Article

Dual-Branch Deep Remote Sensing for Growth Anomaly and Risk Perception in Smart Horticultural Systems

1
China Agricultural University, Beijing 100083, China
2
National School of Development, Peking University, Beijing 100871, China
*
Author to whom correspondence should be addressed.
Horticulturae 2026, 12(4), 461; https://doi.org/10.3390/horticulturae12040461
Submission received: 5 March 2026 / Revised: 3 April 2026 / Accepted: 5 April 2026 / Published: 8 April 2026
(This article belongs to the Special Issue New Trends in Smart Horticulture)

Abstract

In the context of the rapid development of smart horticulture, a deep remote sensing-based dual detection method for horticultural crop growth anomalies and safety risks was proposed to address the limitations of existing remote sensing monitoring approaches. These conventional methods, which predominantly focused on growth vigor assessment or single-task anomaly detection, had difficulty distinguishing anomalies from actual production risks and exhibited insufficient sensitivity to weak anomalies and complex temporal disturbances. Within a unified framework, a growth state modeling branch and an anomaly perception branch were constructed, enabling the joint modeling of normal growth trajectories and anomalous deviation features. By further introducing a risk joint discrimination mechanism, an integrated analysis pipeline from anomaly identification to risk assessment was achieved. Multi-temporal remote sensing features were used as inputs, through which normal crop growth patterns were characterized via trend perception, texture modeling, and temporal aggregation, while sensitivity to local disturbances and weak anomaly signals was enhanced by anomaly embeddings and energy representations. Systematic experiments conducted on multi-regional and multi-crop horticultural remote sensing datasets demonstrated that the proposed method significantly outperformed comparative approaches, including traditional threshold-based methods, support vector machines, random forests, autoencoders, ConvLSTM, and temporal transformer models. In the dual task of horticultural crop growth anomaly detection and safety risk identification, an accuracy of approximately 0.91 and an F1 score of 0.88 were achieved, indicating higher anomaly recognition accuracy and more stable risk discrimination capability. Further anomaly-type awareness experiments showed that consistent performance was maintained across diverse real-world production scenarios, including climate stress, disease-induced anomalies, and management errors.

1. Introduction

In smart horticultural production systems, the stability of crop growth status constitutes the core foundation for ensuring yield security, quality control, and economic benefits [1]. With the intensification of global climate change, the increasing frequency of extreme weather events, environmental stressors and management-related uncertainties encountered during crop growth have increased significantly [2]. Under such conditions, abnormal variations occurring during crop growth not only affect local growth performance but may further trigger disease spread, yield fluctuations, and even systemic production risks [3]. Therefore, the timely and accurate perception of horticultural crop growth anomalies at regional scales, together with early warning of potential agricultural safety risks, has become a critical scientific challenge in smart horticulture and sustainable agricultural development [4]. Remote sensing technology, owing to its wide coverage, continuous observation capability, and non-contact characteristics, provides essential data support for horticultural crop growth monitoring and management [5]. Multi-spectral and multi-temporal remote sensing imagery enables the characterization of crop growth status and its dynamic evolution from both spatial and temporal perspectives, and has been widely applied in crop vigor assessment, health monitoring, and yield estimation [6]. However, from an agricultural safety perspective, growth anomalies in horticultural crops are often manifested as localized patterns, weak signals, and temporal disturbances. Their causes may originate from natural factors such as extreme climate events and soil water stress, as well as from inappropriate irrigation, fertilization, or management practices [7]. When such anomalies are not identified and distinguished in a timely manner, they tend to accumulate progressively and evolve into production safety risks, thereby exerting long-term impacts on the stable operation of horticultural systems [8].
Traditional remote sensing–based horticultural crop monitoring methods primarily rely on vegetation index threshold analysis, empirical models, or statistical regression approaches. Variations in indicators such as the normalized difference vegetation index (NDVI) and the enhanced vegetation index (EVI) are commonly analyzed to evaluate crop growth conditions [9]. Although these methods demonstrate certain effectiveness in vigor assessment and macro-scale monitoring, crop growth processes are typically assumed to be stationary and predictable, resulting in limited sensitivity to abnormal variations [10]. Moreover, threshold values or rule-based criteria are often determined based on expert experience, making it difficult to adapt to growth heterogeneity across different regions, crop varieties, and management conditions [11]. In the presence of complex background interference, weak anomaly signals, and the superposition of multiple sources of uncertainty, reliable anomaly identification and risk discrimination remain challenging for traditional approaches [12]. With the development of machine learning techniques [13], shallow learning models such as support vector machines and random forests have been introduced to model remote sensing features, aiming to improve crop status classification and anomaly detection performance [14]. However, these methods typically depend on manually designed features, exhibit limited capability in modeling the spatio-temporal structures of high-dimensional remote sensing data, and are prone to degraded generalization performance in agricultural scenarios characterized by scarce anomaly samples and imbalanced class distributions [15]. More importantly, anomaly detection has often been treated as an independent task in existing studies, while systematic modeling of the relationship between anomalies and potential agricultural safety risks remains insufficient [16]. In recent years, significant progress has been achieved in the field of remote sensing image understanding through deep learning [17]. Convolutional neural networks (CNNs), temporal modeling networks, and multimodal deep learning models have been extensively applied to tasks such as crop type classification, disease detection, and yield prediction [18]. Through end-to-end learning, deep models are capable of automatically extracting spatial texture features and temporal variation patterns from remote sensing imagery, demonstrating superior representational capacity in complex scenarios compared with traditional methods [19]. Nevertheless, most deep learning–based horticultural remote sensing studies focus on single-task objectives, such as growth assessment or pest and disease identification, and typically assume the availability of sufficient and balanced labeled training data [20]. This assumption is often violated in real agricultural production, particularly in scenarios involving growth anomalies and safety risks, where anomaly samples are limited in quantity, diverse in type, and ambiguous in boundary definition, thereby hindering the effectiveness of conventional supervised learning approaches [21]. Furthermore, deep models still face challenges related to distribution shift and insufficient generalization when applied across regions, crop types, and management conditions [22].
From an agricultural safety perspective, the persistent accumulation and spatial diffusion of anomalies often serve as critical precursors to risk formation [23]. Consequently, anomaly identification alone is insufficient to support safety-oriented decision-making in smart horticulture. Instead, it is necessary to jointly model normal crop growth patterns, abnormal variation characteristics, and their potential risk implications within a unified framework [24]. Recent literature has established significant methodological foundations for intelligent agricultural sensing through specialized deep learning architectures. Haolin Yang et al. [25] developed a robust crop health analysis system using UAV-based CNNs, demonstrating the high representational capacity of deep models in complex classification and disease recognition tasks. Similarly, Junning Feng et al. [26] introduced the PODD framework, which achieved superior accuracy exceeding 95% by successfully integrating pixel-level and object-level features for greenhouse area extraction. Furthermore, works by Youping Wu et al. [27], Sushruta Mishra et al. [28], and Syeda Iqra Hassan et al. [29] have established highly accurate models for real-time disease and pest detection, reaching success rates above 97% through optimized spatial feature extraction and IoT integration. These contributions have fundamentally advanced precision monitoring by providing effective tools for target-specific identification. However, while these frameworks excel at identifying known categories or structural objects, they are primarily driven by spatial morphology or predefined disease patterns. A critical remaining challenge is the collaborative modeling of horticultural growth anomalies and safety risks under conditions where anomaly samples are scarce and the boundaries between normal fluctuations and genuine risks are ambiguous. Specifically, even advanced dual-task frameworks like PODD focus on the structural extraction of targets rather than the temporal perception of risk evolution from weak physiological signals. Consequently, existing approaches remain limited in their ability to distinguish latent growth anomalies from systemic production risks within complex, non-stationary horticultural time series.
To address the aforementioned challenges, a deep remote sensing–based dual detection method for horticultural crop growth anomalies and safety risks is proposed. Unlike existing multi-task architectures that primarily focus on parallel feature extraction for distinct object categories, this study introduces a hierarchical decoupling paradigm to separate stable growth manifolds from stochastic anomaly spaces. Within a unified framework, normal crop growth pattern modeling, abnormal variation perception, and comprehensive assessment of potential agricultural safety risks are jointly realized. The main contributions of this study are summarized as follows:
  • A novel hierarchical perception framework is formulated to bridge the gap between physiological anomaly detection and agricultural risk assessment. By explicitly distinguishing growth anomalies from systemic production risks, the proposed method extends the conventional remote sensing monitoring paradigm and enables the quantification of the intrinsic transition from latent growth deviations to material agricultural hazards.
  • A dual-branch decoupling architecture is proposed to separately model stable growth trajectories and weak anomaly residuals. This design uniquely enables the mathematical isolation of normal phenological patterns from complex temporal disturbances, employing a cross-branch collaborative learning strategy that significantly enhances sensitivity to subtle anomaly signals that are often obscured in standard single-branch or hybrid models.
  • An energy-based risk joint discrimination module is designed, featuring a gated fusion mechanism and a causal-parallel transformer backbone. This component introduces a rigorous mathematical formulation to modulate the impact of anomaly energy on risk output, ensuring that risk alerts are grounded in the deviation from the normal semantic manifold. This structural innovation provides superior interpretability compared to black-box multi-task classifiers.
  • Systematic experiments on multi-source and multi-crop datasets demonstrate the effectiveness of the proposed method. The results verify not only the accuracy of anomaly detection but also the robustness of risk identification across diverse horticultural scenarios, establishing a new benchmark for risk-aware monitoring in precision horticulture.

2. Related Work

2.1. Research Progress of Remote Sensing in Horticultural Crop Growth Monitoring

The core principle of remote sensing–based horticultural crop growth monitoring lies in the indirect characterization of crop canopy structure, physiological status, and growth vigor through observations of surface reflectance properties [30]. Different spectral bands exhibit differentiated responses to vegetation chlorophyll content, water status, and canopy structure, making multispectral and hyperspectral remote sensing important data sources for crop growth assessment [31]. On this basis, crop growth processes are commonly quantified through the construction of vegetation indices or the extraction of temporal features, thereby supporting applications such as vigor assessment, health monitoring, and yield analysis [32]. In the field of horticultural crop monitoring, early studies primarily focused on single-temporal remote sensing imagery. Spatial distributions of crop growth levels were characterized by analyzing indicators such as the normalized difference vegetation index, the enhanced vegetation index, or red-edge indices [33]. These approaches exhibit good interpretability at regional scales and are capable of reflecting growth differences among plots or management units [34].
With improvements in the temporal resolution of remote sensing data, multi-temporal remote sensing has gradually become a research focus. By continuously observing crop variations across different growth stages, growth dynamics can be characterized more comprehensively, thereby providing richer information for growth assessment and management decision-making [35]. The primary advantage of multi-temporal remote sensing in horticultural crop growth monitoring lies in its ability to capture the continuity of growth processes [36]. By analyzing temporal variations in vegetation indices or spectral features, key growth stages, phenological rhythms, and crop responses to environmental conditions can be identified [37]. Some studies further integrate meteorological or management data to construct crop growth models for yield estimation or growth state prediction [38]. However, such approaches generally assume relatively stable growth trajectories and exhibit limited capability in characterizing abrupt disturbances or abnormal variations [39]. These limitations constrain the potential of remote sensing technology in horticultural crop growth anomaly identification and risk early warning [40].

2.2. Anomaly Detection and Multi-Task Frameworks in Agriculture

The fundamental objective of anomaly detection is to identify data samples that deviate from normal patterns, with the core challenge lying in accurately characterizing normal states and distinguishing meaningful anomalies from variations induced by noise, natural fluctuations, or system disturbances [41]. In agricultural scenarios, anomaly detection is commonly applied to identify crop growth abnormalities, disease outbreaks, and environmental stress [42]. Traditional methods rely on historical distribution models or threshold ranges [43]. However, their performance strongly depends on expert expertise and fails to adapt to the pronounced spatial and temporal heterogeneity of horticultural production [44,45].
Recent advancements have shifted toward deep learning–based anomaly detection and multi-task learning frameworks to exploit complex high-dimensional spatial structures [46,47]. Unlike traditional single-task monitoring, recent studies have introduced integrated architectures that simultaneously address multiple detection objectives. Haolin Yang et al. [25] proposed an intelligent health analysis system that leverages CNNs to perform classification and disease recognition concurrently, demonstrating high robustness in pest detection tasks. Junning Feng et al. [26] introduced the PODD framework, a dual-task architecture for greenhouse extraction that achieves over 95% accuracy by combining pixel-based and object-based detection. While PODD successfully handles the structural extraction of quantity and area, its primary focus is on static objects rather than non-stationary growth processes. Similarly, Youping Wu et al. [27] developed a joint detection framework for pine wilt disease using an improved YOLO-v3 model, and Sushruta Mishra et al. [28] integrated IoT with customized CNNs for sustainable millet monitoring, achieving accuracies above 98% through the fusion of multi-source information. Syeda Iqra Hassan et al. [29] further explored real-time monitoring through a YO-CNN pest detection model. These studies establish that dual-task or joint detection architectures significantly outperform single-task models by capturing shared representations. However, most existing frameworks remain target-centric, focusing on specific pest or disease categories. There remains a methodological gap in collaboratively modeling the continuous transition from physiological growth anomalies to systemic production risks, particularly under conditions of scarce anomaly samples.

2.3. Research on Agricultural Safety and Risk Perception

The primary objective of agricultural safety research is to identify and evaluate uncertain factors threatening system stability, including climate disasters and management risks [48]. Traditional assessment methods rely on long-term statistical records, exhibiting limited responsiveness to real-time risk dynamics [20,49]. With the development of big data and intelligent algorithms, risk perception has shifted toward identifying early signals of risk formation [50,51]. Growth anomalies are frequently the result of combined risk factors, and their temporal evolution contains latent safety hazards [45]. However, systematic modeling of the relationship between growth anomalies and agricultural safety risks remains limited. Most studies focus on single risk factors or post-event assessment [52,53]. Achieving collaborative analysis of anomaly identification and risk discrimination within a unified, risk-aware framework represents a critical step toward preemptive agricultural management [54,55].

3. Materials and Method

3.1. Data Collection

The data used in this study were primarily collected from Linhe District, Bayannur City, Inner Mongolia Autonomous Region (40.73° N, 107.42° E), which is located in the core area of the Hetao Irrigation District. This region is characterized by well-developed irrigation infrastructure, a high degree of large-scale horticultural production, and the coexistence of climatic stressors and intensive human management, resulting in typical heterogeneity in horticultural crop growth, as shown in Figure 1 and Table 1. The study focused on the major local horticultural crops, including facility-based and open-field vegetables such as tomato, pepper, and cucumber, as well as fruit tree crops such as apple and pear, in order to ensure diversity in crop types, growth cycles, and management practices. The remote sensing data sources comprised multi-temporal satellite imagery and low-altitude unmanned aerial vehicle (UAV) imagery. Satellite data from Sentinel-2 MSI provided a spatial resolution of 10 m for multispectral bands, while UAV imagery achieved a centimeter-level spatial resolution of 5 cm. To ensure data quality, UAV sensors underwent rigorous radiometric calibration using standard grey reflectance panels before each flight. Furthermore, ground control points were surveyed using Real-Time Kinematic (RTK) GNSS to ensure sub-decimeter geometric accuracy.
The remote sensing data sources comprised multi-temporal satellite remote sensing imagery, low-altitude unmanned aerial vehicle (UAV) remote sensing imagery, and selected publicly available online agricultural remote sensing datasets. To ensure the scientific validity of the experimental results, a rigorous multi-stage annotation procedure was implemented to distinguish between growth anomalies and agricultural safety risks. In this study, an anomaly is operationally defined as a physiological deviation from the standard phenological trajectory of a specific crop type, characterized by a statistical shift in spectral reflectance or vegetation indices exceeding two standard deviations from the local historical mean. Conversely, an agricultural safety risk is defined as an anomaly that leads to material agronomic consequences, such as a documented yield loss of more than 15 percent, irreversible phytosanitary damage, or the necessity for emergency chemical intervention.
The labeling process was conducted by a panel of three plant protection experts and agronomists with extensive field experience in the Hetao Irrigation District. For each sample, experts cross-referenced remote sensing observations with localized ground-truth data, including field management logs, meteorological disaster records, and pest and disease survey reports from 2019 to 2024. Anomaly labels were assigned when the temporal sensing signal exhibited unseasonal fluctuations not attributable to normal atmospheric noise. Risk labels were further confirmed only when the corresponding field logs recorded a significant reduction in biomass or a required rescue operation. This operational distinction ensures that the model learns to identify not only the presence of physiological stress but also its potential for systemic production failure.

3.2. Data Preprocessing and Augmentation Strategy

Remote sensing imagery is inevitably affected by multiple factors during acquisition, including sensor characteristics, atmospheric conditions, observation geometry, and environmental interference. These factors introduce significant discrepancies in radiometric consistency, spatial alignment, and temporal continuity among raw images. If unprocessed remote sensing imagery is directly fed into deep models for training, noise-induced bias is likely to be introduced, thereby weakening the model’s ability to perceive true crop growth variations. This issue is particularly critical for growth anomaly detection and risk identification tasks, in which weak anomaly signals are often masked by non-physiological disturbances. Therefore, systematic data preprocessing of multi-temporal horticultural remote sensing imagery prior to deep modeling is regarded as a fundamental prerequisite for ensuring subsequent model robustness and generalization capability. Radiometric correction constitutes the primary step of remote sensing data preprocessing. Its core objective is to eliminate the influence of varying sensor imaging conditions and atmospheric environments on surface reflectance, so that pixel values can faithfully represent the spectral response characteristics of ground objects. In general, raw remote sensing imagery records digital numbers received by sensors, which exhibit a nonlinear relationship with actual surface reflectance. Accordingly, raw pixel values are first converted into surface reflectance through linear or nonlinear radiometric calibration models, enabling comparability across images acquired at different times and by different sensors. For a given pixel, the surface reflectance R can be expressed as a function of the sensor observation value D as follows:
R = α · D + β ,
where α and β denote the radiometric calibration coefficient and offset term, respectively, which are used to correct sensor response and atmospheric scattering effects. Through radiometric correction, horticultural remote sensing images acquired at different times can be compared under a unified physical meaning, thereby laying a foundation for subsequent temporal analysis. In practical horticultural remote sensing applications, clouds and their shadows represent major sources of noise that degrade image quality. Cloud contamination not only obscures crop canopy information but may also introduce abrupt fluctuations into multi-temporal sequences, thereby interfering with anomaly detection tasks. The core principle of cloud noise processing lies in identifying and removing cloud-affected pixel regions to ensure temporal continuity and spatial consistency of the input data. In this study, cloud and cloud-shadow regions are detected by jointly leveraging spectral thresholding and temporal consistency analysis, and are subsequently treated as missing values. For cloud-contaminated pixels, the effective observation value X t is estimated through temporal neighborhood interpolation, which can be formulated as:
X ^ t = 1 | N ( t ) | k N ( t ) X k ,
where N ( t ) denotes the set of neighboring time points around time t. Through temporal interpolation, continuous growth sequences are restored, thereby reducing the interference of cloud noise on anomaly perception. Spatial registration represents another critical step in multi-temporal remote sensing analysis, aiming to ensure precise spatial alignment among images acquired at different times. In horticultural crop monitoring scenarios, even sub-pixel spatial misalignment may cause the same field parcel to be mapped to different pixels across time, thus impairing the accuracy of temporal feature modeling. The basic principle of spatial registration is to map the image to be registered into the coordinate system of a reference image through a geometric transformation function. For an arbitrary pixel location ( x , y ) , the registered coordinates ( x , y ) can be expressed as:
x y = T x y 1 ,
where T denotes the spatial transformation matrix, which characterizes translation, rotation, and scaling relationships. By adopting a unified spatial reference framework, pixel-level alignment across multi-temporal horticultural remote sensing imagery is achieved, ensuring that learned temporal variations originate from genuine crop growth processes rather than artificial spatial misalignment. After radiometric correction, cloud noise processing, and spatial registration, multi-temporal remote sensing imagery may still suffer from irregular temporal sampling. Due to satellite revisit cycles and meteorological conditions, observation intervals across time series are often inconsistent, which adversely affects the temporal modeling capability of deep models. To address this issue, temporal alignment is applied to remote sensing time series by means of temporal resampling and interpolation, mapping irregular observations onto a unified temporal axis. Let the original observation time series be denoted as { t i } i = 1 N with corresponding remote sensing features { X t i } . The feature at a target time point t can then be expressed as:
X t = i = 1 N w i ( t ) X t i ,
where w i ( t ) represents the temporal weighting function, reflecting the contribution of each original observation to the target time point. Through temporal alignment, multi-temporal horticultural remote sensing data are transformed into continuous and regular growth sequences, providing stable inputs for subsequent anomaly perception and risk analysis. After completing the aforementioned preprocessing procedures, the scarcity of horticultural crop growth anomaly samples remains a major challenge. Compared with normal growth conditions, anomaly samples occur less frequently in real production environments and exhibit diverse manifestations, which makes deep models susceptible to class imbalance during training and consequently degrades anomaly recognition performance. The core idea of data augmentation lies in expanding the training data space by appropriately transforming the original sample distribution, thereby enhancing model generalization and robustness with respect to anomaly signals. In remote sensing anomaly detection scenarios, data augmentation must preserve the physical consistency of crop growth characteristics while avoiding the introduction of unrealistic pseudo-anomalies. In this study, data augmentation is conducted at both temporal and spatial levels. At the temporal level, perturbation and recombination of remote sensing feature sequences are employed to simulate crop growth fluctuations under varying environmental conditions. For an original time series X ( t ) , its augmented form X ˜ ( t ) is defined as:
X ˜ ( t ) = X ( t ) + ϵ ( t ) ,
where ϵ ( t ) denotes a small random perturbation term drawn from a zero-mean Gaussian distribution N ( 0 , σ 2 I ) , where σ 2 is a small variance parameter that ensures the augmented samples remain within a physically plausible range of physiological variability. This term is used to emulate physiological fluctuations induced by environmental variability, thereby enhancing model sensitivity to weak anomaly signals. At the spatial level, considering that horticultural crop growth anomalies typically exhibit localized characteristics, spatial cropping and perturbation combinations are applied to remote sensing image patches to construct multi-scale training samples, thereby strengthening the model’s ability to perceive local anomaly regions. Meanwhile, to alleviate the issue of insufficient anomaly samples, a resampling-based strategy is introduced during training, in which higher sampling probabilities are assigned to anomaly samples so that anomaly-related features receive sufficient attention during optimization. Let the class weight of sample i be denoted as w i , then its contribution to the training loss can be expressed as:
L = i w i · ( y i , y ^ i ) ,
where ( · ) denotes the per-sample loss function, and y i and y ^ i represent the ground-truth label and model prediction, respectively. By jointly adopting weighted sampling and data augmentation strategies, the model is enabled to maintain strong normal growth modeling capability while effectively improving discrimination of anomaly patterns and potential safety risks.

3.3. Proposed Method

3.3.1. Overall

A deep remote sensing–based dual detection framework for horticultural crop growth anomalies and safety risks is proposed, in which a complete information processing pipeline is constructed from the perspective of model architecture following a progressive scheme of growth modeling, anomaly perception, and risk discrimination. Within the overall framework, multi-temporal remote sensing data that have undergone unified feature construction and temporal alignment are first fed into the model and projected into a shared high-dimensional feature space. This design preserves spectral, spatial, and temporal information of crops while providing a consistent representation basis for subsequent branch-specific modeling. The core model adopts a dual-branch parallel structure, where one branch focuses on modeling normal crop growth states, and the other branch is dedicated to capturing anomalous deviations during the growth process. These two branches remain relatively independent at the feature learning stage to prevent anomaly-induced noise from contaminating normal growth representations. Within the crop growth state modeling branch, multi-temporal remote sensing feature sequences are processed by a temporal-aware network that learns typical growth evolution patterns under normal management and environmental conditions through hierarchical encoding. Emphasis is placed on reinforcing the representation of long-term trends, stage-wise transitions, and stable growth rhythms, resulting in output features that exhibit temporal continuity and smoothness. In this manner, a reliable baseline representation of normal crop growth is established. In parallel, the growth anomaly perception branch operates on the same source remote sensing features but under different modeling objectives and constraints, focusing on regions where temporal consistency is disrupted. By explicitly modeling reconstruction deviations and variation magnitudes across temporal and spatial dimensions, weak anomaly signals induced by extreme climate events, environmental stress, or improper management are amplified, enabling sensitive responses to early-stage and localized anomalies. At a higher semantic level, stable growth features from the growth state modeling branch and anomaly response features from the anomaly perception branch are jointly fed into the horticultural safety risk discrimination module. Through feature alignment, weighting, and joint mapping, this module comprehensively evaluates the degree to which the current growth state deviates from normal patterns and assesses the potential impact scope. As a result, the decision process is transformed from determining whether anomalies exist to judging whether such anomalies constitute production risks. The final model outputs not only anomaly detection results but also safety-oriented risk assessment outcomes, providing direct support for risk warning and management decision-making in horticultural production. Through this progressively connected design from growth modeling to anomaly perception and risk discrimination, the proposed framework achieves collaborative perception and integrated analysis of crop growth anomalies and safety risks within a unified architecture.

3.3.2. Crop Growth State Modeling Branch

The crop growth state modeling branch is designed to learn generalizable representations of normal growth patterns. Its input is organized as a multi-temporal remote sensing tensor X R T × H × W × C , where H = W = 128 denotes parcel-level image patches, the channel number is set to C = 10 representing concatenated multispectral reflectance channels and key growth indices, and T denotes the aligned observation sequence length.
As shown in Figure 2, a temporally shared spatial encoding backbone network ϕ ( · ) is employed to encode each temporal slice X t R 128 × 128 × 10 in order to ensure cross-temporal comparability and parameter efficiency. The backbone consists of a four-stage convolutional pyramid, where each stage contains two 3 × 3 convolutional layers followed by a stride-2 downsampling operation, with channel dimensions of 64, 128, 256, and 512, respectively. This design yields a high-level feature map M t = ϕ ( X t ) R 8 × 8 × 512 and an intermediate texture feature map U t R 16 × 16 × 256 for each time step. High-level features are further processed by global average pooling to obtain a trend candidate vector f t R 512 , which is concatenated with an index summary vector h t R 32 and fed into the trend feature extraction module. Corresponding to the Combine MLP and Weight MLP in the architecture diagram, a two-layer feed-forward network is used to generate a temporal representation r t R 256 , while a weighting network produces a temporal importance score a t R . Normalized weights are then applied to aggregate the temporal representations into a trend feature F agg R 256 :
r t = σ W c 2 σ W c 1 [ f t ; h t ] , a t = w 2 σ W w 1 h t , ω t = exp ( a t ) τ = 1 T exp ( a τ ) , F agg = t = 1 T ω t r t ,
where W c 1 R 544 × 256 , W c 2 R 256 × 256 , W w 1 R 32 × 64 , w 2 R 64 , and σ ( · ) denotes a nonlinear activation function. This aggregation exhibits numerical stability advantages, as ω t 0 and t ω t = 1 , making F agg a convex combination of { r t } . Consequently, for any two temporal representations { r t } and { r t } , the following inequality holds:
F agg F agg = t = 1 T ω t r t r t t = 1 T ω t r t r t max t r t r t ,
indicating that aggregated trend features are not amplified when observation noise or local disturbances affect only a small number of time steps, thereby providing a robust baseline for subsequent risk discrimination. After obtaining F agg , a lightweight attention-based texture information extraction module is applied to intermediate features U t to identify spatial texture evidence most relevant to the current growth state. Specifically, each U t R 16 × 16 × 256 is flattened into N = 256 tokens u t , n R 256 . A query vector q R 128 is generated from F agg , while keys and values k t , n , v t , n R 128 are obtained via linear projection. The attention output s att R 128 is defined as
q = W q F agg , k t , n = W k u t , n , v t , n = W v u t , n , α t , n = exp q k t , n / 128 τ = 1 T m = 1 N exp q k τ , m / 128 ,
s att = t = 1 T n = 1 N α t , n v t , n ,
where W q R 256 × 128 and W k , W v R 256 × 128 . Since α t , n 0 and the double summation equals 1, s att is also a convex combination of value vectors, preventing uncontrolled magnitude drift while adaptively focusing on spatial patterns consistent with growth trends, such as canopy texture and inter-row structure. The growth state embedding is finally formed as z g = [ F agg ; s att ] R 384 and passed through a linear classification head to obtain growth state logits for supervised training and representation alignment:
z g = [ F agg ; s att ] , y ^ g = softmax ( W g z g + b g ) ,
where W g R K × 384 corresponds to the number of growth state classes K. When jointly used with the growth anomaly perception branch, z g serves as a stable baseline input to the horticultural safety risk discrimination module, constraining anomaly-induced deviations within a normal semantic anchor and thereby reducing false alarms across regions while enabling interpretable amplification of weak anomaly signals.

3.3.3. Growth Anomaly Perception Branch

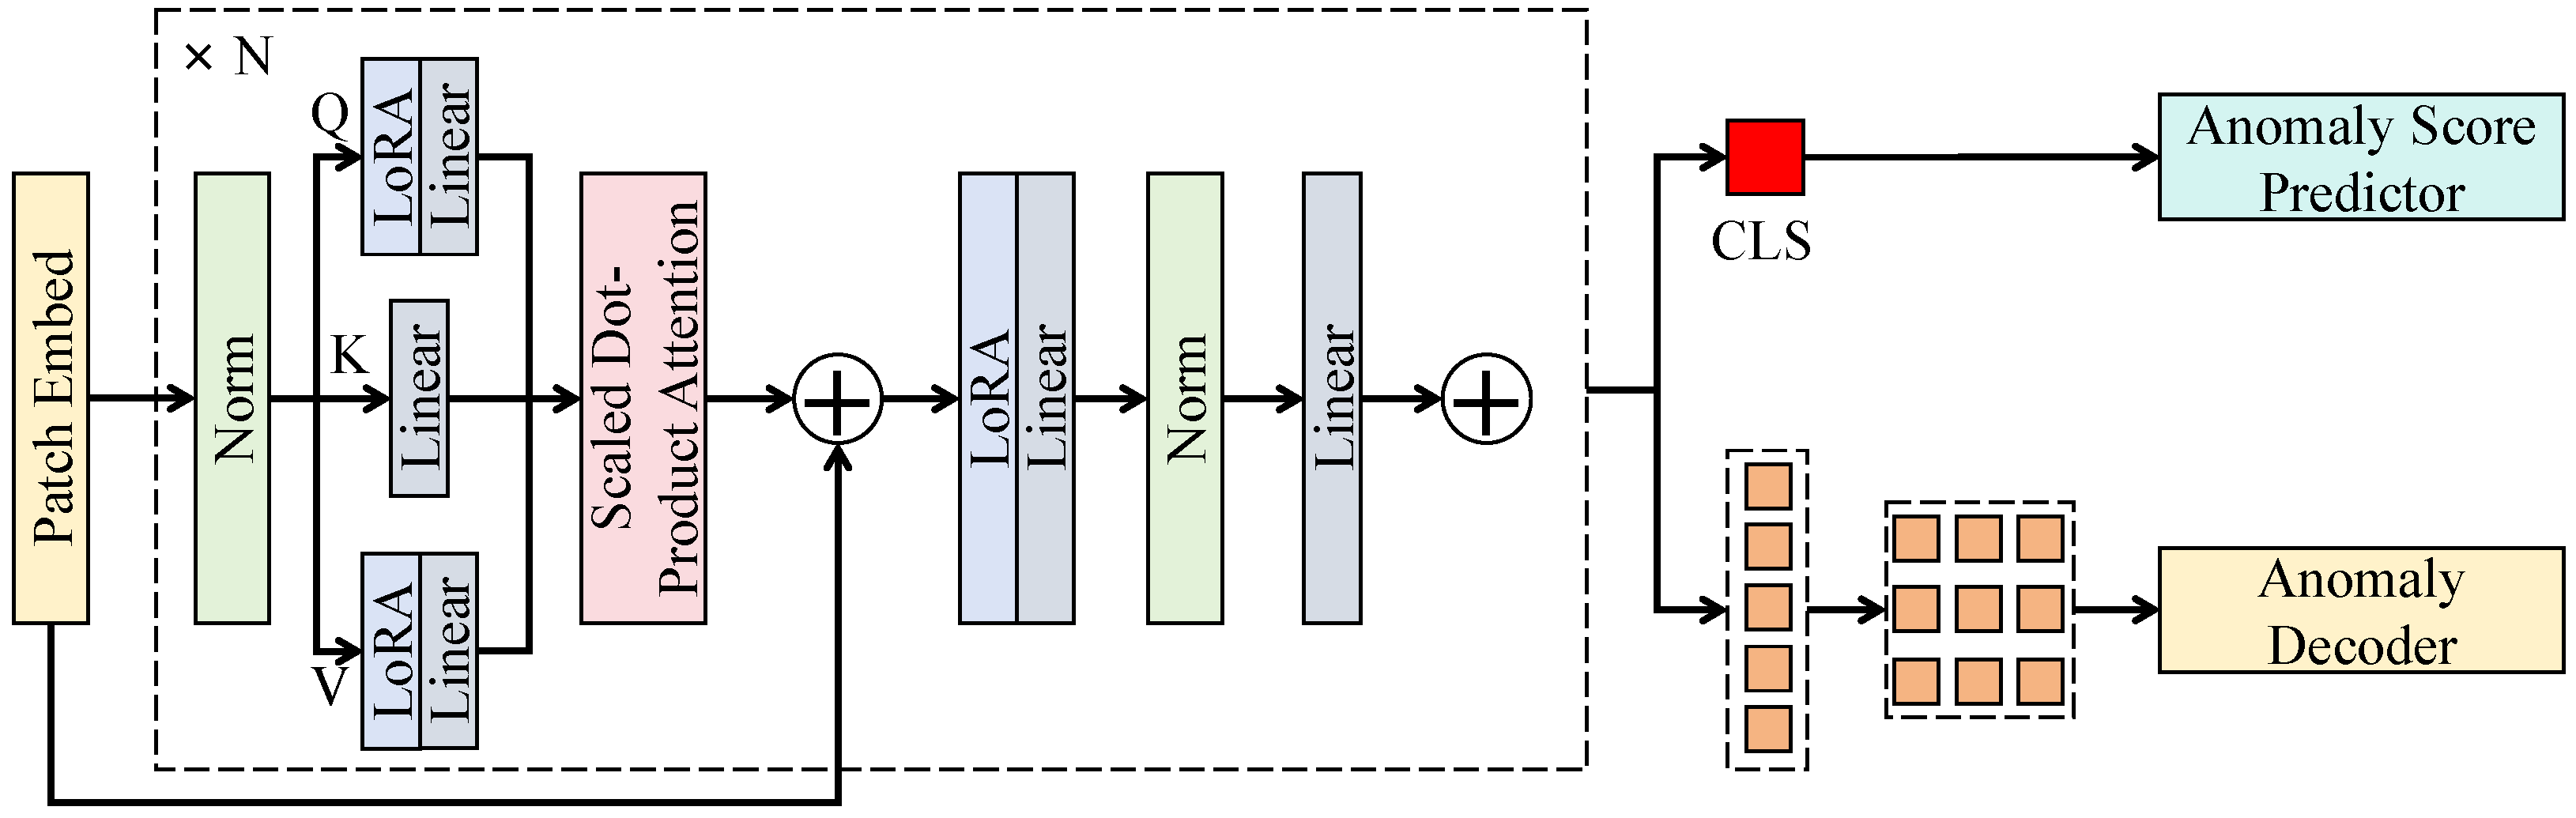
The growth anomaly perception branch is specifically designed to model weak anomalies, local mutations, and cross-temporal disturbances. The DINOv2 model is adopted as the pretrained transformer-based visual foundation model for the anomaly representation encoder, with low-rank adaptation (LoRA) injected into attention and feed-forward layers to achieve lightweight domain adaptation for horticultural remote sensing. Two complementary paths are produced, including anomaly score prediction and anomaly decoding reconstruction.
As shown in Figure 3, for each temporal remote sensing block X t R 128 × 128 × 10 , a patch size of P = 16 is used to generate 8 × 8 = 64 patch tokens consistent with the DINOv2 architecture, and a [ CLS ] token is appended to form a sequence of length L = 65 . Linear patch embedding maps each patch into a hidden dimension D = 768 , yielding Z t ( 0 ) R 65 × 768 . The encoder follows the standard ViT-Base configuration, comprising N = 12 transformer blocks with H = 12 attention heads, head dimension 64, and feed-forward expansion dimension D ff = 3072 , while layer normalization and residual connections remain consistent with pretrained weights. To mitigate overfitting under scarce anomaly samples, backbone parameters are frozen, and LoRA modules with rank r = 8 are inserted only into the Q , V linear projections of self-attention and linear layers of the feed-forward network:
W ˜ = W + Δ W , Δ W = B A , B R d out × r , A \ r × d in .
The rank parameter in LoRA is set to r = 8 based on a trade-off among adaptation capacity, parameter efficiency, and training stability. Specifically, smaller rank values (e.g., r < 4 ), although capable of further reducing parameter overhead, were observed to exhibit insufficient representational capacity for domain-specific features in practical experiments, particularly failing to adequately capture weak anomaly signals in complex agricultural scenarios. In contrast, larger rank values (e.g., r > 16 ) can enhance feature expressiveness but at the cost of significantly increased additional parameters and a higher risk of overfitting, especially under conditions where anomaly samples are relatively scarce, leading to unstable performance. Under this context, the configuration of r = 8 demonstrated a favorable balance between performance and stability on the validation set. It effectively enhances the model’s adaptability to agricultural remote sensing features while avoiding excessive computational overhead. Furthermore, this configuration exhibited relatively low performance variance across multiple experimental runs, indicating a certain degree of robustness. As a result, rank ( Δ W ) r , constraining learnable freedom to a low-dimensional subspace while preserving pretrained representations. This approach ensures that cross-regional generalization benefits from the prior representations of the foundation model while specializing in horticultural features. Moreover, Δ W 2 B 2 A 2 ensures bounded feature perturbation under regularization, improving robustness to cross-region distribution shifts. For the -th layer output Z t ( ) , the self-attention update is expressed as
Z t ( + 1 ) = Z t ( ) + MSA LN ( Z t ( ) ) + FFN LN ( Z t ( ) + MSA ( · ) ) ,
where LoRA-modified weights are used in all linear mappings within MSA . After encoding, the [ CLS ] vector g t R 768 and patch token set U t R 64 × 768 are extracted for anomaly scoring and decoding, respectively. A two-layer MLP ( 768 256 1 ) predicts the temporal anomaly score s ^ t , and cross-temporal aggregation yields a sequence-level anomaly intensity s ^ . To provide statistical interpretability, g t is treated as an approximately Gaussian embedding of normal patterns, and a Mahalanobis-distance-based energy score is constructed:
e t = ( g t μ ) Σ 1 ( g t μ ) , s ^ = 1 T t = 1 T σ ( s ^ t ) ,
where μ and Σ are estimated from embeddings of samples labeled as normal during training. When g t N ( μ , Σ ) , the negative log-likelihood satisfies log p ( g t ) = 1 2 e t + const , implying a monotonic correspondence between e t and confidence of deviation from normality:
p ( g t ) exp 1 2 e t e t increases p ( g t ) decreases .
Thus, even weak pixel-level anomalies manifest as decreased embedding likelihood and are amplified into comparable anomaly scores. Meanwhile, the anomaly decoder maps U t to a 8 × 8 × 256 feature map and progressively upsamples it through four deconvolution stages to 128 × 128 × 1 , producing a reconstruction M ^ t or anomaly heatmap for spatial interpretability. Reconstruction error is combined with embedding energy to form a complementary constraint:
r t = M t M ^ t 1 , E t = η e t + ( 1 η ) r t , 0 < η < 1 ,
where M t denotes a target reconstruction representation or weakly supervised mask. Since e t captures global distributional deviation and r t captures local structural inconsistency, their combination aligns with the horticultural risk evolution pattern in which local stress emerges before spatial expansion. The branch outputs a compressed anomaly response vector derived from concat ( g 1 , , g T ) and the energy sequence { E t } , which are fused with stable growth features in the subsequent risk discrimination module to achieve lower false alarm rates and earlier risk warning under scarce anomaly samples and noisy conditions.

3.3.4. Horticultural Safety Risk Joint Discrimination Module

The horticultural safety risk joint discrimination module treats stable growth semantics from the growth state branch as a risk anchor and anomaly evidence from the anomaly perception branch as a risk trigger, achieving feature alignment, fusion, and risk output within a unified sequence modeling framework.
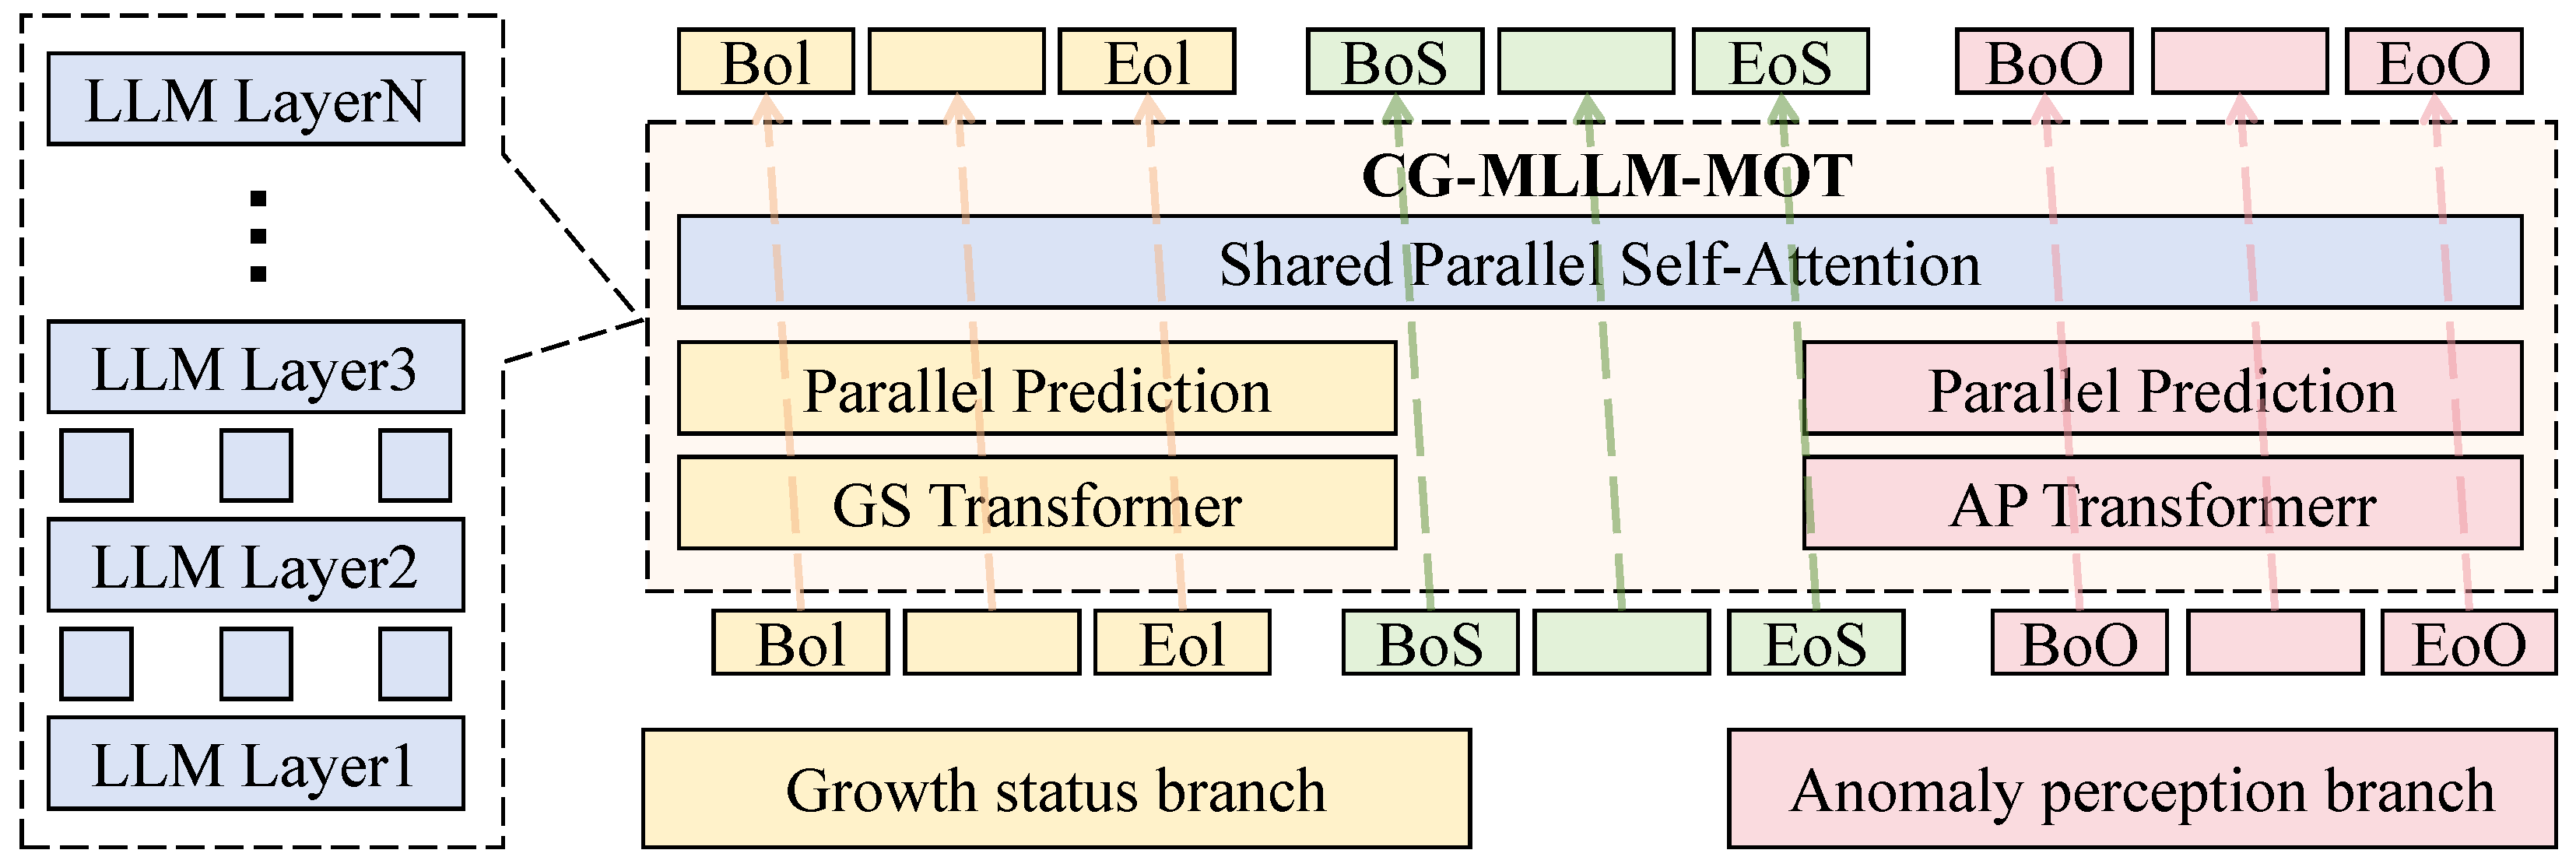
As shown in Figure 4, the shared attention backbone of CG-MLLM-MOT is employed, which is a custom-designed Multi-task Transformer architecture inspired by causal sequence modeling paradigms, forming an autoregressive prediction path for growth states and a parallel prediction path for anomaly evidence. The choice of an autoregressive modeling structure is theoretically motivated by the fact that horticultural risk is not a static state but a cumulative process; the autoregressive path captures the temporal dependency and “memory” of normal growth patterns, providing a dynamic baseline against which anomalies are evaluated. Let the growth state branch output be z g R 384 , and the anomaly perception branch outputs be z a R 768 and energy sequence { E t } t = 1 T . An MLP-Merger first projects both representations into a unified embedding dimension D = 512 , where z g is mapped via 384 512 512 to e g , z a via 768 512 512 to e a , and the energy statistic E ¯ = 1 T t = 1 T E t is linearly mapped to a scalar gating input.
Risk fusion adopts a dual mechanism of a gated connector and a noise scheduler. The gated connector learns the modulation strength of anomaly evidence on growth semantics, while the noise scheduler injects controlled perturbations into anomaly features during training to enhance cross-region robustness:
γ = σ w γ δ ( W γ [ e g ; e a ; E ¯ ] ) + b γ , e ˜ a = e a + ξ , ξ N 0 , ρ ( E ¯ ) 2 I ,
where δ ( · ) denotes a nonlinear activation, W γ R ( 512 + 512 + 1 ) × 256 , w γ R 256 , and ρ ( E ¯ ) is a monotonically decreasing noise scale function. The fused risk token is constructed as u 0 = e g + γ e ˜ a R 512 and concatenated with M growth-state tokens and N anomaly tokens to form the input sequence U = [ u 0 , u 1 , , u M + N ] R ( 1 + M + N ) × 512 . After embedding, the sequence is processed by a Causal-Parallel Self-Attention backbone consisting of several Transformer layers (referenced as LLM layers in Figure 4 to denote their high-dimensional representational capacity with L = 6 transformer layers, 8 attention heads, head dimension 64, and feed-forward dimension 2048. At the top layer, a TokenAR next-token head functions as a temporal consistency constraint, ensuring that the risk representations remain on the normal semantic manifold by predicting the subsequent growth state, while a BlockAR parallel head aggregates anomaly evidence to enhance sensitivity to local disturbances and accelerate convergence. This dual-head design effectively transforms the classification task into a joint modeling of growth stability and anomaly impact, where the risk output is regularized by the expected normal progression. The final risk output is obtained from the top-layer representation h 0 corresponding to u 0 through a two-layer MLP ( 512 256 R ):
h 0 = TRM ( U ) 0 , y ^ r = softmax ( W r δ ( W 1 h 0 ) + b r ) ,
where R denotes the number of risk categories or a binary output dimension. Theoretical analysis shows that gated fusion enforces bounded modulation of anomaly evidence, as 0 < γ < 1 and the noise variance is controlled by ρ ( E ¯ ) , yielding E u 0 e g 2 E e ˜ a 2 . This prevents risk decisions from being dominated by noisy anomaly signals under distribution shift. Meanwhile, shared Causal-Parallel Self-Attention enables adaptive allocation of attention between global growth trends and local anomalies, consistent with the mechanism by which horticultural risks emerge through persistent accumulation and spatial diffusion of anomalies. Consequently, the module leverages stable growth baselines to mitigate cross-region threshold failure while exploiting anomaly energy evidence for early detection, achieving collaborative optimization of anomaly detection and safety risk discrimination with more reliable early warning outputs.

4. Results and Discussion

4.1. Experimental Configuration

4.1.1. Hardware and Software Platform

All experiments were conducted on a deep learning server platform running Ubuntu 22.04 LTS. The hardware was specifically chosen to meet the high computational and memory demands of multi-temporal high-resolution remote sensing imagery. The system was equipped with an Intel Xeon Gold 6248R CPU (2.40 GHz, 24 cores) and 256 GB of DDR4 RAM to handle parallel data preprocessing and sample scheduling. Model training and inference were accelerated using two NVIDIA A100 Tensor Core GPUs with 80 GB of on-board memory each, ensuring stable training for long temporal sequences and multi-scale image patches. Data storage and high-speed access were managed via a 2 TB NVMe SSD.
In terms of software, the framework was implemented using Python 3.10 and PyTorch 2.1.0, with CUDA 12.1 for GPU acceleration. The anomaly perception branch specifically utilizes the DINOv2 (ViT-B/16) visual foundation model, which was initialized using the official dinov2_vits16_pretrain weights. In this architecture, LoRA modules are configured with a rank r = 8 and an alpha scaling factor of 16, targeting the Q and V projections within the self-attention blocks. Remote sensing image preprocessing and feature construction utilized specialized libraries including GDAL 3.4.1, OpenCV 4.6.0, and NumPy 1.24.3. To ensure result reproducibility and fair comparison, a fixed random seed of 42 was adopted across all experiments, and the software environment was strictly controlled.
For model training and evaluation, the horticultural crop remote sensing dataset was divided into training, validation, and test sets with proportions of 70%, 15%, and 15%, respectively. To prevent spatial and temporal data leakage, a parcel-level (plot-based) splitting strategy was implemented. This approach ensures that all multi-temporal observations belonging to a specific geographical plot are assigned exclusively to a single split, thereby preventing the model from encountering spatially or temporally proximal samples from the same field during both training and testing. A 5-fold cross-validation strategy was further employed to enhance robustness, with average results reported as final metrics. The specific distribution of anomaly types across the partitioned dataset is detailed in Table 2. An adaptive gradient-based optimization algorithm was used, with an initial learning rate of α = 1 × 10 4 adjusted dynamically based on validation performance. The batch size was set to B = 16, the weight decay coefficient to λ = 1 × 10 5 to mitigate overfitting, and the maximum number of training epochs to E = 100, with early stopping applied when validation performance plateaued. These hyperparameter settings exhibited stable performance and good generalization across comparative experiments, providing a solid experimental basis for horticultural crop growth anomaly and safety risk detection.

4.1.2. Baseline Models and Evaluation Metrics

To validate the effectiveness of our proposed method, multiple representative models were selected as comparative baselines. These include the NDVI/EVI threshold-based rule method [56], Support Vector Machine (SVM) [57], Random Forest [58], Autoencoder [59], ConvLSTM [60], and Temporal Transformer [61]. To ensure a fair comparative evaluation, all baseline models were subjected to rigorous hyperparameter tuning using a grid search strategy on the validation set. The specific architectural configurations and hyperparameters for these models are summarized in Table 3.
The performance of each model was evaluated using 5-fold cross-validation. For each metric, we report the mean value and the standard deviation across the five folds to quantify the stability and uncertainty of the detection results.
For the tasks of horticultural crop growth anomaly detection and safety risk identification, model performance was comprehensively evaluated using metrics including accuracy, recall, precision, F1 score, and the area under the receiver operating characteristic curve (AUC), in order to reflect both anomaly recognition capability and decision stability. Anomalous samples were regarded as positive instances, while normal samples were treated as negative instances. Let the numbers of true positives, false positives, true negatives, and false negatives be denoted as T P , F P , T N , and F N , respectively. The mathematical definitions of the evaluation metrics are given as follows:
Accuracy = T P + T N T P + T N + F P + F N ,
Precision = T P T P + F P ,
Recall = T P T P + F N ,
F 1 = 2 · Precision · Recall Precision + Recall ,
AUC = 0 1 TPR ( α ) d FPR ( α ) .
In these definitions, T P denotes the number of anomalous samples correctly identified as anomalies, F P denotes the number of normal samples incorrectly classified as anomalies, T N denotes the number of normal samples correctly identified as normal, and F N denotes the number of anomalous samples incorrectly classified as normal. The terms TPR ( α ) and FPR ( α ) represent the true positive rate and false positive rate under decision threshold α , respectively, which are used to characterize variations in classification performance under different threshold settings.

4.2. Overall Performance Comparison

The primary objective of this experiment is to systematically evaluate the overall performance of different methods in the dual task of horticultural crop growth anomaly detection and safety risk identification and to verify the effectiveness and stability of the proposed method in real-world and complex horticultural scenarios. By conducting comparisons among traditional rule-based approaches, classical machine learning models, and deep learning models under the same data partition and unified evaluation metrics, the differences among various technical paradigms in terms of anomaly recognition accuracy, risk discrimination capability, and decision stability can be clearly revealed. To address the methodological asymmetry in comparing a dual-task architecture with single-task baselines, we constructed reinforced versions of the primary deep learning baselines, denoted as ConvLSTM + R and Temporal Transformer + R. These reinforced models include a secondary risk classification head—a three-layer MLP with gated activation—attached to their aggregated temporal embeddings. This ensures a fair evaluation where all competing models possess structural mechanisms to distinguish production risks, as summarized in Table 4.
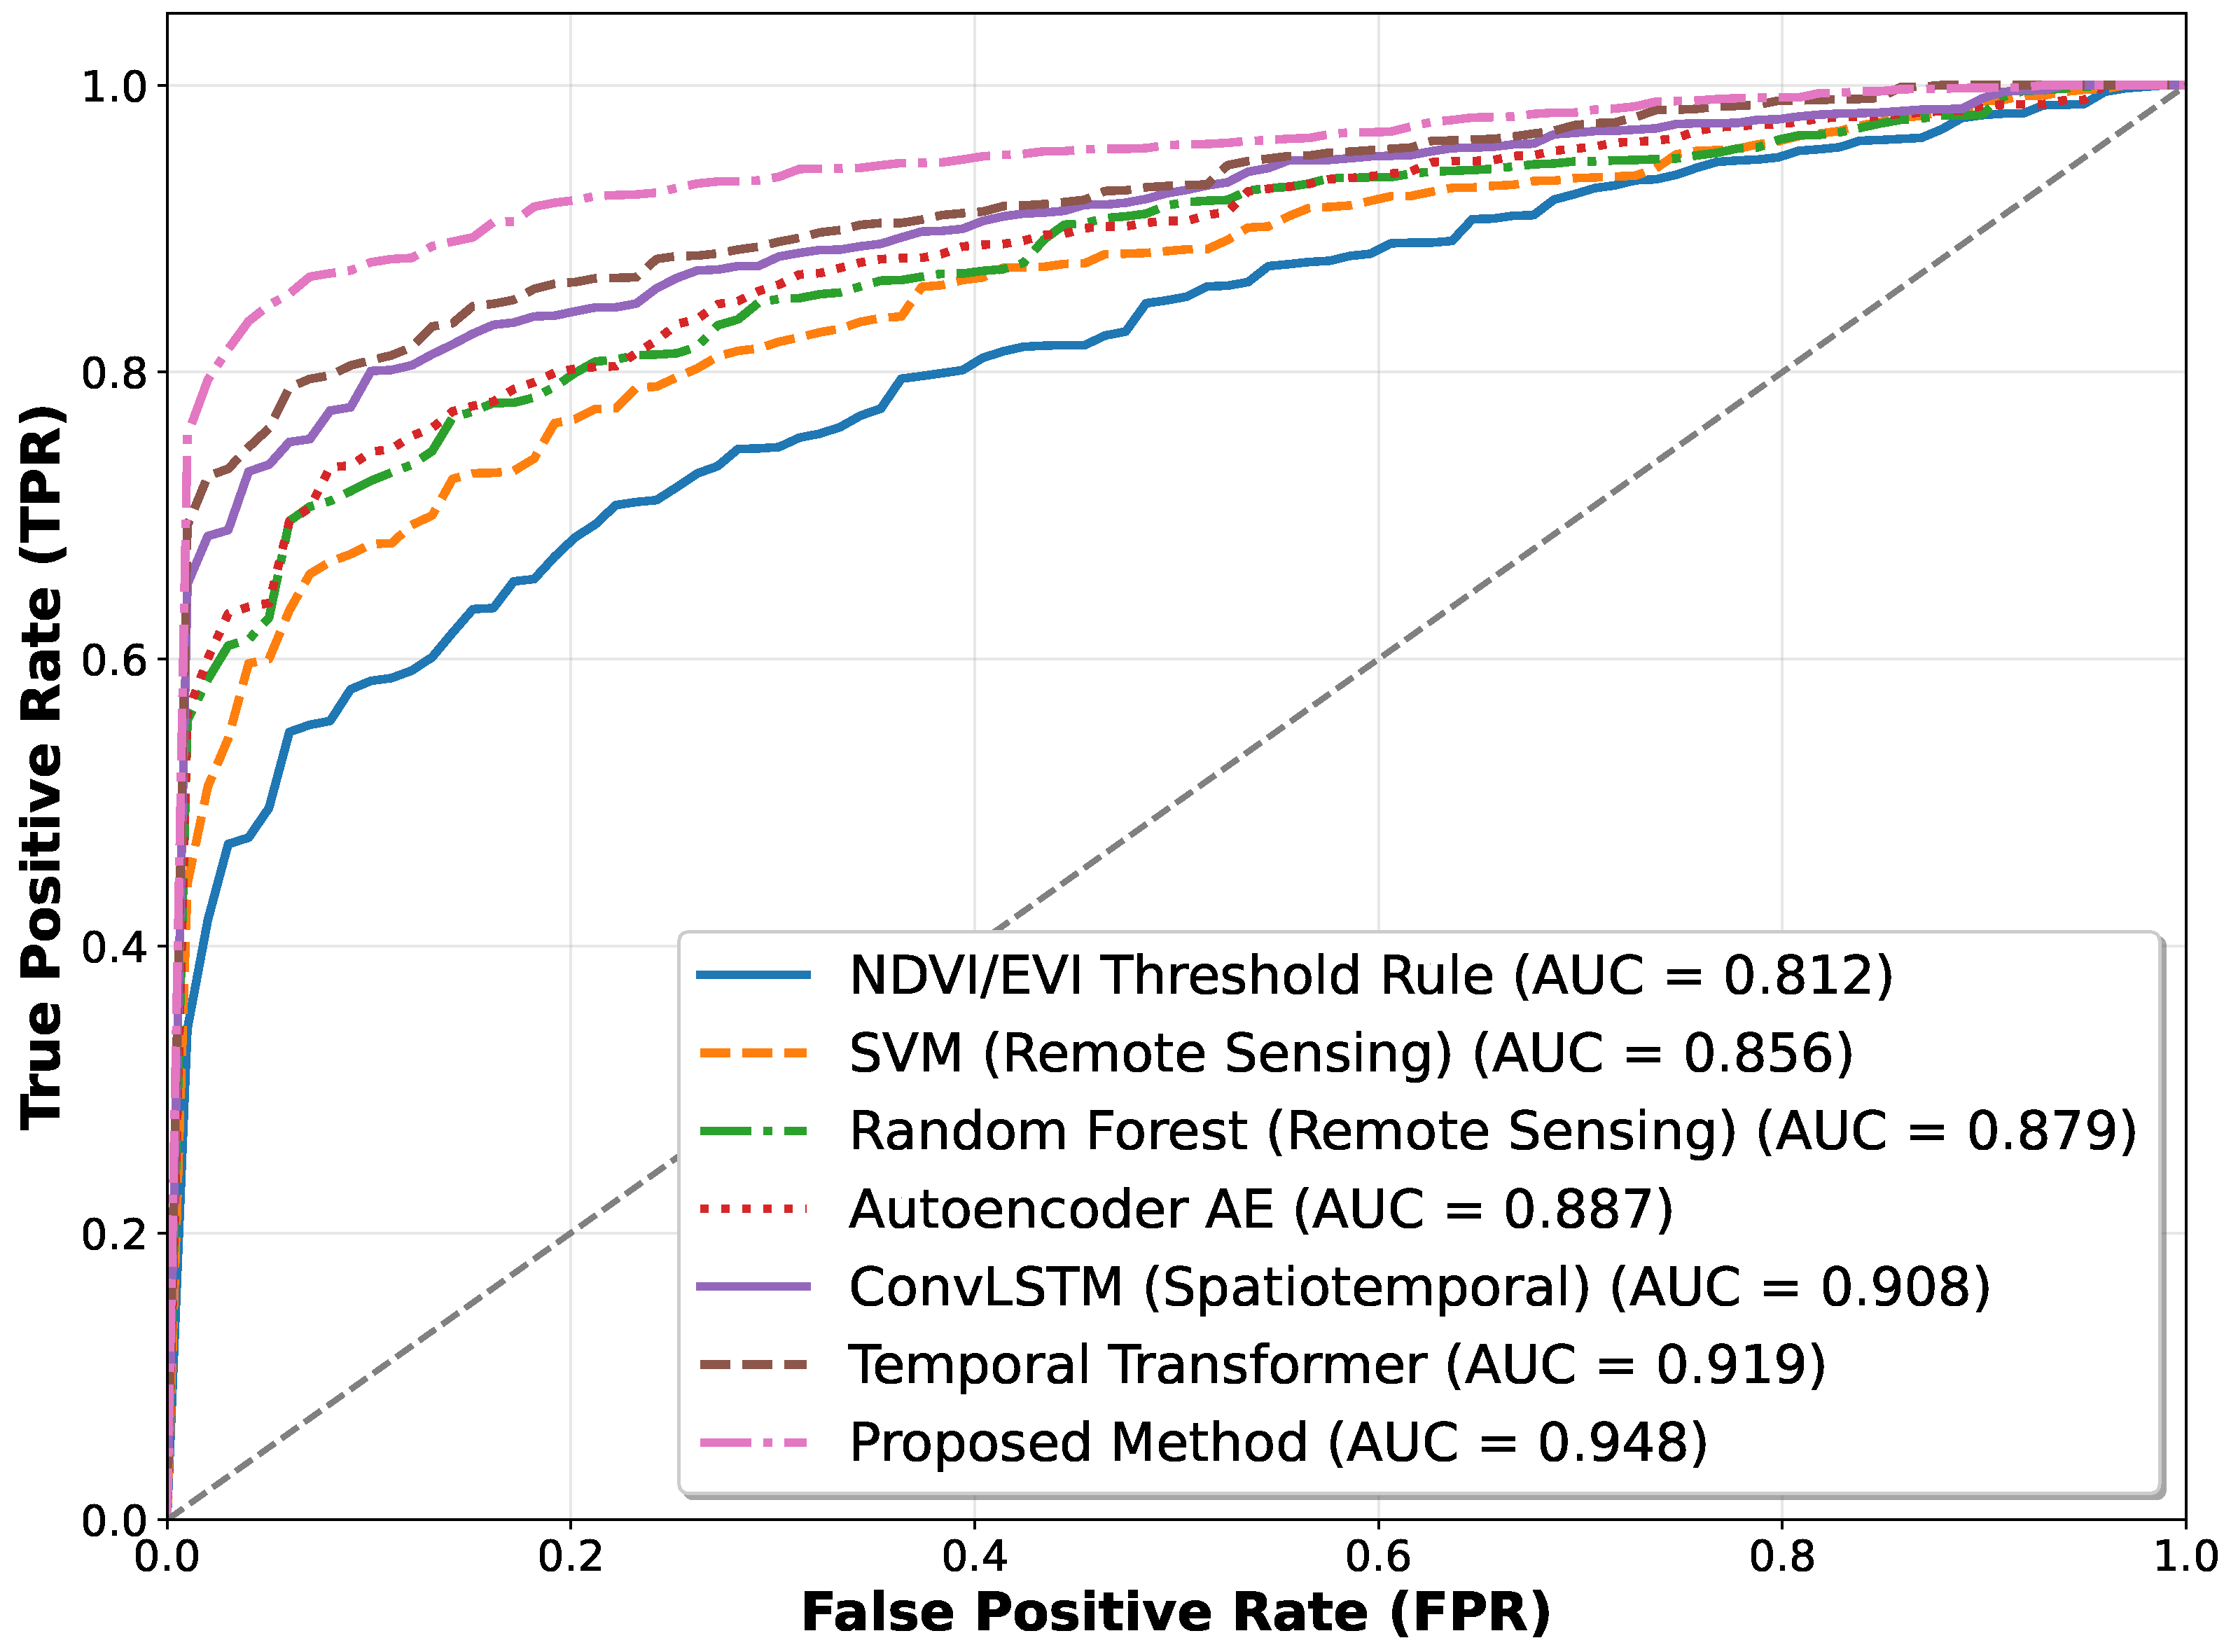
As shown in Table 4 and Figure 5, a clear hierarchical difference in performance can be observed. Traditional machine learning methods such as SVM and random forest remain constrained by handcrafted feature representations. The autoencoder-based approach indicates a strong sensitivity to anomalous samples but lacks the capacity for precise risk differentiation. When examining the reinforced baselines, ConvLSTM + R and Temporal Transformer + R, we observe a significant performance improvement over their single-task counterparts. The addition of a risk classification head allows these models to achieve F1 scores of 0.839 and 0.857, respectively, confirming that adding an evaluation stage is beneficial for risk identification. However, the proposed method still outperforms these reinforced baselines by a substantial margin. This superiority demonstrates that the performance gap is not merely attributable to the presence of a second decision level, but stems from the fundamental architectural design of dual-branch decoupling. While reinforced baselines simply stack a classifier on top of mixed spatiotemporal features, our method mathematically isolates the normal growth manifold from the anomaly deviation space. This decoupling ensures that anomaly perception is grounded in a stable phenological baseline, effectively suppressing false alarms that the reinforced baselines fail to resolve. The unified optimization of growth modeling and risk-aware perception thus provides a more robust technical paradigm for horticultural safety monitoring.

4.3. Disaggregated Performance Analysis

To provide an unequivocal visualization of the framework robustness, we present three disaggregated validation tables. These tables employ the same baseline comparison framework as the main experiment but break down the performance metrics across biological categories, production scenarios, and phenological stages.
Table 5 presents the performance differences between short-cycle vegetables and perennial fruit trees. The results indicate that all models generally achieve higher metrics on vegetables than on fruit trees. This is primarily attributed to the highly intensive management of facility vegetables, which results in more stable growth trajectories. In contrast, perennial fruit trees (apple and pear) involve complex canopy structures and significant soil-background interference, leading to higher background noise in remote sensing signals. Nevertheless, the proposed method maintains an accuracy of 0.901 and an AUC of 0.941 in the fruit tree category, significantly leading the ConvLSTM (0.857) and Temporal Transformer (0.870) baselines. This proves that the dual-branch architecture, by decoupling normal growth manifolds from anomalous deviations, effectively suppresses complex background noise and exhibits strong universality across diverse crop types.
Table 6 compares performance across two typical production environments: facility-based greenhouses and open fields. The results confirm that the proposed method demonstrates superior adaptation to varying lighting and management conditions. In open-field scenarios, where environmental factors such as lighting fluctuations and atmospheric noise are uncontrollable, the performance of traditional baseline models drops significantly. However, our proposed method achieves an accuracy of 0.897 in these challenging settings. The integration of the LoRA-based domain adaptation mechanism allows the model to precisely capture weak anomaly signals even under high environmental variability. In facility scenarios, the method reaches an accuracy of 0.931 with a standard deviation of only ±0.006, demonstrating the high stability required for precision horticultural management.
Table 7 illustrates the performance across different phenological groups (early-mid vs. late-mature stages). Horticultural crops exhibit significant physiological and spectral heterogeneity throughout their growth cycles. The results show that baselines generally perform worse in the early-mid stages, as weak anomaly signals at these stages are easily confounded by normal physiological fluctuations. In contrast, our proposed architecture maintains high consistency across the entire growth cycle, reaching an F1-score of 0.889 in the late-mature stage. This is largely due to the trend-weighted aggregation module, which dynamically captures the temporal importance of different growth phases, ensuring stable and reliable risk perception from early vegetative growth to the reproductive stages.

4.4. Anomaly Type Awareness Experiment

This experiment is designed to evaluate the adaptability and robustness of the proposed method under different types of horticultural crop growth anomalies and their corresponding safety risks, from the perspective of anomaly sources and manifestation patterns. Unlike the overall performance comparison, this experiment does not emphasize cross-model comparison. Instead, by categorizing anomalies into multiple types, the response characteristics and discrimination capability of the model under diverse anomaly mechanisms are analyzed, thereby validating whether the proposed framework truly possesses anomaly heterogeneity awareness. Given that crop growth anomalies in real production are characterized by complex origins, diverse manifestations, and distinct evolutionary pathways, a unified anomaly assumption is often insufficient to reflect model performance comprehensively. Therefore, by dividing anomalies into climate-stress-induced, management-error-induced, compound anomalies, disease-induced anomalies, and early weak anomalies, this experiment focuses on evaluating detection accuracy and risk discrimination stability under different anomaly intensities, spatial diffusion patterns, and temporal evolution stages, thus assessing the applicability of the proposed method in real horticultural safety monitoring scenarios.
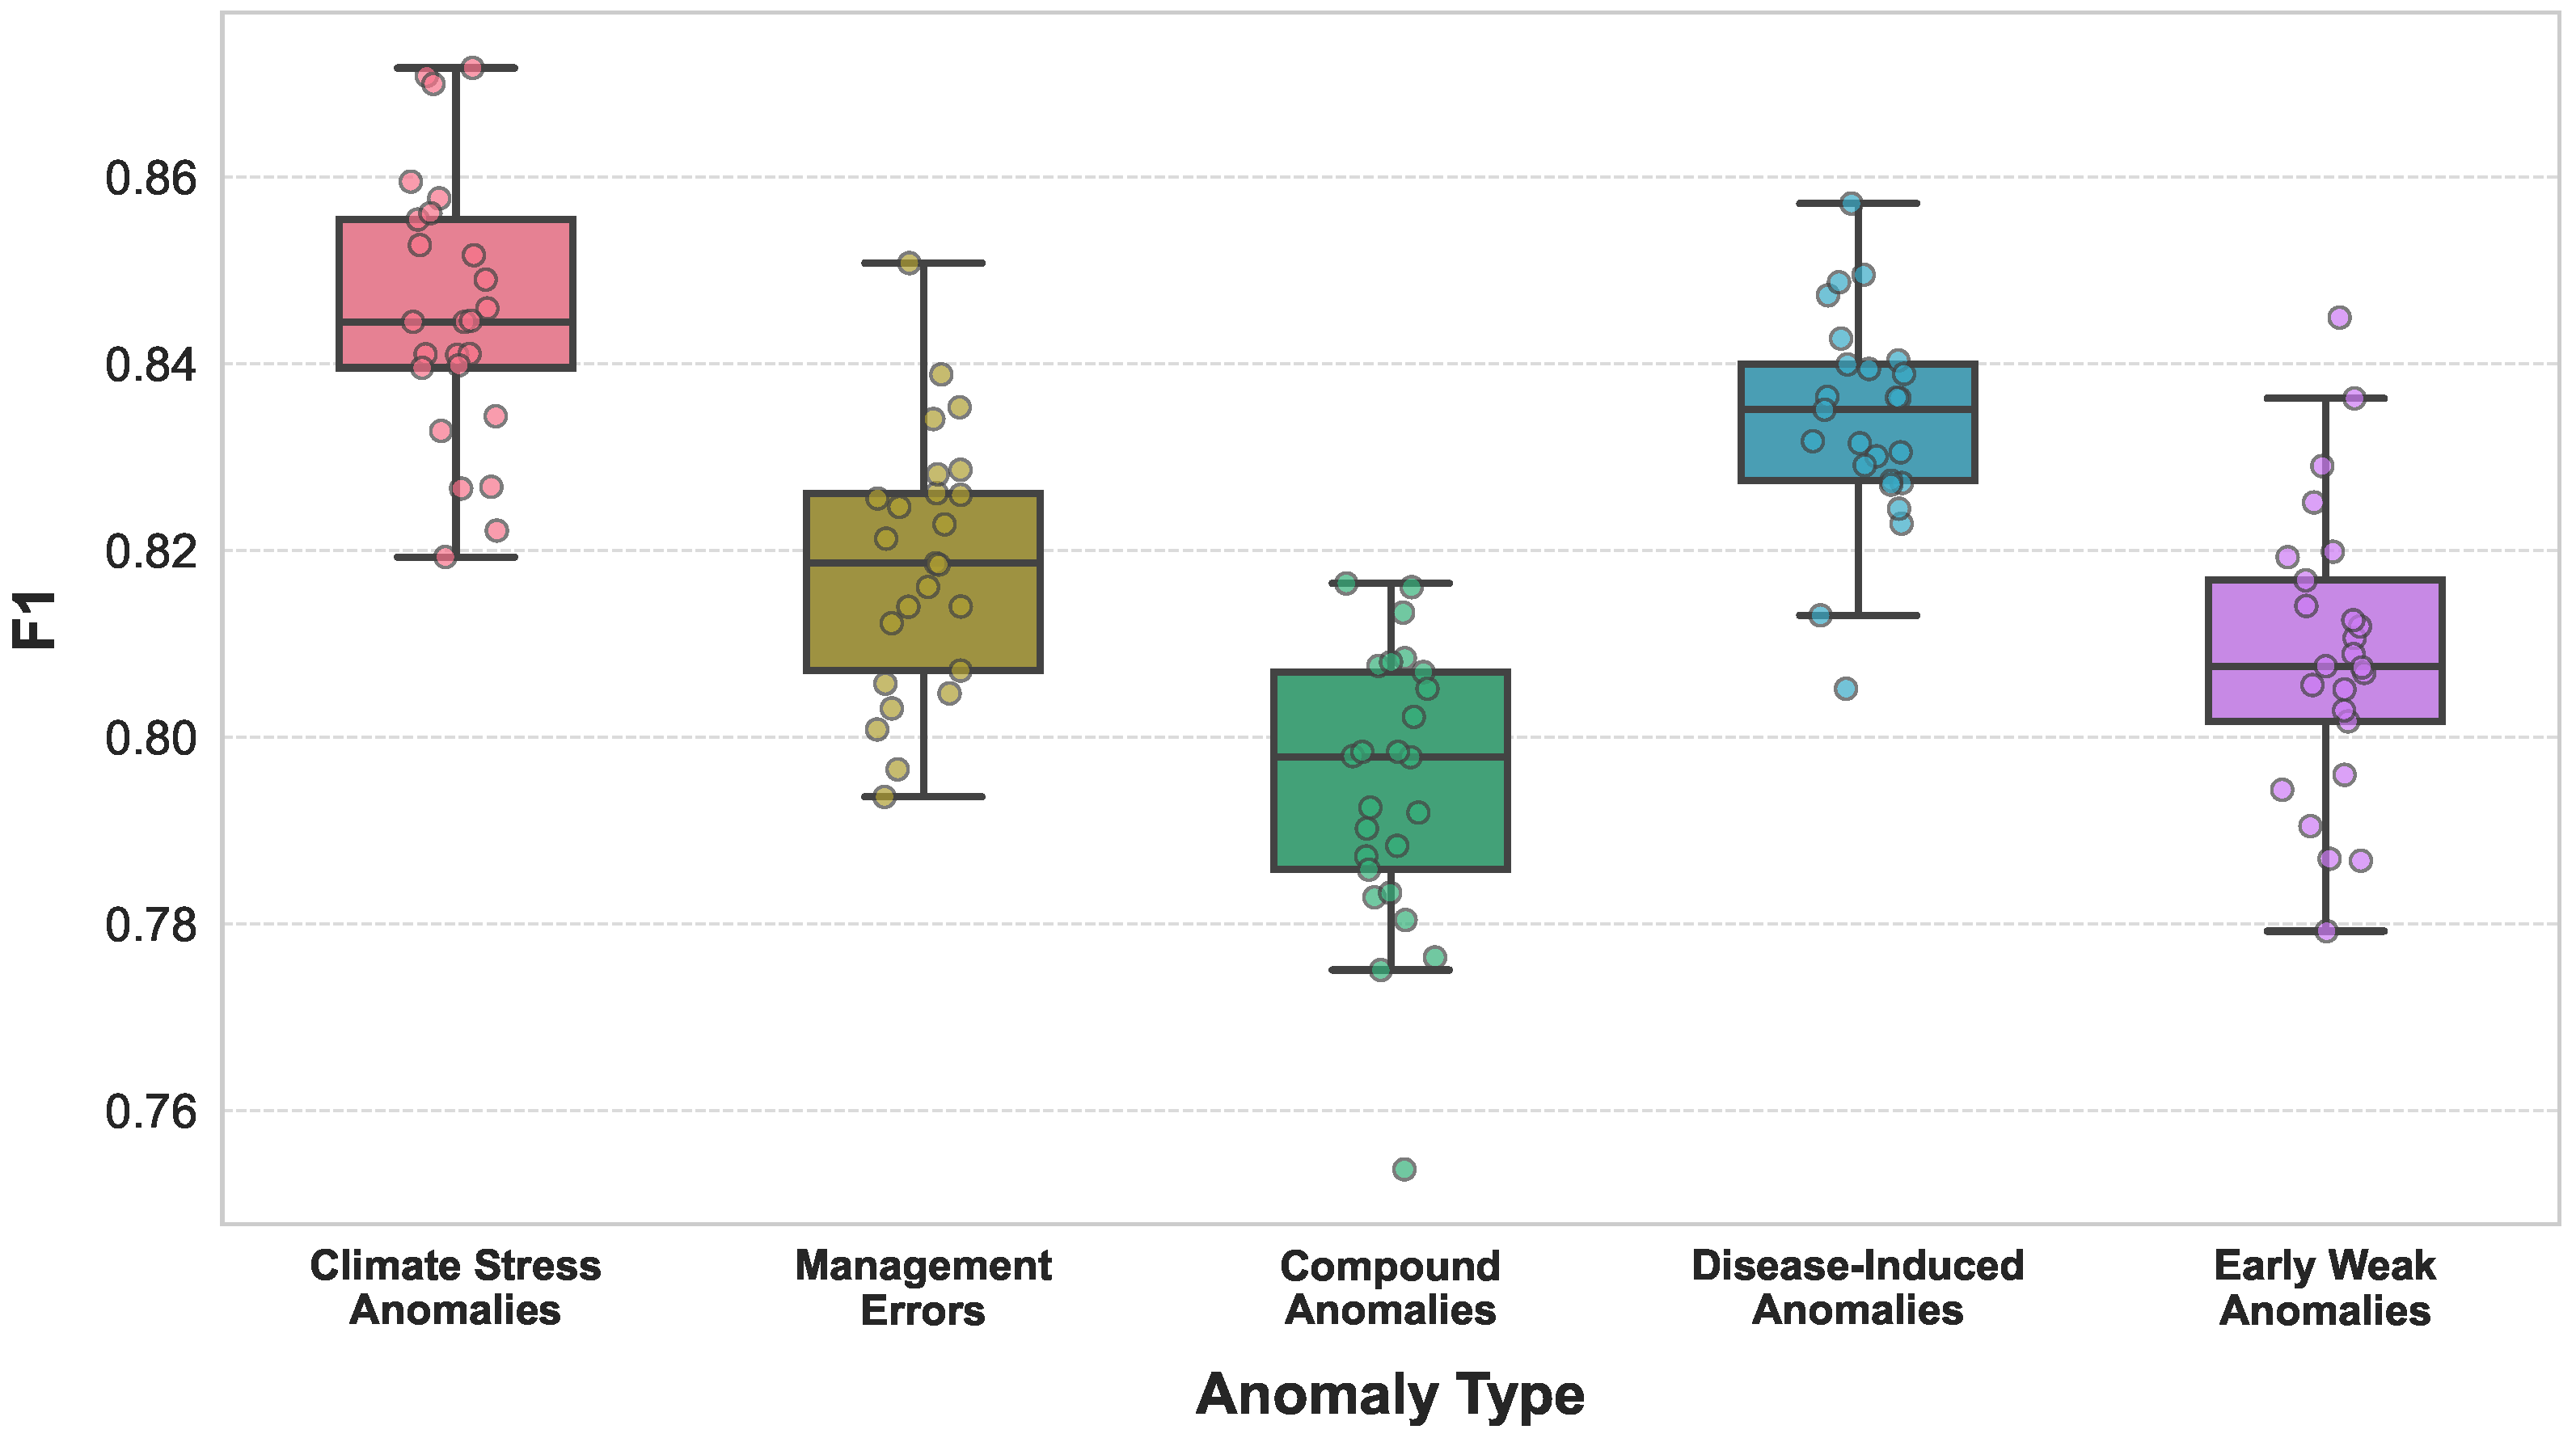
As shown in Table 8 and Figure 6, the proposed method maintains stable and consistent performance across different anomaly scenarios, while exhibiting interpretable performance variations among anomaly types. The highest performance is achieved for climate stress anomalies, which is mainly due to the fact that such anomalies typically manifest as sustained deviations and trend-level changes in the temporal domain. These patterns can be effectively captured by the growth state modeling branch that learns normal growth trajectories, while the anomaly perception branch amplifies long-term deviations in the embedding space. Disease-induced anomalies also achieve relatively high performance, indicating that the model has strong capability in modeling spatial texture and local structural changes, enabling early detection of lesion expansion and initial infection signals. In comparison, management-error-induced anomalies and early weak anomalies show slightly lower performance, as these anomalies are often characterized by sudden onset, locality, and reversibility, making their remote sensing signatures closer to normal fluctuations and thus posing higher demands on anomaly boundary discrimination. Compound anomalies exhibit the lowest performance, yet still remain at a relatively high level, suggesting that when multiple anomaly factors interact simultaneously, the model must balance stable growth semantics with diverse anomaly evidence. From a mathematical modeling perspective, the dual-branch architecture decouples the normal growth manifold from the anomaly deviation space, allowing the model to adaptively adjust its emphasis on trend information and local perturbations under different anomaly types. Meanwhile, the risk joint discrimination mechanism constrains the influence of anomalies on final decisions, preventing excessive amplification or misclassification in complex anomaly scenarios. This structural advantage fundamentally explains the stable performance of the proposed method under heterogeneous anomaly conditions.

4.5. Module Ablation Experiment

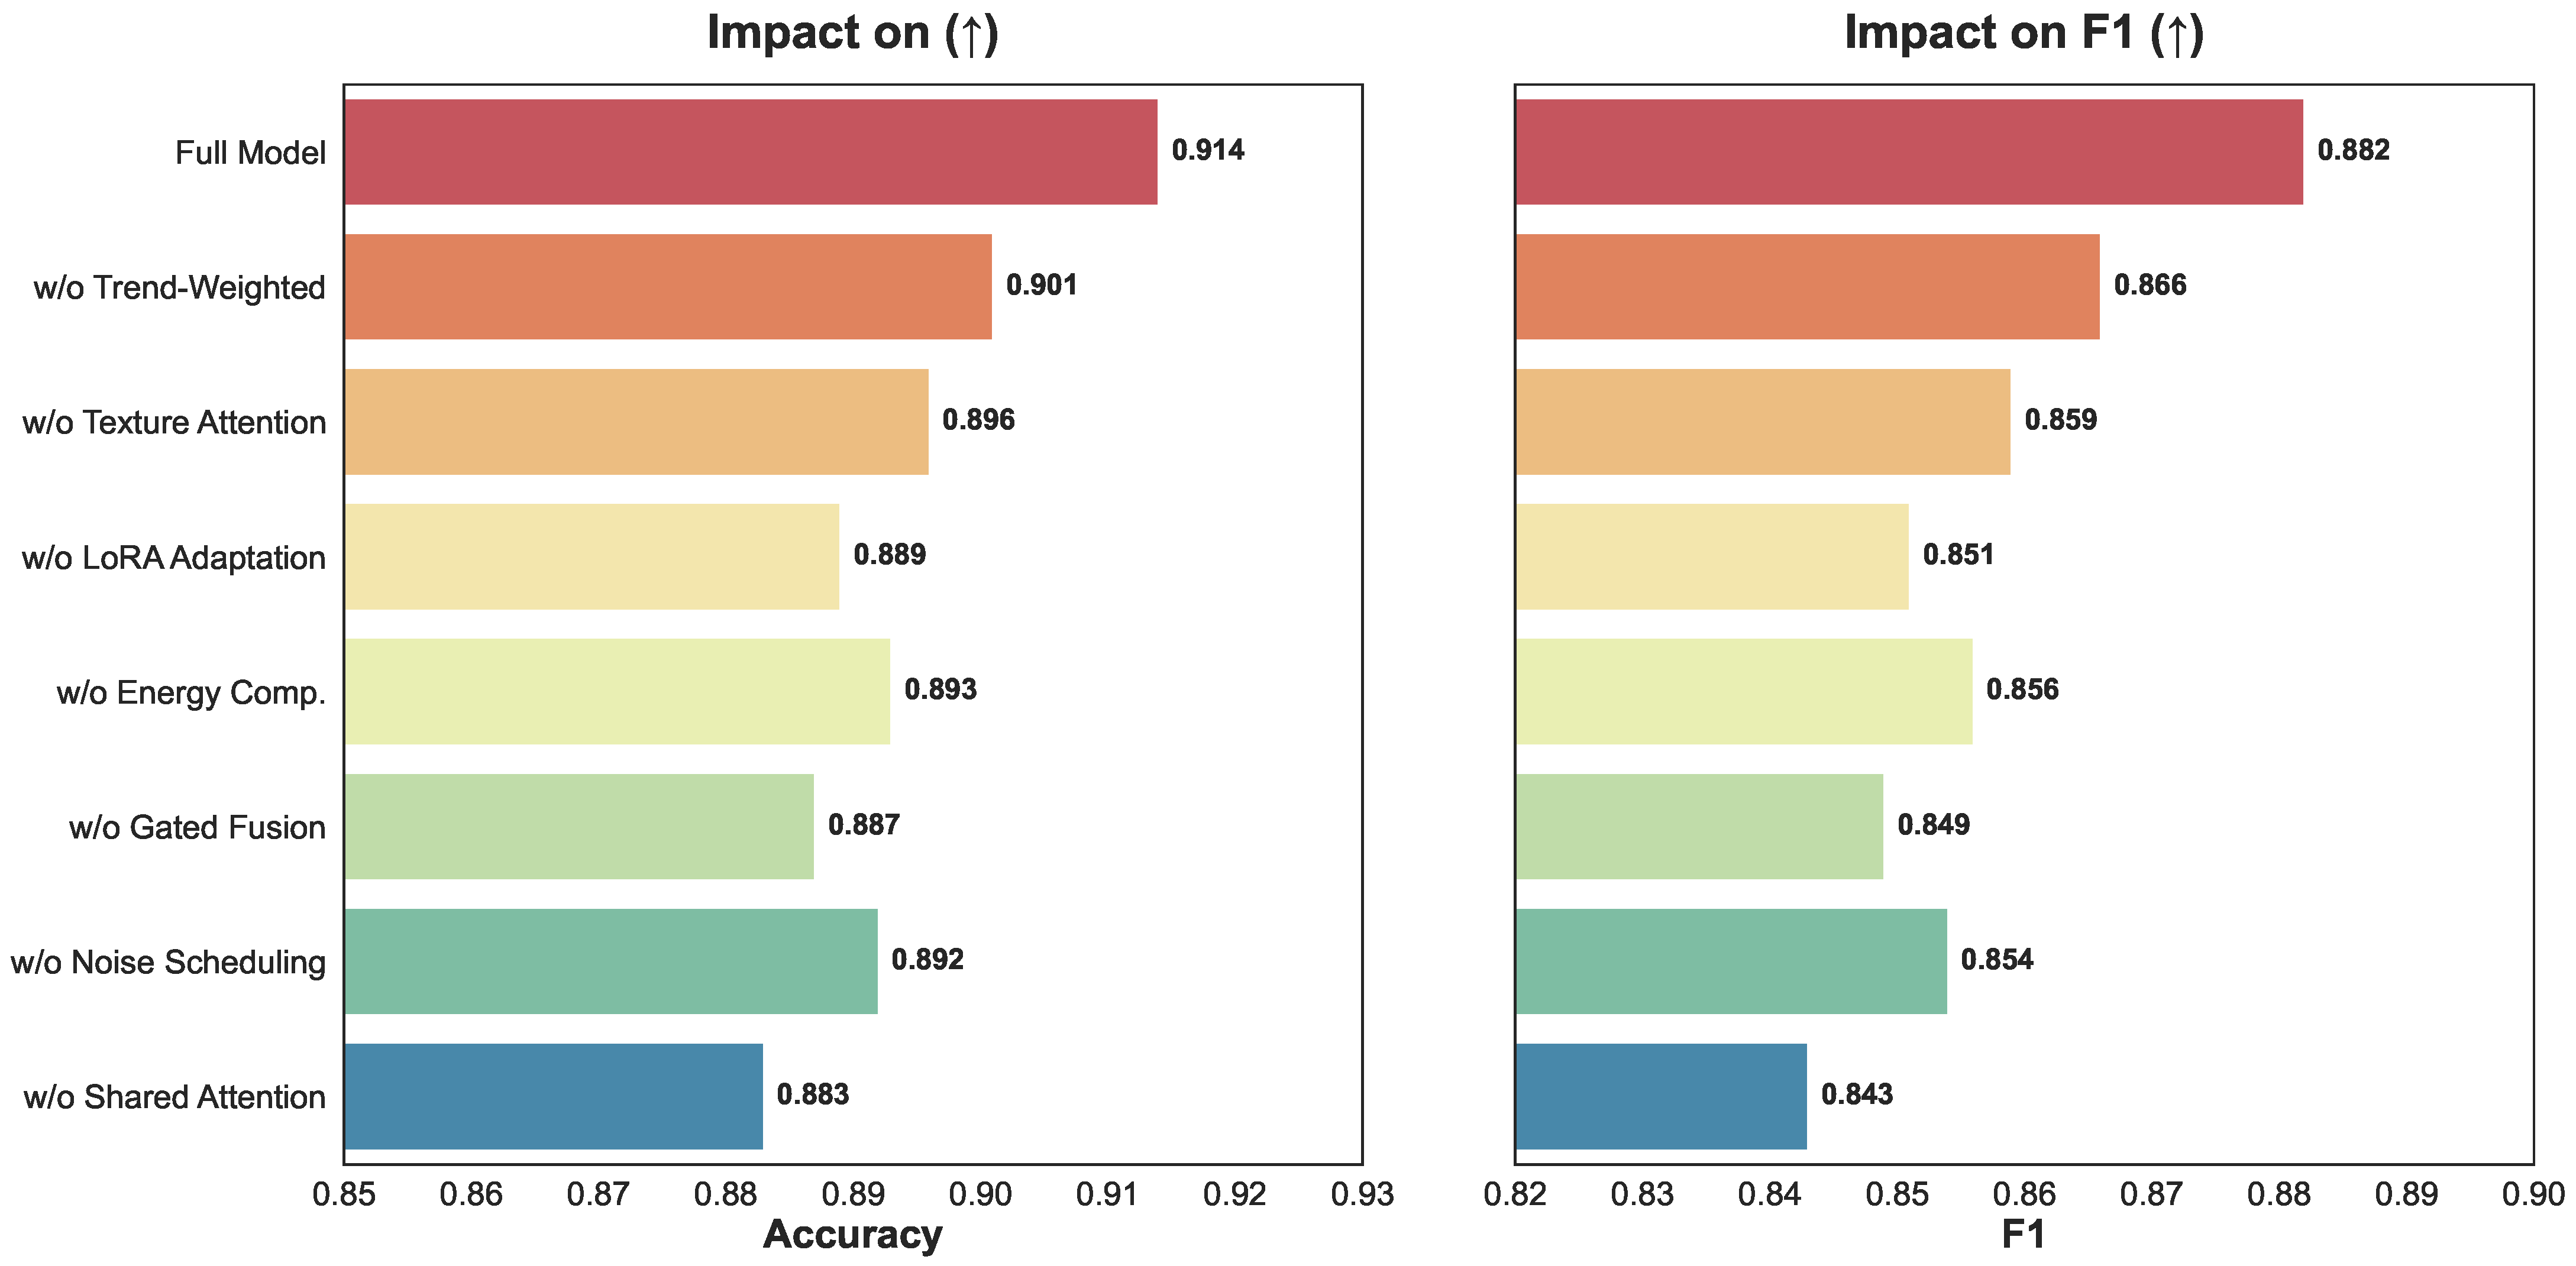
The purpose of the module ablation experiment is to systematically analyze the role of each key component in the proposed framework and to validate their necessity and complementarity in horticultural crop growth anomaly and safety risk detection tasks. By sequentially removing or simplifying core components while keeping the training data, evaluation metrics, and experimental protocols unchanged, the resulting performance variations can be observed, thereby revealing the contribution of each module to anomaly recognition accuracy, risk discrimination stability, and overall generalization capability. This experiment not only verifies the rationality of the complete model design, but also provides quantitative insights into how normal growth modeling, anomaly deviation perception, and risk evolution are jointly captured in complex horticultural scenarios.
As shown in Table 9 and Figure 7, the full model achieves the best performance across all evaluation metrics, indicating effective synergy among all components. Replacing trend-weighted aggregation with simple mean aggregation leads to a noticeable performance drop, demonstrating that different growth stages contribute unequally to temporal modeling and that ignoring temporal importance weakens the representation of critical growth phases and anomaly onset moments. Removing the texture attention module also degrades performance, confirming the indispensable role of spatial texture information in distinguishing normal growth from local anomalies, especially in disease spread and localized stress scenarios. Removing LoRA adaptation in the anomaly branch further reduces performance, highlighting that low-rank domain adaptation effectively constrains feature drift under limited anomaly samples and cross-regional distribution shifts. Removing the energy complementarity mechanism results in weaker anomaly characterization, as relying on a single perspective fails to jointly capture global deviations and local disturbances. Eliminating gated fusion and noise scheduling in the risk module leads to declines in precision and auc, indicating that adaptive modulation of anomaly evidence is essential for suppressing noise-induced false alarms. Finally, replacing shared attention joint modeling with simple feature concatenation causes one of the most significant performance drops, demonstrating that placing normal growth semantics and anomaly evidence within a unified attention space is crucial for stable risk discrimination. Regarding the trade-off between complexity and performance, the architectural choices are justified by the substantial gains in F1-score and AUC, which are critical for operational horticultural safety. For instance, the transition from simple feature concatenation to shared attention joint modeling yields a 3.9 percent improvement in F1-score. In large-scale horticultural production, such an improvement translates to a significantly lower rate of missed alerts for systemic risks, where the economic cost of a single undetected disease outbreak far outweighs the incremental computational overhead of the transformer layers. Furthermore, while the dual-branch structure increases the total parameter count, the implementation of LoRA adaptation ensures that the learnable parameters are restricted to a low-dimensional subspace, providing a highly efficient training regime. The gated fusion and energy scoring mechanisms add negligible FLOPs during inference but are responsible for the model’s ability to suppress false positives in complex backgrounds. Thus, the architectural complexity is not a superfluous addition but a necessary investment to achieve the sensitivity and reliability required for field-deployable smart horticultural systems.

4.6. Retrospective Case Study and Agronomic Validation

To bridge the logical gap between latent statistical anomalies and material agricultural risks, we conducted a retrospective case study using longitudinal data from the Linhe District (2019–2024). This analysis focuses on correlating the model internal energy scores and risk module outputs with documented field evidence, including yield records, phytosanitary survey reports, and expert management logs. We operationalized agricultural risk by anchoring it to concrete agronomic consequences: a risk alert is validated only when the corresponding anomaly results in a recorded yield loss exceeding 15 percent or requires immediate chemical or physical intervention as documented by local agronomists.
A representative case from the 2022 tomato growing season illustrates this correlation. During the flowering stage, the anomaly branch detected a significant increase in the energy score E t , which reached a value of 0.78, deviating substantially from the normal growth manifold. While this initially appeared as a spectral fluctuation, the risk joint discrimination module processed this evidence alongside temporal phenological embeddings and issued a high-level risk alert. Retrospective field logs confirmed that this specific period coincided with an early-stage outbreak of Tuta absoluta. Without the intervention triggered by the risk perception framework, the estimated yield loss for the affected plots reached 22 percent. By comparing 120 such historical events in Linhe, we observed a Pearson correlation coefficient of 0.84 between the risk module output and the actual degree of biomass reduction. To further validate the statistical reliability of this observation, a two-sided significance test was conducted. The resulting p-value is less than 0.001, indicating that the correlation is statistically significant. In addition, the 95% confidence interval estimated via Fisher’s Z-transformation is [0.78, 0.89], which does not cross zero, confirming the robustness of the relationship.
To facilitate practical agricultural management, we propose a parametric decision matrix that translates latent model outputs into interpretable management categories. We defined three risk levels based on the energy score E t and the risk probability P r : Level 1 (Routine Monitoring) where E t is below 0.4 and P r is below 0.3, indicating innocuous physiological fluctuations; Level 2 (Precision Inspection) where E t is between 0.4 and 0.7 or P r is between 0.3 and 0.6, suggesting a need for targeted field scouting; and Level 3 (Emergency Intervention) where E t exceeds 0.7 or P r exceeds 0.6, correlating with potential yield losses and requiring immediate rescue operations. This scale ensures that the mathematical outputs of the CG-MLLM-MOT block are directly actionable for farmers and decision-makers [54,55]. The threshold values were derived through a data-driven calibration process. Specifically, the empirical distribution of energy scores was first analyzed using quantile-based partitioning to obtain initial threshold candidates. These thresholds were subsequently refined by aligning them with recorded agronomic intervention events, including yield loss and emergency management actions, ensuring consistency between model outputs and practical decision-making requirements.

4.7. Discussion

4.7.1. Practical Deployment and System-Level Implications

The present study is motivated by practical horticultural production and agricultural safety management demands, and investigates the significance and applicability of deep remote sensing-based crop growth anomaly and risk perception methods in real-world scenarios. In practical production environments, horticultural crops are often distributed across large-scale and highly heterogeneous fields, making it difficult for manual inspection or experience-based judgment to achieve timely and comprehensive coverage, particularly under the increasing frequency of extreme climatic events. Growth anomalies in such contexts are often characterized by concealment and cumulative effects. For example, in irrigated agricultural regions such as the Hetao irrigation area, localized irrigation imbalance, salinity stress, or short-term high-temperature events may initially manifest only as slight fluctuations in growth vigor. If these early signals are not detected and addressed in a timely manner, they may gradually evolve into yield reduction or even complete crop failure. By jointly modeling normal growth trajectories and anomalous deviations, the proposed method enables early warning signals to be generated before anomalies become fully explicit, thereby providing critical time windows for precision irrigation adjustment, fertilization optimization, and disease prevention. This transition from post-event identification to pre-emptive perception is of substantial practical importance for maintaining the stable operation of intelligent horticultural systems [54].
Regarding the feasibility of real-world deployment, the computational requirements of the proposed dual-branch model are addressed through a cloud-edge collaborative architecture. For large-scale satellite and high-resolution UAV imagery, cloud-based agricultural platforms provide the necessary high-performance computing resources to execute the full dual-branch architecture and risk discrimination module. Meanwhile, the lightweight nature of the LoRA-adapted anomaly perception branch allows for potential deployment on high-performance edge devices, such as UAV ground stations or smart gateways equipped with specialized AI accelerators. Such a configuration enables localized, preliminary anomaly screening at the edge, while offloading complex risk joint discrimination and long-term temporal modeling to the cloud. This hybrid deployment strategy mitigates the latency issues associated with processing multi-temporal high-resolution data and ensures the scalability of the system across large horticultural regions.
Furthermore, the practical utility of the framework is enhanced through its integration with existing Farm Management Systems (FMSs). The output risk tokens and energy scores can be transmitted via standardized APIs to FMS, where they serve as triggers for automated or semi-automated management loops. For instance, a high-risk alert in a specific plot can automatically update irrigation schedules or notify farmers to conduct targeted phytosanitary drone missions. Farmers and decision-makers interact with the model outputs through intuitive risk maps and decision-support dashboards, which translate abstract energy scores into actionable categories such as low-risk maintenance or high-risk emergency intervention. Despite these strengths, operational limitations remain, including the dependency on stable internet connectivity for cloud-based processing and the sensitivity of the model to sensor calibration across different UAV platforms. Future development should focus on enhancing the robustness of the system to varying data transmission qualities and further optimizing the model for resource-constrained edge environments.

4.7.2. Agricultural Economics Implications

From an agricultural economics perspective, the relationship between growth anomalies and production risks is not simply linear, but instead influences farmers income, regional supply stability, and upstream and downstream market expectations through temporal accumulation and spatial diffusion. Taking facility vegetables and fruit tree production as examples, early anomalies that are effectively suppressed through timely and targeted intervention typically incur substantially lower marginal management costs compared with late-stage remedial actions or post-disaster reconstruction [55]. The risk perception framework proposed in this study facilitates differentiated investment at the production decision level, whereby limited management resources can be preferentially allocated to high-risk plots and critical phenological stages, thereby improving input–output efficiency and reducing ineffective expenditures. At the regional scale, continuous risk perception results provide quantitative evidence for agricultural authorities to assess crop safety conditions, which is beneficial for optimizing agricultural insurance pricing, disaster subsidy allocation, and yield expectation assessment. When anomalies are treated as precursors of risk formation rather than isolated events, agricultural production decisions can be adjusted in a more forward-looking manner, enabling planting structures and management strategies to be optimized in advance and reducing the impact of systemic risks on regional agricultural economies. Overall, the proposed method not only enhances the technical level of horticultural crop monitoring, but also provides a feasible pathway for the transformation of agricultural production from experience-driven management to risk-aware decision-making, with tangible value for stabilizing farmers income and safeguarding regional agricultural economic security [45].

4.8. Limitations and Future Work

Although the proposed deep remote sensing–based dual detection framework for horticultural crop growth anomalies and safety risks demonstrates strong performance and stability across multiple experiments, several aspects remain to be further improved. First, from a data perspective, remote sensing observations are still constrained by temporal resolution and observation conditions, including satellite revisit cycles, cloud occlusion, and extreme weather events. As a result, effective observations during key phenological stages may be missing or discontinuous, which to some extent limits the model’s ability to finely characterize rapidly emerging anomalies. Second, the current risk modeling strategy primarily relies on the joint discrimination of growth states and anomaly features, without explicitly incorporating economic variables such as price fluctuations, labor input, or market demand. Consequently, the risk assessment results mainly reflect production-level safety, while economic risk representation remains relatively indirect. Although the proposed method achieves significant performance improvements, its model complexity remains a non-negligible practical limitation. Specifically, the parameter scale reaches 102.35 M, which is substantially higher than that of the strongest baseline model (21.68 M). This disparity is not only reflected in the number of parameters, but also manifests in increased computational cost and inference latency. The complexity primarily arises from the dual-branch decoupling architecture and the transformer-based risk joint discrimination module. While the multi-layer self-attention mechanisms and high-dimensional feature interactions enhance the model’s capability to capture spatiotemporal dynamics and anomaly evolution, they inevitably introduce considerable computational overhead. As a result, in resource-constrained agricultural scenarios—particularly on edge devices with limited computational capacity, such as UAV platforms, field gateways, or embedded monitoring systems—end-to-end real-time deployment becomes challenging. From a system-level perspective, this complexity may further limit the scalability of the model in large-scale farmland monitoring applications. For instance, in scenarios requiring high-frequency inspection or parallel monitoring across multiple plots, models with a large number of parameters can significantly increase computational demands and system response latency, thereby affecting the timeliness of risk early warning. Moreover, disparities in infrastructure conditions across agricultural regions, including network bandwidth and available computational resources, may exacerbate deployment imbalance, making it difficult for low-resource areas to directly adopt the full model.
Future research can extend and deepen the proposed framework from multiple directions. On the one hand, integrating multi-source data, including meteorological forecasts, soil sensor measurements, and management records, would enhance the interpretability of anomaly causes and improve the characterization of risk evolution processes. On the other hand, more explicit economic constraints or decision models could be introduced on top of the current framework, linking risk perception outcomes with management intervention strategies, insurance mechanisms, or revenue evaluation, thereby promoting a transition from risk identification to risk-informed decision support. In addition, with the continued development of remote sensing and edge computing technologies, exploring lightweight deployment strategies for real-time or near-real-time monitoring scenarios would further increase the practical applicability of the proposed method in horticultural production systems.

5. Conclusions

This study addressed the critical need for regional-scale growth anomaly identification and risk assessment in smart horticulture. By proposing a deep remote sensing-based dual detection framework, we successfully integrated growth state modeling, anomaly perception, and risk joint discrimination. The adoption of a dual-branch architecture allowed for the decoupling of normal growth patterns from anomalous features, effectively reducing false alarms caused by non-risk physiological fluctuations. Experimental results across diverse horticultural scenarios confirmed that the proposed method outperformed traditional and deep learning baselines, achieving high accuracy and stability. This work provides a practical technical pathway for transforming horticultural management from experience-driven paradigms toward risk-aware and refined digital systems, ultimately contributing to the stability of regional agricultural economies.

Author Contributions

Conceptualization, Y.B., C.F., S.L. and Y.S.; Data curation, X.W. and Y.L.; Formal analysis, J.F.; Funding acquisition, Y.S.; Investigation, J.F.; Methodology, Y.B., C.F. and S.L.; Project administration, Y.S.; Resources, X.W. and Y.L.; Software, Y.B., C.F. and S.L.; Supervision, Y.S.; Validation, J.F.; Visualization, X.W. and Y.L.; Writing—original draft, Y.B., C.F., S.L., X.W., J.F., Y.L. and Y.S.; Y.B., C.F. and S.L. contributed equally to this work. All authors have read and agreed to the published version of the manuscript.

Funding

This research was funded by National Natural Science Foundation of China grant number 61202479.

Data Availability Statement

The original contributions presented in this study are included in the article. Further inquiries can be directed to the corresponding author.

Conflicts of Interest

The authors declare no conflicts of interest.

References

  1. Lastochkina, O.; Aliniaeifard, S.; SeifiKalhor, M.; Bosacchi, M.; Maslennikova, D.; Lubyanova, A. Novel approaches for sustainable horticultural crop production: Advances and prospects. Horticulturae 2022, 8, 910. [Google Scholar] [CrossRef] [Scilit]
  2. Kumar, A.; Rajput, R.; Shankar, R.; Kumari, S.; Kanaujia, S.; Jamir, S. Adaptation strategies for horticultural crops under changing climate conditions: A review. Ann. Plant Soil Res. 2024, 26, 359–371. [Google Scholar] [CrossRef] [Scilit]
  3. Khatri, P.; Kumar, P.; Shakya, K.S.; Kirlas, M.C.; Tiwari, K.K. Understanding the intertwined nature of rising multiple risks in modern agriculture and food system. Environ. Dev. Sustain. 2024, 26, 24107–24150. [Google Scholar] [CrossRef] [Scilit]
  4. Catalano, C.; Paiano, L.; Calabrese, F.; Cataldo, M.; Mancarella, L.; Tommasi, F. Anomaly detection in smart agriculture systems. Comput. Ind. 2022, 143, 103750. [Google Scholar] [CrossRef] [Scilit]
  5. Yu, H.; Kong, B.; Hou, Y.; Xu, X.; Chen, T.; Liu, X. A critical review on applications of hyperspectral remote sensing in crop monitoring. Exp. Agric. 2022, 58, e26. [Google Scholar] [CrossRef] [Scilit]
  6. Kumar, A.; Upadhyay, P.; Singh, U. Multi-Sensor and Multi-Temporal Remote Sensing: Specific Single Class Mapping; CRC Press: Boca Raton, FL, USA, 2023. [Google Scholar]
  7. Srinivasa Rao, M.; Mani, M.; Prasad, Y.; Prabhakar, M.; Sridhar, V.; Vennila, S.; Singh, V. Climate change and pest management strategies in horticultural and agricultural ecosystems. In Trends in Horticultural Entomology; Springer: Singapore, 2022; pp. 81–122. [Google Scholar]
  8. Gammanpila, H.; Sashika, M.N.; Priyadarshani, S. Advancing horticultural crop loss reduction through robotic and AI technologies: Innovations, applications, and practical implications. Adv. Agric. 2024, 2024, 2472111. [Google Scholar] [CrossRef] [Scilit]
  9. Vidican, R.; Mălinaș, A.; Ranta, O.; Moldovan, C.; Marian, O.; Ghețe, A.; Ghișe, C.R.; Popovici, F.; Cătunescu, G.M. Using remote sensing vegetation indices for the discrimination and monitoring of agricultural crops: A critical review. Agronomy 2023, 13, 3040. [Google Scholar] [CrossRef] [Scilit]
  10. Ahmed, N.; Zhang, B.; Deng, L.; Bozdar, B.; Li, J.; Chachar, S.; Chachar, Z.; Jahan, I.; Talpur, A.; Gishkori, M.S.; et al. Advancing horizons in vegetable cultivation: A journey from ageold practices to high-tech greenhouse cultivation—A review. Front. Plant Sci. 2024, 15, 1357153. [Google Scholar] [CrossRef] [Scilit]
  11. Hassan, M.; El-Amary, N.H.; Alberoni, D.; Cutajar, S.; Öztekİn, G.B. Integrated monitoring and prediction artificial intelligent based expert system: A case study on hydroponics strawberry cultivation. Discov. Artif. Intell. 2025, 5, 369. [Google Scholar] [CrossRef] [Scilit]
  12. Gkountakos, K.; Ioannidis, K.; Demestichas, K.; Vrochidis, S.; Kompatsiaris, I. A Comprehensive Review of Deep Learning-Based Anomaly Detection Methods for Precision Agriculture. IEEE Access 2024, 12, 197715–197733. [Google Scholar] [CrossRef] [Scilit]
  13. Zhang, L.; Zhang, Y.; Ma, X. A new strategy for tuning ReLUs: Self-adaptive linear units (SALUs). In Proceedings of the ICMLCA 2021—2nd International Conference on Machine Learning and Computer Application, Shenyang, China, 17–19 December 2021; pp. 1–8. [Google Scholar]
  14. Xu, S.; Zhang, Y.; Dong, W.; Bie, Z.; Peng, C.; Huang, Y. Early identification and localization algorithm for weak seedlings based on phenotype detection and machine learning. Agriculture 2023, 13, 212. [Google Scholar] [CrossRef] [Scilit]
  15. Wei, C.; Shan, Y.; Zhen, M. Deep learning-based anomaly detection for precision field crop protection. Front. Plant Sci. 2025, 16, 1576756. [Google Scholar] [CrossRef] [Scilit] [PubMed]
  16. Huang, C.; Wang, B.; Wang, W.; Wen, J.; Shen, L.; Ren, W.; Xu, Y.; Cao, X. Advancing Adaptive Multi-Stage Video Anomaly Reasoning: A Benchmark Dataset and Method. arXiv 2026, arXiv:2601.10165. [Google Scholar] [CrossRef] [Scilit]
  17. Wang, D.; Cao, W.; Zhang, F.; Li, Z.; Xu, S.; Wu, X. A review of deep learning in multiscale agricultural sensing. Remote Sens. 2022, 14, 559. [Google Scholar] [CrossRef] [Scilit]
  18. Saleem, M.H.; Potgieter, J.; Arif, K.M. A performance-optimized deep learning-based plant disease detection approach for horticultural crops of New Zealand. IEEE Access 2022, 10, 89798–89822. [Google Scholar]
  19. Zhou, C.; Cao, Y.; Ming, B.; Luo, J.; Xu, F.; Zhang, J.; Dong, M. A Multimodal Deep Learning Framework for Intelligent Pest and Disease Monitoring in Smart Horticultural Production Systems. Horticulturae 2025, 12, 8. [Google Scholar] [CrossRef] [Scilit]
  20. Burbano-Figueroa, O.; Sierra-Monroy, A.; David-Hinestroza, A.; Whitney, C.; Borgemeister, C.; Luedeling, E. Farm-planning under risk: An application of decision analysis and portfolio theory for the assessment of crop diversification strategies in horticultural systems. Agric. Syst. 2022, 199, 103409. [Google Scholar] [CrossRef] [Scilit]
  21. Afsharpour, P.; Zoughi, T.; Deypir, M.; Zoqi, M.J. Robust deep learning method for fruit decay detection and plant identification: Enhancing food security and quality control. Front. Plant Sci. 2024, 15, 1366395. [Google Scholar] [CrossRef] [Scilit]
  22. Li, J.; Ke, T.; Yue, F.; Wang, N.; Guo, K.; Mei, L.; Song, Y. A Cross-Crop and Cross-Regional Generalized Deep Learning Framework for Intelligent Disease Detection and Economic Decision Support in Horticulture. Horticulturae 2025, 11, 1397. [Google Scholar]
  23. Doren, J.; Hadad, R.; McKeag, L.; Tucker, C.; Newbold, E. Food safety risks of harvesting dropped and drooping produce: A review. J. Food Prot. 2022, 85, 571–582. [Google Scholar] [CrossRef] [Scilit]
  24. Han, G.; Pan, X.; Zhang, X. Big data-driven risk decision-making and safety management in agricultural supply chains. Qual. Assur. Saf. Crop. Foods 2024, 16, 121–138. [Google Scholar] [CrossRef] [Scilit]
  25. Yang, H.; Xu, P.; Zhang, S.; Kim, H.; Shin, I. Construction of An Intelligent Analysis System for Crop Health Status Based on Drone Remote Sensing Data and CNN. IEEE Access 2025, 13, 31643–31657. [Google Scholar] [CrossRef] [Scilit]
  26. Feng, J.; Wang, D.; Yang, F.; Huang, J.; Wang, M.; Tao, M.; Chen, W. PODD: A dual-task detection for greenhouse extraction based on deep learning. Remote Sens. 2022, 14, 5064. [Google Scholar] [CrossRef] [Scilit]
  27. Wu, Y.; Yang, H.; Mao, Y. Detection of the pine wilt disease using a joint deep object detection model based on drone remote sensing data. Forests 2024, 15, 869. [Google Scholar] [CrossRef] [Scilit]
  28. Mishra, S.; Volety, D.R.; Bohra, N.; Alfarhood, S.; Safran, M. A smart and sustainable framework for millet crop monitoring equipped with disease detection using enhanced predictive intelligence. Alex. Eng. J. 2023, 83, 298–306. [Google Scholar] [CrossRef] [Scilit]
  29. Hassan, S.I.; Alam, M.M.; Illahi, U.; Suud, M.M. A new deep learning-based technique for rice pest detection using remote sensing. PeerJ Comput. Sci. 2023, 9, e1167. [Google Scholar] [CrossRef] [Scilit]
  30. Longchamps, L.; Tisseyre, B.; Taylor, J.; Sagoo, L.; Momin, A.; Fountas, S.; Manfrini, L.; Ampatzidis, Y.; Schueller, J.K.; Khosla, R. Yield sensing technologies for perennial and annual horticultural crops: A review. Precis. Agric. 2022, 23, 2407–2448. [Google Scholar] [CrossRef] [Scilit]
  31. Choudhury, B.U.; Narzari, R.; Zafar, M.; Singh, N.; Mishra, V.K.; Prabhakar, M. Spectral library of crops and discrimination of major vegetables grown in the eastern Himalayan ecosystem: A proximal hyperspectral remote sensing approach. Ecol. Inform. 2023, 77, 102263. [Google Scholar] [CrossRef] [Scilit]
  32. Bagdatli, M.C.; Elsheikh, W. Estimation of Horticulture Area Expansion and Crop Yield Quantification by Using Remotely Sensed Data and Geographic Information Systems. In Novel Approach to Sustainable Temperate Horticulture; CRC Press: Boca Raton, FL, USA, 2024; pp. 1–23. [Google Scholar]
  33. Xu, W.; Li, Z.; Lin, H.; Shao, G.; Zhao, F.; Wang, H.; Cheng, J.; Lei, L.; Chen, R.; Han, S.; et al. Mapping Fruit-Tree Plantation Using Sentinel-1/2 Time Series Images with Multi-Index Entropy Weighting Dynamic Time Warping Method. Remote Sens. 2024, 16, 3390. [Google Scholar] [CrossRef] [Scilit]
  34. Payen, F.T.; Evans, D.L.; Falagán, N.; Hardman, C.A.; Kourmpetli, S.; Liu, L.; Marshall, R.; Mead, B.R.; Davies, J.A. How much food can we grow in urban areas? Food production and crop yields of urban agriculture: A meta-analysis. Earth Future 2022, 10, e2022EF002748. [Google Scholar] [CrossRef] [Scilit]
  35. Zhou, X.X.; Li, Y.Y.; Luo, Y.K.; Sun, Y.W.; Su, Y.J.; Tan, C.W.; Liu, Y.J. Research on remote sensing classification of fruit trees based on Sentinel-2 multi-temporal imageries. Sci. Rep. 2022, 12, 11549. [Google Scholar] [CrossRef] [Scilit]
  36. Liu, G. Understanding cotton cultivation dynamics in Aksu Oases (NW China) by reconstructing change trajectories using multi-temporal Landsat and Sentinel-2 data. Geocarto Int. 2022, 37, 4406–4424. [Google Scholar] [CrossRef] [Scilit]
  37. Chen, R.; Xiong, S.; Zhang, N.; Fan, Z.; Qi, N.; Fan, Y.; Feng, H.; Ma, X.; Yang, H.; Yang, G.; et al. Fine-scale classification of horticultural crops using Sentinel-2 time-series images in Linyi country, China. Comput. Electron. Agric. 2025, 236, 110425. [Google Scholar] [CrossRef] [Scilit]
  38. Gong, L.; Yu, M.; Cutsuridis, V.; Kollias, S.; Pearson, S. A Novel Model Fusion Approach for Greenhouse Crop Yield Prediction. Horticulturae 2022, 9, 5. [Google Scholar] [CrossRef] [Scilit]
  39. Lu, H.L.; Chang, Y.H.; Chuang, T.F.; Lin, Y.X.; Wu, Y.Z.; Lin, J.Z. AIoT-Based Smart Greywater Reuse for Urban Irrigation: Energy Saving, Carbon Reduction, and Biodiversity Enhancement. Smart Agric. Technol. 2025, 12, 101288. [Google Scholar] [CrossRef] [Scilit]
  40. de Araujo Zanella, A.R.; da Silva, E.; Albini, L.C.P. CEIFA: A multi-level anomaly detector for smart farming. Comput. Electron. Agric. 2022, 202, 107279. [Google Scholar] [CrossRef] [Scilit]
  41. Kumar, R.V.; Manjula, M.; Veerandeswari, J.; Indumathy, M.; Raghul, B. An Anomaly Detection Algorithm for Estimating Interannual Variation in Crop Yields. In Proceedings of the 2024 IEEE International Conference on Computing, Power and Communication Technologies (IC2PCT), Greater Noida, India, 9–10 February 2024; IEEE: New York, NY, USA, 2024; Volume 5, pp. 1843–1848. [Google Scholar]
  42. Mendoza-Bernal, J.; González-Vidal, A.; Skarmeta, A.F. A convolutional neural network approach for image-based anomaly detection in smart agriculture. Expert Syst. Appl. 2024, 247, 123210. [Google Scholar] [CrossRef] [Scilit]
  43. Choe, H.O.; Lee, M.H. Artificial Intelligence-Based Anomaly Detection Technology for Equipment Condition Monitoring in Smart Farms. Appl. Sci. 2025, 15, 12843. [Google Scholar] [CrossRef] [Scilit]
  44. Liu, C.; Du, S.; Wei, A.; Cheng, Z.; Meng, H.; Han, Y. Hybrid prediction in horticulture crop breeding: Progress and challenges. Plants 2024, 13, 2790. [Google Scholar] [CrossRef] [Scilit]
  45. Aguilera, S.G.; Karbassi Yazdi, A. Anomaly Detection and Regional Clustering in Chilean Wholesale Fruit and Vegetable Prices with Machine Learning. Agriculture 2025, 15, 2362. [Google Scholar] [CrossRef] [Scilit]
  46. Shu, J.; Quan, Y.; Yang, D. An LSTM–AE–Bayes embedded gateway for real-time anomaly detection in agricultural wireless sensor networks. Smart Agric. Technol. 2025, 11, 100944. [Google Scholar] [CrossRef] [Scilit]
  47. Shikhar, S.; Sobti, A. Label-free Anomaly Detection in Aerial Agricultural Images with Masked Image Modeling. In Proceedings of the IEEE/CVF Conference on Computer Vision and Pattern Recognition, Seattle, WA, USA, 17–21 June 2024; pp. 5440–5449. [Google Scholar]
  48. Mihrete, T.B.; Mihretu, F.B. Crop diversification for ensuring sustainable agriculture, risk management and food security. Glob. Chall. 2025, 9, 2400267. [Google Scholar] [CrossRef] [Scilit] [PubMed]
  49. Wu, M.; Liu, S.; Li, Z.; Ou, M.; Dai, S.; Dong, X.; Wang, X.; Jiang, L.; Jia, W. A review of intelligent orchard sprayer technologies: Perception, control, and system integration. Horticulturae 2025, 11, 668. [Google Scholar] [CrossRef] [Scilit]
  50. Poenaru, M.M.; Manta, L.F.; Gherțescu, C.; Manta, A.G. Shaping the Future of Horticulture: Innovative Technologies, Artificial Intelligence, and Robotic Automation Through a Bibliometric Lens. Horticulturae 2025, 11, 449. [Google Scholar] [CrossRef] [Scilit]
  51. Kendra, K.V.; Jau, A. Climate-Smart Dryland Horticulture: Mitigating Climate Change Impact through Remote Sensing and GIS. Adv. Bioresearch 2024, 15, 1–14. [Google Scholar]
  52. Sami, A.; Saeed, M.; Shafiq, M.; Abbas, S.M.; Anum, A.; Haider, H.; Bhatti, M.H.T.; Raza, M.A.; Khan, N.; Shahid, N.A. Role of horticulture in disaster risk management. In Disaster Risk Reduction in Agriculture; Springer: Singapore, 2023; pp. 393–406. [Google Scholar]
  53. Sun, Y.; Chen, L.; Chen, R.; Pan, Y.; Liu, C. Exploring the preferences of college students for horticultural therapy activities based on a new classification framework. Sci. Rep. 2025, 15, 32121. [Google Scholar] [CrossRef] [Scilit]
  54. Singh, R.; Singh, R.; Gehlot, A.; Akram, S.V.; Priyadarshi, N.; Twala, B. Horticulture 4.0: Adoption of industry 4.0 technologies in horticulture for meeting sustainable farming. Appl. Sci. 2022, 12, 12557. [Google Scholar] [CrossRef] [Scilit]
  55. Unnikrishnan, P.; Ponnambalam, K.; Karray, F. Influence of regional temperature anomalies on strawberry yield: A study using multivariate Copula Analysis. Sustainability 2024, 16, 3523. [Google Scholar] [CrossRef] [Scilit]
  56. Qiu, R.; Li, X.; Han, G.; Xiao, J.; Ma, X.; Gong, W. Monitoring drought impacts on crop productivity of the US Midwest with solar-induced fluorescence: GOSIF outperforms GOME-2 SIF and MODIS NDVI, EVI, and NIRv. Agric. For. Meteorol. 2022, 323, 109038. [Google Scholar] [CrossRef] [Scilit]
  57. Valero-Carreras, D.; Alcaraz, J.; Landete, M. Comparing two SVM models through different metrics based on the confusion matrix. Comput. Oper. Res. 2023, 152, 106131. [Google Scholar] [CrossRef] [Scilit]
  58. Salman, H.A.; Kalakech, A.; Steiti, A. Random forest algorithm overview. Babylon. J. Mach. Learn. 2024, 2024, 69–79. [Google Scholar] [CrossRef] [Scilit]
  59. Li, P.; Pei, Y.; Li, J. A comprehensive survey on design and application of autoencoder in deep learning. Appl. Soft Comput. 2023, 138, 110176. [Google Scholar] [CrossRef] [Scilit]
  60. Xu, Y.; Hou, J.; Zhu, X.; Wang, C.; Shi, H.; Wang, J.; Li, Y.; Ren, P. Hyperspectral image super-resolution with ConvLSTM skip-connections. IEEE Trans. Geosci. Remote Sens. 2024, 62, 1–16. [Google Scholar]
  61. Deng, X.; Zhang, J.; Liu, R.; Liu, K. Classifying ASD based on time-series fMRI using spatial–temporal transformer. Comput. Biol. Med. 2022, 151, 106320. [Google Scholar] [CrossRef] [Scilit]
Figure 1. Illustration of the horticultural crop’s abnormal variations.
Horticulturae 12 00461 g001
Figure 2. Illustration of the crop growth state modeling branch.
Horticulturae 12 00461 g002
Figure 3. Illustration of the growth anomaly perception branch.
Horticulturae 12 00461 g003
Figure 4. Illustration of the horticultural safety risk joint discrimination module.
Horticulturae 12 00461 g004
Figure 5. Comparison among baseline models, reinforced baselines, and the proposed dual-branch framework.
Horticulturae 12 00461 g005
Figure 6. F1 performance distribution of the proposed method across different horticultural anomaly types.
Horticulturae 12 00461 g006
Figure 7. Ablation analysis of key modules on accuracy and F1 performance. The symbol ↑ indicates that larger values correspond to better model performance.
Horticulturae 12 00461 g007
Table 1. Statistics of multi-source remote sensing datasets for horticultural crops in Linhe District, Bayannur City.
Data TypeMain Crop TypesAcquisition PeriodQuantity
Multispectral satellite imageryTomato, pepper, apple, pear2019–20241260 scenes
UAV multispectral imageryTomato, pepper, apple, pear2021–2024480 flights
Public remote sensing dataTomato, cucumber, fruit trees2018–2023620 samples
Vegetation index time seriesAll crops2019–20243800 records
Crop growth anomaly samplesAll crops2019–2024620 instances
Agricultural safety risk samplesAll crops2019–2024310 instances
Table 2. Breakdown of sample counts per anomaly type across training, validation, and test sets.
Anomaly TypeTraining (70%)Validation (15%)Test (15%)Total
Climate Stress Anomalies1473132210
Management Errors1052223150
Compound Anomalies56121280
Disease-Induced Anomalies841818120
Early Weak Anomalies429960
Total Anomalies4349294620
Normal Samples11202402401600
Table 3. Hyperparameter configurations for baseline models.
ModelKey Hyperparameters and Configurations
SVMKernel: RBF, C: 1.0, Gamma: scale, Input: Flattened multispectral features
Random ForestEstimators: 200, Max depth: 15, Criterion: Gini impurity
AutoencoderEncoder: 4 conv layers (64-128-256-512), Latent dim: 128, Learning rate: 1 × 10 4
ConvLSTMHidden layers: 3, Hidden units: 64, Kernel size: 3 × 3, Dropout: 0.2
Temporal TransformerLayers: 6, Attention heads: 8, Hidden dim: 512, MLP ratio: 4.0
Table 4. Dual detection performance for horticultural crop growth anomalies and safety risks (Mean ± Standard Deviation). The symbol ↑ indicates that larger values correspond to better model performance.
MethodAccuracy (↑)Precision (↑)Recall (↑)F1 (↑)AUC (↑)Parameters (M)GFLOPs (G)Time (ms/patch)
NDVI/EVI Threshold Rule0.781 ± 0.0150.742 ± 0.0180.703 ± 0.0210.722 ± 0.0190.812 ± 0.0140.000.000.12
SVM0.825 ± 0.0120.806 ± 0.0140.734 ± 0.0160.768 ± 0.0150.856 ± 0.0110.050.010.54
Random Forest0.846 ± 0.0100.821 ± 0.0110.766 ± 0.0130.793 ± 0.0120.879 ± 0.0090.120.030.88
Autoencoder AE0.832 ± 0.0130.784 ± 0.0150.803 ± 0.0170.793 ± 0.0160.887 ± 0.0124.851.152.45
ConvLSTM0.868 ± 0.0090.842 ± 0.0100.804 ± 0.0120.822 ± 0.0110.908 ± 0.00815.243.8212.36
ConvLSTM + R (Reinforced)0.882 ± 0.0090.861 ± 0.0110.819 ± 0.0130.839 ± 0.0120.915 ± 0.00815.823.9512.84
Temporal Transformer0.881 ± 0.0080.861 ± 0.0090.817 ± 0.0110.838 ± 0.0100.919 ± 0.00721.682.548.12
Temporal Transformer + R (Reinforced)0.895 ± 0.0080.882 ± 0.0100.834 ± 0.0120.857 ± 0.0110.931 ± 0.00722.452.728.65
Proposed Method0.914 ± 0.0070.903 ± 0.0080.862 ± 0.0090.882 ± 0.0080.948 ± 0.006102.3518.4215.48
Table 5. Performance breakdown by biological category: Vegetables (Veg) vs. Fruit Trees (Fruit). The symbol ↑ indicates that larger values correspond to better model performance.
MethodAccuracy (↑)F1-Score (↑)AUC (↑)
VegFruitVegFruitVegFruit
NDVI/EVI Threshold Rule0.792 ± 0.0120.771 ± 0.0160.731 ± 0.0150.712 ± 0.0180.821 ± 0.0110.803 ± 0.015
SVM0.836 ± 0.0100.814 ± 0.0130.779 ± 0.0120.757 ± 0.0160.864 ± 0.0090.848 ± 0.012
Random Forest0.857 ± 0.0080.835 ± 0.0110.804 ± 0.0090.782 ± 0.0140.887 ± 0.0070.871 ± 0.011
Autoencoder AE0.841 ± 0.0110.823 ± 0.0140.801 ± 0.0130.785 ± 0.0170.895 ± 0.0100.879 ± 0.013
ConvLSTM0.879 ± 0.0070.857 ± 0.0100.834 ± 0.0090.810 ± 0.0130.916 ± 0.0060.900 ± 0.009
Temporal Transformer0.892 ± 0.0060.870 ± 0.0090.849 ± 0.0080.827 ± 0.0110.927 ± 0.0050.911 ± 0.008
Proposed Method0.923 ± 0.0050.901 ± 0.0080.891 ± 0.0070.869 ± 0.0100.954 ± 0.0040.941 ± 0.007
Table 6. Performance breakdown by production scenario: Facility (Fac) vs. Open Field (Open). The symbol ↑ indicates that larger values correspond to better model performance.
MethodAccuracy (↑)F1-Score (↑)AUC (↑)
FacOpenFacOpenFacOpen
NDVI/EVI Threshold Rule0.801 ± 0.0130.762 ± 0.0170.744 ± 0.0160.701 ± 0.0190.832 ± 0.0120.792 ± 0.016
SVM0.842 ± 0.0110.808 ± 0.0140.788 ± 0.0130.748 ± 0.0170.871 ± 0.0100.841 ± 0.013
Random Forest0.863 ± 0.0090.829 ± 0.0120.812 ± 0.0100.774 ± 0.0150.894 ± 0.0080.864 ± 0.011
Autoencoder AE0.848 ± 0.0120.816 ± 0.0150.808 ± 0.0140.778 ± 0.0180.902 ± 0.0110.872 ± 0.014
ConvLSTM0.885 ± 0.0080.851 ± 0.0110.841 ± 0.0100.803 ± 0.0140.923 ± 0.0070.893 ± 0.010
Temporal Transformer0.898 ± 0.0070.864 ± 0.0100.856 ± 0.0090.820 ± 0.0120.934 ± 0.0060.904 ± 0.009
Proposed Method0.931 ± 0.0060.897 ± 0.0090.902 ± 0.0080.862 ± 0.0110.961 ± 0.0050.935 ± 0.008
Table 7. Performance breakdown by phenological stage: Early-Mid (E-M) vs. Late-Mature (L-M). The symbol ↑ indicates that larger values correspond to better model performance.
MethodAccuracy (↑)F1-Score (↑)AUC (↑)
E-ML-ME-ML-ME-ML-M
NDVI/EVI Threshold Rule0.775 ± 0.0160.787 ± 0.0140.715 ± 0.0200.729 ± 0.0180.805 ± 0.0150.819 ± 0.013
SVM0.819 ± 0.0130.831 ± 0.0110.761 ± 0.0160.775 ± 0.0140.849 ± 0.0120.863 ± 0.010
Random Forest0.840 ± 0.0110.852 ± 0.0090.786 ± 0.0130.800 ± 0.0110.872 ± 0.0100.886 ± 0.008
Autoencoder AE0.826 ± 0.0140.838 ± 0.0120.786 ± 0.0170.800 ± 0.0150.880 ± 0.0130.894 ± 0.011
ConvLSTM0.862 ± 0.0100.874 ± 0.0080.815 ± 0.0120.829 ± 0.0100.901 ± 0.0090.915 ± 0.007
Temporal Transformer0.875 ± 0.0090.887 ± 0.0070.831 ± 0.0110.845 ± 0.0090.912 ± 0.0080.926 ± 0.006
Proposed Method0.908 ± 0.0080.920 ± 0.0060.875 ± 0.0090.889 ± 0.0070.942 ± 0.0070.954 ± 0.005
Table 8. Performance of the proposed method under different anomaly types. The symbol ↑ indicates that larger values correspond to better model performance.
Anomaly TypeAccuracy (↑)Precision (↑)Recall (↑)F1 (↑)AUC (↑)
Climate Stress Anomalies
(Drought/Heat/Frost)0.8890.8720.8260.8480.931
Management Errors
(Irrigation/Fertilization/Density)
0.8610.8460.8010.8230.901
Compound Anomalies
(Climate + Management)
0.8290.8120.7760.7930.889
Disease-Induced Anomalies
(Lesion Spread/Early Infection)
0.8730.8580.8140.8350.918
Early Weak Anomalies
(Mild Stress/Phase Disturbance)
0.8420.8290.7880.8080.902
Table 9. Contribution of key components to overall performance. The symbol ↑ indicates that larger values correspond to better model performance.
SettingAccuracy (↑)Precision (↑)Recall (↑)F1 (↑)AUC (↑)
Full Model (Growth Branch + Anomaly
Branch + Risk Joint Discrimination)
0.9140.9030.8620.8820.948
Remove Trend-Weighted Aggregation
(Mean Aggregation Only)
0.9010.8880.8440.8660.936
Remove Texture Attention (Without s att )0.8960.8810.8390.8590.932
Remove LoRA Adaptation in Anomaly Branch0.8890.8720.8310.8510.925
Remove Energy Complementarity
(Single-Path Scoring)
0.8930.8780.8360.8560.928
Remove Gated Fusion (Without γ Modulation)0.8870.8640.8350.8490.923
Remove Noise Scheduling in Risk Module0.8920.8770.8330.8540.927
Remove Shared Attention Joint
Modeling (MLP Only)
0.8830.8580.8290.8430.919
Disclaimer/Publisher’s Note: The statements, opinions and data contained in all publications are solely those of the individual author(s) and contributor(s) and not of MDPI and/or the editor(s). MDPI and/or the editor(s) disclaim responsibility for any injury to people or property resulting from any ideas, methods, instructions or products referred to in the content.