1. Introduction
Cynara cardunculus var.
altilis DC., commonly known as cardoon, belongs to the Asteraceae family and is native to the Mediterranean basin. The species includes three taxa: (i) the domesticated cardoon (
Cynara cardunculus var.
altilis DC.), (ii) wild cardoon (
Cynara cardunculus var.
sylvestris L.), and (iii) globe artichoke (
Cynara cardunculus var.
scolymus L.) [
1,
2,
3,
4]. Phytogeographic and morphological studies have shown that these taxa belong to a single species and should be classified as subspecies [
2].
Cynara cardunculus var.
altilis DC. is a diploid (2n = 34), predominantly cross-pollinated species well adapted to warm weather and low summer precipitation, which induces dormancy, and mild winters with higher rainfall, which promote vegetative regeneration [
1,
5,
6]. Its distribution extends from Southern Europe to regions such as California, South America, Australia, and China [
2], demonstrating high adaptability to semiarid bioclimates, making it suitable for cultivation as a perennial crop on marginal lands with limited water availability [
1].
Cardoon is a traditional crop closely linked to the Mediterranean diet and has been used since ancient times in dishes like soups and salads. Its flower heads are commonly used in the production of Protected Designation of Origin (PDO) cheeses due to their clotting properties [
2,
7,
8]. The plant is also valued for biomass production [
2,
7,
8,
9] and is widely consumed as a medicinal herb, known for its health-promoting properties. Scientific studies have highlighted its antioxidant, antimicrobial, anti-inflammatory, anti-HIV, bile-stimulating, liver-protective, and cholesterol-lowering effects [
4,
7,
10,
11,
12].
In recent years, cardoon has gained commercial interest due to its high levels of bioactive compounds and its wide-ranging industrial applications. Its high yield, stable agronomic performance, adaptability to climate change, and resistance to environmental stresses further enhance its appeal [
2,
7,
8]. The bioactive profile of cardoon includes phenolic acids (such as 3-O-caffeoylquinic acid, 4-O-caffeoylquinic acid, 5-O-caffeoylquinic acid, 1,5-di-O-caffeoylquinic acid, and 3,5-di-O-caffeoylquinic acid), flavonoids (notably luteolin-7-O-glucuronide and luteolin-7-O-glucoside), as well as anthocyanins (e.g., cyanidin), inulin, dietary fibers, and essential minerals [
1,
2,
3,
4,
5,
6,
7].
Improving cardoon biomass quality, particularly its phenolic compound content, is a crucial challenge for enhancing the value of this crop in industrial and commercial contexts. In this regard, soilless cultivation techniques such as the floating system have emerged as effective tools for influencing both plant biomass production and quality [
13]. The floating system enables strict control of the root environment nutrient availability, ionic composition, and oxygenation, allowing precise regulation of plant nutrition and, consequently, modulation of secondary metabolism and enhancement of phenolic compound accumulation.
Moreover, this system supports standardized cultivation, accelerated growth, and high-quality yields, making it a promising approach for improving the functional quality of cardoon biomass [
13]. Previous studies have clearly demonstrated the potential of the floating system as an experimental platform to steer cardoon metabolism and quality. In particular, Borgognone et al. [
13] showed that different salinity sources markedly affected yield, mineral composition, and the profile of phenolic acids and flavonoids in cardoon leaves grown in floating conditions. Furthermore, Borgognone et al. [
14] reported that targeted manipulation of the nutrient solution (NO
3−:Cl
− ratio and nitrate deprivation) significantly modified biomass accumulation, mineral profile, and phenolic composition, highlighting the strong responsiveness of cardoon secondary metabolism to controlled root-zone conditions. These findings support the use of the floating system not only as a cultivation technique but also as a powerful tool for regulating plant metabolism and functional quality.
Alongside soilless cultivation, biostimulants offer a sustainable and effective strategy to enhance plant growth and biomass quality [
15,
16]. According to European Regulation 2019/1009, plant biostimulants are defined as products that stimulate plant nutritional processes independently of their nutrient content, aiming to improve one or more plant or rhizosphere traits, such as nutrient use efficiency, tolerance to abiotic stress, quality characteristics, or soil nutrient availability. Biostimulants include beneficial microorganisms and compounds such as humic substances, protein hydrolysates, amino acid-based products, seaweed, plant extracts, and silicon [
17].
Several studies have shown that the use of biostimulants can significantly enhance crop yield, as demonstrated in leafy species such as sage and spinach [
18,
19]. Beyond growth promotion, biostimulants are increasingly recognized for their ability to modulate secondary metabolism and improve crop quality. Increased accumulation of phenolic compounds, flavonoids, and antioxidant capacity has been reported in artichoke, yarrow, tomato, lettuce, and olive treated with different biostimulant formulations [
20,
21,
22,
23,
24]. These effects are often associated with the activation of phenylpropanoid pathways, enhanced nutrient use efficiency, and improved plant physiological status.
In the present study, two types of biostimulants were used: a protein hydrolysate (PH) derived from legumes and a seaweed extract (SW). Protein hydrolysates, obtained through enzymatic hydrolysis of plant proteins, provide free amino acids and signaling peptides that act as metabolic precursors and regulatory molecules, enhancing nitrogen assimilation, photosynthetic activity, and the biosynthesis of secondary metabolites, including phenolic compounds [
15,
17,
19]. Seaweed extracts are known to contain hormone-like substances (auxins, cytokinins, and brassinosteroids), polysaccharides, and osmoprotectants, which can stimulate primary and secondary metabolism, improve stress tolerance, and promote the accumulation of health-related compounds such as phenolics, flavonoids, and antioxidants [
16,
18].
Based on this evidence, we hypothesized that the application of biostimulants can influence both primary and secondary metabolism of cardoon through distinct mechanisms, and that their effects are modulated by harvest timing, ultimately enhancing biomass quality and bioactive compound accumulation in a floating system. However, there is still a lack of studies focusing on the use of biostimulants in cardoon cultivation, particularly in an innovative soilless system such as the floating system. Therefore, the aim of this study is to evaluate the effectiveness of PH and SW, applied as foliar sprays, on Cynara cardunculus var. altilis DC grown in a floating system, focusing on their effects on biomass production, physiological traits, mineral profile, and especially on phenolic compounds and antioxidant-related quality parameters across four successive harvests.
2. Materials and Methods
2.1. Growth Conditions, Treatments and Leaf Biomass Determination
The experiment was conducted from March 2024 for 19 weeks inside the greenhouses of the “Nello Lupori” Experimental Farm of Tuscia University, central Italy (latitude 42°25′ N, longitude 12°08′ E, altitude 310 m). The daily temperature inside the greenhouse was maintained between 12 and 30 °C via forced ventilation, and plants were grown under natural light. For this experiment,
Cynara cardunculus var.
altilis cv. “Bianco Avorio” (La Semiorto Sementi, Sarno, Italy) was employed. The cultivar was selected based on previous studies highlighting its high productivity and adaptability to floating system cultivation [
14].
The cultivation setup consisted of 12 plastic tanks, each filled with 60 L of nutrient solution, above which a tray containing vermiculite-filled cells was placed. Seedlings were sown at a density of 135 plants per m2. The nutrient solution was prepared by dissolving the following fertilizers in ultrapure water characterized by negligible ion content: Ca(NO3)2 (722 mg L−1), KH2PO4 (136 mg L−1), K2SO4 (230 mg L−1), NH4NO3 (83 mg L−1), MgSO4 (250 mg L−1), KNO3 (107 mg L−1).
Micronutrients were supplied via a commercial fertilizer (Mikrom; Cifo S.p.A., Bologna, Italy) at 24 mg L−1, containing B (5 g kg−1), Cu (5 g kg−1), Fe (40 g kg−1), Mn (40 g kg−1), Mo (2 g kg−1), Zn (10 g kg−1), Mg (18 g kg−1), and S (24 g kg−1). During the growing cycle, the average electrical conductivity and pH of the nutrient solution were 2.26 ± 0.25 mS cm−1 and 5.75, respectively.
Oxygenation was continuously monitored and maintained at an average dissolved O2 concentration of 5.34 mg L−1 using an oxygenation system installed throughout the setup to prevent root hypoxia during the experiment. Dissolved oxygen levels in the nutrient solution were measured using the HI-9143 Oximeter (Hannah Instrument Italia S.r.l., Ronchi di Villafranca Padovana, Italy). Tanks and trays were covered with black plastic sheets to prevent algal proliferation.
To enhance plant growth (80 plants/tanks), two biostimulants were applied weekly as foliar sprays, after dilution in water: a protein hydrolysate from legumes (PH), Trainer®, (Hello Nature, Rivoli Veronese, Italy), obtained through enzymatic hydrolysis of legume seeds and containing 310 g kg−1 of free amino acids and peptides, applied at a concentration of 3 mL L−1; and an algae-based solution (SW), Toggle® (Acadian Plant Health, Dartmouth, NS, Canada), refined from North Atlantic Ascophyllum nodosum sources containing 20 g kg−1 of organic carbon and 7 g kg−1 of mannitol applied at a concentration of 1.5 g L−1. The application rates were selected based on the manufacturers’ recommended agronomic dosages, reflecting practical use conditions rather than dose–response comparisons. Therefore, the aim of the study was to evaluate the functional effects of two commercially relevant biostimulant categories under realistic application scenarios. Untreated plants served as the control (CT). A total of 12 experimental units (3 treatments × 4 replicates) were allocated across the tanks.
When the leaves reached approximately 15–20 cm in length, they were harvested by cutting 7 cm above the base, ensuring the apical meristem remained intact. A total of four samplings were performed, and the leaves were weighed fresh immediately after harvest. The experiment was arranged in a completely randomized design with tanks as the experimental units. Although aerial biomass was destructively harvested at each sampling time, regrowth occurred from the same root systems, which remained intact throughout the experimental period. Therefore, measurements collected over time were temporally related. In the statistical analysis, biostimulant treatment was treated as a between-subject factor, while sampling time was treated as a within-subject (repeated-measures) factor.
The collected material was oven-dried at 70 °C until constant weight for dry weight determination and mineral analysis, whereas samples intended for phenolic compound analysis were dried at 45 °C. After drying, the leaves were ground into a fine powder and stored in the dark until further processing. The timing of the treatments and samplings is summarized in the timeline shown in
Figure 1.
2.2. Non-Invasive Assessment of Plant Physiological Parameters
Throughout the experiment, plant physiological status was monitored periodically according to the timeline (
Figure 1) using non-destructive leaf analyses performed with a Multi Pigment Meter-100 (MPM-100, ADC BioScientific Ltd., Hoddesdon, UK). It allows rapid, non-invasive measurement of key physiological indicators, such as chlorophyll, flavonols, and Nitrogen Flavonol Index (NFI).
Measurements were not aimed at assessing age-dependent responses of individual leaves but at monitoring overall plant physiological status. For this reason, pigment analyses were not performed on leaves standardized by age, but on representative subsamples obtained from the total aboveground biomass collected for each replicate at harvest.
All plant material was harvested simultaneously and processed using the same protocol across treatments; therefore, pigment data represent an integrated whole-plant response rather than age-dependent effects at the single-leaf level.
2.3. Mineral and Organic Acids Determination
Nitrate, ammonium, and total Kjeldahl nitrogen were determined in 0.5 g aliquots of dried leaf tissue from each of the four biomass samplings. Nitrate was determined according to Vendrell and Zupancic (1990) [
25] using the 5% salicylic acid method. Briefly, nitrates were extracted from dried plant tissues with distilled water [
25]. After mixing and centrifugation at room temperature, absorbance was measured spectrophotometrically at 410 nm.
Total Kjeldahl nitrogen (TKN), including organic nitrogen and ammonium, was determined by the Kjeldahl method [
25]. Dried and ground samples were digested with concentrated sulfuric acid (96%) in the presence of a catalyst to convert organic nitrogen into ammonium. After digestion, the solution was made alkaline, and the released ammonia (NH
3) was distilled, trapped in a boric acid solution, and quantified by titration with 0.1 N HCl.
Ammonium (NH
4+–N) was determined separately following the procedure described by Borgognone et al. (2013) [
26]. Leaf samples were extracted in 6% (
w/
v) trichloroacetic acid (TCA) and centrifuged, and the NH
4+ concentration in the supernatant was measured colorimetrically using the phenol–hypochlorite method [
26].
Organic nitrogen (Norg) was calculated as the difference between total Kjeldahl nitrogen and ammonium nitrogen. The NO3−/NH4+ and Norg/TKN ratios were calculated on a dry weight basis.
For the determination of mineral composition and organic acids in cardoon leaves, the analytical procedure was carried out according to the protocol described by Rouphael et al. [
27], with slight modifications. Briefly, 250 mg of dried leaf material were suspended in 50 mL of ultrapure water (Milli-Q, Merck Millipore, Darmstadt, Germany), subjected to three freeze–thaw cycles in liquid nitrogen, and then centrifuged for 10 min at 6000 rpm (R-10 M, Remi Elektrotechnik Limited, Mumbai, India). The resulting supernatant was filtered through a 0.20 μm Whatman membrane filter (Whatman International Ltd., Maidstone, UK) and analyzed by ion exchange chromatography. The concentrations of anions, cations, and organic acids were expressed on a dry weight basis (g kg
−1 DW).
2.4. Preparation of Hydroalcoholic Leaf Extracts
Dried and finely ground leaves of cardoon from the four harvests were used to prepare extracts, following conditions consistent with those applied for phenolic analysis. The extraction was carried out using a hydroalcoholic solution (ethanol/acidified distilled water = 70:30
v/
v, pH 3.2 adjusted with formic acid), based on a previously validated protocol with slight modifications [
28].
For each sample, 1 g of plant material was extracted in 10 mL of solvent under continuous magnetic stirring at room temperature for 24 h. The mixture was centrifuged at 9000 rpm for 10 min, and the supernatant was collected. The residue was re-extracted with 10 mL of absolute ethanol, then centrifuged again. Supernatants were combined and concentrated using a rotary evaporator.
The concentrated extracts were frozen for 24 h and then freeze-dried under vacuum to obtain dry powder extracts. Extracts were weighed and stored at 4 °C until analysis. Extractions were performed separately for the experimental groups, including control plants (CT) and those treated with biostimulants such as the algae-based solution (SW) and legume protein hydrolysate (PH), following the same protocol.
Each extraction was carried out in triplicate for each sample to ensure reproducibility and accuracy of the results.
2.5. Total Phenolics Content Determination
The total phenolic content (TPC) of the extracts was determined using the colorimetric Folin–Ciocalteu method. To perform this assay, the method previously reported by Pannucci et al. (2022) [
28] was used. Briefly, 100 µL of the extract was added to 200 µL of Folin–Ciocalteu reagent and 2 mL of distilled water. After 3 min at 25 °C, 1 mL of an aqueous sodium carbonate solution (Na
2CO
3:H
2O 20:80
w/
v) was added.
The mixture was then left to react in the dark for 1 h. The absorbance was measured at 765 nm using a UV-Vis spectrophotometer. Quantification was performed by reference to a calibration curve prepared from standard solutions of gallic acid. The analysis was performed in triplicate. The results are expressed as milligrams of gallic acid equivalent per gram of dry extract (mg GAE g−1 DE).
2.6. Antioxidant Activity Determination
The antioxidant activity of leaf extracts was evaluated using the DPPH (2,2-diphenyl-1-picrylhydrazyl) radical scavenging assay, a widely used colorimetric method for assessing the free radical neutralizing capacity of plant-derived compounds. To perform this assay, the method previously reported by Pannucci et al. (2022) [
28] was used.
Briefly, 500 µL of a DPPH solution (126 µM in methanol) was added to 500 µL of each extract at different concentrations (200–600 µg/mL in methanol). The mixture was incubated in the dark at room temperature for 1 h, after which the absorbance was measured at 517 nm using a UV-Vis spectrophotometer (Shimadzu UV-2600, Kyoto, Japan). Methanol was used as a blank.
The analyses were performed in triplicate. The antioxidant activity was calculated by plotting the percentage of DPPH radical inhibition against the extract concentration and expressed as the amount of extract required to reduce the DPPH by 50% (IC50).
2.7. Statistical Analysis
Statistical analyses were performed using RStudio (version 2023.13.0+386, Posit Software, PBC, Boston, MA, USA). A repeated-measures ANOVA was conducted using the afex package (aov_ez function), with biostimulant treatment as the between-subject factor and sampling time as the within-subject factor, specifying the experimental unit identifier to account for repeated observations. Type III sums of squares were applied. Effect sizes were calculated as partial eta squared (partial η2). When significant effects were detected, Tukey’s post hoc test was applied (p ≤ 0.05) using estimated marginal means (emmeans package) to compare treatment means. Sphericity was evaluated within the repeated-measures framework, and corrections were considered when required as provided by the model output.
A principal component analysis (PCA) was performed on standardized variables (z-score) using the prcomp function in R (version 4.4.2; R Foundation for Statistical Computing, Vienna, Austria). The biplot of PC1 and PC2 was generated with ggplot2, including variable loadings and 95% confidence ellipses for each treatment group.
Exact p-values are reported where appropriate, while threshold notation (e.g., p < 0.001) is retained in tables for clarity and readability.
Due to the experimental structure, the residual degrees of freedom were relatively limited (df = 9). While sufficient for detecting treatment effects, future studies with larger experimental datasets may further strengthen the statistical robustness of the findings.
3. Results
3.1. Effect of Biostimulant Treatments and Harvest Timing on Cardoon Biomass Yield
Fresh and dry biomass production was significantly influenced by biostimulant treatment, with sampling time modulating the magnitude of the treatment effects, as confirmed by repeated-measures ANOVA (Table 2) and mean comparisons (
Table 1).
Biostimulant application increased fresh weight (FW) compared with the control, although no significant differences among treatments were observed at the I harvest. From the II harvest onward, both protein hydrolysate (PH) and seaweed extract (SW) resulted in significantly higher FW values than the control. Maximum FW was recorded in PH- and SW-treated plants at the III harvest, whereas control plants consistently showed lower FW values at subsequent harvests. Intermediate FW values were observed in the remaining treatment combinations.
A similar pattern was observed for dry weight (DW) (
Table 1). No significant treatment effects were detected at the I harvest, while PH and SW significantly increased DW relative to the control from the II harvest onward. The highest DW values were recorded in PH- and SW-treated plants at the III harvest, as well as in SW-treated plants at the II harvest. Across all harvest times, DW accumulation was consistently lower in control plants compared with biostimulant-treated plants.
Dry matter content (% DM) was significantly affected by sampling time but was not influenced by biostimulant treatment or by the interaction between factors (
Table 2). The highest % DM values were observed at the II and IV harvests, whereas the lowest values occurred at the I harvest, indicating that biostimulant application primarily enhanced biomass accumulation without significantly altering dry matter allocation patterns.
Table 2.
Summary of repeated-measures ANOVA showing the effect of biostimulant treatment and harvest time on yield on dry weight basis.
Table 2.
Summary of repeated-measures ANOVA showing the effect of biostimulant treatment and harvest time on yield on dry weight basis.
| Source of Variance | df | f | p | Partial η2 |
|---|
| | Biomass (g FW m−2) |
| Treatment | 2 | 18.92 | <0.001 | 0.808 |
| Time | 3 | 10.68 | <0.01 | 0.616 |
| Treatment × Time | 6 | 6.52 | <0.01 | 0.662 |
| | Biomass (g DW m−2) |
| | df | f | p | Partial η2 |
| Treatment | 2 | 21.36 | <0.001 | 0.826 |
| Time | 3 | 34.21 | <0.001 | 0.837 |
| Treatment × Time | 6 | 9.34 | <0.001 | 0.737 |
| | Dry matter content (%) |
| | df | f | p | Partial η2 |
| Treatment | 2 | 0.77 | ns | 0.145 |
| Time | 3 | 18.75 | <0.001 | 0.738 |
| Treatment × Time | 6 | 0.19 | ns | 0.054 |
3.2. Non-Invasive Assessment of Plant Physiological Parameters
Chlorophyll content, flavonoid concentration, and Nitrogen Flavonol Index (NFI) were significantly affected by biostimulant treatment, with sampling time modulating the magnitude of treatment effects, as confirmed by repeated-measures ANOVA (
Table 3;
p;
Supplementary Table S1).
Biostimulant application significantly influenced chlorophyll content from the II harvest onward. Plants treated with protein hydrolysate (PH) and seaweed extract (SW) exhibited higher chlorophyll levels than control plants across subsequent harvests. PH-treated plants showed the highest chlorophyll values at the II and III harvests, whereas SW-treated plants reached maximum values at the II and IV harvests.
Flavonoid concentration was not affected by biostimulant treatment but varied significantly with sampling time. Flavonoid levels declined progressively during plant development, regardless of treatment.
Nitrogen Flavonol Index values were significantly enhanced by biostimulant application from the II harvest onward. PH-treated plants exhibited the highest NFI values at the III harvest, while SW-treated plants reached maximum values at the IV harvest. Overall, both biostimulant treatments resulted in higher NFI values compared with the control at later developmental stages.
3.3. Total Phenolic Content and Antioxidant Activity of Cardoon Extracts
Total phenolic content (TPC) and antioxidant activity, expressed as IC
50, were significantly affected by biostimulant treatment, with sampling time modulating the magnitude of treatment effects, as confirmed by repeated-measures ANOVA (
Table 4;
Supplementary Table S2).
Biostimulant application significantly influenced TPC at all harvest times. Plants treated with protein hydrolysate (PH) and seaweed extract (SW) showed higher TPC values than control plants at the I and II harvests. At the III harvest, PH-treated plants exhibited the highest TPC values, whereas SW-treated plants showed significantly lower TPC compared with the other treatments. At the IV harvest, PH maintained significantly higher TPC than both control and SW treatments.
Antioxidant activity also showed clear treatment-dependent differences across harvest times. PH-treated plants exhibited lower IC50 values than control and SW treatments at the I harvest. At the III harvest, control plants showed the lowest IC50 values, followed by PH, while SW exhibited significantly higher IC50 values. At the IV harvest, SW-treated plants showed the highest IC50 values, whereas control and PH treatments exhibited intermediate values.
3.4. Mineral and Organic Acids Content
Nitrogen fractions and derived indices were significantly affected by biostimulant treatment, with sampling time modulating the magnitude of treatment effects, as confirmed by repeated-measures ANOVA (
Table 5;
Supplementary Table S3).
Total Kjeldahl nitrogen (TKN) was significantly enhanced by biostimulant application from the II harvest onward. No differences among treatments were detected at the I harvest, whereas both protein hydrolysate (PH) and seaweed extract (SW) treatments resulted in higher TKN values than the control at subsequent harvests, with maximum values observed at the II and III harvests.
Nitrate (NO3−) concentration showed limited treatment-dependent variation, with significant differences detected only at specific harvest stages. In particular, SW-treated plants exhibited significantly higher NO3− levels at the IV harvest compared with the other treatments.
Ammonium (NH4+) concentration was consistently higher in SW-treated plants across harvest times, whereas control plants exhibited the lowest values. Consequently, the NO3−/NH4+ ratio was significantly influenced by biostimulant treatment from the II harvest onward, with control plants showing higher ratios than PH- and SW-treated plants at the II and III harvests.
These patterns suggest treatment-dependent differences in nitrogen form distribution, which may reflect distinct nutritional and metabolic strategies under biostimulant application. However, the mechanistic links between nitrogen fractions and downstream metabolic responses remain inferential and would require dedicated biochemical or molecular investigations for confirmation.
The mineral composition of cardoon leaves was significantly influenced by biostimulant treatment, with sampling time modulating the magnitude of treatment effects, as confirmed by repeated-measures ANOVA (
Supplementary Table S4). Mean values are reported in
Table 6.
Phosphorus concentration was significantly affected by biostimulant application from the II harvest onward. No differences among treatments were detected at the I harvest, whereas protein hydrolysate (PH) resulted in significantly higher P concentrations than the control at subsequent harvests, with maximum values observed at the III harvest. Seaweed extract (SW) showed intermediate P concentrations across harvest times.
Potassium concentration was generally higher in PH-treated plants across harvest times. SW-treated plants exhibited higher K concentrations at early harvest stages but lower values at the IV harvest than PH-treated plants.
Calcium concentration was consistently higher in PH-treated plants across harvest times, while SW showed intermediate values. Magnesium concentration was significantly higher in both PH and SW than in the control, particularly at the III harvest.
Sulfur concentration exhibited treatment-dependent differences across harvest times. SW-treated plants showed higher S concentrations at early harvest stages, whereas PH-treated plants exhibited higher S concentrations at the IV harvest.
Sodium concentration was significantly higher in PH- and SW-treated plants compared with the control at selected harvest times. Chloride concentration showed significant treatment-dependent differences mainly at later harvest stages.
The organic acid composition was significantly affected by biostimulant treatment, with sampling time modulating the magnitude of treatment effects, as confirmed by repeated-measures ANOVA (
Table 7;
Supplementary Table S5).
Malate concentration showed marked treatment-dependent differences across harvest times. Control plants exhibited a progressive increase in malate concentration, reaching the highest values at the III and IV harvests. In contrast, protein hydrolysate (PH)-treated plants maintained relatively low and stable malate levels throughout the experimental period. Seaweed extract (SW)-treated plants displayed intermediate malate concentrations, with higher values at the IV harvest than at earlier stages.
Oxalate concentration exhibited moderate treatment-dependent variation across harvest times. SW-treated plants generally showed higher oxalate concentrations at the I and IV harvests, whereas PH-treated and control plants showed comparable values across harvests.
Citrate concentration was significantly enhanced by biostimulant application from the II harvest onward. Both PH and SW treatments resulted in higher citrate concentrations than the control at subsequent harvests. PH-treated plants maintained elevated citrate levels at the III and IV harvests, whereas SW-treated plants reached maximum citrate concentration at the III harvest, followed by a decline at the IV harvest.
3.5. Principal Component Analysis (PCA)
To obtain an overview of yield- and quality-related traits of cardoon plants subjected to different treatments (Control, PH, and SW), a principal component analysis (PCA) was performed on all measured parameters. The first two principal components (PCs) explained 50.4% of the total variance, with PC1 and PC2 accounting for 30.4% and 20.0%, respectively (
Figure 2). The relative contribution of each principal component is reflected in the percentage of explained variance, providing an overview of the dataset’s multivariate structure. The main contributors to PC1 were growth-related traits and macronutrient accumulation, whereas PC2 was mainly associated with antioxidant and phenolic variables. Samples showed moderate separation by treatment. Control plants were mainly grouped on the negative side of PC1, while PH and SW treatments were distributed on the positive side, indicating a clear treatment-driven differentiation in the physiological response of cardoon. Along PC2, PH-treated plants were positioned in the upper quadrants, whereas SW-treated plants clustered in the lower ones, suggesting distinct adaptive strategies.
PC1 was positively correlated with growth-related parameters (fresh and dry biomass, % DM), photosynthetic pigments (chlorophyll), and macronutrients (Ca, Mg, P and N), and negatively associated with organic acids (malate) and nitrate concentration. PC2 was positively correlated with antioxidant and phenolic traits and negatively correlated with productivity and mineral-related variables.
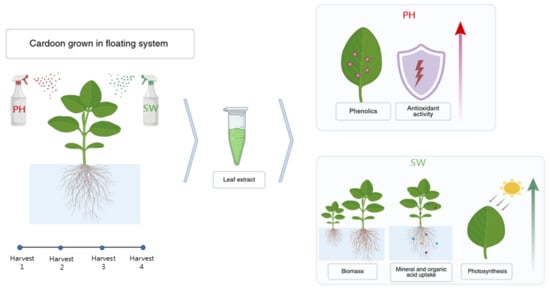
Overall, the PCA revealed that PH and SW treatments induced contrasting physiological and metabolic adjustments compared with the control. PH treatment was associated with increased accumulation of antioxidant compounds and phenolics, indicating a shift in secondary metabolism, whereas SW enhanced nutrient uptake and biomass accumulation, reflecting a different adaptive strategy. The PCA was used as an exploratory multivariate approach to visualize treatment-related patterns rather than to infer direct correlations among variables. Given the high number of variables included in the PCA, reporting full numerical loadings would reduce interpretability. Therefore, the analysis is presented using a biologically oriented qualitative interpretation of the main contributors.
4. Discussion
The present study demonstrates that biostimulants based on seaweed extract (SW) and protein hydrolysate (PH) induce distinct and complementary physiological and biochemical strategies in cardoon leaves cultivated in a floating system. Overall, plant responses were primarily driven by biostimulant type, while harvest timing modulated the magnitude of these responses without altering the underlying treatment-specific patterns.
Repeated-measures ANOVA revealed significant effects of biostimulant treatment, harvest timing, and their interaction on most evaluated traits, indicating that SW and PH differentially influenced plant growth and metabolism throughout the cultivation cycle. However, the consistent separation of treatments across harvests highlights that biostimulant application, rather than temporal progression alone, represented the main determinant of plant performance.
The biomass stimulation observed under both SW and PH treatments confirms the well-documented growth-promoting action of plant-derived biostimulants and highlights their capacity to modulate primary metabolism [
29,
30,
31,
32,
33]. The stronger growth response under SW suggests a predominant stimulation of vegetative development and carbon assimilation processes. This response can be mechanistically attributed to improved nutrient uptake and macronutrient availability, especially elements involved in osmotic regulation and stomatal functioning, which support leaf expansion and dry matter accumulation [
34]. In contrast, the comparatively moderate biomass increase under PH likely reflects a different resource allocation strategy, in which assimilated carbon and nitrogen are partially redirected toward secondary metabolism rather than maximal growth. The modulation of these responses across harvest stages further suggests that biostimulant efficacy is developmentally regulated, with intermediate phenological phases representing a window of higher metabolic plasticity.
Photosynthetic performance further supported the treatment-driven differentiation between SW and PH. The enhanced photosynthetic performance observed under both biostimulants indicates an overall improvement in nitrogen use efficiency and pigment biosynthesis, supporting a more efficient photosynthetic apparatus [
19]. PH-treated plants exhibited higher chlorophyll and NFI values at intermediate stages, consistent with enhanced nitrogen assimilation, which supports pigment biosynthesis and metabolic activity [
35]. In contrast, SW-treated plants maintained elevated pigment levels at later stages, likely due to sustained macronutrient availability, which enhanced enzymatic activity and osmotic balance, thereby supporting continued leaf expansion and growth [
36]. These results indicate that both treatments improved physiological efficiency, albeit through different nutritional and metabolic pathways.
The progressive increase in NFI across harvests suggests a sustained improvement in nitrogen status under biostimulant application, reflecting dynamic resource allocation patterns over developmental stages. This trend suggests a shift in resource allocation toward growth-related processes, particularly under SW, whereas PH maintained a stronger association with metabolic quality traits. The observed pigment dynamics are closely linked to biomass accumulation, as enhanced photosynthetic capacity provides the carbon skeletons and energy required to sustain both primary and secondary metabolic pathways [
37].
The biostimulant type exerted a marked influence on the phytochemical quality of cardoon leaves. PH consistently promoted higher total phenolic content (TPC) and antioxidant activity (IC
50) than both SW and the control treatments across harvest times. This response is consistent with the ability of protein hydrolysates to enhance nitrogen assimilation and provide amino acid precursors required for phenolic biosynthesis, thereby stimulating secondary metabolism [
15]. In contrast, SW-treated plants generally exhibited lower phenolic accumulation and antioxidant activity, suggesting preferential allocation of assimilated resources toward biomass production rather than secondary metabolite synthesis, highlighting a trade-off between growth and phytochemical accumulation [
29,
30]. Harvest timing modulated these effects, with phenolic accumulation peaking at intermediate developmental stages before declining at later stages.
Nitrogen fraction analysis provided additional insights into these contrasting physiological strategies. PH treatments enhanced total nitrogen content and promoted favorable nitrogen partitioning toward organic forms associated with amino acid and phenolic biosynthesis. Conversely, SW treatments were characterized by higher accumulation of inorganic nitrogen forms, such as nitrate and ammonium, likely supporting rapid cell expansion and biomass accumulation [
31]. These findings suggest a potential role of nitrogen metabolism in mediating the relationship between biostimulant application and secondary metabolism [
38,
39,
40]. However, the mechanistic links between nitrogen fractions and secondary metabolism remain speculative and would require further biochemical or molecular validation.
Mineral profiling further reinforced the functional differentiation between treatments. PH enhanced the accumulation of phosphorus, calcium, and magnesium, elements essential for enzymatic reactions, energy transfer, and metabolic biosynthesis. In contrast, SW preferentially influenced potassium, sodium, and sulfur accumulation during specific developmental stages, supporting osmotic regulation and stomatal activity and thereby explaining the greater vegetative growth observed under this treatment [
31,
36].
Organic acid profiling highlighted additional treatment-dependent metabolic adjustments. Both PH and SW stimulated citrate accumulation, indicating enhanced metabolic activity and increased carbon-skeleton availability for biosynthetic processes. Malate accumulation followed distinct patterns across treatments, with PH maintaining lower, more stable concentrations, suggesting tighter regulation of carbon metabolism and intracellular pH, whereas control plants exhibited a progressive increase over time [
41].
Integration of all measured traits through principal component analysis confirmed that biostimulant type represented a major driver of plant responses, while temporal dynamics also contributed substantially to the observed variability. SW-treated plants clustered with growth-related traits, pigment accumulation, and macronutrient uptake, reflecting a strategy oriented toward primary metabolism and vegetative development. In contrast, PH-treated plants showed increased phenolic accumulation and antioxidant capacity, indicating a preferential investment in secondary metabolism and physiological resilience [
15,
42,
43]. This interpretation aligns with recent work emphasizing the importance of detailed leaf quality profiling to understand plant responses to nutritional inputs across horticultural systems [
44]. Control plants were clearly separated from both biostimulant treatments, highlighting the strong modulatory role of PH and SW in directing plant metabolic trajectories.
Overall, these findings demonstrate that PH and SW exert their effects through interconnected but distinct physiological and biochemical pathways. Biostimulant application enhances nutrient uptake and assimilation, which in turn supports photosynthetic capacity and carbon availability, linking growth and metabolic quality. This observation is consistent with recent findings showing that modified organic inputs can influence nutrient availability and crop responses in controlled systems [
45]. While harvest timing modulates the expression of these responses, the type of biostimulant remains a major determinant, and temporal dynamics significantly modulate their magnitude and expression. These results highlight the potential of targeted biostimulant strategies to optimize the balance between primary and secondary metabolism in cardoon cultivated in soilless systems.
5. Conclusions
This study demonstrates that legume-derived protein hydrolysate (PH) and Ascophyllum nodosum seaweed extract (SW) represent effective yet functionally distinct biostimulant strategies for improving cardoon performance in a floating soilless system. Overall, plant responses were strongly influenced by biostimulant type, while harvest timing also played a significant role in shaping the expression of growth- and quality-related traits.
Both biostimulants significantly increased fresh and dry biomass compared with untreated plants. SW predominantly promoted vegetative growth and mineral accumulation, reflecting a physiological strategy oriented toward primary metabolism and biomass production. In contrast, PH more strongly stimulated nutraceutical quality by enhancing phenolic concentration and antioxidant activity, indicating preferential activation of secondary metabolic pathways.
Harvest timing significantly influenced the magnitude of these responses, interacting with treatment-specific physiological patterns. Intermediate developmental stages allowed the expression of the maximum biostimulant effect on both productivity and phytochemical traits, whereas later stages were characterized by a general decline in metabolic efficiency and functional quality.
From an applied perspective, the combining floating system cultivation with targeted biostimulant application offers a promising approach for sustainable, precision-oriented cardoon production. The choice of biostimulant can be strategically used to direct plant metabolism toward either biomass yield or functional quality, depending on production objectives, with harvest timing acting as a key modulatory factor influencing response dynamics.
Future research should focus on elucidating the molecular and biochemical mechanisms underlying the distinct modes of action of PH and SW and on validating these findings under field or commercial cultivation conditions. Such studies will be essential for optimizing application protocols and assessing the agronomic feasibility and economic sustainability of biostimulant-based strategies in cardoon production. Although the results provide clear evidence of treatment-dependent responses, future studies including larger experimental datasets, dose–response evaluations, and multi-season validations would be valuable for further validating and generalizing these findings.