Article

Selection of High-Yielding Genotypes of Coffea canephora at Transitional Altitude: Adaptability and Stability and Impacts of Water Management

by
Tafarel Victor Colodetti
1,*,
Wagner Nunes Rodrigues
1,
João Felipe de Brites Senra
1,
Marcelo Curitiba Espindula
2,3,
José Francisco Teixeira do Amaral
4,
José Domingos Cochicho Ramalho
5,6 and
Marcelo Antonio Tomaz
7
1
Centro de Pesquisa, Desenvolvimento e Inovação Sul, Instituto Capixaba de Pesquisa, Assistência Técnica e Extensão Rural (INCAPER), Cachoeiro de Itapemirim 29323-000, ES, Brazil
2
Empresa Brasileira de Pesquisa Agropecuária (EMBRAPA), Brasília 70770-901, DF, Brazil
3
Centro de Pesquisa, Desenvolvimento e Inovação Norte, Instituto Capixaba de Pesquisa, Assistência Técnica e Extensão Rural (INCAPER), Linhares 29915-140, ES, Brazil
4
Centro de Ciências Agrárias e Engenharias, Departamento de Engenharia Agrícola, Universidade Federal do Espirito Santo, Alegre 29500-000, ES, Brazil
5
Forest Research Center, Associate Laboratory TERRA, School of Agriculture, University of Lisbon (ISA/ULisboa), Quinta do Marquês, Av. da República, 2784-505 Oeiras, Portugal
6
GeoBioSciences, GeoTechnologies and GeoEngineering Unit (GeoBiotec), NOVA School of Sciences and Technology (NOVA-SST), Monte de Caparica, 2829-516 Caparica, Portugal
7
Centro de Ciências Agrárias e Engenharias, Departamento de Agronomia, Universidade Federal do Espirito Santo, Alegre 29500-000, ES, Brazil
*
Author to whom correspondence should be addressed.
Horticulturae 2026, 12(2), 207; https://doi.org/10.3390/horticulturae12020207
Submission received: 30 December 2025 / Revised: 3 February 2026 / Accepted: 5 February 2026 / Published: 7 February 2026

Abstract

Expanding Coffea canephora cultivation to transitional altitudes offers a promising strategy to sustain coffee production under climate change. This study evaluated 27 genotypes cultivated under two water management regimes (fully and minimally irrigated) at 650 m altitude in Espírito Santo, Brazil, over eight harvests (2018–2025). A split-plot design was analyzed using a three-way mixed model (REML/BLUP) to estimate genetic parameters and predicted genotypic values. Adaptability and stability were assessed using the harmonic mean of relative performance of genotypic values (HMRPGV) and weighted average of absolute scores (WAASB) and integrated into a multi-trait selection index. Significant genotypic and temporal effects were detected, while the interaction between genotypes and water management regimes was non-significant, indicating consistent performance under different water regimes. Broad-sense heritability was moderate, with high selective accuracy. Genotypes 108 and 203 achieved the highest predicted yields (91.4 and 86.8 bags ha−1) and superior adaptability. The multi-trait index identified six outstanding genotypes—108, 203, 201, 306, 303, and 302—combining high yield, broad adaptability, and temporal stability, resulting in an expected genetic gain of 8.17% in relation to the original population. These findings demonstrate that selected C. canephora genotypes are well adapted to transitional altitudes, supporting breeding programs for climate-resilient and high-yielding crops.

1. Introduction

Coffea canephora Pierre ex Froehner is a globally significant agricultural product, holding substantial socioeconomic importance and accounting for approximately 36–40% of the global coffee supply [1,2,3]. Brazil, being the world’s largest producer and exporter of coffee, plays a crucial role in this market and in breeding programs involving this species [3,4]. While historically thriving in hot and humid lowlands, with smaller variations in air temperature (favored by minimal of 17 °C and maximum of 33 °C) and annual precipitation of at least 1200 mm [5,6], the shifting environmental conditions caused by climate change creates an uncertain scenario, mainly due to the increase in temperature and occurrence of prolonged droughts. Prediction models estimate a progressive increase of 1.7 °C in the average air temperature in the Southeast Region of Brazil until 2050. As result, nearly 60% of the areas currently classified as apt for coffee plantations will be reclassified as inapt due to thermal limitations [7].
Worrisome studies demonstrate that this increase in air temperature will negatively impact the coffee yield more than the decrease in annual precipitation. A 1 °C increase in air temperature could result in losses ranging from 25% to 31% in the production of C. canephora under annual precipitations from 1200 to 920 mm, respectively. The most pessimistic scenario would result in loss of 36% of coffee production if the annual precipitation was 460 mm [8]. Analysis of vegetative spectral indexes with data about precipitation and air temperature demonstrate that even irrigated crops of C. canephora in Espírito Santo state continue to be susceptible to extreme climatic events, which justifies the adoption of management strategies to mitigate the adverse effects from higher temperatures (e.g., agroforestry, consortium between species, cultivation in transitional altitudes).
The global projections indicate a decrease in the apt area for C. canephora production due to changes in the rainfall regimen and an increase in mean temperatures [9]; there is a rising trend of migration of this species to higher altitudes, seeking milder temperatures [10], especially due to the great impact of this climatic variable over coffee yield. This scenario necessitates expanding C. canephora cultivation into new frontiers, including higher regions currently classified as transitional regions between coffee species (400–700 m). These regions are marginally occupied by C. arabica due to aptitude restrictions, but with potential for C. canephora [11].
Environments with higher altitudes, exemplified by the mountainous region of Espírito Santo, Brazil, present both a unique cultivation alternative to expand the crop and a challenge to evade possible negative impacts caused by the temperature during the coldest months [6]. Optimizing C. canephora productivity in such challenging contexts demands a thorough understanding of the intricate interplay between genetic factors and environmental management, particularly water availability. Effective water management strategies, including controlled irrigation, are critical for maximizing yield and ensuring plant performance. Simultaneously, harnessing the rich genetic variability inherent within C. canephora is paramount for identifying genotypes that exhibit enhanced adaptability and stability across these emerging environments [3].
Long-term and multi-environmental efforts are required in order to evaluate the impact of the genotype × environmental interaction on productivity and to allow a reliable selection of genotypes capable of better benefiting from cultivation at transitional altitudes. Therefore, the objective of this research work was to evaluate the productivity, adaptability and stability of 27 genotypes of C. canephora cultivated with different water managements at transitional altitude, aiming to select genotypes for cultivation at higher altitude.

2. Materials and Methods

2.1. Local Characterization

The experimental field was established in the municipality of Alegre, in the mountainous region of the Espírito Santo state (Caparaó), in the southeast region of Brazil (20°52′6″ S, 41°28′45″ W). The site lies at an altitude of 650 m and is classified as marginally suitable for the cultivation of C. canephora, according to the current zoning of agricultural climate risk [11].
The climate of the location is classified as Cwa, according to the Köppen climate classification [12], being humid subtropical with hot summers and dry winters. The topography is undulating and the soil is classified as Typic Hapludox [13].

2.2. Crop Management

Crop management followed the recommended practices for the cultivation of C. canephora in Espírito Santo state [14]. The genotypes were planted in 2015, and each plant was trained with three orthotropic stems that were obtained after bending the primary stem. The adopted spacing was 3.0 × 1.0 m, resulting in a population of 3333 plants per hectare (10,000 m2) and, therefore, 9999 orthotropic stems. This plant and stem density falls within the recommended density for C. canephora.
Nutrient management was based on the results of physical and chemical analyses of soil. Fertilizers were applied via fertigation and divided into monthly applications. Phytosanitary management was based on monitoring pests and diseases and associated chemical and biological methods. The weeds were managed using mechanical and chemical methods. Canopy management was performed through programmed cycle pruning, with annual removal of plagiotropic branches and the substitution of orthotropic stems starting after five years.

2.3. Experimental Design

The experiment followed a split-plot design, with two water managements in the main plots and 27 genotypes in the subplots, evaluated across eight harvests. The treatments were arranged in a randomized complete block design, with four replications and three plants per experimental unit.

2.4. Genetic Material

The 27 genotypes belong to three clonal cultivars certified in Brazil by the National Plant Varieties Protection Service (Serviço Nacional de Proteção de Cultivares, SNPC, Brazil). Nine genotypes originate from the cultivar “Diamante ES8112” (SNPC Certification No.: 20140103), which exhibits early ripening cycles, and are designated as 101, 102, 103, 104, 105, 106, 107, 108, and 109. Nine genotypes belong to the cultivar “Jequitibá ES8122” (SNPC Certification No.: 20140104), characterized by intermediate ripening cycles, and are identified as 201, 202, 203, 204, 205, 206, 207, 208, and 209. The remaining nine genotypes are components of the cultivar “Centenária ES8132” (SNPC Certification No.: 20140102), exhibiting late ripening cycles, and are designated as 301, 302, 303, 304, 305, 306, 307, 308, and 309 [14].
The selection of these genotypes was made since the three clonal cultivars were developed in the same breeding program (realized by Instituto Capixaba de Pesquisa, Assistência Técnica e Extensão Rural–Incaper) and launched together, grouping genotypes with desirable agronomic traits (e.g., crop yield, beverage quality). These cultivars were composed of genotypes with different ripening cycle lengths in order to facilitate the staggering of the harvest stages [4]. Although these genotypes presented similar desirable traits, there are specific traits for characters such as canopy architecture, biometry, physiologic performance, nutrition and yield [15].
The genotypes were asexually propagated by cloning, using stem cuttings obtained from nurseries properly certified in the national inspection organ (Ministério da Agricultura e Pecuária, MAPA).

2.5. Water Management

The different water management regimens were imposed on the plots after the first productive harvest (2017), creating two conditions: one was maintained under full irrigation while the other was subjected to minimal irrigation.
The minimally irrigated condition received only the water added by the standardized fertigation parcels (4.29 L of water per plant per month), plus natural precipitation, which was monitored by an automatic weather station (E5000 model, Irriplus, Viçosa, Minas Gerais, Brazil) installed adjacently to the experimental field. This station also registered the meteorological conditions along the experimental period. This small artificial input of water was made in order to supply the nutrients equally for both conditions.
To establish the adequate water supply for the fully irrigated plot, the soil was sampled and subjected to hydro-physical analysis. The soil bulk density was 1.051 g cm−3 and its water retention curve is expressed in Equation (1) (R2 = 98.18%), where W represents the water availability (m3 water m−3 soil) and T represents the water tension (kPa) in the soil.
W = 0.2889 T−0.121
The water availability in the soil at field capacity (10 kPa) was 0.2308 m3 m−3 and at the permanent wilting point (1500 kPa) was 0.1561 m3 m−3. Soil moisture was monitored, at a depth of 0–25 cm, using tensiometers randomly installed in the soil within the crop. The irrigation was triggered to replenish moisture to field capacity level whenever it depleted to nearly 70% of available water (34 kPa), based on the water depletion factor to avoid water stresses for coffee plants [14,16]. Irrigation was performed using a drip system with self-compensating emitters, spaced 40 cm of distance from each other, with a water flow of 3.43 L h−1.

2.6. Data Collection

During the ripening stage of each harvest (2018 to 2025), when at least 80% of the fruits [17] in each experimental unit were fully ripe, the units were harvested and the coffee volume (L) was quantified. From each unit, 3 L of harvested coffee were sampled to determine the conversion yield (mass of processed coffee per harvested volume). The fruits were dried to a moisture content of 11.5% (wet base), hulled using a Pinhalense DRC1 machine (Pinhalense, Espírito Santo do Pinhal, São Paulo, Brazil), and weighed on an electronic precision scale (accuracy: 0.1 mg). The conversion yield (g L−1) and the plant density were then used to estimate overall crop yield, expressed as processed coffee productivity (bags of 60 kg of processed coffee per hectare) for each genotype.

2.7. Statistical Analysis

Phenotypic data from the multi-environment trial were analyzed using a three-way mixed model framework, considering the experimental design with blocks nested within years and within water management regimes. Analyses were conducted in R version 4.5.1 [18] using the sommer package [19]. Variance components were estimated by restricted maximum likelihood (REML), and genotypic values were derived through best linear unbiased prediction (BLUP) for random effects and best linear unbiased estimation (BLUE) for fixed effects, following the methodology proposed by [20].
Let Y i j k l denote the phenotypic observation of the i-th genotype evaluated in the j-th water management regimen, the k-th year, and the l-th block nested within the regimen-year combination. The linear mixed model was fitted according to Equation (2), where μ is the overall mean; L j is the fixed effect of the j-th water management regimen; A k is the fixed effect of the k-th year; G i is the random effect of i-th genotype; ( G L ) i j is the random genotype × regimen interaction; ( G A ) i k is the random genotype × year interaction; ( G L A ) i j k is the random genotype × regimen × year interaction; P i j k l is the random permanent effect of the experimental unit; B ( l / k ) / j is the random effect of block nested within years and regimen plots; and ε i j k l is the residual error. All random effects were assumed to be mutually independent.
Y = μ + L j + A k + G i + ( G L ) i j + ( G A ) i k + ( G L A ) i j k + P i j k l + B ( l / k ) / j + ε i j k l
From this model, variance components were estimated and subsequently used to compute relevant genetic parameters. Genotypic values were predicted as the sum of the overall mean and the random genetic deviation (µ + G i ). Adjusted means for water management regimes and years were obtained from the fixed-effects portion of the model. Furthermore, genotype × environment interactions were partitioned into different levels (genotype × regimen, genotype × year, and genotype × regimen × year) to derive specific predictions for each environment (e.g., μ + L j + A k + ( G L A ) i j k ).
Values of cultivation and use (VCUs) were calculated following [21], using confidence intervals around the predicted genotypic means to evaluate stability and performance across environments (combinations of water management regimes and years).
The significance of variance components was assessed through deviance analysis via likelihood ratio tests (LRTs). Reduced models were constructed by sequentially removing individual random effects while keeping all other terms unchanged. The reduced ( M R ) and full ( M F ) models were compared using the deviance statistic (Equation (3)), where l R and l F denote the log-likelihoods of the reduced and full models, respectively.
D = 2 ( l R l F )
The deviance statistic (D) was assumed to follow an asymptotic χ 2 distribution, with degrees of freedom equal to the difference in the number of parameters between the two models [22,23].
Genotypic stability was assessed using the Weighted Average of Absolute Score of BLUPs (WAASB) as proposed by [24]. BLUPs of genotype × regimen, genotype × year, and genotype × regimen × year interactions were extracted from the mixed model and used to compute overall, spatial, and temporal stability indices. Spatial stability was estimated from genotype × regimen effects and temporal stability from genotype × year effects, allowing assessment of genotype-specific responses across water management regimes and years. Based on these indices, genotypes were classified into four categories: stable in both dimensions, stable only spatially, stable only temporally, or unstable.
Genotypic adaptability was evaluated using the harmonic mean of the relative performance of genotypic values (HMRPGV), as proposed by [25], which computes relative performances of each genotype across all environmental combinations, penalizing low and inconsistent performances and thereby highlighting genotypes with broad adaptation.
A multi-trait selection index ( I i ) was constructed to simultaneously integrate productivity, adaptability, and stability and used to rank the genotypes (Equation (4)), where g i denotes the predicted genotypic effect, H M R P G V i represents adaptability, and W A A S B i corresponds to stability (lower values indicate greater stability). Different weights were used to associate the magnitudes and direction related to the desired performance of the genotypes. Higher positive weight was used for the predicted genetic effect ( g i , higher is more productive) and a moderate positive contribution for the adaptability measure ( H M R P G V i , higher is more productive and adaptable); a lesser and negative weight was associated to the instability measure ( W A A S B i , lower is better).
I i = 0.70 g i + 0.35 H M R P G V i 0.05 W A A S B i
The expected genetic gain was calculated based on the selection of the top 20% of ranked genotypes considering the yield heritability. Graphical outputs were generated using the ggplot2 package [26].

3. Results and Discussion

The Espírito Santo state is the largest producer of C. canephora in Brazil and corresponds to 18% of the worldwide production of this species [27]. According to its agroclimatic zoning [11], the adequate range of temperature is between 22 and 26 °C, and ideal water availability is characterized by annual accumulated precipitation between 1100 and 1200 mm. Regarding the rainfall distribution, the accumulated precipitation during the main reproductive stages of the phenological cycle (September to February) should be between 750 and 930 mm.
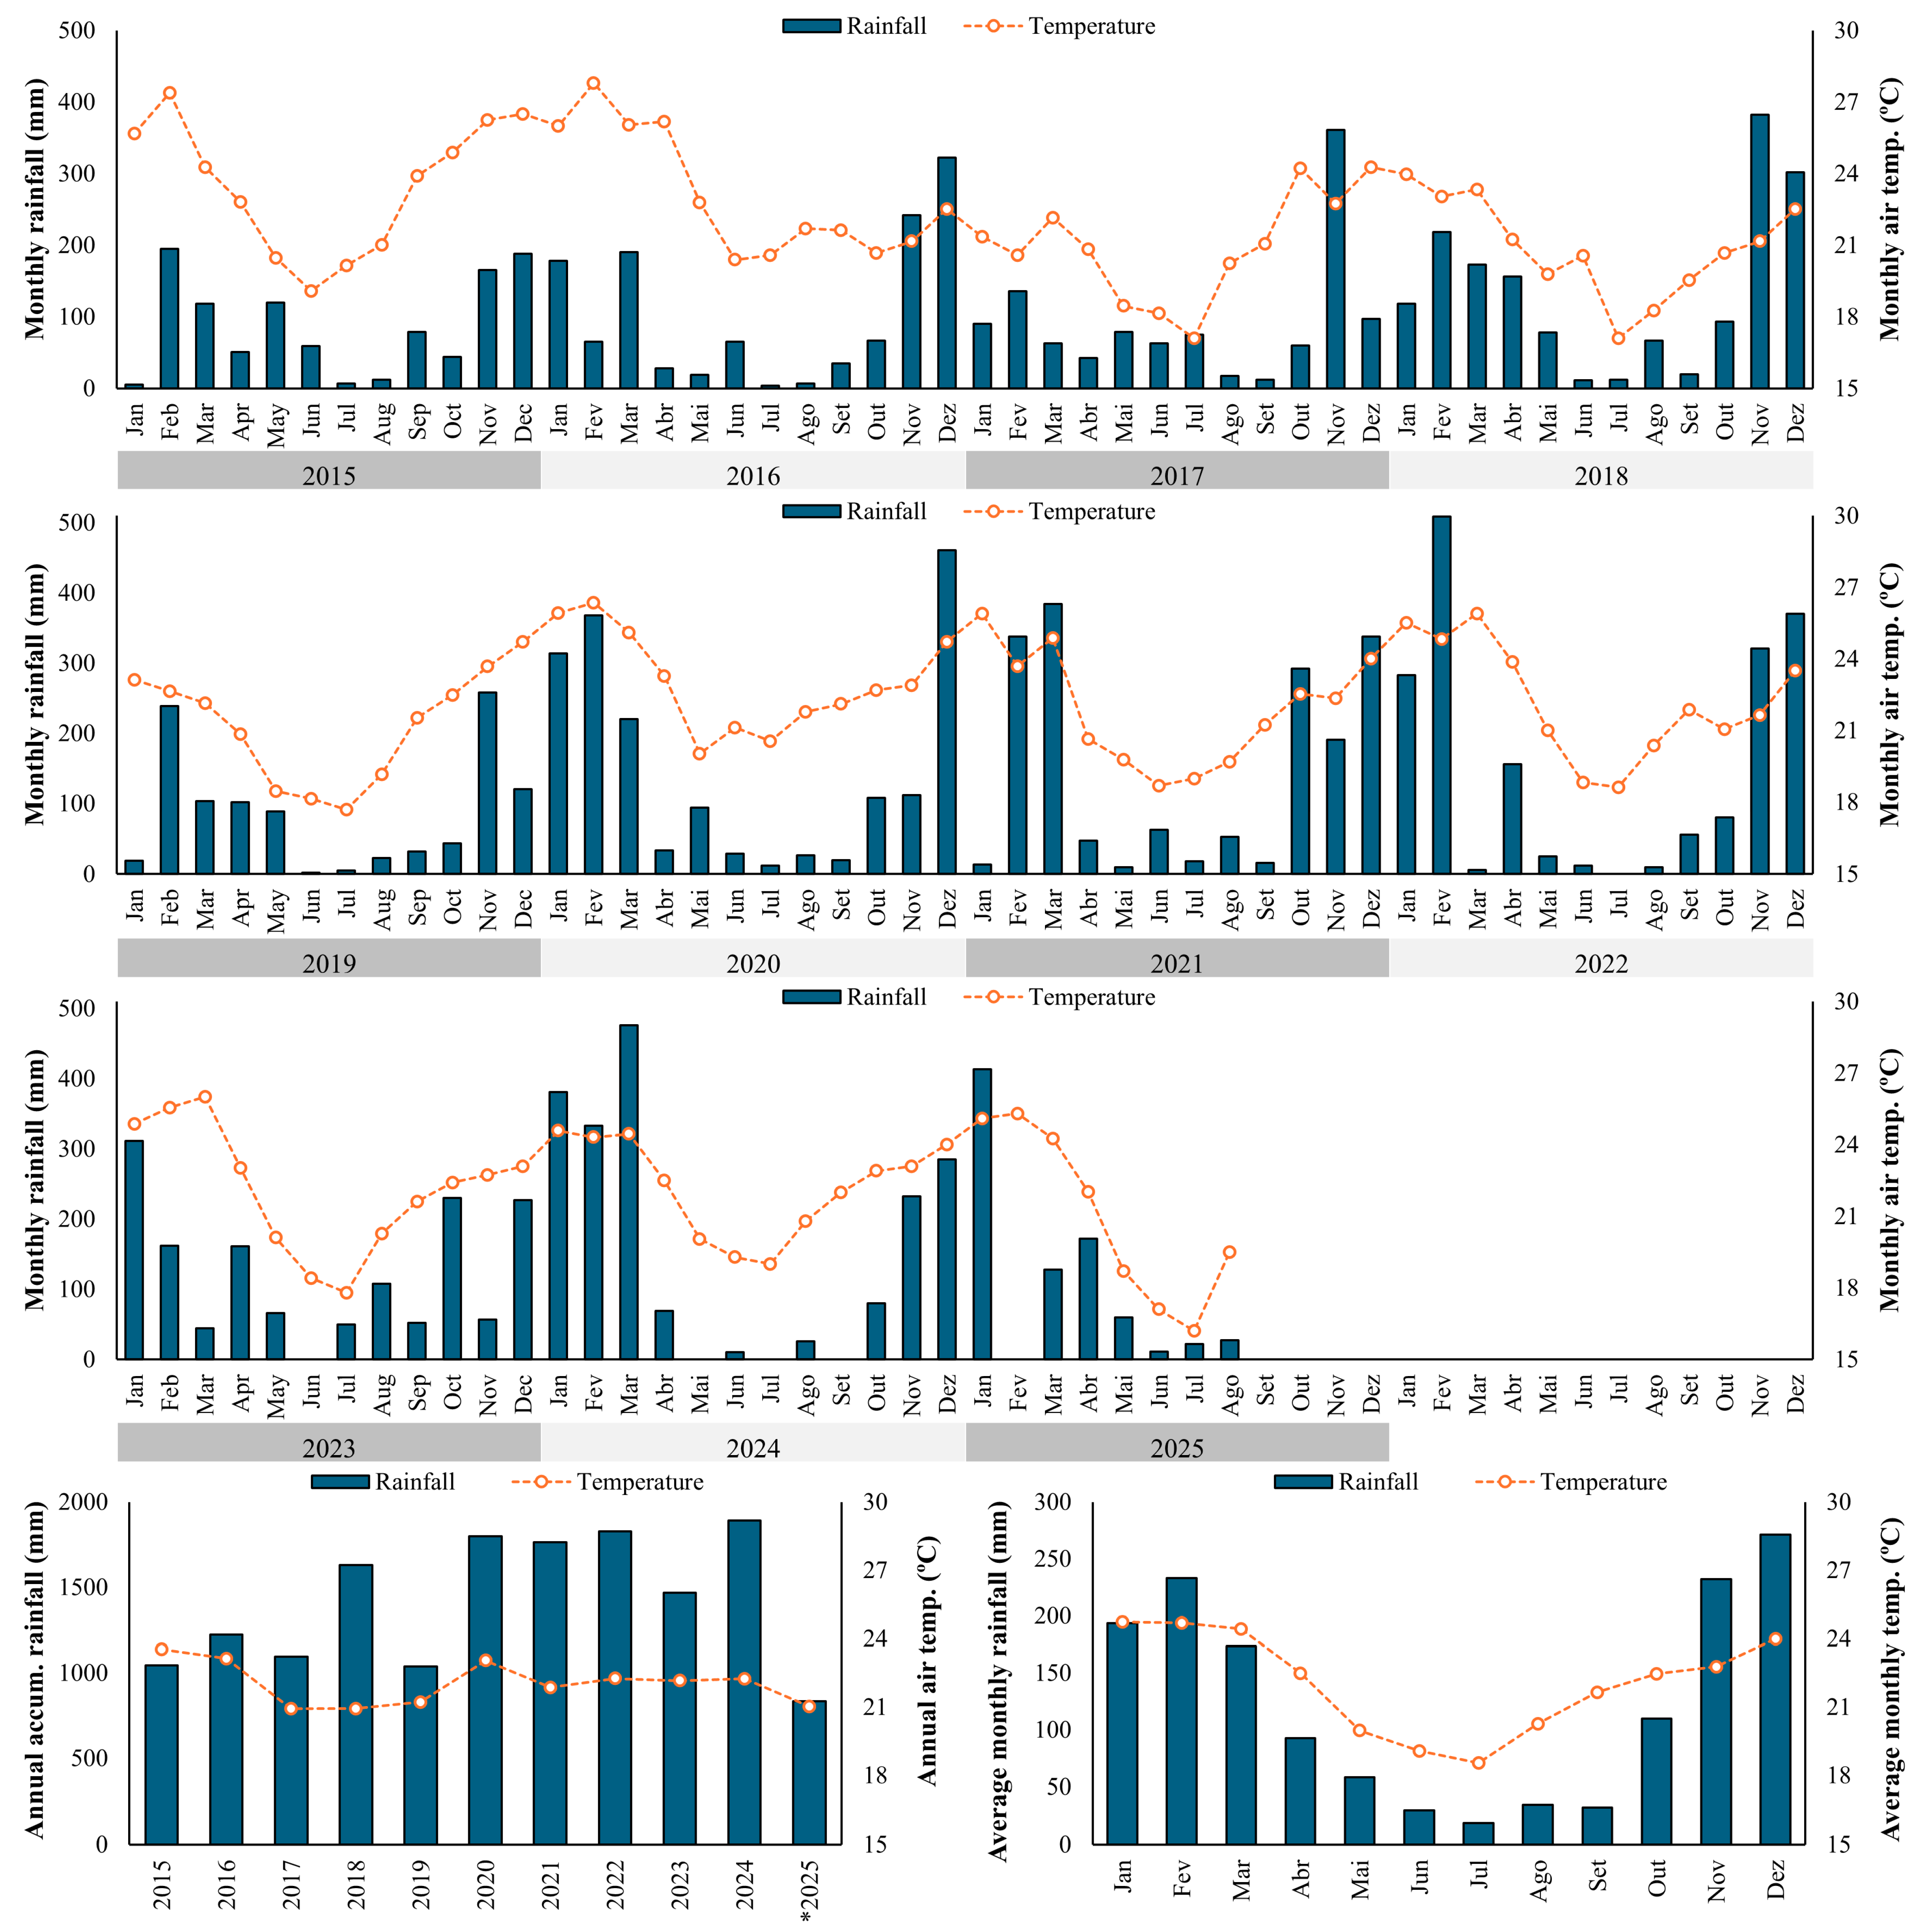
Data obtained during the trial, from 2015 to 2025, showed that the average temperature was 22.1 °C and the average annual precipitation was 1477.9 mm, while the average accumulated precipitation during the reproductive stages was 1071.4 mm (Figure 1). Only in 2015 (676.0 mm) and 2019 (712.5 mm) was the precipitation during these reproductive stages lower than adequate. Since 2015 was the planting year and the entire experimental field was managed with irrigation, this should not have significant effects over the results of this research.
Environmental factors, such as water availability, are known to significantly impact C. canephora productivity and quality [8,28]. Since the observed natural water regimen during the trail fully supplied the adequate level, with only 2019 presenting an accumulated rainfall lower than the adequate range, the irrigation may have presented a lesser impact. Analyzing the Pearson correlations between the climate variables and the crop yield reveals a low to moderate negative correlation for the annual precipitation for fully (r = −0.605) and minimally (r = −0.526) irrigated conditions and weak negative correlations with the average annual temperature for both managements (r = −0.128; r = −0.087, respectively). These results indicate that fluctuations in yield were more related to the pruning cycles (canopy longevity) than to the climatic conditions along the years; this is confirmed by a high consistence of the crop yield between hydric managements (r = 0.989).
The analysis of genetic parameters and variance components is presented in Table 1, obtained by the used mixed model (REML/BLUP) in order to obtain unbiased estimations of genetic variance and accurate predictions of genotypic values [29]. These parameters are fundamental for guiding selection strategies and predicting the success of breeding programs [30]. The three-way mixed model employed in this study made it possible to dissect the complex genetic and environmental interactions influencing C. canephora productivity. The overall phenotypic mean across genotypes, water management regimes, and harvests was 61.86 bags of 60 kg per hectare, representing the central tendency of performance within the experiment.
The deviance analysis, based on likelihood ratio tests (LRTs), revealed contrasting contributions of genetic and environmental sources of variation (Table 2). A highly significant genotypic main effect demonstrated a substantial genetic variability among the genotypes. This inherent variability represents an essential prerequisite for breeding progress in C. canephora given its known high genetic diversity [4,31].
A highly significant genotype × year interaction was observed, which was also reflected in its high determination coefficient among stability-related parameters ( C i n t G A ). This indicates that genotypic performance was strongly influenced by temporal variability across the eight harvests. This finding is in agreement with previous studies on perennial crops, including C. canephora, where year-to-year fluctuations, particularly those caused by environmental factors, are known to differentially affect the stability and adaptability of genotypes [32,33,34]. The genotypic correlation across years was moderate (0.41), further confirming that these temporal fluctuations indeed altered genotypic relative performance. The temporal variation of the yield of these genotypes is widely discussed. The longevity of the orthotropic stems has a crucial role in the productive cycles, being one of the main bases of the cyclic renovation of the aerial part of the plants [14]. This renovation had influence over the productivity achieved across the cycles, mainly during 2021 when the plants presented only one remaining orthotropic steam to sustain the productive branches while the new stems were growing.
In contrast, the genotype × regimen interaction was not significant, suggesting that genotypic ranking remained largely consistent across the two management conditions (fully or minimally irrigated). This implies that, despite differences in water source, the overall availability of this resource had a lesser effect on the relative performance of genotypes. The productivity was not substantially altered by spatial effects within the transitional altitude environment. Certainly, this result was caused by the abundant rainfall during the experimental period (Figure 1), it being enough to attend to the plant’s demands. The high genotypic correlation across water management regimes (0.96) further supports this consistent performance.
The significance of the three-way interaction (Table 2) indicates that the combined influence of water management regimes and year substantially affected genotype expression. This result highlights the complexity of evaluating perennial species across multiple environments, as genotypic responses cannot be fully explained by water regimen or year alone, but rather by their joint variation [32,35,36]. These results emphasize the need for long-term, multi-environment trials to capture the full spectrum of genotype × environment interactions and understand the specific conditions under which certain genotypes perform best. Coffee productivity tends to be strongly modulated by interannual environmental fluctuations, a recognized challenge in perennial crop breeding [34,37].
The complete model exhibited the lowest AIC and BIC values among all tested alternatives (Table 2), strongly suggesting that it provides the most adequate balance between explanatory power and complexity.
The broad-sense heritability on a plot basis was moderate (Table 1), reflecting the effect of genetic variance over the phenotype. This parameter is essential to estimate the selection gains, and, due to the lack of significance of the interaction genotype × regimen, it will be especially important to estimate the global gains.
The genetic coefficient of variation was nearly twice the magnitude of the C V e , denoting that genetic variability exceeded the residual one and ensuring a high level of precision for inferences about the crop yield in this experimental trial. These results, associated with the moderate repeatability, contributed to the high selective accuracy (Table 1), showing a favorable condition to select genotypes for crop yield, even considering the long-term aspect of the trial, which suggested the plants were influenced by environmental shifts over the years and subjected to canopy renovation. This is especially important for quantitative traits such as the yield, due to its consistent polygenic nature [38,39]. This result also validates the value for cultivation and use explored in this research, since 90% accuracy is often used as a cutoff point for this end [29], expanding the chance of success of applying the current results to other locations.
The highest genetic predicted values were observed for genotypes 108 and 203 (91.36 and 86.75, respectively), which clearly outperformed the population mean (61.86) consistently across environments, suggesting a potential for broad adaptation [40]. In contrast, genotypes such as 102, 204, 101, and 103 ranked lowest (between 38.27 and 42.75). The wide range of predicted values evidenced a broad genetic variation available for exploitation, which is critical for breeding progress, since the identification of top-performing genotypes regarding yield provides the basis to guide the selection process. Even within populations of recommended genotypes, substantial genetic variability has been reported in the species C. canephora, encompassing both vegetative and productive traits [15]. The predicted genetic values also demonstrated substantial variation across environments, reflecting both genotypic plasticity and the strong influence of environmental factors across the combinations of water management regimes and years.
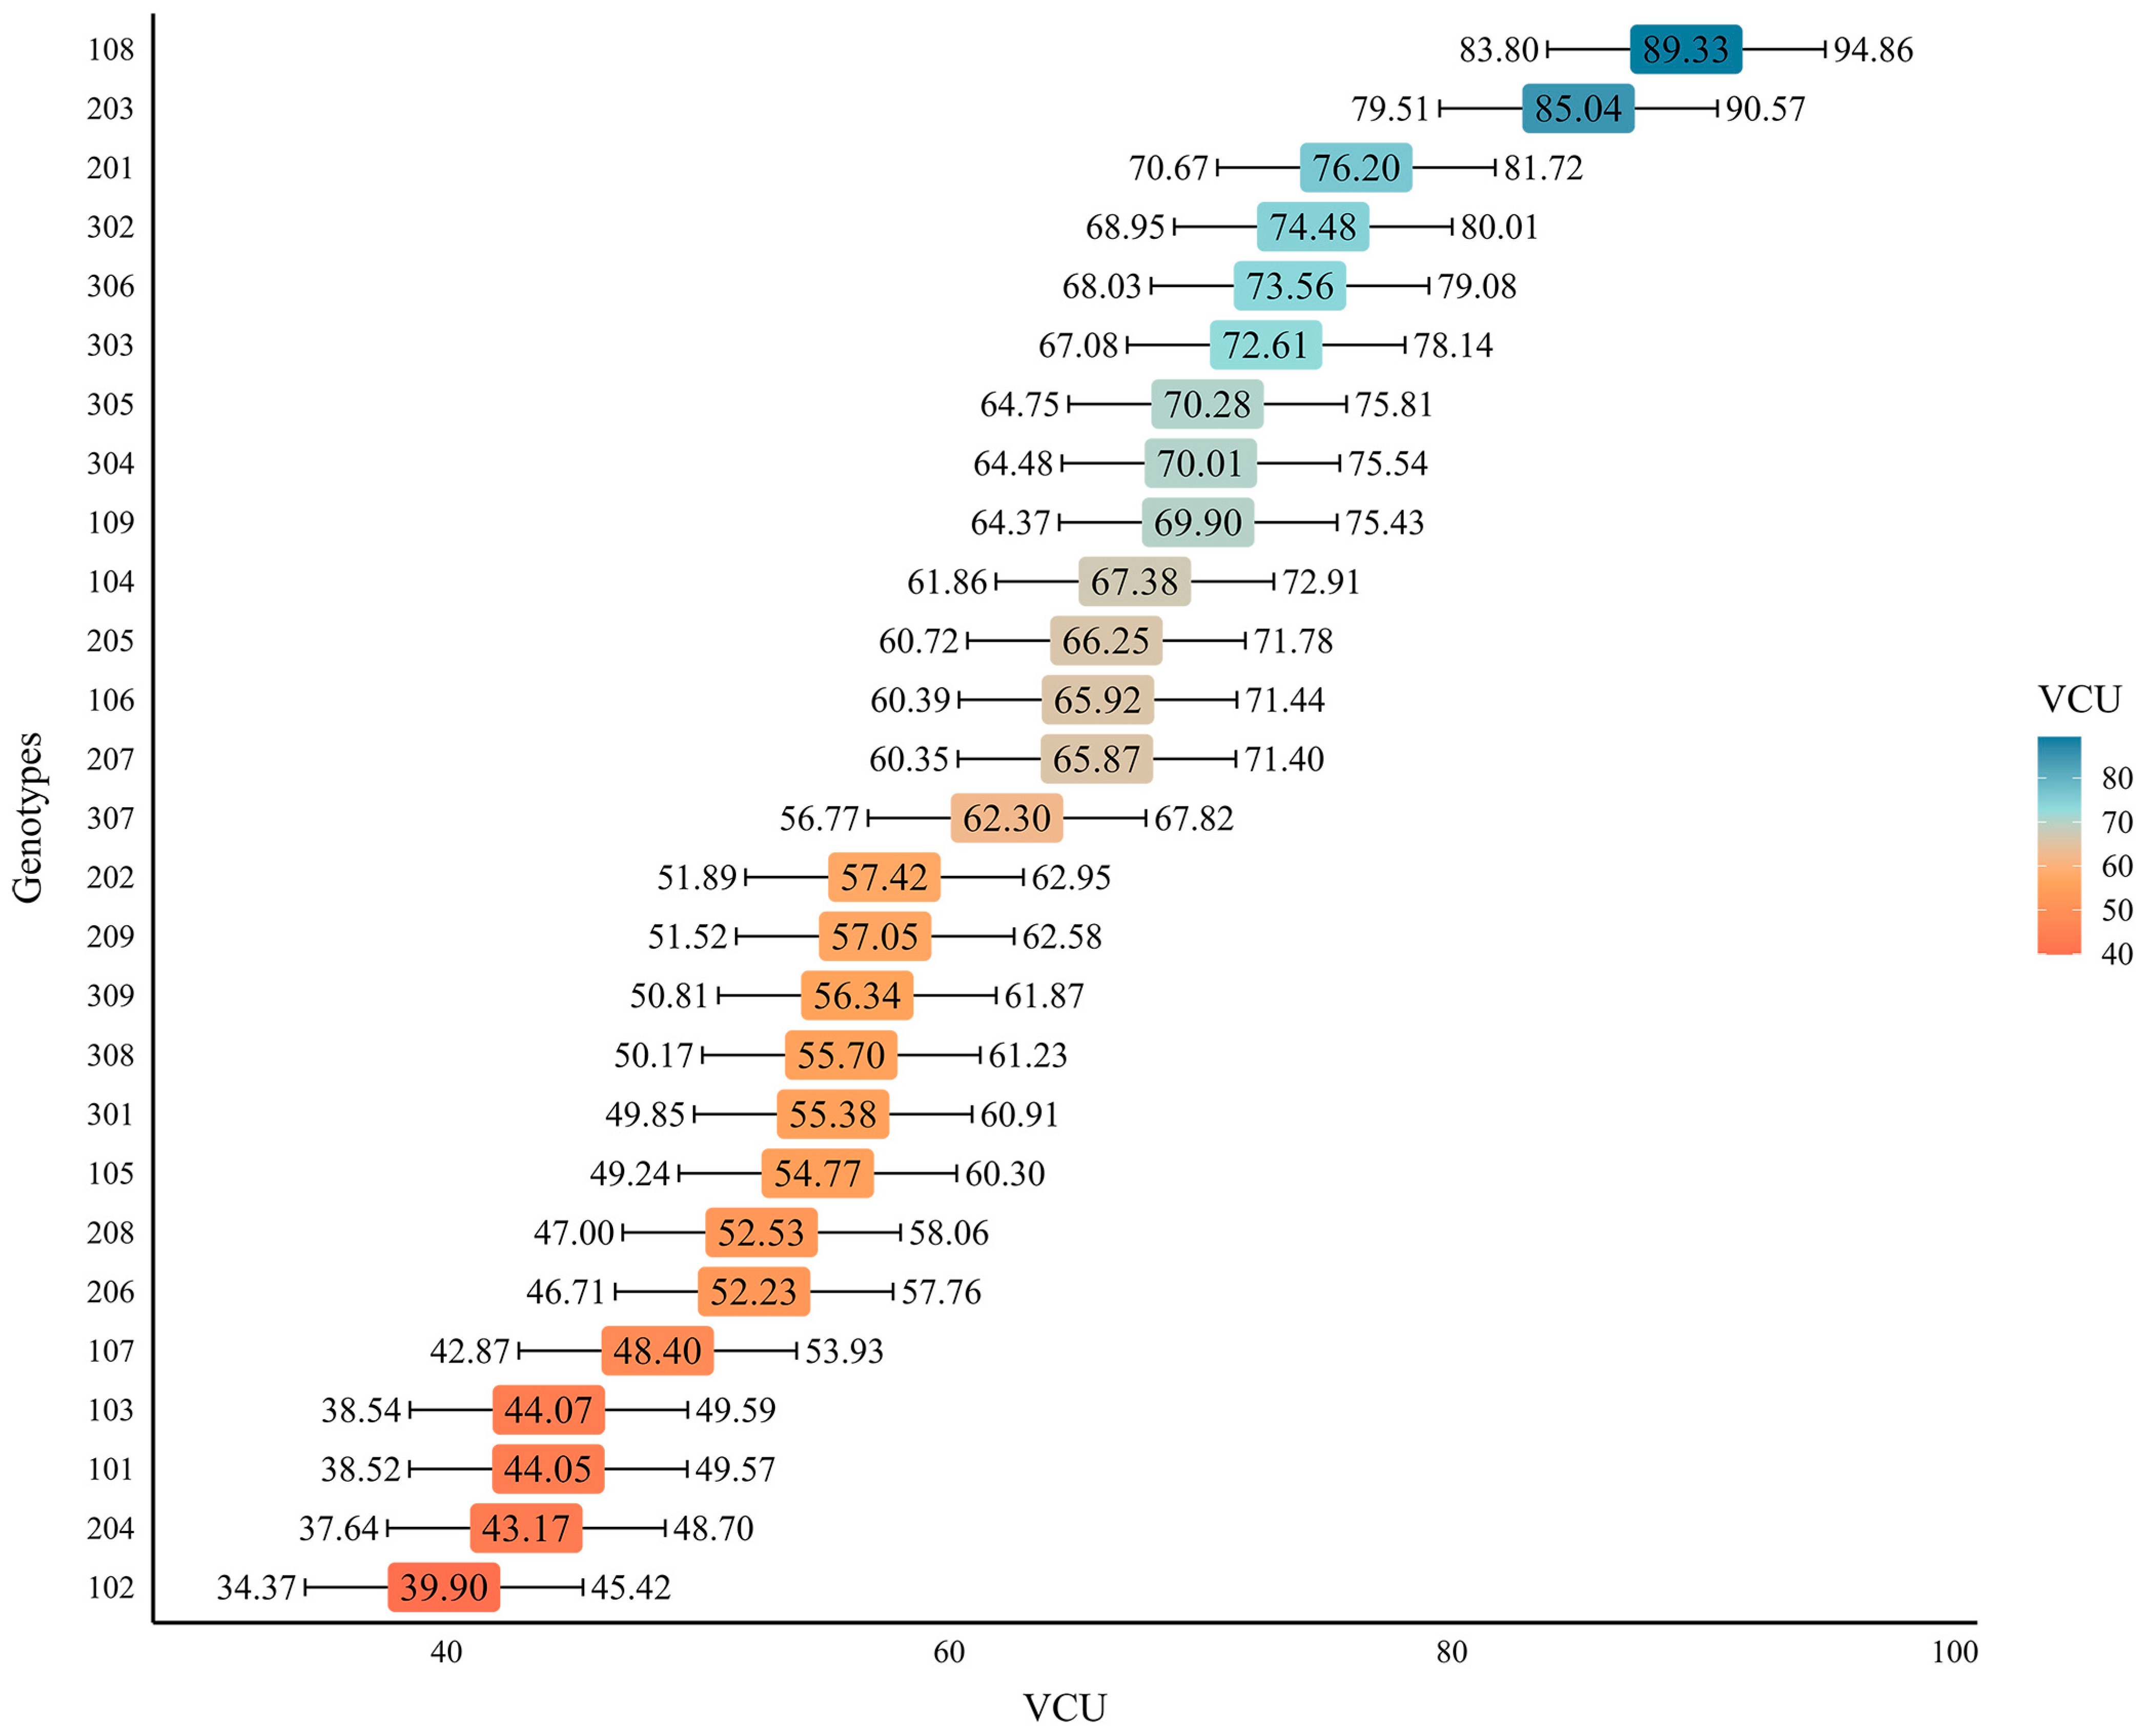
The value for cultivation and use (VCU), incorporating genetic predicted values and their confidence intervals, allows the recommendation of genotypes and cultivars not only due to their high yield but also by a consistent performance and overall utility [37,41,42]. In this trial, the VCU analysis identified genotype 108 as the best-performing candidate, followed by 203 (Figure 2); these genotypes consistently expressed higher relative values and, therefore, have strong potential for recommendation in breeding programs. The inferior limit for the confidence interval of 203 surpasses the VCU value for the following genotype (201), demonstrating the superiority of these two genotypes among the group.
The genotypes 201, 302, 306, and 303 also displayed high VCU, showing reliability for cultivation in transitional altitudes. Fourteen genotypes (108, 203, 201, 302, 306, 303, 305, 304, 109, 104, 205, 106, 207, and 307) among the 27 presented above-average VCU (Figure 2). On the other hand, the lowest VCUs were observed for 102, 204, 101 and 103, suggesting a limited agronomic relevance under the evaluated conditions at transitional altitude, as these genotypes presented at least 17.79 bags per hectare less than the overall average of the population.
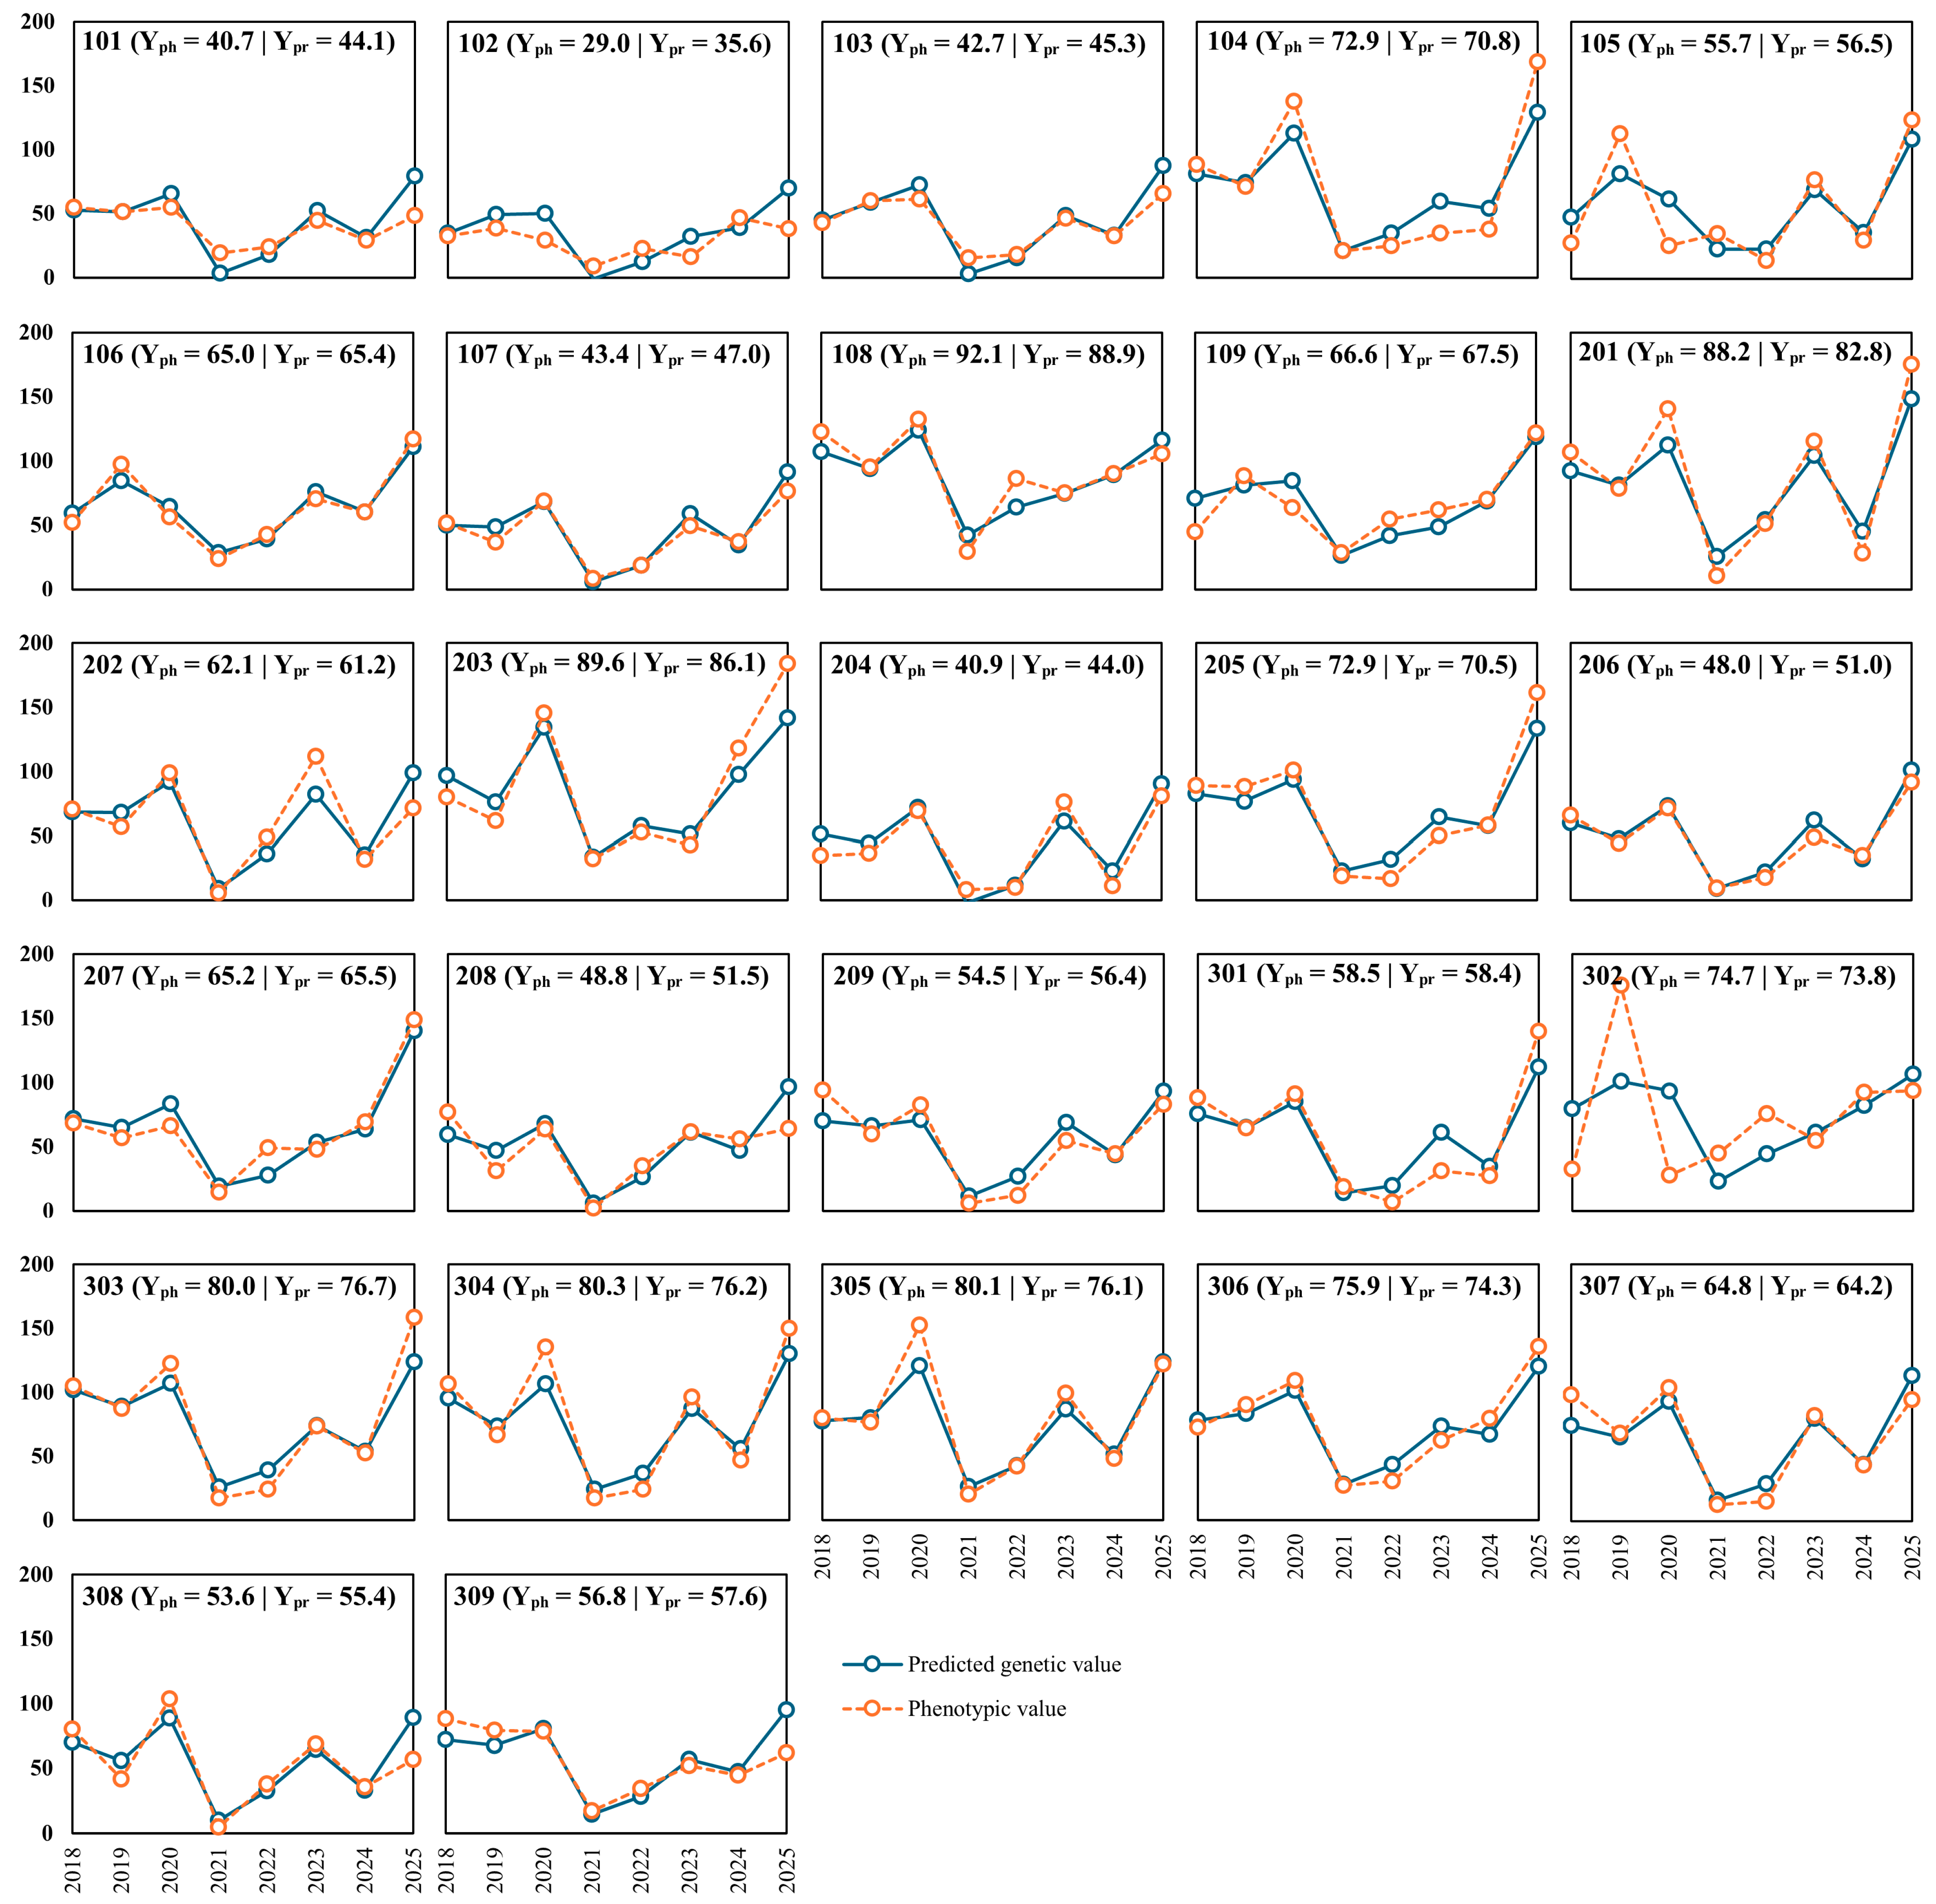
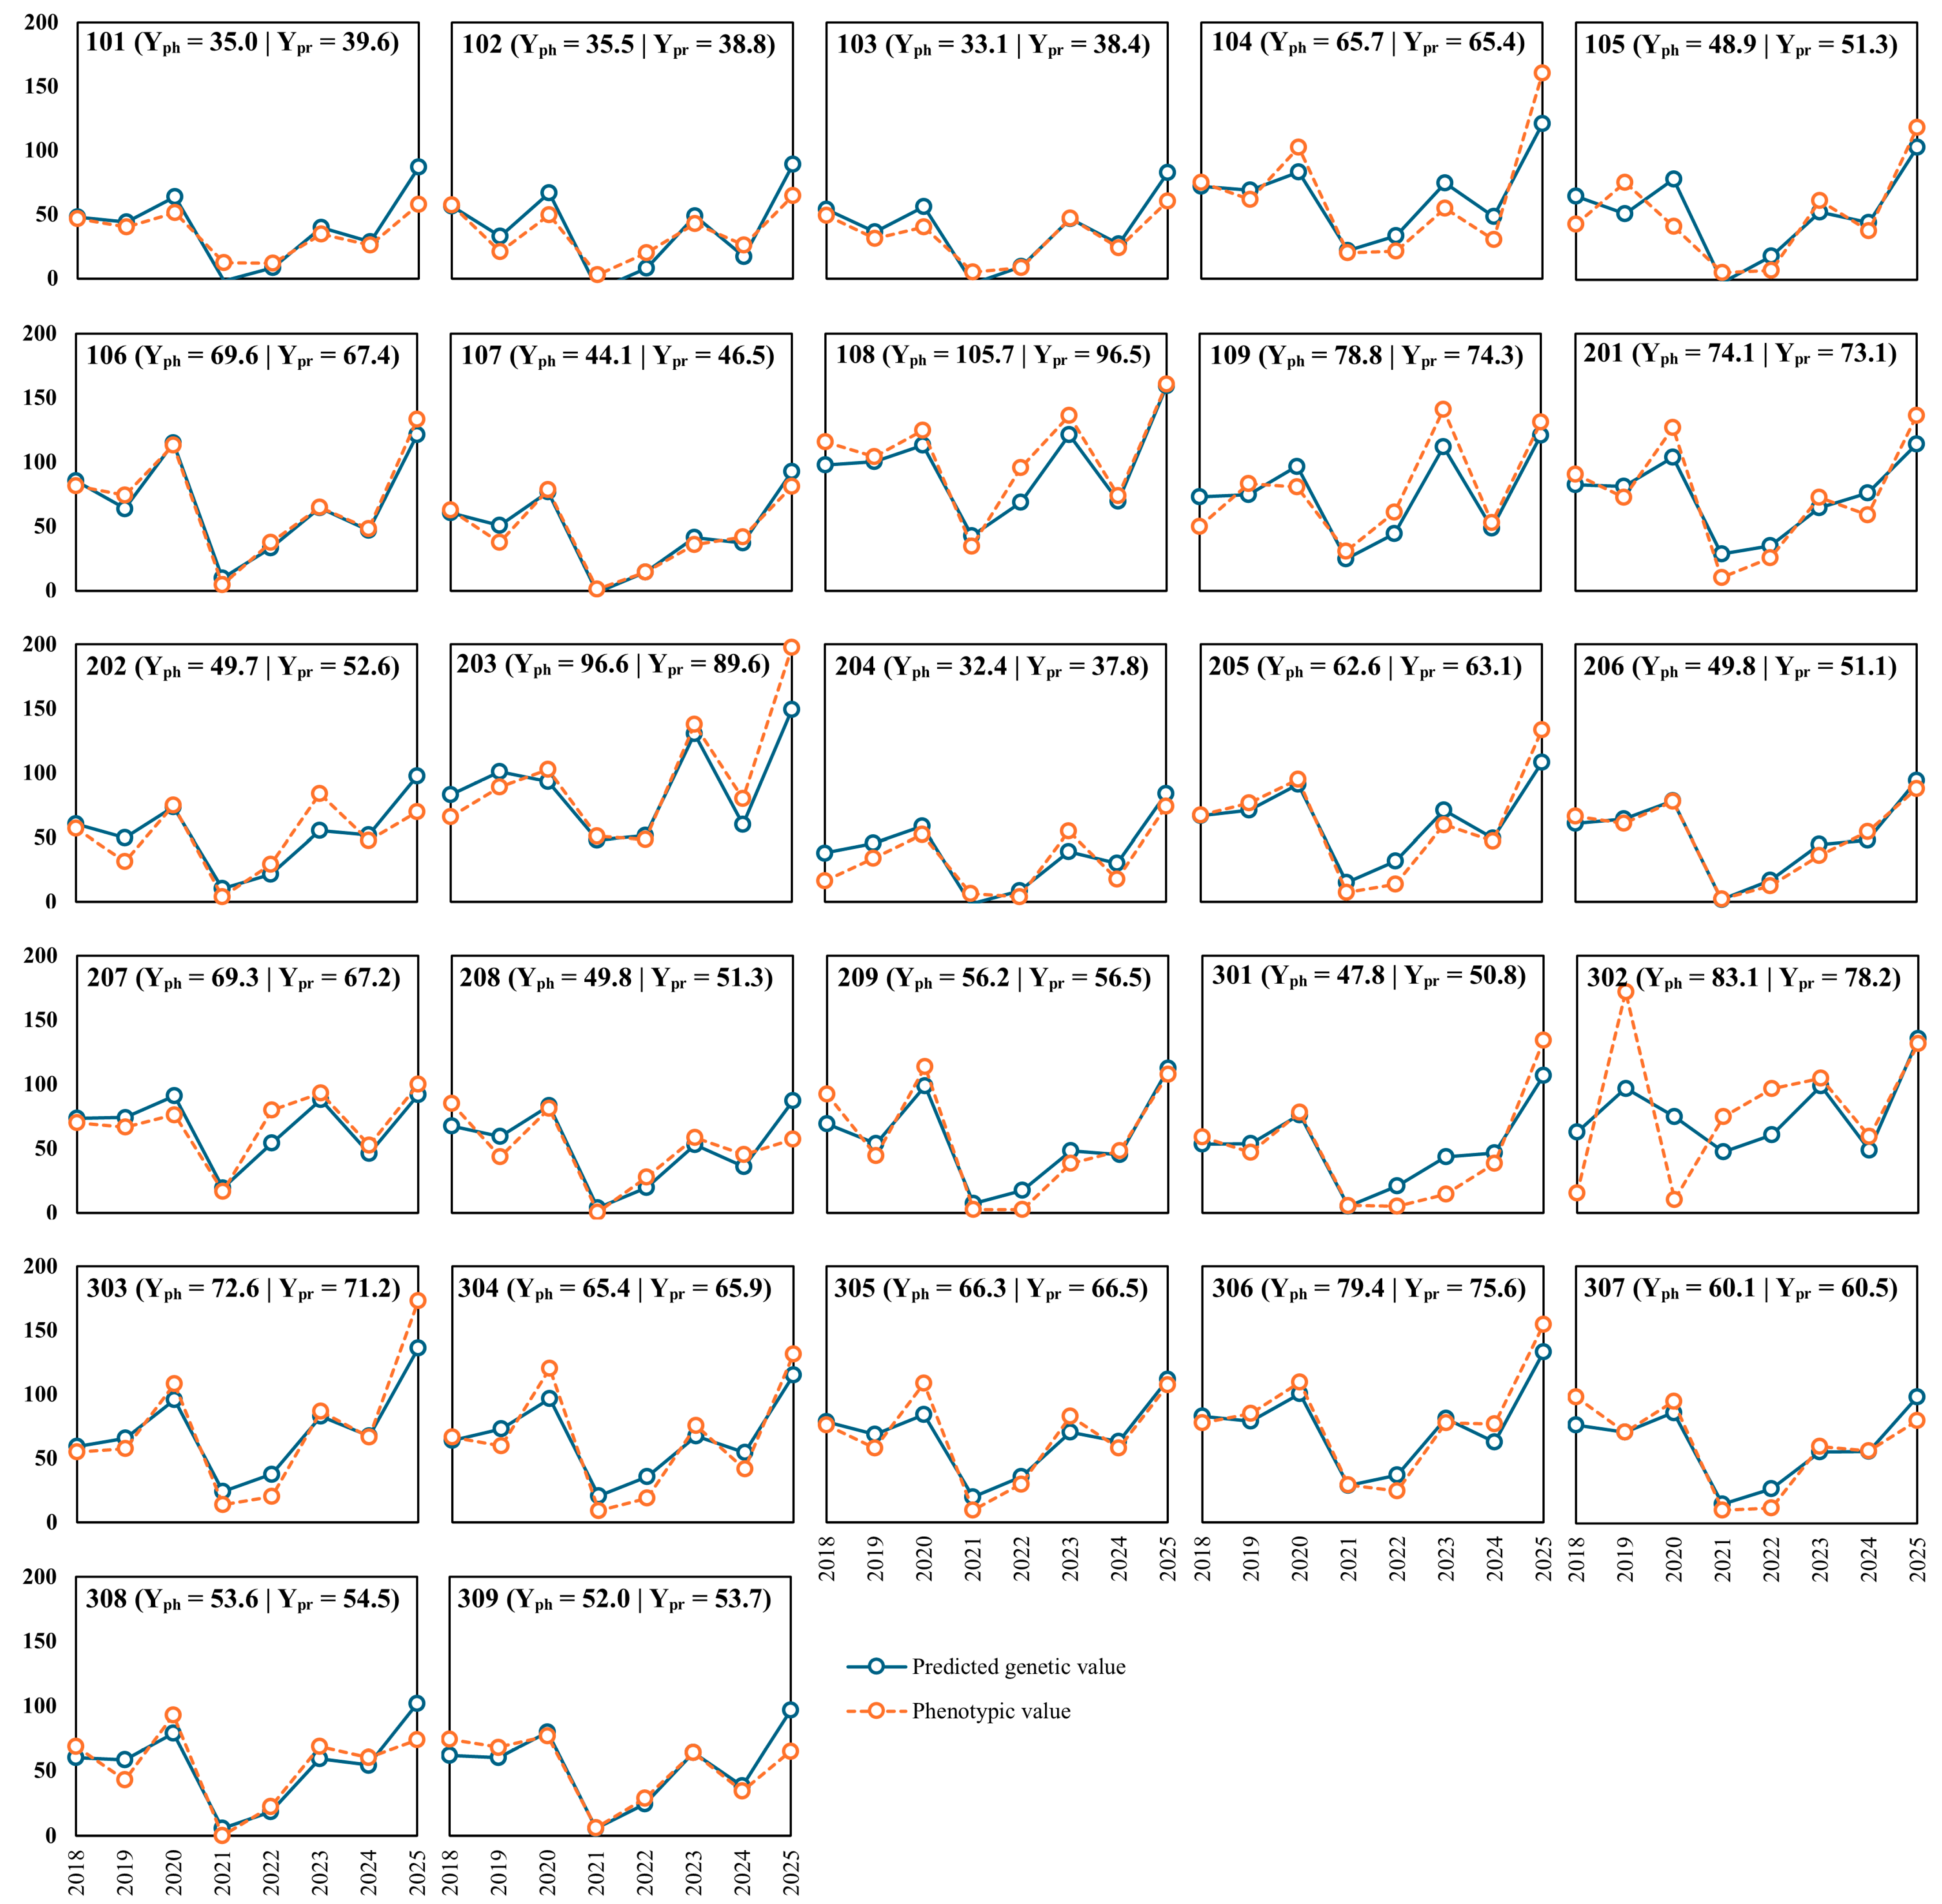
The mixed model used for estimating predicted genetic values efficiently adjusted to the productive performance of the genotypes in the evaluated conditions. Particularly strong adjustments to the prediction were observed for genotypes 103, 106, 107, 206, and 306 in the fully irrigated condition (Figure 3) and for genotypes 106, 107, 206, and 306 in the minimally irrigated (Figure 4). However, 105 and 302 presented variations that restricted the predictability of their phenotypic values in both conditions. Overall, despite significant biennial oscillations being observed, the predicted values were well-adjusted across the years.
For most genotypes, the lowest yields obtained under both water management regimes occurred in 2021 (Figure 3 and Figure 4). This year corresponded to the fifth harvest and the period of canopy renewal, when the productivity was generated from a single and older orthotropic steam. Another specific pattern can be noted for the genotype 302, which exhibited low yield in 2020 (the fourth harvest) regardless of the irrigation, possibly due to a pronounced biennial bearing effect [35]. Similarly, genotypes 105, 205, and 301 showed reduced yield in 2022 with full irrigation, while the same occurred for 204, 209, and 301 in the minimally irrigated condition. At this moment, the plants have their canopies already renewed, corresponding to the first harvest after the full renovation, and these genotypes produced less than before the intervention, possibly related to a limited initial recovery or sensibility to an eventual random abiotic effect.
In the fully irrigated condition (Figure 3), the highest yields were consistently obtained by genotypes 108, 203, and 201, with this last genotype achieving the maximum prediction (148.10 in 2025). Conversely, the genotypes 102 and 204 frequently exhibited low yields under irrigation, indicating their limited suitability for such conditions. For the minimally irrigated condition (Figure 4), a similar pattern was observed, with genotypes 108 and 203 consistently ranked among the highest-performing, achieving 159.41 and 149.28 bags per hectare in the 2025 harvest. In contrast, 102 and 204 repeatedly showed the poorest performance.
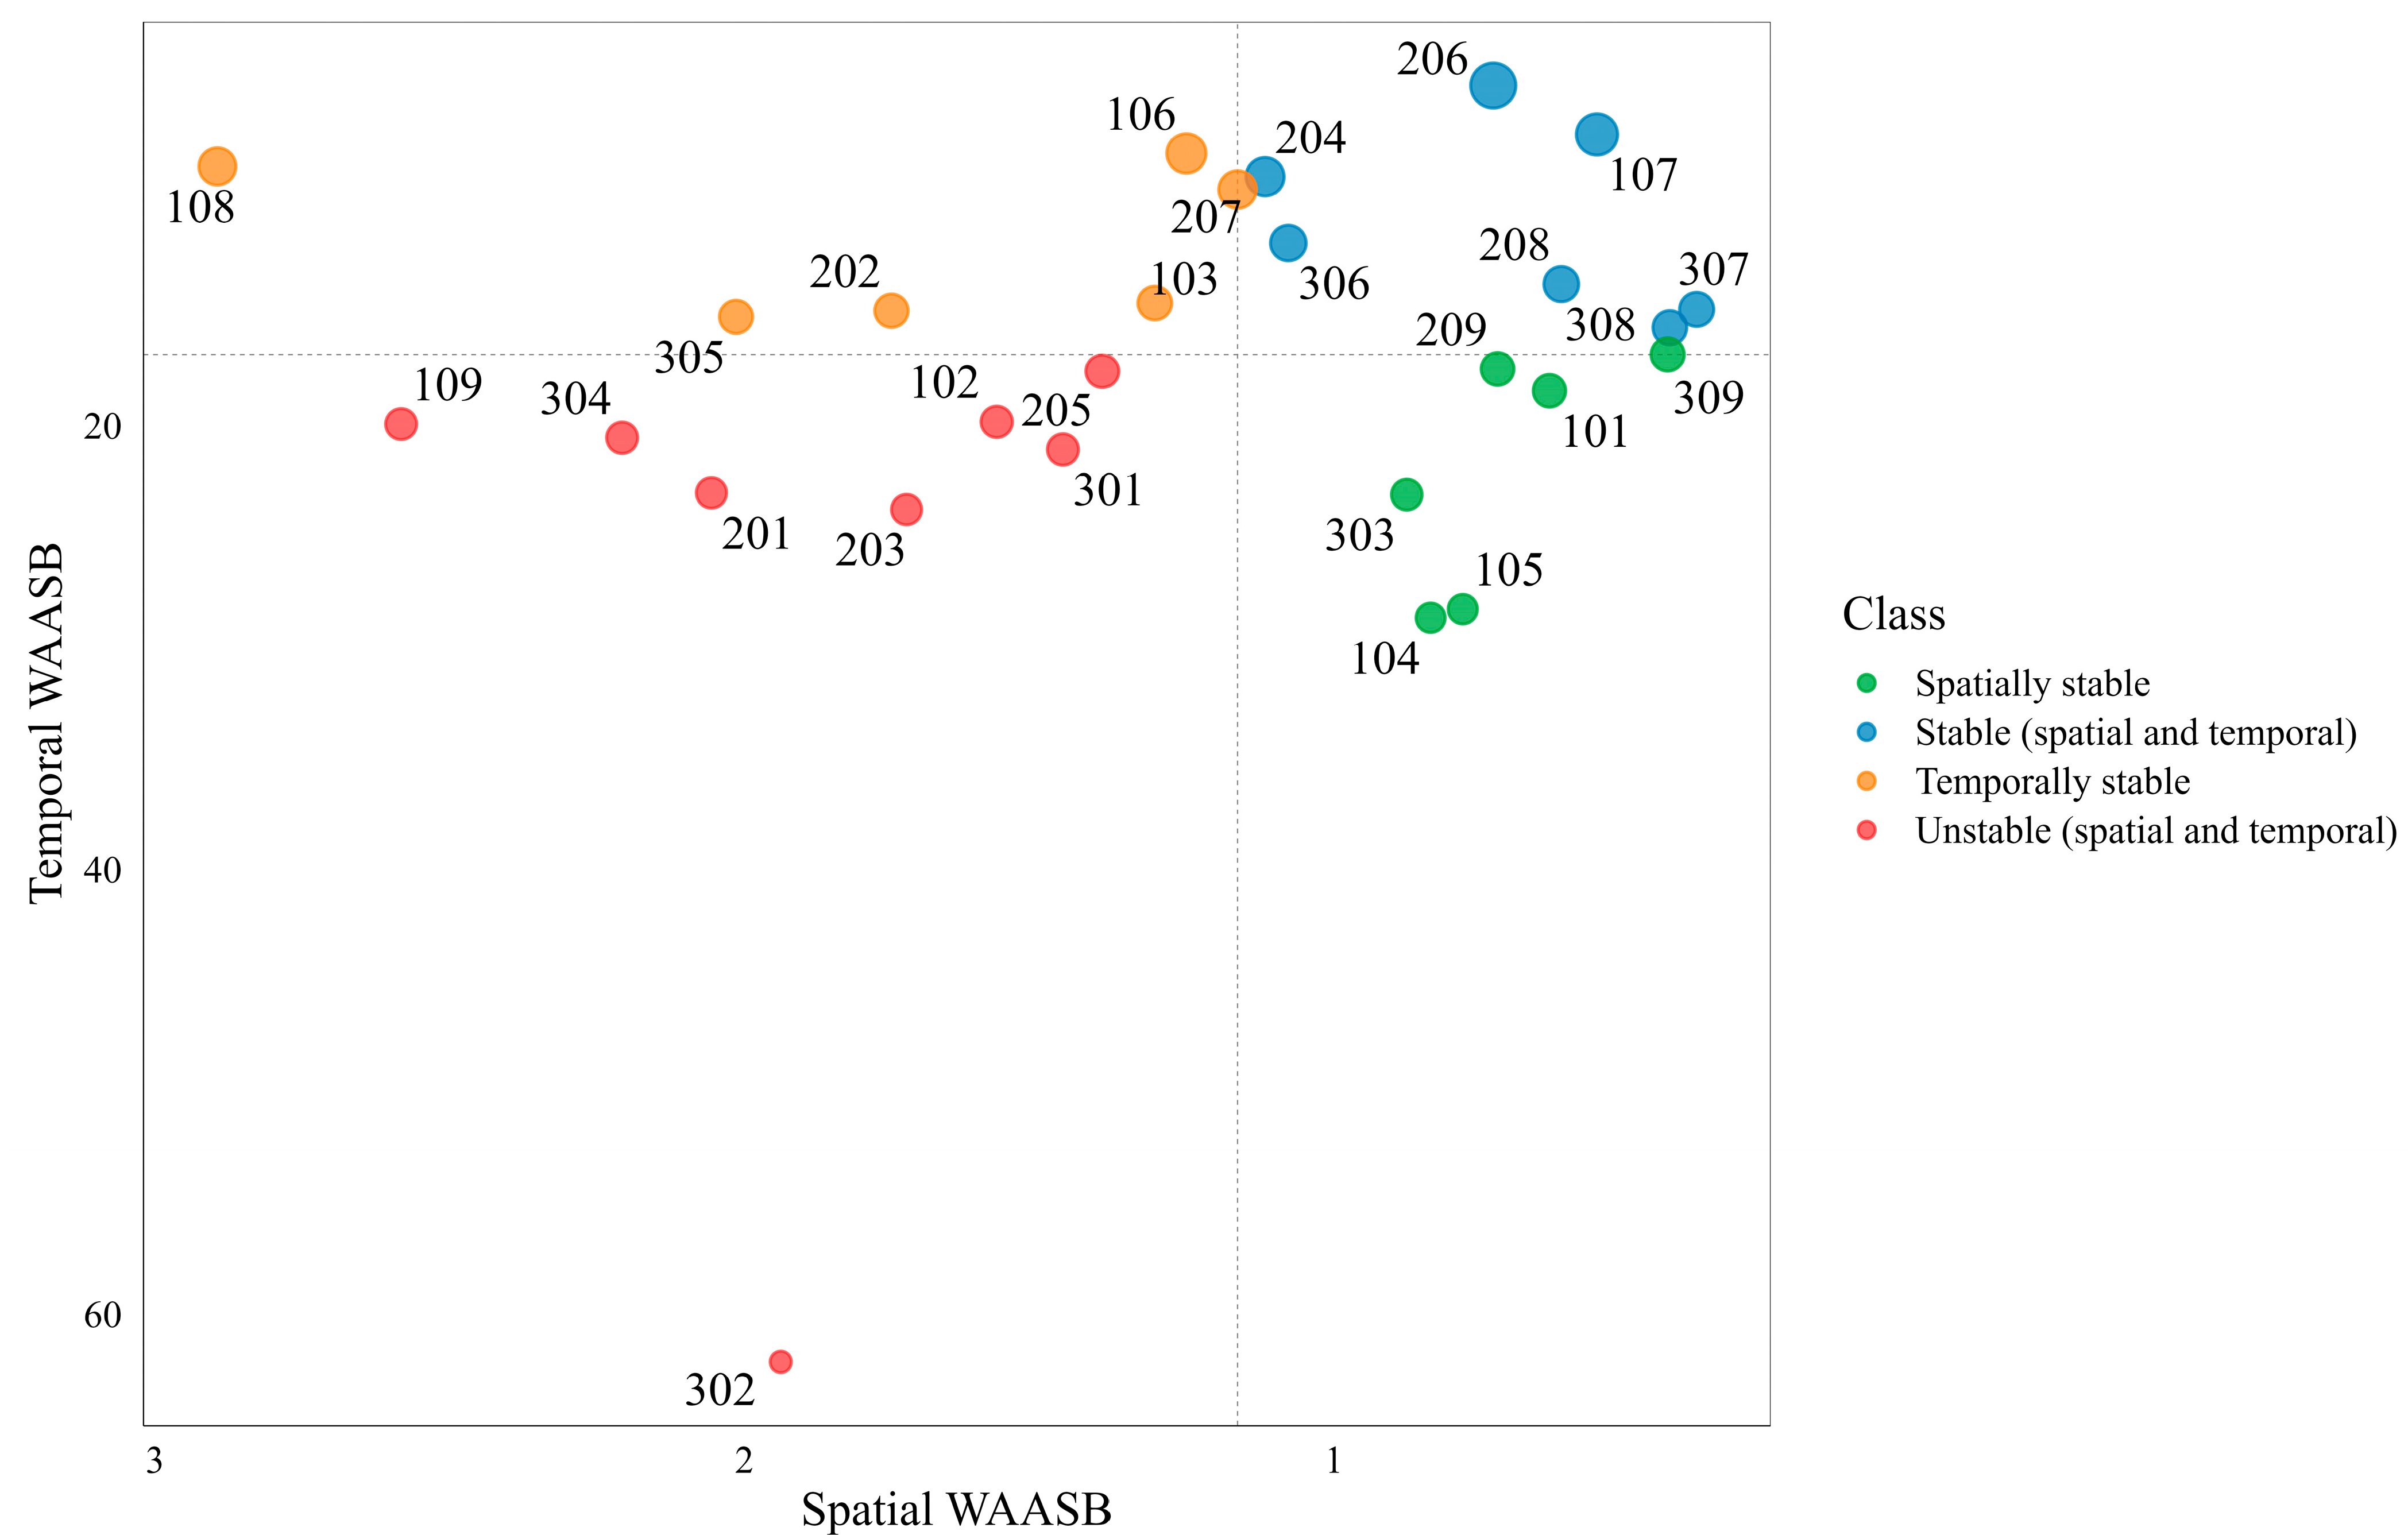
Strategies that consider not only the performance but also the stability are crucial for selecting genotypes that can keep consistent productivity under varying environmental conditions and over multiple years, which is extremely important for perennial crops such as C. canephora [43]. In this context, the weighted average of absolute scores of BLUPs (WAASB) was used to assess overall phenotypic stability. From a calculation perspective, the WAASB quantifies the weighted contribution of each genotype to the G × E interaction based on BLUP-derived interaction principal components [24]. Consequently, lower WAASB values indicate reduced sensitivity to environmental variation and greater stability. Based on this index, genotypes 206, 107, 204, 108, and 106 presented superior stability relative to the evaluated group. Decomposing this stability parameter in spatial and temporal components allowed the joint evaluation of yield stability across both these environmental axes (Figure 5).
This decomposition revealed that temporal instability accounted for the majority of variability across genotypes. For instance, genotypes such as 104, 105, and 303 maintained relatively low spatial instability but presented high sensitivity to changes across the productive cycles. The genotype 302 displayed the highest temporal WAASB, suggesting strong sensitivity to year-to-year environmental variation despite its high yield (which can be observed in Figure 4). The genotypes 102, 109, 201, 203, 205, 301, 302, and 304, classified as unstable (Figure 5), should be used with caution at transitional altitudes, as their instability could compromise their expected performance in years affected by climatic extremes or stresses. This behavior is expected, as some genotypes of C. canephora are more prone to express yield bienniality, evidencing a significant effect of genetic control in the expression of this temporal fluctuation [35].
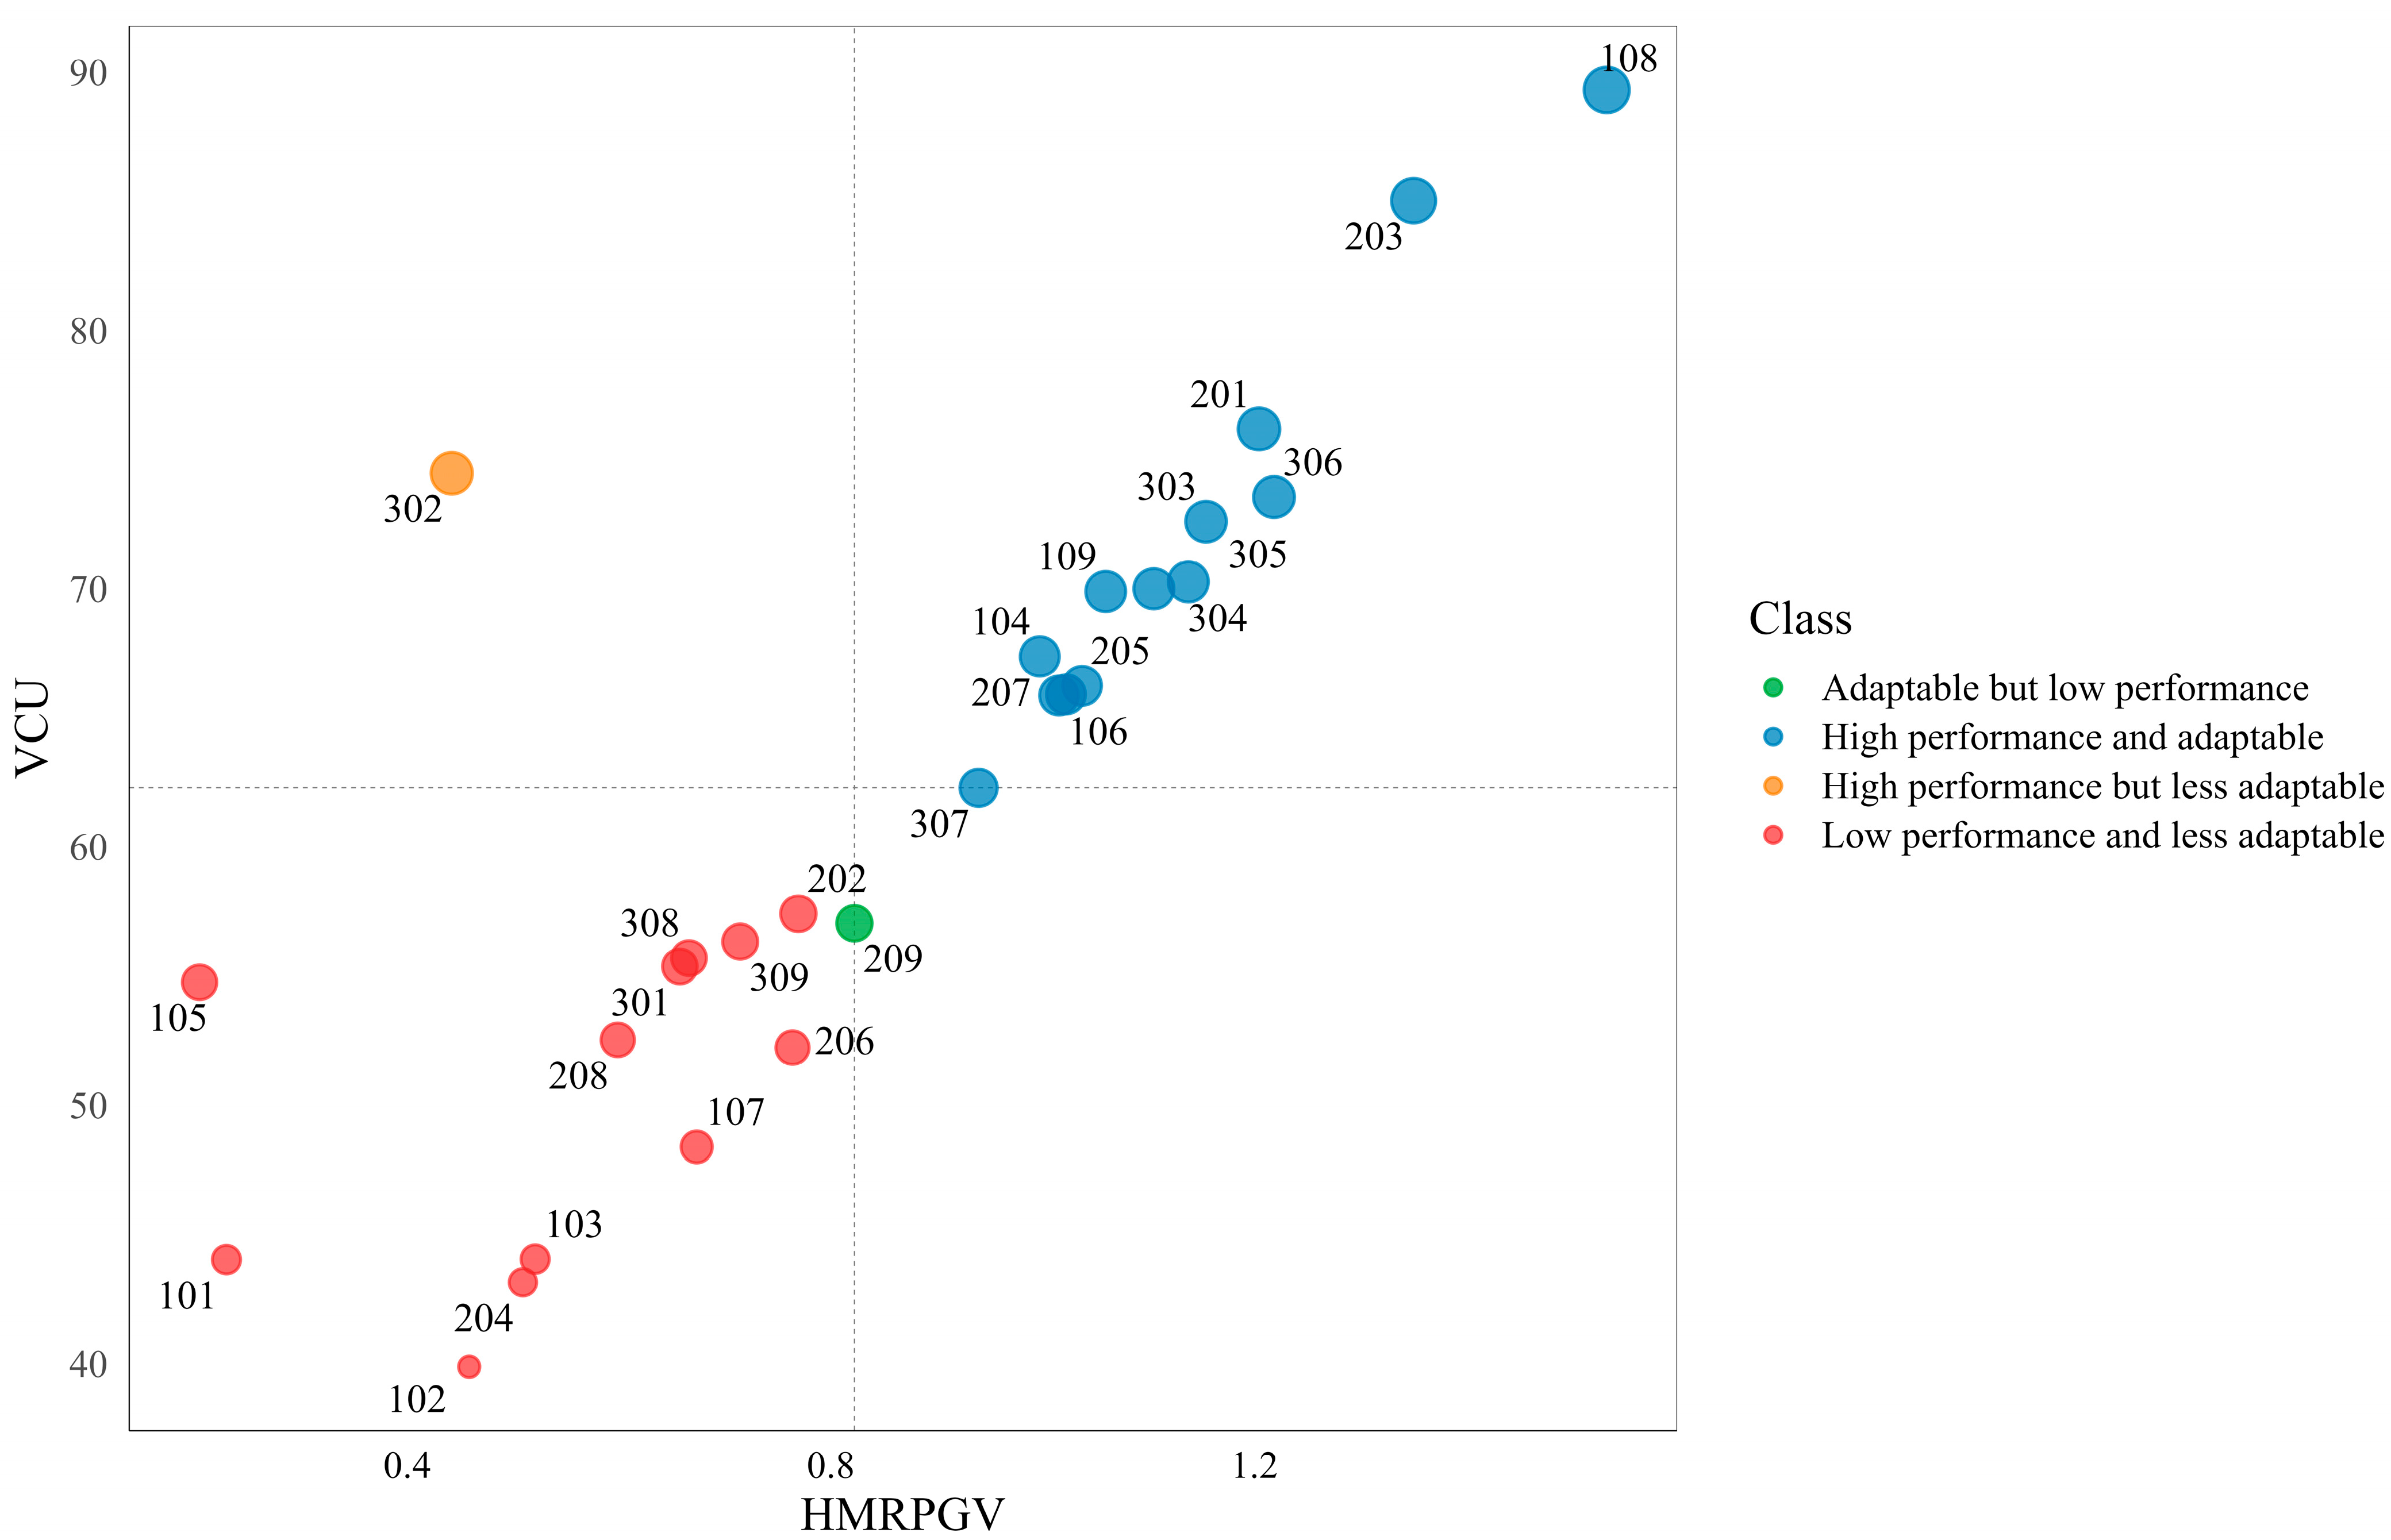
The harmonic mean of the relative performance of genotypic values (HMRPGV) integrates predicted genotypic performance with consistency [44]. From a calculation perspective, the HMRPGV simultaneously captures yield performance and penalizes instability, allowing adaptability to be interpreted as the ability of a genotype to maintain consistently high relative performance across diverse environmental conditions. Based on this index, genotype 108 exhibited the highest adaptability, followed by 203, 306, and 201. These genotypes not only showed superior predicted genetic values and high VCU, but also maintained stable relative performance across environments, confirming their potential for recommendation due to broader adaptability. Higher to intermediate adaptability was observed in genotypes such as 303, 305, 304, 109, 205, 106, 207, and 104. Although their yield levels were slightly lower than the top performers, these genotypes exhibited a favorable balance between crop yield and adaptability. In contrast, genotypes 105 and 101 showed the lowest HMRPGV values, suggesting poor adaptability and inconsistent performance across environments. Overall, the HMRPGV analysis confirmed that the best-performing genotypes combined high yield, stability, and broad adaptability, with genotypes 108, 203, 306, and 201 standing out as the most promising candidates for genetic improvement and recommendation.
The analysis revealed that genotype 108 stood out with the highest VCU and the highest HMRPGV, confirming it as the most productive and broadly adapted genotype in the population. Genotypes 203, 201, 306, 303, 305, 304, 109, 104, 205, 207, 106, and 307 also clustered in the quadrant of higher yield and adaptability (Figure 6). The genotype 302 combined a relatively high VCU and a low HMRPGV, indicating a lesser adaptability but a high productivity potential. Genotype 209 was the only one classified as adaptable, due to its slightly above-average HMRPGV but with lower performance (relatively low VCU). The remaining genotypes showed both low productivity and low adaptability, placing them as the least promising candidates for selection to transitional altitude environments.
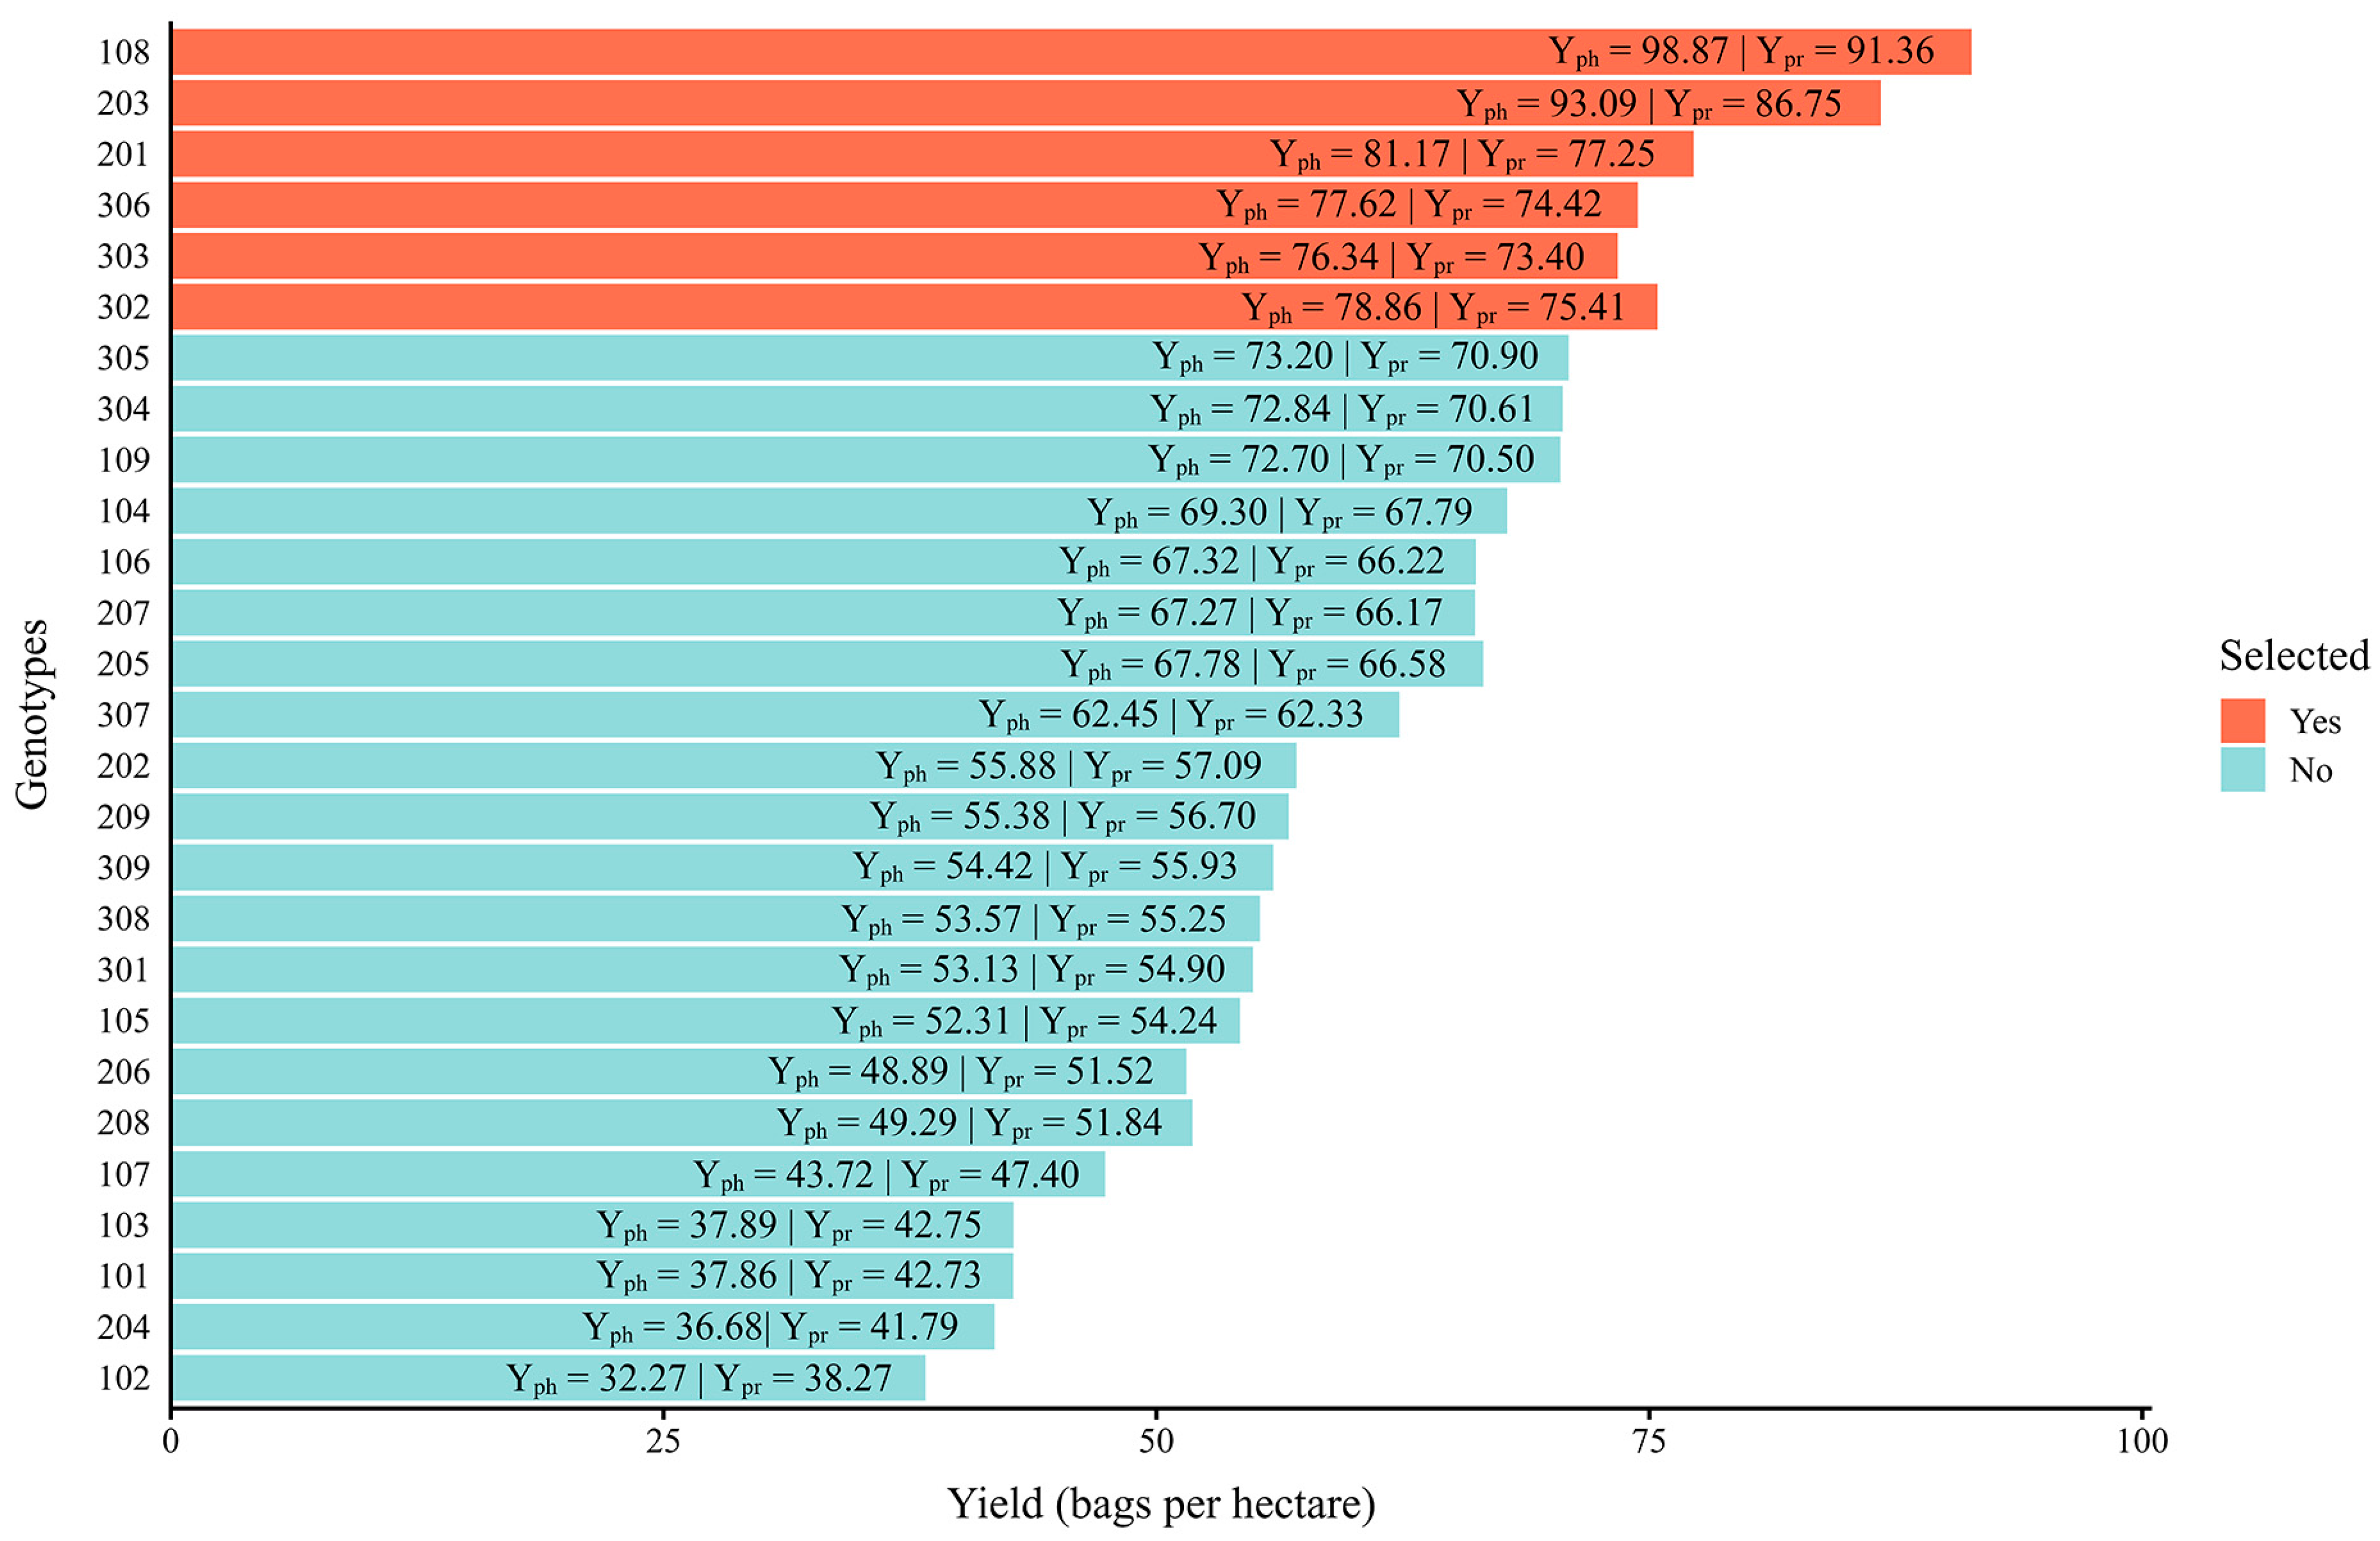
The multi-trait selection index indicated six genotypes for their outstanding combination of yield, adaptability, and stability: 108, 203, 201, 306, 303, and 302 (Figure 7). Genotype 108 achieved the highest score, confirming its superior performance across both environmental and temporal conditions. Genotypes 203 and 201 also exhibited strong overall performance. The genotype 302, despite a lower relative adaptability, was retained due to its very competitive yield; this weighting shows the capacity of the proposed index to balance multiple traits, penalizing instability but still valuing yield. This result highlights the efficiency of multi-trait selection indices in identifying a limited set of promising genotypes, aligning with recommended selection intensities. Overall, the proposed selection index provided a robust framework for prioritizing genotypes that combine high crop yield, broader adaptability, and consistent performance across multiple years and management conditions.
Changing the weighting scheme used in the selection index (by altering the coefficients in Equation (4)) would result in a new ranking. This could be done in order to further penalize instability or low performance; however, in the current research, the used weighting scheme was consistent for both a global selection or an irrigation-based selection, with only minor shifts in the overall top-performing genotypes.
The crop yields observed among these genotypes are significantly high, even though they include years of canopy renovation during the pruning cycle, when the plants present limited production while new orthotropic stems are getting established, and the long-term period of evaluation (eight harvests). Additionally, the weighting scheme used in the selection index was able to capture temporal stability (discussed in Figure 4 and Figure 5) and bring gains for bienniality. The selected genotypes exhibited lower mean yield bienniality compared with the remaining genotypes. Across four biennial cycles (2018–2019, 2020–2021, 2022–2023, and 2024–2025), the average bienniality of the six selected genotypes (Figure 7) was 36.9%, whereas the remaining genotypes showed a mean of 43.4%, representing a 15% reduction in bienniality for the selected group. As yield bienniality is strongly associated with genetic background [35], these results indicate that genetic gains through selection can effectively mitigate this trait. It is also noteworthy that this effect could be managed agronomically in order to further decrease its impact on the crop yield over the years [34,35].
The predicted genetic gains for crop yield with the selection based on the proposed index was 5.05 bags per hectare, corresponding to an 8.17% (resulting in 66.90 bags per hectare) improvement relative to the original population, which represents a meaningful enhancement in productivity achievable through targeted breeding for transitional altitude. These results highlight the effectiveness of this selection protocol, where combining yield performance across multiple environments and years [30,31] allows for the identification of genotypes with high adaptability and stability.
The cycles required for breeding programs of perennial crops are often lengthy, normally taking at least 25 years for C. canephora [45]; therefore, the application of sophisticated statistical models and comprehensive selection indices offers promising avenues to accelerate genetic improvement of the species and the recommendation of genotypes for transitional altitudes. These results enrich the available knowledge for cultivation in transitional altitudes and may lead to new recommendations. To this end, multi-environmental studies including locations with non-favorable rainfall conditions should be prioritized.
Based on the multi-trait selection index used in this research, the trustworthiness of the data and the scientific consistence, the six selected genotypes (108, 203, 201, 306, 303, and 302) are indicated for cultivation at transitional altitudes and will contribute to more sustainable, competitive and resilient coffee crops, especially considering the current challenges caused by climate change.

4. Conclusions

The long-term evaluation of 27 Coffea canephora genotypes under distinct water management regimes at transitional altitude (650 m) provided valuable insights into the genetic and environmental factors shaping yield performance, adaptability, and stability. The use of a three-way mixed model (REML/BLUP) effectively captured genotypic variability and genotype × environment interactions, revealing that temporal variation had a greater influence on productivity than spatial (irrigation-related) effects.
The moderate heritability, high selective accuracy, and broad genetic variation observed confirm the feasibility of genetic improvement for yield at transitional altitudes, which was even possible for a group of genotypes previously selected for yield and beverage quality for lowlands.
The multi-trait index identified six outstanding genotypes, 108, 203, 201, 306, 303, and 302, which combined high yield, broad adaptability, and temporal stability, resulting in an expected genetic gain of 8.17%. These findings demonstrate that selected C. canephora genotypes are well adapted to transitional altitudes, supporting breeding programs for climate-resilient and high-yielding crops.
Overall, this study reinforces the potential of transitional altitude regions as viable environments for C. canephora cultivation. It highlights the effectiveness of advanced statistical modeling and multi-trait selection strategies as key tools for accelerating genetic gains and supporting the sustainable expansion of robusta coffee production under changing climatic scenarios.

Author Contributions

Conceptualization, T.V.C., W.N.R. and M.A.T.; methodology, T.V.C. and W.N.R.; software, W.N.R. and J.F.d.B.S.; validation, T.V.C., W.N.R., J.F.d.B.S. and J.D.C.R.; formal analysis, T.V.C., W.N.R. and J.F.d.B.S.; investigation, T.V.C. and W.N.R.; resources, M.C.E., J.F.T.d.A. and M.A.T.; data curation, T.V.C. and W.N.R.; writing—original draft preparation, T.V.C. and W.N.R.; writing—review and editing, T.V.C., W.N.R. and M.A.T.; visualization, T.V.C., W.N.R. and M.C.E.; supervision, J.F.T.d.A., J.D.C.R. and M.A.T.; project administration, T.V.C. and M.A.T.; funding acquisition, J.F.T.d.A., M.C.E. and M.A.T. All authors have read and agreed to the published version of the manuscript.

Funding

This research was funded by Fundação de Amparo à Pesquisa e Inovação do Espírito Santo (FAPES) grant number Edital 20/2022—Chamada de Apoio a Núcleos Capixabas Emergentes em Pesquisa.

Data Availability Statement

The original contributions presented in this study are included in the article. Further inquiries can be directed to the corresponding author.

Acknowledgments

The authors would like to thank José Augusto Demartini Landi and his Family for granting access to the plantation, as well as the Centro de Ciências Agrárias e Engenharias of the Universidade Federal do Espírito Santo (CCAE/UFES) for providing access to the necessary facilities and laboratories and Fundação de Amparo à Pesquisa e Inovação do Espírito Santo (FAPES) for providing aid to the research. The last author would like to acknowledge the research fellowship granted by Conselho Nacional de Desenvolvimento Científico e Tecnológico (CNPq)—Edital PQ—2021 (Process No. 316070/2021-1). Additional funding support by FCT—Fundação para a Ciência e a Tecnologia, I.P., Portugal, through the projects UID/00239/2025 (DOI: 10.54499/UID/00239/2025) and UID/PRR/00239/2025 (DOI: 10.54499/UID/PRR/00239/2025), both of the Forest Research Centre, the UID/04035/2025 (DOI: 10.54499/UID/04035/2025), of the GeoBioSciences, GeoTechnologies and GeoEngineering Unit, and the LA/P/0092/2020 (DOI: 10.54499/LA/P/0092/2020) of the Associate Laboratory TERRA, is also greatly acknowledged. The authors would also like to thank the Instituto Capixaba de Pesquisa, Assistência Técnica e Extensão Rural (Incaper) for providing propagation material for the genotypes from their matrix-plants.

Conflicts of Interest

The authors declare no conflicts of interest.

Abbreviations

The following abbreviations are used in this manuscript:
CwaHumid subtropical with hot summers and dry winters
SNPCServiço Nacional de Proteção de Cultivares
MAPAMinistério da Agricultura e Pecuária
REMLRestricted maximum likelihood
BLUPBest linear unbiased prediction
BLUEBest linear unbiased estimation
VCUValue of cultivation and use
LRTLikelihood ratio test
WAASBWeighted average of absolute scores of BLUPs
HMRPGVHarmonic mean of the relative performance of genotypic values
μOverall mean
σ g 2 Genetic variance
σ g y 2 Genotype × Year interaction variance
σ g l 2 Genotype × Regimen interaction variance
σ g l y 2 Genotype × Regimen × Year interaction variance
σ p e r m 2 Permanent environmental variance
σ e 2 Residual variance
σ p 2 Phenotypic variance
h 2 Broad-sense heritability
ρ Coefficient of repeatability
C V g Genetic coefficient of variation
C V e Experimental coefficient of variation
C V r Relative coefficient of variation
C i n t G L Determination coefficient for the Genotype × Regimen interaction
C i n t G A Determination coefficient for the Genotype × Year interaction
C i n t G L A Determination coefficient for the Genotype × Regimen × Year interaction
C P Permanent determination coefficient
r G L Genotypic correlation across water regimes
r G A Genotypic correlation across years
r G L A Genotypic correlation across regimes and years
r ^ g g Selective accuracy
PEVPrediction error variance
SEPStandard error of prediction
AICAkaike information criterion
BICBayesian information criterion
YphPhenotypic means
YprPredicted genetic values

References

  1. Campuzano-Duque, L.F.; Herrera, J.C.; Ged, C.; Blair, M.W. Bases for the establishment of Robusta coffee (Coffea canephora) as a new crop for Colombia. Agronomy 2021, 11, 2550. [Google Scholar] [CrossRef] [Scilit]
  2. Kath, J.; Byrareddy, V.M.; Craparo, A.; Nguyen-Huy, T.; Mushtaq, S.; Cao, L.; Bossolasco, L. Not so robust: Robusta coffee production is highly sensitive to temperature. Glob. Change Biol. 2020, 26, 3677–3688. [Google Scholar] [CrossRef] [Scilit]
  3. Bezerra, C.S.; Tomaz, J.C.; Valente, M.S.F.; Espindula, M.C.; Marques, R.L.S.; Tadeu, H.C.; Ferreira, F.M.; Silva, G.S.; Meneses, C.H.S.G.; Lopes, M.T.G. Phenotypic diversity and genetic parameters of Coffea canephora clones. Plants 2023, 12, 4052. [Google Scholar] [CrossRef] [Scilit]
  4. Ferrão, R.G.; Ferrão, M.A.G.; Fonseca, A.F.A.; Ferrão, L.F.V.; Pacova, B.E.V. Coffea canephora breeding. In Conilon Coffee, 3rd ed.; Ferrão, R.G., Fonseca, A.F.A., Ferrão, M.A.G., DeMuner, L.H., Eds.; Incaper: Vitória, Brazil, 2019; pp. 145–201. [Google Scholar]
  5. Partelli, F.L.; Marré, W.B.; Falqueto, A.R.; Vieira, H.D.; Cavatte, P.C. Seasonal vegetative growth in genotypes of Coffea canephora, as related to climatic factors. J. Agric. Sci. 2013, 5, 108–116. [Google Scholar] [CrossRef] [Scilit]
  6. Martins, M.Q.; Partelli, F.L.; Golynski, A.; Pimentel, N.S.; Ferreira, A.; Bernardes, C.O.; Ribeiro-Barros, A.I.; Ramalho, J.D.C. Adaptability and stability of Coffea canephora genotypes cultivated at high altitude and subjected to low temperature during the winter. Sci. Hortic. 2019, 252, 238–242. [Google Scholar] [CrossRef] [Scilit]
  7. Gomes, L.C.; Bianchi, F.J.J.A.; Cardoso, I.M.; Fernandes, R.B.A.; Fernandes Filho, E.I.; Schulte, R.P.O. Agroforestry systems can mitigate the impacts of climate change on coffee production: A spatially explicit assessment in Brazil. Agric. Ecosyst. Environ. 2020, 294, e106858. [Google Scholar] [CrossRef] [Scilit]
  8. Venâncio, L.P.; Filgueiras, R.; Mantovani, E.C.; Amaral, C.H.; Cunha, F.F.; Silva, F.C.S.; Althoff, D.; Santos, R.A.; Cavatte, P.C. Impact of drought associated with high temperatures on Coffea canephora plantations: A case study in Espírito Santo State, Brazil. Sci. Rep. 2020, 10, e19719. [Google Scholar] [CrossRef] [Scilit] [PubMed]
  9. Ovalle-Rivera, O.; Läderach, P.; Bunn, C.; Obersteiner, M.; Schroth, G. Projected shifts in Coffea arabica suitability among major global producing regions due to climate change. PLoS ONE 2015, 10, e0124155. [Google Scholar] [CrossRef] [Scilit]
  10. Ferrão, M.A.G.; Riva-Souza, E.M.; Azevedo, C.; Volpi, P.S.; Fonseca, A.F.A.; Ferrão, R.G.; Montagnon, C.; Ferrão, L.F.V. Robust and smart: Inference on phenotypic plasticity of Coffea canephora Reveals Adaptation to Alternative Environments. Crop Sci. 2024, 64, 2709–2724. [Google Scholar] [CrossRef] [Scilit]
  11. Taques, R.C.; Dadalto, G.G. Agroclimatic zoning for conilon coffee culture in the state of Espírito Santo. In Conilon Coffee, 3rd ed.; Ferrão, R.G., Fonseca, A.F.A., Ferrão, M.A.G., DeMuner, L.H., Eds.; Incaper: Vitória, Brazil, 2019; pp. 71–83. [Google Scholar]
  12. Alvares, C.A.; Stape, J.L.; Sentelhas, P.C.; Gonçalves, J.L.M.; Sparovek, G. Köppen’s climate classification map for Brazil. Meteorol. Z. 2013, 22, 711–728. [Google Scholar] [CrossRef] [Scilit]
  13. Santos, H.G.; Jacomine, P.K.T.; Anjos, L.H.C.; Oliveira, V.A.; Lumbreras, J.F.; Coelho, M.R.; Almeida, J.A.; Araujo Filho, J.C.; Oliveira, J.B.; Cunha, T.J.F. Sistema Brasileiro de Classificação de Solos, 5th ed.; Embrapa: Brasília, Brazil, 2018. [Google Scholar]
  14. Fonseca, A.F.A.; Verdin Filho, A.C.; Ronchi, C.P.; Volpi, P.S.; Lani, J.A.; Guarçoni, A.; Ferrão, M.A.G.; Ferrão, R.G. Management of conilon coffee cultivation: Planting, spacing, pruning and pinching. In Conilon Coffee, 3rd ed.; Ferrão, R.G., Fonseca, A.F.A., Ferrão, M.A.G., DeMuner, L.H., Eds.; Incaper: Vitória, Brazil, 2019; pp. 327–359. [Google Scholar]
  15. Jordaim, R.B.; Colodetti, T.V.; Rodrigues, W.N.; Salles, R.A.; Amaral, J.F.T.; Maciel, L.S.; Partelli, F.L.; Ramalho, J.D.C.; Tomaz, M.A. Genotypic performance of Coffea canephora at transitional altitudes for climate-resilient coffee cultivation. Horticulturae 2025, 11, 595. [Google Scholar] [CrossRef] [Scilit]
  16. Rodrigues, R.R.; Pizetta, S.C.; Reis, E.F.; Garcia, G.O. Disponibilidade hídrica no solo no desenvolvimento inicial do cafeeiro conilon. Coffee Sci. 2015, 10, 46–55. [Google Scholar]
  17. Silva, J.S.; Verdin Filho, A.C.; Moreli, A.P.; Fonseca, A.F.A.; Ferrão, R.G.; Ferrão, M.A.G.; Volpi, P.S. Conilon coffee harvesting and post-harvesting. In Conilon Coffee, 3rd ed.; Ferrão, R.G., Fonseca, A.F.A., Ferrão, M.A.G., DeMuner, L.H., Eds.; Incaper: Vitória, Brazil, 2019; pp. 611–627. [Google Scholar]
  18. R Core Team. R: A Language and Environment for Statistical Computing; R Foundation for Statistical Computing: Vienna, Austria, 2024; Available online: https://www.R-project.org (accessed on 30 September 2025).
  19. Covarrubias-Pazaran, G. Genome-assisted prediction of quantitative traits using the R package Sommer. PLoS ONE 2016, 11, e0156744. [Google Scholar] [CrossRef] [Scilit]
  20. Henderson, C. Best linear unbiased estimation and prediction under a selection model. Biometrics 1975, 31, 423–447. [Google Scholar] [CrossRef] [Scilit]
  21. Bernardo, R. Genomewide selection with minimal crossing in self-pollinated crops. Crop Sci. 2010, 50, 624–627. [Google Scholar] [CrossRef] [Scilit]
  22. Self, S.G.; Liang, K. Asymptotic properties of maximum likelihood estimators and likelihood ratio tests under nonstandard conditions. J. Am. Stat. Assoc. 1987, 82, 605–610. [Google Scholar] [CrossRef]
  23. Stram, D.O.; Lee, J.W. Variance components testing in the longitudinal mixed effects model. Biometrics 1994, 50, 1171–1177. [Google Scholar] [CrossRef] [Scilit]
  24. Olivoto, T.; Lúcio, A.D.C.; Silva, J.A.G.; Marchioro, V.S.; Souza, V.Q.; Jost, E. Mean performance and stability in multi-environment trials I: Combining features of AMMI and BLUP techniques. Agron. J. 2019, 111, 2949–2960. [Google Scholar] [CrossRef] [Scilit]
  25. Resende, M.D.V. Matemática e Estatística na Análise de Experimentos e no Melhoramento Genético; Embrapa: Brasília, Brazil, 2007. [Google Scholar]
  26. Wickham, H. Ggplot2: Elegant Graphics for Data Analysis, 2nd ed.; Springer: Berlin/Heidelberg, Germany, 2016; Available online: https://ggplot2-book.org/ (accessed on 30 September 2025).
  27. Companhia Nacional de Abastecimento. Acompanhamento da Safra Brasileira: Café; Conab: Brasília, Brazil, 2025. Available online: https://www.gov.br/conab/pt-br/atuacao/informacoes-agropecuarias/safras/safra-de-cafe/3o-levantamento-de-cafe-safra-2025/boletim-cafe-setembro-2025 (accessed on 30 September 2025).
  28. Thioune, E.H.; Strickler, S.R.; Gallagher, T.F.; Charpagne, A.; Decombes, P.; Osborne, B.; McCarthy, J. Temperature impacts the response of Coffea canephora to decreasing soil water availability. Trop. Plant Biol. 2020, 13, 236–250. [Google Scholar] [CrossRef] [Scilit]
  29. Resende, M.D.V.; Alves, R.S. Linear, generalized, hierarchical, bayesian and random regression mixed models in genetics/genomics in plant breeding. Funct. Plant Breed. J. 2020, 3, 121–152. [Google Scholar] [CrossRef] [Scilit]
  30. Sakiyama, N.S.; Bikila, B.A. Estimation of genetic parameters in Coffea canephora var. Robusta. Adv. Crop Sci. Technol. 2017, 5, e310. [Google Scholar] [CrossRef]
  31. Mistro, J.C.; Resende, M.D.V.; Fazuoli, L.C.; Vencovsky, R. Effective population size and genetic gain expected in a population of Coffea canephora. Crop Breed. Appl. Biotechnol. 2019, 19, 1–7. [Google Scholar] [CrossRef] [Scilit]
  32. Begna, T. The role of genotype by environmental interaction in plant breeding. J. Nat. Sci. Res. 2020, 11, 9–18. [Google Scholar] [CrossRef] [Scilit]
  33. Beksisa, L. Genotype x environment interaction and its stability measures; major emphasis in arabica coffee: A review. Adv. Life Sci. Technol. 2021, 89, 1–9. [Google Scholar] [CrossRef] [Scilit]
  34. Cilas, C.; Bouharmont, P.; Bar-Hen, A. Yield stability in Coffea canephora from diallel mating designs monitored for 14 years. Heredity 2003, 91, 528–532. [Google Scholar] [CrossRef] [Scilit] [PubMed]
  35. Rodrigues, W.N.; Tomaz, A.T.; Ferrão, R.G.; Ferrão, M.A.G.; Fonseca, A.F.A.; Martins, L.D. Crop yield bienniality in groups of genotypes of conilon coffee. Afr. J. Agric. Res. 2013, 8, 4422–4426. [Google Scholar] [CrossRef] [Scilit]
  36. Marie, L.; Abdallah, C.; Campa, C.; Courtel, P.; Bordeaux, M.; Navarini, L.; Lonzarich, V.; Bosselmann, A.S.; Turreira-García, N.; Alpizar, E.; et al. G × E interactions on yield and quality in Coffea arabica: New F1 hybrids outperform American cultivars. Euphytica 2020, 216, e78. [Google Scholar] [CrossRef] [Scilit]
  37. Partelli, F.L.; Silva, F.A.; Covre, A.M.; Oliosi, G.; Corrêa, C.C.G.; Viana, A.P. Adaptability and stability of Coffea canephora to dynamic environments using the Bayesian approach. Sci. Rep. 2022, 12, e11608. [Google Scholar] [CrossRef] [Scilit]
  38. Covre, A.M.; Silva, F.A.; Oliosi, G.; Corrêa, C.C.G.; Viana, A.P.; Partelli, F.L. Multi-environment and multi-year bayesian analysis approach in Coffea canephora. Plants 2022, 11, 3274. [Google Scholar] [CrossRef] [Scilit] [PubMed]
  39. Ngure, G.M.; Watanabe, K.N. Coffee sustainability: Leveraging collaborative breeding for variety improvement. Front. Sustain. Food Syst. 2024, 8, e1431849. [Google Scholar] [CrossRef] [Scilit]
  40. Piza, M.R.; Luz, S.R.O.T.; Andrade, V.T.; Figueiredo, V.; Rezende, J.C.; Bruzi, A.T.; Botelho, C.E. Multiple traits selection strategies: A proposal for coffee plant breeding. Agronomy 2023, 13, 2033. [Google Scholar] [CrossRef] [Scilit]
  41. Cooke, R.J.; Reeves, J.C. Plant genetic resources and molecular markers: Variety registration in a new era. Plant Genet. Resour. 2003, 1, 81–87. [Google Scholar] [CrossRef] [Scilit]
  42. Yang, C.J.; Russell, J.; Ramsay, L.; Thomas, W.; Powell, W.; Mackay, I. Overcoming barriers to the registration of new plant varieties under the DUS system. Commun. Biol. 2021, 4, e302. [Google Scholar] [CrossRef] [Scilit] [PubMed]
  43. Adunola, P.; Ferrão, M.A.G.; Ferrão, R.G.; Fonseca, A.F.A.; Volpi, P.S.; Comério, M.; Verdin Filho, A.C.; Muñoz, P.; Ferrão, L.F.V. Genomic selection for genotype performance and environmental stability in Coffea canephora. G3 Genes Genomes Genet. 2023, 13, jkad062. [Google Scholar] [CrossRef] [Scilit]
  44. Santos, A.; Ceccon, G.; Teodoro, P.E.; Correa, A.M.; Alvarez, R.C.; Silva, J.F.; Alves, V.B. Adaptability and stability of erect cowpea genotypes via REML/BLUP and GGE biplot. Plant Breed. 2016, 75, 299–306. [Google Scholar] [CrossRef] [Scilit]
  45. Gamboa-Becerra, R.; Hernández-Hernández, M.C.; González-Ríos, Ó.; Suárez-Quiroz, M.L.; Gálvez-Ponce, E.; Ordaz-Ortíz, J.J.; Winkler, R. Metabolomic markers for the early selection of Coffea canephora plants with desirable cup quality traits. Metabolites 2019, 9, 214. [Google Scholar] [CrossRef] [Scilit]
Figure 1. Accumulated monthly rainfall and monthly air temperature from January 2015 to August 2025 (above) and annual and monthly averages (below), as monitored in the field at transitional altitude (650 m), in Alegre, Espírito Santo state, Brazil. * from January to August 2025.
Horticulturae 12 00207 g001
Figure 2. Value for cultivation and use (VCU) and confidence intervals for crop yield of 27 genotypes of C. canephora, evaluated at transitional altitude (650 m), across eight harvests (2018–2025).
Horticulturae 12 00207 g002
Figure 3. Phenotypic means (Yph) and predicted genetic values (Ypr) of crop yield (bags 60 kg of processed coffee per hectare) of 27 genotypes of C. canephora across eight harvests (2018–2025), cultivated at transitional altitude (650 m) and in the fully irrigated plot.
Horticulturae 12 00207 g003
Figure 4. Phenotypic means (Yph) and predicted genetic values (Ypr) of crop yield (bags 60 kg of processed coffee per hectare) of 27 genotypes of C. canephora across eight harvests (2018–2025), cultivated at transitional altitude (650 m) and in the minimally irrigated plot.
Horticulturae 12 00207 g004
Figure 5. Biplot of weighted average of absolute scores from the predicted genetic values (WAASB) for spatial and temporal effects for crop yield of 27 genotypes of C. canephora, evaluated in two conditions (fully or minimally irrigated), over eight years (2018–2025), at transitional altitude (650 m).
Horticulturae 12 00207 g005
Figure 6. Biplot of value for cultivation and use (VCU) and predicted adaptability by the harmonic mean of the relative performance of genotypic values (HMRPGV) of crop yield of 27 genotypes of C. canephora, evaluated in two conditions (fully or minimally irrigated), over eight years (2018–2025), at transitional altitude (650 m).
Horticulturae 12 00207 g006
Figure 7. Order of selection index (from top to bottom) of 27 genotypes of C. canephora cultivated at transitional altitude (650 m) across eight harvests (2018–2025) and two conditions of water availability, showing the overall phenotypic means (Yph) and predicted genetic values (Ypr) for crop yield (bags 60 kg of processed coffee per hectare).
Horticulturae 12 00207 g007
Table 1. Estimates of variance components and genetic parameters for crop yield of 27 genotypes of C. canephora, evaluated in two water management regimes (fully or minimally irrigated), at transitional altitude (650 m), across eight harvests (2018–2025).
Component/ParameterUnitValue
Overall mean ( μ )bags per hectare61.8562
Genetic variance ( σ g 2 ) 235.0075
Genotype × Year interaction variance ( σ g y 2 ) 342.1841
Genotype × Regimen interaction variance ( σ g l 2 ) 8.9555
Genotype × Regimen × Year interaction variance ( σ g l y 2 ) 171.3709
Permanent environmental variance ( σ p e r m 2 ) 6.3183
Residual variance ( σ e 2 ) 69.4099
Phenotypic variance ( σ p 2 ) 833.2462
Broad-sense heritability ( h 2 ) 0.2820
Coefficient of repeatability ( ρ ) 0.3004
Genetic coefficient of variation ( C V g )%24.7832
Experimental coefficient of variation ( C V e )%13.4688
Relative coefficient of variation ( C V r ) 1.8401
Determination coefficient for the Genotype × Regimen interaction ( C i n t G L ) 0.0107
Determination coefficient for the Genotype × Year interaction ( C i n t G A ) 0.4107
Determination coefficient for the Genotype × Regimen × Year interaction ( C i n t G L A ) 0.2057
Permanent determination coefficient ( C P ) 0.0076
Genotypic correlation across regimes ( r G L ) 0.9633
Genotypic correlation across years ( r G A ) 0.4072
Genotypic correlation across regimes and years ( r G L A ) 0.5783
Selective accuracy ( r ^ g g ) 0.9650
Prediction error variance (PEV)bags per hectare7.9547
Standard error of prediction (SEP)bags per hectare2.8204
Table 2. Deviance and likelihood ratio test (LRT) for the crop yield of 27 genotypes of C. canephora, evaluated in two water management regimes (fully or minimally irrigated), at transitional altitude (650 m), across eight harvests (2018–2025).
EffectAICBICLog-likehoodLRT Deviance
Genotype−2045.10−1996.001031.5532.61 **
Genotype × Regimen−2076.55−2027.461047.281.16
Genotype × Year−1973.94−1924.85995.97103.77 **
Genotype × Regimen × Year−1381.00−1331.91699.50696.71 **
Permanent−2054.23−2005.131036.1123.48 **
Complete model−2077.71−2028.621047.85
** Significant at 1% of probability, based on the χ 2 test with one degree of freedom. AIC = Akaike information criterion. BIC = Bayesian information criterion.
Disclaimer/Publisher’s Note: The statements, opinions and data contained in all publications are solely those of the individual author(s) and contributor(s) and not of MDPI and/or the editor(s). MDPI and/or the editor(s) disclaim responsibility for any injury to people or property resulting from any ideas, methods, instructions or products referred to in the content.