Article

Phenotypic and Phytochemical Variations in Wolfberry Varieties and Their Harvest Times

1
State Key Laboratory of Tree Genetics and Breeding, Nanjing Forestry University, Nanjing 210037, China
2
Wolfberry Science Research Institute, Ningxia Academy of Agriculture and Forestry Sciences, Yinchuan 750002, China
3
Co-Innovation Center for the Sustainable Forestry in Southern China, Nanjing 210037, China
*
Author to whom correspondence should be addressed.
Horticulturae 2025, 11(9), 1138; https://doi.org/10.3390/horticulturae11091138
Submission received: 15 August 2025 / Revised: 7 September 2025 / Accepted: 17 September 2025 / Published: 18 September 2025

Abstract

Lycium barbarum L. is a perennial deciduous shrub used for centuries as a traditional medicinal and food supplement in China. In this study, we investigated the effects of variety and harvest time on the phenotypic and phytochemical variations in goji berry fruits to optimize harvest strategies, select superior goji varieties, and improve market competitiveness of the goji industry. Both field investigations and laboratory analyses were conducted to evaluate yield, phenotypic traits, and nutritional indicators during the summer and autumn of 2024. Both variety and harvest time significantly affected most traits investigated, with strong interaction effects. Overall, summer-harvested fruits, which account for 78% to 100% of the total production per plant, had higher contents of Lycium barbarum polysaccharides and carotenoids than those harvested in autumn. A comprehensive evaluation using the TOPSIS method demonstrated that the fruits harvested in early July generally exhibited superior overall quality. Among the tested varieties, the ‘5-6’ variety consistently displayed outstanding fruit quality across all harvest times and showed very good prospects for application and extension in commercial production when compared to the other varieties. Our findings not only provide valuable insights into the comprehensive evaluations of different goji berry varieties but also highlight the importance of identifying optimal harvest times based on the sensory quality and nutritional value for each goji variety.

1. Introduction

Wolfberry (Lycium barbarum L.), also called goji berry, a perennial deciduous shrub in Solanaceae [1], is recognized for its strong ecological adaptability, with significant tolerance to salinity, alkalinity, and nutrient-poor soils [2,3,4], and grows at different altitudes, ranging from 700 to 2700 m [5]. Commercial goji berries are mainly produced in Ningxia, Xinjiang, Gansu, Qinghai, and Inner Mongolia in China [6]. It was reported that the cultivation area in Ningxia alone reached approximately 25,334 ha in 2022, with an impressive annual fresh fruit output of 300,000 tons [4]. As evaluated in recent reviews, the goji berry industry in Ningxia stands as the core production region, characterized by the most favorable foundational infrastructure, fully integrated production elements, robust scientific and technological support, and strong brand competitiveness [7,8]. Moreover, goji berry cultivation has expanded globally in recent decades, including countries across Europe, North America, and other parts of Asia [7]. The rapid development of the goji industry has not only played a key role in protecting and restoring fragile ecosystems in arid regions [9], but also significantly improved farmers’ financial performance, effectively boosted local economies, and served as an essential livelihood source for impoverished rural communities [10,11]. As a typical pioneer species for ecological greening, goji holds both ecological and economic values [7]. Goji berry is a typical traditional medicinal plant [12] and has been used as a traditional Chinese medicine for more than 2000 years [13]. Its reputed functions—nourishing the liver and kidneys, improving vision, and replenishing vital essence—have been validated through centuries of clinical use [14]. Modern pharmacological studies have further confirmed that goji berry fruits are rich in active compounds, including Lycium barbarum polysaccharides (LBPs), betaine, carotenoids, flavonoids, and medicinal amino acids. These constituents contribute to various biological functions, such as enhancing immune response, antioxidant activity, tumor suppression, and protection of the eyes, lungs, and kidneys [15]. Due to its diverse profiles of bioactive compounds, goji berry is now recognized as a valuable resource with both nutritional and medicinal potential, and it holds promising applications in functional food development and health-related industries.
As an indeterminate flowering species, goji is characterized by multiple rounds of flower bud differentiation and continuous flowering and fruiting within a single growing season [16,17]. Based on fruit maturation timing, goji production is generally divided into two main categories: summer (from late May to August) and autumn (from late September to mid-October). However, autumn is considered a less vigorous and unproductive season for the production of goji berries. For instance, Wan et al. reported that the second harvest time (e.g., July) in summer produced the highest fruit yield and the largest fruit size of goji, while different harvest times also affect the market quality of goji berry [18]. It was reported that the first batch of wolfberries harvested in summer had greater amounts of total sugar and flavonoids, whereas other nutrients peaked in the third batch [19]. Thus, determining an optimal harvest time for each variety is very important for producers to achieve high-quality and premium-priced goji fruits as well as for improving the economic performance and market competitiveness of the goji industry.
The commercial value of fruits is influenced by various factors, including biochemical composition and phenotypic features such as size, shape, and visual appearance. In goji berry, the appearance of the dried fruit plays a critical role in consumer preference [20]. Phenotypic attributes such as fruit size, determined by longitudinal and transverse diameters, and color saturation, quantified by color parameters (L*, a*, b*), are critical indicators of dried fruit grade and consumer appeal during processing stages [21]. However, the accumulation of bioactive compounds in goji fruits underpins their dual function as food and medicine. Among these, LBP is most widely studied and recognized for its health-promoting properties [4]. LBPs, mainly composed of six monosaccharides, namely galactose (Gal), rhamnose, arabinose, glucose, mannose, and xylose [22], are glycopeptide chains consisting of acidic heteropolysaccharides and polypeptides or proteins. LBP has various physiological benefits, such as anti-ageing effects, improved blood function, and immune modulation [23,24]. Rutin, quercetin, and kaempferol have been reported as the main flavonoids in goji berry [25], which exhibits cardiovascular benefits including antioxidant, anti-inflammatory, and hypotensive effects, improved myocardial diastolic and systolic functions, lipid-lowering, and vasodilation of coronary arteries [25,26,27]. Moreover, zeaxanthin dipalmitate, the predominant carotenoid in L. barbarum, exhibits antioxidant activity far exceeding that of vitamin E [28,29] and serves as a natural pigment with antioxidative, immunomodulatory, ocular- and liver-protective, and anti-inflammatory properties, making it a promising candidate as a non-toxic food colorant [30].
However, the phytochemical contents in goji berry vary significantly across varieties, origins, and harvest times, with the variation approaching 30–50% in active constituents [30,31]. As a recognized authentic production region for goji berries, Ningxia has made continuous progress in new-variety development [31]; however, multiple factors, such as site conditions, genetic backgrounds of varieties, pre-harvest management practices, and harvest times, influence the quality of goji berries [21,32]. Indeed, fruit quality plays a crucial role in determining the market competitiveness of goji berries, but fruit quality is a complex trait affected by interactions among horticultural management, genotype, and environments [6]. Therefore, an integrated evaluation approach is required to assess the quality attributes of goji berries. However, systematic comparative studies on both phenotypic and nutritional characteristics for various varieties and harvest times remain limited. In this study, variations in phenotypic traits, yield per plant, and key nutritional components among goji berry varieties and their harvest times were systematically analyzed, and the Technique for Order Preference by Similarity to Ideal Solution (TOPSIS) method was then applied to derive the optimal harvest time, optimal variety, and comprehensive quality scores. The main purposes of this study are to figure out the phenotypic and phytochemical variations in some new breeding wolfberry varieties during their development stages while exposed to the same environment and management practice and to explore an integrated evaluation approach to assess the quality attributes of goji berries. The findings of this study could help fill gaps in basic information on new breeding goji genotypes, provide a scientific basis for improving the yield and quality of goji berry, and contribute to the high-quality development of the Ningxia goji industry.

2. Materials and Methods

2.1. Trial Site

The study was conducted at the goji berry cultivation base of the Luhuatai Forestry Station in Ningxia Hui Autonomous Region, China (38.65° N, 106.16° E). The experimental plantation was established in 2018. The detailed soil characteristics at the trial site are shown in Table 1. During the trial period, irrigation volume, irrigation schedule, and fertilization were consistent across all varieties.

2.2. Plant Materials

Seven varieties of goji berry were included in this study, all developed by the Qin Kan breeding team at the Ningxia Academy of Goji Research. These varieties are named ‘Ningqi No.1’ (hereafter referred to as N1), ‘Ningqi No.7’ (N7), ‘8-9’, ‘9-2’, ‘14-02’, ‘5-6’, and ‘Ningqi No.1 Yellow’ (N1H). Varieties N1 and N7 were bred using directed hybridization techniques. The ‘14-02’ variety is a clonal line selected from outstanding individual plants within a seedling population in a commercial goji orchard. Varieties ‘8-9’, ‘9-2’, and ‘5-6’ were developed from specific hybrid combinations, i.e., ‘0902 × 06-3-8’, ‘0903 × 0901’, and ‘0901 × 0902’, respectively. N1H is a bud mutation derived from N1. All experimental plants were six years old, planted at a spacing of 3 m × 1 m. A randomized block design was used, with 30 plants per variety and 10 plants per replicate.
For sampling, three trees were randomly selected in a triangular layout for each variety, and the three selected trees were sampled for each variety across all harvest times. Fruit samples (goji berry) were collected at six harvest times, i.e., 3 June (referred to as I), 11 June (II), 17 June (III), 25 June (IV), 3 July (V), and 12 October (VI) 2024, respectively. Fresh mature fruits for each variety were harvested during each harvest time, and the phenotypic traits of the sampled fruits were immediately measured after harvest. The remaining fruit samples were hot-air dried to constant weight, and then sealed and stored at –80 °C for subsequent analysis of key nutritional and functional compounds.

2.3. Phenotypic Trait Measurement

Fruit phenotypic traits, including berry length, berry width, fruit shape index (FSI = l e n g t h w i d t h ), and color parameters, were assessed using a MICROTEK flatbed scanner. Fresh fruits were scanned to obtain two-dimensional images, while the image analysis was conducted using the Wanseed Seed Analysis Software (SC-G V2.0) to extract quantitative data.
For fruit weight measurement, 50 g of fresh fruit from each sample was randomly weighed using a BS 224 S analytical balance (Sartorius, Göttingen, Germany). This process was repeated three times per sample. Both total weight and fruit count were recorded, and the average single fruit weight was calculated accordingly.
Fruit color parameters were measured using a chroma meter (CM-5, Konica Minolta, Tokyo, Japan), where L* represents lightness (brightness), a* indicates the red–green axis (positive values denote red, negative values green), and b* corresponds to the yellow–blue axis (positive values denote yellow, negative values blue).

2.4. Determination of Nutritional Characteristics

2.4.1. Polysaccharide Content

The content of polysaccharides was measured using the phenol–sulfuric acid colorimetric assay. In brief, an appropriate amount of dried fruit sample was subjected to ultrasonic extraction with 80% ethanol to remove interfering substances, followed by a second extraction with distilled water. The resulting supernatant was reacted with phenol–sulfuric acid reagent and cooled in a water bath, and then the absorbance was measured at 490 nm. The polysaccharide content was determined based on a glucose calibration curve and expressed as glucose equivalents.

2.4.2. Total Flavonoid Content

Total flavonoid content was determined using the aluminum nitrate colorimetric method. Briefly, an appropriate amount of dried fruit powder was extracted with 75% ethanol under ultrasonic treatment. The extract was reacted with aluminum nitrate and sodium hydroxide, and absorbance was measured at 510 nm. Rutin was used as the standard to generate a calibration curve, and results were expressed as milligrams of rutin equivalents per gram of dry weight (mg/g DW).

2.4.3. Carotenoid Content

Carotenoids were extracted under dark conditions using a mixture of acetone and petroleum ether (1:4, v/v). The absorbance of the extract was measured at 450 nm using a spectrophotometer, and the carotenoid content was calculated based on the absorbance values.
All biochemical analyses were performed in three biological replicates, and results are presented as mean ± standard deviation.

2.5. Multi-Criteria Assessment

In this study, the TOPSIS method was employed to comprehensively evaluate the superiority of goji berry quality across different varieties and harvest times. A total of 11 indicators were selected for the analysis, including single plant yield, berry length, berry width, fruit shape index, single fruit weight, fruit color parameters (L*, a*, and b*), polysaccharide content, total flavonoid content, and carotenoid content. All indicators were treated as positive criteria and incorporated into the TOPSIS model to calculate comprehensive scores. The criteria values were standardized using the following equation, where X i j represents the value of the j-th indicator for the i-th variety, and p i j represents the value after dimensionless processing, which is used to eliminate the influence of indicator dimensions [33]:
p i j = X i j i = 1 n X i j 2
Then, the positive and negative ideal ( Z j + , Z j ) solutions were determined using Equations (2) and (3).
Z j + = m a x ( Z 1 j , Z 2 j , , Z n j , ) ,   j   =   { 1 ,   2 ,   ,   n |   is   associated   with   the   positive   criteria }
Z j = m i n ( Z 1 j , Z 2 j , , Z n j , ) ,   j   =   { 1 ,   2 ,   ,   n |   is   associated   with   the   positive   criteria }
In the subsequent stage, the division of every option from the positive and negative perfect arrangement ( d i + , d i ) is given as follows, where z i j represents the standardized value of the i-th evaluation object on the j-th evaluation indicator after standardization processing:
d i + = j = 1 n ( z i j z j + ) 2 ,   ( i   =   1 ,   2 ,   ,   m )
d i = j = 1 n ( z i j z j ) 2 ,   ( i   =   1 ,   2 ,   ,   m )
In the final step, the TOPSIS procedure is used to calculate the relative intimacy ( C i ) to the perfect result and to rank the performance order, according to Equation (6):
C i = d i d i + d i + ,   ( i   =   1 ,   2 ,   ,   m )

2.6. Statistical Analyses

Data processing and statistical analyses were performed using Excel and SPSS version 27.0 (IBM Corp., Armonk, NY, USA). Two-way analysis of variance (ANOVA) was conducted to evaluate the significance of differences among groups. Hierarchical clustering analysis was performed using the agglomerative clustering method. The TOPSIS comprehensive evaluation was conducted using SPSSPRO 1.0.11 (SPSSPRO Inc., Shanghai, China). All graphical representations were generated using Origin version 9.0 (Origin Lab Corp., Northampton, MA, USA).

3. Results

3.1. Variation in Fresh Fruit Yield per Plant

Two-way ANOVA indicated that both variety and harvest time significantly affected fruit yield per plant (summer yield + autumn yield), while a highly significant interaction was also observed between the two factors (p < 0.001, Table S1). Overall, the summer fruit yields were significantly higher than the autumn yields across all varieties, where the summer harvest yield for each variety accounted for 78% to 100% of the total production per plant (Figure 1b). Notably, no autumn fruits were harvested for the two varieties (i.e., ‘8-9’ and ‘9-2’).
During the summer season, no mature fruits were harvested in the first sampling time (e.g., 3 June) for four varieties, but varieties ‘N7’, ‘5-6’, and ‘8-9’ produced some mature fruits (Figure 1a), suggesting that various varieties show a different fruit development and ripening process, such as ‘N1’ exhibiting later fruiting onset. However, the peak yield per plant for all varieties was reached during the fifth harvest time (V, e.g., 3 July), where the yield accounted for 35% to 63% of the summer production per plant (Figure 1a). Figure 1 also showed that variety ‘N1H’ consistently showed lower yields across all harvest times. Compared to variety ‘N1H’, the total yield per plant in other varieties increased by 70–88%.

3.2. Variations in Phenotypic Characteristics

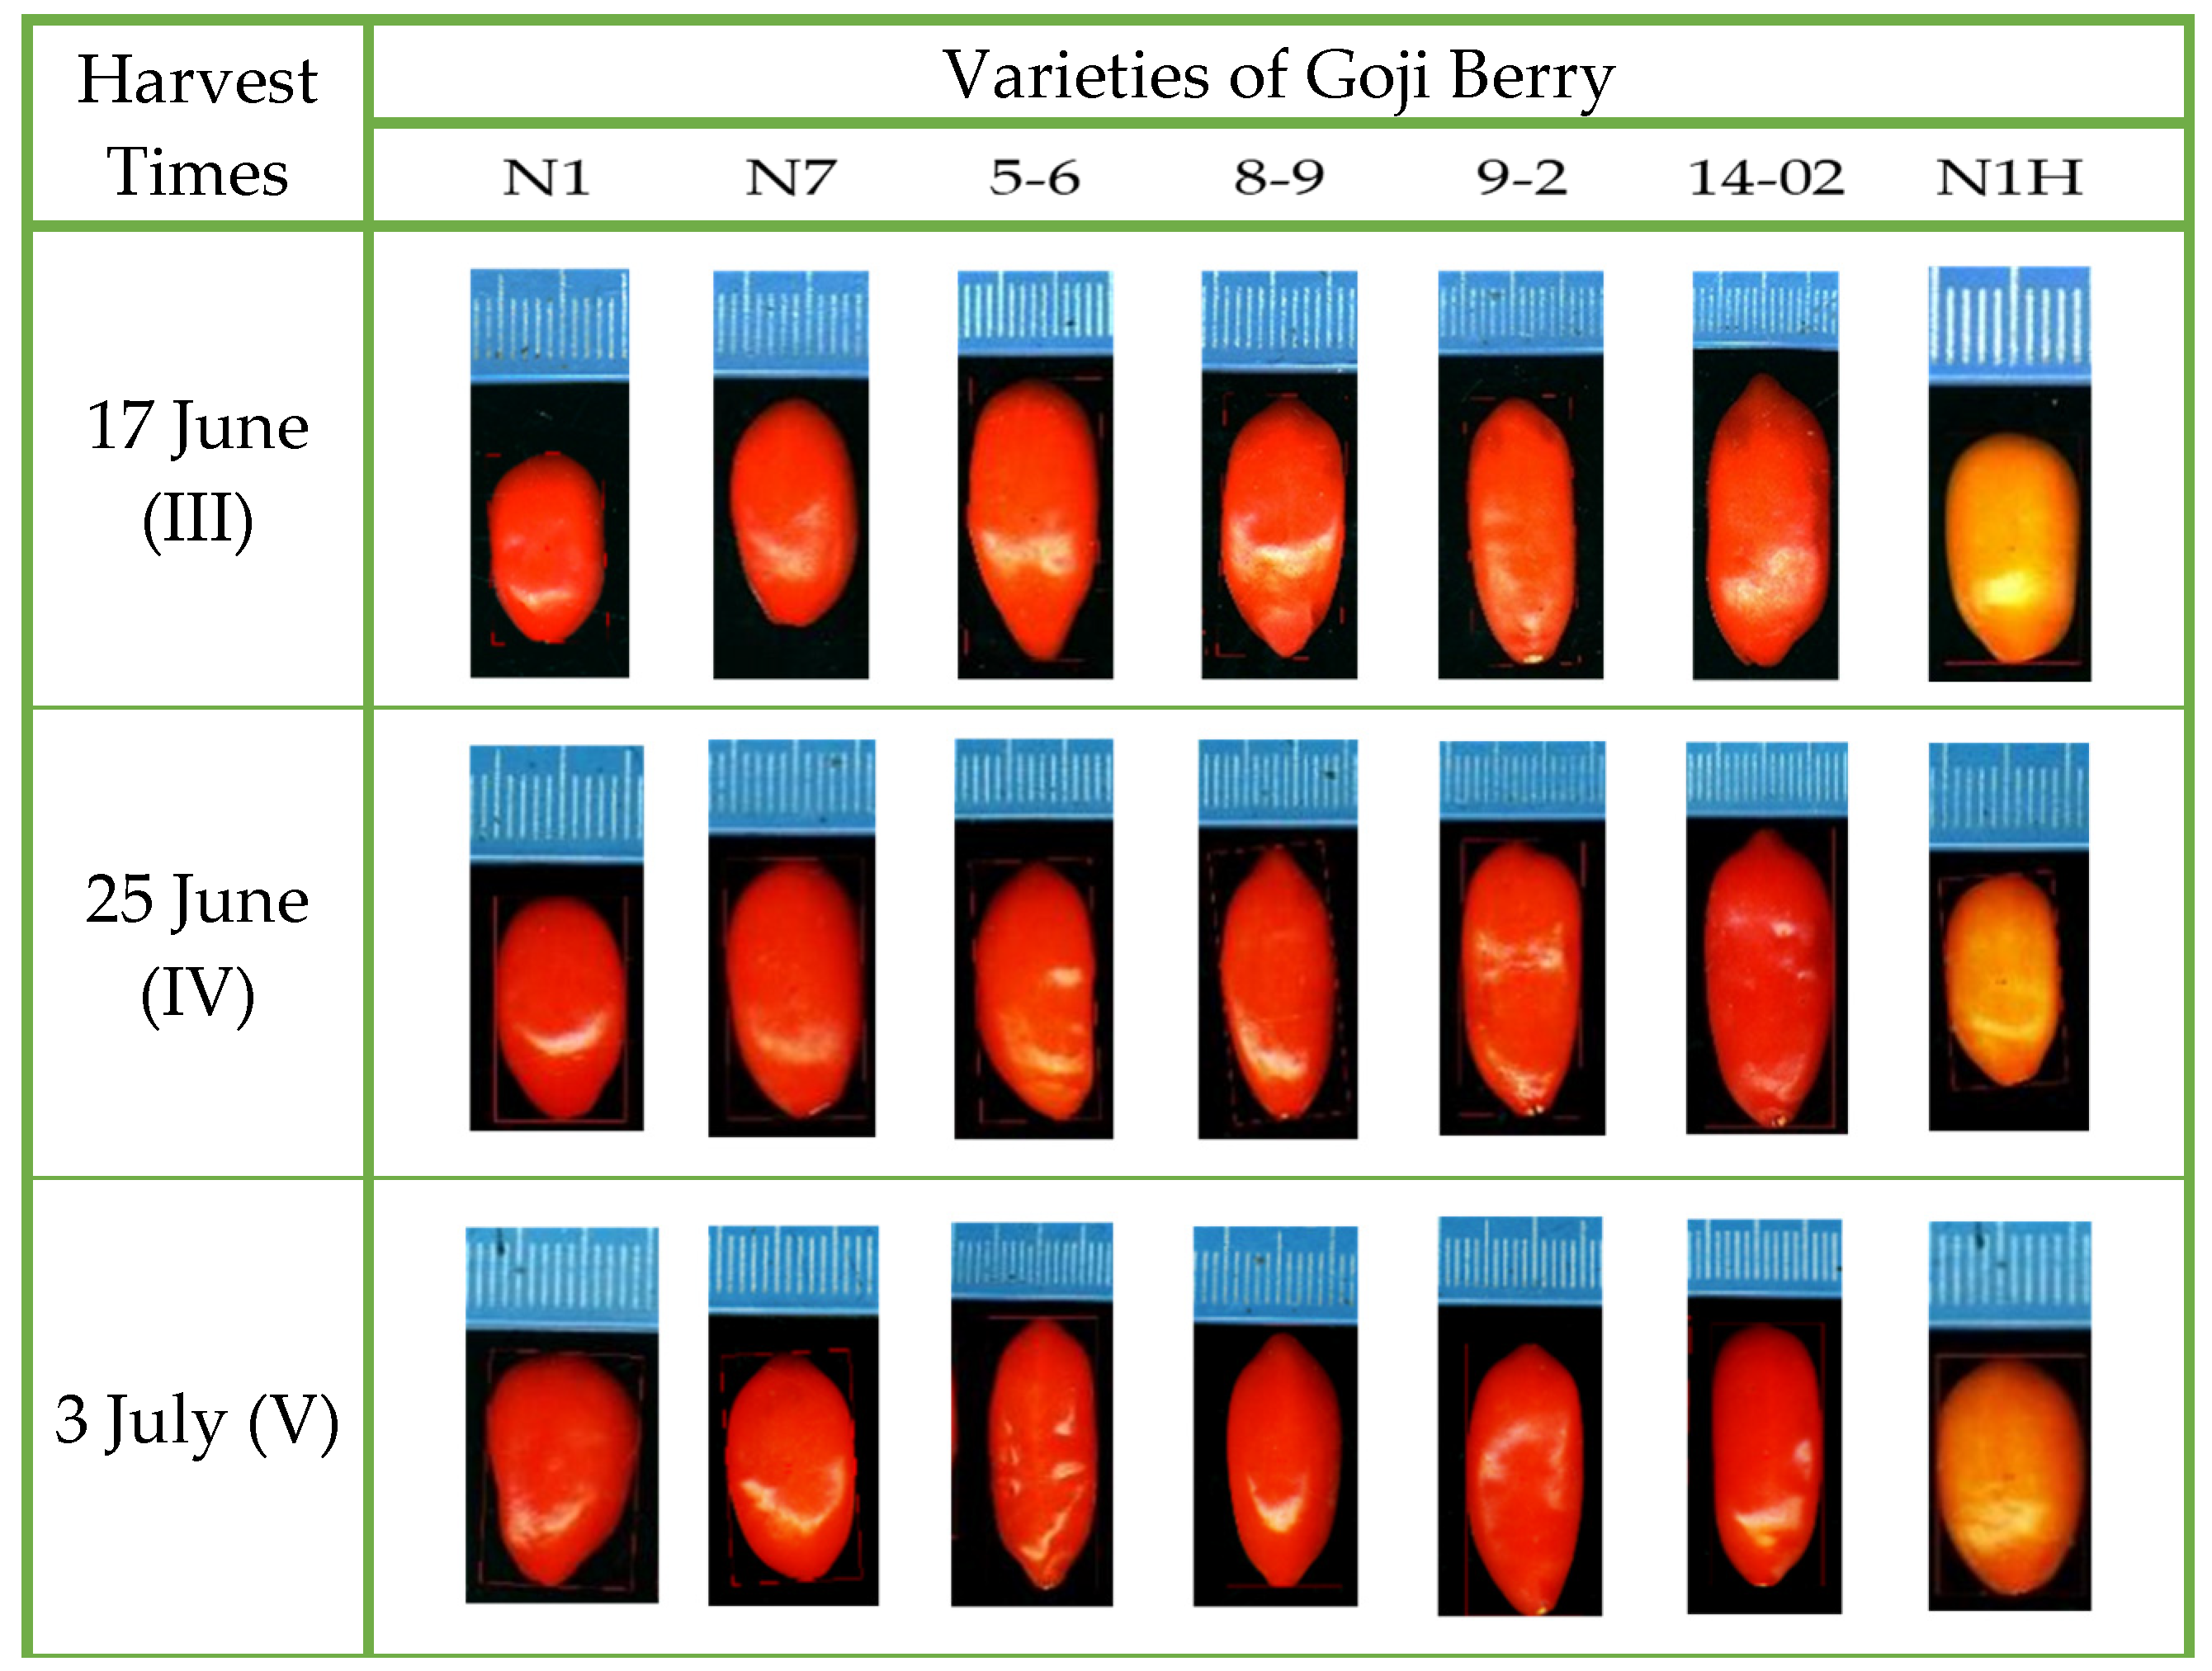
Based on the fruit yields per plant mentioned above, we focused on the fruit phenotypic traits harvested from III to V, and fresh fruit samples from each harvest were randomly selected and analyzed for key traits (Table 2 and Figure 2). Figure 2 presents the scanned images of goji berries in seven varieties harvested at the three harvest times, showing the distinct differences in phenotypic traits such as size, shape, and color straightforwardly.
Statistical analysis revealed that both variety and harvest time had significant effects on fruit berry length, berry width, shape index, and single berry weight (p < 0.001), with a highly significant interaction between the two factors (Table S2). In most case, both longitudinal and transverse diameters as well as fruit weight showed an increasing trend as harvesting time progressed (Table 2), whereas the fruit shape index (FSI) followed a “rise-then-decline” pattern, with all varieties reaching their highest shape index values at the IV. Variety ‘5-6’ exhibited the highest index (2.43), which is 3.28–28.69% greater than that of the other varieties, and showed a distinctly elongated elliptical morphology. In contrast, ‘N1’ had the lowest index (1.74), showing a broad elliptical fruit shape. These morphological differences are closely related to the inherent developmental patterns of goji berries, where longitudinal elongation predominates in the early stages, while lateral expansion becomes dominant in later stages, leading to dynamic changes in the fruit shape index over time. Genetic background also played a key role in fruit morphology. Varieties such as ‘5-6’ and ‘14-02’ consistently displayed a typical elongated elliptical shape, whereas ‘N1’, ‘N7’, and ‘N1H’ tended to produce broader, more rounded fruits.
All varieties exhibited a significant increase in single berry weight over the harvest period (p < 0.05, Table 2), even if the magnitude of increase varied among the genotypes. At the harvest time of V, the average single berry weight reached its maximum in all varieties. Notably, significant differences in fruit weight were also observed among the varieties. ‘N1H’, a yellow-fruited variety, had an average fruit weight of 0.61 g across III to V, which was 46.49% lower than the average weight of the red-fruited varieties (1.14 g). This discrepancy may be attributed to genetic factors and differences in the accumulation patterns of bioactive metabolites between the two fruit types.
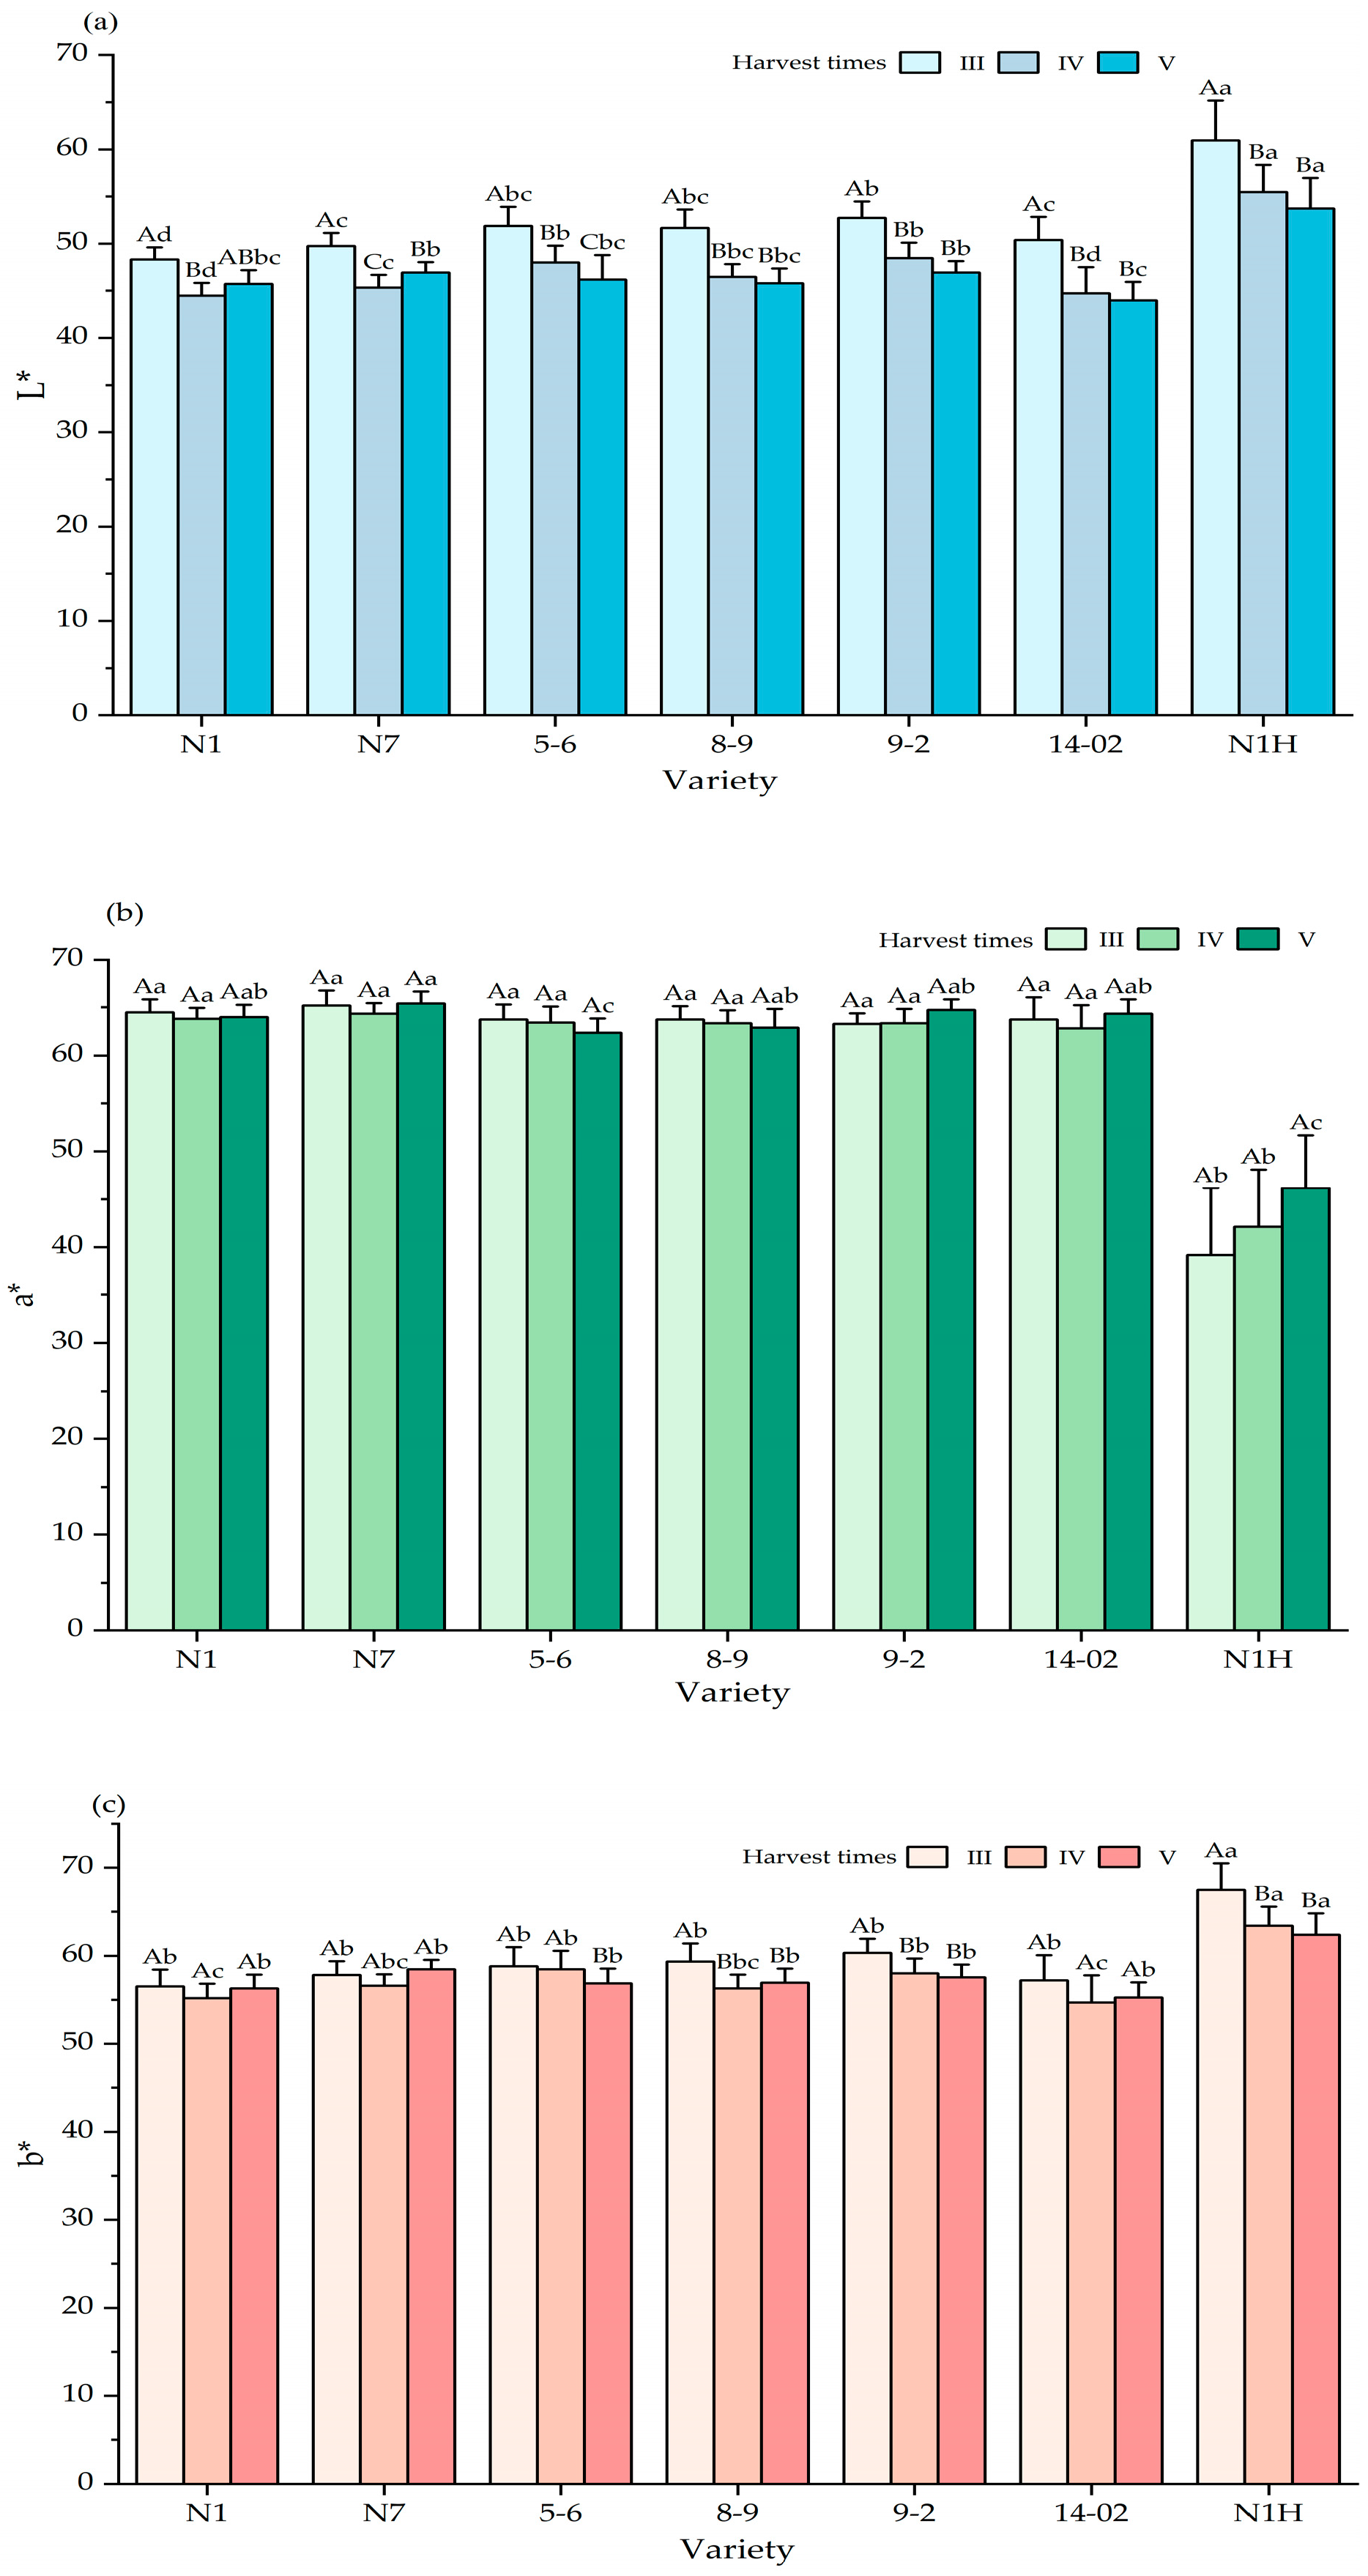
Two-way ANOVA indicated that both variety and harvest time had a significant effect on the L* value (p < 0.01), whereas the harvest time had no significant effect on a* and b* values (Table S3). A further analysis showed a highly significant difference in color parameters between the yellow-fruited variety (only N1H) and other red-fruited varieties (other six varieties) (p < 0.01, Figure 3), while color variation among the red-fruited varieties was relatively minor. These results suggest that fruit coloration in goji berries is primarily determined by genetic background, and less affected by harvest time.

3.3. Variations in Key Metabolites

Dried goji berry fruits from six harvest times (I–VI) were analyzed for their nutritional quality (Table 3). A two-way ANOVA revealed that both variety and harvest time had highly significant effects (p < 0.01) on contents of polysaccharides, flavonoids, and carotenoids, with a significant interaction between the two factors (p < 0.01, Table S4).
Polysaccharide contents varied substantially across varieties and harvest times. Variety ‘5-6’ exhibited the highest polysaccharide content at harvest time I (64.6 ± 1.27 mg·g−1), significantly outperforming all other varieties. While varieties such as ‘N1’, ‘N7’, and ‘N1H’ displayed relatively high polysaccharide contents at stage IV, most varieties showed a general decline in polysaccharide levels following the initial harvest. Notably, variety ‘9-2’ achieved its peak polysaccharide content during stage V (65.5 ± 2.21 mg·g−1).
Flavonoid contents also showed dynamic variations across varieties and harvest times. At the first harvest, variety ‘5-6’ exhibited a markedly elevated flavonoid level (9.53 mg·g−1), nearly three times higher than that of the other varieties. Most red-fruited varieties reached their peak flavonoids during early to mid-harvest times (II–III), after which the content gradually declined. In contrast, a yellow-fruited variety, ‘N1H’, consistently maintained high flavonoid levels across all stages, with a maximum of 17.58 mg·g−1 observed at stage VI, indicating its inherent high-flavonoid trait.
Similarly, carotenoid content was significantly influenced by both variety and harvest time. Red-fruited goji varieties generally exhibited higher carotenoid levels compared to yellow-fruited ones. ‘N7’ recorded the highest carotenoid content at stage I (1.01 mg·g−1), while variety ‘14-02’ reached a peak value of 1.80 mg·g−1 at stage IV, significantly surpassing all other varieties. In contrast, ‘N1H’ consistently exhibited low carotenoid levels throughout all harvest times. These results highlight both inter-variety differences and the regulatory effect of harvest timing on the accumulation of the key bioactive metabolites in goji berries.

3.4. Comprehensive Evaluation on Fruit Quality Using TOPSIS

Based on 11 key indicators measured, the comprehensive assessment of fruit quality across seven varieties and three harvest times was conducted using the TOPSIS method. According to the comprehensive scores (Table 4), overall, the fruits harvested at stage V exhibited superior integrated quality, due to an optimal balance among fruit yield, fruit morphology, and secondary metabolite accumulations of fruits at this stage. Notably, the variety ‘5-6’ consistently achieved high Ci scores across all harvest times, indicating its outstanding performance in terms of comprehensive fruit quality.
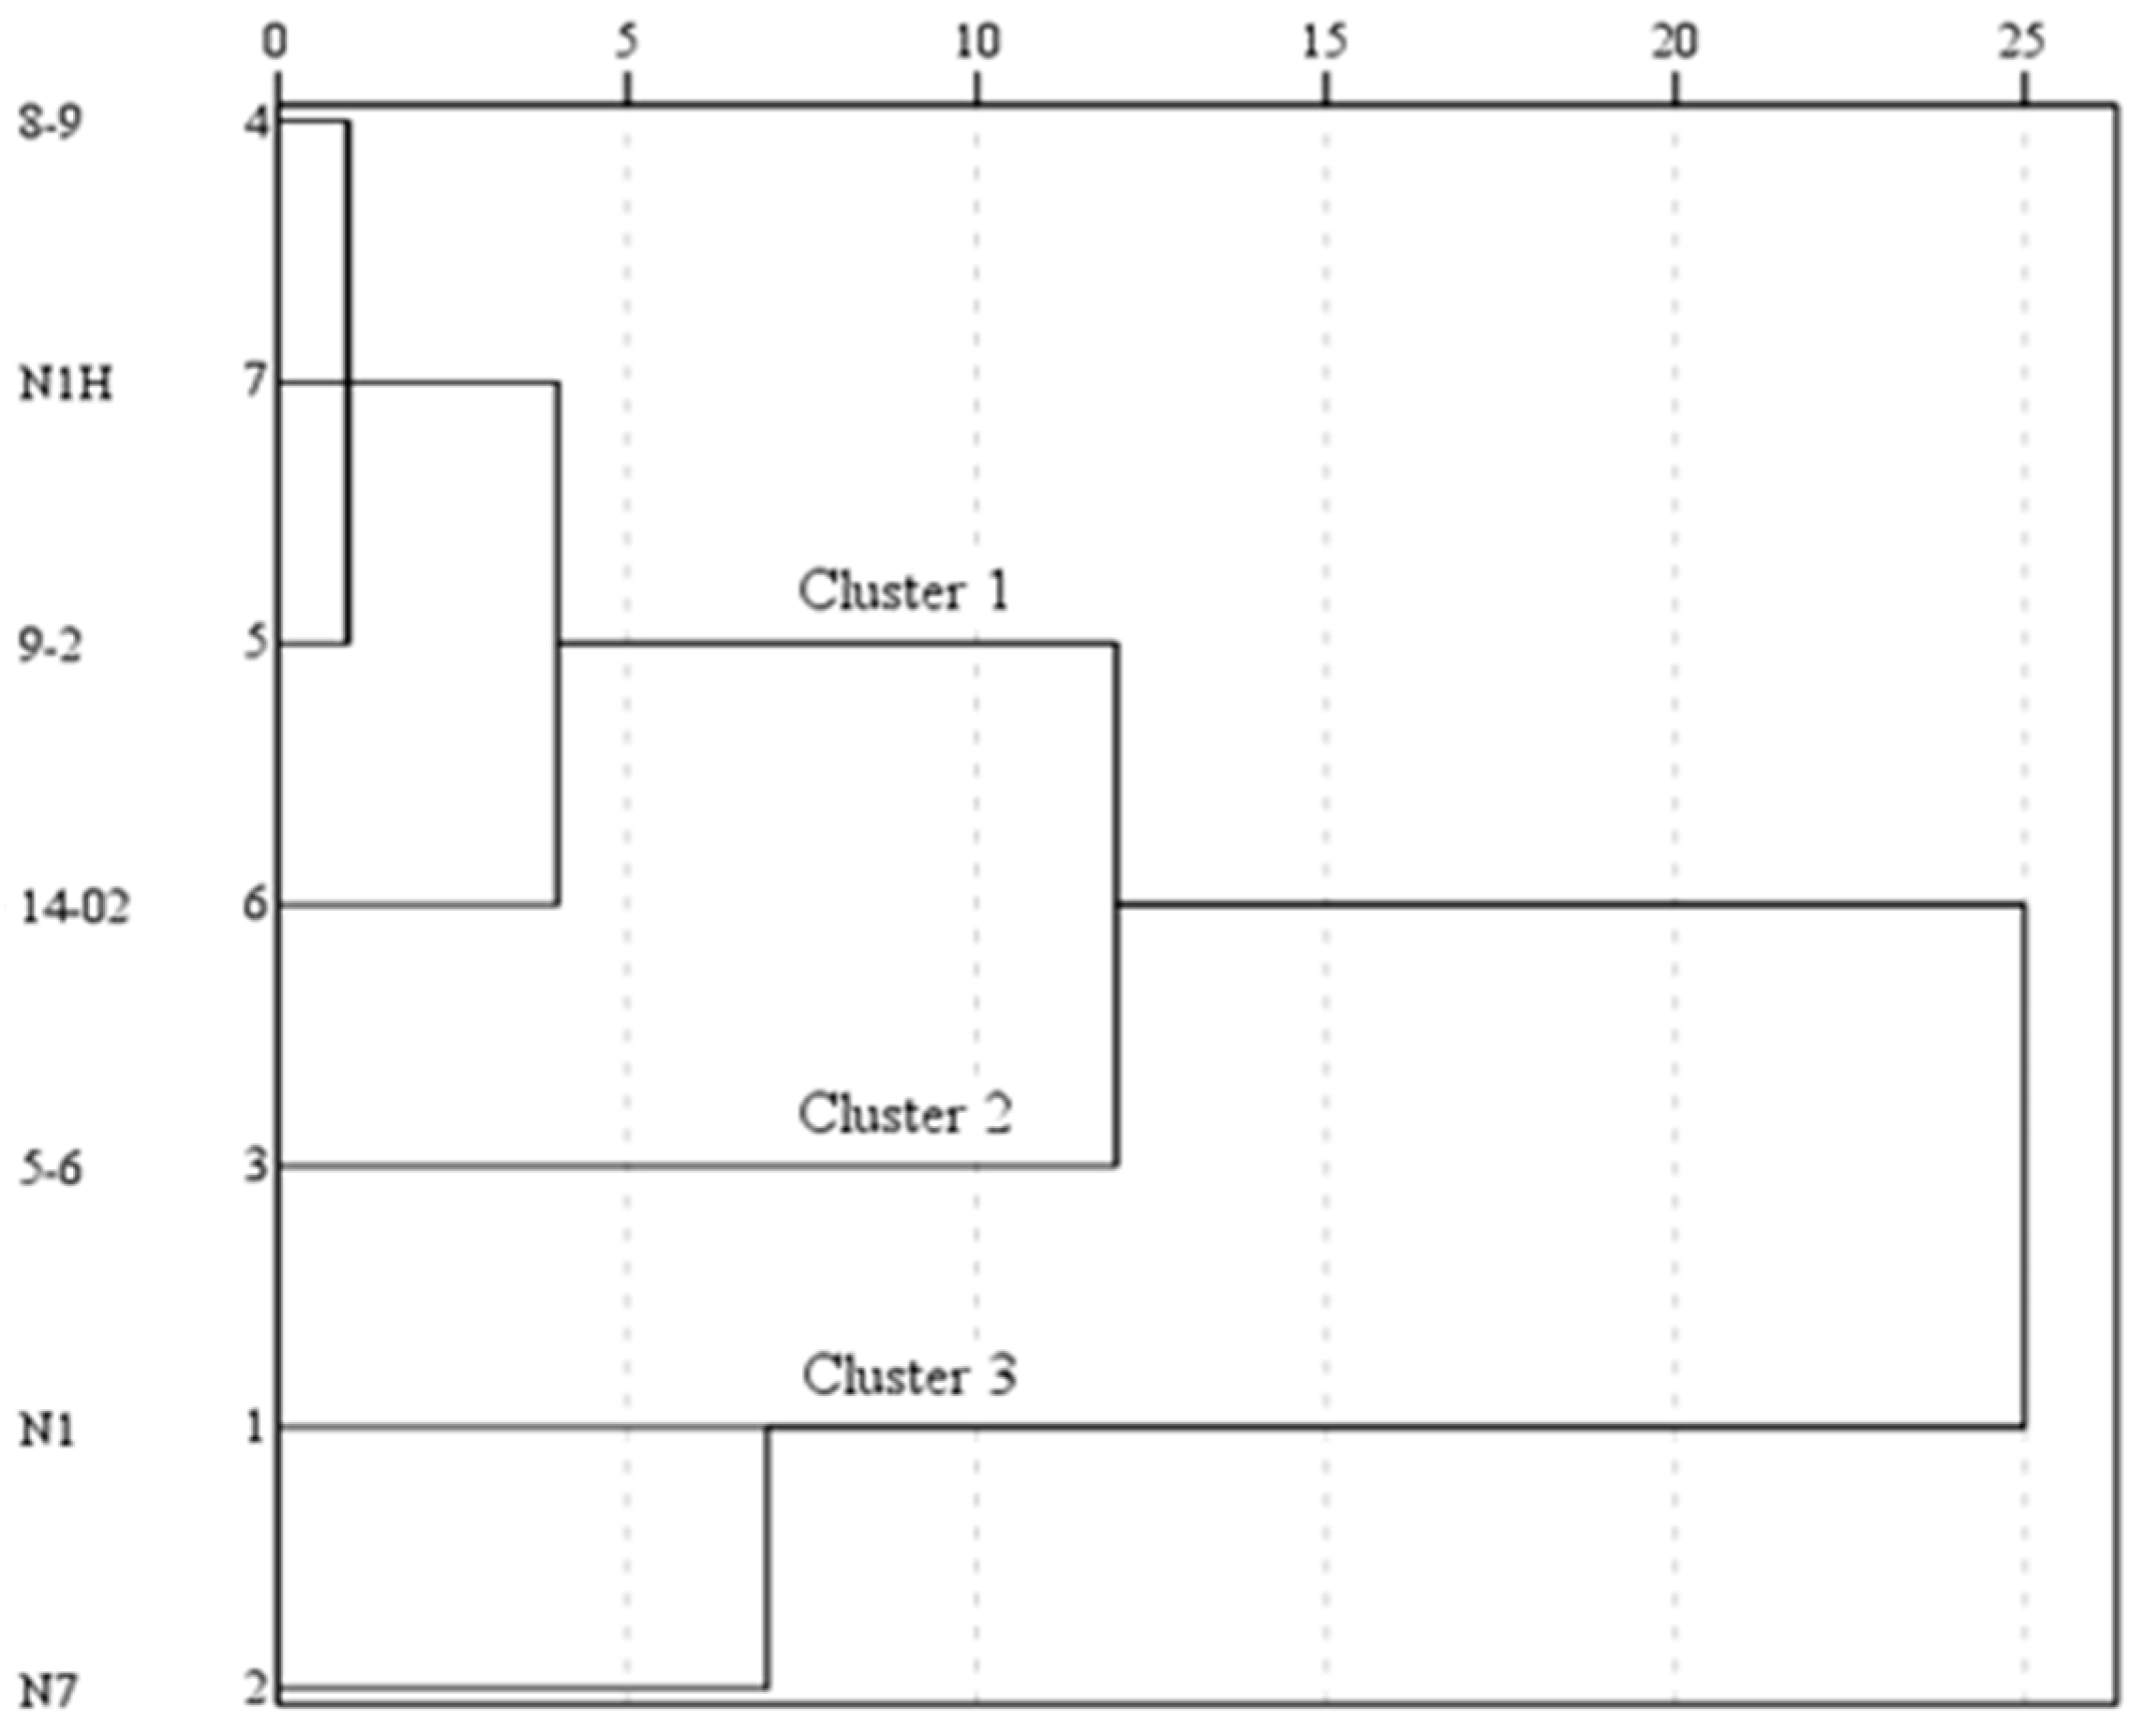
Hierarchical cluster analysis based on the Euclidean distances of the mean Ci values for each variety further grouped the seven varieties into three distinct clusters (Figure 4). Cluster I comprised four varieties, including ‘8-9’, ‘N1H’, ‘9-2’, and ’14-02’, with Ci values ranging from 0.4076 to 0.4485, reflecting an intermediate level of overall quality. Cluster II consisted solely of the ‘5-6’ variety, showing the highest Ci value (0.4838), indicating its superior performance in yield, fruit size, color attributes, and accumulation of bioactive compounds. Cluster III included two varieties of ‘N1’ and ‘N7’, with Ci values of 0.3747 and 0.3256 respectively, representing a relatively low overall fruit quality.

4. Discussion

Both external appearance and nutritional quality of goji berries influence market values and sustainable development in the goji berry industry [34]. This study evaluated seven representative goji varieties grown in Ningxia, China. Fruit samples were collected during the summer fruiting period (3 June to 3 July) and autumn fruiting period (12 October), and the yield, phenotypic traits, and nutritional quality were assessed. Marked genotypic differences were observed in yield performance (p < 0.05, Figure 1). However, no significant difference in total fruit yield per plant were detected among the four red-fruited varieties (e.g., ‘N1’, ‘8-9’, ‘5-6’ and ‘14-02’) (Figure 1b), while the yellow-fruited variety ‘N1H’ recorded the lowest yield. These results highlight the yield advantage of red-fruited varieties over yellow-fruited types. In terms of phenotypic variations, ‘5-6’ variety produced bright red and long elliptical fruits, whereas the ‘N1H’ produced smaller but more vivid yellow fruits (Figure 2).
Regarding nutritional attributes, the LBP contents, averaged from harvest times II to V, were ranked by variety as ‘9-2’ (56.78 mg·g−1) > ‘5-6’ (56.08 mg·g−1) > ‘8-9’ (55.48 mg·g−1) > ‘N7’ (53.80 mg·g−1)> ‘N1H’ (51.80 mg·g−1) > ‘N1’ (50.68 mg·g−1) > ‘14-02’ (48.75 mg·g−1), whereas ‘N1H’ accumulated significantly higher total flavonoids than other varieties, consistent with previous findings [4,35], where higher phenolic contents were reported in yellow-fruited goji varieties. Conversely, the red-fruited varieties generally exhibited higher polysaccharide levels, reflecting a color–genotype–metabolite linkage [36]. Overall, the present study showed that the red-fruited varieties typically demonstrated higher and more stable yields, more elongated fruit shapes, and greater accumulations of LBPs and carotenoids—traits associated with enhanced pharmacological functionality. It was reported that ‘N1’ has become the dominant commercial variety in China among the tested varieties, accounting for 80% of the total national production area [37], while ‘N7’ has emerged as a widely adopted alternative, particularly in Qinghai’s intensive production bases [38]. Despite a lower yield and smaller fruit size, yellow-fruited varieties like ‘N1H’ showed a higher flavonoid content, which could be selected as a valuable germplasm for functional and antioxidant applications in the future. However, a TOPSIS-based comprehensive evaluation in the present study revealed significant variations in integrated quality across genotypes and harvest times. Overall, the fruits harvested at the V stage exhibited superior comprehensive quality in most varieties, while the ‘5-6’ variety consistently achieved high quality across all harvest times (Table 4, Figure 4). These results suggest that the ‘5-6’ variety could have very good prospects for application and extension in commercial production.
Temporal variations in yield and quality were also evident among the goji varieties. However, the greatest yield per plant was observed at the V harvest time for all the varieties (Figure 1), while the single fruits harvested at the IV stage exhibited superior visual quality and were significantly larger and heavier than those from harvested at the V stage (Figure 2). Nutritionally, our study indicated that summer-harvested fruits had higher contents of LBPs and carotenoids than those harvested in autumn. While some studies have shown higher sugar and polysaccharide accumulations in late-season fruits [39], such discrepancies may stem from variety-specific responses and environmental variations. As autumn fruits are developed on the new “seven-inch” branches formed after summer pruning, the shorter nutrient accumulation periods and suboptimal environmental factors (low temperatures, reduced light, early frost) limit fruit set, development and quality. These findings emphasize the importance of optimizing cultivation strategies to enhance autumn yield and stabilize year-round production, which could improve the overall economic sustainability of the goji industry [40].
It is worth pointing out that the environment and management practices also influenced the phenotypic and phytochemical traits of the goji berry varieties [21,32]; thus, it is hard to reveal the effects of the genotype x environment (GxE) interaction on the quality and yield traits based on one site investigation. Some goji berry varieties may perform well in one environment but poorly in another due to specific environmental variations. Thus, field trials with more sites and multiple-year investigation should be conducted in the future based on this study to identify the superior varieties and their best harvest times for each cultivation region.

5. Conclusions

Both variety and harvest time had significant effects on the fruit yield per plant, phenotypic traits, and nutritional attributes (p < 0.001). Overall, summer-harvested fruits had higher contents of LBPs and carotenoids than those harvested in autumn, whereas the greatest yield per plant was achieved on 3 July (at the harvest stage V) for all the varieties. A comprehensive evaluation using the TOPSIS method also demonstrated that the fruits harvested during harvest stage V generally exhibited superior overall quality. However, among the tested varieties, ‘5-6’ consistently displayed outstanding fruit quality across all harvest times, showing very good prospects for application and extension in commercial production. The findings from the study not only fill gaps in basic information on new breeding goji genotypes and provide valuable insights for comprehensive evaluations of different goji berry varieties but also highlight the importance of each variety in identifying optimal harvest times that maximize both sensory quality and nutritional values.

Supplementary Materials

The following supporting information can be downloaded from https://www.mdpi.com/article/10.3390/horticulturae11091138/s1, Table S1: Two-way ANOVA of total yield per plant of goji berries across different varieties and harvest times; Table S2: Two-way ANOVA of phenotypic characteristics of goji berries across different varieties and harvest times; Table S3. Two-way ANOVA of color parameters of goji berries across different varieties and harvest times; Table S4: Two-way ANOVA of bioactive metabolites of goji berries across different varieties and harvest times.

Author Contributions

Conceptualization, S.F. and R.W.; Methodology, R.W. and Y.Z.; Investigation, Y.Z., R.W., and L.Y.; Resources, Z.S.; Data curation, Y.Z. and L.Y.; Writing—original draft preparation, Y.Z.; Writing—review and editing, S.F.; Funding acquisition, Z.S. and R.W.; Supervision, S.F. All authors have read and agreed to the published version of the manuscript.

Funding

This work was supported by the Key R & D plan project of Ningxia Hui Autonomous Region (2023BCF01033).

Data Availability Statement

The data presented in this study are available on request from the corresponding author.

Conflicts of Interest

The authors declare no conflicts of interest.

References

  1. Kulczyński, B.; Gramza-Michałowska, A. Goji Berry (Lycium barbarum): Composition and Health Effects—A Review. Pol. J. Food Nutr. Sci. 2016, 66, 67–75. [Google Scholar] [CrossRef]
  2. Zhang, Z.; He, K.; Zhang, T.; Tang, D.; Li, R.; Jia, S. Physiological Responses of Goji Berry (Lycium barbarum L.) to Saline-alkaline Soil from Qinghai Region, China. Sci. Rep. 2019, 9, 12057. [Google Scholar] [CrossRef]
  3. Yang, Z.; Dai, G.; Qin, K.; Wu, J.; Wang, Z.; Wang, C. Comprehensive Evaluation of Germplasm Resources in Various Goji Cultivars Based on Leaf Anatomical Traits. Forests 2025, 16, 187. [Google Scholar] [CrossRef]
  4. Shi, X.; Wang, X.; Zheng, Y.; Fu, L. Advances in the Study of Bioactive Compounds and Nutraceutical Properties of Goji Berry (Lycium barbarum L.). Appl. Sci. 2024, 15, 262. [Google Scholar] [CrossRef]
  5. Gündüz, E.; Dursun, R.; Zengin, Y.; İçer, M.; Durgun, H.M.; Kanıcı, A.; Kaplan, İ.; Alabalık, U.; Gürbüz, H.; Güloğlu, C. Lycium barbarum Extract Provides Effective Protection against Paracetamol-induced Acute Hepatotoxicity in Rats. Int. J. Clin. Exp. Med. 2015, 8, 7898–7905. [Google Scholar] [PubMed]
  6. Lu, Y.; Guo, S.; Zhang, F.; Yan, H.; Qian, D.W.; Shang, E.X.; Wang, H.Q.; Duan, J.A. Nutritional Components Characterization of Goji Berries from Different Regions in China. J. Pharm. Biomed. Anal. 2021, 195, 113859. [Google Scholar] [CrossRef] [PubMed]
  7. Yu, J.; Yan, Y.; Zhang, L.; Mi, J.; Yu, L.; Zhang, F.; Lu, L.; Luo, Q.; Li, X.; Zhou, X. A Comprehensive Review of Goji Berry Processing and Utilization. Food Sci. Nutr. 2023, 11, 7445–7457. [Google Scholar] [CrossRef]
  8. Yossa Nzeuwa, I.B.; Guo, B.; Zhang, T.; Wang, L.; Ji, Q.; Xia, H.; Sun, G. Comparative Metabolic Profiling of Lycium Fruits (Lycium barbarum and Lycium chinense) from Different Areas in China and from Nepal. J. Food Qual. 2019, 2019, 4396027. [Google Scholar] [CrossRef]
  9. Wang, Y.; Zhao, C.; Ma, Q.; Li, Y.; Jing, H.; Sun, T.; Milne, E.; Easter, M.; Paustian, K.; Yong, H.W.A. Carbon Benefits of Wolfberry Plantation on Secondary Saline Land in Jingtai Oasis, Gansu—A Case Study on Application of the CBP Model. J. Environ. Manag. 2015, 157, 303–310. [Google Scholar] [CrossRef]
  10. Jiang, Y.; Chen, Q.; Wei, N. Determining the Impact Bruising of Goji Berry Using a Pendulum Method. Horticulturae 2025, 11, 14. [Google Scholar] [CrossRef]
  11. Yao, R.; Heinrich, M.; Wang, Z.; Weckerle, C.S. Quality Control of Goji (Fruits of Lycium barbarum L. and L. chinense Mill.): A Value Chain Analysis Perspective. J. Ethnopharmacol. 2018, 224, 349–358. [Google Scholar] [CrossRef]
  12. Chung, R.; Chen, C.; Ng, L. Nitrogen Fertilization Affects the Growth Performance, Betaine and Polysaccharide Concentrations of Lycium barbarum. Ind. Crop. Prod. 2010, 32, 650–655. [Google Scholar] [CrossRef]
  13. Xue, J.; Lu, Y.; He, J.; Xie, M.; He, K.; Wang, H. Lycium barbarum Studies: A System Review on Molecular Biology, Cultivation, and Quality Characteristics of Goji Berries. Biochem. Syst. Ecol. 2025, 121, 105020. [Google Scholar] [CrossRef]
  14. Amagase, H.; Farnsworth, N.R. A Review of Botanical Characteristics, Phytochemistry, Clinical Relevance in Efficacy and Safety of Lycium barbarum Fruit (Goji). Food Res. Int. 2011, 44, 1702–1717. [Google Scholar] [CrossRef]
  15. Sharifi-Rad, J.; Quetglas-Llabrés, M.M.; Sureda, A.; Mardones, L.; Villagran, M.; Sönmez Gürer, E.; Živković, J.; Ezzat, S.M.; Zayed, A.; Gümüşok, S. Supercharging Metabolic Health with Lycium barbarum L.: A review of the Therapeutic Potential of This Functional Food for Managing Metabolic Syndrome. Food Front. 2024, 5, 420–434. [Google Scholar] [CrossRef]
  16. Gong, H.; Rehman, F.; Ma, Y.; A, B.; Zeng, S.; Yang, T.; Huang, J.; Li, Z.; Wu, D.; Wang, Y. Germplasm Resources and Strategy for Genetic Breeding of Lycium species: A review. Front. Plant Sci. 2022, 13, 802936. [Google Scholar] [CrossRef] [PubMed]
  17. Wang, C.; Qin, K.; Shang, X.; Gao, Y.; Wu, J.; Ma, H.; Wei, Z.; Dai, G. Mapping Quantitative Trait Loci Associated with Self-(in)compatibility in Goji Berries (Lycium barbarum). BMC Plant Biol. 2024, 24, 441. [Google Scholar] [CrossRef] [PubMed]
  18. Wan, R.; Shi, Z.; Li, Y.; Huang, T.; Cao, Y.; An, W.; Zhang, X.; Zhao, J.; Qin, K.; Wang, X. Effect of Potassium on the Agronomic Traits and Fruit Quality of Goji (Lycium barbarum L.). Sci. Rep. 2024, 14, 21477. [Google Scholar] [CrossRef]
  19. Liang, X.; An, W.; Li, Y.; Qin, X.; Zhao, J.; Su, S. Effects of Different Nitrogen Application Rates and Picking Batches on the Nutritional Components of Lycium barbarum L. Fruits. Front. Plant Sci. 2024, 15, 1355832. [Google Scholar] [CrossRef] [PubMed]
  20. Rehman, F.; Gong, H.; Li, Z.; Zeng, S.; Yang, T.; Ai, P.; Pan, L.; Huang, H.; Wang, Y. Identification of Fruit Size Associated Quantitative Trait Loci Featuring SLAF Based High-density Linkage Map of Goji Berry (Lycium spp.). BMC Plant Biol. 2020, 20, 474. [Google Scholar] [CrossRef]
  21. Huang, T.; Jia, N.; Zhu, L.; Jiang, W.; Tu, A.; Qin, K.; Yuan, X.; Li, J. Comparison of Phenotypic and Phytochemical Profiles of 20 Lycium barbarum L. Goji Berry Varieties During Hot Air-drying. Food Chem. 2025, 27, 102436. [Google Scholar] [CrossRef] [PubMed]
  22. Masci, A.; Carradori, S.; Casadei, M.A.; Paolicelli, P.; Petralito, S.; Ragno, R.; Cesa, S. Lycium barbarum Polysaccharides: Extraction, Purification, Structural Characterization and Evidence about Hypoglycaemic and Hypolipidaemic Effects. A Review. Food Chem. 2018, 254, 377–389. [Google Scholar] [CrossRef]
  23. Fakhfakh, J.; Athmouni, K.; Mallek-Fakhfakh, H.; Ayedi, H.; Allouche, N. Polysaccharide from Lycium arabicum: Structural Features, in vitro Antioxidant Activities and Protective Effect against Oxidative Damage in Human Erythrocytes. Chem. Biodivers. 2020, 17, e2000614. [Google Scholar] [CrossRef]
  24. Chang, R.; So, K.F. Use of Anti-aging Herbal Medicine, Lycium barbarum, against Aging-associated Diseases. What Do We Know So Far? Cell. Mol. Neurobiol. 2008, 28, 643–652. [Google Scholar] [CrossRef]
  25. Mocan, A.; Cairone, F.; Locatelli, M.; Cacciagrano, F.; Carradori, S.; Vodnar, D.C.; Crișan, G.; Simonetti, G.; Cesa, S. Polyphenols from Lycium barbarum (Goji) Fruit European Cultivars at Different Maturation Steps: Extraction, HPLC-DAD Analyses, and Biological Evaluation. Antioxidants 2019, 8, 562. [Google Scholar] [CrossRef] [PubMed]
  26. Liu, Y.; Luo, J.; Peng, L.; Zhang, Q.; Rong, X.; Luo, Y.; Li, J. Flavonoids: Potential Therapeutic Agents for Cardiovascular Disease. Heliyon 2024, 10, e32563. [Google Scholar] [CrossRef]
  27. Ilić, T.; Dodevska, M.; Marčetić, M.; Božić, D.; Kodranov, I.; Vidović, B. Chemical Characterization, Antioxidant and Antimicrobial Properties of Goji Berries Cultivated in Serbia. Foods 2020, 9, 1614. [Google Scholar] [CrossRef]
  28. Qian, J. The Efficiency of Flavonoids in Polar Extracts of Lycium chinense Mill Fruits as Free Radical Scavenger. Food Chem. 2004, 87, 283–288. [Google Scholar] [CrossRef]
  29. Solomando González, J.C.; Rodríguez Gómez, M.J.; Ramos García, M.; Nicolás Barroso, N.; Calvo Magro, P. Characterization and Selection of Lycium barbarum Cultivars Based on Physicochemical, Bioactive, and Aromatic Properties. Horticulturae 2025, 11, 924. [Google Scholar] [CrossRef]
  30. Hu, Z.; Ma, Y.; Liu, J.; Fan, Y.; Zheng, A.; Gao, P.; Wang, L.; Liu, D. Assessment of the Bioaccessibility of Carotenoids in Goji Berry (Lycium barbarum L.) in Three Forms: In vitro Digestion Model and Metabolomics Approach. Foods 2022, 11, 3731. [Google Scholar] [CrossRef] [PubMed]
  31. Ma, R.; Zhang, X.; Ni, Z.; Thakur, K.; Wang, W.; Yan, Y.; Cao, Y.; Zhang, J.; Rengasamy, K.R.; Wei, Z. Lycium barbarum (Goji) as Functional Food: A Review of Its Nutrition, Phytochemical Structure, Biological Features, and Food Industry Prospects. Crit. Rev. Food Sci. Nutr. 2023, 63, 10621–10635. [Google Scholar] [CrossRef] [PubMed]
  32. Yao, R.; Heinrich, M.; Zou, Y.; Reich, E.; Zhang, X.; Chen, Y.; Weckerle, C.S. Quality Variation of Goji (Fruits of Lycium spp.) in China: A Comparative Morphological and Metabolomic Analysis. Front. Pharmacol. 2018, 9, 151. [Google Scholar] [CrossRef]
  33. Ramón-Canul, L.G.; Margarito-Carrizal, D.L.; Limón-Rivera, R.; Morales-Carrera, U.A.; Rodríguez-Buenfil, I.M.; Ramírez-Sucre, M.O.; Cabal-Prieto, A.; Herrera-Corredor, J.A.; de Jesús Ramírez-Rivera, E. Technique for Order of Preference by Similarity to Ideal Solution (TOPSIS) Method for the Generation of External Preference Mapping Using Rapid Sensometric Techniques. J. Sci. Food Agric. 2021, 101, 3298–3330. [Google Scholar] [CrossRef]
  34. Sater, H.; Ferrão, L.F.V.; Olmstead, J.; Munoz, P.R.; Bai, J.; Hopf, A.; Plotto, A. Exploring Environmental and Storage Factors Affecting Sensory, Physical and Chemical Attributes of Six Southern Highbush Blueberry Cultivars. Sci. Hortic. 2021, 289, 110468. [Google Scholar] [CrossRef]
  35. Jurikova, T.; Tinakova, S.M.; Ziarovska, J.; Szekeres, L.; Mlcek, J.; Fatrcova-Sramkova, K.; Knazicka, Z.; Skrovankova, S. Polyphenolic Spectrum of Goji Berries and Their Health-promoting Activity. Foods 2025, 14, 1387. [Google Scholar] [CrossRef] [PubMed]
  36. Zhao, W.; Shi, Y. Comprehensive Analysis of Phenolic Compounds in Four Varieties of Goji Berries at Different Ripening Stages by UPLC–MS/MS. J. Food Compos. Anal. 2022, 106, 104279. [Google Scholar] [CrossRef]
  37. Wang, Y.; Li, X.; Guo, S.; Li, Y.; Zhang, B.; Yin, Y.; An, W.; Cao, Y.; Zhao, J. Evaluation of Nutrients and Related Environmental Factors for Wolfberry (Lycium barbarum) Fruits Grown in the Different Areas of China. Biochem. Syst. Ecol. 2019, 86, 103916. [Google Scholar] [CrossRef]
  38. Cui, M.; Xiao, M.; Zhang, D.; Xie, Z. Characterization of Goji Quality at Different Harvest Stages in Qaidam Basin Based on Transcriptome and Widely Targeted Metabolome. J. Food Biochem. 2024, 2024, 1139944. [Google Scholar] [CrossRef]
  39. Liu, D.; Yuan, M.; Wang, Y.; Zhang, L.; Yao, W.; Feng, M. Integrated Metabolome and Transcriptome Analysis of Differences in Quality of Ripe Lycium barbarum L. Fruits Harvested at Different Periods. BMC Plant Biol. 2024, 24, 82. [Google Scholar] [CrossRef]
  40. Polat, M.; Mertoglu, K.; Eskimez, I.; Okatan, V. Effects of the Fruiting Period and Growing Seasons on Market Quality in Goji Berry (Lycium Barbarum L.). Folia Hortic. 2020, 32, 229–239. [Google Scholar] [CrossRef]
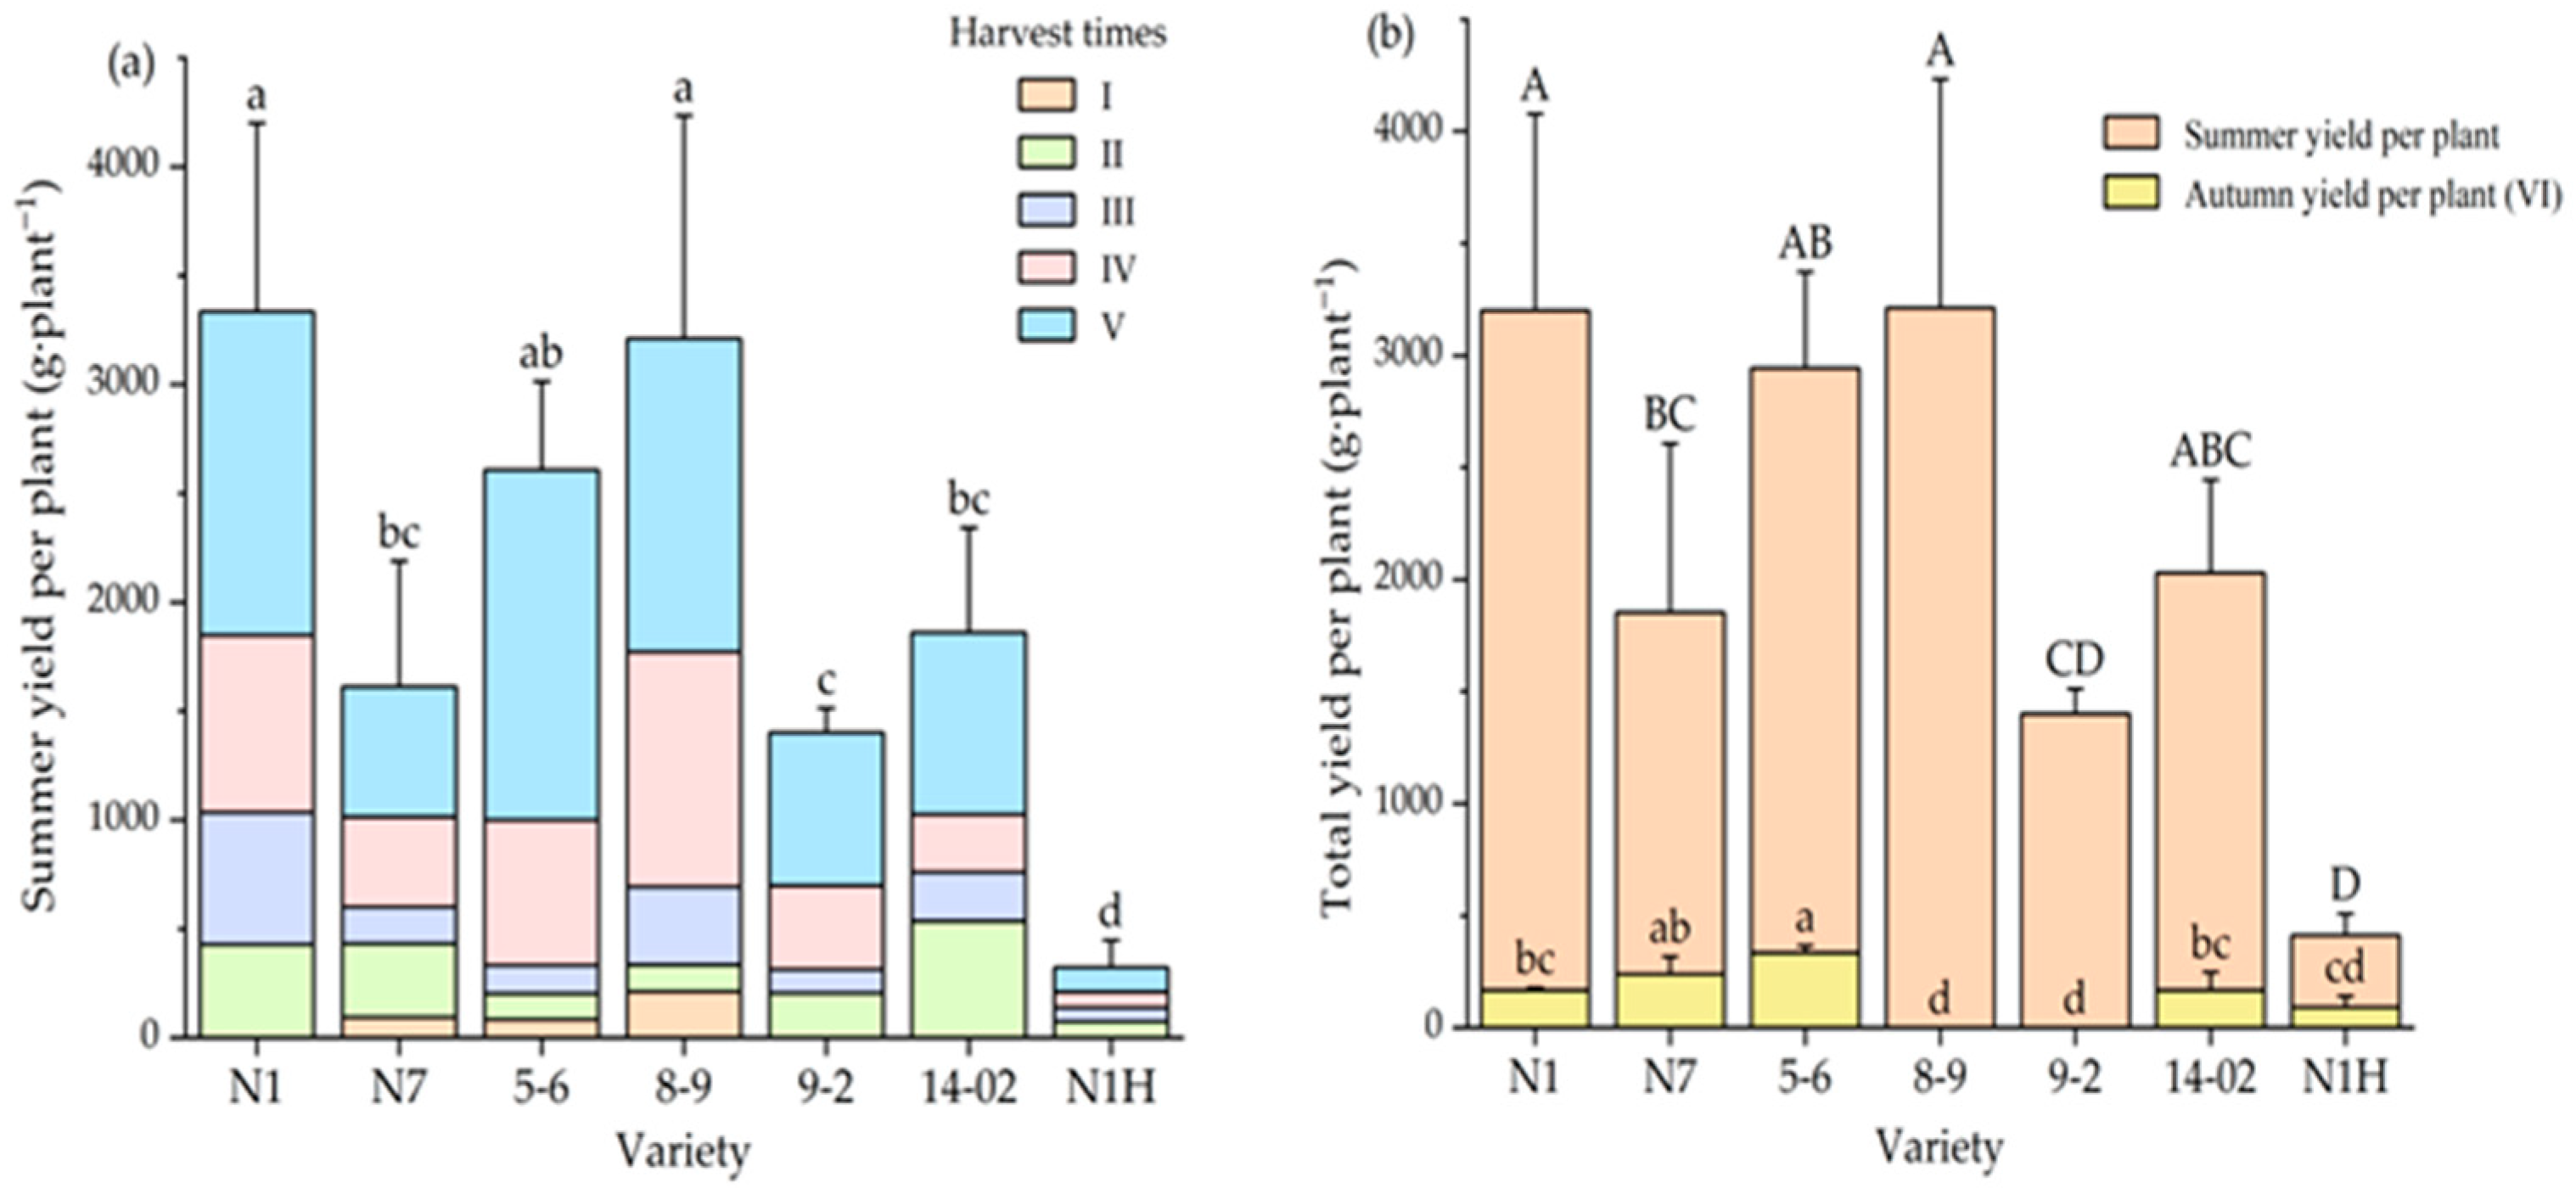
Figure 1. Variation in fruit yield per plant (g·plant−1) across different goji varieties and their harvest times. (a) Summer fruit yield at different harvest times among varieties. Different lowercase letters indicate significant differences in summer yield among varieties (p < 0.05). (b) Autumn fruit yield and total yield among varieties. Different uppercase letters indicate significant differences in total yield among varieties (p < 0.05), and different lowercase letters indicate significant differences in autumn yield among varieties (p < 0.05).
Horticulturae 11 01138 g001
Figure 2. Scanned images of goji fruits sampled from different varieties at various harvest times.
Horticulturae 11 01138 g002
Figure 3. Changes in L* (a), a* (b), and b* (c) of different goji berry varieties across harvest times. Uppercase letters indicate significant differences (p < 0.05) among harvest times within the same variety; lowercase letters indicate significant differences among varieties within the same harvest time (p < 0.05).
Horticulturae 11 01138 g003
Figure 4. Hierarchical cluster dendrogram showing the overall quality differences of seven goji berry varieties across three harvest times, based on Euclidean distances calculated from the relative closeness (Ci values) to the ideal solution.
Horticulturae 11 01138 g004
Table 1. Soil chemical properties at the experimental site.
Soil Depth (cm)Soil Chemical Property
pHTotal Salt Content (g·kg−1)Organic Matter (g·kg−1)Hydrolyzable Nitrogen (mg·kg−1)Available Potassium (mg·kg−1)Available Phosphorus (mg·kg−1)
0–208.220.5932.00198.00640.00555.00
20–408.220.6525.30171.00585.00297.00
Table 2. Variations in phenotypic characteristics of goji berries across varieties and harvest times.
Harvest
Time
Variety
N1N75-68-99-214-02N1H
Berry length (mm)
III6.18 ± 0.86 Bf6.39 ± 0.51 Ce9.20 ± 0.76 Cb7.40 ± 0.76 Cd8.27 ± 0.77 Cc10.03 ± 1.20 Ca5.45 ± 0.67 Cg
IV18.59 ± 1.33 Af20.46 ± 1.53 Ae27.98 ± 1.96 Ba20.90 ± 2.40 Bd24.76 ± 3.53 Bc26.54 ± 3.43 Bb18.62 ± 1.94 Bf
V18.55 ± 1.74 Ag19.65 ± 1.61 Be28.03 ± 3.22 Aa22.09 ± 1.82 Ad25.8 ± 33.32 Ac27.10 ± 2.67 Ab18.70 ± 1.71 Af
Berry width (mm)
III3.40 ± 0.35 Ce3.69 ± 0.24 Cc4.04 ± 0.41 Cb3.63 ± 0.29 Cd4.05 ± 0.41 Cb4.52 ± 0.52 Ca3.06 ± 0.44 Cf
IV10.03 ± 1.07 Bg11.27 ± 0.83 Bd11.58 ± 1.27 Bc10.40 ± 1.13 Be12.66 ± 1.65 Ba11.85 ± 1.36 Bb9.75 ± 1.14 Bf
V10.65 ± 1.04 Af11.17 ± 0.58 Ad11.93 ± 0.98 Ac11.04 ± 0.91 Ae12.92 ± 1.04 Aa12.22 ± 1.04 Ab10.31 ± 1.01 Ag
FSI
III1.82 ± 0.14 Bd1.76 ± 0.16 Be2.26 ± 0.21 Ca2.02 ± 0.17 Ac2.05 ± 0.23 Ac2.12 ± 0.20 Bb1.78 ± 0.16 Ce
IV1.89 ± 0.15 Ae1.84 ± 0.13 Ae2.43 ± 0.29 Aa2.04 ± 0.14 Ac1.99 ± 0.34 Bcd2.24 ± 0.20 Ab1.94 ± 0.21 Ad
V1.73 ± 0.10 Cd1.75 ± 0.12 Bd2.33 ± 0.22 Ba2.02 ± 0.24 Ac2.00 ± 0.18 Bc2.22 ± 0.22 Ab1.83 ± 0.18 Bd
Fruit weight (g)
III0.64 ± 0.25 Ce0.99 ± 0.16 Cc1.01 ± 0.84 Cc0.78 ± 0.26 Bd1.17 ± 0.10 Cb1.39 ± 0.15 Ca0. 42 ± 0.21 Cf
IV0.74 ± 0.15 Be1.06 ± 0.16 Bc1.43 ± 0.20 Ba0.90 ± 0.10 Ad1.25 ± 0.15 Bb1.45 ± 0.10 Ba0. 58 ± 0.12 Bf
V0.85 ± 0.14 Af1.20 ± 0.12 Ad1.53 ± 0.11 Ab0.90 ± 0.14 Ae1.36 ± 0.12 Ac1.80 ± 0.10 Aa0.84 ± 0.14 Af
Note: Uppercase letters indicate significant differences (p < 0.05) among harvest times within the same variety; lowercase letters indicate significant differences among varieties within the same harvest time (p < 0.05). The values shown are the means ± SD, n = 3.
Table 3. Variations in contents of polysaccharides, flavonoids, and carotenoids across different varieties and harvest times.
Harvest TimeVariety
N1N75-68-99-214-02N1H
Polysaccharides (mg·g−1)
I-54.3 ± 1.25 Bc64.6 ± 1.27 Aa61.4 ± 1.18 Ab---
II51.0 ± 1.14 Bc53.8 ± 1.07 Bb61.0 ± 1.26 Ba62.8 ± 1.15 Aa40.4 ± 1.05 Ce44.6 ± 1.13 Bd43.3 ± 2.11 Cd
III42.7 ± 2.14 Cd50.3 ± 1.07 Cc50.1 ± 1.07 Dc54.4 ± 1.05 Bb54.1 ± 2.10 Bb54.5 ± 2.91 Ab62.0 ± 2.17 Aa
IV54.9 ± 1.09 Ade58.1 ± 1.17 Abc60.4 ± 1.12 Bb42.2 ± 1.02 Cf67.1 ± 1.26 Aa53.8 ± 1.13 Ae56.9 ± 0.92 Bcd
V54.1 ± 1.07 Ac53.0 ± 1.19 Bc52.8 ± 2.35 Cc62.5 ± 1.21 Ab65.5 ± 2.21 Aa42.1 ± 1.25 Be45.0 ± 1.15 Cd
VI29.7 ± 0.07 Da19.9 ± 0.04 Dc17.6 ± 0.08 Ed--17.0 ± 0.05 Cd27.6 ± 0.09 Db
Flavonoids (mg·g−1)
I-3.14 ± 0.61 CDb9.53 ± 0.74 Ca3.96 ± 1.09 Cb---
II15.54 ± 1.80 Ab6.71 ± 1.23 Bf12.74 ± 2.23 Ac10.03 ± 1.58 Ad9.58 ± 1.56 Ad16.30 ± 1.32 Aa7.97 ± 1.09 Ce
III11.66 ± 0.87 Bb6.99 ± 1.31 Bc7.04 ± 1.33 Dc7.38 ± 1.19 Bc11.42 ± 1.14 Ab16.08 ± 1.58 Aa14.31 ± 1.07 Bab
IV4.32 ± 1.25 Dc3.61 ± 1.15 Cc3.34 ± 0.61 Ec4.03 ± 0.56 Cc3.45 ± 1.02 Bc6.55 ± 1.16 Cb16.54 ± 1.44 Aa
V6.98 ± 0.95 Ca2.09 ± 1.20 Dd6.58 ± 1.27 Da1.56 ± 1.06 De5.13 ± 1.19 Bb2.43 ± 1.04 Dd4.23 ± 1.16 Dc
VI7.76 ± 0.45 Cc10.41 ± 1.33 Ab11.01 ± 0.45 Bb--8.35 ± 0.61 Bc17.58 ± 1.19 Aa
Carotenoids (mg·g−1)
I-1.01 ± 0.06 Ba0.61 ± 0.02 Cc0.73 ± 0.04 Ab---
II0.53 ± 0.02 Cc0.25 ± 0.05 Ed0.73 ± 0.04 ABb0.54 ± 0.08 Dc0.77 ± 0.08 Ba0.15 ± 0.01 Ef0.20 ± 0.06 Ae
III0.87 ± 0.05 Bb1.32 ± 0.06 Aa0.73 ± 0.05 Ac0.60 ± 0.03 Cd0.43 ± 0.06 Ce0.71 ± 0.01 Dc0.13 ± 0.02 Df
IV0.35 ± 0.02 Df0.54 ± 0.09 De0.71 ± 0.02 Bc0.67 ± 0.08 Bd0.90 ± 0.03 Ab1.81 ± 0.09 Aa0.11 ± 0.08 Eg
V0.89 ± 0.08 Bb0.78 ± 0.05 Cc0.57 ± 0.04 Dd0.46 ± 0.06 Ee0.77 ± 0.03 Bc1.77 ± 0.07 Ba0.16 ± 0.01 Cf
VI0.95 ± 0.04 Ab1.03 ± 0.49 Ba0.37 ± 0.07 Ec--0.93 ± 0.06 Cb0.19 ± 0.09 Bd
Note: Uppercase letters indicate significant differences (p < 0.05) among harvest times within the same variety; lowercase letters indicate significant differences among varieties within the same harvest time (p < 0.05). The values shown are the means ± SD, n = 3.
Table 4. A comprehensive assessment of various indices for different goji varieties across three harvest times by the TOPSIS method.
VarietyHarvest Time d i + d i CiRanking Order
N1III0.25120.11330.310820
IV0.23970.12910.350116
V0.21340.18420.46337
N7III0.26690.10110.274821
IV0.24660.12990.344918
V0.23840.13250.357215
5-6III0.23560.13400.362613
IV0.18980.20190.51552
V0.17430.23400.57321
8-9III0.23380.11320.326219
IV0.21590.15520.418212
V0.20880.19170.47863
9-2III0.23540.13170.358814
IV0.21540.16900.43969
V0.20040.17800.47055
14-02III0.22220.16090.419911
IV0.22370.18250.44928
V0.21820.19860.47644
N1HIII0.25380.19410.433410
IV0.21440.18600.46456
V0.24690.13170.347917
d i + : the calculated distances to the ideal solution; d i : the calculated distances to the negative ideal solution; Ci: the relative closeness to the ideal solution.
Disclaimer/Publisher’s Note: The statements, opinions and data contained in all publications are solely those of the individual author(s) and contributor(s) and not of MDPI and/or the editor(s). MDPI and/or the editor(s) disclaim responsibility for any injury to people or property resulting from any ideas, methods, instructions or products referred to in the content.