Article

Transcriptomic Analysis Reveals the Regulation Function of Calcium Ions Regarding Anthocyanin Biosynthesis in Lonicera japonica Under Cold Stress

College of Life Sciences and Medicine, Zhejiang Sci-Tech University, Hangzhou 310018, China
*
Authors to whom correspondence should be addressed.
These authors contributed equally to this work.
Horticulturae 2025, 11(9), 1023; https://doi.org/10.3390/horticulturae11091023
Submission received: 14 July 2025 / Revised: 15 August 2025 / Accepted: 30 August 2025 / Published: 1 September 2025
(This article belongs to the Section Genetics, Genomics, Breeding, and Biotechnology (G2B2))

Abstract

Lonicera japonica is a widely utilized medicinal and ornamental plant. Its secondary metabolism is highly sensitive to cold stress. Previous studies have demonstrated how L. japonica accumulates anthocyanin in response to cold stress, with calcium ions playing a potential role in the regulation. To further clarify the regulatory function of calcium ions regarding pigment formation under cold stress, transcriptomic analysis was conducted on exogenous calcium ions and calcium chelator EGTA-treated L. japonica under cold stress. The CaCl2 treatment markedly delayed changes in the pigmentation, and the plant maintained a higher chlorophyll content, whereas EGTA treatment enhanced anthocyanin accumulation and induced earlier and more intense leaf coloration. A total of 17,296 differentially expressed genes were co-expressed during cold stress, and calcium-responsive genes were predominantly enriched in phenylpropanoid biosynthesis, hormone signaling, and stress response pathways. Notably, key transcription factors such as MYBS3 and BRH1 were identified with expression patterns that closely correlated with pigment changes and stress adaptation. These results indicate the deep involvement of molecular mechanisms of calcium signaling in modulating pigment accumulation in response to cold stress, providing a theoretical foundation for improving both the ornamental and medicinal value of L. japonica under adverse environmental conditions.

1. Introduction

Lonicera japonica, a species of the Caprifoliaceae family, is a semi-evergreen vine plant that is widely distributed across East Asia [1]. The flowers of L. japonica have a long-standing history of use in traditional medicine due to its antiallergic [2], anti-inflammatory [3], antibacterial [4], and antiviral properties [5,6], which are attributed to secondary metabolites such as flavonoids, phenolic acids, volatile oils, iridoids, triterpenoids, and saponins [7]. Chlorogenic acid and luteoloside are the primary bioactive compounds used to assess the quality of L. japonica [8]. While the highest content of chlorogenic acid is found in the flowers of L. japonica, its concentration is significantly influenced by the flowering time [7]. Recent studies confirm the increasing importance of exploring bioactive compounds in various parts of L. japonica, especially the leaves, which have been found to exhibit pharmacological effects that may be stronger than those of the flowers and stems [9]. Notably, beyond its medicinal applications, the plant possesses unique ornamental value, known for its excellent climbing abilities and adaptability to various environments, which make it a favored choice for three-dimensional garden landscaping and beautification. As the demand for quality of life increases, advanced cultivation techniques are being applied to develop varieties of L. japonica with distinct leaf vein colors, furthering its ornamental appeal.
Cold stress, which can be categorized as cold injury (above 0 °C) or freezing injury (below 0 °C) [10], is one of the most prevalent abiotic stressors limiting plant growth and development [11]. To cope with such conditions, plants have evolved complex adaptive mechanisms, including the accumulation of cytoprotective metabolites that are regulated through diverse signaling pathways [12]. Evidence suggests that bZIP transcription factors are significantly upregulated in Zizania latifolia under cold stress and mitigate its effects by coordinating a secondary metabolism, including flavonoids, acid derivatives, and alkaloids [13]. Li et al. found that the heterologous expression of AabHLH35 causes high levels of anthocyanins to accumulate, enhancing Arabidopsis’ tolerance to cold stress [14]. Kamal et al. [15] found a strong correlation between anthocyanin accumulation and the development of red leaf coloration in red maples under cold stress, with a significant upregulation of the UGT gene family observed. These transcriptional and metabolic responses largely rely on early Ca2+ signaling [16], as a crucial process for inducing temperature-responsive gene expressions. Cold exposure triggers a rapid Ca2+ influx and activates downstream kinase and transcriptional cascades. Calcium-dependent protein kinases directly interact with calcium under cold stress, leading to the rapid activation of CBF/DREB1 genes [17,18,19]. These transcription factors (TFs) interact with the DRE/CRT cis-element to initiate the expression of cold-responsive genes [19].
Our previous studies revealed that under cold stress, L. japonica undergoes leaf reddening accompanied by a significant increase in secondary metabolites and the enhanced activity of calcium signaling proteins. However, despite the proven role of calcium signaling in cold stress, the precise molecular mechanisms by which calcium regulates transcriptional networks and secondary metabolite biosynthesis in L. japonica remain largely uncharacterized. In this study, we focus on investigating the regulatory effect of calcium ions on L. japonica under cold stress and identify key genes that respond to calcium ion signals. We analyzed the transcriptomic data in plants under cold stress following exogenous calcium application [20,21] and subsequently performed qPCR analysis on five key genes. This study elucidates the regulatory mechanisms governing the leaf color and secondary metabolism, thereby offering insights into the manipulation of ornamental traits and plant adaptation to environmental factors.

2. Materials and Methods

2.1. Plant Materials and Stress Treatment

L. japonica (Beihua No.1) seedlings were transplanted from a nursery in Linyi (35°18′28″ N, 117°34′45″ E) to pots and grown in a greenhouse at Zhejiang Sci-Tech University, Hangzhou (30°18′54″ N, 120°21′27″ E). Stem segments (5 cm) were planted in nutrient-rich soil and incubated (Ningbo Southeast Instrument, Ningbo, China) under conditions of 24 °C, 70% humidity, 8000 Lux light intensity, and a 12 h light/12 h dark cycle. The plants were randomly divided into 3 groups and sprayed with ddH2O (CK), 10 mM Ethylene Glycol-bis(β-aminoethyl ether)-N,N,N′,N′-tetraacetic acid (EGTA), or 10 mM CaCl2 (Ca2+). Approximately 0.95 g of EGTA powder and 0.28 g of anhydrous CaCl2 powder were accurately weighed using an analytical balance, and each was dissolved in 150 mL of distilled water. The CaCl2 powder was stirred until fully dissolved, transferred to a 250 mL volumetric flask, and brought to volume. The EGTA powder was dissolved under magnetic stirring and 1 M NaOH was added dropwise to maintain pH 7.5; the resulting solution was transferred to a 250 mL volumetric flask and brought to volume. All solutions were thoroughly mixed before application. At the starting point (SP), to induce cold stress, sprayed plants were placed into a growth chamber at a temperature of 10 °C, with identical humidity, light, and photoperiod conditions (day 0). During cold stress, the spraying experiment was repeated every five days. Leaves from all the groups treated for 15 days (T15) and 30 days (T30) were collected. Three independent replicates were performed as biological replicates, and the collected plant materials were frozen in liquid nitrogen and stored at −80 °C.

2.2. Pigment Content Measurement

Chlorophyll and carotenoid extraction was performed following the work of Yang et al. [22] with modifications. Briefly, 0.1 g of L. japonica leaves was placed in 10 mL of 95% ethanol and kept in darkness for 48 h until the leaves turned white. The extract was centrifuged at 5000× g for 5 min, and the absorbance of the supernatant was measured at 470 nm, 649 nm, and 665 nm using a UV-1800PC spectrophotometer (MAPADA, Shanghai, China). Chlorophyll and carotenoid contents were calculated according to Lichtenthaler et al.’s method [23].
Anthocyanin extraction and quantification were performed as described by Zhang et al. [24]. Briefly, 50 mg of frozen leaves was pulverized in liquid nitrogen, extracted in 3 mL of 0.1% (v/v) hydrochloric acid in methanol for 1 h, and shaken overnight. After centrifugation at 2500× g for 10 min, 1 mL of the supernatant was mixed with 1 mL of ddH2O, followed by extraction with 1 mL of chloroform to remove chlorophyll. The absorbance of the resulting solution was measured at 530 nm for the quantification of anthocyanin.

2.3. Total RNA Extraction, cDNA Library Construction, and Sequencing

Total RNA was extracted from L. japonica leaves using an RNA extraction kit (Accurate Biotechnology, Hunan, China). RNA degradation and purity were assessed via agarose gel electrophoresis and a Nanodrop 1000 spectrophotometer (Thermo Fisher, Waltham, MA, USA). mRNA was isolated using Oligo(dT) Beads and fragmented using a fragmentation reagent. Double-stranded cDNA was synthesized from mRNA fragments using the Smart-RT enzyme (Takara, Tokyo, Japan). cDNA ends were repaired, poly(A) tails were added, and target products were purified using magnetic beads. Sequencing libraries were constructed using pooling cDNA from three independent biological replicates per group. Libraries were quality-checked using a Qseq100 DNA Analyzer (Bioptic Inc., La Canada Flintridge, CA, USA) and real-time PCR (qRT-PCR), followed by sequencing on an Illumina Novaseq 6000 platform (Illumina, San Diego, CA, USA).

2.4. Gene Assembly and Expression Analysis

Raw data were filtered using fastp (https://github.com/OpenGene/fastp, accessed on 31 December 2024) to remove adapters, reads with lengths <50 bp, reads containing >5 bp N bases, and low-quality bases (Q < 20). Clean data were aligned to the reference genome [25] using HISAT2 (https://daehwankimlab.github.io/hisat2/, accessed on 31 December 2024). Gene expression levels were quantified as Fragments Per Kilobase Million (FPKM) values.

2.5. Functional Analysis

To analyze potential functions of identified genes, annotations were performed based on sequence homology. Functional classification was performed using the Mapman Bin Code (https://mapman.gabipd.org/, accessed on 13 March 2025). Pathway mapping was conducted using the Kyoto Encyclopedia of Genes and Genomes (KEGG) database (http://www.genome.jp/kegg/, accessed on13 March 2025) [26].

2.6. Correlation Analysis Between TF Expression and Pigment Contents

To identify differentially expressed TFs associated with changes in pigment contents, a total of 8 genes related to TFs were obtained from differential functional analysis. Pearson correlation analysis was performed using R statistical software (version 4.5.1). Specifically, the cor.test() function from the base stats package was used to calculate Pearson correlation coefficients (r) and 95% confidence intervals (95% CIs) via a two-tailed Pearson correlation test, with a significance threshold set at α = 0.05.

2.7. Quantitative Real-Time (qRT) PCR Analysis

To verify the accuracy of the gene expression obtained from the RNA-Seq analysis, critical candidate genes were selected for qRT-PCR. Primers were designed using Primer 5.0 software (Table S1) and qRT-PCR was used on an ABI7500 fluorescence quantitative PCR instrument (Applied Biosystems, Carlsbad, CA, USA) with the SYBR® Green Pro Taq HS qPCR kit (Accurate Biotechnology Co., Ltd., Hunan, China) and three biological replicates set for each group. Using the 2−ΔΔCt method [27], relative expression levels were calculated using actin as an internal reference gene [28].

2.8. Statistical Analysis

SPSS 27.0 software was used to establish a database and perform statistical analysis. One-way ANOVA with Tukey’s test was applied for comparisons among groups. A p < 0.05 was considered statistically significant.

3. Results

3.1. Morphological and Physiological Responses of L. japonica Leaves Under Cold Stress

In this study, L. japonica was grown at 10 °C for 30 days. The leaf morphology was monitored under cold conditions. During cold stress treatment, the leaf color of L. japonica in CK exhibited a gradual transition from green to purple. In contrast, Ca2+ spraying significantly accelerated this physiological transformation, with leaves displaying a purple phenotype as early as the mid-stress stage. However, a prolonged stress duration led to a gradual reversion toward green leaf coloration in this treatment group. The EGTA treatment exhibited a similar leaf color transition pattern to the control, but also demonstrated more pronounced pigment accumulation after 30 days of stress exposure (Figure 1A).
The total chlorophyll, carotenoid, and anthocyanin contents in leaves from the three groups were measured spectrophotometrically at SP, T15, and T30 (Figure 1B). Under cold conditions, chlorophyll and carotenoid levels gradually declined in all groups over time, whereas the anthocyanin content increased. However, at T30, it was found that calcium ion treatment slightly increased the chlorophyll and carotenoid content of L. japonica leaves. Meanwhile, significantly lower anthocyanin accumulation levels were found at both T15 and T30 compared to the other two groups. Conversely, the EGTA treatment displayed a sharp increase in the anthocyanin content at T15, reaching nearly three times the initial (SP) level. This corresponds to the visually observed color changes. The proportions of total chlorophylls, carotenoids, and anthocyanins in each sample were calculated and plotted in a 3D sphere diagram (Figure 1C). These data reveal marked shifts in the pigment composition under cold stress in both the Ca2+ treatment and the EGTA treatment, relative to the CK.

3.2. Transcriptomic Analysis of Leaves Under Cold Stress

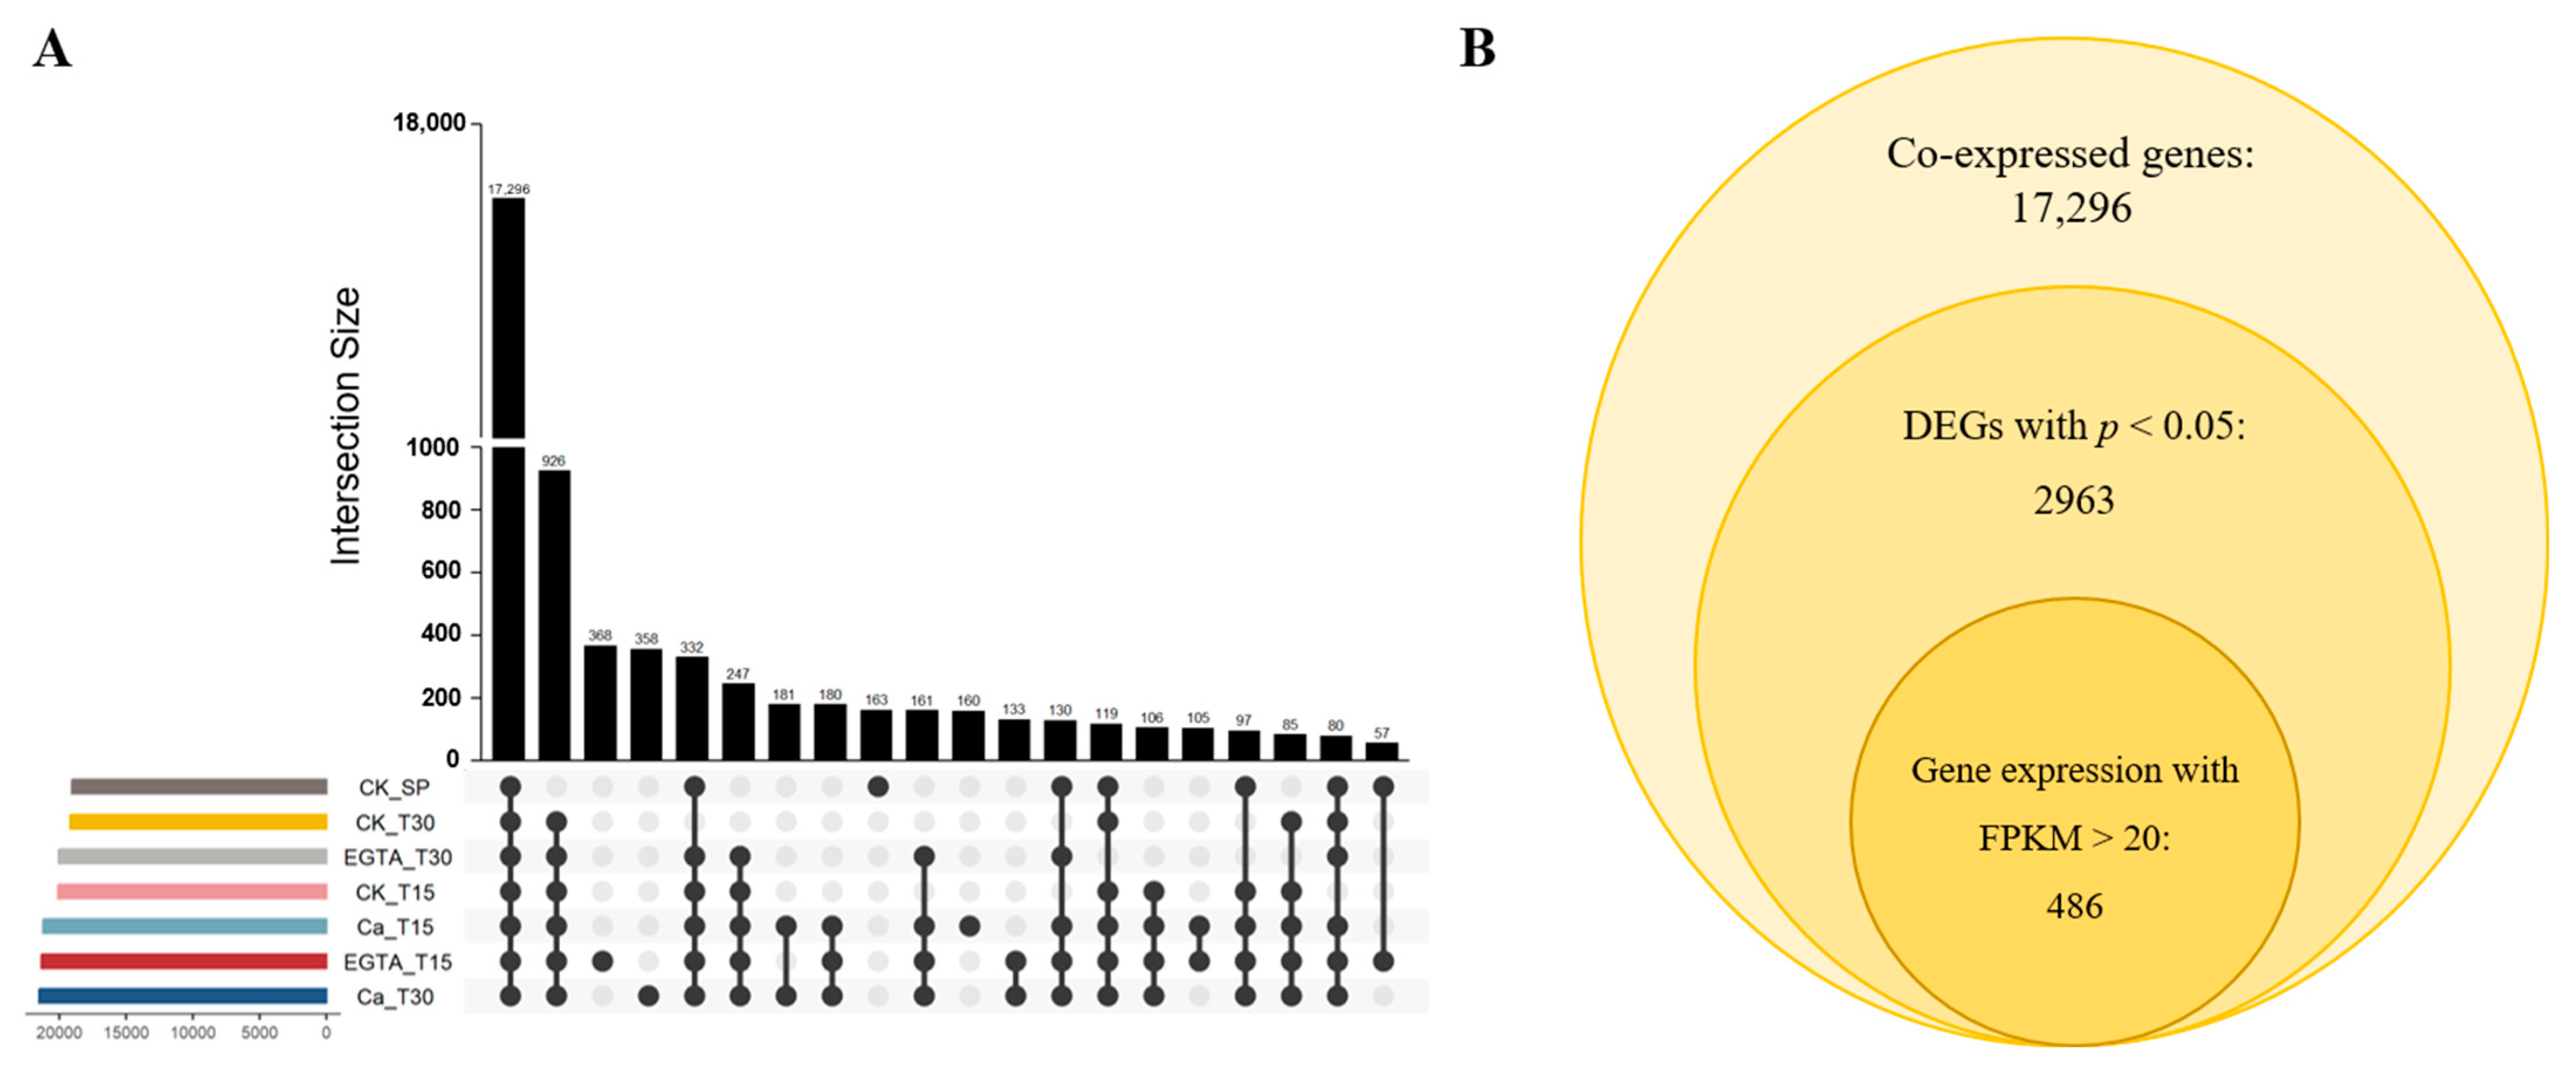
To study the molecular mechanisms underlying plant responses to cold stress, transcriptome sequencing was conducted on L. japonica leaves. A total of 22,693, 23,325, 22,647, 24,529, 24,437, 24,866, and 23,903 genes were detected in the CK_SP, CK_T15, CK_T30, Ca_T15, Ca_T30, EGTA_T15, and EGTA_T30 groups, respectively (Figure 2A). Among these, 17,296 genes were commonly expressed across all seven treatment groups. Differential expression analysis was conducted using Cuffdiff, and genes with p < 0.05 and FPKM > 20 [29] were selected to identify those with significantly relevant expressions (Figure 2B). The filtering process identified 486 differentially expressed genes (DEGs).

3.3. Clustering Analysis of DEGs Expression Patterns

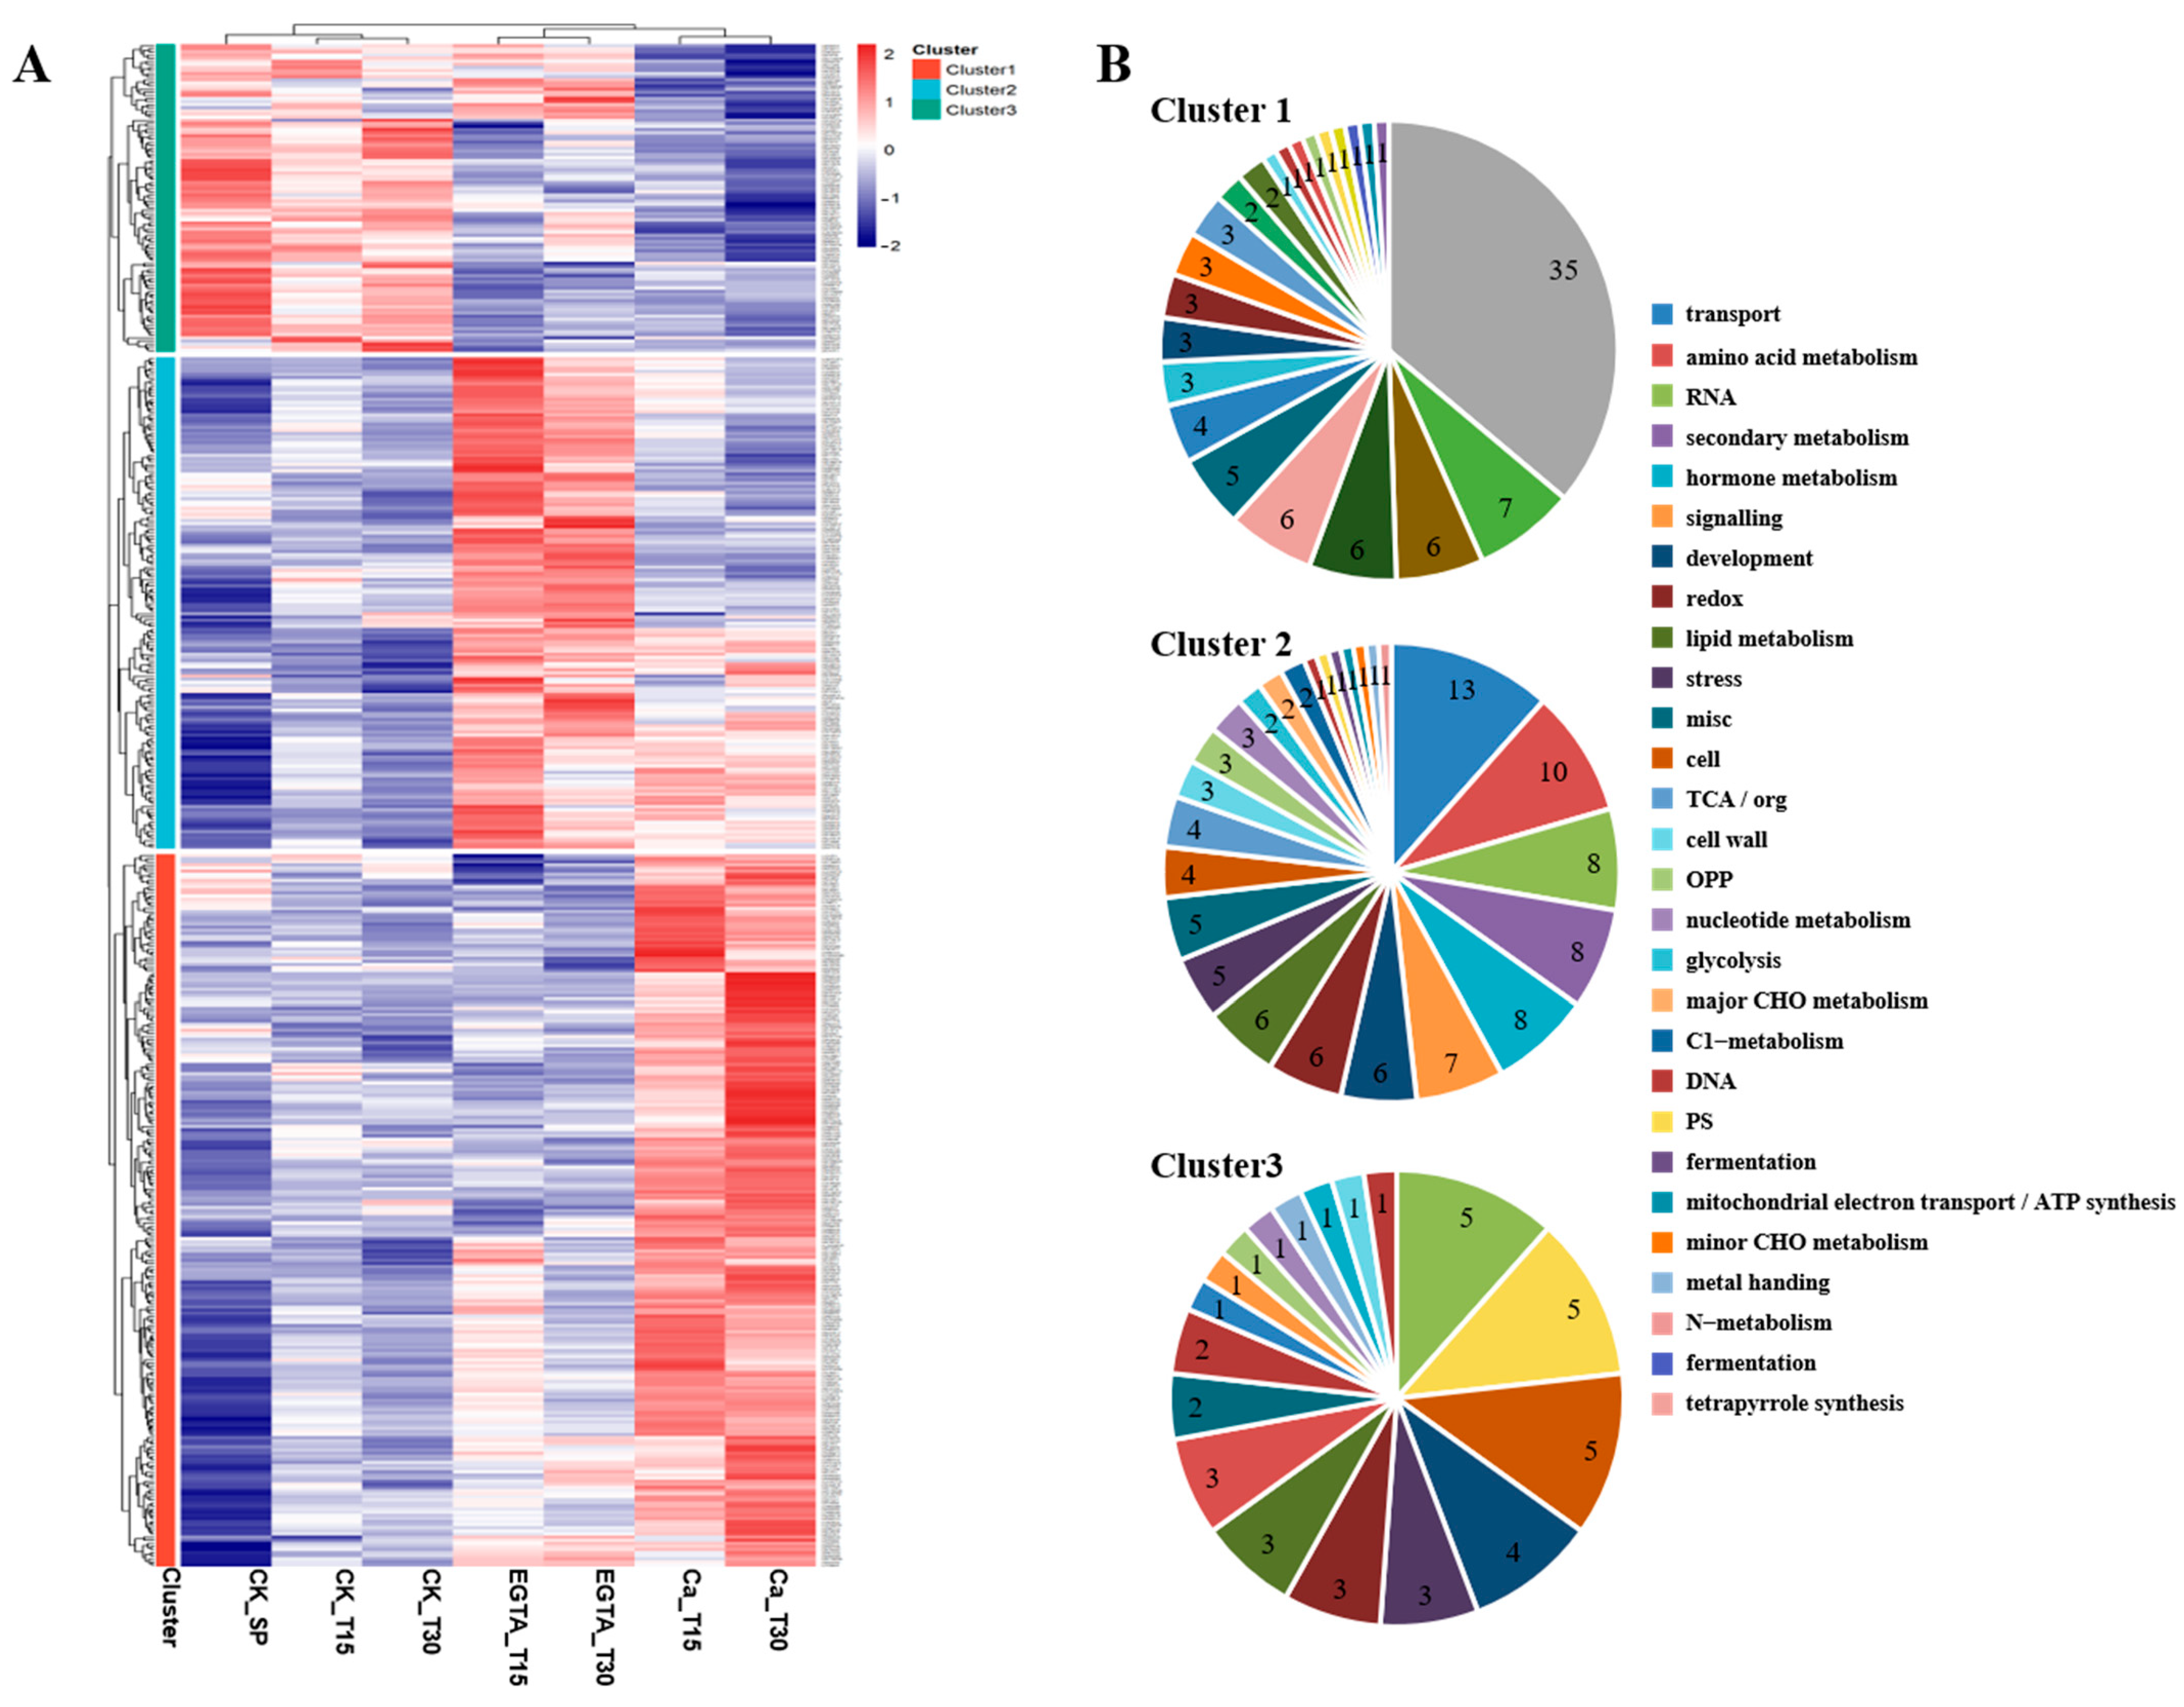
To further investigate the expression patterns of DEGs under cold stress, hierarchical clustering analysis was conducted and the results were visualized via a heatmap (Figure 3A). Cluster analysis categorized the DEGs into three distinct subclasses (Cluster 1, Cluster 2, and Cluster 3), comprising 229, 158, and 99 genes, respectively. Although the expression of genes in both Cluster 2 and Cluster 3 increased with prolonged cold stress in CK, their responses to calcium signaling were the opposite. After EGTA treatment, the expression of Cluster 2 genes under cold stress was significantly higher than the CK group, suggesting that their expression may be suppressed by calcium signaling. In contrast, Ca2+ treatment inhibited an elevated expression. Conversely, the expression of Cluster 3 genes under cold stress was significantly higher than in the Ca2+ treatment group than the EGTA treatment group, indicating that their expression may be positively regulated by calcium signaling.

3.4. Function Annotation and Enrichment

The biological functions of the three gene groups were predicted via annotation using MapMan bin codes (Figure 3B). Cluster 1 predominantly contained genes related to RNA processing, signaling, stress responses, cellular functions, and tetrapyrrole synthesis. Cluster 2 was enriched with genes involved in transport, amino acid metabolism, RNA processes, secondary metabolism, hormone metabolism, and signaling. Cluster 3 included genes associated with RNA processing, cellular functions, photosynthesis, development, stress responses, and amino acid metabolism. Moreover, secondary metabolism-related genes were notably enriched in phenylpropanoid and flavonoid metabolic pathways in Cluster 2.

3.5. Analysis of Amino Acid Metabolism Pathways in L. japonica Under Cold Stress

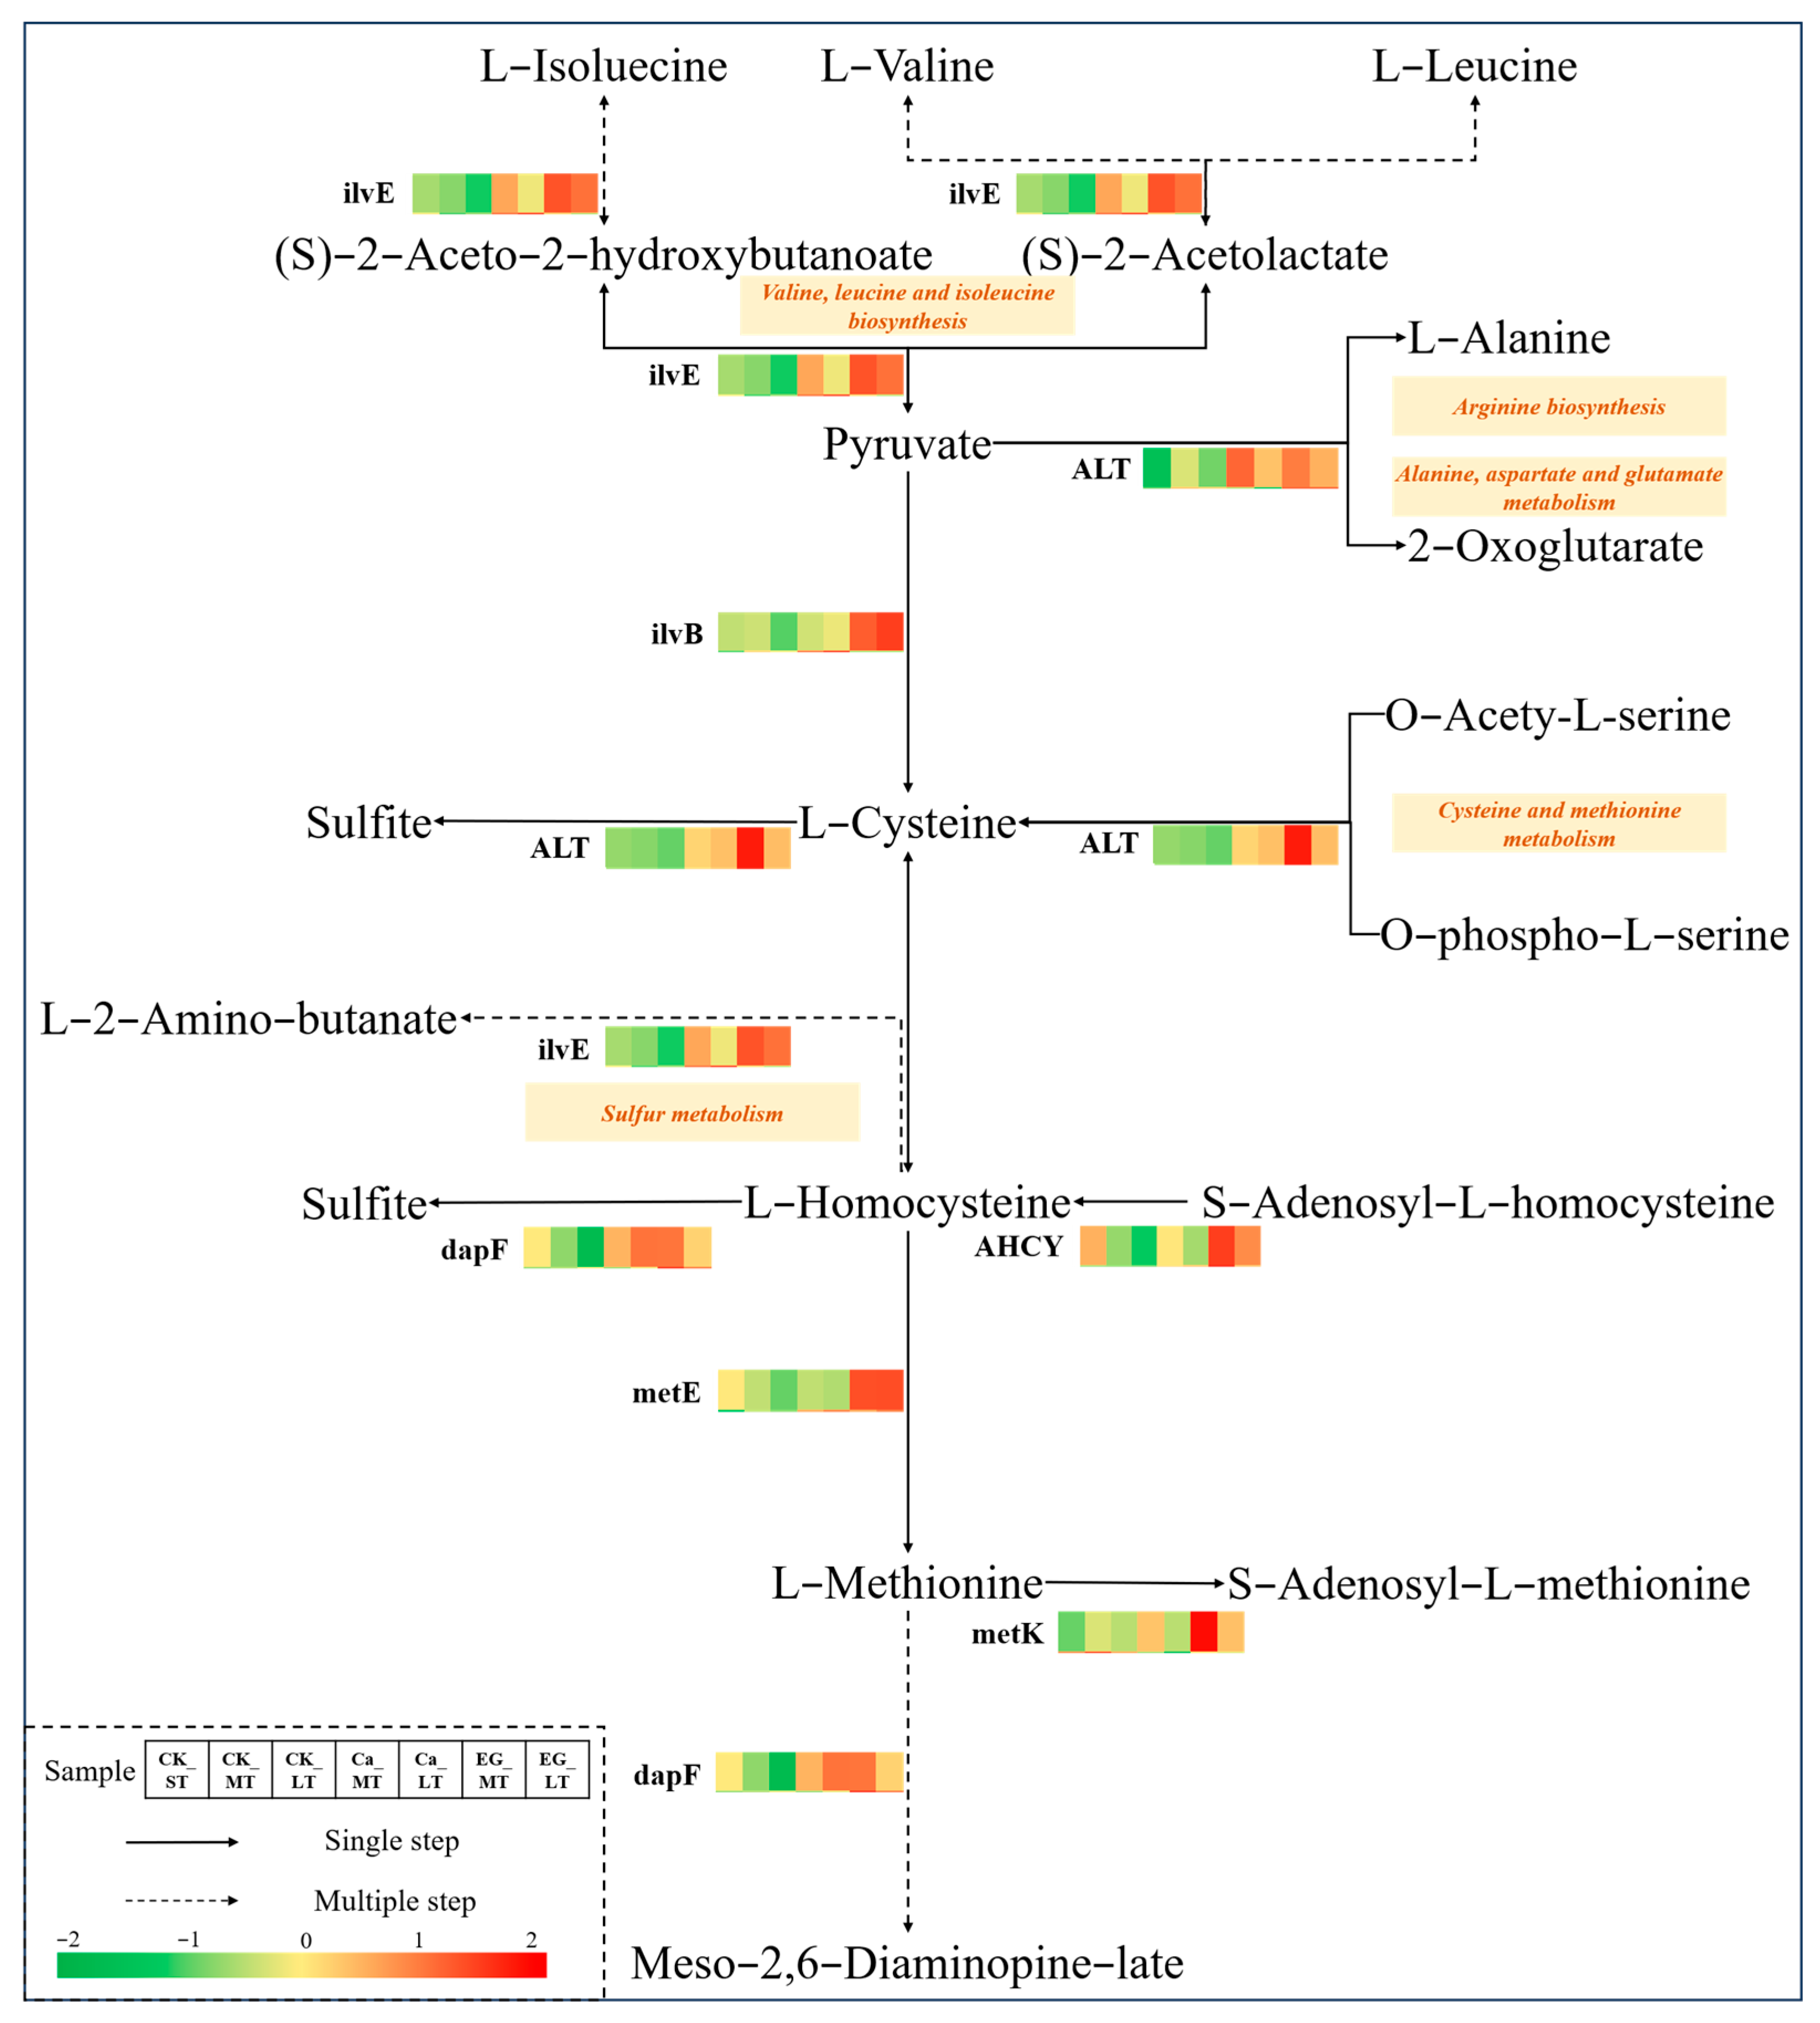
To clarify the specific roles of calcium ions in regulating the cold response, the amino acid-related genes in Cluster 2 (Figure 3) were included in the KEGG pathway mapping analysis (Figure 4). The results identified seven genes primarily involved in four biosynthesis and metabolic pathways, such as valine, leucine, and isoleucine biosynthesis; arginine biosynthesis; alanine, aspartate, and glutamate metabolism; cysteine and methionine metabolism; and sulfur metabolism. Among these, ilvE genes participate in multiple reaction steps, and their expression levels increased in both Ca2+ treatment and EGTA treatment compared to CK. In EGTA treatment, ilvB catalyzes the conversion of pyruvate to L-Cysteine, showing upregulated expression in EGTA treatment. The expression levels of three genes, such as AHCY, metE, and metK, significantly responded to EGTA treatment. These genes are located within the cyclic reaction pathway and involve L-Homocysteine, L-Methionine, S-Adenosyl-L-Methionine, and S-Adenosyl-L-Homocysteine. This pathway is crucial for intracellular methyl transfer reactions, serving as a methyl donor for numerous biosynthetic and regulatory processes.

3.6. Response of Secondary Metabolism to Cold Stress

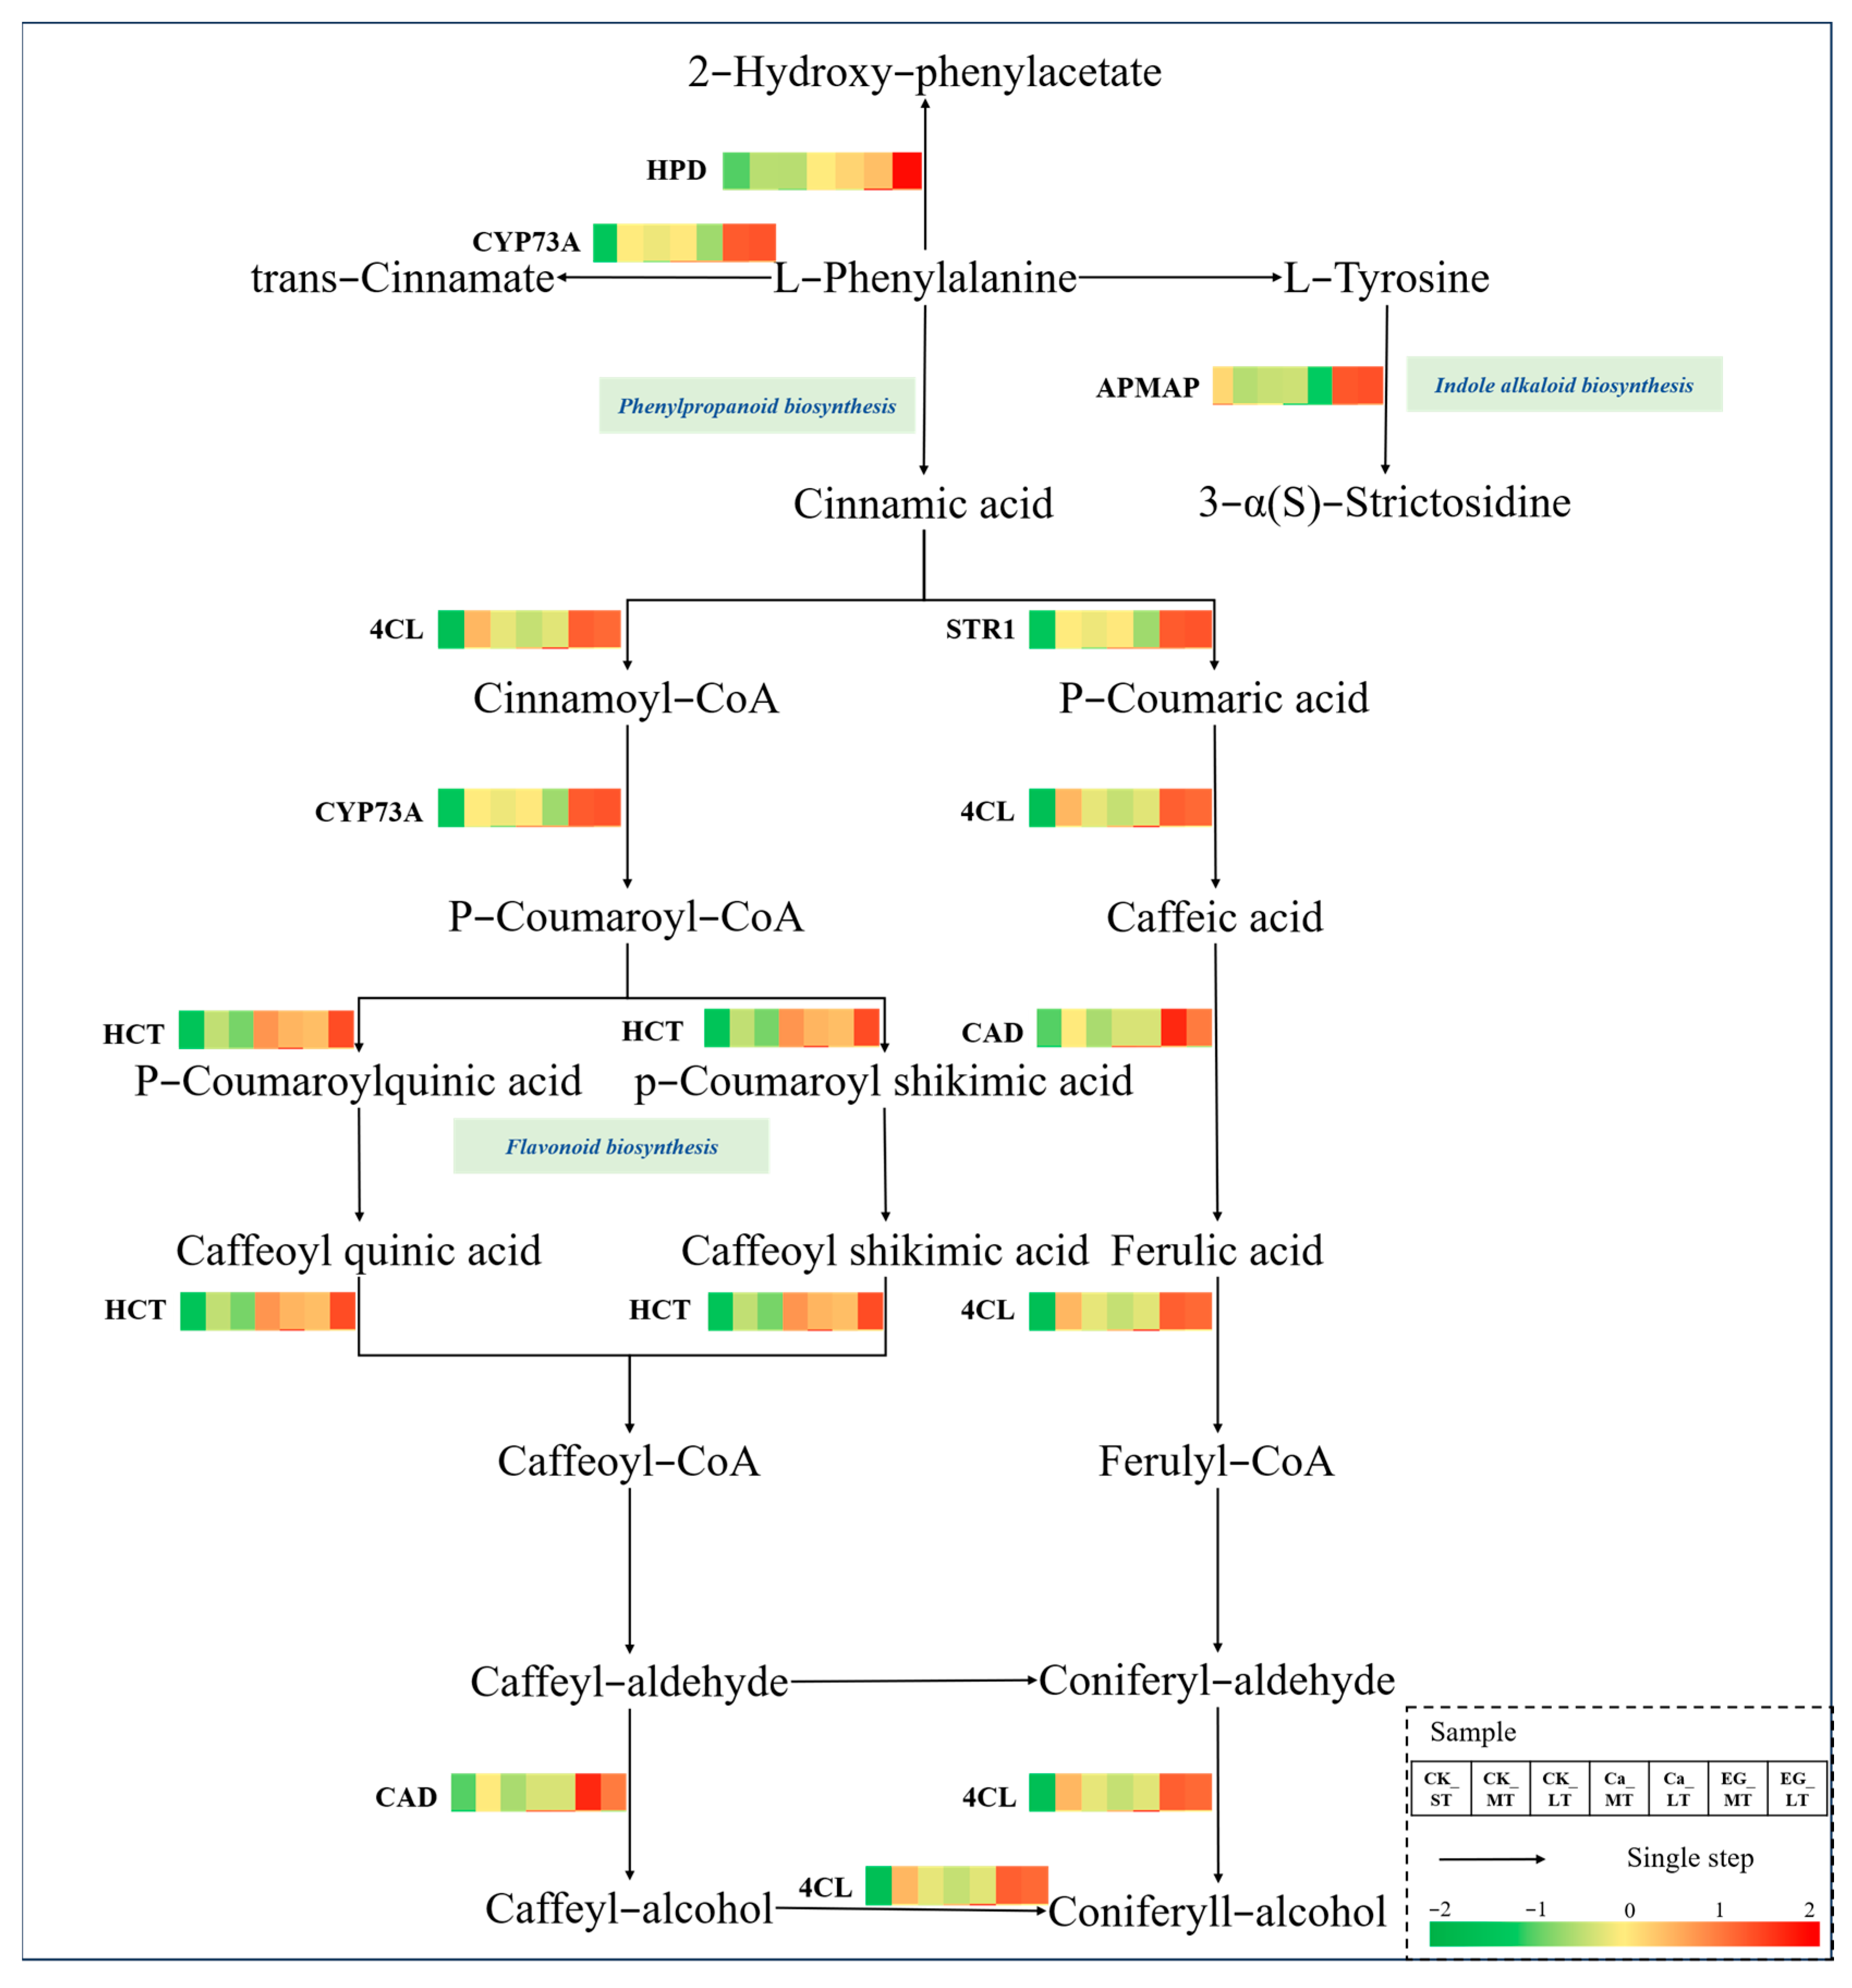
To further investigate the regulatory roles of calcium ions regarding the mechanisms by which the secondary metabolism responds to cold stress, secondary metabolism-related genes in Cluster 2 were mapped to the KEGG database, yielding the results shown in Figure 5. Seven DEGs were mapped to biosynthesis pathways, including phenylpropanoid biosynthesis, indole alkaloid biosynthesis, and flavonoid biosynthesis. Among them, HCT primarily participates in the flavonoid biosynthesis pathway, catalyzing the conversion of p-Coumaroyl-CoA to Caffeoyl-CoA. Ca2+ treatment induced HCT expression to first increase and then decrease, but it remained above the control. EGTA treatment caused continuous HCT upregulation, peaking at T30. Notably, CAD, 4CL, CYP73A, APMAP, and STR1 were unresponsive to Ca2+ treatment, but were significantly upregulated by EGTA.

3.7. Expression Analysis of Genes Related to RNA, Hormones, and Transport

To further elucidate the functional mechanism of calcium ions in regulating the stress response of L. japonica, RNA-, hormone-, and transport-related genes in Cluster 2 of Figure 3A were selected (Table 1). Among the hormone-related genes, three genes named brassinosteroid-responsive RING-H2 (BRH1), BRI1-associated kinase 1 (BAK1), and BRI1 EMS SUPPRESSOR 1/BRASSINAZOLE RESISTANT 1 (BES1/BZR1) were identified as being involved in the brassinosteroid (BR) signaling pathway. Notably, BRH1 was induced and activated during the late stages of cold stress. Although Ca2+ treatment did not significantly alter the expression trends of these three genes, the application of EGTA markedly enhanced BRH1 expression under cold stress. Regarding transport-related genes, calcium-binding protein CAST (CAST) exhibited a significant upregulation starting from the mid-phase of cold stress. Interestingly, Ca2+ appeared to suppress CAST expression under stress, whereas EGTA treatment substantially increased its transcript levels.
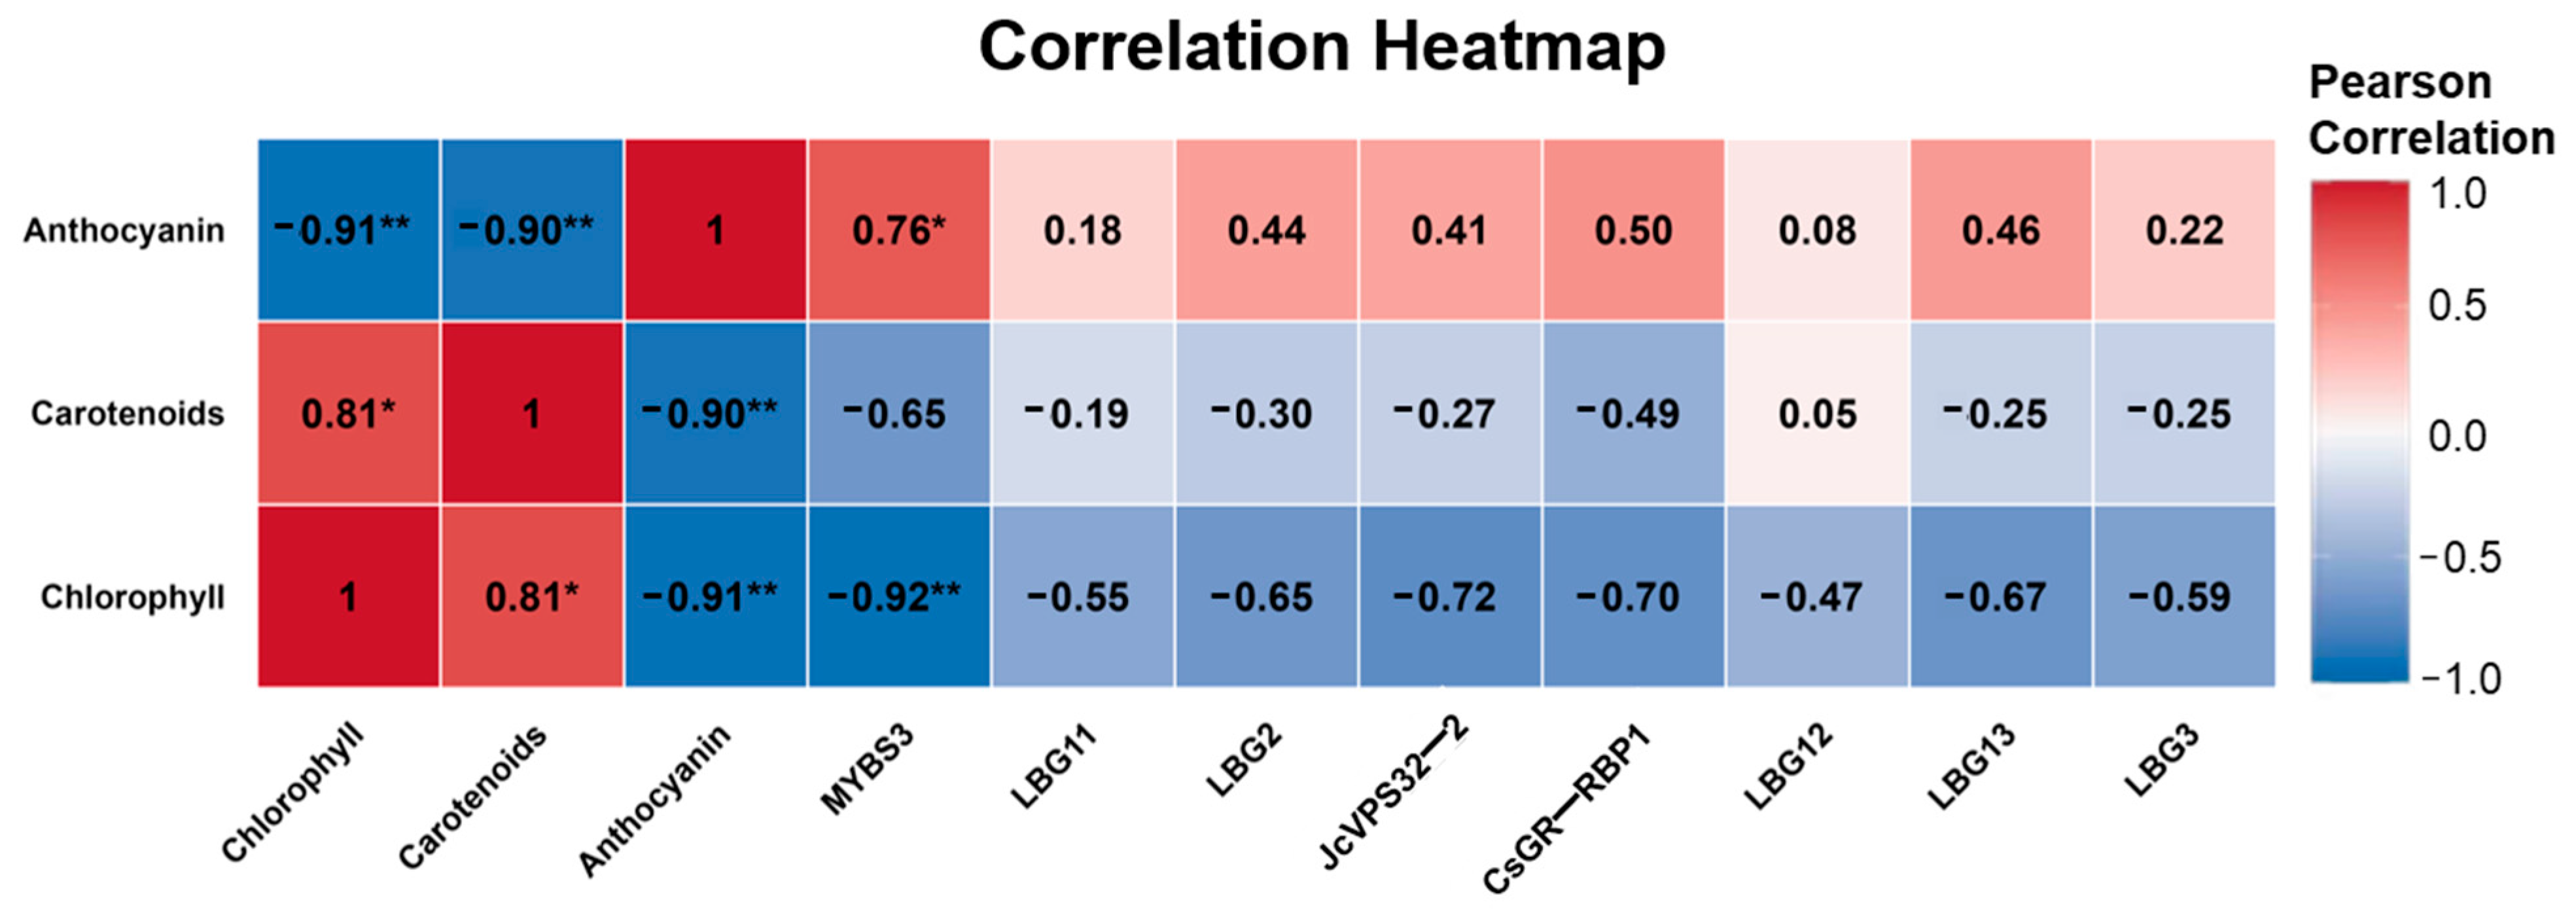
Additionally, eight RNA-related genes were identified (Table S2). Correlation analysis between the expression levels of these RNA-related genes and the contents of chlorophyll, anthocyanin, and carotenoid revealed that MYBS3 alone exhibited a significant association with pigment dynamics (Figure 6). Specifically, MYBS3 expression was negatively correlated with the chlorophyll content, but positively correlated with anthocyanin accumulation.

3.8. Gene Expression Analysis

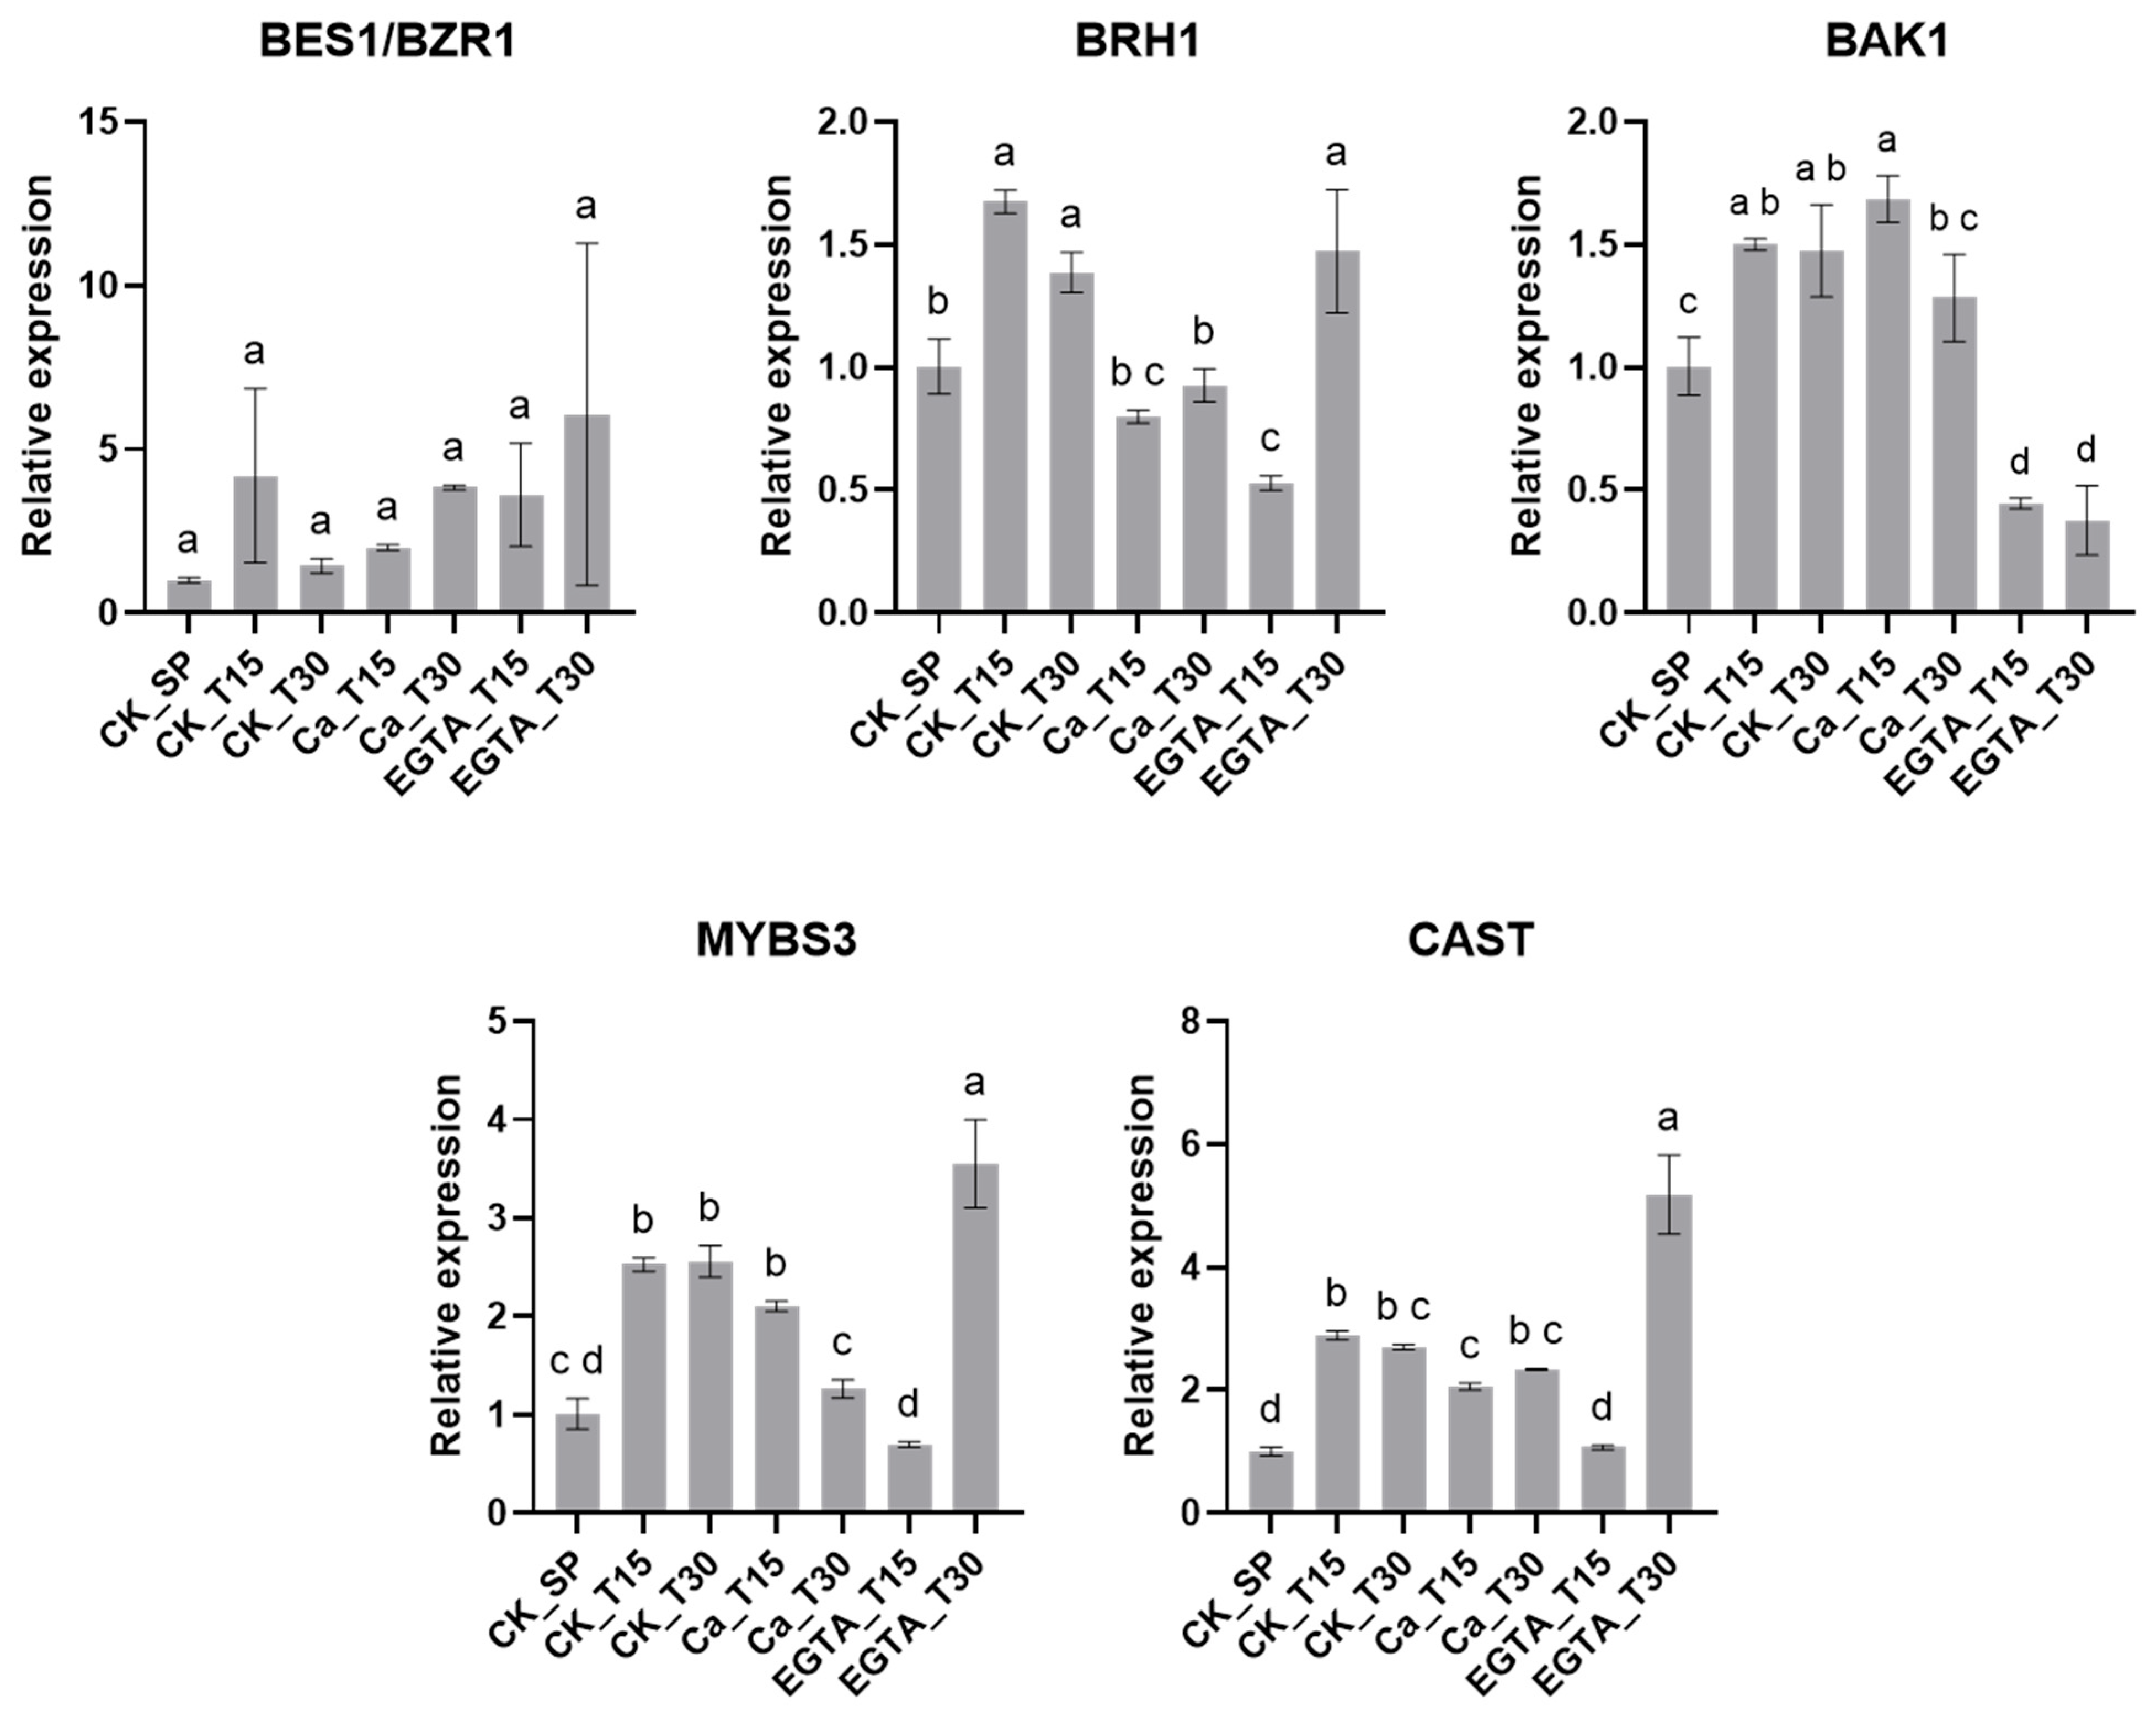
To identify critical TFs involved in calcium-regulated secondary metabolism under cold stress, we compared the genes from Cluster 2 with those reported in previous studies. Five potential TFs were identified, primarily associated with hormones, RNA, and the signaling function (Table 1). These candidates were subsequently validated using quantitative qRT-PCR (Figure 7). The expression of BES1/BZR1 remained relatively stable over time across all three treatment groups. BRH1 gene expression initially increased and then decreased as stress was prolonged in CK; in contrast, the EGTA treatment showed an opposite trend, with its expression decreasing and then increasing. In the Ca2+ treatment, BRH1 expression remained relatively stable throughout the cold stress. The expression of BAK1 in CK and Ca2+ treatments was significantly higher, but decreased significantly when treated with EGTA. The transcriptional expression of MYBS3 significantly increased in EGTA treatment compared to CK, and decreased under Ca2+ treatment. CAST gene expression increased over time in each treatment; its level of expression in the EGTA treatment was 417.53% higher than the CK treatment and 121.73% higher than the Ca2+ treatment.

4. Discussion

Enhanced leaf coloration induced by cold stress is a phenomenon commonly observed in many plants. Its core mechanism is generally attributed to the significant accumulation [30] of phenolic compounds, especially anthocyanins. Gao-Takai et al. [31] reported an increased total anthocyanin concentration and skin coloration in grapes under cold treatment. They also confirmed that grapes experiencing nocturnal cold stress during the color-changing period significantly promote anthocyanin synthesis [32]. Concurrently, calcium has been identified as a key mediator in cold stress signal transduction, alleviating cold injury through mechanisms such as membrane stabilization and reactive oxygen species scavenging [33]. As anthocyanin biosynthesis functions as an adaptive response to abiotic stress [34,35], calcium signaling is postulated to influence anthocyanin metabolism within the broader stress response network. Previous reports indicate that both exogenous calcium application and cold stress can independently stimulate anthocyanin accumulation in a variety of plant species [33,36]. In a previous study, it was indicated that the accumulation of anthocyanins in L. japonica under cold stress might be largely attributed to the elevation of calcium homeostasis and stimulation of BR signaling [37,38,39]. Further studies indicate that the regulation of the anthocyanin biosynthesis pathway via calcium ions is concentration-dependent. For instance, elevated concentrations of exogenous calcium ions significantly inhibit anthocyanin synthesis in grapes [40,41]. Interestingly, our experiments revealed that the application of exogenous calcium ions significantly reduced the synthesis of anthocyanins under cold stress, and the use of calcium chelators (such as EGTA) restored the capacity for anthocyanin synthesis. These results collectively demonstrate that, during stress responses to cold temperature in plants, the calcium ion regulation of anthocyanin synthesis exhibits a significant concentration-dependent effect. This provides important clues for the in-depth analysis of plant cold resistance mechanisms and the anthocyanin metabolic regulatory network. Moreover, KEGG pathway analysis in the current study indicated that both calcium supplementation and inhibition affect primary metabolism, particularly amino acid biosynthesis. EGTA treatment significantly upregulated the metE and AHCY genes involved in the L-Cysteine and L-Methionine metabolic pathways; the resulting sulfur- and methyl-containing metabolites act as donors for the phenylpropanoid pathway [42,43]. Key phenylpropanoid pathway genes, such as HCT and 4CL, were also upregulated during EGTA treatment. These results suggest that a calcium deficiency may promote anthocyanin synthesis through enhanced amino acid metabolism, thereby increasing the availability of phenylpropanoid precursors.
Our results demonstrate that under cold stress, the application of calcium channel blockers markedly suppresses the expression of BAK1, which is a pivotal co-receptor within the BR signaling cascade. Reduced BAK1 activity has been associated with the increased accumulation of reactive oxygen species, which can stimulate the synthesis of anthocyanin—a phenomenon observed under both cold and non-cold stress conditions [34,44,45]. BAK1 functions by forming a co-receptor complex with BRI1 to transduce BR signals downstream, activating transcription factors BZR1/BES1 that regulate BR-responsive gene expression [46]. Notably, Zhang et al. [24] reported that calcium signaling under cold stress activates BRI1 expression. Similarly, in our study, we identified that BRH1, a receptor-like kinase structurally homologous to BRI1, may participate in this calcium-mediated BR signaling pathway under cold conditions. Although a direct causal relationship between calcium-mediated BR signaling and anthocyanin biosynthesis requires further validation, our findings suggest that this pathway has a potential regulatory role in cold stress responses.
In addition, this study focused on changes in the expression of the transcription factor MYBS3. MYBS3 is a characteristic MYB transcription factor [47] known to regulate glucose signaling in rice [48] and is generally involved in cold stress responses [49] in a variety of plants. In this study, MYBS3 was significantly upregulated during cold stress, and this increase was observed in the presence of calcium channel blockers. Its expression dynamics were closely associated with anthocyanin accumulation. While its direct involvement in secondary metabolism remains largely unexplored, it is noteworthy that many MYB transcription factors function as key regulators of flavonoid and anthocyanin biosynthesis. Within the context of the stress response, the MYB-BR signaling module (e.g., SlMYB49) integrates hormone signaling and antioxidant defense systems, enhancing plant tolerance to abiotic stresses and highlighting the central role of this regulatory network in growth and adaptation [50]. Furthermore, MYB genes can promote anthocyanin biosynthesis by regulating the expression of UDP-glucose through flavonoid 3-O-glucosyltransferase [51]. It has also been reported that BR signaling suppresses the expression of specific MYB genes, such as MYB11 and MYB12, thereby modulating flavonoid biosynthesis, with MYB expression positively correlating with the flavonoid content [52]. Taken together, these findings underscore a complex regulatory network in which calcium signaling indirectly modulates anthocyanin biosynthesis through interactions with BR signaling and MYB transcription factors. These observations imply that MYBS3 is a cold-responsive transcriptional regulator with potential roles in coordinating calcium signaling and secondary metabolic pathways, including anthocyanin biosynthesis. Through transcriptome data mining and correlation analysis, we identified the potential role of MYBS3 in the calcium-mediated regulation of anthocyanin accumulation in L. japonica under cold stress. Although further functional validation is still lacking, this finding establishes a critical foundation for future investigations employing genetic approaches (e.g., overexpression/knockdown) and molecular biological techniques (e.g., validation of binding to target gene promoters) to elucidate the precise regulatory function of MYBS3 within this pathway.

5. Conclusions

In this study, we conducted a comprehensive transcriptomic analysis to investigate how calcium ions regulate anthocyanin biosynthesis in L. japonica under cold stress. Phenotypic and physiological data showed that exogenous calcium suppressed anthocyanin accumulation while maintaining chlorophyll levels, whereas EGTA-induced calcium chelation significantly enhanced anthocyanin synthesis and accelerated leaf coloration. Transcriptome profiling revealed 17,296 co-expressed genes and a set of calcium-responsive DEGs enriched in pathways associated with the secondary metabolism, hormone signaling, and stress response. Among them, transcription factors such as MYBS3 and BRH1 exhibited expression patterns that were tightly correlated with the pigment content, particularly under calcium-deficient conditions. These results suggest that calcium signaling influences anthocyanin biosynthesis not by directly activating structural genes, but by modulating upstream regulators involved in BR- and MYB-dependent transcriptional networks. Specifically, calcium may act as a suppressor of anthocyanin-related gene expression through downregulating BRH1 and MYBS3, which are strongly induced under EGTA treatment. This implies a calcium-sensitive regulatory mechanism where pigment metabolism is fine-tuned through hormonal and transcriptional crosstalk in response to environmental stress. Our findings uncover a new layer of complexity in cold-induced pigment regulation and identify candidate regulators that may inform future breeding strategies for improving both ornamental and stress-tolerant traits in L. japonica.

Supplementary Materials

The following supporting information can be downloaded at: https://www.mdpi.com/article/10.3390/horticulturae11091023/s1, Table S1: The sequence of primers used in this study; Table S2: The identified 8 genes related to RNA in Cluster 2 of Figure 3A.

Author Contributions

Conceptualization, J.C. and B.Y.; methodology, R.Q. and J.L. (Junle Lv); software, J.L. (Jiachen Li); validation, J.C. and W.Z.; formal analysis, P.W.; investigation, J.C. and W.Z.; resources, P.W.; data curation, J.L. (Junle Lv); writing—original draft preparation, J.C. and W.Z.; writing—review and editing, B.Y. and L.Z.; supervision, B.Y. and L.Z.; project administration, L.Z.; funding acquisition, B.Y. All authors have read and agreed to the published version of the manuscript.

Funding

This work was supported by the Zhejiang Province Key R&D Program Project (Grant No. 2023C04019), the Research Initiation Funding of Zhejiang Sci-Tech University (Grant No. 23042215-Y), and the Zhejiang Xinmiao Talents Program (Grant No. 2024R406A041).

Data Availability Statement

The data presented in this study are deposited in the National Center for Biotechnology Information Sequence Read Archive repository, accession number PRJNA903538.

Conflicts of Interest

The authors declare that they have no conflicts of interest.

Abbreviations

The following abbreviations are used in this manuscript:
TFtranscription factor
SPstart point
BRbrassinosteroid
BRH1brassinosteroid-responsive RING-H2
BAK1BRI1-associated kinase 1
BES1/BZR1BRI1 EMS SUPPRESSOR 1/BRASSINAZOLE RESISTANT 1
CASTcalcium-binding protein CAST
DEGsdifferentially expressed genes

References

  1. Miller, K.E.; Gorchov, D.L. The invasive shrub, Lonicera maackii, reduces growth and fecundity of perennial forest herbs. Oecologia 2004, 139, 359–375. [Google Scholar] [CrossRef] [PubMed]
  2. Chan, B.C.L.; Hon, K.L.E.; Leung, P.C.; Sam, S.W.; Fung, K.P.; Lee, M.Y.H.; Lau, H.Y.A. Traditional Chinese medicine for atopic eczema: PentaHerbs formula suppresses inflammatory mediators release from mast cells. J. Ethnopharmacol. 2008, 120, 85–91. [Google Scholar] [CrossRef]
  3. Liu, T.; Bai, H.; Wang, H.; Li, Y.; Wang, Z. Anti-inflammatory effects and mechanism of Plantago asiatica L. and Lonicera japonica Thunb. extracts based on canine and feline kidney cell models. J. Ethnopharmacol. 2025, 338, 119069. [Google Scholar] [CrossRef] [PubMed]
  4. Yang, X.; Yu, A.; Hu, W.; Zhang, Z.; Ruan, Y.; Kuang, H.; Wang, M. Extraction, Purification, structural characteristics, health benefits, and application of the polysaccharides from Lonicera japonica Thunb.: A Review. Molecules 2023, 28, 4828. [Google Scholar] [CrossRef]
  5. Wang, X.; He, J.; Su, X.; Xu, B.; Liu, Y.; Tang, Y.; Sun, S.; Li, P.; Zhao, C. Characterization of the complete chloroplast genome of Lonicera tangutica (Caprifoliaceae), an ornamental and medicinal plant in China. Mitochondrial DNA B Resour. 2022, 7, 535–536. [Google Scholar] [CrossRef] [PubMed]
  6. Paschalidis, K.; Fanourakis, D.; Tsaniklidis, G.; Tsichlas, I.; Tzanakakis, V.A.; Bilias, F.; Samara, E.; Ipsilantis, I.; Grigoriadou, K.; Matsi, T.; et al. Integrated nutrient management boosts inflorescence biomass and antioxidant profile of Carlina diae (Asteraceae)—An endangered local Endemic plant of crete with medicinal and ornamental value. Agriculture 2024, 14, 259. [Google Scholar] [CrossRef]
  7. Shang, X.; Pan, H.; Li, M.; Miao, X.; Ding, H. Lonicera japonica Thunb.: Ethnopharmacology, phytochemistry and pharmacology of an important traditional Chinese medicine. J. Ethnopharmacol. 2011, 138, 1–21. [Google Scholar] [CrossRef]
  8. Kong, D.-x.; Li, Y.-q.; Bai, M.; He, H.-j.; Liang, G.-x.; Wu, H. Correlation between the dynamic accumulation of the main effective components and their associated regulatory enzyme activities at different growth stages in Lonicera japonica Thunb. Ind. Crops Prod. 2017, 96, 16–22. [Google Scholar] [CrossRef]
  9. Li, R.; Kuang, X.; Wang, W.; Wan, C.; Li, W. Comparison of chemical constitution and bioactivity among different parts of Lonicera japonica Thunb. J. Sci. Food Agric. 2020, 100, 614–622. [Google Scholar] [CrossRef]
  10. Ding, Y.; Shi, Y.; Yang, S. Regulatory networks underlying plant responses and adaptation to cold Stress. Annu. Rev. Genet. 2024, 58, 43–65. [Google Scholar] [CrossRef]
  11. Theocharis, A.; Clément, C.; Barka, E.A. Physiological and molecular changes in plants grown at low temperatures. Planta 2012, 235, 1091–1105. [Google Scholar] [CrossRef] [PubMed]
  12. Miura, K.; Furumoto, T. Cold signaling and cold response in plants. Int. J. Mol. Sci. 2013, 14, 5312–5337. [Google Scholar] [CrossRef]
  13. Jiang, Y.; Chen, X.; Wang, F.; Li, X.; Qin, Z.; Fan, S.; Yan, N.; Xie, Y.; Zhao, R. Metabolomic response of Zizania latifolia to low-temperature stress and identification of the bZIP transcription factor family. GM. Crops Food. 2025, 16, 413–434. [Google Scholar] [CrossRef]
  14. Jiang, L.; Tian, X.; Li, S.; Fu, Y.; Xu, J.; Wang, G. The AabHLH35 transcription factor identified from Anthurium andraeanum is involved in cold and drought tolerance. Plants 2019, 8, 216. [Google Scholar] [CrossRef]
  15. Kamal, K.A.; Shah, F.A.; Zhao, Y.; Chen, Z.; Fu, S.; Zhu, Z.; Ren, J.; Liu, H. Genome-wide identification of the UGT genes family in Acer rubrum and role of ArUGT52 in anthocyanin biosynthesis under cold stress. BMC Plant Biol. 2025, 25, 288. [Google Scholar] [CrossRef]
  16. Knight, H.; Trewavas, A.J.; Knight, M.R. Cold calcium signaling in Arabidopsis involves two cellular pools and a change in calcium signature after acclimation. Plant Cell 1996, 8, 489–503. [Google Scholar] [CrossRef]
  17. Veremeichik, G.N.; Bulgakov, D.V.; Konnova, Y.A.; Brodovskaya, E.V.; Grigorchuk, V.P.; Bulgakov, V.P. Proteome-level investigation of Vitis amurensis calli transformed with a constitutively active, Ca2+-independent form of the Arabidopsis AtCPK1 gene. Int. J. Mol. Sci. 2023, 24, 13184. [Google Scholar] [CrossRef]
  18. Yang, G.; Shen, S.; Yang, S.; Komatsu, S. OsCDPK13, a calcium-dependent protein kinase gene from rice, is induced in response to cold and gibberellin. Plant Physiol. Biochem. 2003, 41, 369–374. [Google Scholar] [CrossRef]
  19. Fowler, S.; Thomashow, M.F. Arabidopsis transcriptome profiling indicates that multiple regulatory pathways are activated during cold acclimation in addition to the CBF cold response pathway. Plant Cell 2002, 14, 1675–1690. [Google Scholar] [CrossRef] [PubMed]
  20. Feng, D.; Wang, X.; Gao, J.; Zhang, C.; Liu, H.; Liu, P.; Sun, X. Exogenous calcium: Its mechanisms and research advances involved in plant stress tolerance. Front. Plant Sci. 2023, 14, 1143963. [Google Scholar] [CrossRef] [PubMed]
  21. Junyan, W.; Qiaowen, P.; Fahim, A.M.; Lulu, Z.; Hui, G.; Lijun, L.; Gang, Y.; Wangtian, W.; Yuanyuan, P.; Yan, F.; et al. Effects of exogenous calcium and calcium inhibitor on physiological characteristics of winter turnip rape (Brassica rapa) under low temperature stress. BMC Plant Biol. 2024, 24, 937. [Google Scholar] [CrossRef] [PubMed]
  22. Yang, W.; Xu, H.; Xiao, Q.; Li, X.; Shao, Q. Combined analysis of metabolome and transcriptome provides insights into metabolisms of chlorophylls, carotenoids, and flavonoids in the yellowing leaves of ‘HAES344’ macadamia. Sci. Hortic. 2023, 308, 111600. [Google Scholar] [CrossRef]
  23. Lichtenthaler, H.K.; Wellburn, A.R. Determinations of total carotenoids and chlorophylls a and b of leaf extracts in different solvents. Biochem. Soc. Trans. 1983, 11, 591–592. [Google Scholar] [CrossRef]
  24. Zhang, M.; Li, M.; Fu, H.; Wang, K.; Tian, X.; Qiu, R.; Liu, J.; Gao, S.; Zhong, Z.; Yang, B.; et al. Transcriptomic analysis unravels the molecular response of Lonicera japonica leaves to chilling stress. Front. Plant Sci. 2022, 13, 1092857. [Google Scholar] [CrossRef] [PubMed]
  25. Pu, X.; Li, Z.; Tian, Y.; Gao, R.; Hao, L.; Hu, Y.; He, C.; Sun, W.; Xu, M.; Peters, R.J.; et al. The honeysuckle genome provides insight into the molecular mechanism of carotenoid metabolism underlying dynamic flower coloration. New Phytol. 2020, 227, 930–943. [Google Scholar] [CrossRef] [PubMed]
  26. Kanehisa, M.; Goto, S. KEGG: Kyoto encyclopedia of genes and genomes. Nucleic. Acids. Res. 2000, 28, 27–30. [Google Scholar] [CrossRef]
  27. Livak, K.J.; Schmittgen, T.D. Analysis of relative gene expression data using real-time quantitative PCR and the 2(-Delta Delta C(T)) Method. Methods 2001, 25, 402–408. [Google Scholar] [CrossRef]
  28. Cai, Z.; Wang, C.; Chen, C.; Zou, L.; Yin, S.; Liu, S.; Yuan, J.; Wu, N.; Liu, X. Comparative transcriptome analysis reveals variations of bioactive constituents in Lonicera japonica flowers under salt stress. Plant Physiol. Biochem. 2022, 173, 87–96. [Google Scholar] [CrossRef]
  29. Brady, K.; Talbot, C.C., Jr.; Long, J.A.; Welch, G.; French, N.; Nicholson, D.; Bakst, M.R. Transcriptome analysis of blastoderms 481 exposed to prolonged egg storage and short periods of incubation during egg storage. BMC Genomics 2022, 23, 262. [Google Scholar] [CrossRef]
  30. Hormaetxe, K.; Hernández, A.; Becerril, J.M.; García-Plazaola, J.I. Role of red carotenoids in photoprotection during winter acclimation in Buxus sempervirens leaves. Plant Biol. 2004, 6, 325–332. [Google Scholar] [CrossRef]
  31. Gaiotti, F.; Pastore, C.; Filippetti, I.; Lovat, L.; Belfiore, N.; Tomasi, D. Low night temperature at veraison enhances the accumulation of anthocyanins in Corvina grapes (Vitis vinifera L.). Sci. Rep. 2018, 8, 8719. [Google Scholar] [CrossRef]
  32. Gao-Takai, M.; Katayama-Ikegami, A.; Matsuda, K.; Shindo, H.; Uemae, S.; Oyaizu, M. A low temperature promotes anthocyanin biosynthesis but does not accelerate endogenous abscisic acid accumulation in red-skinned grapes. Plant Sci. 2019, 283, 165–176. [Google Scholar] [CrossRef]
  33. Zhu, M.; Yu, J.; Tang, W.; Fan, S.; Bai, M.; Chen, M.; Yang, G. Role of calcium in regulating anthocyanin accumulation in ‘Manicure Finger’ grape berries. Sci. Hortic. 2019, 256, 108585. [Google Scholar] [CrossRef]
  34. He, Q.; Ren, Y.; Zhao, W.; Li, R.; Zhang, L. Low Temperature Promotes Anthocyanin Biosynthesis and Related Gene Expression in the Seedlings of Purple Head Chinese Cabbage (Brassica rapa L.). Genes 2020, 11, 81. [Google Scholar] [CrossRef]
  35. Kaur, S.; Tiwari, V.; Kumari, A.; Chaudhary, E.; Sharma, A.; Ali, U.; Garg, M. Protective and defensive role of anthocyanins under plant abiotic and biotic stresses: An emerging application in sustainable agriculture. J. Biotechnol. 2023, 361, 12–29. [Google Scholar] [CrossRef] [PubMed]
  36. Fu, D.; Qi, J.; Su, L.; Wang, X.; Wang, M.; Chen, B.; Yu, X.; Zhao, X.; Gao, W.; Guo, X.; et al. Chalcone synthase 2 (BpCHS2), a structural gene, was activated by low temperature to promote anthocyanin synthesis in Broussonetia papyrifera to improve its cold tolerance. Plant Physiol. Biochem. 2025, 222, 109656. [Google Scholar] [CrossRef]
  37. Petridis, A.; Döll, S.; Nichelmann, L.; Bilger, W.; Mock, H.P. Arabidopsis thaliana G2-LIKE FLAVONOID REGULATOR and BRASSINOSTEROID ENHANCED EXPRESSION1 are low-temperature regulators of flavonoid accumulation. New Phytol. 2016, 211, 912–925. [Google Scholar] [CrossRef] [PubMed]
  38. Lee, S.H.; Kim, S.H.; Park, T.K.; Kim, Y.P.; Lee, J.W.; Kim, T.W. Transcription factors BZR1 and PAP1 cooperate to promote anthocyanin biosynthesis in Arabidopsis shoots. Plant Cell 2024, 36, 3654–3673. [Google Scholar] [CrossRef]
  39. Lucchin, A.; Fouassier, H.; Robe, E.; Mbengue, M.; Aguilar, M.; San Clemente, H.; Vert, G.; Galaud, J.P.; Aldon, D. The calcium sensor AtCML8 contributes to Arabidopsis plant cell growth by modulating the brassinosteroid signaling pathway. Plant J. 2025, 121, e17179. [Google Scholar] [CrossRef]
  40. Martins, V.; Garcia, A.; Costa, C.; Sottomayor, M.; Gerós, H. Calcium- and hormone-driven regulation of secondary metabolism and cell wall enzymes in grape berry cells. J. Plant Physiol. 2018, 231, 57–67. [Google Scholar] [CrossRef]
  41. Martins, V.; Billet, K.; Garcia, A.; Lanoue, A.; Gerós, H. Exogenous calcium deflects grape berry metabolism towards the production of more stilbenoids and less anthocyanins. Food Chem. 2020, 313, 126123. [Google Scholar] [CrossRef]
  42. Tzin, V.; Galili, G. New insights into the shikimate and aromatic amino acids biosynthesis pathways in plants. Mol. Plant 2010, 3, 956–972. [Google Scholar] [CrossRef] [PubMed]
  43. López-Maury, L.; Marguerat, S.; Bähler, J. Tuning gene expression to changing environments: From rapid responses to evolutionary adaptation. Nat. Rev. Genet. 2008, 9, 583–593. [Google Scholar] [CrossRef]
  44. Zhang, S.; Li, C.; Ren, H.; Zhao, T.; Li, Q.; Wang, S.; Zhang, Y.; Xiao, F.; Wang, X. BAK1 Mediates light intensity to phosphorylate and activate catalases to regulate plant growth and development. Int. J. Mol. Sci. 2020, 21, 1437. [Google Scholar] [CrossRef]
  45. Catalá, R.; Medina, J.; Salinas, J. Integration of low temperature and light signaling during cold acclimation response in Arabidopsis. Proc. Natl. Acad. Sci. USA 2011, 108, 16475–16480. [Google Scholar] [CrossRef]
  46. Wang, Z.Y.; Nakano, T.; Gendron, J.; He, J.; Chen, M.; Vafeados, D.; Yang, Y.; Fujioka, S.; Yoshida, S.; Asami, T.; et al. Nuclear-localized BZR1 mediates brassinosteroid-induced growth and feedback suppression of brassinosteroid biosynthesis. Dev. Cell. 2002, 2, 505–513. [Google Scholar] [CrossRef]
  47. Huang, C.-K.; Lo, P.-C.; Huang, L.-F.; Wu, S.-J.; Yeh, C.-H.; Lu, C.-A. A single-repeat MYB transcription repressor, MYBH, participates in regulation of leaf senescence in Arabidopsis. Plant Mol. Biol. 2015, 88, 269–286. [Google Scholar] [CrossRef]
  48. Su, C.-F.; Wang, Y.-C.; Hsieh, T.-H.; Lu, C.-A.; Tseng, T.-H.; Yu, S.-M. A Novel MYBS3-Dependent Pathway Confers Cold Tolerance in Rice. Plant Physiol. 2010, 153, 145–158. [Google Scholar] [CrossRef]
  49. Yang, Q.S.; Gao, J.; He, W.D.; Dou, T.X.; Ding, L.J.; Wu, J.H.; Li, C.Y.; Peng, X.X.; Zhang, S.; Yi, G.J. Comparative transcriptomics analysis reveals difference of key gene expression between banana and plantain in response to cold stress. BMC Genomics 2015, 16, 446. [Google Scholar] [CrossRef] [PubMed]
  50. Zhang, P.; Wang, R.; Yang, X.; Ju, Q.; Li, W.; Lü, S.; Tran, L.P.; Xu, J. The R2R3-MYB transcription factor AtMYB49 modulates salt tolerance in Arabidopsis by modulating the cuticle formation and antioxidant defence. Plant Cell Environ. 2020, 43, 1925–1943. [Google Scholar] [CrossRef] [PubMed]
  51. Petroni, K.; Tonelli, C. Recent advances on the regulation of anthocyanin synthesis in reproductive organs. Plant Sci. 2011, 181, 219–229. [Google Scholar] [CrossRef] [PubMed]
  52. Liang, T.; Shi, C.; Peng, Y.; Tan, H.; Xin, P.; Yang, Y.; Wang, F.; Li, X.; Chu, J.; Huang, J.; et al. Brassinosteroid-activated BRI1-EMS-SUPPRESSOR 1 inhibits flavonoid biosynthesis and coordinates growth and UV-B stress responses in plants. Plant Cell 2020, 32, 3224–3239. [Google Scholar] [CrossRef] [PubMed]
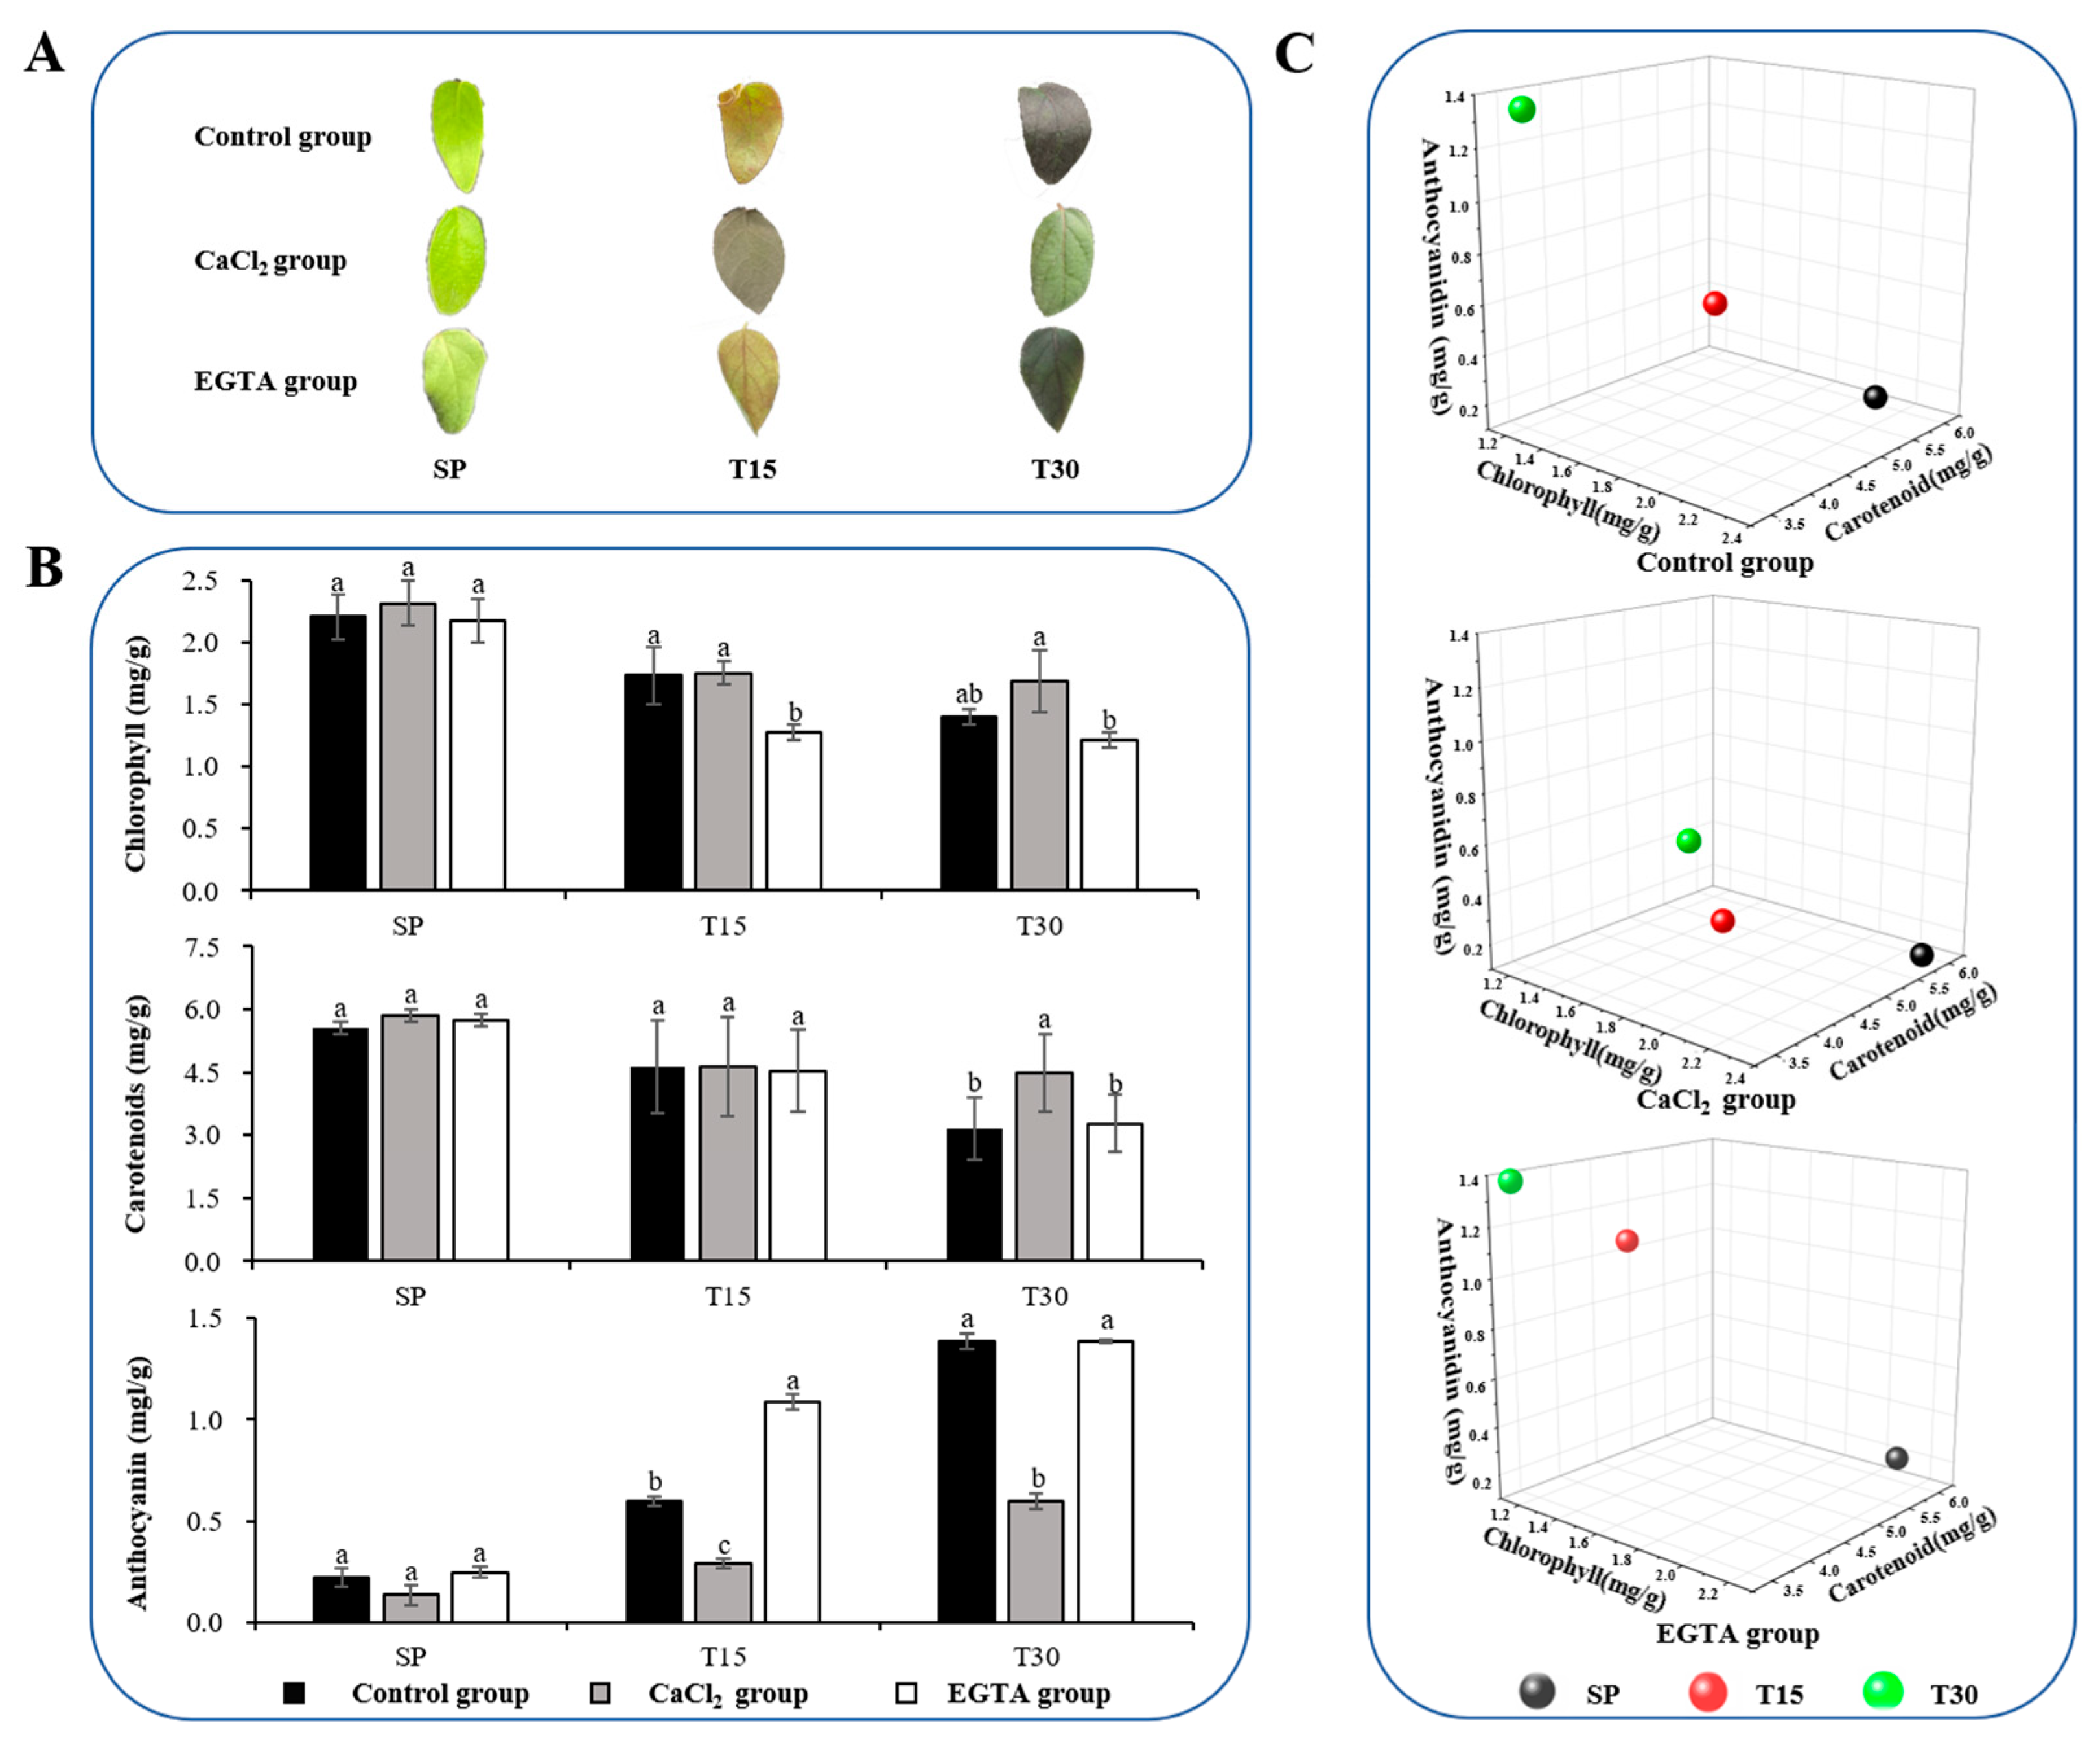
Figure 1. Morphophysiological changes in L. japonica leaves with various distributions of Ca2+ during cold stress. (A) Phenotypic changes in leaves treated with ddH2O, CaCl2, and EGTA under cold stress. SP: start point (treatment for 0 days); T15: treatment for 15 days; T30: treatment for 30 days. (B) Analysis of pigment content (total chlorophyll, carotenoids, and anthocyanins). Means with the same letter did not differ significantly among samples, while different letters indicate a significant change according to the one-way ANOVA test (p < 0.05). (C) Three-dimensional sphere diagram. Each sphere in the three-dimensional plot represents a sample, with its position determined by the content of chlorophyll, carotenoids, and anthocyanins in L. japonica leaves. The X-axis represents the chlorophyll content; the Y-axis represents the carotenoid content; and the Z-axis represents the anthocyanin content.
Horticulturae 11 01023 g001
Figure 2. UpSet plot showing the relationship between totally identified genes (A) and differentially expressed genes (DEGs) from co-expressed genes (B). CK_SP: start point in control group; CK_T15: treatment for 15 days in control group; CK_T30: treatment for 15 days in control group; Ca_T15: treatment for 15 days in Ca2+ treatment; Ca_T30: treatment for 30 days in Ca2+ treatment; EGTA_T15: treatment for 15 days in EGTA treatment; EGTA_T30: treatment for 30 days in EGTA treatment. (B) Schematic diagram of gene selection criteria. DEGs: differentially expressed genes.
Horticulturae 11 01023 g002
Figure 3. Hierarchical clustering of DEGs (A) and functional analysis of MapMan bin codes (B). Hierarchical clustering was performed using the R package heatmap alongside Euclidean distance and complete linkage. For annotation of MapMan bin codes, BLAST searches were conducted to identify Arabidopsis thaliana homologs of the target genes. Then, MapMan bin codes were assigned based on the corresponding Arabidopsis gene identifiers. DEGs from different clusters were separately classified according to MapMan bin codes.
Horticulturae 11 01023 g003
Figure 4. Pathway mapping of DEGs related to amino acid metabolism based on the KEGG database. Abbreviations are as follows: ilvE, branched-chain amino acid aminotransferase; ALT, alanine transaminase; ilvB, cetolactate synthase I/II/III large subunit; dapF, diaminopimelate epimerase; AHCY, Adenosylhomocysteinase; metK, S-adenosylmethionine synthetase; metE, 5-methyltetrahydropteroyltriglutamate–homocysteine methyltransferase. The gene expressions of DEGs were calculated prior to heatmap generation using Z-score normalization.
Horticulturae 11 01023 g004
Figure 5. Pathway mapping of DEGs related to secondary metabolism based on the KEGG database. Abbreviations are as follows: HPD, 4-hydroxyphenylpyruvate dioxygenase; CYP73A, trans-cinnamate 4-monooxygenase; APMAP, adipocyte plasma membrane-associated protein; STR1, srictosidine synthase; 4CL, 4-coumarate–CoA ligase; CAD, cinnamyl-alcohol dehydrogenase; HCT, shikimate O-hydroxycinnamoyltransferase.
Horticulturae 11 01023 g005
Figure 6. RNA gene correlation analysis with pigment contents. The value within each cell represents the Pearson correlation coefficient for the corresponding pair of variables. The color gradient indicates the direction and strength of the correlation (red denotes positive correlation and blue denotes negative correlation; darker shades represent larger absolute values of Pearson correlation coefficient). Asterisks (*) within cells denote statistical significance levels: * p < 0.05, ** p < 0.01 (two-tailed test).
Horticulturae 11 01023 g006
Figure 7. Expression changes in three groups of genes under cold stress. Means with the same letter do not differ significantly among samples, while different letters indicate a significant change according to the one-way ANOVA test (p < 0.05).
Horticulturae 11 01023 g007
Table 1. FPKM expression values of genes related to RNA, hormones, and signaling.
No.Description aFunction bFPKM Value
CK_SPCK_T15CK_T30Ca_T15Ca_T30EGTA_T15EGTA_T30
1MYBS3RNA157.39167.3984.15148.52155.14246.83215.14
2BRH1Hormone46.1546.1554.0041.1844.84104.06106.58
3BAK1Hormone32.4732.4731.2032.6830.0639.8537.43
4BES1/BZR1Hormone25.9324.8124.1426.0831.1138.5428.36
5CASTSignaling43.8680.3266.4068.5255.27124.24113.34
Footnotes: a Description: genes are based on the best BLASTn hits in the NCBI nr database (E-value < 1 × 10⁻⁵), b Function: annotation was conducted using Mapman bin codes. BRH1: brassinosteroid-responsive RING-H2; BAK1: BRI1-associated kinase 1; BES1/BZR1: Bri1-EMS-Suppressor 1 and brassinazole-resistant 1 family; CAST: calcium-binding protein CAST.
Disclaimer/Publisher’s Note: The statements, opinions and data contained in all publications are solely those of the individual author(s) and contributor(s) and not of MDPI and/or the editor(s). MDPI and/or the editor(s) disclaim responsibility for any injury to people or property resulting from any ideas, methods, instructions or products referred to in the content.