Article

Basic Characteristics, Superior Individual Selection, and Comprehensive Evaluation of 12 Wild Vernicia fordii (Vernicia fordii (Hemsl.) Airy Shaw) Trees in the Hunan–Guizhou Region

1
State Key Laboratory of Utilization of Woody Oil Resource, Changsha Technology Innovation Center for Woody Oil Quality and Efficiency Improvement, Key Laboratory of Cultivation and Protection for Non-Wood Forest Trees of Ministry of Education, Hunan International Joint Research Center for Tropical Arid Economic Forests Along the “Belt and Road”, Hunan Lutou Forest Ecosystem National Observation and Research Station, Central South University of Forestry and Technology, Changsha 410004, China
2
Hunan Wugang Tung Tree Science and Technology Courtyard, Wugang 422400, China
*
Authors to whom correspondence should be addressed.
Horticulturae 2025, 11(9), 1024; https://doi.org/10.3390/horticulturae11091024
Submission received: 15 July 2025 / Revised: 4 August 2025 / Accepted: 18 August 2025 / Published: 1 September 2025
(This article belongs to the Section Genetics, Genomics, Breeding, and Biotechnology (G2B2))

Abstract

The tung tree, a crucial woody oil plant, serves as a premium raw material for eco-friendly coating production, yet its short lifespan (typically under 20 years) and lack of asexual reproduction have led to resource losses. This study surveyed wild tung trees in the Hunan–Guizhou region, focusing on older and high-fruit-yielding specimens. After two years of investigation, selected individuals were conserved in the Wugang Tung Tree Germplasm Resource Bank to provide high-quality materials for breeding superior varieties. Comparative analysis of fruit yield and commercial traits from 60 wild trees identified 12 superior individuals for secondary selection, with notable trait variations observed. Using the entropy weight-TOPSIS method, superior individual FT01 exhibited the highest relative closeness (C = 0.6836), indicating optimal overall traits, while FT01, XY12, JX01, WG25, and WG31 (all with C > 0.50) demonstrated good overall performance. Genetic diversity analysis of these 12 individuals, employing 14 SSR primers, revealed 33 alleles (average 2.2142 per primer), Shannon’s information index values ranging from 0.1973 to 0.9723 (average 0.5325), and polymorphism information content between 0.1486 and 0.5833 (average 0.3981), indicating high genetic diversity. UPGMA clustering divided the superior trees into five groups, with FT01, WG25, JX01, and XY12 in separate groups, all exhibiting high yield and large fruit size, consistent with TOPSIS results. Consequently, FT01, XY12, JX01, WG25, and WG31, with the highest comprehensive evaluation scores and richest genetic diversity, are prioritized as candidate materials for new variety selection and breeding.

1. Introduction

The tung tree (Vernicia fordii) is a member of the Euphorbiaceae family and a native tree species of China that has been cultivated for more than 1000 years. Along with the oil-tea tree (Camellia oleifera Abel), walnut (Juglans regia L.), and tallow tree (Sapium sebiferum (L.) Roxb.), the tung tree is one of four major woody oil trees in China. Its fruit is rich in oil, and it is an excellent raw material for manufacturing industrial products such as lacquer, pigments, and ink [1]. Furthermore, tung trees possess medicinal and timber utilization value, making them widely used in furniture manufacturing, box material production, and other fields. As a typical mid-subtropical tree species, tung trees favor regions with abundant sunshine and a warm climate. They are distributed across a vast area in China, spanning from 18°30′ N to 34°30′ N latitude and 97°50′ E to 122°07′ E longitude [2]. Specifically, tung trees are found in 20 provinces (autonomous regions and municipalities directly under the central government), covering approximately one-fourth of China’s land area, with Hunan and Guizhou Provinces being the most concentrated distribution areas [3]. Tung trees flourished during the 1960s and 1970s due to their high practical value. However, in the late 1980s, with the synthesis of chemical paints that were cheap and widely used due to poor environmental and health awareness, the demand for tung oil plummeted, leading to a lower price [4]. As a result, farmers switched to cultivating other tree species, and the government did not prioritize the protection of tung tree resources, resulting in significant destruction of these resources. With the heightened awareness of environmental protection, tung oil, as a high-quality coating material that is green and pollution-free, has witnessed a gradually increasing market demand. However, there is a shortage of elite varieties, necessitating the exploration and promotion of superior varieties through selecting superior individuals.
Considerable progress has been made in the field of tung tree elite individual selection methods and related indicator measurements. Researchers such as Xu Jie [5], Sun Ye [6], and Shuang Deliang [7] have systematically selected elite individual tung trees based on the yield and commercial traits of the fruits. Cai Xinling et al. [8] focused on the tung tree resources in the Dabie Mountains of Anhui Province and screened out 5 elite individuals from 45 individual trees through preliminary, secondary, and final selection phases. They also identified nine indicators, including yield, fresh weight per fruit, and kernel oil content, as crucial for selecting elite tung trees. Wu Huawei [9] evaluated the germplasm resources of tung trees in the Sichuan–Chongqing region, but his research was primarily limited to tung tree seeds. Wen Shanna [10] investigated the commercial traits of 36 elite families in Yongshun County, Hunan Province, and evaluated flower characteristics, fruit quantity characteristics, tree morphological characteristics, fruit commercial traits, and oil physicochemical properties. Most of these studies focused on measuring and analyzing the commercial traits of tung tree fruits and the physicochemical properties of the oil. However, few studies have comprehensively examined the phenotypic characteristics, commercial traits, physiological and biochemical indicators, anatomical structures, and genetic characteristics of elite tung trees.
Hunan and Guizhou Provinces are the main production areas for tung trees, boasting abundant wild tung tree resources [3]. However, these resources are mixed, with numerous tung tree individuals of varying quality and significant differences in yield. Therefore, selecting elite individual wild tung trees is of great significance for improving tung oil quality, increasing yield, and promoting the sustainable development of the tung oil industry. This study aimed at preliminary selection of wild tung tree resources in the Hunan and Guizhou regions by comparatively analyzing the commercial traits of fruits, utilizing the principal component analysis (PCA) [11] and the “rationality satisfaction” elite individual evaluation model [12]. Further secondary selection and a comprehensive evaluation were carried out to identify superior varieties, providing scientific evidence and technical support for the development of the tung tree industry. We hope to offer new ideas and methods for conserving and utilizing wild tung tree resources in the Hunan and Guizhou regions, driving the transformation, upgrade, and sustainable development of the tung tree industry. This study will provide a valuable reference for selecting elite individuals and comprehensively evaluating tung trees in other regions.

2. Materials and Methods

2.1. Scope and Criteria for Selecting Elite Individuals

The scope of selection for superior tung tree individuals encompasses Shaoyang City, Hengyang City, Zhuzhou City, Xiangxi Autonomous Prefecture in Hunan Province, and Xingyi City in Guizhou Province. After the initial selection process, the superior individuals were primarily distributed in Shaoyang City and Xingyi City. Shaoyang City is located in southwestern central Hunan, upstream of the Zijiang River between 25°58′ to 27°40′ N latitude and 109°49′ to 112°57′ E longitude, with a total area of 20,824 km2. Shaoyang City is situated in a subtropical zone characterized by a typical mid-subtropical humid monsoon climate [13]. Xingyi City is located in southwest Guizhou Province and southwest of Qianxinan Buyei and the Miao Autonomous Prefecture, which borders Anlong and Xingren. It is the capital of Qianxinan Buyei and Miao Autonomous Prefecture and serves as the political, economic, cultural, and informational hub of the prefecture, with a jurisdictional area of 2915 km2 [14].

2.2. Method for Selecting Elite Individuals

2.2.1. Indicator Measurements and Comprehensive Evaluation for the Preliminary Selection of Elite Individuals

We conducted a survey of wild tung tree resources in Hunan and Guizhou Provinces from September 2022 to June 2025. Through field visits and guidance from local forest farmers, 60 trees that were planted in the 1980s, scattered in various areas, and characterized by old age, high individual yield, good growth, complete tree shape, minimal pest and disease infestation, and strong stress resistance were selected as preliminary elite individuals (Table S1 in Supplementary Materials). As a whorled-branch tree species, tung trees add a new branch annually during growth. Based on this feature, we accurately estimated the age of tung trees by counting the number of nodes on their branches. Tree yield was measured during the fruit ripening period in October and November, and fruit characteristics were recorded. Twenty fruits were picked from each sampled tree to measure individual fruit weight. Vernier calipers were used to measure the peel thickness, transverse diameter, and longitudinal diameter of the fruit. Additionally, the Soxhlet extraction method was employed to extract tung oil, and the fresh seed yield rate, dry kernel yield rate, and kernel oil content were calculated. All experimental groups were designed with three replicates, and each replicate was measured twice to obtain the average value.

2.2.2. Fatty Acid Composition of the Oil from the Selected Elite Individuals in the Secondary Selection

Prior to the determination of fatty acid composition, tung oil was first extracted. The dehulled kernels were placed in an oven at 105 ± 2 °C and dried to a constant weight. For each superior individual tree, 5 g of kernels were weighed out, and tung oil was extracted using the Soxhlet extraction method. The fatty acid composition of the oil was determined by gas chromatography. The chromatographic column used was a fused silica capillary column (60 m × 0.25 mm × 0.25 μm), and the detector was a hydrogen flame ionization detector. Nitrogen was the carrier gas, and the injector and detector temperatures were 250 °C. The split ratio was 100:1, and the column temperature was maintained at 190 °C. The fatty acid composition was calculated using the area normalization method [15].

2.2.3. Physicochemical Properties of the Tung Oil from the Selected Elite Individuals in the Secondary Selection

The titration method was employed to determine the acid value, iodine value, and saponification value of the tung oil samples. Each tung oil sample (2 g) was mixed with alcohol and ether to determine the acid value and then titrated with a potassium hydroxide (KOH)–alcohol solution until a pink color endpoint was reached, and the acid value was calculated. The tung oil sample (0.2 g) was reacted with chloroform and Wiesner’s reagent to determine the iodine value, followed by titration with sodium thiosulfate until a color change endpoint was observed, from which the iodine value was derived. The saponification value was determined by placing the tung oil sample (2 g) in a refluxing KOH-ethanol solution, and the remaining alkali was titrated with a standard hydrochloric acid solution to facilitate calculation of the saponification value [16].

2.2.4. Evaluating the Floral Phenotypic Characteristics of Selected Superior Trees

At least three branches were sampled from each tree during the peak flowering stage. Subsequently, these branches were counted, and the number of female flowers on each branch was recorded.

2.2.5. Chlorophyll Content of the Selected Elite Individuals in Secondary Selection

Chlorophyll content was determined using the colorimetric method. Fresh leaves with the midribs removed were chopped, and 2 g of the chopped leaves were weighed. Quartz sand, calcium carbonate, and 3 mL of 95% ethanol were added to a mortar, and the mixture was ground until a homogeneous slurry was formed. An additional 10 mL of ethanol was then added, and grinding was continued until the tissue was completely decolorized. The extract was diluted to an appropriate concentration, and absorbance was measured at wavelengths of 665 nm and 649 nm (or 645 nm) using a UV-visible spectrophotometer [17].

2.2.6. Anatomical Structure and Photosynthetic Characteristics of the Leaves from Selected Superior Individuals

Leaf slides were prepared using the nail polish impression method, and stomatal characteristics were observed and photographed under an optical microscope (BX51 Olympus, the manufacturer is Olympus Corporation, Tokyo, Japan). Five different visual fields were randomly selected for photography to determine the stomatal density of the leaves. The anatomical structure of the leaves was observed using the paraffin sectioning method [18,19]. The thicknesses of the upper epidermis, lower epidermis, palisade tissue, and spongy tissue were measured with Image-Pro Plus 6.0 software, along with the areas of the mesophyll cells (M) and bundle sheath cells (BS). The proportion of bundle sheath cells (%BS) was calculated using the formula %BS = BS area/(BS area + M area). The top grafting method was used to conserve and propagate the re-selected superior clones in the germplasm resource conservation bank of the Hunan Wugang Tung Tree Science and Technology Courtyard. Subsequently, the photosynthetic capacity of the grafted trees of these clones was measured using the LI-6400 Portable Photosynthesis System manufactured by LI-COR, Inc. (Lincoln, NE, USA). The main measurement indicators included the net photosynthetic rate (Pn), stomatal conductance (Gs), intercellular CO2 concentration (Ci), and transpiration rate (Tr) [20,21].

2.2.7. Simple Sequence Repeat (SSR) Molecular Marker and Cluster Analyses of the Selected Elite Trees in Secondary Selection

Leaf samples were collected from the selected elite trees, and high-quality genomic DNA was extracted [22]. Based on 68 published SSR primer sequences specific to tung oil, suitable primers were selected for polymerase chain reaction (PCR) amplification [23]. The SSR primers were synthesized by General Biosystems Co., Ltd. (Nanqiao District, Chuzhou City, Anhui Province, China). The selected SSR primers were used to amplify the target tung oil genomic DNA. Bands that appeared clearly at the same position on the electrophoresis profile were recorded as “1”, and the absence of a band was recorded as “0”. The band information was converted into a raw matrix consisting of “0” or “1”. Popgene32 was used to calculate the number of alleles (Na), effective number of alleles (Ne), observed heterozygosity (Ho), expected heterozygosity (He), and Shannon’s information index (I). PowerMarker- 3.25 software was used to calculate the polymorphism information content (PIC). NTSYSpc-2.11F software was used to calculate the genetic similarity coefficient. Based on Nei’s genetic distance, the unweighted pair group method with arithmetic mean (UPGMA) method was performed in the SHAN program for the cluster analysis.

2.2.8. Comprehensive Evaluation Method for the Selected Elite Trees

A comprehensive evaluation of the selected elite plants was based on the entropy weight–technique for order of preference by similarity to ideal solution (TOPSIS) method [24]. A matrix was first established according to the steps of the entropy weight–TOPSIS method, a raw indicator, which included measurement indicators such as the individual plant yield, oil yield per plant, single fruit weight, rate of oil extraction from fresh seeds, rate of oil extraction from dry kernels, oil content, acid value, linolenic acid content, leaf area, chlorophyll a + b content, stomatal density, tissue density, and pollen viability. Large numerical features can dominate the distance calculation results, so the data were standardized first. Then, the entropy method was used to assign weights to each indicator and form a weighted matrix. Finally, a comprehensive score for each individual was calculated.

2.2.9. Data Statistics and Analytical Methods

All raw data were processed using Microsoft Office Excel 2019 (Microsoft Inc., Redmond, WA, USA). Graphs were plotted using Origin 2018 (Origin Laboratories, Northampton, MA, USA), and differences were tested using SPSS 23.0 software (SPSS Inc. Chicago, IL, USA). A comprehensive evaluation was conducted on 60 initially selected superior individuals using principal component analysis and the “rationality-satisfaction” evaluation model. One-way analysis of variance and Duncan’s multiple range test were used to detect differences between the treatment means. A p-value < 0.05 was considered significant. PCA was conducted using SPSS 23.0 software to comprehensively analyze fruit quality. Adobe Photoshop cc 2018 (Adobe Systems Inc., San Jose, CA, USA) was used for graphic design and layout.

3. Results

3.1. Screening of the Preliminary Elite Trees

After field investigations and rigorous measurements, we conducted on-site yield assessments of 60 elite tung tree individuals (Table S2 in Supplementary Materials) and recorded their commercial fruit traits in detail (Table S3 in Supplementary Materials). Statistical methods were used to perform correlation analysis (Figure S1 in Supplementary Materials) and PCA (Table S4 in Supplementary Materials) on the commercial fruit traits, to understand the relationships and main factors influencing the traits. A comprehensive evaluation of the 60 elite individuals was conducted combined with the rational satisfaction evaluation model, and their scores were calculated and ranked (Table S5 in Supplementary Materials). The results showed that 12 elite trees, namely FT01, XY12, WG25, XY07, YS01, JX01, WG16, XY01, WG21, WG31, WG23, and WG30, were selected for the secondary selection stage (Figure 1). As shown in Table 1, only the yield of superior strain WG30 was <40 kg, while the yield of superior strain FT01 was 111.7 kg. The fruit size and oil yield of these 12 superior strains were at relatively high levels.

3.2. Comparative Analysis of Oil Quality Among the Selected Elite Trees in Secondary Selection

3.2.1. Comparative Analysis of Fatty Acid Composition Among the Selected Elite Trees in Secondary Selection

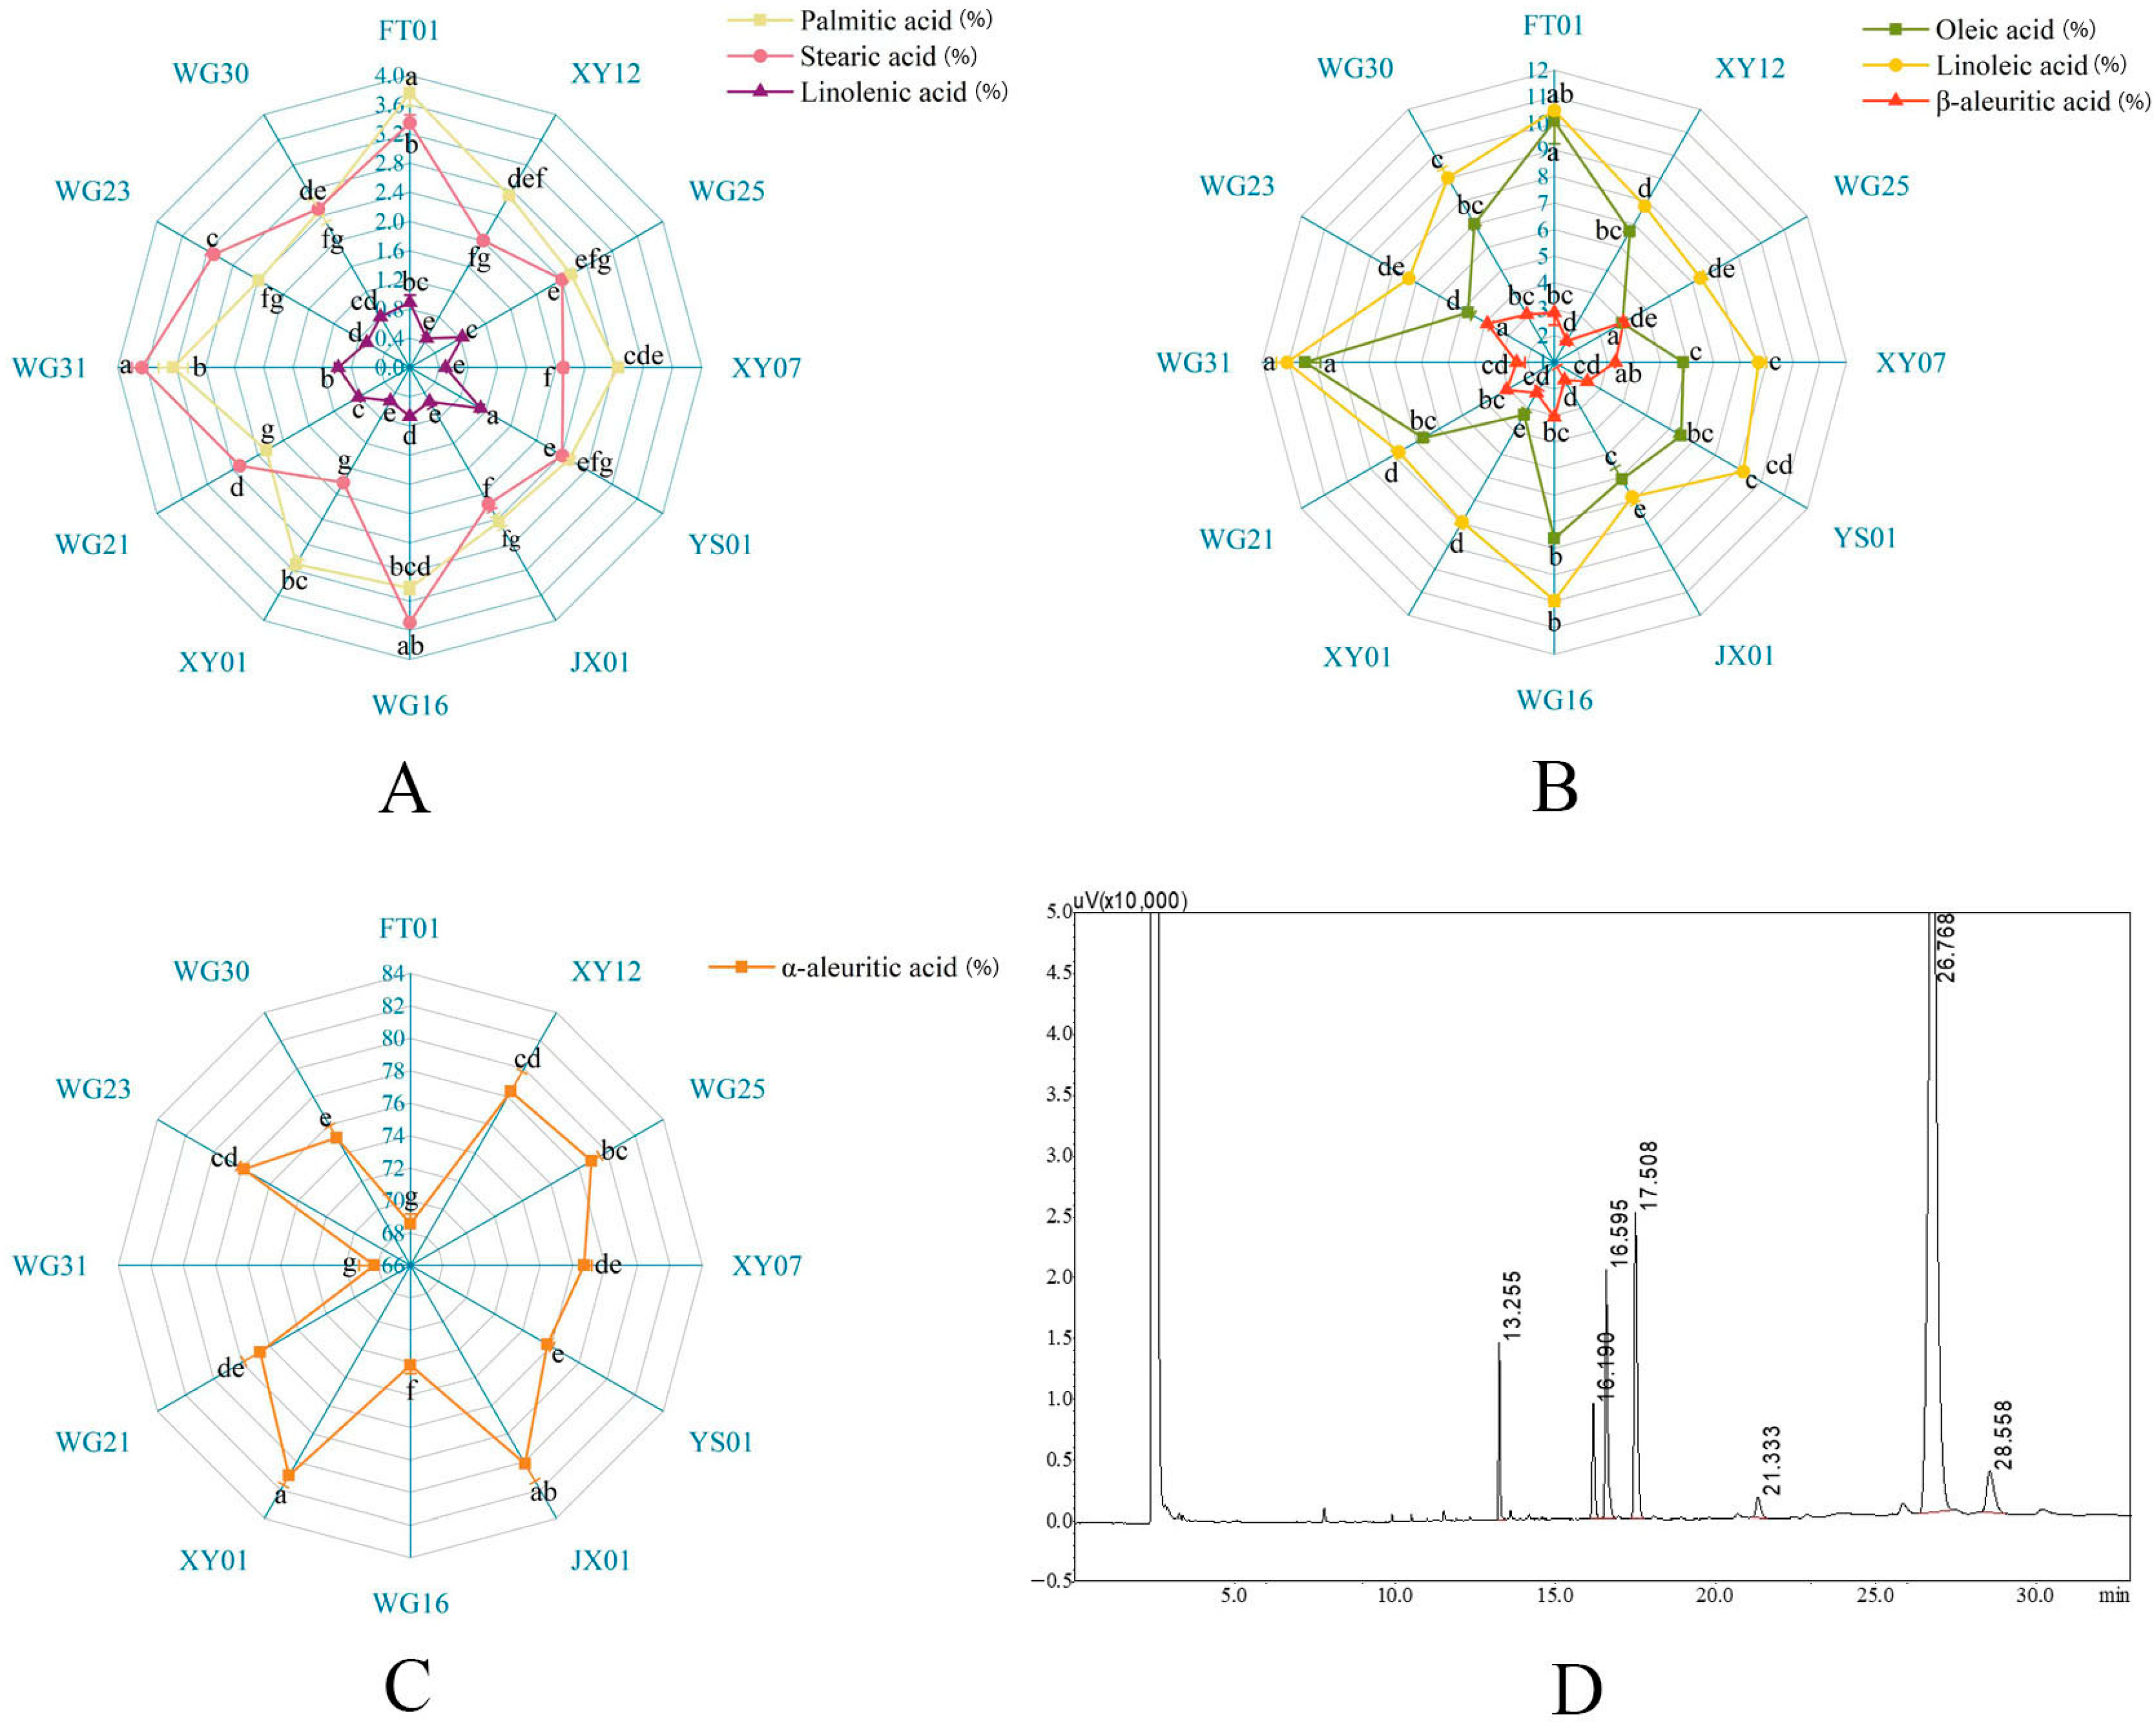
The fatty acid composition of the 12 selected elite trees consisted of unsaturated fatty acids (UFAs) and a small amount of saturated fatty acids (SFAs) (Figure 2). The SFAs in tung oil are composed of palmitic acid and stearic acid, while the UFAs include eleostearic acid, oleic acid, linolenic acid, and linoleic acid. The SFA content of the 12 selected elite trees ranged from 4% to 7%, and the UFA content ranged from 93% to 96%. The average UFA content of the selected elite trees was 94.58%, with the highest UFA content observed in JX01 (95.40%) and the lowest in FT01 (92.89%). The average eleostearic acid content of the selected elite trees was 78.63%, and those with eleostearic acid content exceeding 80% included WG25, JX01, XY01, XY12, WG23, and XY07. In particular, XY01 had the highest eleostearic acid content of 83.31%, while WG31 had the lowest content of 70.66%. Among the selected elite trees, XY01 had the highest α-eleostearic acid content of 80.98%, and WG31 had the lowest α-eleostearic acid content of 68.23%. WG25 had the highest β-eleostearic acid content, with an average of 4.01%, while JX01 had the lowest β-eleostearic acid content, with an average of 1.77%.

3.2.2. Comparative Analysis of the Physicochemical Properties of the Oil from Selected Elite Individuals in Secondary Selection

Significant differences were observed in the acid, iodine, and saponification values between the 12 selected elite trees during secondary selection (Table 2). The order of the coefficients of variation (CVs), from largest to smallest, was acid value > saponification value > iodine value. The acid value ranged from 0.69 to 2.82 mg/g, with no significant difference between WG23 and WG30, but both were significantly higher than those of the other elite trees at 2.81 mg/g and 2.82 mg/g, respectively. The iodine value ranged from 140.91 to 182.59 g/100 g, with significant differences between all elite individuals. JX01, YS01, and WG31 had the highest iodine values, at 182.59, 176.74, and 175.96 g/100 g, respectively. The saponification value ranged from 152.06 to 208.53 mg/g, with significant differences between all elite individuals. YS01 and JX01 had the highest saponification values at 208.53 mg/g and 201.70 mg/g, respectively.

3.3. Comparative Analysis of Growth Traits Among the Reselected Elite Strains

3.3.1. Comparative Analysis of Floral Phenotypic Characteristics and Pollen Quality

The CVs for flower quantity and the proportion of female flowers among the 12 re-selected superior strains were extremely high (Figure 3A), indicating substantial potential for further screening and selection. The flower count ranged from 1 to 44.67, with an average of 25.11. The superior plant WG21 had a significantly higher flower count than the others, while XY01 was monoecious and had a significantly lower flower count. The proportion of female flowers ranged from 13.37% to 100.00%, with an average of 31.11%. XY01 had a significantly higher proportion than the other plants, while WG16 and WG30 were not significantly different from each other but were significantly lower than the rest.

3.3.2. Comparative Analysis of Pigment Contents in the Leaves of Selected Elite Plants

Determining the chlorophyll content in the leaves of superior plants is crucial for assessing their growth and developmental level as well as nutritional status, as it provides a basis for comparing the growth performance of different superior plants. Significant differences were observed in the chlorophyll a and b and total chlorophyll (chlorophyll a + b) contents among the 12 selected superior plants (Figure 3B). The chlorophyll a content ranged from 1.69 to 2.53 mg/g, with an average of 2.10 mg/g. The superior plants JX01, WG21, XY12, and FT01 had significantly higher chlorophyll a content than the others. Chlorophyll b content ranged from 0.75 to 1.14 mg/g, with an average of 0.90 mg/g. WG31 had the highest chlorophyll b content, followed by YS01. The total chlorophyll (chlorophyll a + b) content ranged from 2.44 to 3.46 mg/g, with an average of 3.01 mg/g. JX01, WG21, XY12, and FT01 had significantly higher total chlorophyll contents than the other superior plants.

3.3.3. Comparative Analysis of Stomatal Density Among the Reselected Elite Strains

The leaves of the tung tree have stomata on the upper and lower surfaces, with a higher density on the lower surface. These stomata are crucial for respiration and water regulation. Significant differences in stomatal density were observed (Figure 3C), ranging from 233.00 to 409.68 stomata/mm2. Specifically, FT01, JX01, and XY12 exhibited significantly higher stomatal densities than the other superior plants, while WG16 and YS01 had significantly lower densities.

3.3.4. Comparative Analysis of Leaf Anatomical Cross-Sectional Structure Among the Reselected Elite Strains

The cross-sectional structure of leaves included the upper epidermis, palisade parenchyma, spongy parenchyma, vascular bundle sheath, vascular bundle, and lower epidermis. Varying degrees of anatomical structure existed among the leaves of the 12 selected elite clones (Figure 4). The top three indicators with the highest CVs were the proportion of the vascular bundle sheath (%BS) and lower epidermis thickness, with CVs of 30.38% and 23.57%, respectively. The upper epidermis thickness ranged from 18.48 to 24.82 µm, with an average of 21.18 µm, where FT01 was significantly thicker than the other elite clones, followed by XY01, YS01, and WG21. The palisade parenchyma thickness varied between 50.74 and 131.18 µm, averaging 88.45 µm, and XY07 was significantly thicker than the others. The spongy parenchyma thickness ranged from 79.30 to 146.33 µm, averaging 109.02 µm, with XY07 having the thickest spongy parenchyma. The smallest epidermis thickness ranged from 15.39 to 22.46 µm, averaging 18.47 µm; YS01 had the thickest lower epidermis. %BS ranged from 1.79% to 4.53%, averaging 3.23%, with YS01 being significantly higher than the other elite clones.
Table 3 Comparative analysis of leaf anatomical cross-sectional structures among the reselected elite strains.

3.3.5. Comparative Analysis of Photosynthetic Performance Among the Selected Superior Individuals

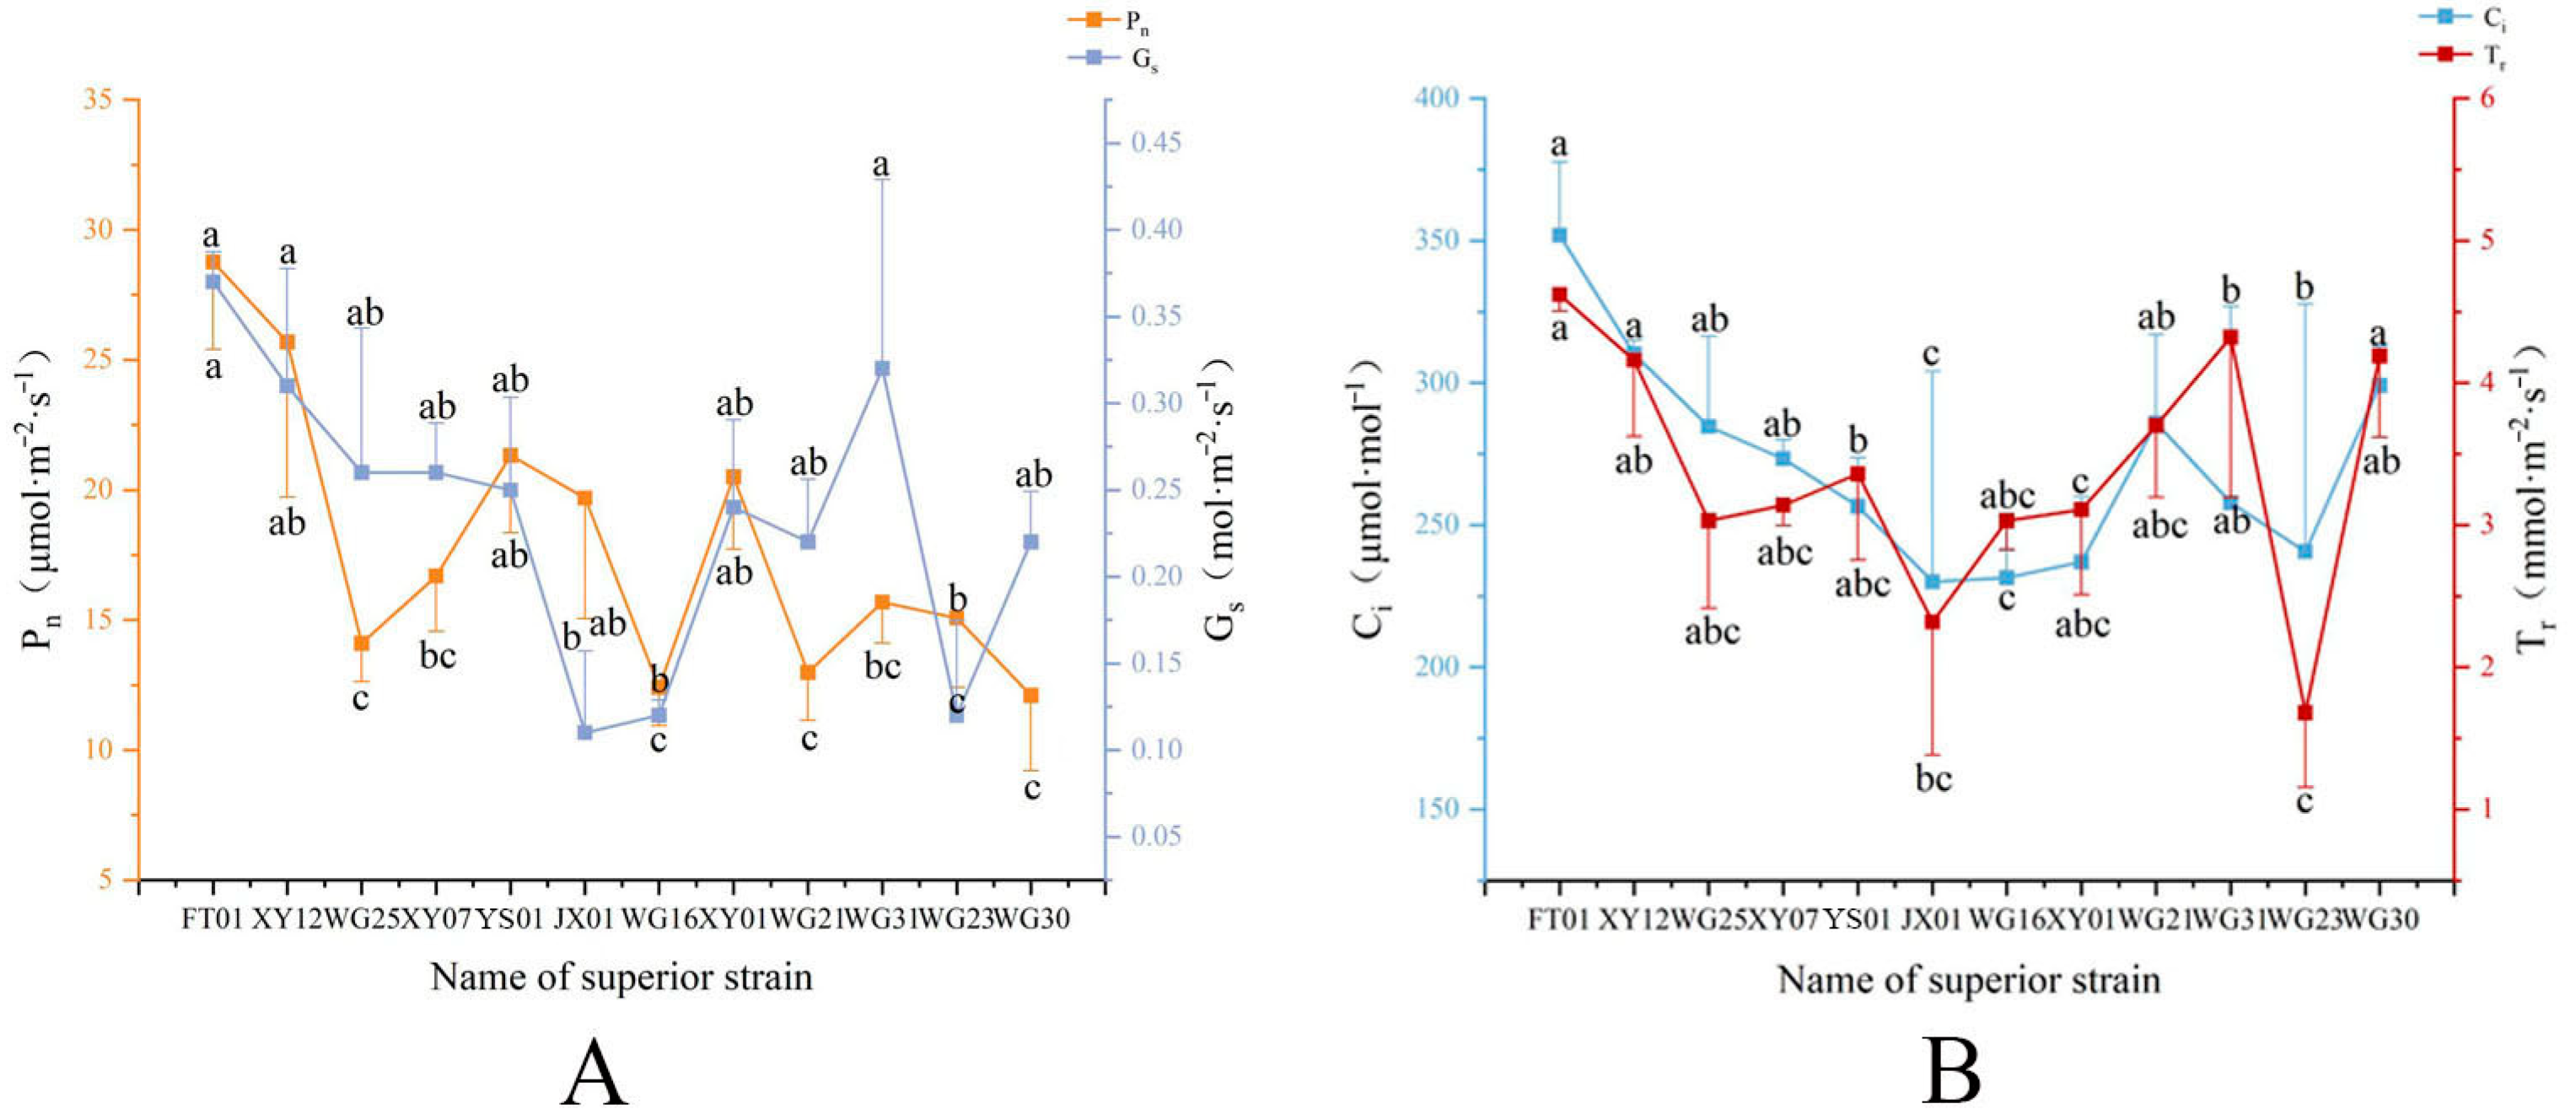
Photosynthetic intensity is a crucial indicator for assessing tree growth status and physiological activity. To compare the photosynthetic performance of the superior individuals, the most effective grafting method was used to preserve large trees under the same environmental conditions (Figure S2 in Supplementary Materials). Figure 5 shows the significant differences in photosynthetic performance among the superior individuals. The Pn range was 12.10–28.77 μmol·m−2·s−1, with an average of 17.92 μmol·m−2·s−1; the Gs range was 0.11–0.37 mol·m−2·s−1, with an average of 0.23 mol·m−2·s−1; the Ci range was 230.11–351.86 μmol·mol−1, with an average of 271.56 μmol·mol−1; and the Tr range was 1.68–4.62 mmol·m−2·s−1, with an average of 3.39 mmol·m−2·s−1. The photosynthetic performance of the superior individuals FT01 and XY12 was significantly higher than that of the other superior individuals, followed by YS01.

3.4. Comprehensive Evaluation of the Reselected Superior Plants Using the Entropy Weight–TOPSIS Method

This study employed 13 traits, including yield per plant, oil yield per plant, single fruit weight, fresh seed yield rate, dry kernel yield rate, oil yield rate, acid value, eleostearic acid content, net photosynthetic rate, chlorophyll a + b contents, stomatal density, palisade tissue, and proportion of female flowers, as comprehensive evaluation indicators. An evaluation matrix was constructed based on these key traits (Table S6 in Supplementary Materials). A standardized decision matrix (Table S7 in Supplementary Materials) was established using a standardization formula. The entropy method was applied to calculate the information entropy values of each indicator and obtain the corresponding weight coefficients (Table S8 in Supplementary Materials). A comprehensive evaluation was conducted with the TOPSIS model across the 13 indicators (Table 3). Based on the positive ideal solution distance (D+) and negative ideal solution distance (D−), the relative closeness (C) of each superior plant to the indicators was obtained, and the plants were sorted accordingly. The results showed that the C values of the 12 superior plants ranged from 0.3887 to 0.6836. FT01 had the highest C, indicating the best traits. The C values of superior plants FT01, XY12, JX01, WG25, and WG31 were >0.50, suggesting good traits. The superior plants with relatively poorer C were XY01, WG16, WG23, and WG30, all with values < 0.45.

3.5. SSR Molecular Marker and Clustering Analyses of Selected Superior Plants

3.5.1. Screening of SSR Primers and Polymorphism Analysis of the Amplified Products

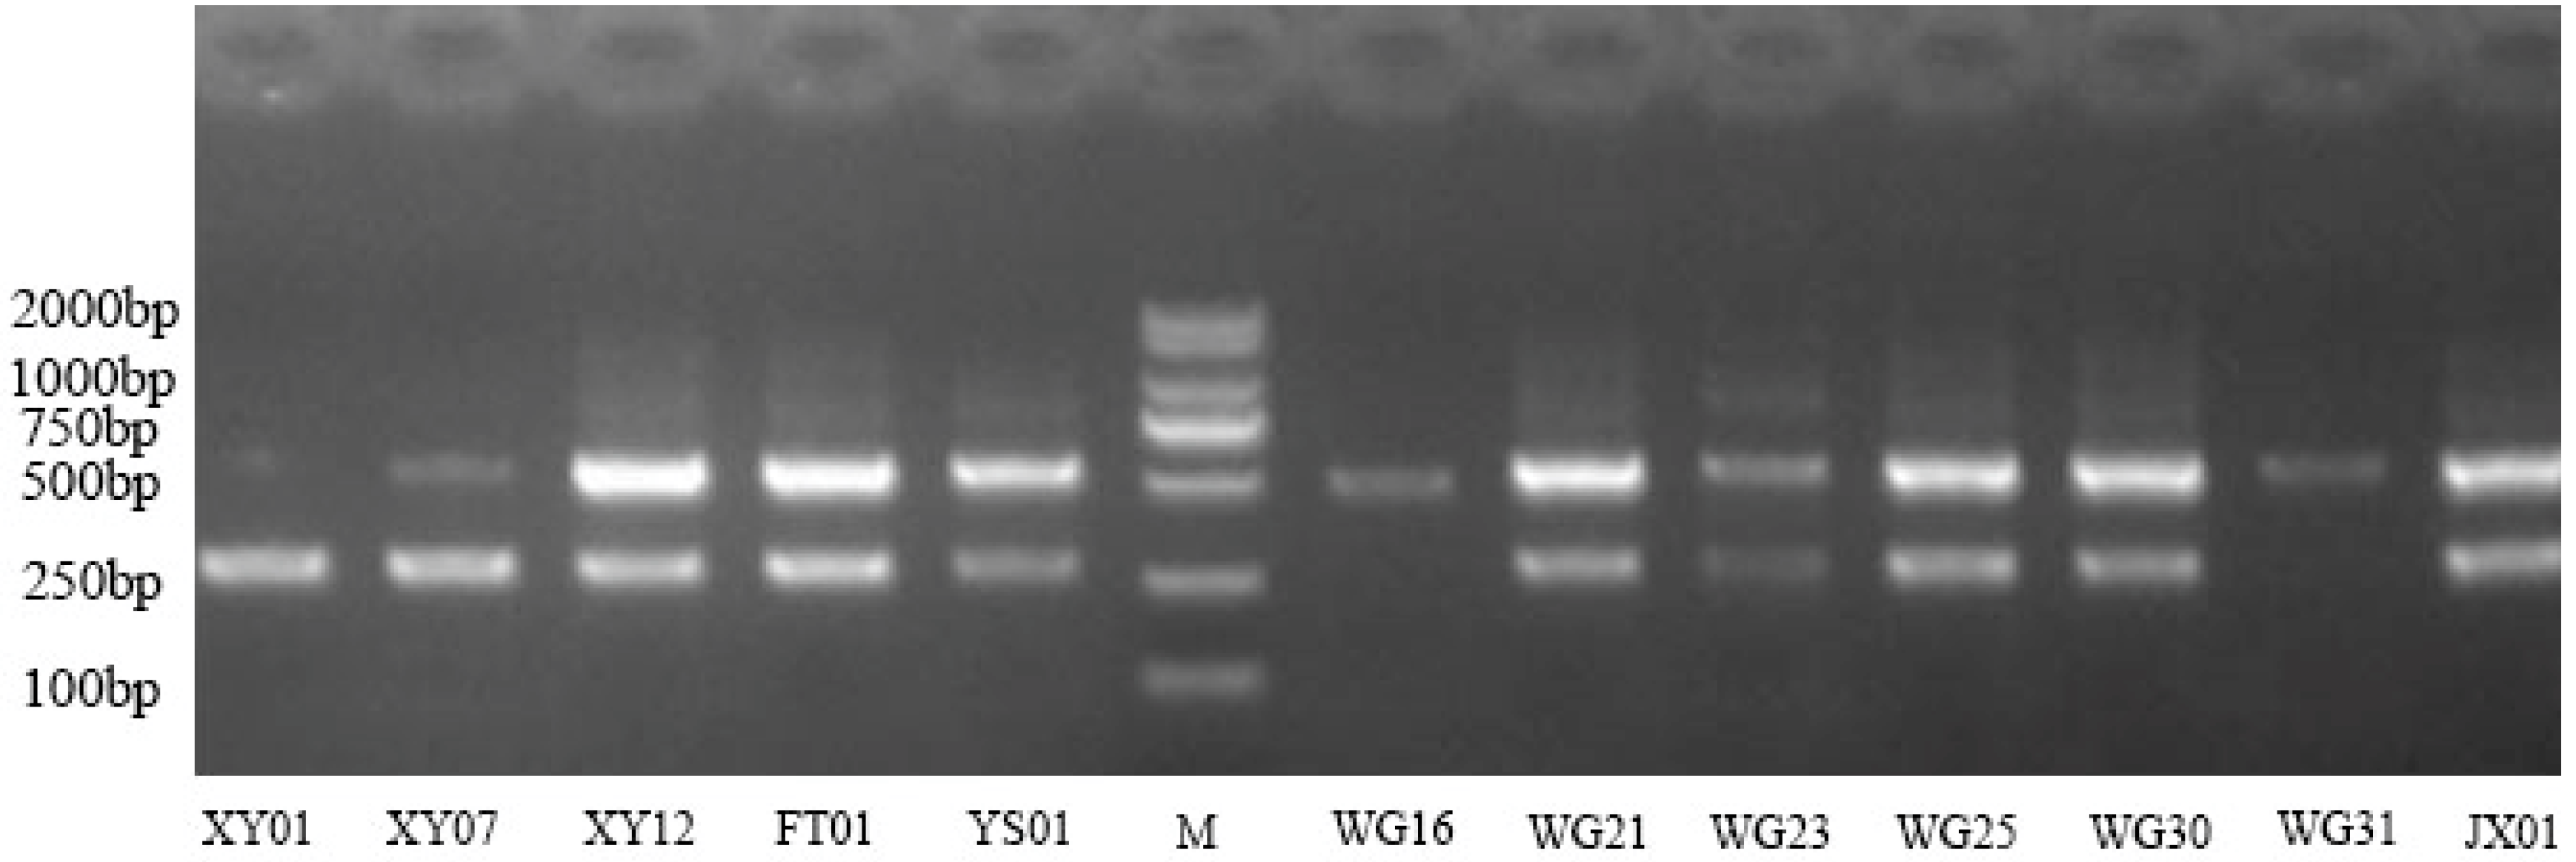
Fourteen primer pairs were selected from sixty-eight pairs based on their complete, clear, and polymorphic amplification bands. The amplification results of these selected primers for the 12 tung tree germplasm resources are shown in Table 4. Na ranged from 2 to 4, with an average of 2.2142, and the VFEST62 primer exhibited the highest Na. Ne ranged from 1.0985 to 2.1428, with an average of 1.5461. The I value ranged from 0.1973 to 0.9723, with an average of 0.5325. The Ho and He values ranged from 0.1296 to 0.4463 and from 0.1748 to 0.6059, respectively, with averages of 0.2906 and 0.4305. The PIC value ranged from 0.1486 to 0.5833, with an average of 0.3981. The high average values of PIC, I, and Ne indicate that the 14 SSR markers exhibited good polymorphism and could be used for germplasm identification. The average He and I values were >0.4, suggesting that the 12 superior plants were rich in genetic diversity. Figure 6 shows the amplification results of the VFEST18 primer.

3.5.2. Comparative Analysis of Genetic Diversity Between Selected Superior Plants

Genetic diversity was compared among the 12 superior individuals (Table 5). The results showed that Na ranged from 1.5000 to 2.0833, with an average of 1.7983. The superior plants WG16, FT01, XY07, and WG31 had higher numbers of alleles. Ne ranged from 0.8127 to 1.7514, with an average of 1.2249. The superior plants WG31, JX01, and FT01 had higher Ne values. The I values ranged from 0.1753 to 0.7116, with an average of 0.4169. The superior plants WG31, JX01, FT01, and WG16 had higher I values. The Ho values ranged from 0.0988 to 0.4485, with an average of 0.2453. The superior plants JX01 and WG31 had higher Ho values. The He values ranged from 0.1136 to 0.5641, with an average of 0.3268. The superior plants WG31, JX01, and FT01 had higher He values. We concluded that the three superior plants WG31, JX01, and FT01 had higher genetic parameter values and richer genetic diversity than the other superior plants.

3.5.3. Cluster Analysis Based on SSR Markers

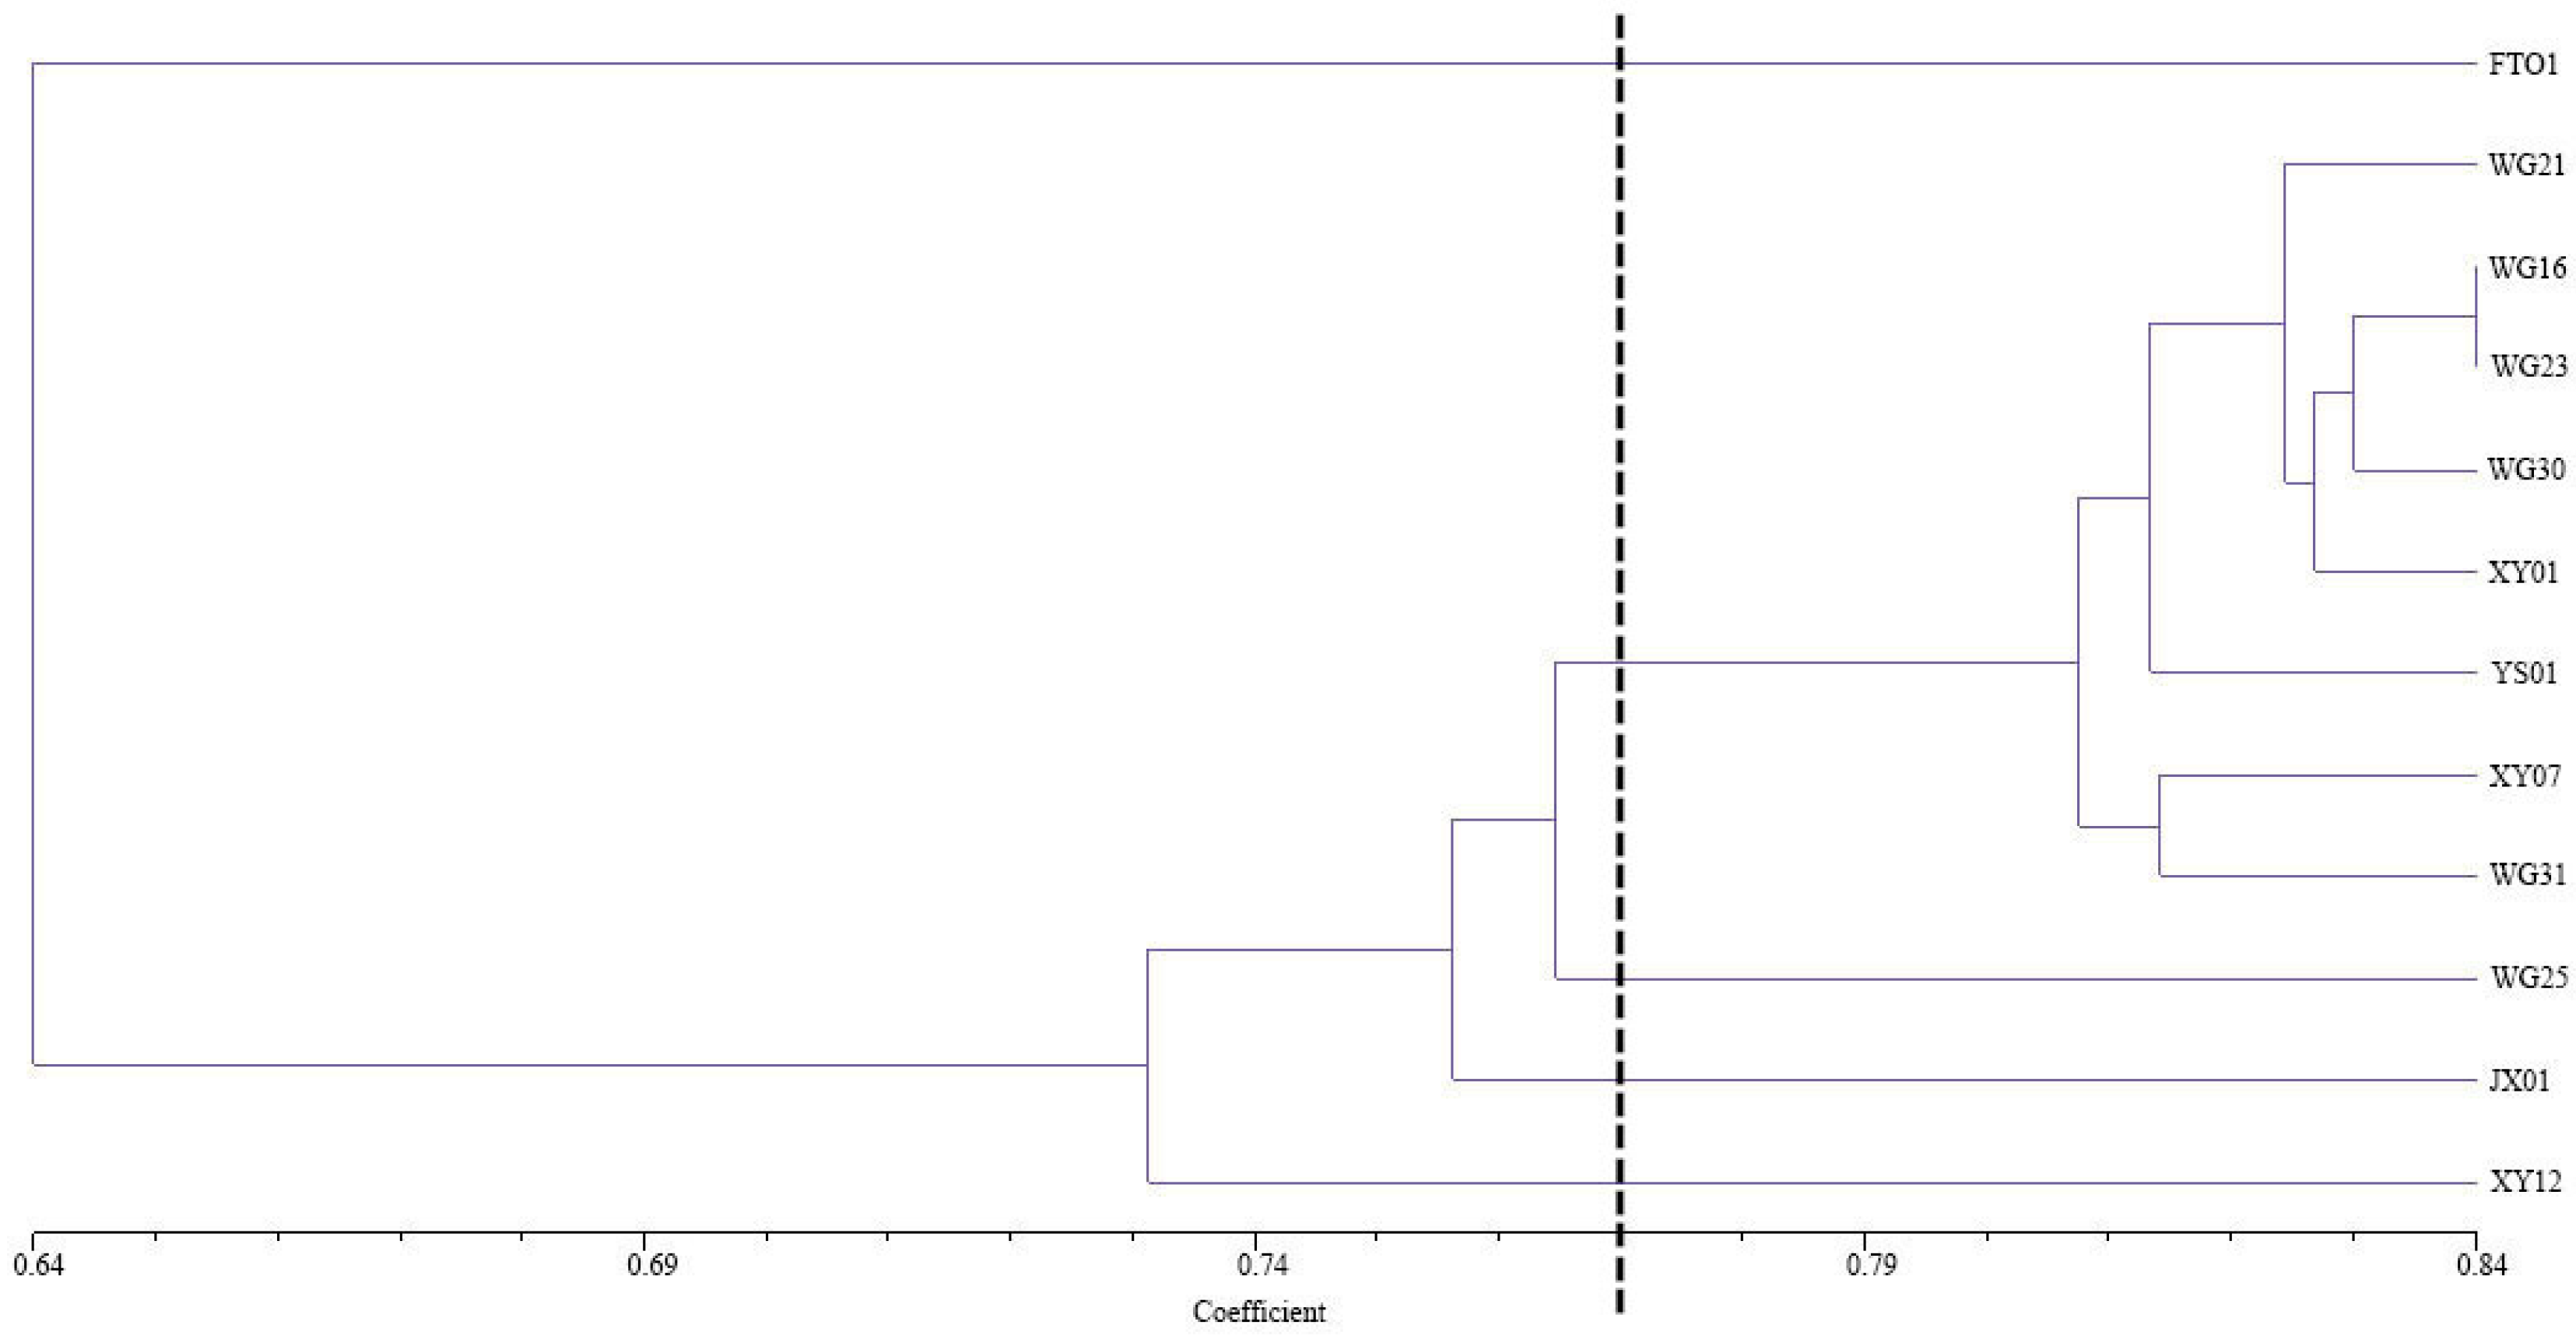
Based on the genetic similarity coefficient matrix, UPGMA clustering was performed on the 12 tung tree germplasm resources, and the results are shown in Figure 7. As shown in Figure 7, the genetic similarity coefficients among the 12 superior plants ranged from 0.64 to 0.84, with an average of 0.74. When the similarity coefficient was set to 0.77, the superior plants were divided into five clusters. FT01, WG25, JX01, and XY12 each formed a separate cluster. The second cluster was the largest, with WG16 and WG23 clustering together first, followed by WG30. These three strains were then clustered with XY01, WG21, and YS01. Subsequently, WG31 and XY07 clustered together and joined the previous group. The reason why FT01, WG25, JX01, and XY12 were classified into a separate category may be because these four elite strains originated from different regions and possess distinct characteristics. FT01 was noted for its high yield; WG25 exhibited optimal photosynthetic performance; the fruit of JX01 displayed a bright red color; and XY12 boasted the highest fruit oil yield among all strains. Within the second cluster, WG16, WG23, WG30, WG21, and WG31 originated from Wu Gang, Hunan, indicating that superior plants from the same region have higher genetic similarity.

4. Discussion

As a woody oil crop with tremendous development potential, tung trees require a breeding strategy aimed at selecting and cultivating varieties with high yield, high oil content, high quality, and high genetic diversity. This would be of great significance for promoting tung tree varieties and enhancing market competitiveness [25]. Therefore, how to evaluate and screen tung tree resources has become a key issue. A CV > 10% indicates a significant difference between individuals [26]. In this study, significant differences were detected in eight commercial fruit traits from the 60 initially selected superior tung trees. Correlation analysis revealed extremely significant correlations between some of these commercial fruit traits, particularly between single fruit weight and fruit transverse diameter, fruit longitudinal diameter, and fruit peel thickness, which was consistent with similar studies on tung trees [27]. The PCA results of the commercial fruit traits were consistent with the correlation results. Single fruit weight, fruit transverse diameter, fruit longitudinal diameter, and fruit peel thickness constituted the first principal components, explaining 39.607% of the variance. This finding is not entirely consistent with the research results of Xu Yongjie et al. [28]. In their study, fruit weight, fruit transverse diameter, and fruit longitudinal diameter constituted the first principal component, with a variance contribution rate of 37.622%.
This study analyzed the fatty acid composition, physicochemical properties of the tung oil, floral phenotypes, chlorophyll content, leaf anatomical structure, and photosynthetic performance of grafted trees among the 12 pre-selected elite tung tree clones. The results indicated that the average content of eleostearic acid was 78.63% (range: 70.66–83.31%). Higher eleostearic acid content correlated with better tung oil quality, making it a crucial indicator for assessing tung oil quality [29]. The CV for the acid value among the pre-selected clones was 45.56%, which agreed with the findings of Li Shuifang et al. [30]. Clones with abundant flowers and a high proportion of female flowers tend to produce higher fruit yields, with CVs exceeding 60%, indicating significant differences between clones. The photosynthetic performance of plants is closely related to the palisade tissue, vascular BS, and stomata in leaves. The vascular BS enhance photosynthetic efficiency and regulate the leaf environment to improve drought adaptability [31]. The %BS of clones YS01, WG31, and XY12 was significantly higher than that of the other clones, while the photosynthetic performance of the grafted trees from clones FT01, XY12, and YS01 was notably stronger than that of the other clones. This demonstrates the significant effect of vascular BS on the photosynthetic performance of plants.
Genetic diversity refers to the diversity of genes and their combinations within organisms, serving as a crucial indicator of a species’ genetic potential [32]. Due to their resistance to external influences, abundance, and high polymorphism, molecular marker techniques have emerged as primary tools for studying genetic diversity. In this study, 14 pairs of SSR primers were used to investigate the genetic diversity of 12 superior tung trees. The results of the primer polymorphism analysis revealed that the mean I, He, and PIC values were 0.5325, 0.4305, and 0.3981, respectively. These values exceeded the average I value of 0.4701 reported by Nybom [33] for plants, indicating that the 12 superior tung trees possessed high genetic diversity, similar to the findings of W. Xu et al. [23]. A comparative analysis of the genetic diversity parameters of the 12 superior individuals showed that WG31, JX01, and FT01 had higher genetic parameter values, indicating richer genetic diversity than the other individuals. These three individuals had C values > 0.50 in the entropy weight–TOPSIS method analysis, reflecting their superior traits, which was consistent with the SSR results. Cluster analysis is a commonly used method for studying the genetic relationships and genetic diversity in crop germplasm resources, serving as a prerequisite for germplasm conservation and utilization [34]. Jia Baoguang et al. [35] classified 169 tung trees into four major categories using SSR molecular markers, but the genetic relationships did not fully align with geographical proximity. In this study, the 12 superior individuals were clustered into five groups based on SSR molecular markers: FT01, WG25, JX01, and XY12 each formed a distinct group, with these four individuals originating from different regions, while the remaining eight trees belonged to one group and were predominantly from the same region. These results are similar to those obtained by Fu Junshi et al. [36]. This study will continue to observe and measure the growth characteristics and fruit economic traits of superior individuals after grafting preservation, and compare them with those of the maternal plants, thereby laying a preliminary foundation for the application for new varieties.

5. Conclusions

Based on a comprehensive evaluation of tree age, yield, oil content, and physiological and biochemical indicators, we identified five mature individual tung trees with excellent fruit size and high yields. Ultimately, five superior individuals with high comprehensive evaluation scores and abundant genetic diversity were identified from the 12 tung trees, such as FT01, XY12, JX01, WG25, and WG31. Among them, FT01 had a single tree fruit yield of 200 kg and an oil yield of 10 kg, reflecting high development and utilization value. FT01 is expected to be used to cultivate a new generation of tung tree varieties.

Supplementary Materials

The following supporting information can be downloaded at: https://www.mdpi.com/article/10.3390/horticulturae11091024/s1, Figure S1: Correlation matrix of economic trait indicators for fruits from initially selected superior plants; Figure S2: Growth conditions of grafted trees selected from superior plants; Table S1: Basic information of 60 elite individuals; Table S2: Yield of preliminarily selected superior plants; Table S3: Economic traits of fruits from initially selected superior plants; Table S4: Eigenvalues, contribution rates, and cumulative contribution rates of three principal components; Table S5: Scores and rankings of economic traits evaluation for the fruits of the first 12 preliminarily selected superior plants; Table S6: Initial decision matrix; Table S7: Initial decision matrix; Table S8: Summary of weight calculation results ssing entropy method.

Author Contributions

Z.L. formulated and designed the experiments. L.-S.L. provided the experimental materials. Z.L., H.-Y.S., along with Y.-Y.L., C.-R.L. and R.Z., conducted resource surveys and measured the growth indicators, economic traits, and other relevant characteristics of various superior clones. Z.L., H.-Y.S., together with L.D., carried out the grafting work of the re-selected superior clones and measured the photosynthetic characteristics of the grafted trees. H.-Y.S. analyzed all the data and wrote a paper that was recognized by everyone. Z.L. and X.-F.T. revised the paper, and their revisions received recognition from everyone. All authors have read and agreed to the published version of the manuscript.

Funding

This work was supported by The Science and Technology Innovation Program of Hunan Province (2022RC1155).

Institutional Review Board Statement

Sampling has been conducted with the approval of the Forestry Bureaus of Shaoyang City and Xingyi City.

Data Availability Statement

The original contributions presented in this study are included in the article. Further inquiries can be directed to the corresponding author(s).

Acknowledgments

We express our sincere gratitude to the National Tung Tree Germplasm Repository. During the project’s advancement, its professional and comprehensive support has laid a solid foundation for the smooth progress of resource collection work. Meanwhile, we would like to extend our special thanks to X.-Q.M. At the critical stage of resource collection, leveraging his professional expertise and extensive network of resources, he has tirelessly provided a large amount of valuable information and key materials, significantly propelling the progress of the work. The English in this document has been checked by at least two professional editors, both native speakers of English. For a certificate, please see: http://www.textcheck.com/certificate/mN3oG8 (Accessed on 15 January 2015).

Conflicts of Interest

The authors declare that they have no competing interests.

References

  1. Yang, Y.; Liao, Y.; Tan, X. Discussion on coordinated development of Vernicia fordii industry and future environment-friendly coatings industry in China. Nonwood For. Res. 2018, 36, 188–192. [Google Scholar] [CrossRef]
  2. Zhang, Q.; Wen, Z.; Luo, K. Advances in biological research of tung tree (Vernicia fordii). Nonwood For. Res. 2020, 38, 238–245. [Google Scholar] [CrossRef]
  3. Cao, L.; Zhong, Q.; Zou, Y.; Chen, Y.; Wan, X.; Lu, Y. Comparison and Cluster Analysis of Photosynthetic Characteristics of Different Vernicia fordii Germplasm Resources. For. Sci. Technol. 2023, 9, 43–47. [Google Scholar] [CrossRef]
  4. Zhang, H.; Peng, R.; Tan, X.; Li, Z. Establishing an efficient callus genetic transformation system for the tung tree (Vernicia fordii). Ind. Crops Prod. 2024, 211, 118264. [Google Scholar] [CrossRef]
  5. Xu, J.; Wang, F.; Ban, Q.; Cheng, T. Screening and Evaluation of Vernicia fordii Plus Trees with 3 Years Old in Guizhou. Guizhou Agric. Sci. 2017, 45, 5–8. [Google Scholar]
  6. Sun, Y. Comprehensive Evaluation of Fruit Quality of Vernicia fordii Based on Principal Component Analysis in Yunyang County. J. Anhui Agric. Sci. 2024, 52, 140–142+156. [Google Scholar]
  7. Shuang, D.; An, L.; Wang, F.; Dan, H.; Kong, F.; He, Y.; Xu, Y. Fruit Analysis and Pedigree Screening of Vernicia fordii. Hubei For. Sci. Technol. 2019, 48, 7–10. [Google Scholar]
  8. Cai, X.; Huang, Z.; Zhang, X.; Zhang, W.; Xiao, Z. Selection of superior trees of Vernicia fordii in the northern distribution margin description of the major traits. J. Anhui Agric. Univ. 2015, 42, 775–779. [Google Scholar] [CrossRef]
  9. Wu, H.; Gu, Y.; Chen, J.; Gao, J.; Luo, J. A Study of Variation of Seed Character in Natural Populations of Aleuvites fordii in Sichuan and Chongqing Areas. J. Sichuan For. Sci. Technol. 2014, 35, 6–13. [Google Scholar] [CrossRef]
  10. Wen, S. Research on Main Economic Traits of 36 Elite Families of Tung Oil Tree. Master’s Thesis, Central South University of Forestry and Technology, Changsha, China, 2013. [Google Scholar]
  11. Perera, R.; Huerta, M.C.; Barris, C.; Baena, M. Clustering classifier of FRP strengthened concrete beams using superpixels and principal component analysis. Constr. Build. Mater. 2024, 453, 139019. [Google Scholar] [CrossRef]
  12. Zhao, J. Evaluation of Main Traits and Selection of Superior Individuals of Camellia gauchowensis in Jieyang Region of Guangdong Province. Master’s Thesis, Central South University of Forestry and Technology, Changsha, China, 2021. [Google Scholar] [CrossRef]
  13. Liu, Z.; Zhang, J.; Zhang, Y.; Lao, J.; Liu, Y.; Wang, H.; Jiang, B. Effects and interaction of meteorological factors on influenza: Based on the surveillance data in Shaoyang, China. Environ. Res. 2019, 172, 326–332. [Google Scholar] [CrossRef]
  14. Ye, J.X.; Sun, Y.Z.; Yao, T.M. A Keichousaurus-bearing regurgitalite from the Middle Triassic Xingyi Fauna, Dingxiao of Xingyi City, Guizhou, South China. Palaeoworld 2024, 33, 363–373. [Google Scholar] [CrossRef]
  15. Zhang, L.; Jia, B.; Tan, X.; Thammina, C.S.; Long, H.; Liu, M.; Wen, S.; Song, X.; Cao, H.; Prasad, M. Fatty acid profile and unigene-derived simple sequence repeat markers in tung tree (Vernicia fordii). PLoS ONE 2017, 9, e105298. [Google Scholar] [CrossRef]
  16. Chen, D.; Chen, Y.; Zhang, Z.; Liu, C.; Yang, X.; Long, L.; Chen, L.; Wang, R. Analysis of Fruit Economic Characters and Fatty Traits of Camellia oleifera Cultivars. J. Chin. Cereals Oils Assoc. 2025, 40, 112–118. [Google Scholar] [CrossRef]
  17. Janik-Zabrotowicz, E.; Arczewska, M.; Hamera, J.; Sofińska-Chmiel, W.; Łastawiecka, E.; Gagoś, M. Epoxy resin-mediated transformation of chlorophyll-rich photosynthetic pigments extract into high-yield fluorescent products. J. Lumin. 2025, 277, 120962. [Google Scholar] [CrossRef]
  18. Sijin, L.; Nan, Y.; Longqing, C. Paraffin section observation of flower bud differentiation of Chimonanthus praecox in Kunming and comparison of the differentiation processes in different regions, China. Hortic. Plant J. 2022, 8, 221–229. [Google Scholar] [CrossRef]
  19. Gu, Z.; Yang, R.; Chen, H. The Establishment of Isolation and Transient Transformation Methods of Protoplasts of Vernicia fordii Mesophyll Cells. J. For. Sci. 2018, 54, 46–53. [Google Scholar]
  20. Li, Z.; Ma, F.; Zhang, H.; Luo, C.R.; Liu, Y.Y.; Mi, X.Q.; Li, L.S.; Shu, H.Y.; Tan, X.F. Grafting Techniques of Tung Tree Seedlings with Hypocotyle Rootstocks and the Anatomical Structure. J. For. Sci. 2024, 60, 80–92. [Google Scholar]
  21. Tian, K.; Xu, J.; Dai, L.; Li, Z.; Geng, X.; Liu, Z.; Wang, Y. Physiological Response of Idesia polycarpa Seedlings to Extreme High Temperature and High Temperature Plus Drought Stress. Sci. Silvae Sin. 2024, 60, 84–92. [Google Scholar]
  22. Ahmed, A.; Abdalla, A.A.A.; Elsafy, M.; Ezzeldin, A.; Rahmatov, M.; Abdelhalim, T. Harnessing genetic diversity in Sudanese sorghum wild relatives for stay-green drought tolerance via microsatellite (SSR) marker assessment. Genet. Resour. Crop Evol. 2024, 72, 4699–4711. [Google Scholar] [CrossRef]
  23. Xu, W.; Yang, Q.; Huai, H.; Liu, A. Development of EST-SSR markers and investigation of genetic relatedness in tung tree. Tree Genet. Genomes 2012, 8, 933–940. [Google Scholar] [CrossRef]
  24. Shen, Z.; Min, H.; Wang, L.; Zhang, Y. Evaluation of Carbon Neutrality Capacity of Regional Construction Industry Based on the Entropy Weight TOPSIS Model. Buildings 2024, 14, 2363. [Google Scholar] [CrossRef]
  25. Wang, X.; Shang, H. Cultivation and Processing Utilization Techniques of Tung Oil Tree. For. Ecol. 2023, 8, 39–40. [Google Scholar] [CrossRef]
  26. Liu, X.; Liu, N.; Shang, H.; Pan, X.; Wang, X.; Zeng, Y. Identification and differential analysis of metabolomic composition ofleaves, flowers and shells of Vernicia fordii. Plant Physiol. J. 2021, 57, 2366–2378. [Google Scholar] [CrossRef]
  27. Wang, J.; Li, W.; Ge, C.; Zhang, L.; Tan, X.; Liu, M. Effects of exogenous hormones on the fiowering and fruit characteristics of male tung trees of ‘putaotong’ (Vernicia fordii Hemsl.). J. Cent. South Univ. For. Technol. 2023, 43, 20–32+110. [Google Scholar] [CrossRef]
  28. Xu, Y.; Deng, X.; Dai, X.; Wang, D.; Ma, L.; Li, L.; Zeng, B. Comprehensive evaluation of resistance of Aleurites fordii superior family based on principal component analysis and clustering analysis. J. Cent. South Univ. For. Technol. 2012, 32, 24–27. [Google Scholar] [CrossRef]
  29. Li, W.; Liu, M.; Zhang, L.; Tan, X.; Zhang, F.; Wang, Z. Study of major economic traits in 4 superior families of tung tree. Nonwood For. Res. 2018, 36, 29–34. [Google Scholar] [CrossRef]
  30. Li, S.; He, S.; Long, H.; Tan, X. Oil contents and fatty acid compositions of Vernicia fordii seeds from one hundred excellent families. China Oils Fats 2017, 42, 123–127. [Google Scholar]
  31. Wang, S.; Tian, L.; Zhou, S.; Chu, Y.; Mei, D.; Yuan, J.; Yu, Y.; Fu, X. Effects of Polyploidization on Leaf Morphology, Photosynthetic Performance and Accumulation of Secondary Metabolites in Cyclocarya paliurus. Sci. Silvae Sin. 2024, 60, 120–131. [Google Scholar]
  32. Rajasree, S.S.; Lal, M.G. Assessment of Genetic Diversity in Greengram (Vigna radiata L.) Using Metroglyph Analysis. Arch. Curr. Res. Int. 2024, 24, 128–144. [Google Scholar] [CrossRef]
  33. Nybom, H. Comparison of different nuclear DNA markers for estimating intraspecific genetic diversity in plants. Mol. Ecol. 2004, 13, 1143–1155. [Google Scholar] [CrossRef] [PubMed]
  34. Derakhshani, B.; Lee, C.; Shin, D.; Jung, K.-H. Identification of core drought-responsive genes for developing drought-tolerant rice varieties through meta-analysis of RNA-Seq data. Plant Biotechnol. Rep. 2024, 18, 705–718. [Google Scholar] [CrossRef]
  35. Jia, B.; Lin, Q.; Tan, X.; Li, Z.; Long, X.; Xiang, H.; Zhang, L. Development of EST-SSR Markers and Their Use for Genetic Diversity Analysis in Tung Tree (Vernicia fordii (Hemsl.) Airy Shaw). J. Plant Genet. Resour. 2016, 17, 625–636. [Google Scholar] [CrossRef]
  36. Fu, J.; Nan, L.; Zhang, Z.; Wu, S.; Chen, X. Evaluation of Morphological Characteristics and SSR Genetic Diversity of 21 Accessions of Timothy Seeds. Chin. J. Grassl. 2024, 46, 23–33. [Google Scholar] [CrossRef]
Figure 1. Twelve superior plants that advanced to the final selection stage. (AL) represent FT01, XY12, WG25, XY07, YS01, JX01, WG16, XY01, WG21, WG31, WG23, and WG30, respectively; (13) depict the inflorescence, fruiting sequence, and lateral view of the fruit from each superior plant.
Horticulturae 11 01024 g001
Figure 2. Fatty acid composition and relative mass fraction of fatty acids in the re-selected superior plants. (A): The contents of palmitic acid, stearic acid, and linolenic acid in the re-selected superior plants; (B): The contents of oleic acid, linoleic acid, and β-eleostearic acid in the re-selected superior plants; (C): The content of α-eleostearic acid in the re-selected superior plants; (D): Gas chromatography. The peak indicates the content of heavier fatty acids. Different lowercase letters indicate significant differences among individual plants (p < 0.05).
Horticulturae 11 01024 g002
Figure 3. Growth traits of the reselected superior strains. (A): Comparison of flower quantity and the proportion of female flowers among the reselected superior strains; (B): Comparison of pigment content among the reselected superior strains; (C): Comparison of stomatal density among the reselected superior strains. Different lowercase letters indicate significant differences among individual plants (p < 0.05).
Horticulturae 11 01024 g003
Figure 4. Cross-sectional anatomical structure and comparative analysis of leaves from selected superior plants. (A): (A1A12) represent the cross-sectional anatomical structures of the superior plants FT01, XY12, WG25, XY07, CN01, JX01, WG16, XY01, WG21, WG31, WG23, and WG30, respectively; (B): Comparative analysis of upper epidermis thickness among the selected superior plants; (C): Comparative analysis of palisade tissue thickness among the selected superior plants; (D): Comparative analysis of spongy tissue thickness among the selected superior plants; (E): Comparative analysis of lower epidermis thickness among the selected superior plants; (F): Comparative analysis of %BS among the selected superior plants. Different lowercase letters indicate significant differences among individual plants (p < 0.05).
Horticulturae 11 01024 g004
Figure 5. Comparative analysis of photosynthetic performance between selected superior individuals. (A): Content and comparison of net photosynthetic rate and stomatal conductance in selected superior individuals; (B): Content and comparison of intercellular CO2 concentrations and transpiration rates in selected superior individuals. Different lowercase letters indicate significant differences among individual plants (p < 0.05).
Horticulturae 11 01024 g005
Figure 6. SSR profiles of 12 tung tree germplasm resources amplified using primer VFEST18.
Horticulturae 11 01024 g006
Figure 7. Cluster analysis based on the SSR markers. The position marked by the dashed line represents the similarity coefficient.
Horticulturae 11 01024 g007
Table 1. Economic characteristics of excellent plants entering the selection stage.
NumberCodesYield Per Plant (kg)Oil Yield per Plant (kg)Peel Thickness (mm)Fruit Transverse Diameter (mm)Fruit Vertical Diameter (mm)Fruit Shape IndexSingle Fruit Weight (g)Fresh Seed Rate (%)Rate of Dryness (%)Oil Yield (%)
1FT01111.712.148.49 ± 0.1164.22 ± 0.2552.70 ± 0.110.82 ± 0.0593.90 ± 0.5531.84 ± 0.1665.35 ± 0.1952.25 ± 0.05
2XY1261.49.786.48 ± 0.6448.80 ± 0.6148.80 ± 1.031.05 ± 0.0759.06 ± 0.2839.33 ± 0.3365.50 ± 0.3361.85 ± 0.84
3WG2553.68.297.59 ± 0.6255.39 ± 0.4557.00 ± 0.431.03 ± 0.1179.26 ± 1.4742.10 ± 0.4662.55 ± 0.5358.74 ± 0.03
4XY0750.57.846.52 ± 0.8250.23 ± 0.4845.70 ± 0.081.00 ± 0.0962.18 ± 0.2542.12 ± 0.4458.13 ± 0.2363.41 ± 0.04
5YS0149.56.596.72 ± 0.2556.74 ± 0.4557.97 ± 0.641.02 ± 0.0271.70 ± 0.5744.54 ± 0.7166.07 ± 0.7245.22 ± 0.03
6JX0152.95.258.64 ± 0.3561.00 ± 0.4270.40 ± 0.621.15 ± 0.0596.84 ± 0.2640.65 ± 0.5264.97 ± 0.4737.56 ± 0.05
7WG1642.74.889.07 ± 0.4366.47 ± 1.5260.01 ± 0.030.91 ± 0.02105.33 ± 3.1239.82 ± 0.0965.01 ± 0.1144.12 ± 0.72
8XY0158.96.497.96 ± 0.8668.63 ± 0.741.27 ± 0.101.27 ± 0.0470.37 ± 1.2330.62 ± 0.3559.88 ± 0.3360.10 ± 0.41
9WG2147.25.868.87 ± 0.3757.44 ± 0.3557.47 ± 0.871.00 ± 0.0378.27 ± 1.3841.21 ± 0.2462.50 ± 0.5548.21 ± 0.03
10WG3162.76.497.36 ± 0.2656.70 ± 0.2459.25 ± 0.831.04 ± 0.0568.94 ± 0.5734.53 ± 0.7258.20 ± 0.6551.51 ± 0.05
11WG2345.75.916.96 ± 0.3857.26 ± 0.9258.06 ± 0.651.02 ± 0.0978.24 ± 1.0943.42 ± 0.6358.78 ± 0.8250 ± 67 ± 0.11
12WG3032.33.838.42 ± 0.6362.75 ± 0.3669.14 ± 0.471.10 ± 0.0492.36 ± 1.8438.56 ± 0.3767.19 ± 0.2345.76 ± 0.32
Table 2. Physicochemical indices of lipids from the reselected elite strains.
CodeAcid Value (mg/g)Iodine Value (g/100 g)Saponification Value (mg/g)
FT011.15 ± 0.04 f170.98 ± 0.23 e196.96 ± 0.38 c
XY120.98 ± 0.03 gh172.84 ± 0.25 d195.51 ± 0.21 d
WG251.40 ± 0.06 e159.39 ± 0.47 g177.48 ± 0.06 g
XY071.64 ± 0.03 d160.08 ± 0.21 g167.59 ± 0.28 i
YS010.87 ± 0.02 h176.74 ± 0.22 b208.53 ± 0.27 a
JX010.69 ± 0.01 i182.59 ± 0.10 a201.70 ± 0.12 b
WG162.25 ± 0.10 c153.73 ± 0.32 h187.55 ± 0.21 e
XY012.46 ± 0.05 b146.89 ± 0.18 i152.06 ± 0.11 l
WG212.23 ± 0.04 c162.79 ± 0.18 f169.78 ± 0.14 h
WG311.12 ± 0.08 fg175.96 ± 0.19 c180.29 ± 0.50 f
WG232.81 ± 0.03 a140.91 ± 0.18 k153.75 ± 0.15 k
WG302.82 ± 0.02 a141.72 ± 0.25 j163.47 ± 0.18 j
Min0.69140.91152.06
Max2.82182.59208.53
Mean value1.7162.05179.56
Standard deviation0.7814.1418.77
Coefficient of variation/%45.568.7210.45
Note: Different lowercase letters indicate significant differences at the p = 0.05 level.
Table 3. Summary of weight calculation results using the entropy method.
CodeD+D−CSorting Results
FT010.10640.22980.68361
XY120.13860.20130.59222
WG250.15330.16950.52514
XY070.17750.16630.48386
YS010.18580.15480.45447
JX010.16100.19180.54363
WG160.19610.14110.418410
XY010.18310.13990.43329
WG210.17260.14340.45378
WG310.16710.16970.50395
WG230.20460.13980.405911
WG300.21410.13610.388712
Note: D+ represents the positive ideal solution distance; D− represents the negative ideal solution distance; and C represents the relative closeness.
Table 4. Genetic diversity of 14 SSR loci in 12 tung tree germplasm resources.
Primer IDPrimer SequenceNaNeIHoHePIC
VFEST12F:TTATGTGTGTTGATGTGGCT
R:TTCTCTGCTTCTCCCTCTC
31.69690.59370.37920.48570.4506
VFEST18F:GCCAAAGAAACCTAAGAC
R:ACAAGCAAAACAAAGAGAC
21.42790.48310.22630.37280.3391
VFEST20F:TGGCATTGGCACTCACTACAG
R:TAAGTTCACAAAAGCGGTCACA
21.22360.31590.19250.27940.2563
VFEST3F:TGGGAAACAATAATGGGAGG
R:CGGGAACTAATAAAATCAAGCC
21.30220.39320.25310.38470.3495
VFEST41F:CACTGCTGGTAACGGAACTG
R:ATAAGACTCCACCGACGCT
21.53790.52110.19080.39570.3718
VFEST5F:ATTCCAACTCAAAAACTCTG
R:TTGATTTACAGAGCAAGTGAT
21.09850.19730.12960.17480.1486
VFEST51F:AGCGGCAACACCAGCAACT
R:TGGGTAGAGGGAGGAGGCAT
21.37260.41270.26250.37080.3252
VFEST55F:GTCTCTCTCTTTCTATCTGTAACC
R:GCTTCAGGCTCTAAATCTTC
21.43650.51550.31240.45980.4199
VFEST58F:ATCCCTATTGATGAGACC
R:TTAACACTAACTATACTTGACACT
31.75010.65060.36840.52270.5005
VFEST60F:CTCCACCCAGTCTTCTACTTCAC
R:ATCCAATAGCGTAAGATGACAAAG
21.87340.74390.44630.60510.5596
VFEST62F:TAATCCCATCGCCAAATCC
R:TTCCGAAGAAACCGCAGT
42.14280.97230.42720.60590.5833
VFEST65F:GGAGGATGATGAAGTCAGAGAG
R:GAGTGTGTCAACTGCCCAAC
21.89270.73270.38940.57360.5385
VFEST68F:ATCAGGGCTTGGTTTTGGGT
R:ATAGGTAGGGGAGGCAGAGGAG
21.35730.40080.18440.35810.3278
VFEST8F:GCAATCTTCCCTCCAATGA
R:TGTAGTTTTTCCCTGATAGCATTA
31.55240.51140.33510.43830.4025
Mean value 2.21421.54610.53250.29260.43050.3981
Note: Na: number of alleles; Ne: effective number of alleles; I: Shannon’s information index; Ho: observed heterozygosity; He: expected heterozygosity; PIC: polymorphism information content.
Table 5. Statistical analysis of genetic parameters for 12 superior plants.
CodeNaNeIHoHe
FT012.00001.43990.58290.34650.5114
XY121.75001.36740.47610.23540.3202
WG251.66671.25370.39460.20210.2883
XY072.00001.00210.17530.09880.1136
YS011.66671.14760.37240.20900.2948
JX011.91671.59850.63910.44850.5638
WG162.08331.36250.52870.26360.3817
XY011.58330.87580.20680.11240.1693
WG211.74670.95440.21030.10900.1582
WG312.00001.75140.71160.43720.5641
WG231.66671.13230.47250.30110.3561
WG301.50000.81270.23290.17980.2003
Mean value1.79831.22490.41690.24530.3268
Note: Na: number of alleles; Ne: effective number of alleles; I: Shannon’s information index; Ho: observed heterozygosity; He: expected heterozygosity.
Disclaimer/Publisher’s Note: The statements, opinions and data contained in all publications are solely those of the individual author(s) and contributor(s) and not of MDPI and/or the editor(s). MDPI and/or the editor(s) disclaim responsibility for any injury to people or property resulting from any ideas, methods, instructions or products referred to in the content.