Abstract
Mulberry trees are not only economically significant forest trees with substantial added value but also serve as exceptional candidates for environmental management and ecological enhancement. However, in the widely applied cutting propagation of mulberry, the intensity of adventitious root formation in cuttings has long remained a key challenge in the cutting process. Our research group previously found that 800 mg/L Rooting Powder No. 1 (ABT1) has an obvious promoting effect on the development of adventitious roots in mulberry cuttings, but its molecular mechanism has not yet been studied. In this research, transcriptome sequencing (RNA-seq) technology was employed to sequence the ‘Yueshenda 10’ mulberry during four distinct cutting stages. Through Kyoto Encyclopedia of Genes and Genomes (KEGG) and Gene Ontology (GO) enrichment analysis, shifts in gene expression and metabolic pathways were scrutinized, pinpointing the pivotal role of plant hormones in this context. Furthermore, using Weighted Gene Co-Expression Network Analysis (WGCNA), the study analyzed gene expression across all samples, identifying two modules, “black” and “blue”. These modules were predominantly expressed in the treatment group during the rooting phase and minimally expressed in the control group. Critical genes such as gene21267 and gene16291 from the black module, alongside gene18291 and gene20028 from the blue module, were identified as key to the rooting success of the ‘Yueshenda 10’ cuttings. This investigation not only supports the nutrient propagation and effective use of mulberry trees but also clarifies the molecular basis of adventitious root formation in these plants, extending the research to other related species. This work fosters the diversification and enhancement of the mulberry industry chain.
1. Introduction
The mulberry tree, belonging to the genus Morus and family Moraceae, is a perennial arboreal species recognized not only for its substantial economic contributions as a forest resource but also for its superior capabilities in environmental management and ecological sustainability [1]. The leaves of the mulberry serve as the exclusive nutritional source for the domestic silkworm, (Bombyx mori L.) [2], highlighting its pivotal role in sericulture. Beyond their utility for silk production, mulberry fruits possess extensive potential in health and nutrition sectors, boasting a complex array of nutrients that includes fatty acids, amino acids, vitamins, minerals, and a spectrum of bioactive elements [3]. As global demands for premium silk escalate, the current cultivation practices restricted to conventional agricultural lands are insufficient. This necessitates the exploration and adaptation of mulberry cultivation in non-traditional areas, particularly those environments challenged by abiotic stressors such as high alkalinity [4], salinity [5], and drought conditions [6]. The technique of asexual reproduction is instrumental in forestry to preserve elite traits across generations and accelerate the proliferation of mulberry trees [7]. Among the various asexual propagation methods [8], including tissue culture and grafting, the technique of softwood cutting has been refined through rigorous scholarly research [9] and is now a fundamental strategy for the propagation of mulberry saplings [10]. Adventitious root formation, a critical phase in the propagation of plants that are typically challenging to root [11], serves as an indicator of a plant’s innate regenerative abilities [12]. Optimizing this root formation process is crucial for enhancing both the economic value and ecological benefits of mulberry trees.
Studies have demonstrated that employing plant hormone treatments during the propagation of cuttings can significantly enhance various growth and development stages in plants, the breakdown and mobilization of reserved food, and changes in endogenous auxin status Rooting powders, innovative and potent exogenous plant hormones, have found widespread application in the propagation of diverse tree species, flowering plants, and crops. ABT1 is a commonly used plant growth regulator, whose active ingredients are a compound preparation of naphthalene acetic acid (NAA) and indole-3-butyric acid (IBA). After compounding, the two can work synergistically, not only enhancing the effect of rooting induction but also promoting robust growth of the root system [13,14]. It can also affect the growth regulation, development [15] and response to environmental stimuli of plants [16]. Reports indicate that ABT1 and Rooting Powder No. 2 (ABT2) can elevate the rooting success rate of softwood cuttings to 95% [17]. In mulberries, applying concentrations of 0.10% to 0.13% IBA along with ABT6 achieves survival rates exceeding 81% [18].
Advancements in biotechnology have notably enhanced the utility of RNA-seq, establishing it as a prevalent and effective method for exploring molecular mechanisms [19]. Studies indicate a profound linkage between plant hormones and gene activation, where hormones activate gene expression during specific developmental stages or within certain tissues, demonstrating their physiological impacts. It is well documented that most plant hormones influence and modulate gene expression across various cycles or pathways, transforming these genes into functional proteins or enzymes that subsequently alter corresponding phenotypic traits [20]. For instance, in olive (Canarium album L.) cuttings, the external application of the auxin indole-3-butyric acid (IBA) has been shown to regulate auxin balance by adjusting the expression of genes within the PIN family. This adjustment facilitates a redistribution of auxin in the basal tissues of the cuttings, playing a vital role in the initiation of adventitious roots [21]. During the transcriptomic examination of willow (Salix babylonica L.), researchers identified the involvement of ten auxin-related genes (SAURs and GH3) along with nine auxin transport genes (PINs, ABCs, LAX2, and AUXs) in the rooting processes [22]. Additionally, the Aux/IAA gene family, among the first discovered [23], has been recognized for its potential to regulate the timing of various rooting stages, thereby influencing auxin stability and signal detection [24]. In mulberry research, Zhang Xiaofeng and his team [25] have conducted experiments on cutting propagation, identifying significant gene alterations within the plant hormone signal transduction pathway during the adventitious root formation stage, including key genes such as TIR1, GH3, SAUR, PYR/PYL, LPI, HSP70, cTBP, CHS, ECPP44, and M35. Furthermore, Tang Zhuang and colleagues [26] have discovered that the mulberry auxin transport inhibitor response factor gene, MaTIR1, plays a regulatory role in the formation of adventitious roots during the rooting of softwood cuttings.
Substantial research efforts have been dedicated to unraveling the molecular dynamics of adventitious root development predominantly in model plants like Arabidopsis thaliana (A. thaliana) and rice. However, such studies on mulberry trees remain considerably less frequent. ‘Yueshenda 10’ has emerged as an efficient and reliable variety in cutting propagation, thanks to its advantages such as high survival rate, easy access to cuttings, rapid rooting, robust seedlings, and stable genetic traits. It exhibits significant application value in sericulture or fruit mulberry cultivation. Our research group previously established that administering 800 mg/L of ABT1 substantially facilitates the propagation process in the mulberry cultivar ‘Yueshenda 10’ [27]. This study aims to further assess the influence of exogenous plant hormones on the rooting efficiency of softwood cuttings from mulberry trees. Additionally, we are conducting a comprehensive transcriptome sequencing analysis on the phloem of these cuttings to better understand the genetic interactions at play. The results of this research are anticipated to lay a solid foundation for advancing theoretical knowledge and practical techniques necessary for the vegetative reproduction and effective utilization of mulberry trees. Moreover, the insights derived from this study are intended to clarify the molecular mechanisms underpinning adventitious root development in mulberry trees, which could also be applicable to the study of other species that are closely related, thus supporting the diversification and enhancement of the mulberry industry’s quality standards.
2. Materials and Methods
2.1. Selection of Experimental Materials
The experiment utilized the ‘Yueshenda 10’ mulberry variety, procured from the Sericulture and Agricultural Products Processing Institute of the Guangdong Academy of Agricultural Sciences, China. Conducted at Henan Agricultural University’s Zone Three experimental field in June 2023, the trial used clean river sand as the rooting substrate. Five rooting substrates, each measuring 20 m by 1.5 m by 0.8 m, were prepared. These beds were equipped with an automatic intermittent spray system overhead and covered with a shade net. Three days prior to the commencement of the cutting, the substrate underwent daily turning and disinfection with a 1:800 dilution of carbendazim wettable powder.
The experiment involved collecting cuttings from semi-lignified branches of the current year’s growth, each cutting fashioned to about 15 cm in length with a diameter of 1.0–1.5 cm, the upper end flattened, and the lower end sharply cut at a 45-degree angle. Once prepared, the cuttings were first immersed in a 1:800 dilution of carbendazim solution for 30 s, followed by treatment with a plant growth regulator or distilled water. During cutting, each cutting was inserted approximately 7–8 cm into the substrate at a spacing of 10 cm between individuals, ensuring the slanted end was oriented downward and the bud apex upward. After insertion, the soil was compacted, and the substrate was thoroughly irrigated using micro-sprinklers to ensure intimate contact between the cutting base and the substrate, thereby maintaining adequate moisture. Post-cutting, the cuttings were disinfected weekly with a 1:800 carbendazim solution, and misting was applied for 10 s every 2 h. Following root formation, misting frequency was reduced. Manual weeding was performed as needed to eliminate competing vegetation.
The experiment designated two treatment methods for the softwood cuttings of the mulberry: a clear water treatment (CK) with a 30 min immersion and a treatment with 800 mg/L ABT1. Each treatment was replicated three times, with 50 cuttings per replicate. Rooting morphologies at the base of the cuttings were observed, leading to the selection of phloem tissues at four distinct stages: 12 (callus formation stage), 24 (adventitious root induction stage), 36 (adventitious root formation stage), and 48 (adventitious root elongation stage) days after treatment with ABT1 and the control treatment. At each of these stages, nine cuttings were randomly selected, rinsed with clear water, and their surface moisture removed. The basal 2 cm of the phloem tissue from each cutting was then severed and finely chopped. These were grouped into sets of three cuttings to form one biological replicate, with each treatment having three such replicates. The samples were immediately immersed in liquid nitrogen and stored at −80 °C for subsequent analysis.
2.2. RNA Extraction, cDNA Library Construction, and Sequencing
The samples that were collected underwent RNA extraction, which was intended for comprehensive transcriptome sequencing. The isolation of total RNA was carried out utilizing the Tiangen DP411 kit (Tiangen, Beijing, China). An aliquot of 2 µL from each RNA sample was subjected to agarose gel electrophoresis, a step crucial for assessing the RNA’s quality. The precise measurements of RNA concentration and its integrity were conducted using the Thermo Scientific NanoDrop 2000 UV-Vis (Thermo, Waltham, MA, USA) spectrophotometer along with the Agilent 2100 Bioanalyzer provided by Agilent Technologies (Palo Alto, CA, USA). Following these assessments, the construction of the cDNA libraries was managed by Biomarker Technologies Corporation based in Beijing, using the Illumina mRNA-Seq Sample Preparation Kit (Illumina, San Diego, CA, USA). The sequencing phase was executed on an Illumina NovaSeq6000 (Illumina, San Diego, CA, USA) platform, ensuring high-throughput and accurate genetic analysis.
2.3. Bioinformatics Analysis of RNA-Seq Data
Initially, the raw sequencing data were compiled and subjected to a comprehensive quality assessment using FastQC software (version 0.12.0) [28]. Subsequent steps involved the alignment of the cleaned reads with the Morus notabilis genome (Morus_notabilis.ASM41409v2_new.genome.fa, GenBank accession numbers: GCF_000414095.1) [29] using HISAT2 software (version 2.2.1) [30], which is known for its speed and accuracy. This alignment facilitated the mapping of reads to the reference genome. To quantify gene expression, RSEM software (version 1.3.3) [31] was employed, converting the data into FPKM (Fragments Per Kilobase of transcript sequence per Million base pairs sequenced) values to standardize expression across samples. The next phase involved identifying differentially expressed genes using the DESeq R package (version 1.48.1) [32]. Genes showing a |log2 Fold Change| >1 and an FDR (false discovery rate) <0.05 were classified as differentially expressed genes (DEGs) [33]. These DEGs were further analyzed for functional enrichment using the clusterProfile software (version 4.16.0), focusing on GO and KEGG pathways, with a significance threshold of Padj >0.05 marking statistically significant enrichments.
2.4. Weighted Correlation Network Analysis
To analyze differentially expressed genes during the various stages of mulberry cutting root development, a WGCNA was conducted employing the WGCNA package in R [34]. The analysis utilized log2(FPKM + 1) as the expression data input. Selection of the soft thresholding power was based on achieving a scale-free topology, with the minimum power chosen when the correlation coefficient exceeded or plateaued at 0.8. This parameter was used to examine shifts in gene connectivity at varying power levels. Gene clusters were formed through a dynamic tree cutting approach, organizing them into modules based on expression correlation. Modules exhibiting similar expression profiles were consolidated if their module eigengenes (MEs) displayed a similarity above the threshold of 0.8. Each module was required to contain at least 50 genes. Those modules that were significantly associated with the adventitious root formation in mulberry were highlighted for further detailed examination.
2.5. Validation of DEGs with Real-Time Fluorescence Quantitative PCR (RT-qPCR)
To ensure the integrity and validity of the transcriptome datasets, primers were meticulously designed utilizing the Primer-BLAST tool hosted by the NCBI, as detailed in Table S1. For the qRT-PCR assessments of the RNA sequencing data, RNA specimens from three distinct biological replicates at each time point, chosen based on observable disparities in root development stages, were employed. These qRT-PCR procedures were facilitated by Nomino Keda (Wuhan) Biotechnology Co., Ltd. (Wuhan, China), using the advanced MonAmp™ ChemoHS qPCR Mix kit for synthesizing first-strand cDNA. The quantitative assessments were performed with the ABI7500 system from Applied Biosystems, based in California, USA, specifically designed for real-time fluorescence quantitation. Actin (accession number XM_010113057.2) was utilized as the consistent reference gene throughout these experiments. The analysis method employed to quantify relative gene expression was the 2−ΔΔCt method [35]. Comprehensive statistical analyses of these quantitative findings were executed using the robust capabilities of Microsoft Excel alongside SPSS software, version 26.0.
3. Results
3.1. Root Development of ‘Yueshenda 10’ in Different Periods
Figure 1 illustrates the progressive stages of root development observed in ‘Yueshenda 10’ cuttings. The period from planting day to the 12th day is marked as the callus formation phase; subsequent to this, from the 12th to the 24th day, the stage of adventitious root induction occurs; following this phase, from the 24th to the 36th day, is identified as the adventitious root initiation phase; concluding with the adventitious root elongation phase spanning from the 36th to the 48th day. As can be seen from the figure, the quality of adventitious roots in the ABT treatment group was significantly higher than that in the CK group, peaking at 48 days. Specifically, at 48 days, the adventitious roots in the ABT treatment group were longer, more numerous, and of better quality compared to those in the CK group. Samples were collected from both the control and treated groups of cuttings at four distinct time points: 12 days (CK1, ABT1), 24 days (CK2, ABT2), 36 days (CK3, ABT3), and 48 days (CK4, ABT4) post-planting, to serve as the experimental subjects for further detailed analysis.
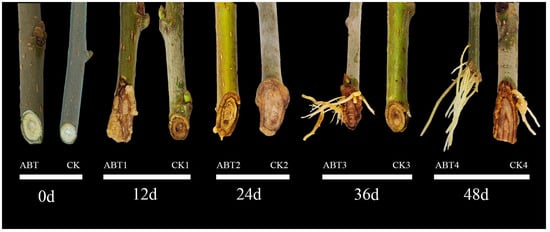
Figure 1.
Changes in the base of ‘Yueshenda 10’ mulberry cuttings at different developmental stages (days after cutting).
3.2. Statistics, Alignment, and Correlation Analysis of Sequencing Results
Transcriptomic profiling was carried out on mulberry cuttings through various growth stages, resulting in a compilation of 149.51 gigabases (Gb) of raw sequence data as presented in Table S2. The quality of the sequence data was robust, with each sample’s Q30 base quality metric exceeding 89.45%, and the GC content was maintained within a narrow range of 45.16% to 46.89%. Following stringent quality controls, the clean reads were effectively aligned to the mulberry reference genome, exhibiting alignment rates varying from 63.71% to 75.24%, as documented in Table S3. The quantified gene expressions were graphically represented through heatmaps in Figure 2, where the correlation coefficients (R2 values) were consistently noted to range between 0.8 and 1. This graphical representation clearly indicated that the samples from the control group (CK) and those treated with ABT1 clustered closely together, demonstrating robust biological reproducibility. The data derived from this transcriptomic analysis highlight the high quality and reliability of the sequencing efforts, confirming the preparedness of this dataset for subsequent bioinformatic evaluations.
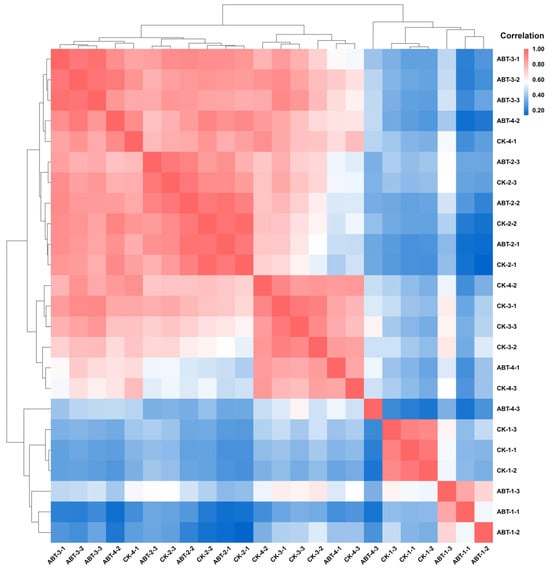
Figure 2.
Correlation analysis among samples. The value in each color block of the heatmap indicates the correlation between the two samples corresponding to the horizontal and vertical axes of that block. A larger value denotes a higher correlation. The color gradient shifts sequentially from blue to white and finally to red, with the correlation strength increasing correspondingly.
3.3. Analysis of DEGs at Different Developmental Stages
In comparison with the baseline control group, the gene expression analysis following the treatment revealed that 1338, 129, 865, and 137 genes were significantly up-regulated, while 1617, 174, 355, and 100 genes were down-regulated at intervals of 12, 24, 36, and 48 days, respectively, as illustrated in Figure 3. Notably, the surge in DEGs at the 12-day mark aligns with the critical period of callus formation, suggesting a time when a diverse array of genes are activated to support the development of adventitious roots. This expression pattern underscores the potential involvement of these genes in the formation of adventitious roots in the ‘Yueshenda 10’ mulberry variety. Furthermore, the differential expression patterns captured in the Venn diagram highlight that 117, 827, 155, and 2510 unigenes were uniquely identified in individual sets of DEGs. In addition, groups of 35, 34, 75, 281, 46, and 7 unigenes appeared in two overlapping sets of DEGs, while 17, 6, 6, and 17 unigenes were consistently found across three sets of DEGs. Remarkably, a core group of 3 unigenes was present across all four sets, indicating a shared expression profile critical to the treatment’s impact.
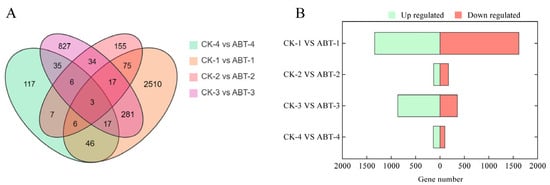
Figure 3.
Statistical analysis of DEGs at different developmental stages. (A) Venn diagrams of the number of differentially expressed genes at different times; (B) Bar charts of the number of differentially expressed genes at different times.
3.4. GO Functional Enrichment Analysis of Differentially Expressed Genes
To delve deeper into the biological implications of the genes differentially expressed under ABT1 treatment, a GO enrichment analysis was performed on the DEGs identified at each critical stage, with the findings depicted in Figure 4. At the initial 12-day mark (Figure 4A), DEGs in the biological process category were predominantly associated with microtubule-based movement. This was closely followed by genes involved in pollen recognition and the response to various abiotic stimuli. Within the cellular component category, the majority of DEGs were part of the integral component of the membrane, with significant representation also in photosystem I and the apoplast. The molecular function category saw a major enrichment in activities related to endopeptidase inhibition, along with notable activities in UDP-glycosyltransferase and protein kinase. By the 24th day (Figure 4B), the focus of enrichment in the biological process shifted towards cell wall biogenesis, complemented by activities in the xyloglucan metabolic process and defense responses. DEGs associated with the nucleus were the most prominent in the cellular component category, alongside others located in the cell wall and apoplast. Molecular functions of these genes included significant enrichment in xyloglucan:xyloglucosyl transferase activity, with additional activities related to hydrolyzing O-glycosyl compounds and DNA binding observed. On day 36 (Figure 4C), the enriched biological processes primarily addressed responses to biotic stimuli, followed closely by reactions to osmotic and salt stress. In the cellular component analysis, cell wall components were highlighted, with additional focus on plant-type cell walls and external encapsulating structures. The molecular function analysis showed a dominance of monooxygenase activity, supported by other oxidoreductase activities and flavin adenine dinucleotide binding. At the 48-day interval (Figure 4D), carbohydrate metabolic processes took precedence in the biological category, alongside lignin catabolic processes and the regulation of jasmonic acid-mediated signaling pathways. The apoplast, integral components of the membrane, and cell wall were the primary focuses within the cellular component category. Molecular functions at this stage were chiefly enriched in transmembrane transporter activity, with substantial contributions from hydrolase activity (specifically hydrolyzing O-glycosyl compounds) and copper ion binding.
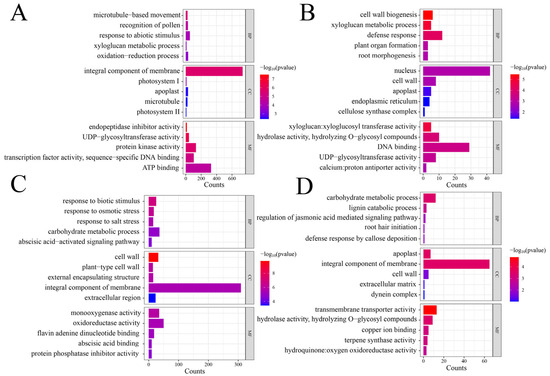
Figure 4.
GO enrichment analysis of DEGs at different stages. (A–D) represent 12 days, 24 days, 36 days, and 48 days, respectively.
Overall, these DEGs showcased a broad involvement in metabolic and enzymatic catalytic activities, with a diverse expression of genes that are crucial for transcription. Furthermore, the data indicated significant molecular, cellular, and biological changes during the rooting process, illustrating the complex nature of adventitious root differentiation in mulberry cuttings.
3.5. KEGG Enrichment Analysis of Differentially Expressed Genes
KEGG pathway analyses were conducted on DEGs comparing four sets: ABT1 versus CK1, ABT2 versus CK2, ABT3 versus CK3, and ABT4 versus CK4. These analyses revealed that 1112 DEGs were linked to 118 pathways, 103 DEGs to 49 pathways, 509 DEGs to 116 pathways, and 104 DEGs to 63 pathways, respectively. Detailed in Figure 5, the pathway analysis underscores the top 15 pathways with the smallest q-values indicating significant enrichment. During the initial callus induction phase comparing ABT1 with CK1, the most significantly enriched pathway was “plant–pathogen interaction,” which included 130 DEGs. This was closely followed by the “plant hormone signal transduction” pathway, incorporating 97 DEGs. In the subsequent adventitious root induction phase (ABT2 vs. CK2), notable pathways with significant DEG enrichment included “plant hormone signal transduction” with 16 DEGs, “MAPK signaling pathway—plant” with 13 DEGs, “circadian rhythm—plant” with 12 DEGs, and “plant–pathogen interaction” with 10 DEGs. As the process advanced to the adventitious root initiation stage (ABT3 vs. CK3), there was a pronounced enrichment of DEGs in the “plant–pathogen interaction” and “plant hormone signal transduction” pathways, with 68 and 53 DEGs, respectively. During the final phase of adventitious root elongation (ABT4 vs. CK4), the “plant hormone signal transduction” pathway again featured prominently, this time with 12 DEGs. This phase also highlighted significant enrichment in other metabolic pathways such as “phenylpropanoid biosynthesis,” “starch and sucrose metabolism,” and “MAPK signaling pathway—plant,” each showing enrichment of nine DEGs. These analyses consistently highlighted “plant hormone signal transduction” as a recurrently significant pathway across all stages, followed by “MAPK signaling pathway—plant,” “plant–pathogen interaction,” and “phenylpropanoid biosynthesis.” The repeated appearance of these pathways suggests their crucial roles in regulating the biochemical and physiological processes underlying the formation of adventitious roots in mulberry trees, reflecting the complex interaction of multiple signaling and metabolic pathways during root development.
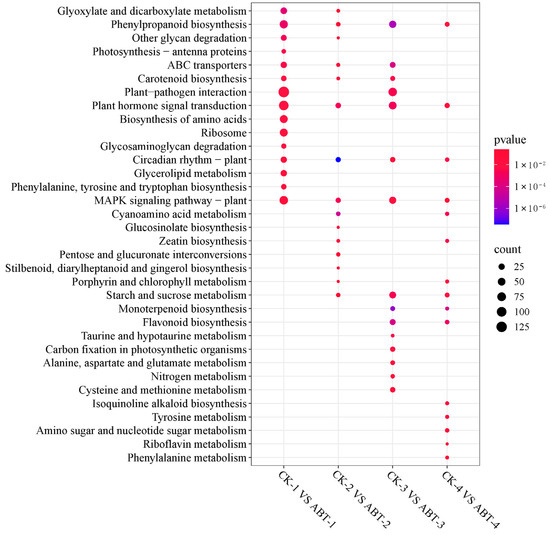
Figure 5.
KEGG enrichment analysis of DEGs at different stages. CK1 vs. ABT1, CK2 vs. ABT2, CK3 vs. ABT3, and CK4 vs. ABT4, respectively, represent the KEGG enrichment results of differentially expressed genes (DEGs) in the ABT1 treatment group compared with the control group at 12, 24, 36, and 48 days.
3.6. Development of Adventitious Roots in Mulberry Mediated by Plant Hormone Synthesis-Related Genes
The KEGG analysis underscored the pivotal role of plant hormone signal transduction in the cutting process, leading to a targeted examination of this specific pathway. An analysis of the transcriptome data yielded a selection of genes involved in hormone biosynthesis and signal transduction: 36 auxin-related genes (Figure 6A), 21 gibberellin-related genes (Figure 6B), 15 jasmonic acid-related genes (Figure 6C), and 10 abscisic acid-related genes (Figure 6D). Figure 6 illustrates the expression patterns of these plant hormone biosynthesis-related genes. To pinpoint genes that potentially foster the development of adventitious roots in the treated specimens, those exhibiting high expression levels in the treatment group were marked as positively correlated with root development. The expression trends of auxin-related genes (Figure 6A) highlight a significant up-regulation at 12 and 36 days. Notably, at the 12-day mark, genes such as gene21164 (IAA1), gene11041 (IAA1), gene4729 (IAA11), gene11139 (indole-3-acetic acid-amido synthase), gene101 (SAUR32), and gene6948 (SAUR19) were markedly expressed. By the 36th day, genes like gene24321 (SAUR50), gene1072 (IAA4), gene16594 (IAA13), and gene7679 (GH3.6) showed significant expression. For the gibberellin pathway, as depicted in Figure 6B, prominent gene expression was observed primarily at 12, 24, and 36 days. Specific instances include gene15341 (carboxylesterase 17) at 12 days, gene4422 (LOC21397054) at 24 days, and both gene3546 (carboxylesterase 15) and gene4884 (bHLH130) at 36 days. The jasmonic acid pathway’s expression profile (Figure 6C) diverges slightly, with differential expression predominantly noted at 12 days; gene3093 (bHLH041) is an example of significant expression within the treatment group at this stage. The expression profiles for the abscisic acid pathway, outlined in Figure 6D, reveal a primary concentration of differentially expressed genes at 12 days, with some fluctuations noted at 24 and 36 days. At these stages, gene8199 (phosphatase 2C) and gene10763 (serine/threonine-protein kinase) were notably expressed, with gene5605 (PYL4) and gene9352 (phosphatase 2C) also showing significant expression at 24 and 36 days, respectively. Overall, the initial stage from 0 to 12 days, corresponding with callus formation, emerges as the most active period for plant hormone action. Comparatively, the differences in hormone activity between the control and treatment groups from 36 to 48 days are less pronounced, indicating a diminishing influence of plant hormones in this later stage.
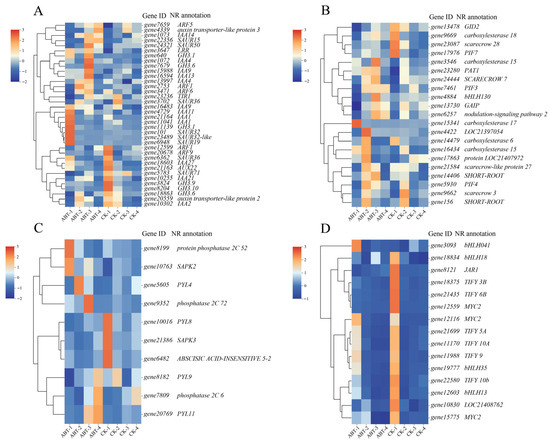
Figure 6.
Expression of DEGs in plant hormone synthesis and signal transduction pathways. (A) Auxin-related genes; (B) gibberellin-related genes; (C) jasmonic acid-related genes; (D) abscisic acid-related genes.
3.7. Weighted Gene Co-Expression Network Analysis
Figure 7A demonstrates that a soft threshold β of 30 achieves a scale-free network fitting index R2 greater than 0.8, while maintaining the average connectivity near zero. This confirms that a β-value of 30 is appropriate for constructing a scale-free network that adheres to the required analytical standards. Consequently, this β-value was employed to establish the network.
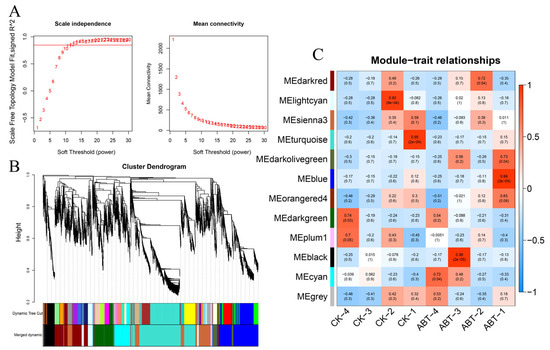
Figure 7.
WGCNA chart of mulberry gene expression and sample association. (A) Determination of the most suitable soft threshold by plotting scale independence and average connectivity. (B) Dendrogram based on co-expression network analysis depicting the hierarchical clustering of genes, with the x-axis representing module colors. (C) Module–sample association plot, where each row corresponds to a module with the same color as in part B, and each column represents a sample. The correlation between different modules is indicated by the values within the boxes.
A dendrogram was constructed using the pairwise correlations among gene expression profiles, as shown in Figure 7B. Employing the dynamic tree cut method, this dendrogram was pruned to organize genes with analogous expression patterns into corresponding branches, with each branch representing a unique co-expression module. Following a threshold module similarity of 0.8, modules exhibiting akin expression profiles were amalgamated, culminating in the formation of 10 distinct co-expression modules. Each module was designated a unique color, and genes that did not fit into any specific module were marked in gray. Subsequent correlation analyses between these modules and various samples highlighted 10 modules that corresponded to different varieties and treatment durations. By examining the interrelations between the modules and the samples, as depicted in Figure 7C, it was discerned that the magenta, black, and brown modules exhibited a significant positive correlation with specific traits. It is noteworthy that among these modules, the blue module exhibits the highest relevance to the ABT1 treatment group, with a correlation coefficient of 0.96. Additionally, the black module shows an even stronger correlation with ABT1, reaching 0.98. Therefore, these two modules were selected as the focus for further in-depth investigation, aiming to explore the core genes within them.
3.8. Key Module and Key Gene Mining
Utilizing the results from the WGCNA analysis and employing visual network analysis techniques, the pivotal hub genes within the identified modules were precisely pinpointed. Afterward, connections among nodes with a weight value exceeding 0.02 were selectively filtered and subjected to thorough analysis. Among these, the 10 nodes demonstrating the highest connectivity within each of the two modules were chosen for detailed study, leading to the creation of co-expression network diagrams for the 10 central genes in each module. Within the black module (illustrated in Figure 8A), gene21267 (GenBank accession numbers: XP_010104889.1) and gene16291 (GenBank accession numbers: XP_010094419.1) emerged as central, playing a significant role in the network. Similarly, in the blue module (depicted in Figure 8B), gene18291 (GenBank accession numbers: XP_010106989.1) and gene20028 (GenBank accession numbers: XP_010109033.1) were identified as central, underscoring their importance in the rooting process of ‘Yueshenda 10’ mulberry cuttings. To deepen the understanding of the functional attributes of these core genes, extensive literature searches were conducted in the Morus notabilis and NCBI databases for related studies on these genes. Additionally, the functions of their homologous genes in A. thaliana were annotated using the TAIR database (Table S4).
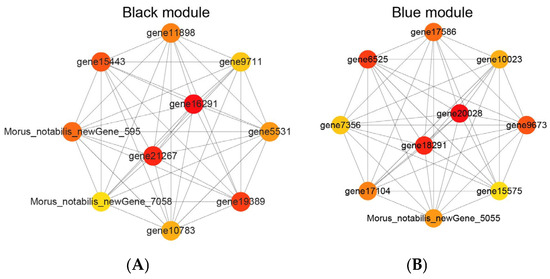
Figure 8.
Co-expression network of core genes in black and blue modules.
3.9. qRT-PCR Validation
To enhance the verification of the transcriptome data’s accuracy, nine genes that exhibited differential expression were randomly chosen and tested using qRT-PCR. The testing results, as presented in Figure 9, confirmed that the expression patterns of these genes closely mirrored those identified through initial transcriptome sequencing. At the same time, four key genes were also verified (Figure S1), and it was found that the trend was in line with expectations. This alignment of results from two distinct methodologies reaffirms the reliability and precision of the initial transcriptome data, confirming their robustness for further scientific analysis.
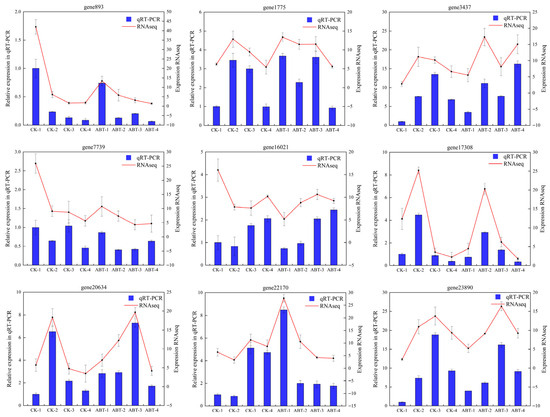
Figure 9.
qRT-PCR validation of gene expression levels.
4. Discussion
Transcriptome sequencing shows strong reliability by detecting diverse targets with great sensitivity across its entire detection range. In recent years, more researchers began using this technology to study woody plant species. The scientific community now understands the genetic aspects of adventitious root formation better thanks to improved deep sequencing technology [36,37]. The study of gene activity helps us learn about the molecular mechanics that control adventitious root development. In this study, transcriptome analyses were carried out on the phloem tissues at four distinct developmental stages of the mulberry variety ‘Yueshenda 10’. Our team prepared four comparative libraries on the Illumina NovaSeq6000 device to study differential expression between CK1 with ABT1 as well as the other three CK–ABT combinations. Scientists produced 149.51 Gb of useful genetic data by making cDNA libraries from treated samples and untreated controls. Our analysis revealed that 4715 genes showed differences in expression between the libraries. Of these genes, 2469 increased in activity and 2246 decreased in activity. Meanwhile, based on the transcriptome results, we obtained molecular evidence for the phenotypic changes of cuttings before and after ABT1 treatment. Phytohormone-related genes play a key role in the development of adventitious roots. From 0 to 12 days, the surge in DEGs made the callus development stage more active in the treatment group. For example, auxin-related genes such as gene21164 (IAA1), gene11041 (IAA1), gene4729 (IAA11), gene11139 (indole-3-acetic acid-amidosynthetase), gene101 (SAUR32), and gene6948 (SAUR19) were significantly expressed. The initial germination stage, corresponding to callus formation, is the period when genes related to phytohormone action are most active. Between 12 and 36 days, endogenous hormones for root growth, such as auxin, gibberellin, and jasmonic acid, began to work synergistically; for instance, gene15341 (carboxylesterase 17) and gene4422 (LOC21397054) started to be significantly expressed. Compared with the control group, the expression of key factors related to root growth in the treatment group was enhanced, leading to more vigorous formation and elongation of adventitious roots. Therefore, the number, length, and quality of adventitious roots in the treatment group were significantly higher than those in the control group. However, from 36 to 48 days, there was no significant difference in hormone activity between the control group and the treatment group, indicating that the influence of phytohormone-related genes gradually weakened in the later stage; moreover, the expression of abscisic acid-related genes further suggested that the adventitious roots of cuttings entered the late growth stage.
The DEGs from four distinct developmental intervals were annotated within the GO database, which revealed that these genes predominantly function across three principal categories: biological processes, molecular functions, and cellular components. Notably, these DEGs are involved in essential functions such as metabolic processes, catalytic activities, structural roles in cellular membranes, and components of the nucleus. Enrichment analysis of pathways further demonstrated that certain pathways, including plant hormone signal transduction, MAPK signaling pathway—plant, plant–pathogen interaction, and phenylpropanoid biosynthesis, were significantly enriched and integral during the adventitious root formation stages. Among these, 82 DEGs were specifically linked to plant hormone signal transduction. The analysis highlights considerable expression differences during the callus formation stage, suggesting distinctive and stage-specific regulatory roles for these DEGs, which vary significantly across different phases of development.
Our study of plant hormone signal transmission showed that Aux/IAA and SAUR genes became prominently active through the auxin pathway when plant cells formed a callus. Scientific experiments show that adding plant hormones to plants increases how certain genes that make and control hormones behave. In Arabidopsis, IAA builds an auxin distribution pattern that helps create adventitious roots. Auxin-driven root development depends on AUX1/like AUX1 (LAX) influx carriers and PIN-Formed (PIN) efflux carriers because they help plants establish the necessary auxin pathways [38]. The main hormone processes that begin root development serve as essential elements in the initial stages of adventitious root formation [39], which matches our research observations. Research shows that IAA genes control rice root system structure and side-branch development which shows auxin pathways strongly determine mulberry root evolution [40]. The SAPK family genes with PYL receptors control abscisic acid (ABA) signaling, while the bHLH and TIFY families constitute significant genes in the jasmonic acid (JA) pathway. SAUR family genes manage multiple plant growth processes including cell development as well as auxin production and transport, while also modifying how plants signal through ethylene receptors to boost plant size. These genes perform multiple roles to boost grapevines growth while controlling genetic regulation within the plants [41]. Scientists found that when callus tissues develop naturally at plant wound locations, JA helps plants rebuild themselves. JA accumulates fast at wounded plant areas [42] and activates genetic pathways to create callus tissue [43]. Our results demonstrate that bHLH genes show early and strong activity in the JA pathway to support plant tissue repair and regrowth.
The genes identified in this study are crucial in influencing plant rooting, as supported by previous research. Among these, tonoplast membrane intrinsic proteins (TIPs) and Nodulin26-like membrane intrinsic proteins (NIPs) are key subclasses of plant aquaporins that contribute to various plant physiological processes and help plants adapt to stress conditions [44]. NIP5;1, a primary member of the NIP family, is known to facilitate boron transport [45] and enhance root cell development in Arabidopsis [46]. Thus, we hypothesize that after ABT1 treatment, the active expression of NIPs and TIPs in mulberry cuttings promotes root cell development and ion transport, resulting in a higher degree of adventitious root development in the treated cuttings compared to the CK group. Furthermore, TIP2;2 plays an important role in boosting plant stress tolerance by promoting the expression of root system genes in Arabidopsis and influencing root structure changes [47]. Additionally, PUB proteins, which contain the U-box domain, are integral to plant stress responses. Studies have demonstrated that overexpressing PUB22 and PUB23 in Arabidopsis increases sensitivity to salt and drought stresses by interfering with the 26S proteasome cascade, which impairs early-stage root development [48]. In A. thaliana, PUB9 modifies the auxin transporter PIN2 through ubiquitination, affecting the polar transport of auxin, thereby regulating root gravitropic growth and lateral root development [49]. Calmodulin-like proteins (CMLs) are essential for plant development and coordination of stress resistance. Research on Arabidopsis mutants and wild-type plants has revealed varying levels of AtCAM and AtCML [50], suggesting their involvement in regulating stem growth and development [51]. We hypothesize that PUB proteins and CMLs (calmodulin-like proteins) act together in the growth and development of adventitious roots, resulting in better quality of adventitious roots in cuttings treated with ABT1 compared to the CK group. These also further confirm the correctness of the core genes identified in this study.
5. Conclusions
In this study, transcriptome sequencing was performed on cuttings of ‘Yueshenda 10’ at four stages before and after ABT1 treatment to characterize the internal molecular changes in the cuttings. Through this analysis, gene 21267, gene 16291, gene 18291, and gene 20028 were identified as potential key genes responsible for the successful rooting of these cuttings. This research not only provides support for the asexual propagation and efficient utilization of mulberry but also clarifies the molecular basis of adventitious root formation in mulberry, extending the research scope to other related species. Moreover, it contributes to the diversification and upgrading of the mulberry industry chain. A limitation of this experiment is that the screened genes have not yet been verified through experiments such as transgenesis, which will be the focus of our subsequent research.
Supplementary Materials
The following supporting information can be downloaded at: https://www.mdpi.com/article/10.3390/horticulturae11080991/s1, Figure S1. The qPCR results of four key genes. Table S1. Upstream and downstream primers of 10 genes and internal reference genes for qRT-PCR. Table S2. Statistics of second-generation transcriptome sequencing data. Table S3. Statistical table of results of second-generation sequencing data and transcript sequence comparison. Table S4. Annotation and function of key genes.
Author Contributions
Conceptualization, J.Q.; methodology, J.Q. and H.D.; software, Z.W.; validation, Z.W. and H.D.; formal analysis, J.S.; investigation, J.S. and H.D.; data curation, H.D.; writing —original draft preparation, Z.W. and H.D.; writing—review and editing, J.Q.; supervision, Z.W.; project administration, J.Q.; funding acquisition, J.Q. and Z.W. All authors have read and agreed to the published version of the manuscript.
Funding
This research was funded by Innovation Project of Shanxi Agricultural University (2016YJ14), Science and Technology Support Project for High-Quality Development of “Specialized” and “High-Quality” Agriculture of Shanxi Agricultural University (TYGC25-44), Special Project for Science and Technology Cooperation and Exchange in Shanxi Province (202304041101010).
Data Availability Statement
The basic data for this article can be found in the article. However, some data are currently not shared and are also part of ongoing research. If necessary, they can be obtained from the corresponding author upon reasonable request.
Acknowledgments
We are also grateful to Xinyuan Qiao from the College of Forestry, Shanxi Agricultural University for his assistance with this thesis.
Conflicts of Interest
The authors declare that they have no conflicts of interest to report regarding the present study.
References
- Waghmare, R.D.; Gore, A.H.; Anbhule, P.V.; Sohn, D.; Kolekar, G.B. Dataset on the shooting and rooting ability of Morus alba using waste tea residue derived carbon dots as an alternative of growth plant stimulator. Data Brief 2020, 29, 105345. [Google Scholar] [CrossRef]
- Cao, X.; Du, W.; Shang, C.; Shen, Q.; Liu, L.; Cheng, J. Comparative transcriptome reveals circadian and hormonal control of adventitious rooting in mulberry hardwood cuttings. Acta Physiol. Plant. 2018, 40, 197. [Google Scholar] [CrossRef]
- Wen, P.; Hu, T.G.; Linhardt, R.J.; Liao, S.T.; Wu, H.; Zou, Y.X. Mulberry: A review of bioactive compounds and advanced processing technology. Trends Food Sci. Technol. 2019, 83, 138–158. [Google Scholar] [CrossRef]
- Lu, L.; Tang, Y.; Xie, J.S.; Yuan, Y.L. The role of marginal agricultural land-based mulberry planting in biomass energy production. Renew. Energy 2009, 34, 1789–1794. [Google Scholar] [CrossRef]
- Velázquez-Martí, B.; Sajdak, M.; López-Cortés, I. Available residual biomass obtained from pruning Morus alba L. trees cultivated in urban forest. Renew. Energy 2013, 60, 27–33. [Google Scholar] [CrossRef]
- Wang, Y.; Wu, K.; Zhen, Z.; Shi, Z.; Yang, H.; Zhang, J.; Jing, Y. Combined Pretreatment with NaOH and Fenton of Mulberry Wood to Enhance Enzymatic Digestibility for Biofuels. J. Biobased Mater. Bioenergy 2018, 12, 65–75. [Google Scholar] [CrossRef]
- Li, Y.; Huang, J.; Yu, C.; Mo, R.; Zhu, Z.; Dong, Z.; Hu, X.; Zhuang, C.; Deng, W. Physiological and Transcriptome Analyses of Photosynthesis in Three Mulberry Cultivars within Two Propagation Methods (Cutting and Grafting) under Waterlogging Stress. Plants 2023, 12, 2066. [Google Scholar] [CrossRef]
- Koyuncu, F. Adventitious Root Formation in Leaf-bud Cuttings of tea (Camellia sinensis L.). Pak. J. Bot. 2004, 36, 763–768. [Google Scholar] [CrossRef]
- Shang, C.; Yang, H.; Ma, S.; Shen, Q.; Liu, L.; Hou, C.; Cao, X.; Cheng, J. Physiological and Transcriptomic Changes during the Early Phases of Adventitious Root Formation in Mulberry Stem Hardwood Cuttings. Int. J. Mol. Sci. 2019, 20, 3707. [Google Scholar] [CrossRef]
- da Costa, C.T.; de Almeida, M.R.; Ruedell, C.M.; Schwambach, J.; Maraschin, F.S.; Fett-Neto, A.G. When stress and development go hand in hand: Main hormonal controls of adventitious rooting in cuttings. Front. Plant Sci. 2013, 4, 133. [Google Scholar] [CrossRef]
- Wendling, I.; Trueman, S.J.; Xavier, A. Maturation and related aspects in clonal forestry—Part II: Reinvigoration, rejuvenation and juvenility maintenance. New For. 2014, 45, 473–486. [Google Scholar] [CrossRef]
- Lv, G.; Qing, J.; Du, H.; Du, Q.; Meng, Y.; He, F.; Liu, P.; Du, L.; Wang, L. Comparing Rooting Ability and Physiological Changes of Two Eucommia ulmoides Improved Varieties. Forests 2021, 12, 1267. [Google Scholar] [CrossRef]
- Zhang, W.; Fan, J.; Tan, Q.; Zhao, M.; Zhou, T.; Cao, F. The effects of exogenous hormones on rooting process and the activities of key enzymes of Malus hupehensis stem cuttings. PLoS ONE 2017, 12, e0172320. [Google Scholar] [CrossRef] [PubMed][Green Version]
- Jiang, Y.D.; Xiong, Y.Q.; Zhang, J.M. Different Rooting Powder Concentrations: Effects on Budding and Rooting of Cutting Segments in 5 Woody Plants. Chin. Agric. Sci. Bull. 2021, 7, 52–58. [Google Scholar] [CrossRef]
- Dave, A.; Vaistij, F.E.; Gilday, A.D.; Penfield, S.D.; Graham, I.A. Regulation of Arabidopsis thaliana seed dormancy and germination by 12-oxo-phytodienoic acid. J. Exp. Bot. 2016, 67, 2277–2284. [Google Scholar] [CrossRef]
- Kohanová, J.; Martinka, M.; Vaculík, M.; White, P.J.; Hauser, M.T.; Lux, A. Root hair abundance impacts cadmium accumulation in Arabidopsis thaliana shoots. Ann. Bot. 2018, 122, 903–914. [Google Scholar] [CrossRef]
- Quan, J.; Ni, R.; Wang, Y.; Sun, J.; Ma, M.; Bi, H. Effects of Different Growth Regulators on the Rooting of Catalpa bignonioides Softwood Cuttings. Life 2022, 12, 1231. [Google Scholar] [CrossRef]
- Zhang, Y.J.; Zhang, X.J.; Zhang, G.Z.; Li, D.D.; Li, R.J. Research on hard branch cutting technology of Longmulberry. For. Sci. Tech. 2012, 4, 27–29. [Google Scholar] [CrossRef]
- Withanage, M.H.H.; Liang, H.; Zeng, E. RNA-Seq Experiment and Data Analysis. Methods Mol. Biol. 2022, 2418, 405–424. [Google Scholar] [CrossRef]
- Santner, A.; Calderon-Villalobos, L.I.; Estelle, M. Plant hormones are versatile chemical regulators of plant growth. Nat. Chem. Biol. 2009, 5, 301–307. [Google Scholar] [CrossRef]
- Velada, I.; Cardoso, H.; Porfirio, S.; Peixe, A. Expression Profile of PIN-Formed Auxin Efflux Carrier Genes during IBA-Induced In Vitro Adventitious Rooting in Olea europaea L. Plants 2020, 9, 185. [Google Scholar] [CrossRef]
- Yu, Y.; Meng, N.; Chen, S.; Zhang, H.; Liu, Z.; Wang, Y.; Jing, Y.; Wang, Y.; Chen, S. Transcriptomic profiles of poplar (Populus simonii × P. nigra) cuttings during adventitious root formation. Front. Genet. 2022, 13, 968544. [Google Scholar] [CrossRef] [PubMed]
- Ramos, J.A.; Zenser, N.; Leyser, O.; Callis, J. Rapid degradation of auxin/indoleacetic acid proteins requires conserved amino acids of domain II and is proteasome dependent. Plant Cell 2001, 13, 2349–2360. [Google Scholar] [CrossRef] [PubMed]
- Druege, U.; Franken, P.; Lischewski, S.; Ahkami, A.H.; Zerche, S.; Hause, B.; Hajirezaei, M.R. Transcriptomic analysis reveals ethylene as stimulator and auxin as regulator of adventitious root formation in petunia cuttings. Front. Plant Sci. 2014, 5, 494. [Google Scholar] [CrossRef] [PubMed]
- Nie, H.; Jiao, F.; Zhang, X.; Li, X.; Tang, Z.; Cheng, J. Expression analysis of ethylene synthesis-related genes aco and sams during the rooting process of mulberry green branch cuttings. Sci. Seric. 2013, 39, 633–637. [Google Scholar] [CrossRef]
- Tang, Z.; Du, W.; Li, X.Y.; Cheng, J.L. Cloning of TIR1 gene in mulberry and analysis of its expression in tissues, organs and rooting in cuttings. Acta Sericologica Sin. 2014, 40, 5. [Google Scholar] [CrossRef]
- Sun, J.; Li, H.; Chen, H.; Wang, T.; Quan, J.; Bi, H. The Effect of Hormone Types, Concentrations, and Treatment Times on the Rooting Traits of Morus ‘Yueshenda 10’ Softwood Cuttings. Life 2023, 13, 1032. [Google Scholar] [CrossRef]
- de Sena Brandine, G.; Smith, A.D. Falco: High-speed FastQC emulation for quality control of sequencing data. F1000Research 2019, 8, 1874. [Google Scholar] [CrossRef]
- He, N.; Zhang, C.; Qi, X.; Zhao, S.; Tao, Y.; Yang, G.; Lee, T.H.; Wang, X.; Cai, Q.; Li, D.; et al. Draft genome sequence of the mulberry tree Morus notabilis. Nat. Commun. 2013, 4, 2445. [Google Scholar] [CrossRef]
- Kim, D.; Paggi, J.M.; Park, C.; Bennett, C.; Salzberg, S.L. Graph-based genome alignment and genotyping with HISAT2 and HISAT-genotype. Nat. Biotechnol. 2019, 37, 907–915. [Google Scholar] [CrossRef]
- Li, B.; Dewey, C.N. RSEM: Accurate transcript quantification from RNA-Seq data with or without a reference genome. BMC Bioinform. 2011, 12, 323. [Google Scholar] [CrossRef]
- Anders, S.; Huber, W. Differential expression analysis for sequence count data. Genome Biol. 2010, 11, R106. [Google Scholar] [CrossRef] [PubMed]
- Dou, H.; Sun, J.; Wang, T.; Bi, S.; Feng, X.; Sun, H.; Quan, J. Transcriptomic profiling and discovery of key transcription factors involved in adventitious roots formation from root cuttings of mulberry. BMC Genom. 2024, 25, 693. [Google Scholar] [CrossRef] [PubMed]
- Zhang, T.; Wong, G. Gene expression data analysis using Hellinger correlation in weighted gene co-expression networks (WGCNA). Comput. Struct. Biotechnol. J. 2022, 20, 3851–3863. [Google Scholar] [CrossRef] [PubMed]
- Schmittgen, T.D.; Livak, K.J. Analyzing real-time PCR data by the comparative C(T) method. Nat. Protoc. 2008, 3, 1101–1108. [Google Scholar] [CrossRef]
- Libao, C.; Minrong, Z.; Zhubing, H.; Huiying, L.; Shuyan, L. Comparative transcriptome analysis revealed the cooperative regulation of sucrose and IAA on adventitious root formation in lotus (Nelumbo nucifera Gaertn). BMC Genom. 2020, 21, 653. [Google Scholar] [CrossRef]
- Li, K.; Liu, Z.; Xing, L.; Wei, Y.; Mao, J.; Meng, Y.; Bao, L.; Han, M.; Zhao, C.; Zhang, D. miRNAs associated with auxin signaling, stress response, and cellular activities mediate adventitious root formation in apple rootstocks. Plant Physiol. Biochem. 2019, 139, 66–81. [Google Scholar] [CrossRef]
- Gao, X.; Nagawa, S.; Wang, G.; Yang, Z. Cell polarity signaling: Focus on polar auxin transport. Mol. Plant 2008, 1, 899–909. [Google Scholar] [CrossRef]
- Della Rovere, F.; Fattorini, L.; D’Angeli, S.; Veloccia, A.; Falasca, G.; Altamura, M.M. Auxin and cytokinin control formation of the quiescent centre in the adventitious root apex of Arabidopsis. Ann. Bot. 2013, 112, 1395–1407. [Google Scholar] [CrossRef]
- Mao, C.; He, J.; Liu, L.; Deng, Q.; Yao, X.; Liu, C.; Qiao, Y.; Li, P.; Ming, F. OsNAC2 integrates auxin and cytokinin pathways to modulate rice root development. Plant Biotechnol. J. 2020, 18, 429–442. [Google Scholar] [CrossRef]
- Yadav, S.K.; Santosh Kumar, V.V.; Verma, R.K.; Yadav, P.; Saroha, A.; Wankhede, D.P.; Chaudhary, B.; Chinnusamy, V. Genome-wide identification and characterization of ABA receptor PYL gene family in rice. BMC Genom. 2020, 21, 676. [Google Scholar] [CrossRef]
- Zhou, W.; Lozano-Torres, J.L.; Blilou, I.; Zhang, X.; Zhai, Q.; Smant, G.; Li, C.; Scheres, B. A Jasmonate Signaling Network Activates Root Stem Cells and Promotes Regeneration. Cell 2019, 177, 942–956.e14. [Google Scholar] [CrossRef] [PubMed]
- Heyman, J.; Cools, T.; Vandenbussche, F.; Heyndrickx, K.S.; Van Leene, J.; Vercauteren, I.; Vanderauwera, S.; Vandepoele, K.; De Jaeger, G.; Van Der Straeten, D.; et al. ERF115 controls root quiescent center cell division and stem cell replenishment. Science 2013, 342, 860–863. [Google Scholar] [CrossRef] [PubMed]
- An, H.; Zhang, J.; Xu, F.; Jiang, S.; Zhang, X. Transcriptomic profiling and discovery of key genes involved in adventitious root formation from green cuttings of highbush blueberry (Vaccinium corymbosum L.). BMC Plant Biol. 2020, 20, 182. [Google Scholar] [CrossRef]
- Li, G.; Santoni, V.; Maurel, C. Plant aquaporins: Roles in plant physiology. Biochim. Biophys. Acta 2014, 1840, 1574–1582. [Google Scholar] [CrossRef] [PubMed]
- Takano, J.; Wada, M.; Ludewig, U.; Schaaf, G.; von Wirén, N.; Fujiwara, T. The Arabidopsis major intrinsic protein NIP5;1 is essential for efficient boron uptake and plant development under boron limitation. Plant Cell 2006, 18, 1498–1509. [Google Scholar] [CrossRef]
- Uenishi, Y.; Nakabayashi, Y.; Tsuchihira, A.; Takusagawa, M.; Hashimoto, K.; Maeshima, M.; Sato-Nara, K. Accumulation of TIP2;2 Aquaporin during Dark Adaptation Is Partially PhyA Dependent in Roots of Arabidopsis Seedlings. Plants 2014, 3, 177–195. [Google Scholar] [CrossRef]
- Cho, S.K.; Ryu, M.Y.; Song, C.; Kwak, J.M.; Kim, W.T. Arabidopsis PUB22 and PUB23 are homologous U-Box E3 ubiquitin ligases that play combinatory roles in response to drought stress. Plant Cell 2008, 20, 1899–1914. [Google Scholar] [CrossRef]
- Pérez-Henríquez, P.; Nagawa, S.; Liu, Z.; Pan, X.; Michniewicz, M.; Tang, W.; Rasmussen, C.; Cui, X.; Van Norman, J.; Strader, L.; et al. PIN2-mediated self-organizing transient auxin flow contributes to auxin maxima at the tip of Arabidopsis cotyledons. Nat. Commun. 2025, 16, 1380. [Google Scholar] [CrossRef]
- Galon, Y.; Finkler, A.; Fromm, H. Calcium-regulated transcription in plants. Mol. Plant 2010, 3, 653–669. [Google Scholar] [CrossRef]
- Yang, T.; Poovaiah, B.W. Hydrogen peroxide homeostasis: Activation of plant catalase by calcium/calmodulin. Proc. Natl. Acad. Sci. USA 2002, 99, 4097–4102. [Google Scholar] [CrossRef]
Disclaimer/Publisher’s Note: The statements, opinions and data contained in all publications are solely those of the individual author(s) and contributor(s) and not of MDPI and/or the editor(s). MDPI and/or the editor(s) disclaim responsibility for any injury to people or property resulting from any ideas, methods, instructions or products referred to in the content. |
© 2025 by the authors. Licensee MDPI, Basel, Switzerland. This article is an open access article distributed under the terms and conditions of the Creative Commons Attribution (CC BY) license (https://creativecommons.org/licenses/by/4.0/).