Article

Towards Understanding the Promotion of Plant Growth Under an Experimental Red-Fluorescent Plastic Film

by
Eric J. Stallknecht
*,† and
Erik S. Runkle
Department of Horticulture, Michigan State University, 1066 Bogue Street, East Lansing, MI 48824, USA
*
Author to whom correspondence should be addressed.
Current address: School of Plant and Environmental Science, Virginia Tech, 1444 Diamond Springs Road, Virginia Beach, VA 23455, USA.
Horticulturae 2025, 11(8), 980; https://doi.org/10.3390/horticulturae11080980
Submission received: 10 July 2025 / Revised: 11 August 2025 / Accepted: 15 August 2025 / Published: 19 August 2025
(This article belongs to the Special Issue Optimized Light Management in Controlled-Environment Horticulture)

Abstract

Semitransparent plastic films containing red-fluorescent pigments can increase the growth of some greenhouse crops despite a lower transmitted photosynthetic photon flux density (PPFD), but the underlying mechanism by which this occurs is not fully understood. We postulated it can be attributed to a lower blue-light environment that increases leaf expansion and thus photon capture. We examined the growth response and photosynthetic capacity of vegetable and ornamental greenhouse crops under a red-fluorescent plastic, plastics with varying transmission percentages of blue light (from 6% to 20%), and an uncovered greenhouse control with a 40% greater PPFD. When the transmitted PPFD was similar, decreasing the percentage of blue light increased the extension growth for some but not all species tested. Transmitted PPFD had a more pronounced effect on extension growth than the percentage of blue light. Lettuce shoot dry mass was greater under the red-fluorescent film than the other covered treatments and similar to the uncovered control with 40% more light. Regardless of the transmission spectrum, decreasing the transmitted PPFD reduced tomato fruit fresh mass and generally decreased the number of flowers ornamental on the species. Maximum photosynthetic rate (Amax), stomatal conductance (gsw), and quantum yield of photosystem II (PhiPSII) consistently decreased as the percentage of blue light transmission decreased, but this did not correlate to biomass accumulation. An experimental red-fluorescent film had cultivar and species-specific effects on growth, highlighting both its potential for leafy greens and potential challenges for greenhouse crops with a greater quantum requirement.

1. Introduction

Protected agricultural systems such as high tunnels and greenhouses can help mitigate undesirable weather conditions, increase water-use efficiency, extend growing seasons, reduce biotic pressure, and in some cases increase crop yield and quality [1]. Transparent plastics are the most used materials to protect crops, accounting for the vast majority of the approximately 5.6 million hectares of global protected agriculture production in 2019 [2]. In addition to the well-understood benefits of protected agriculture, there is an underutilized potential to manipulate the transmission characteristics of various materials. Light transmission characteristics such as photosynthetic photon flux density (PPFD; 400–700 nm), spectral distribution, and directionality are controllable and can independently and sometimes interactively impact crop yield and quality.
There is a growing scientific and industry interest in manipulating the photon spectrum when growing ornamental, medicinal, and food crops under protected cultivation. This interest stems from factors, including (1) research with light-emitting diodes which has improved our understanding of how the photon spectrum regulates crop morphology and biomass accumulation; (2) development of covering materials with improved life spans and modified transmission characteristics, including a diversity of incorporated pigments that photoselectively increase or decrease specific light wavebands; and (3) the opportunity to incorporate transparent photovoltaic materials that selectively absorb some of the incident sunlight into protected agriculture (i.e., agrivoltaics) to co-localize energy and agricultural production [3,4,5,6]. However, there are still impediments to large-scale commercial implementation of materials that alter the solar spectrum. First, different types of crops grown in protected agriculture may have unique responses to an altered light environment. Second, protected cultivation occurs in diverse geographical locations with dissimilar weather conditions. Third, manipulating the photon spectrum decreases the transmitted PPFD. Finally, these novel materials are still developing technologically and are more expensive than their unpigmented counterparts. Therefore, additional research and development are needed to help overcome these barriers and to facilitate large-scale commercial implementation.
The sun emits a broad range of wavelengths including ultraviolet (UV; 280–399 nm), blue (B; 400–499 nm), green (G; 500–599 nm), red (R; 600–699 nm), and far-red (FR; 700–750 nm) photons. These wavebands have independent and interactive effects on the growth and development of plants. Of these, wavelengths between 400 and 700 nm (i.e., B, G, and R light) are considered photosynthetically active radiation (PAR), but UV and FR photons also influence the development of secondary metabolites such as anthocyanins and alter plant architecture in ways that influence whole-plant photosynthesis [5,7]. UV and B photons often increase the accumulation of secondary pigments such as anthocyanins and suppress stem and leaf expansion, resulting in more compact growth habits [7]. High percentages of G light can induce shade-avoidance responses, including increased leaf and stem elongation [8]. R light often has the opposite effect of B light on plant growth; leaves develop fewer secondary pigments and shoot extension growth increases [9]. Although a majority of studies have focused on dicot species, the antagonistic effects of R and B light on extension growth is consistent in monocots such as barley (Hordeum vulgare) [10], indicating the conserved nature of light signaling pathways in plants. Although it is debated whether FR light is photosynthetically active, photons with wavelengths up to 750 nm increase stem and leaf elongation and increase photosynthetic rate [11]. Although wavebands have independent effects on plant growth, light environments in greenhouses, even when modified, have a broad waveband. When considering species- and cultivar-specific responses to the PPFD and photon spectrum, there is still limited information on how modifying the solar spectrum can increase crop production, quality, or both.
One strategy to manipulate the solar spectrum (i.e., alter the transmitted photon spectrum) is to incorporate fluorescent additives into plastics that absorb shorter-wavelength ultraviolet UV, B, and/or G photons and fluoresce longer wavelength red R and FR photons. Various fluorescent materials have increased the biomass accumulation of herbaceous crops such as lettuce (Lactuca sativa) and cabbage (Brassica rapa ssp. pekinensis), a fruiting crop in tomato (Solanum lycopersicum), and the woody species Japanese larch (Larix kaempferi) [12,13,14,15,16,17]. It is often hypothesized that these ‘spectral shifting’ materials can increase crop growth by better matching the absorption spectra of isolated and purified chlorophyll (Chl) a and b or by increasing the flux of R photons that have a higher average quantum yield (mol CO2 fixed per mol photon) than UV, B, and G photons [18,19]. However, these hypotheses have limitations, including the following: (1) plants contain accessory pigments (e.g., carotenoids and xanthophyll) that increase light absorption that ultimately contribute to photosynthesis; (2) G photons may be less photosynthetically efficient but can penetrate deeper in individual leaves and plant canopies; (3) quantum efficiency data as a function of wavelength were generated at low-light intensities; and (4) a decrease in B light transmission can alter plant architecture and consequently photon interception and whole-plant photosynthesis [8,20,21,22]. Currently, there are few published mechanistic studies that tested the different hypotheses for increased biomass accumulation under fluorescent films. Mechanistic studies are needed to understand how red-fluorescent films influence the photosynthetic responses of various greenhouse crops, alter leaf pigment concentrations, and regulate gene expression involved in light signaling pathways.
Experiments performed with red-fluorescent films have shown greater extension growth (e.g., increased leaf area or stem length) of crops such as lettuce, cabbage, Welsh onion (Allium fistulosum), and cucumber (Cucumis sativus) compared to those grown under a neutral density material [12,14,17,23,24,25]. However, this response is not always consistent; in other studies, the morphology of lettuce, strawberry (Fragaria × ananassa), and radish (Raphanus raphanistrum) was unaffected by red-fluorescent materials [12,26,27]. Plants utilize photoreceptors with distinct absorption spectra to perceive the surrounding light environment and mediate photomorphogenesis [5,28]. Phytochromes are photoreceptors that primarily absorb in R and FR light while cryptochromes absorb UV-A and B light. Phytochrome and cryptochrome can both independently influence plant morphology [29,30]. Typically, decreasing the R:FR or the fraction of B photons increases shade-avoidance or acclimation responses [5,28]. Red-fluorescent materials typically increase the fraction of R photons more than FR photons, thereby increasing the R:FR and phytochrome photoequilibrium (PPE), which in theory would inhibit extension growth mediated through phytochrome. However, plants grown under red-fluorescent materials often exhibit increased extension growth. Thus, Stallknecht and Runkle [17] hypothesized that the primary cause of increased extension growth for some crops under red-fluorescent materials resulted from a decreased fraction of B photons and was mediated through cryptochromes.
Plant morphology plays an important role in determining the biomass accumulation of individual plants and entire crops [21]. Increased extension growth (i.e., increased leaf area and internode elongation) can increase biomass accumulation by increasing photon interception, independent of quantum efficiency [3,9]. Stallknecht and Runkle [17] observed a strong positive correlation between increased lettuce single leaf area and shoot fresh mass (SFM), but projected canopy area (PCA) was not correlated with increased SFM. Despite the greater lettuce yield, it is unclear whether fruiting crops and/or floriculture crops exhibit greater growth and yield under red-fluorescent materials. Moreover, it is also unclear whether a photoselective material that absorbed B photons could have similar effects on crop biomass accumulation and quality compared to a red-fluorescent material when transmission of PPFD is constant.
Researchers have hypothesized that increasing the fraction of R photons in a spectrum from red-fluorescent plastics increases photosynthetic efficiency (i.e., quantum yield) of crops, but supporting data are not consistent among crops. The quantum yield of cabbage, sweet pepper (Capsicum annuum), and strawberry increased under a red-fluorescent film, but not in basil (Ocimum basilicum), tomato, and cucumber [31,32]. The objective of this research was to determine how an experimental red-fluorescent film and photoselective films with varying percentages of B light regulated plant morphology and area-based net photosynthetic rate for a diverse range of greenhouse crops. We hypothesized that decreasing the B light fraction would increase extension growth and biomass accumulation of the leafy green lettuce, the fruiting crop tomato, and the floriculture crops petunia (Petunia × hybrida) and snapdragon (Antirrhinum majus). Additionally, we postulated that the single-leaf maximum photosynthetic rate (on a leaf area basis) would be independent of the percentage of B light in the modified solar spectrum treatments.

2. Materials and Methods

2.1. Seedling Growth Culture

All seedlings were placed inside a controlled growth room with a 22 °C air temperature, 60% relative humidity, and ambient CO2 concentration. The environment inside the growth room was more stable than that of a greenhouse, which led to a higher germination rate and more uniform and repeatable seedling transplants. Sole-source lighting was provided by white, B, and R light-emitting diodes (LED)s (RAY 44 Physiospec Indoor; Fluence Bioengineering, Austin, TX, USA). Seedlings were covered with a transparent humidity dome for 4 d until radical emergence. We provided irrigation as needed with deionized water and hydroponic water-soluble fertilizer (12–4–16 RO Hydro FeED; JR Peters, Inc., Allentown, PA, USA) as well as magnesium sulfate (Epsom salt, Pennington Seed Inc., Madison, GA, USA) that provided the following nutrients (in mg∙L−1): 125 N, 42 P, 167 K, 73 Ca, 49 Mg, 39 S, 1.7 Fe, 0.52 Mn, 0.56 Zn, 0.13 B, 0.47 Cu, and 0.13 Mo. The irrigation solution pH and electrical conductivity (EC) were measured with a handheld meter (HI9814; Hanna Instruments, Woonsocket, RI, USA) and adjusted to a pH of 5.8 and EC of 1.2 mS∙cm−1. Seeds of red-leaf ‘Rouxai’ (Rijk Zwaan; Salinas, CA, USA, USA) and green-leaf ‘Butter Crunch’ lettuce (Johnny’s Selected Seeds, Winslow, ME, USA) were sown into 200-cell rock wool sheets (AO 25/40 Starter Plugs; Gordan, Milton, ON, Canada) on 5 April 2022 and grew under an 18 h photoperiod at a PPFD of 200 µmol∙m−2∙s−1 [daily light integral (DLI) = 13.0 mol∙m−2∙d−1] until transplant on 19 April 2022 (14 d). Lettuce seedling growth culture was adapted from Stallknecht and Runkle [17]. Dwarf cherry tomato ‘Red Robin’ seeds (Park Seed Co., Hodges, SC, USA) were sown into 128-cell trays filled with a peat-based soilless substrate (Suremix; Michigan Grower Products, Inc., Galesburg, MI, USA) on 21 April 2022 and grown under an 18 h photoperiod at a PPFD of 250 µmol∙m−2∙s−1 (DLI = 16.2 mol∙m−2∙d−1) until transplant on 13 May 2022 (22 d). Petunia ‘Madness Pink’ and snapdragon ‘Snapshot Yellow’ seeds (PanAmerican Seed Co., West Chicago, IL, USA) were sown into 288-cell trays filled with a mixture of 50% peat-based soilless substrate and 50% vermiculite on 21 August 2022 and grown under a 9 h photoperiod at a PPFD of 200 µmol∙m−2∙s−1 (DLI = 6.5 mol∙m−2∙d−1) until transplant on 19 September 2022 (30 d). Tomato and floriculture seedling culture was adapted from Stallknecht et al. [4].

2.2. Chamber Design

We constructed four chambers with polyvinyl chloride pipe and placed them on aluminum benches inside a glass-glazed research greenhouse at Michigan State University (East Lansing, MI, USA lat. 43° N; Figure 1A). Each chamber provided 2.4 m2 of growing space and had an internal volume of 2.5 m3 (Figure S1). Each chamber had one 6 m3 min−1 fan (Axial 1751; AC Infinity Inc., City of Industry, CA, USA) installed on the south-facing wall that was in line with the air flow of the greenhouse ventilation to maintain a similar internal air temperature among chambers.

2.3. Treatment Transmission

Each chamber was covered with either a common neutral density polyethylene greenhouse plastic (Standard clear 6 mil film; Greenhouse Mega Store, Danville, IL, USA), an experimental red-fluorescent film (as described in [14]), or a photoselective film (not developed specifically for plant applications) that transmitted 6 or 11% of the photons between 400 and 499 nm (Calcolor 90 Yellow and Cinelux Daffodil; Rosco Laboratories Inc., Stamford, CT, USA). The 6% and 11% B treatments are referred to as ‘very low blue’ and ‘low blue’ henceforth. Varying layers of 11% and 40% neutral density shading materials (ProtekNet; Johnny’s Selected Seeds and Harmony 2047 FR; Ludvig Svensson Inc., Charlotte, NC, USA) were used to cover the chambers to match the transmission PPFD among the four covered treatments. In addition to the four chambers, a greenhouse bench with no chamber or covering material was used as a greenhouse control treatment. We used a spectroradiometer (LI-180 Spectrometer; LI-COR, Inc., Lincoln, NE, USA) to measure treatment transmission spectra on a cloudless day at solar noon (n = 10). The photon spectrum for each treatment is depicted in Figure 1B and Table S1.

2.4. Greenhouse Environment and Sensing

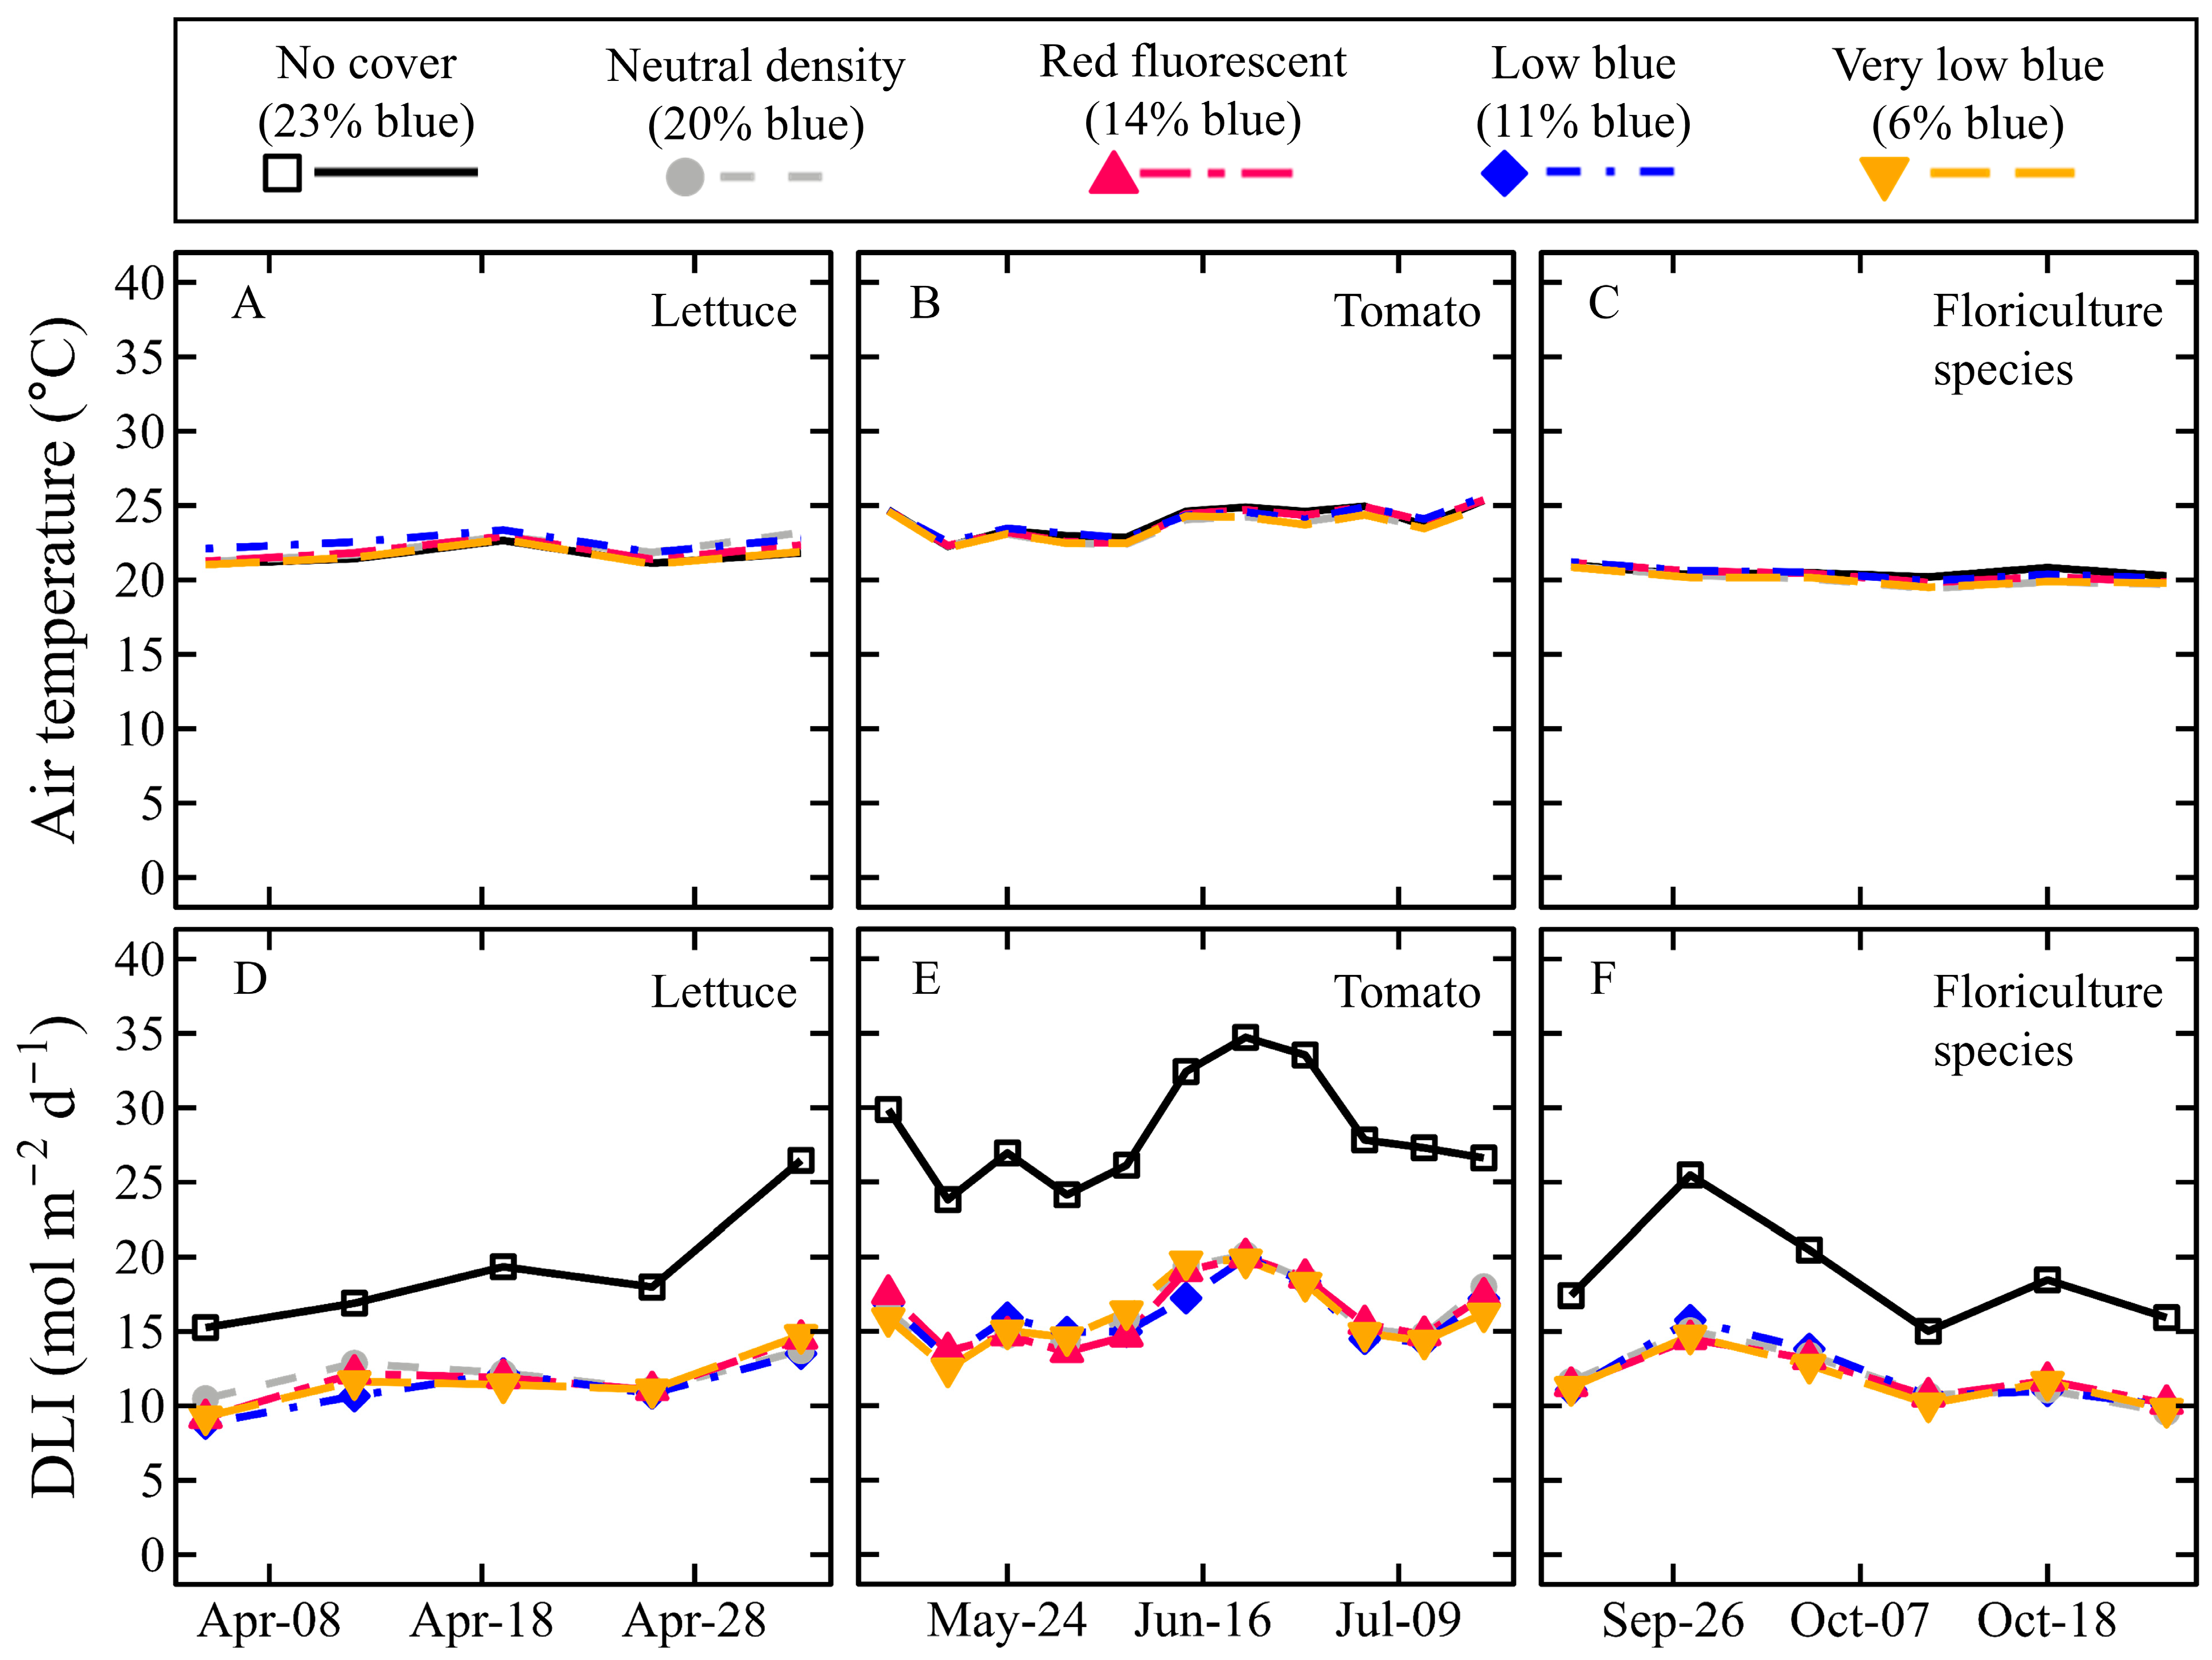
The research greenhouse was controlled by an environmental control system (Integro 725; Priva, De Lier, The Netherlands) with a constant setpoint of 21 °C and ambient CO2 concentration. Steam heat, evaporative cooling pads, exhaust fans, and roof vents regulated the greenhouse air temperature. Each greenhouse bench (i.e., an experimental unit) contained one aspirated and shielded thermocouple (Type E; Omega Engineering, Inc., Stamford, CT, USA) and one quantum sensor (LI-190SA; LI-COR, Inc.) maintained at canopy height for the duration of the experiment. Air temperature and instantaneous PPFD were measured every minute with a data logger (CR-1000; Campbell Scientific, Logan, UT, USA) and hourly averages were recorded. Average weekly air temperature and daily light integral (DLI; mol∙m−2∙d−1) data are displayed in Figure 2A–F and Table S2. Average weekly air temperature differences among greenhouse benches were <0.5 °C (Figure 2A–C). Average DLI values among the four covered treatments were within 0.5 mol∙m−2∙d−1 but the average DLI for the uncovered greenhouse control treatment was 7–12 mol∙m−2∙d−1 greater than the covered treatments (Figure 2D,E).

2.5. Mature Growth Culture

Lettuce and tomato seedlings were transplanted into 1800 cm3 plastic pots filled with a peat-based soilless substrate, and floriculture seedlings were transplanted into 1000 cm3 plastic pots with the same media. Pots containing lettuce, tomato, and floriculture crops were placed inside the greenhouse chambers at a density of 22, 12, and 25 plants per m2, respectively. Pot size and planting densities were based on their anticipated sizes at final harvest, ensuring little competition for light. Plants were irrigated as needed with a solution of reverse osmosis water mixed with a 13 N–1.3 P–12.5 K water-soluble fertilizer that contained (in mg∙L−1) 125 N, 13 P, 120 K, 77 Ca, 19 Mg, 1.7 Fe, 0.4 Cu, and Zn, 0.8 Mn, 0.2 B and Mo (MSU Orchid RO Water Special; GreenCare Fertilizers, Inc., Kankakee, IL, USA). The lettuce and tomato received no supplemental lighting but floriculture crops received supplemental lighting above the chambers, providing an average PPFD of 110 µmol∙m−2∙s−1 at bench height for 16 h∙d−1 from luminaires (ILM-PG-180-2-300W-ED-FS-60; Rofianda Trading B.V., The Netherlands) containing broad-band (white) LEDs with a similar spectrum to sunlight (SunLike LED STW9C2SB-S; Seoul Semiconductor, Gyeonggi-do, South Korea). The floriculture crops received supplemental lighting because the solar PPFD was moderately low, and thus plant growth inside the covered chambers would have been relatively poor. The LEDs emitted 24% B, 36% G, 34% R, and 6% FR light. The supplemental lighting was controlled with the same environmental control system that managed air temperature inside the greenhouse and operated from 0500 to 2100 h.

2.6. Data Collection

Lettuce, tomato, and floriculture crops grew until destructive measurements were taken on 10 May, 29 Jul, and 28 Oct 2022 (21, 75, and 40 d in the treatments), respectively. Leaf length and width, chlorophyll concentration (n = 3), and CIELAB color space (n = 3) were measured on the most recently fully expanded leaf from each plant with a ruler, chlorophyll meter (MC-100; Apogee Instruments, Inc., Logan, UT, USA), and colorimeter (BC-10 Plus; Konica Minolta Sensing, Ramsey, NJ, USA), respectively. Specific leaf area (SLA) was calculated by dividing the area of a representative leaf [measured with a leaf area meter (LI-3000C; LI-COR, Inc.)] by its dry mass. PCA was measured with top–down photos and ImageJ software (version 1.54d) [33]. Stem length was measured as the distance from the substrate surface to the apical meristem. Stem diameter was measured with digital calipers (41101 DigiMax; Wiha Switzerland, Monticello, MN, USA) at the substrate surface. SFM and shoot dry mass (SDM) per plant were measured for all stems and leaves on a digital scale (GR-200 or GX-1000; A&D Store, Inc., Wood Dale, IL, USA). SDM was measured after drying shoots for 4 d at 60 °C in a dedicated drying oven (Blue M, Blue Island, IL, USA or SMO28-2; Sheldon Manufacturing, Inc., Cornelius, OR, USA). Radiation use efficiency (RUE) was calculated by dividing SDM by the total mol of intercepted PAR for each sample. For tomato, ripe and unripe fruits were counted at a single destructive measurement. A tomato fruit was considered ripe when at or past the turning stage [34]. Fruit fresh mass (FFM) was measured on all ripe and unripe tomato fruits. For petunia and snapdragon, the time to flower was calculated as the number of days from transplant to the first fully open flower. Additionally, at the time of harvest, we counted the total number of visible flowers and flower buds and the number of branches >3 cm long.

2.7. Light Response Curves

Measurements were made with a portable photosynthesis system (LI-6800; LI-COR, Inc.) using the fluorometer head attachment for each greenhouse crop in each treatment (n = 3) to generate light response curves. Measurements were taken on mature, fully expanded leaves at the top of the canopy ± 3 h from solar noon. The environmental conditions inside the chamber were set at 10,000 rpm fan speed, 500 µmol∙s−1 air flow rate setpoint (0.85 L∙min−1), 0.1 kPa pressure deficit, 50% relative humidity, 400 ppm CO2 concentration, and 25 °C leaf temperature. Light response curves were generated using light-adapted leaves with descending PPFDs of 1800, 1500, 1200, 900, 600, 300, 150, 50, and 0 µmol∙m−2∙s−1. The light was provided by the fluorometer head and consisted of 20% B and 80% R photons. Light response data were analyzed in R software (version 4.3.3) [35] using a non-rectangular hyperbola expressed as
P N ( I ) = α I + P N M A X ( α I + P N M A X ) 2 4 θ I P N M A X 2 θ R D
where α is the initial slope of the light response curve, I is the PPFD, θ is the convexity of the light response curve, PNMAX is the maximum rate of photosynthesis, and RD is the dark respiration rate according to Marshall and Biscoe [36].

2.8. Stomatal Conductance and Quantum Yield Measurements

Stomatal conductance (gsw), and quantum yield of photosystem II (PhiPSII) survey measurements were taken with a portable fluorometer and porometer (LI-600; LI-COR, Inc.). Survey measurements were taken at solar noon on a cloudless day for each greenhouse crop on light-acclimated leaves near the top of the canopy when plant were fully mature (n = 20). Survey measurements on lettuce, tomato, and floriculture crops were taken on 10 May, 26 July, and 24 October 2022, respectively.

2.9. Experimental Design and Statistical Analysis

The experiment was organized as a completely randomized design where each greenhouse bench was an experimental unit that was randomly assigned the treatment and plants. The lettuce, tomato, and floriculture crop sample size was 20, 24, and 25 plants, respectively. Data were analyzed in R software using analysis of variance and Tukey’s honestly significant difference test at α = 0.05. Additionally, regression analysis was conducted on plants from the neutral density and two blue-selective cover treatments as a function of percentage of B light. The greenhouse control treatment was omitted from regression analysis because the average DLI was ~40% greater than the covered treatments. Additionally, the red-fluorescent treatment was omitted from regression analysis because the transmission of G photons also decreased significantly, which could have interactive effects on crop morphology and biomass accumulation.

3. Results

3.1. Morphology

3.1.1. Lettuce Morphology

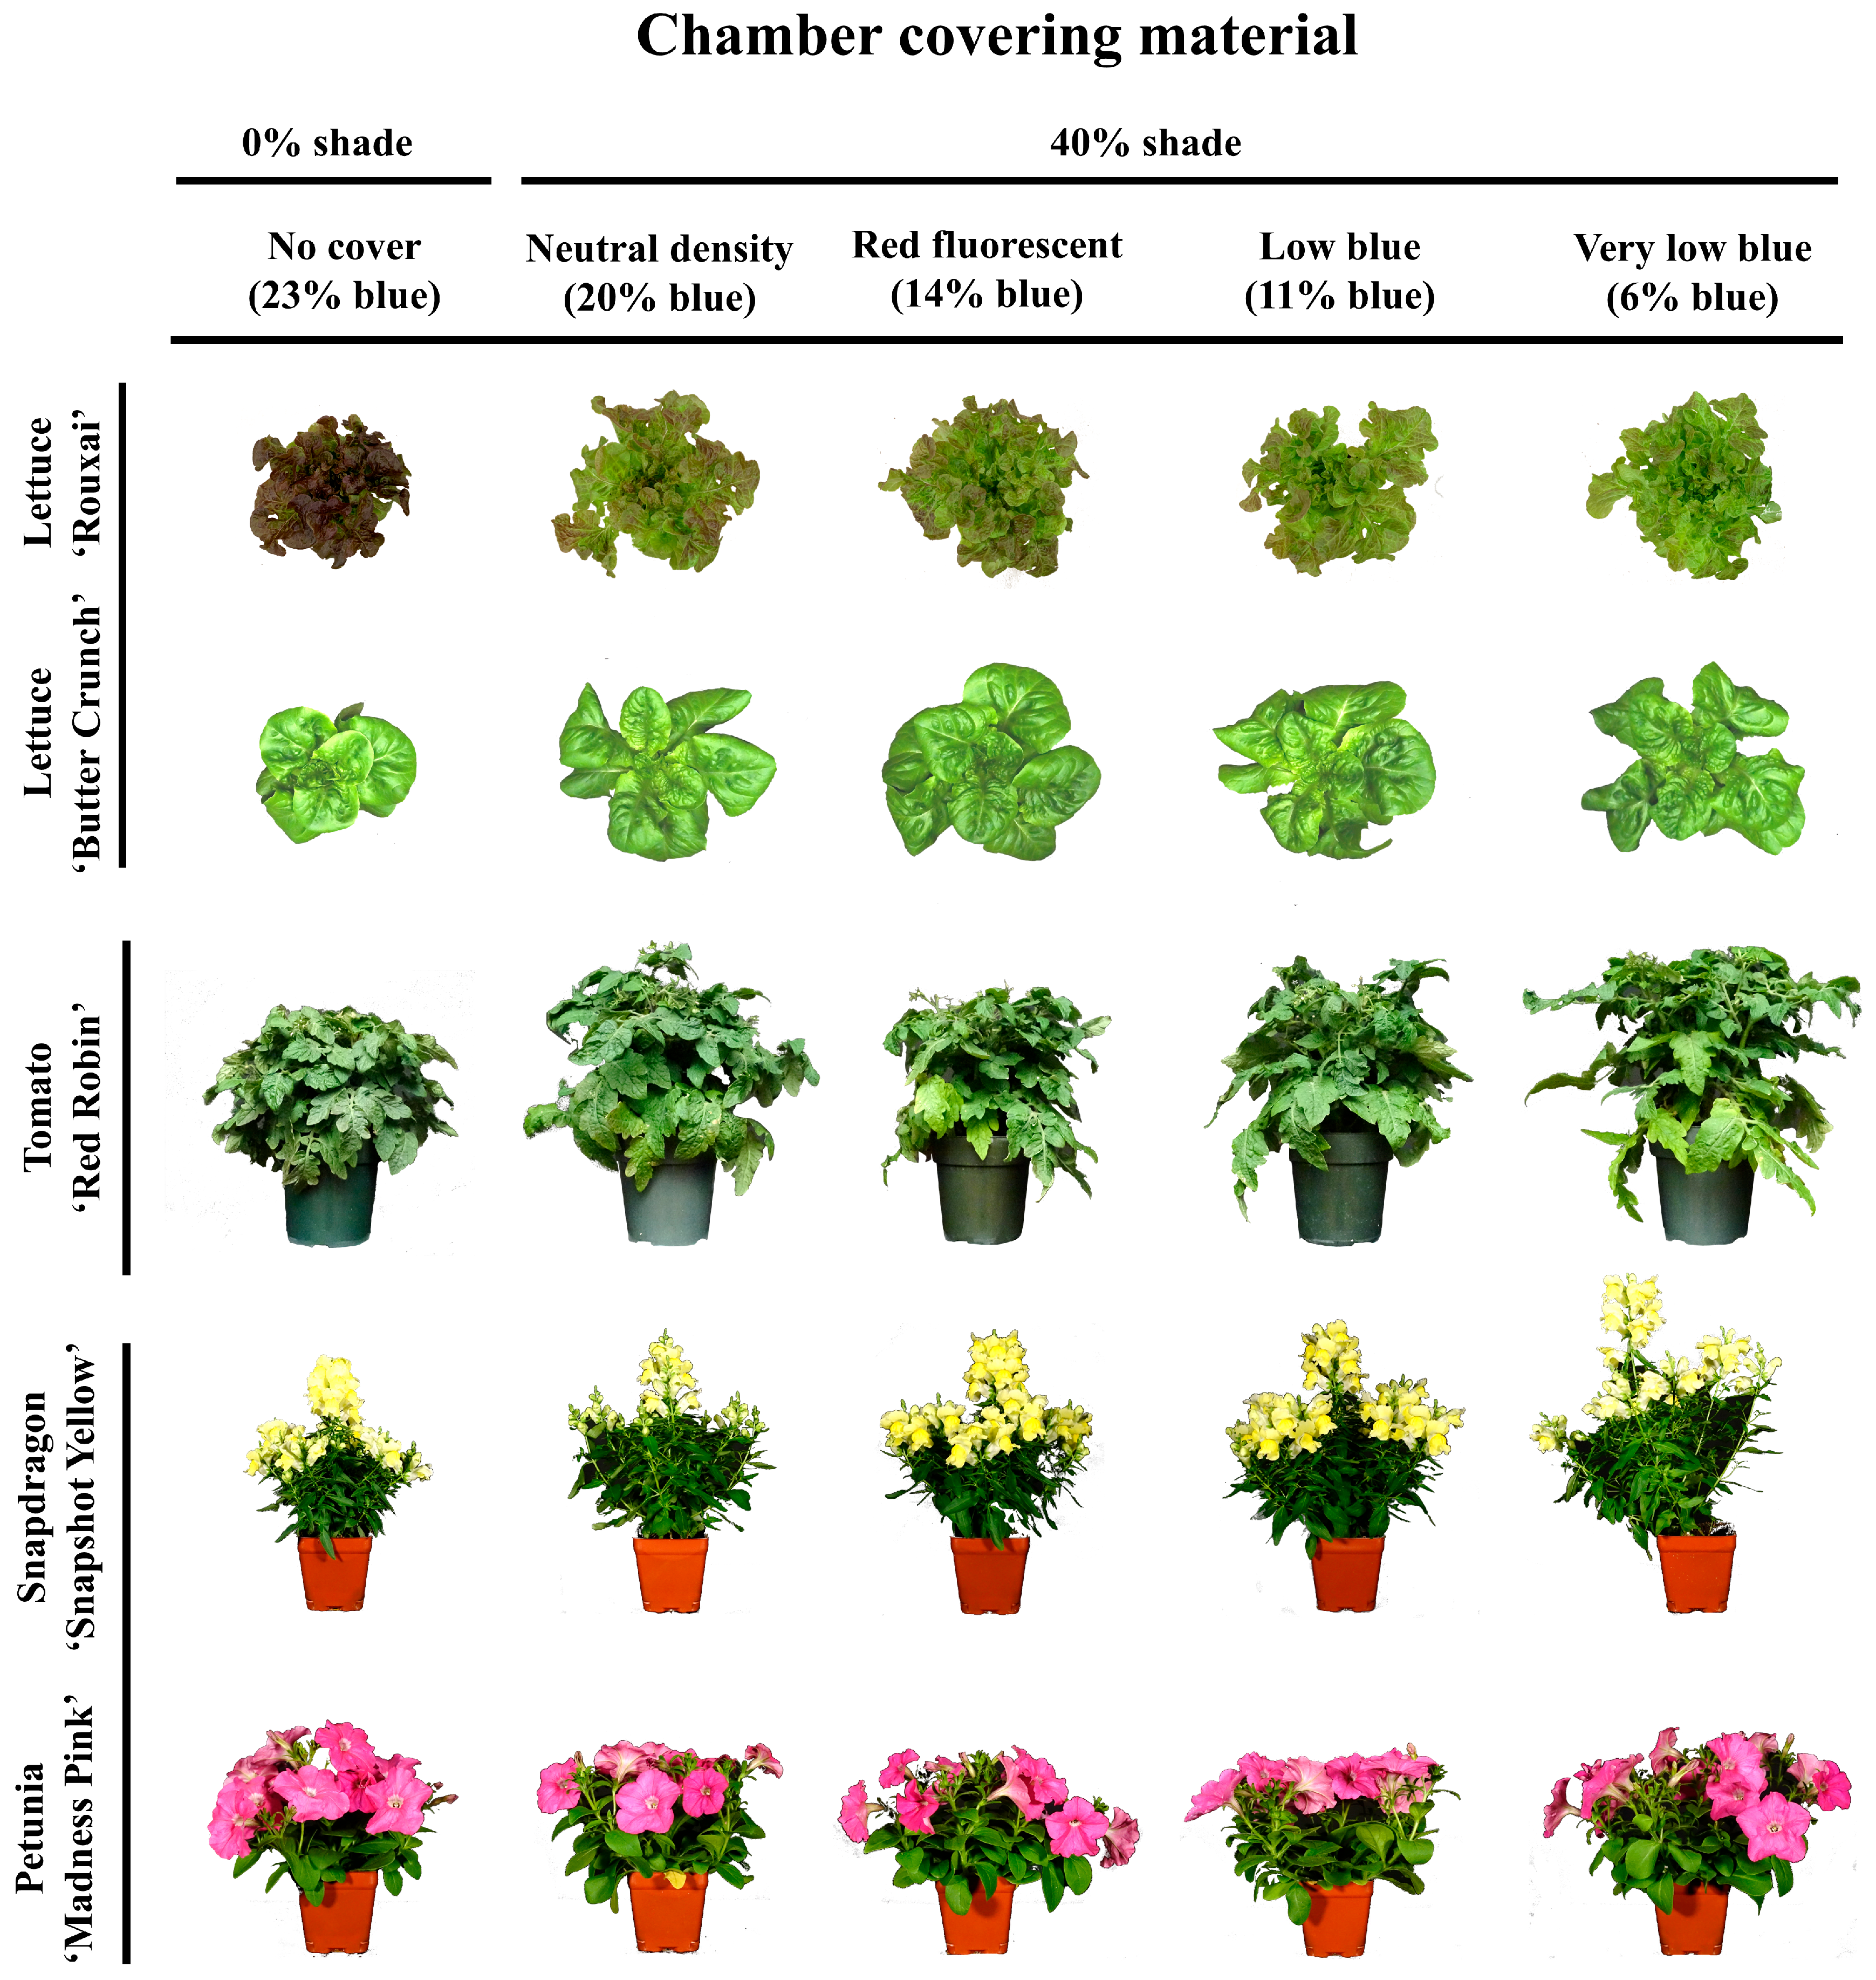
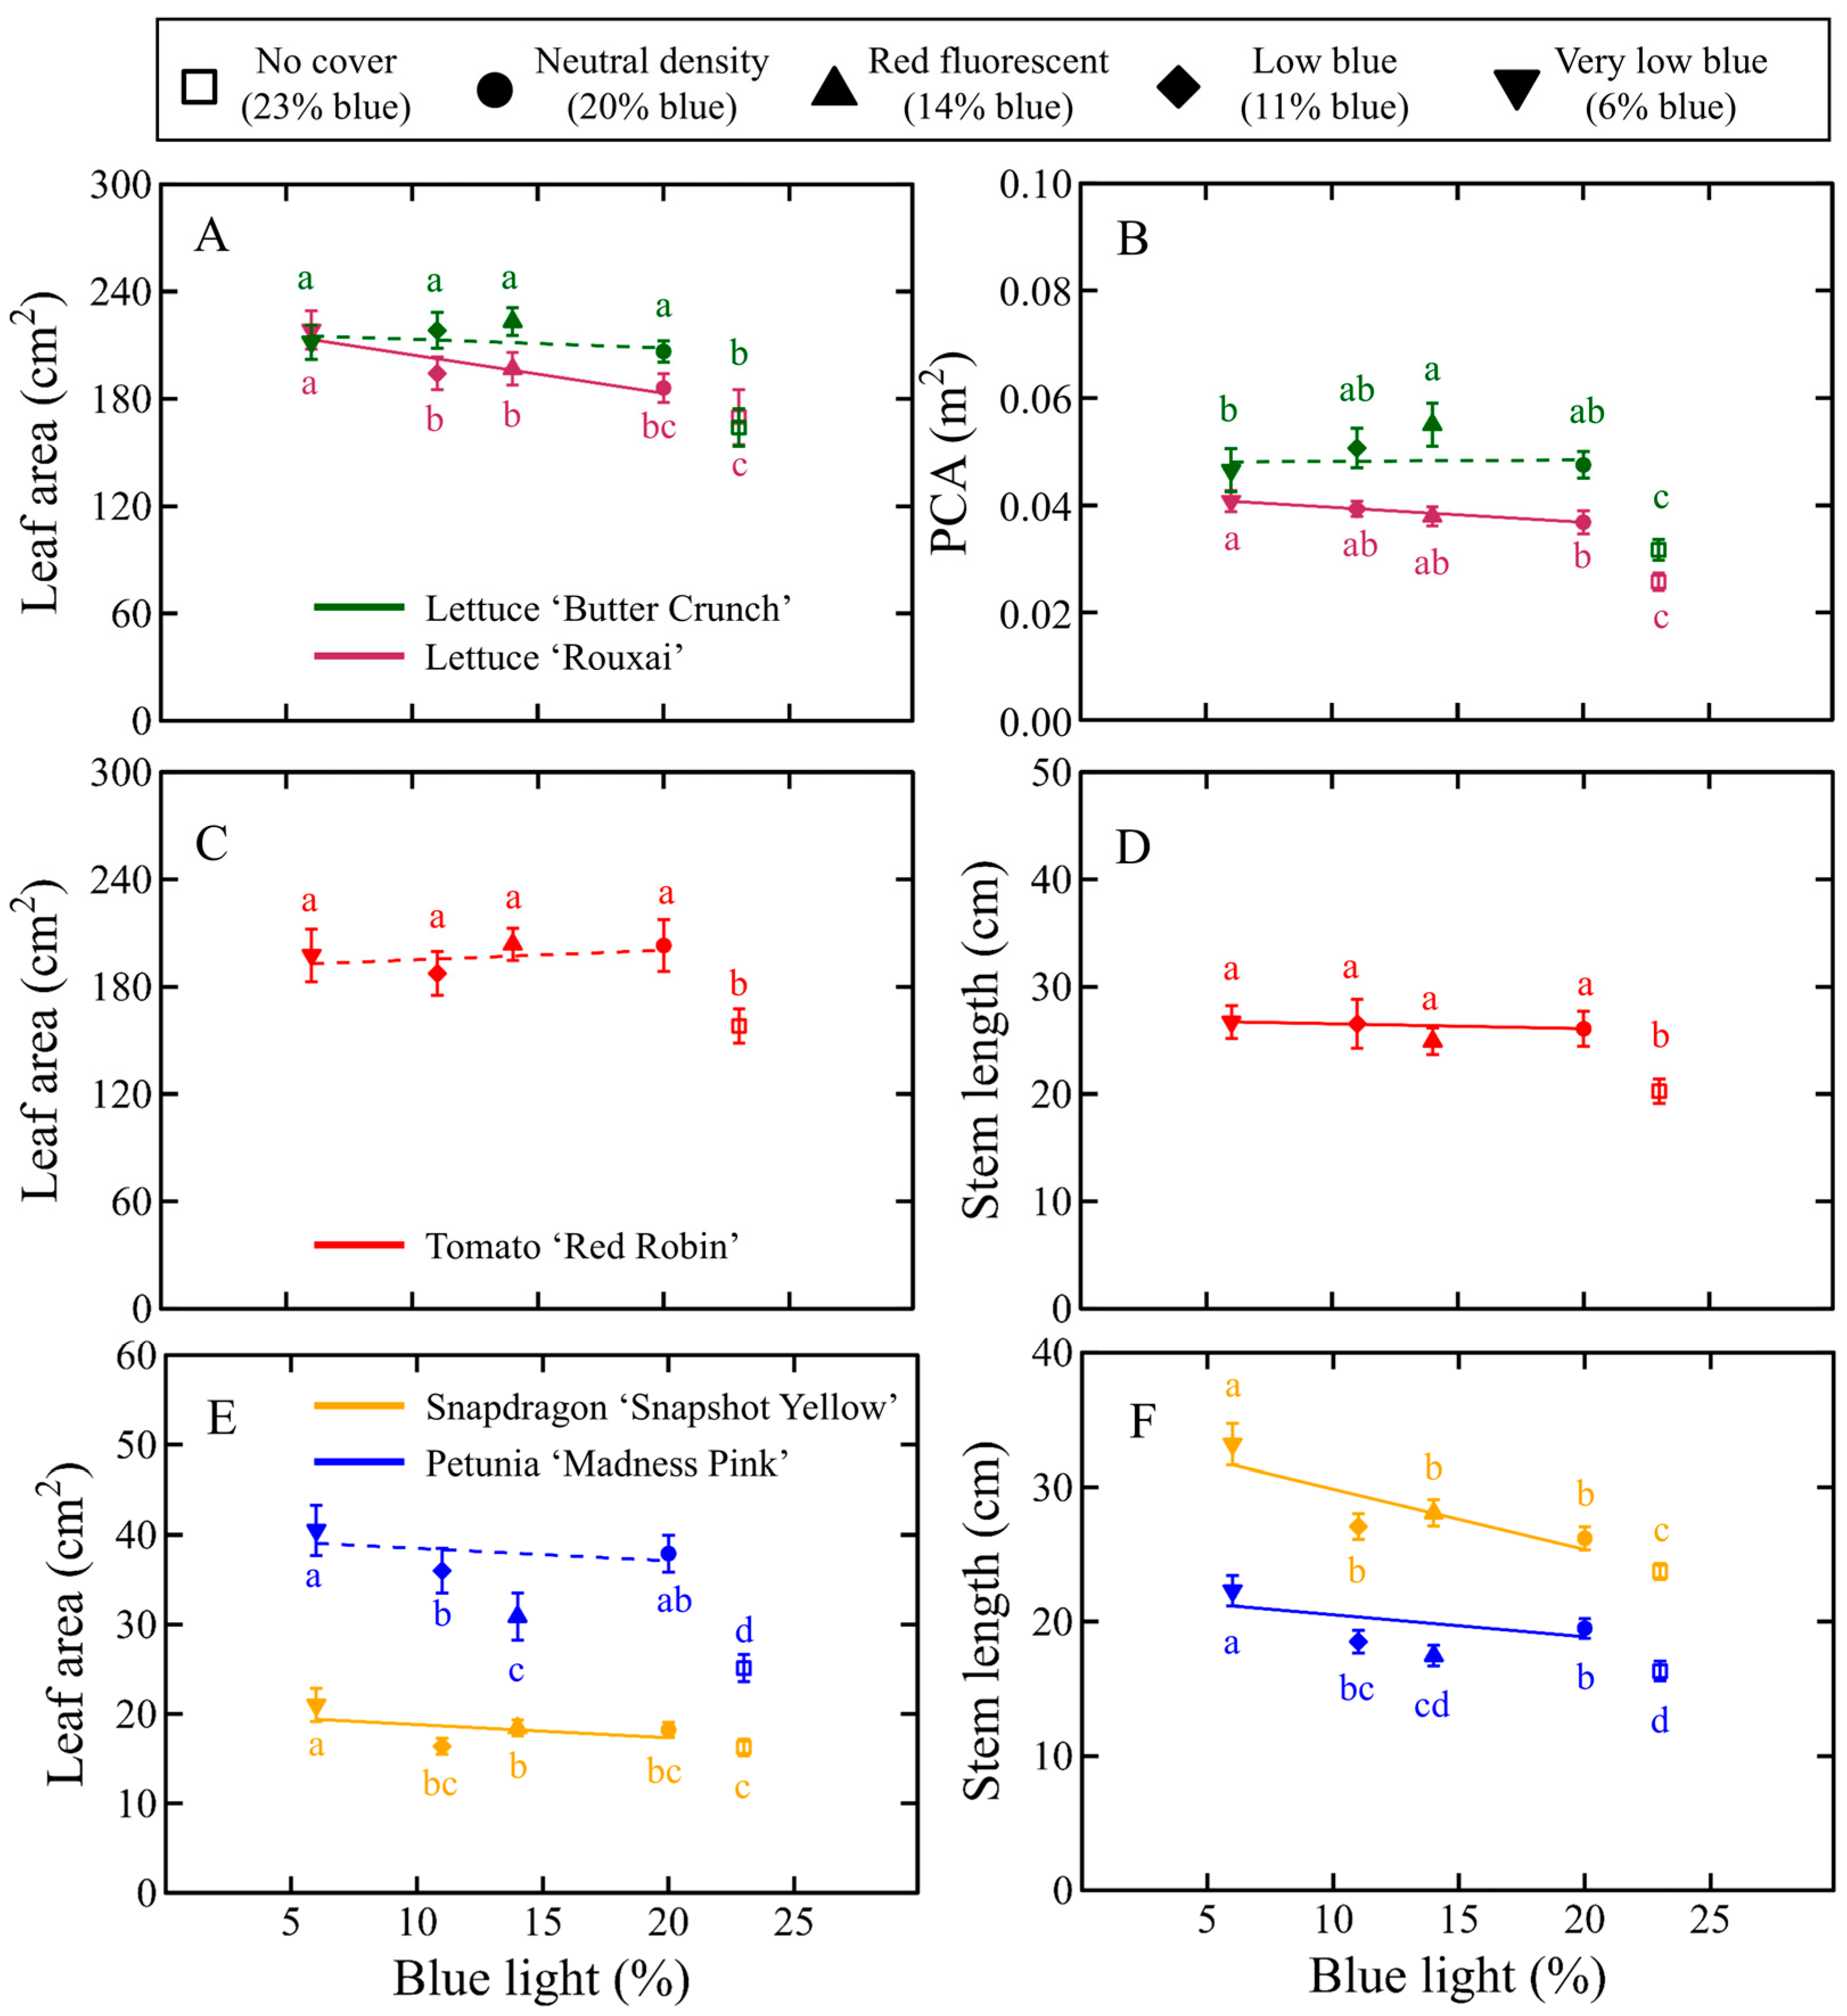
Figure 3 displays a representative plant grown under four different shading materials with varying percentages of B light ranging from 6% to 20% and an uncovered greenhouse control with a 40% higher average DLI. Figure 4 depicts important morphological metrics for each crop as a function of the percentage of B light in the transmission spectrum. The average values and statistical tests for all growth metrics and crops are displayed in Tables S3–S7. The regression analysis for each crop growth parameter as a function of B-light percentage is presented in Tables S8–S12.
The single-leaf area of lettuce decreased linearly as the percentage of B light increased from 6% to 20% for red-leaf lettuce ‘Rouxai’ but not for green-leaf lettuce ‘Butter Crunch’ (Figure 4A). ‘Butter Crunch’ leaves in the neutral density treatment had 31% greater area than plants under the uncovered greenhouse control. PCA was between 34–40% and 32–42% smaller in the greenhouse control for ‘Rouxai’ and ‘Butter Crunch’ compared to the covered treatments, respectively (Figure 3 and Figure 4B). Among the covered treatments, B-light percentage had no effect on the PCA of either lettuce cultivar.

3.1.2. Tomato Morphology

Dwarf cherry tomato ‘Red Robin’ leaf area and stem length were similar under all covered treatments (Figure 4C,D and Figure S2). Regardless of the covered treatment, tomato leaves had approximately 20% less surface area and plants were 22% shorter compared to plants in the uncovered control.

3.1.3. Floriculture Crops Morphology

In general, floriculture species under the covered treatments exhibited greater stem elongation compared to the uncovered control plants, but snapdragon was more sensitive to the percentage of B photons than petunia. All the covered treatments increased petunia leaf area, but there was no effect on snapdragon leaf area (Figure 4E). At the average DLI of 12.7 mol∙m−2∙d−1, snapdragon leaf area increased by 15% as the percentage of B photons decreased from 20% to 6%, but not in petunia. Unique to petunia, leaf area under the red-fluorescent film was less than plants under the other covered treatments. Among the covered treatments, snapdragon and petunia stem length increased linearly as the percentage of transmitted B photons decreased (Figure 4F).

3.2. Biomass Accumulation

3.2.1. Lettuce Biomass Accumulation

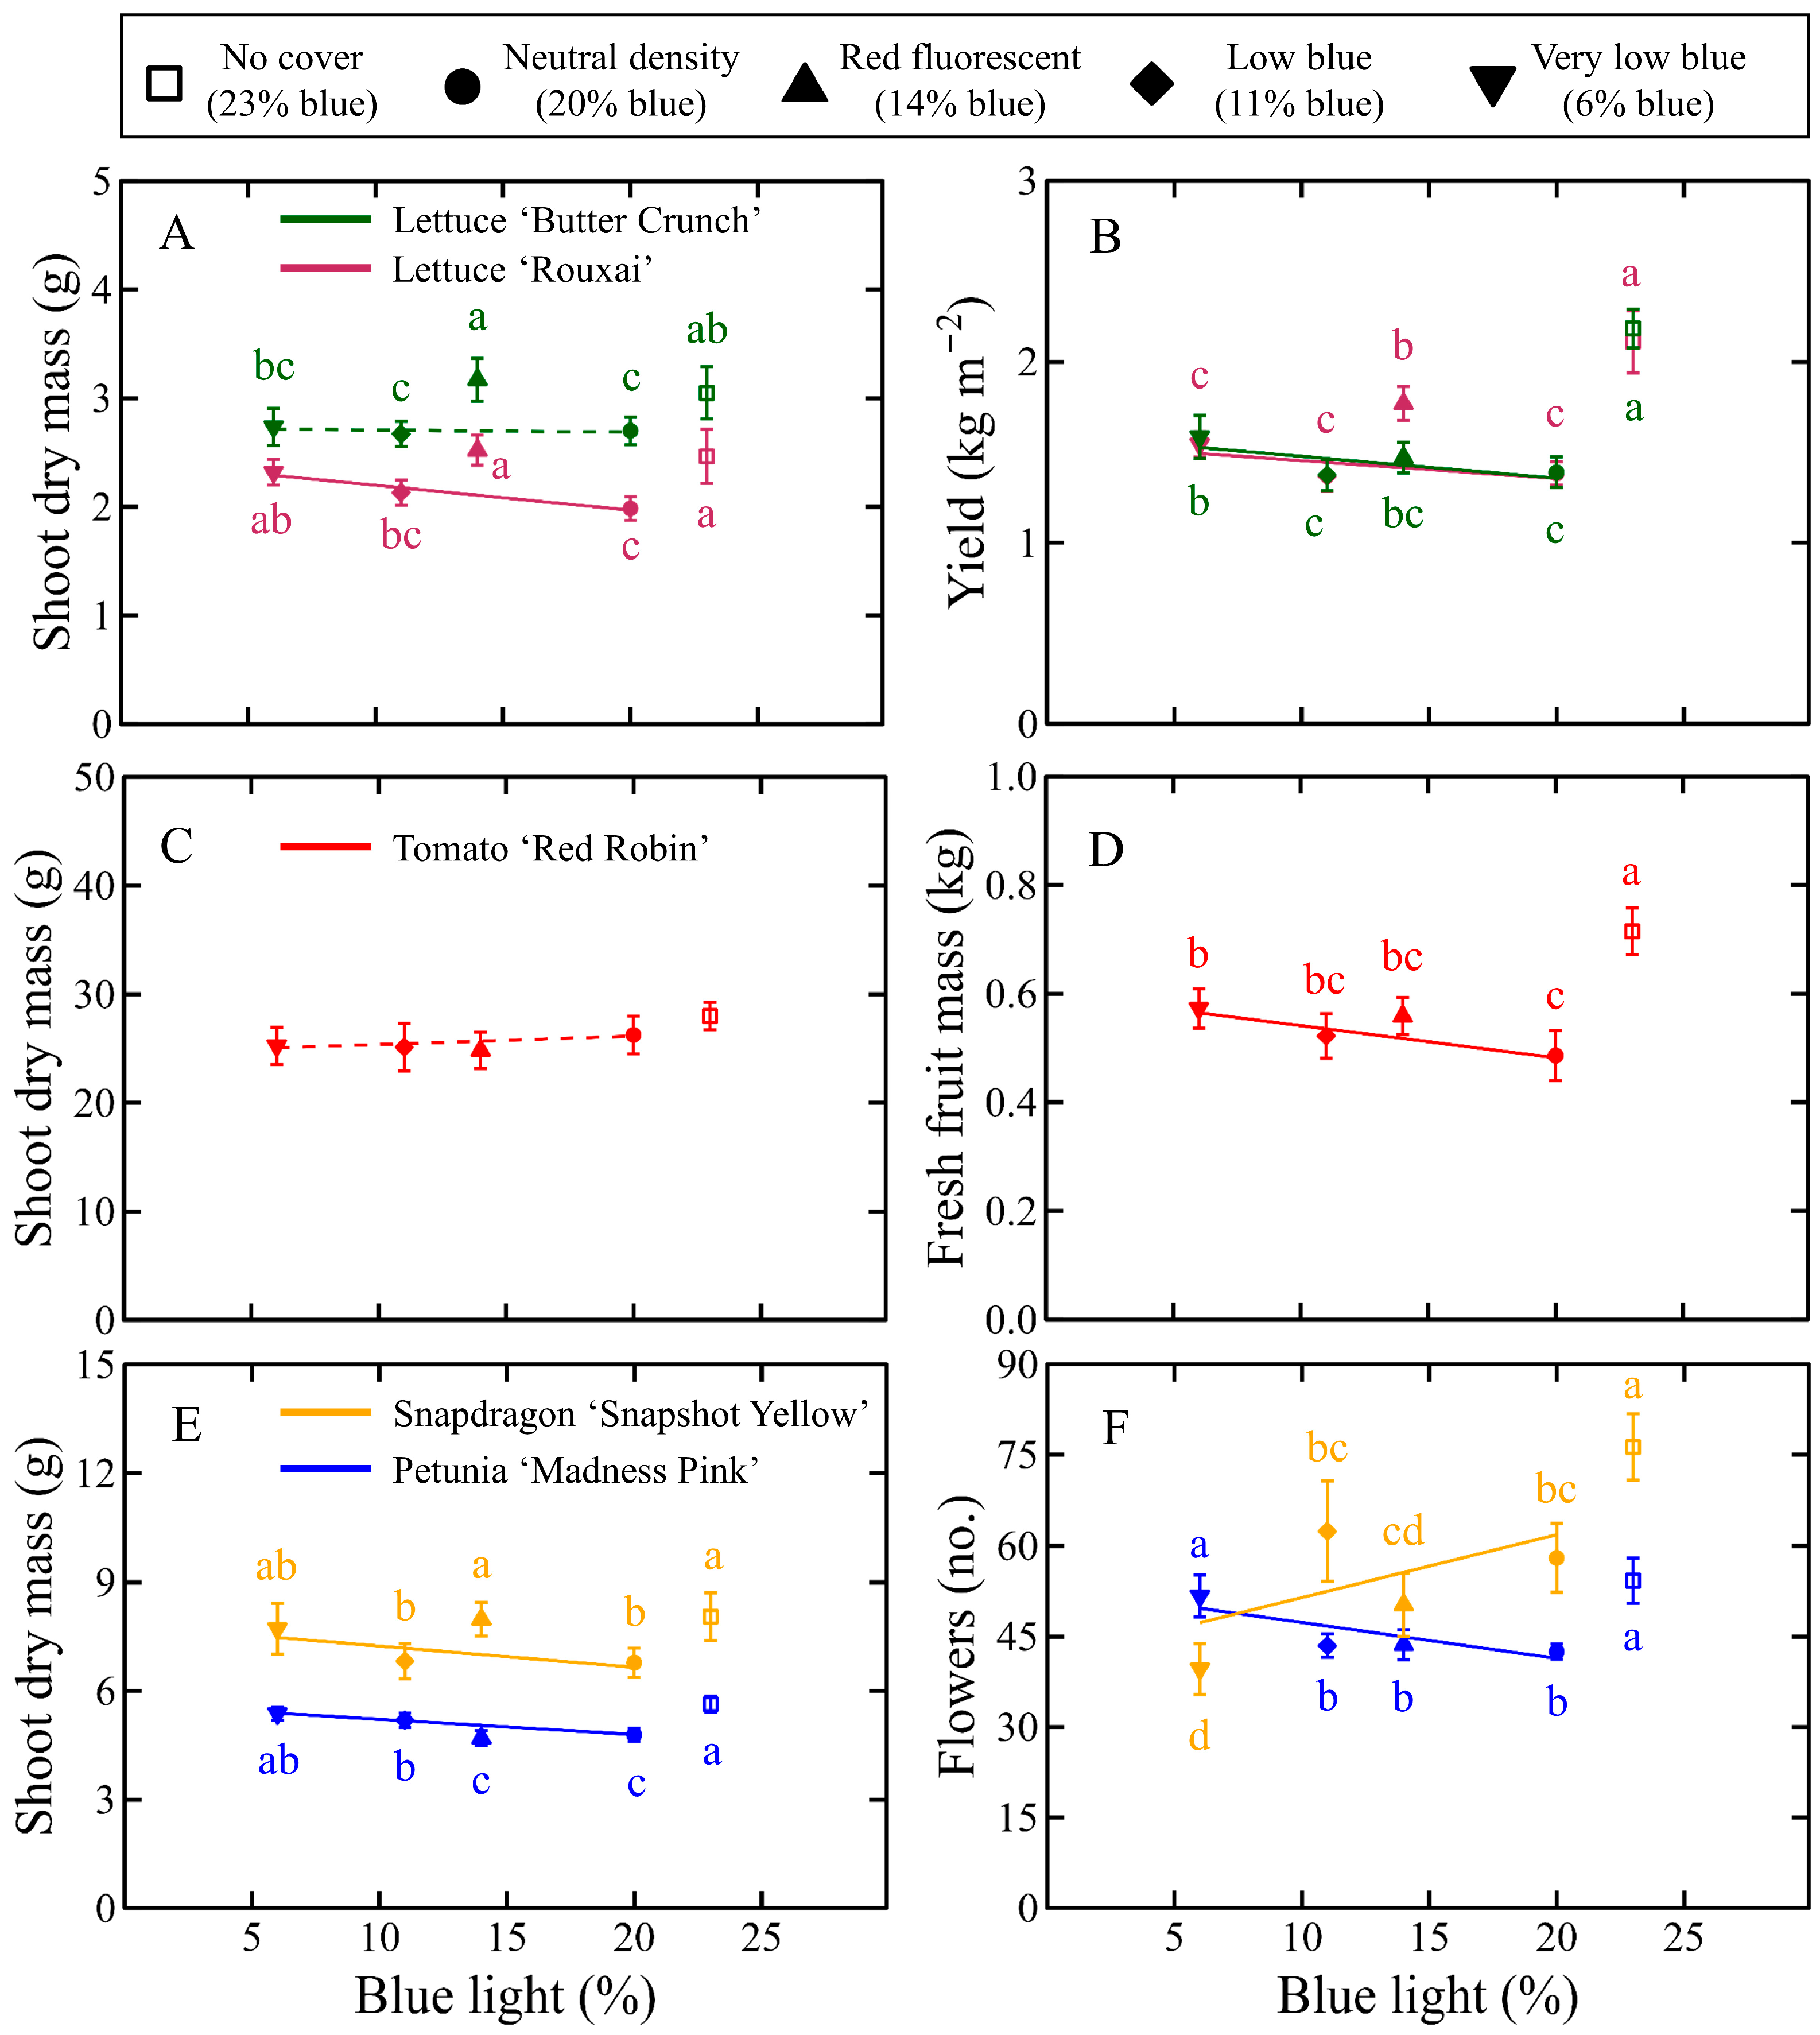
Figure 5 displays growth metrics for each crop as a function of the percentage of B photons in the transmission spectrum. Yields of both cultivars were greatest in the uncovered control treatment. Lettuce ‘Rouxai’ and ‘Butter Crunch’ grown under the red-fluorescent film had 27% and 17% greater SDM than plants under the neutral density cover with a similar DLI, and a similar SDM as plants under the uncovered control, which received a 40% higher DLI on a per-plant basis (Figure 5A). When the fraction of B photons in the transmitted spectrum increased from 6% to 20%, ‘Rouxai’ SDM decreased by 17% but there was no trend effect with ‘Butter Crunch’. Crop yield considers the harvestable biomass per unit growing area (i.e., SFM per m2) and can be a more appropriate metric for agricultural production systems. Lettuce ‘Rouxai’ yield increased by 12–28% under the red-fluorescent film compared to the neutral density and photoselective treatments, whereas ‘Butter Crunch’ yield under the red-fluorescent film was similar to plants under the neutral density and photoselective treatments (Figure 5B).

3.2.2. Tomato Biomass Accumulation

The percentage of B photons and average DLI did not impact tomato SDM (Figure 5C). All covered treatments produced less FFM than the uncovered control (Figure 5D and Figure S2). Among the covered treatments, FFM decreased by 18% as the percentage of B photons increased from 6% to 20%.

3.2.3. Floriculture Crops Biomass Accumulation

Among the covered treatments, petunia SDM increased linearly as the percentage of B photons decreased, but the trend was not significant in snapdragon (Figure 5E). Snapdragon flower number at harvest increased linearly as the percentage of B photons in the spectrum increased (Figure 5F). Conversely, petunia had the most flowers under the 6% B light treatment and uncovered greenhouse control, and flower number decreased linearly as the percentage of B photons in the spectrum increased.

3.3. Light Response Curves, Quantum Yield, and Stomatal Conductance

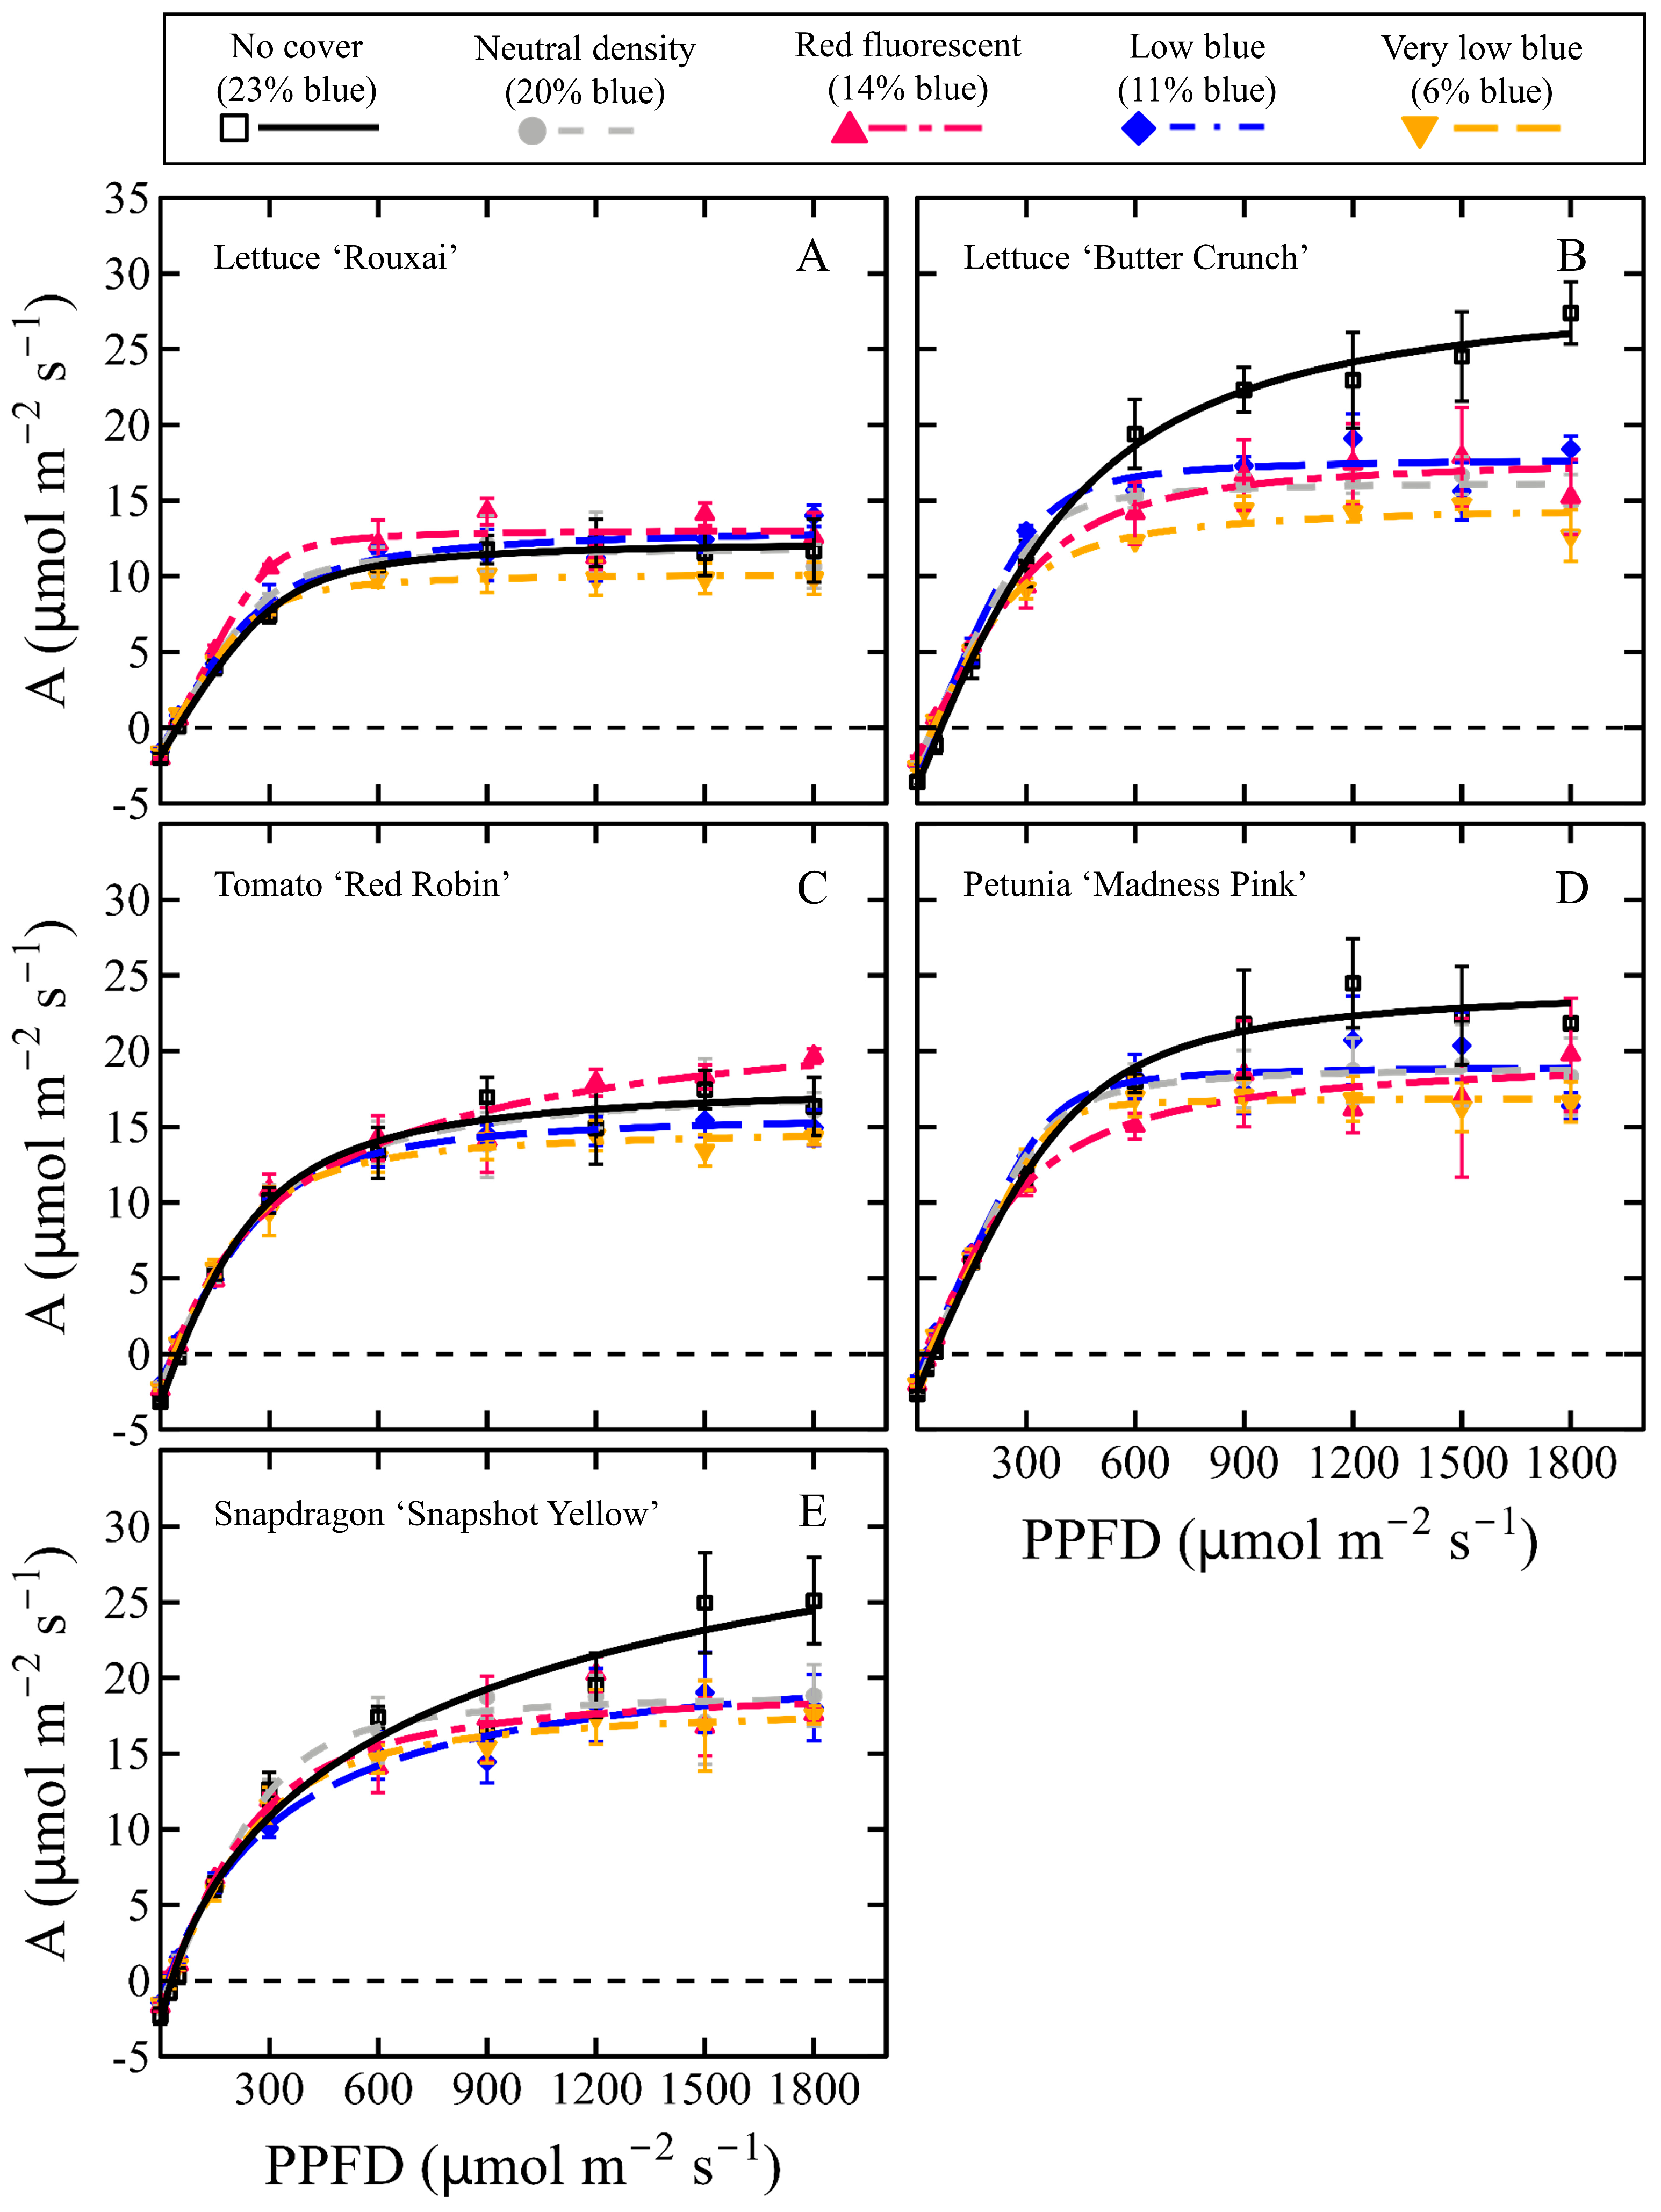
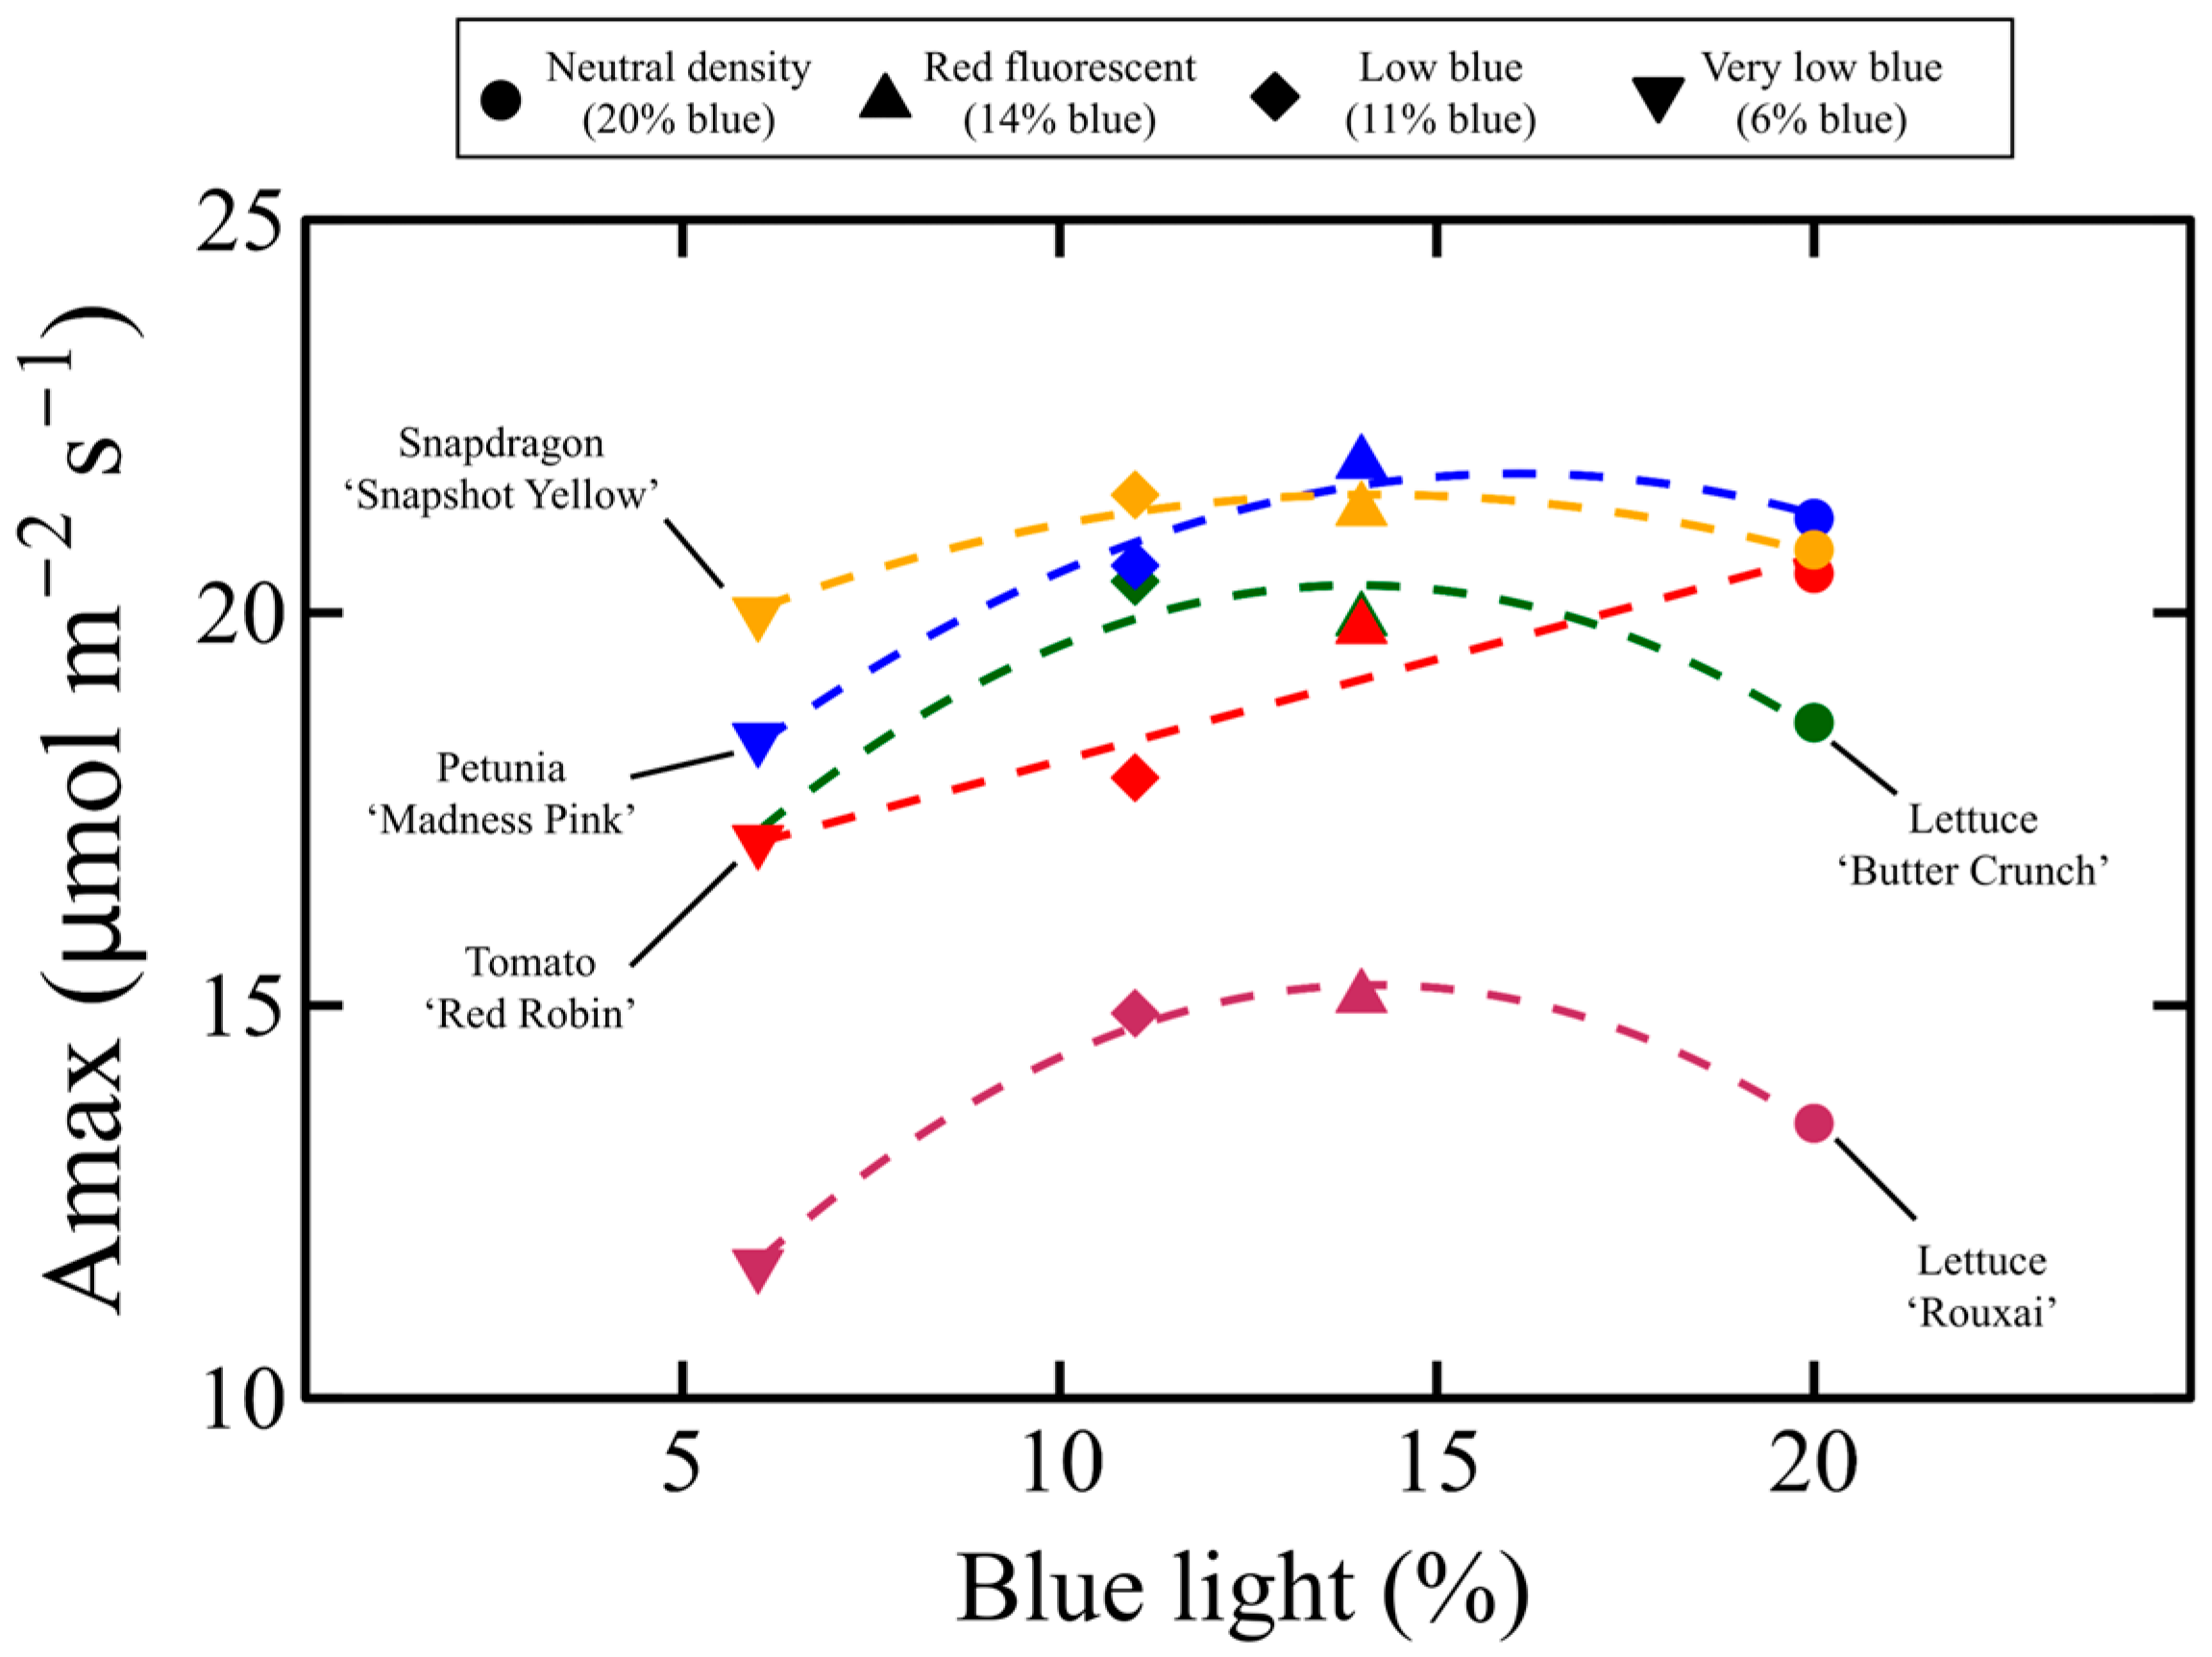
Figure 6 illustrates light response curves developed from sun-acclimated leaves of each crop and each lighting treatment. The average maximum rate of photosynthesis (Amax) of lettuce ‘Butter Crunch’, petunia, and snapdragon under the uncovered treatment was noticeably higher than that under the covered treatments (Figure 6B,D,E; Table S8). Conversely, the Amax of lettuce ‘Rouxai’ and tomato was similar to that of plants under the covered treatments (Figure 6A,C). Among the covered treatments, the relationship between Amax and the percentage of B photons in a treatment varied. Lettuce showed a quadratic trend, while tomato showed a linear trend, but Amax was generally lowest in the very low blue treatment (Figure 7; Table S13). Among species, Amax was lowest in plants grown under the very low blue treatment.
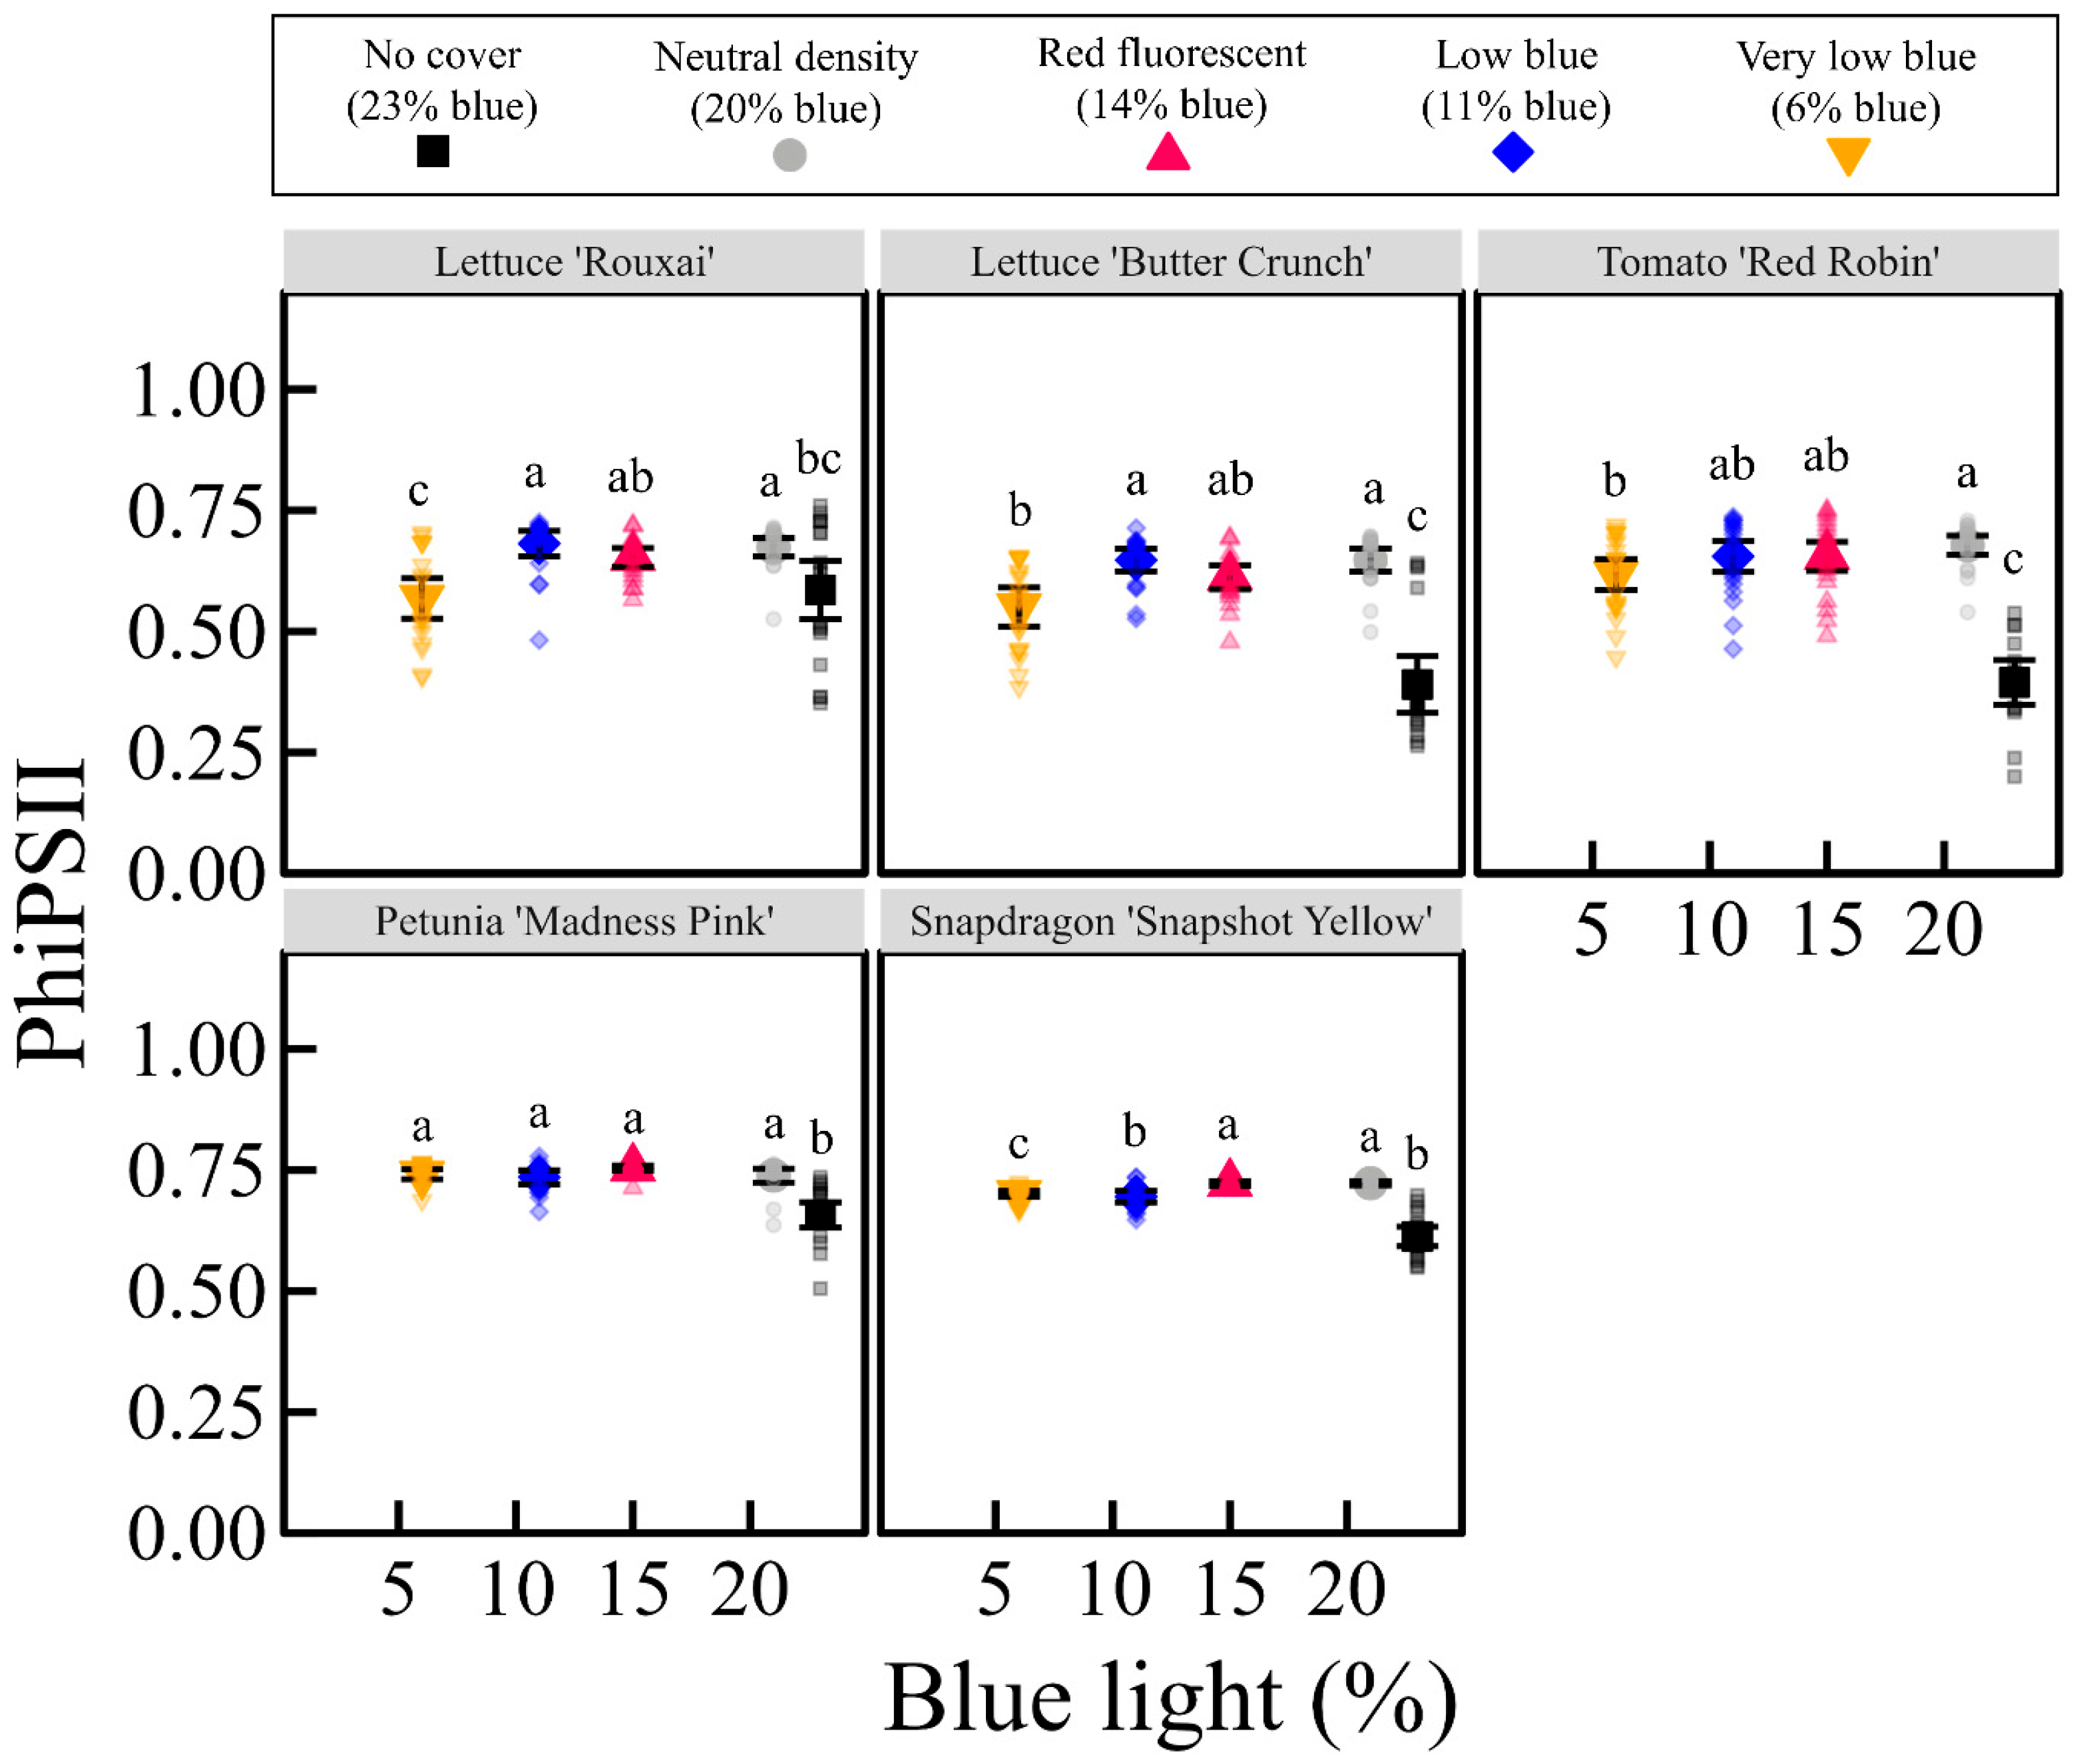
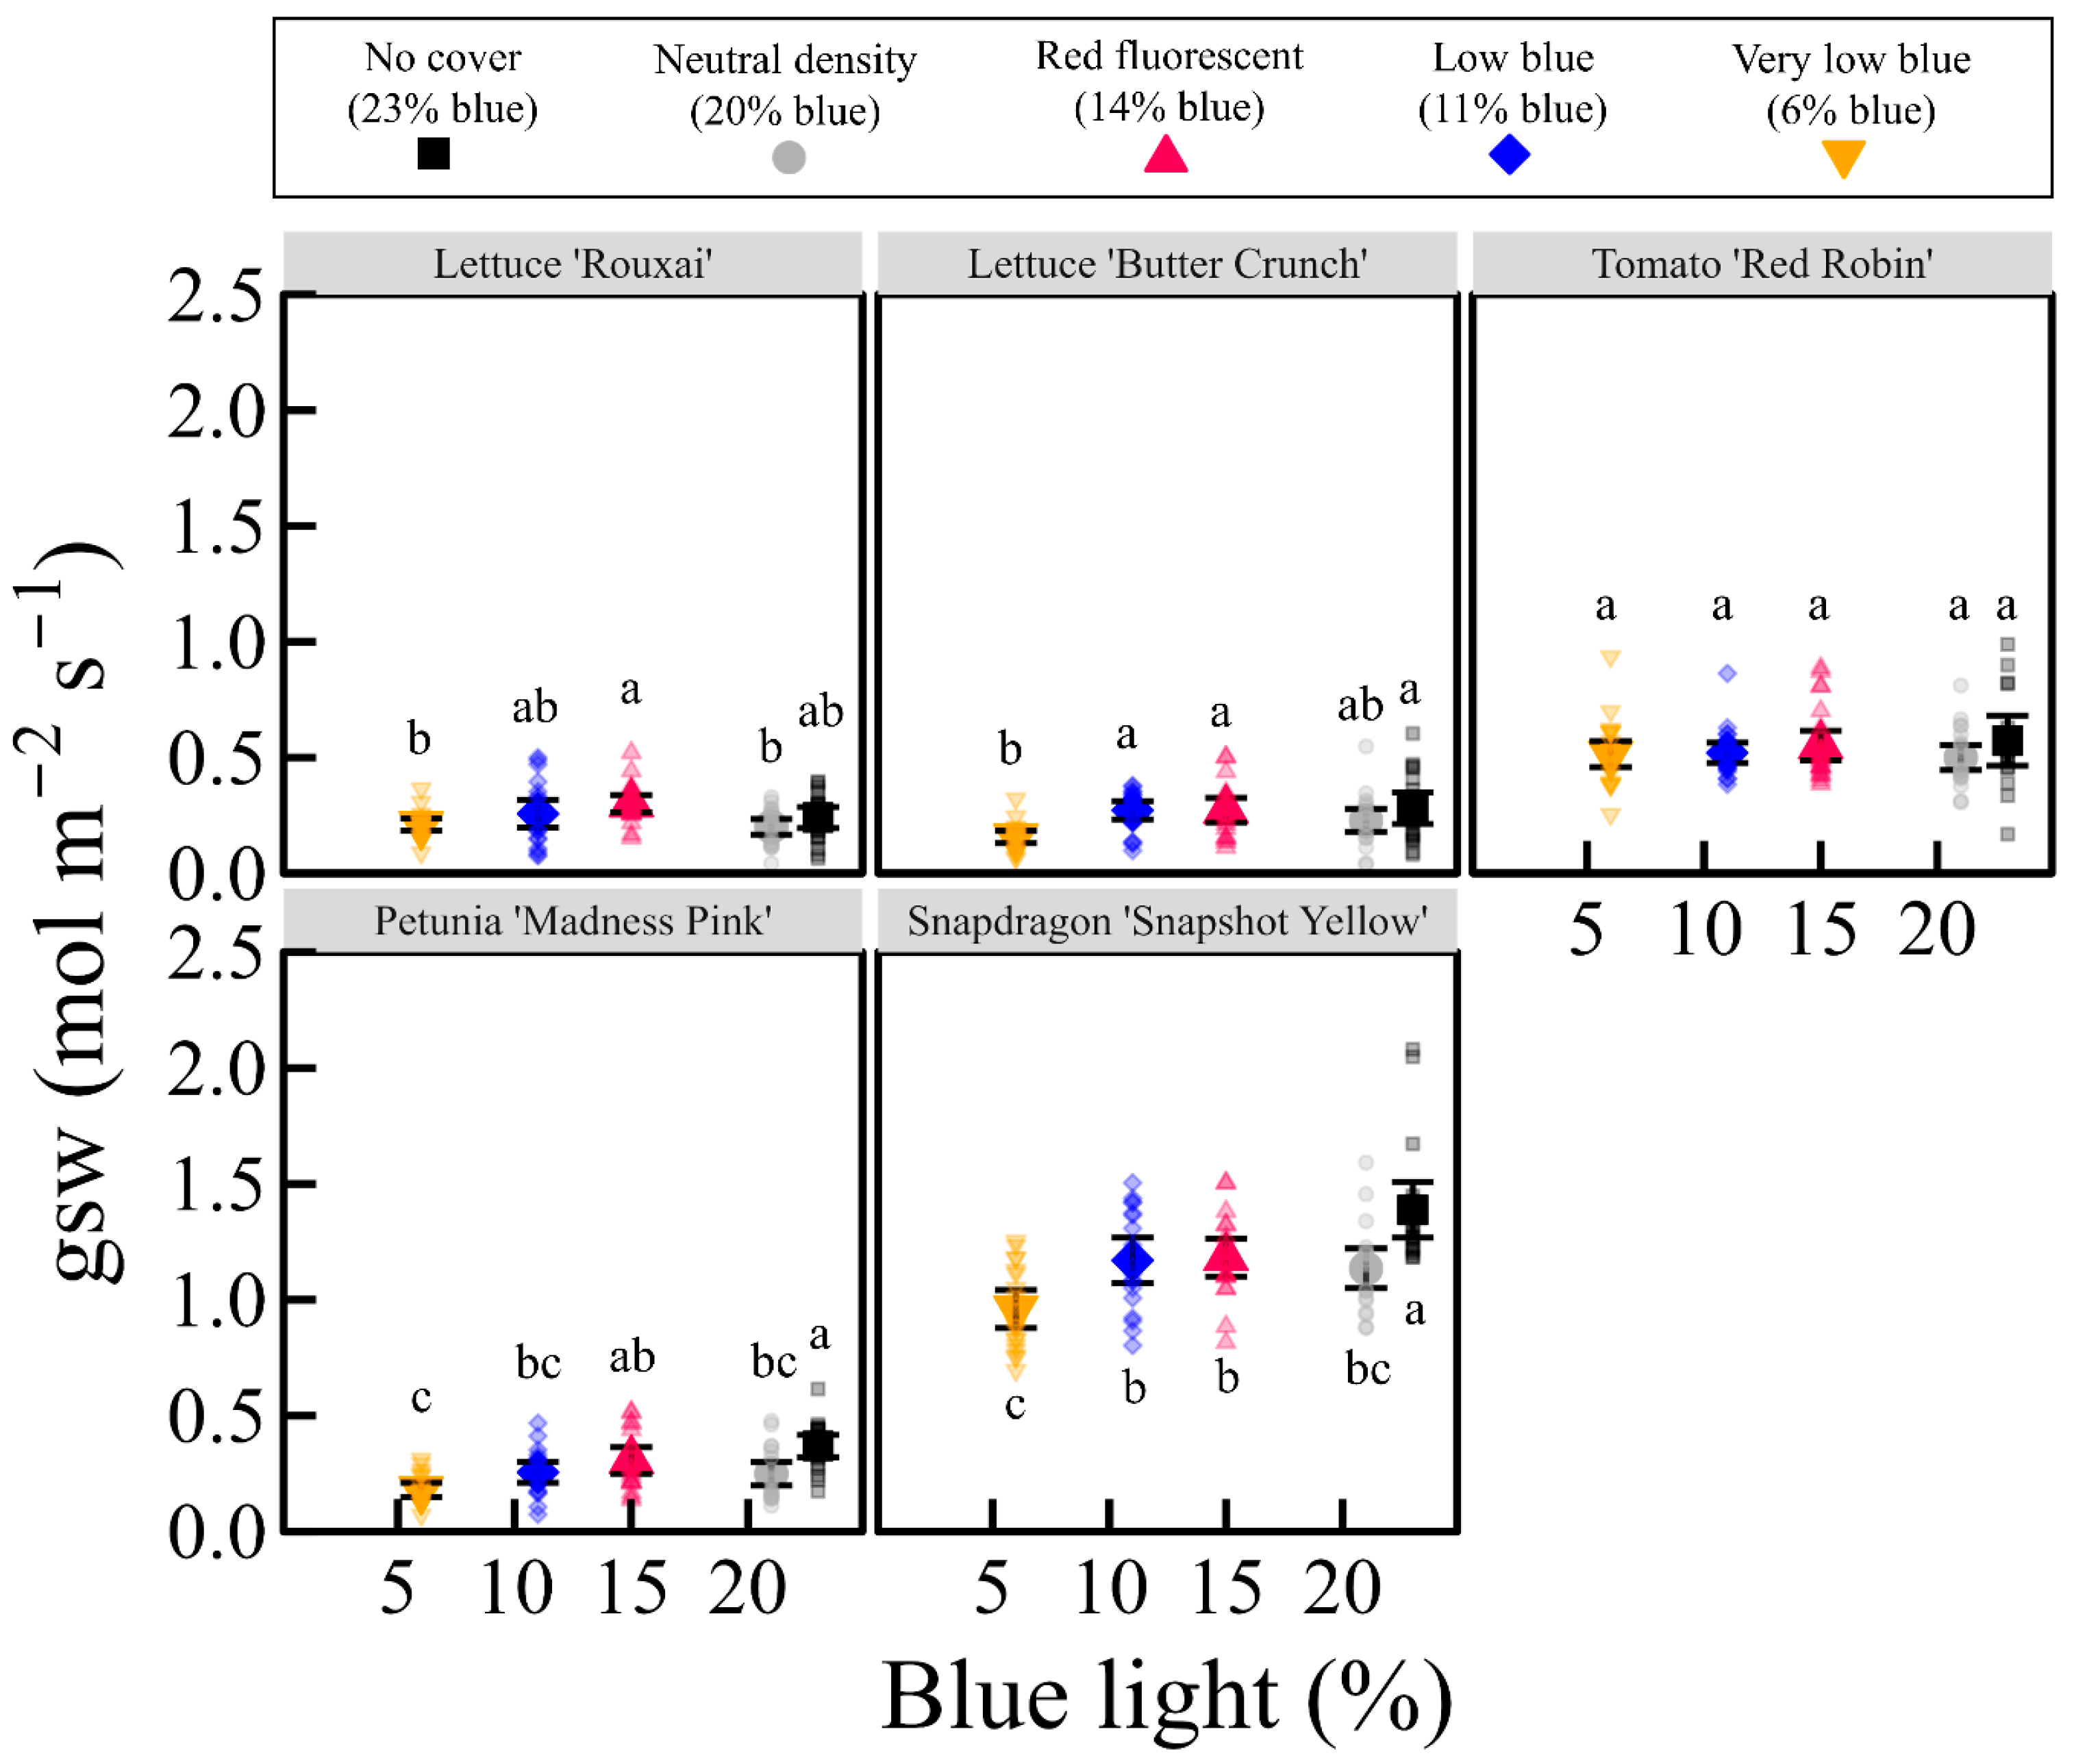
PhiPSII tended to be lower under the uncovered treatments compared to the covered ones regardless of species or cultivar (Figure 8; Table S14). Among the covered treatments, PhiPSII was similar in the neutral density and red-fluorescent treatments for all species. Compared to the neutral density shade treatment, PhiPSII was lowest in the very low blue treatment for lor both lettuce cultivars, tomato, and snapdragon. Lettuce and tomato gsw were similar regardless of treatment, but snapdragon and petunia gsw were greatest in the uncovered control and least in the very low blue treatment (Figure 9; Table S14).

4. Discussion

Although red-fluorescent plastics have increased the growth of various crops in some cases, their effects on crop morphology, photosynthetic light response, and biomass accumulation have varied within and between species. In recent years, there has been a growing effort to understand the mechanisms by which red-fluorescent materials enhance biomass accumulation in certain crops. To contribute to this research, we conducted a comparative study on the morphology, biomass accumulation, and photosynthetic light response of leafy green, fruiting, and floriculture greenhouse crops grown under an experimental red-fluorescent plastic, plastics with varying transmission percentages of B blue light (from 6% to 20%), and an uncovered greenhouse control with ~40% higher average PPFD.

4.1. Transmission PPFD Influenced Crop Morphology

Plants in low-light environments typically exhibit increased extension growth, such as greater leaf area or stem elongation, as a shade-avoidance or acclimation response to maximize light interception [37]. The magnitude of extension growth exists in a continuum, and is correlated to average DLI, albeit not always linearly [4]. Red-fluorescent materials always decrease the transmitted PPFD because the spectral conversion is not completely efficient. The magnitude by which PPFD decreases depends on the type of pigment used, pigment concentration, and whether light-extracting microstructures are incorporated [12,14,17,31,32,38]. In the literature, red-fluorescent materials have decreased the average transmission PPFD from <5% to 50%. In part, greater extension growth under a red-fluorescent film could be explained by the decrease in the average PPFD and independent of the modified photon spectrum. The effect of the decreased DLI on growth and development, independent of transmission spectrum, is often unknown because many studies did not include an uncovered control or a neutral density treatment that had the same transmission PPFD as the red-fluorescent plastic(s).
Regardless of the species tested, extension growth metrics such PCA, stem length, and individual leaf area increased in the neutral density covered treatment with a lower average DLI compared to the uncovered control (Figure 3 and Figure 4). Based on our findings, the treatment transmission PPFD, and consequently the average DLI, had a more substantial effect on plant morphology than the modified photon spectrum. This implies red-fluorescent plastics in agriculture may promote shoot extension growth (compared to an unpigmented plastic) because of the decrease in transmission PPFD. Increased extension growth may be undesirable in ornamental crop production, where compact shoot architecture is usually desired for potted plant production. These results also suggest that previous studies using red-fluorescent materials may, in some cases, have attributed morphological changes to transmission spectrum rather than the decrease in transmission PPFD. Future studies would benefit from attempting to decouple the effects of transmission PPFD and spectrum using more appropriate controls.

4.2. Decreasing the Percentage of B Light Slightly Increased Extension Growth in a Species-Specific Manner

While the effect of treatment DLI on morphology was substantial across species, the modified solar spectra also altered plant morphology in a species-specific manner (Figure 3 and Figure 4). Because red-fluorescent pigments absorbed B and G photons and fluoresced them mostly as R photons, this likely modified the absorption of phytochrome and cryptochrome photoreceptors. We postulated that extension growth would be correlated to the percentage of transmitted B light, presumably mediated by cryptochrome, rather than the more subtle changes to the R:FR and estimated PPE under the various covered treatments.
A decrease in the percentage of red light, an increase in the percentage of FR light, or both decrease the PPE and commonly increase plant extension growth [6,37,39]. Compared to the other covered treatments, the experimental red-fluorescent material slightly increased the estimated PPE from ~0.72 to 0.74. If this small change in phytochrome status solely mediated changes to crop morphology, the expected response would be slightly less extension growth under the red-fluorescent film. Consistent with expectation, petunia individual leaf area and PCA were attenuated under the red-fluorescent film relative to the other covered treatments (Figure 4E; Table S6). The morphology of lettuce, tomato, and snapdragon grown under the red-fluorescent film was similar to that under the neutral density cover and low blue treatment. This suggests petunia is especially sensitive to changes in the PPE, and red-fluorescent materials can, in some cases, elicit phytochrome-mediated growth responses.
Crop morphology is also mediated through cryptochromes that primarily absorb B and UV-A light. Since red-fluorescent materials commonly absorb B photons, this could independently diminish the inhibitory effect of B photons on extension growth (i.e., greater extension growth) [3,37]. Unlike the relatively small changes to PPE, the experimental red-fluorescent film transmitted 30% less B light than the neutral density cover with a similar PPFD. A photon spectrum with a low percentage of B light increased the extension growth of leafy greens and floriculture crops in previous studies, which is consistent with our results [3,40,41]. However, the extension growth of both lettuce cultivars and snapdragon grown under the red-fluorescent treatment (14% B) was statistically similar to the neutral density (20% B) and low blue treatments (11%), which suggests that cryptochrome responses were at or near saturation with 11% of B light. However, changes to plant morphology attributed to phytochrome or cryptochrome were less than those caused by the treatment transmission PPFD. Therefore, while fluorescent greenhouse plastics may alter the transmission spectrum, more attention needs to be given to transmission PPFD and its effect on crop growth.

4.3. Effects of DLI on Crop Yield

As a paradigm, a 1% decrease in the PAR received by a plant decreases biomass accumulation by 0.75–1% [42]. Based on this, all species were expected to have approximately 40% less SDM when grown under neutral density shade treatment compared to the uncovered control. However, the actual decrease in biomass for lettuce ‘Rouxai’ and ‘Butter Crunch’ was only 19% and 11% in the neutral density treatment (Figure 5A). Likewise, petunia and snapdragon had 15% and 16% less SDM under the neutral density shade compared to the unshaded control (Figure 5E). As expected, tomato FFM decreased by 36% as the DLI decreased from approximately 29 to 16 mol∙m−2∙d−1, which generally follows the 1% paradigm (Figure 5D). However, the relationship between biomass accumulation and average DLI is not entirely linear. As DLI increases, biomass accumulation can begin to plateau, where further increases in DLI increase the SDM at a decreasing rate. For lettuce and many floriculture crops, growth responses to the average DLI begin to become nonlinear at approximately 15 mol∙m−2∙d−1, while it may be 25 mol∙m−2∙d−1 for fruiting crops because they grow more vegetive mass and have fruits acting as sinks for excess photosynthates [43,44,45]. The average DLI under the covered treatments for lettuce, tomato, and floriculture crops were 12.4, 16.3, and 12.7 mol∙m−2∙d−1, respectively. While it was not feasible to adjust transmission percentages of the red-fluorescent film in the current study, these results highlight opportunities to optimize red-fluorescent films based on crop type and solar radiation levels.

4.4. Effects of Photon Spectrum on Biomass Accumulation

The transmission spectrum of the covered treatments influenced the biomass accumulation of some, but not all species. Generally, plants had the greatest SDM, FFM, and number of flowers in the red-fluorescent and very low blue treatments (Figure 5). Despite the lower transmission PPFD under the red-fluorescent film, biomass of both lettuce cultivars was similar to that of the unshaded control, which is consistent with other studies that used a similar experimental red-fluorescent film [14,17]. While the B-light filters increased biomass accumulation similar to the red-fluorescent film, it often came at the expense of greater extension growth and decreased leaf pigmentation, which is typically not desirable for horticultural production.

4.5. Maximum Rate of Photosynthesis Is Affectred by DLI in a Species-Specifc Manner

Generally, the incident PPFD on a leaf influences its photosynthetic capacity, wherein increasing the average DLI increases Amax and decreasing DLI has the opposite effect [46]. As expected, the Amax of green-leaf lettuce ‘Butter Crunch’, petunia, and snapdragon were greatest under the uncovered treatment with a higher average DLI. However, the Amax of red-leaf lettuce ‘Rouxai’ and tomato under the uncovered treatment were similar to the Amax in the neutral density treatments despite the average DLI being approximately 9 and 12 mol∙m−2∙d−1 greater, respectively (Figure 6A,C). Some plant species upregulate the biosynthesis of anthocyanins that mitigate photoinhibition caused by an excessive flux of high-energy photons, particularly in the UV and B wavebands, and attenuate Amax [47,48,49]. In accordance, greater anthocyanin accumulation gives leaves a more reddish appearance, and on average, lettuce ‘Rouxai’ and tomato leaves under the uncovered treatment were 180% and 13% redder than leaves under the uncovered treatments (Figure 3; Tables S3 and S5). In part, this suggests that the upregulation of anthocyanins caused by a high PPFD attenuated the Amax of red-leaf lettuce and tomato. However, regardless of the Amax variance within and between species, differences in Amax did not correlate with differences in SDM of both lettuce and floriculture crops, nor the FFM of tomato. We cannot explain this discrepancy.
Differences in Amax occurred in several species grown under red-fluorescent materials in other studies, but it is unclear whether this resulted from differences in transmission PPFD or transmission spectrum. For instance, lettuce and tomato Amax were significantly lower when grown under a red-fluorescent material that decreased the PPFD by ~30 to 50%, but the Amax was similar for lettuce or slightly increased for cabbage and sweet pepper when the PPFD under the red-fluorescent material decreased by <5% [12,31,32,38]. While Kang et al. [12] observed differences between Amax and the electron transport rate of PSI and PSII of cabbage under a red-fluorescent material, this did not happen in the current study and may be species-specific. Accordingly, Amax differences among studies seem to correlate more with PPFD differences between red-fluorescent and neutral density materials than an altered photon spectrum. Thus, it is still unclear how increasing the flux of R photons at the expense of B and G photons affects Amax because red-fluorescent materials always decreased the PPFD. Whether Amax increased or decreased as a result of PPFD did not necessarily correlate with biomass accumulation in our study or others, suggesting that changes in plant morphology influence light interception and consequently biomass accumulation.

4.6. Maximux Rate of Photosynthesis Is Affected by the Transmission of B Light

Comparing the photosynthetic light response of crops among studies can be challenging because red-fluorescent materials decrease the PPFD, which independently influences Amax. In other studies, decreasing the percentage of B photons from approximately 20% to 5–8% decreased the Amax of cucumber, lettuce, and rose (Rosa × hybrida) by 26%, 30%, and 19%, respectively [20,50,51]. Similar to other studies, at a constant PPFD, decreasing the percentage of B photons from 20% to 6% lowered the Amax by 4–17% depending on the species and cultivar. It has been postulated that decreasing the percentage of B photons limits Amax in part by decreasing gsw [9,20,52]. In this study, gsw and Amax were typically lowest in the very low blue treatment (6% B) and greatest in the red-fluorescent treatment relative to the neutral density covered treatment (Figure 7 and Figure 9). In a different study, tomato and cucumber seedlings responded similarly, where gsw decreased as the percentage of B decreased [53]. While gsw may limit Amax, this did not fully explain why there was typically greater biomass accumulation in the very low blue treatment compared to the neutral density shade (20% B). Despite lower Amax, gsw, and PhiPSII values under the lowest blue treatment, plants produced similar or more biomass compared to the neutral density shade.
Single-leaf photosynthetic measurements do not necessarily equate to changes in biomass accumulation. Red-fluorescent materials can impart changes to plant architecture, such as increased leaf area, SLA, PCA, or stem elongation, that could interactively influence whole-plant photosynthesis [54]. Thus far, studies evaluating red-fluorescent materials have not identified predictable effects of red-fluorescent materials on photosynthesis. Additional studies utilizing whole-plant gas exchange systems are merited to better quantify how altered plant architecture caused by red-fluorescent materials interacts with single-leaf photosynthesis.

5. Conclusions

An experimental red-fluorescent plastic film can have varying effects on morphology, photosynthetic light response, and biomass accumulation of various greenhouse crops. Our findings indicate that (1) red-fluorescent film did not increase extension growth more than a neutral density cover with a similar DLI, but did increase extension growth (e.g., increased stem length, leaf area, and/or PCA) compared to plants grown in an uncovered treatment; and (2) the manner in which a red-fluorescent film influenced Amax was species- and cultivar-specific, but differences in Amax did not always reflect differences in biomass accumulation. The current work does not fully explain the mechanism in which a red-fluorescent film can increase the yield of some crops and not others, but does highlight the complex interactions between the transmission spectrum, plant morphology, photosynthetic light response, and biomass accumulation. Further research is needed to understand how modifications to the solar spectrum influence gsw, electron transport, and whole-plant photosynthesis. In addition, generating fluorescent pigment dose-response curves for different crops could aid in determining the economic feasibility of adopting this technology.

Supplementary Materials

The following supporting information can be downloaded at: https://www.mdpi.com/article/10.3390/horticulturae11080980/s1, Figure S1: Chamber schematic; Figure S2: Representative tomato plants and fruits grown under various covers with different spectral characteristics or no cover. The spectral characteristics of each treatment are displayed in Figure 1B and Supplementary Table S1; Table S1: Light transmission parameters under each treatment; Table S2: The average air temperature and daily light integral under each treatment; Table S3: Lettuce ‘Rouxai’ growth response; Table S4: Lettuce ‘Butter Crunch’ growth response; Table S5: Tomato ‘Red Robin’ growth response; Table S6: Petunia ‘Madness Pink’ growth response; Table S7: Snapdragon ‘Snapshot Yellow’ growth response; Table S8: Regression equations for lettuce ‘Rouxai’; Table S9: Regression equations for lettuce ‘Butter Crunch’; Table S10: Regression equations for tomato ‘Red Robin’; Table S11: Regression equations for petunia ‘Madness Pink’; Table S12: Regression equations for snapdragon ‘Snapshot Yellow’; Table S13: Light response curve coefficients; Table S14: The average PhiPSII and gsw for each crop.

Author Contributions

Conceptualization, E.J.S. and E.S.R.; Methodology, E.J.S. and E.S.R.; Software, E.J.S. and E.S.R.; Validation, E.J.S. and E.S.R.; Formal Analysis, E.J.S. and E.S.R.; Investigation, E.J.S. and E.S.R.; Resources, E.S.R.; Data Curation, E.J.S.; Writing—Original Draft Preparation, E.J.S.; Writing—Review and Editing, E.J.S. and E.S.R.; Visualization, E.J.S. and E.S.R.; Supervision, E.S.R.; Project Administration, E.S.R.; Funding Acquisition, E.S.R. All authors have read and agreed to the published version of the manuscript.

Funding

This work was funded by the United States Department of Agriculture’s National Institute of Food and Agriculture under the project title: ‘Advanced energy efficient greenhouse systems employing spectral splitting and solar water purification’ (No. 2018-67003-27407) and Hatch project 192266.

Data Availability Statement

The raw data supporting the conclusions of this article will be made available by the authors on request.

Acknowledgments

We thank our colleagues at the University of Colorado Boulder Xiaobo Yin, Ronggui Yang, and Lihua Shen for the development and construction of the experimental film. Additionally, we thank Nathan DuRussel, Annika Kohler, and Matt Vettraino for technical assistance and data collection.

Conflicts of Interest

The authors declare no conflicts of interest.

Abbreviations

The following abbreviations are used in this manuscript:
UVUltraviolet; 280–399 nm
BBlue; 400–499 nm
GGreen; 500–599 nm
RRed; 600–699 nm
FRFR; 700–750 nm
PPFDPhotosynthetic photon flux density; 400–700 nm
ChlChlorophyll
PPEPhytochrome photoequilibrium
SFMShoot fresh mass
SDMShoot dry mass
FFMFruit fresh mass
PCAProjected canopy area
ECElectrical conductivity
DLIDaily light integral
PARPhotosynthetically active radiation
LEDLight-emitting diode
SLASpecific leaf area
RUERadiation use efficiency
PhiPSIIQuantum yield of photosystem II
AmaxMaximum rate of photosynthesis
gswStomatal conductance

References

  1. Wittwer, S.H.; Castilla, N. Protected Cultivation of Horticultural Crops Worldwide. HortTechnology 1995, 5, 6–23. [Google Scholar] [CrossRef]
  2. Cuesta Roble Releases 2019 Global Greenhouse Statistics. Produce Grower, 10 January 2020. Available online: https://www.producegrower.com/news/cuesta-roble-2019-global-greenhouse-statistics/ (accessed on 1 May 2025).
  3. Meng, Q.; Boldt, J.; Runkle, E.S. Blue Radiation Interacts with Green Radiation to Influence Growth and Predominantly Controls Quality Attributes of Lettuce. J. Amer. Soc. Hortic. Sci. 2020, 145, 75–87. [Google Scholar] [CrossRef]
  4. Stallknecht, E.J.; Herrera, C.K.; Yang, C.; King, I.; Sharkey, T.D.; Lunt, R.R.; Runkle, E.S. Designing Plant–Transparent Agrivoltaics. Sci. Rep. 2023, 13, 1903. [Google Scholar] [CrossRef]
  5. Ouzounis, T.; Rosenqvist, E.; Ottosen, C.-O. Spectral Effects of Artificial Light on Plant Physiology and Secondary Metabolism: A Review. HortScience 2015, 50, 1128–1135. [Google Scholar] [CrossRef]
  6. Park, Y.; Runkle, E.S. Far-Red Radiation Promotes Growth of Seedlings by Increasing Leaf Expansion and Whole-Plant Net Assimilation. Environ. Exp. Bot. 2017, 136, 41–49. [Google Scholar] [CrossRef]
  7. Kelly, N.; Runkle, E.S. Ultraviolet A and Blue Light Transiently Regulate Total Phenolic and Anthocyanin Concentrations in Indoor-Grown Red-Leaf Lettuce. HortScience 2023, 58, 1595–1602. [Google Scholar] [CrossRef]
  8. Wang, Y.; Folta, K.M. Contributions of Green Light to Plant Growth and Development. Am. J. Bot. 2013, 100, 70–78. [Google Scholar] [CrossRef]
  9. Hernández, R.; Kubota, C. Physiological Responses of Cucumber Seedlings under Different Blue and Red Photon Flux Ratios Using LEDs. Environ. Exp. Bot. 2016, 121, 66–74. [Google Scholar] [CrossRef]
  10. Kochetova, G.V.; Avercheva, O.V.; Bassarskaya, E.M.; Kushunina, M.A.; Zhigalova, T.V. Effects of Red and Blue LED Light on the Growth and Photosynthesis of Barley (Hordeum Vulgare L.) Seedlings. J. Plant Growth Regul. 2023, 42, 1804–1820. [Google Scholar] [CrossRef]
  11. Zhen, S.; Bugbee, B. Far-red Photons Have Equivalent Efficiency to Traditional Photosynthetic Photons: Implications for Redefining Photosynthetically Active Radiation. Plant Cell Environ. 2020, 43, 1259–1272. [Google Scholar] [CrossRef]
  12. Kang, J.H.; Kim, D.; Yoon, H.I.; Son, J.E. Growth, Morphology, and Photosynthetic Activity of Chinese Cabbage and Lettuce Grown under Polyethylene and Spectrum Conversion Films. Hortic. Environ. Biotechnol. 2023, 64, 593–603. [Google Scholar] [CrossRef]
  13. Parrish, C.H.; Hebert, D.; Jackson, A.; Ramasamy, K.; McDaniel, H.; Giacomelli, G.A.; Bergren, M.R. Optimizing Spectral Quality with Quantum Dots to Enhance Crop Yield in Controlled Environments. Commun. Biol. 2021. [Google Scholar] [CrossRef] [PubMed]
  14. Shen, L.; Lou, R.; Park, Y.; Guo, Y.; Stallknecht, E.J.; Xiao, Y.; Rieder, D.; Yang, R.; Runkle, E.S.; Yin, X. Increasing Greenhouse Production by Spectral-Shifting and Unidirectional Light-Extracting Photonics. Nat. Food 2021, 2, 434–441. [Google Scholar] [CrossRef]
  15. Shoji, S.; Saito, H.; Jitsuyama, Y.; Tomita, K.; Haoyang, Q.; Sakurai, Y.; Okazaki, Y.; Aikawa, K.; Konishi, Y.; Sasaki, K.; et al. Plant Growth Acceleration Using a Transparent Eu3+-Painted UV-to-Red Conversion Film. Sci. Rep. 2022, 12, 17155. [Google Scholar] [CrossRef]
  16. Novoplansky, A.; Sachs, T.; Cohen, D.; Bar, R.; Bodenheimer, J.; Reisfeld, R. Increasing Plant Productivity by Changing the Solar Spectrum. Sol. Energy Mater. 1990, 21, 17–23. [Google Scholar] [CrossRef]
  17. Stallknecht, E.J.; Runkle, E.S. An Experimental Red Fluorescent Film Has Cultivar-Specific Effects on Lettuce Yield and Morphology. HortScience 2025, 60, 1132–1141. [Google Scholar] [CrossRef]
  18. McCree, K.J. The Action Spectrum, Absorptance and Quantum Yield of Photosynthesis in Crop Plants. Ag. Meteorol. 1971, 9, 191–216. [Google Scholar] [CrossRef]
  19. Inada, K. Action Spectra for Photosynthesis in Higher Plants. Plant Cell Physiol. 1976, 17, 355–365. [Google Scholar] [CrossRef]
  20. Hogewoning, S.W.; Trouwborst, G.; Maljaars, H.; Poorter, H.; Van Ieperen, W.; Harbinson, J. Blue Light Dose-Responses of Leaf Photosynthesis, Morphology, and Chemical Composition of Cucumis Sativus Grown under Different Combinations of Red and Blue Light. J. Exp. Bot. 2010, 61, 3107–3117. [Google Scholar] [CrossRef]
  21. Fageria, N.K.; Baligar, V.C.; Clark, R. Plant Canopy Architecture. In Physiology of Crop Production; CRC Press: Boca Raton, FL, USA, 2006; pp. 11–32. [Google Scholar] [CrossRef]
  22. Snowden, M.C.; Cope, K.R.; Bugbee, B. Sensitivity of Seven Diverse Species to Blue and Green Light: Interactions with Photon Flux. PLoS ONE 2016, 11, e0163121. [Google Scholar] [CrossRef]
  23. Minich, A.; Minich, I.; Shaitarova, O.; Permyakova, N.; Zelenchukova, N.; Ivanitskiy, A.; Filatov, D.; Ivlev, G. Vital Activity of Lactuca sativa and Soil Microorganisms under Fluorescent Films. Tomsk State Pedagog. Univ. Bull. 2011, 8, 74–84. [Google Scholar]
  24. Nishimura, Y.; Wada, E.; Fukumoto, Y.; Aruga, H.; Shimoi, Y. The effect of spectrum conversion covering film on cucumber in soilless culture. Acta Hortic. 2012, 956, 481–487. [Google Scholar] [CrossRef]
  25. González, A.; Rodríguez, R.; Bañón, S.; Franco, J.A.; Fernández, J.A.; Salmerón, A.; Espí, E. Strawberry and cucumber cultivation under fluorescent photoselective plastic films cover. Acta Hortic. 2003, 614, 407–413. [Google Scholar] [CrossRef]
  26. Hemming, S.; Os, E.A.V.; Hemming, J.; Dieleman, J.A. The Effect of New Developed Fluorescent Greenhouse Films on the Growth of Fragaria × Ananassa “Elsanta”. Acta Hortic. 2006, 71, 145–154. [Google Scholar] [CrossRef]
  27. Hidaka, K.; Yoshida, K.; Shimasaki, K.; Murakami, K.; Yasutake, D.; Kitano, M. Spectrum Conversion Film for Regulation of Plant Growth. J. Fac. Agric. Kyushu Univ. 2008, 53, 549–552. [Google Scholar] [CrossRef]
  28. Franklin, K.A. Shade Avoidance. New Phytol. 2008, 179, 930–944. [Google Scholar] [CrossRef] [PubMed]
  29. Duanmu, D.; Bachy, C.; Sudek, S.; Wong, C.-H.; Jiménez, V.; Rockwell, N.C.; Martin, S.S.; Ngan, C.Y.; Reistetter, E.N.; Van Baren, M.J.; et al. Marine Algae and Land Plants Share Conserved Phytochrome Signaling Systems. Proc. Natl. Acad. Sci. USA 2014, 111, 15827–15832. [Google Scholar] [CrossRef]
  30. Lin, C.; Shalitin, D. Cryptochrome Structure and Signal Transduction. Annu. Rev. Plant Biol. 2003, 54, 469–496. [Google Scholar] [CrossRef]
  31. Loik, M.E.; Carter, S.A.; Alers, G.; Wade, C.E.; Shugar, D.; Corrado, C.; Jokerst, D.; Kitayama, C. Wavelength-Selective Solar Photovoltaic Systems: Powering Greenhouses for Plant Growth at the Food-Energy-Water Nexus. Earth’s Future 2017, 5, 1044–1053. [Google Scholar] [CrossRef]
  32. Yoon, H.I.; Kang, J.H.; Kang, W.H.; Son, J.E. Subtle Changes in Solar Radiation under a Green-to-Red Conversion Film Affect the Photosynthetic Performance and Chlorophyll Fluorescence of Sweet Pepper. Photosynthetica 2020, 58, 1107–1115. [Google Scholar] [CrossRef]
  33. Schneider, C.A.; Rasband, W.S.; Eliceiri, K.W. NIH Image to ImageJ: 25 Years of Image Analysis. Nat. Methods 2012, 9, 671–675. [Google Scholar] [CrossRef]
  34. Skolik, P.; Morais, C.L.M.; Martin, F.L.; McAinsh, M.R. Determination of Developmental and Ripening Stages of Whole Tomato Fruit Using Portable Infrared Spectroscopy and Chemometrics. BMC Plant Biol. 2019, 19, 236. [Google Scholar] [CrossRef]
  35. R: A Language for Statistical Computing. 2025. Available online: https://cran.r-project.org/bin/windows/base/old/4.4.3/ (accessed on 1 July 2025).
  36. Marshall, B.; Biscoe, P.V. A Model for C3 Leaves Describing the Dependence of Net Photosynthesis on Irradiance. J. Exp. Bot. 1980, 31, 29–39. [Google Scholar] [CrossRef]
  37. Casal, J.J. Shade Avoidance. Arab. Book 2012, 10, e0157. [Google Scholar] [CrossRef]
  38. Tokarz, K.M.; Makowski, W.; Tokarz, B.; Muszyńska, E.; Gajewski, Z.; Mazur, S.; Kunicki, E.; Jeremiasz, O.; Sobik, P.; Nowak, P.; et al. Performance of the Photosynthetic Apparatus under Glass with a Luminophore Modifying Red-To-Far-Red-Light Ratio—A Case Study. Cells 2023, 12, 1552. [Google Scholar] [CrossRef] [PubMed]
  39. Park, Y.; Runkle, E.S. Blue Radiation Attenuates the Effects of the Red to Far-Red Ratio on Extension Growth but Not on Flowering. Environ. Exp. Bot. 2019, 168, 103871. [Google Scholar] [CrossRef]
  40. Craver, J.K.; Nemali, K.S.; Lopez, R.G. Acclimation of Growth and Photosynthesis in Petunia Seedlings Exposed to High-Intensity Blue Radiation. J. Am. Soc. Hortic. Sci. 2020, 145, 152–161. [Google Scholar] [CrossRef]
  41. Runkle, E.S.; Heins, R.D. Specific Functions of Red, Far Red, and Blue Light in Flowering and Stem Extension of Long-Day Plants. J. Am. Soc. Hortic. Sci. 2001, 126, 275–282. [Google Scholar] [CrossRef]
  42. Marcelis, L.F.M.; Broekhuijsen, A.G.M.; Meinen, E.; Nijs, E.M.F.M.; Raaphorst, M.G.M. Quantification of the growth response to light quantity of greenhouse grown crops. Acta Hortic. 2006, 711, 97–104. [Google Scholar] [CrossRef]
  43. Dorais, M. The Use of Supplemental Lighting for Vegetable Crop Production: Light Intensity, Crop Response, Nutrition, Crop Management, Cultural Practices. In Proceedings of the Canadian Greenhouse Conference, Niagara Falls, ON, Canada, 9 October 2003; Volume 9, pp. 115–133. [Google Scholar]
  44. Faust, J.E.; Logan, J. Daily Light Integral: A Research Review and High-Resolution Maps of the United States. HortScience 2018, 53, 1250–1257. [Google Scholar] [CrossRef]
  45. Albright, L.D.; Both, A.J.; Chiu, A.J. Controlling greenhouse light to a consistent daily integral. Trans. ASAE 2000, 43, 421–431. [Google Scholar] [CrossRef]
  46. Masabni, J.; Sun, Y.; Niu, G.; Del Valle, P. Shade Effect on Growth and Productivity of Tomato and Chili Pepper. HortTechnology 2016, 26, 344–350. [Google Scholar] [CrossRef]
  47. Gould, K.S. Nature′s Swiss Army Knife: The Diverse Protective Roles of Anthocyanins in Leaves. BioMed Res. Int. 2004, 2004, 314–320. [Google Scholar] [CrossRef]
  48. Liakopoulos, G.; Nikolopoulos, D.; Klouvatou, A.; Vekkos, K.-A.; Manetas, Y.; Karabourniotis, G. The Photoprotective Role of Epidermal Anthocyanins and Surface Pubescence in Young Leaves of Grapevine (Vitis Vinifera). Ann. Bot. 2006, 98, 257–265. [Google Scholar] [CrossRef]
  49. Tsormpatsidis, E.; Henbest, R.G.C.; Battey, N.H.; Hadley, P. The Influence of Ultraviolet Radiation on Growth, Photosynthesis and Phenolic Levels of Green and Red Lettuce: Potential for Exploiting Effects of Ultraviolet Radiation in a Production System. Ann. App. Biol. 2010, 156, 357–366. [Google Scholar] [CrossRef]
  50. Terfa, M.T.; Solhaug, K.A.; Gislerød, H.R.; Olsen, J.E.; Torre, S. A High Proportion of Blue Light Increases the Photosynthesis Capacity and Leaf Formation Rate of Rosa × Hybrida but Does Not Affect Time to Flower Opening. Physiol. Plant. 2013, 148, 146–159. [Google Scholar] [CrossRef] [PubMed]
  51. Wang, J.; Lu, W.; Tong, Y.; Yang, Q. Leaf Morphology, Photosynthetic Performance, Chlorophyll Fluorescence, Stomatal Development of Lettuce (Lactuca sativa L.) Exposed to Different Ratios of Red Light to Blue Light. Front. Plant Sci. 2016, 7, 250. [Google Scholar] [CrossRef] [PubMed]
  52. Matthews, J.S.A.; Vialet-Chabrand, S.; Lawson, T. Role of Blue and Red Light in Stomatal Dynamic Behaviour. J. Exp. Bot. 2020, 71, 2253–2269. [Google Scholar] [CrossRef]
  53. Liang, Y.; Kang, C.; Kaiser, E.; Kuang, Y.; Yang, Q.; Li, T. Red/Blue Light Ratios Induce Morphology and Physiology Alterations Differently in Cucumber and Tomato. Sci. Hortic. 2021, 281, 109995. [Google Scholar] [CrossRef]
  54. Sarlikioti, V.; De Visser, P.H.B.; Buck-Sorlin, G.H.; Marcelis, L.F.M. How Plant Architecture Affects Light Absorption and Photosynthesis in Tomato: Towards an Ideotype for Plant Architecture Using a Functional–Structural Plant Model. Ann. Bot. 2011, 108, 1065–1073. [Google Scholar] [CrossRef]
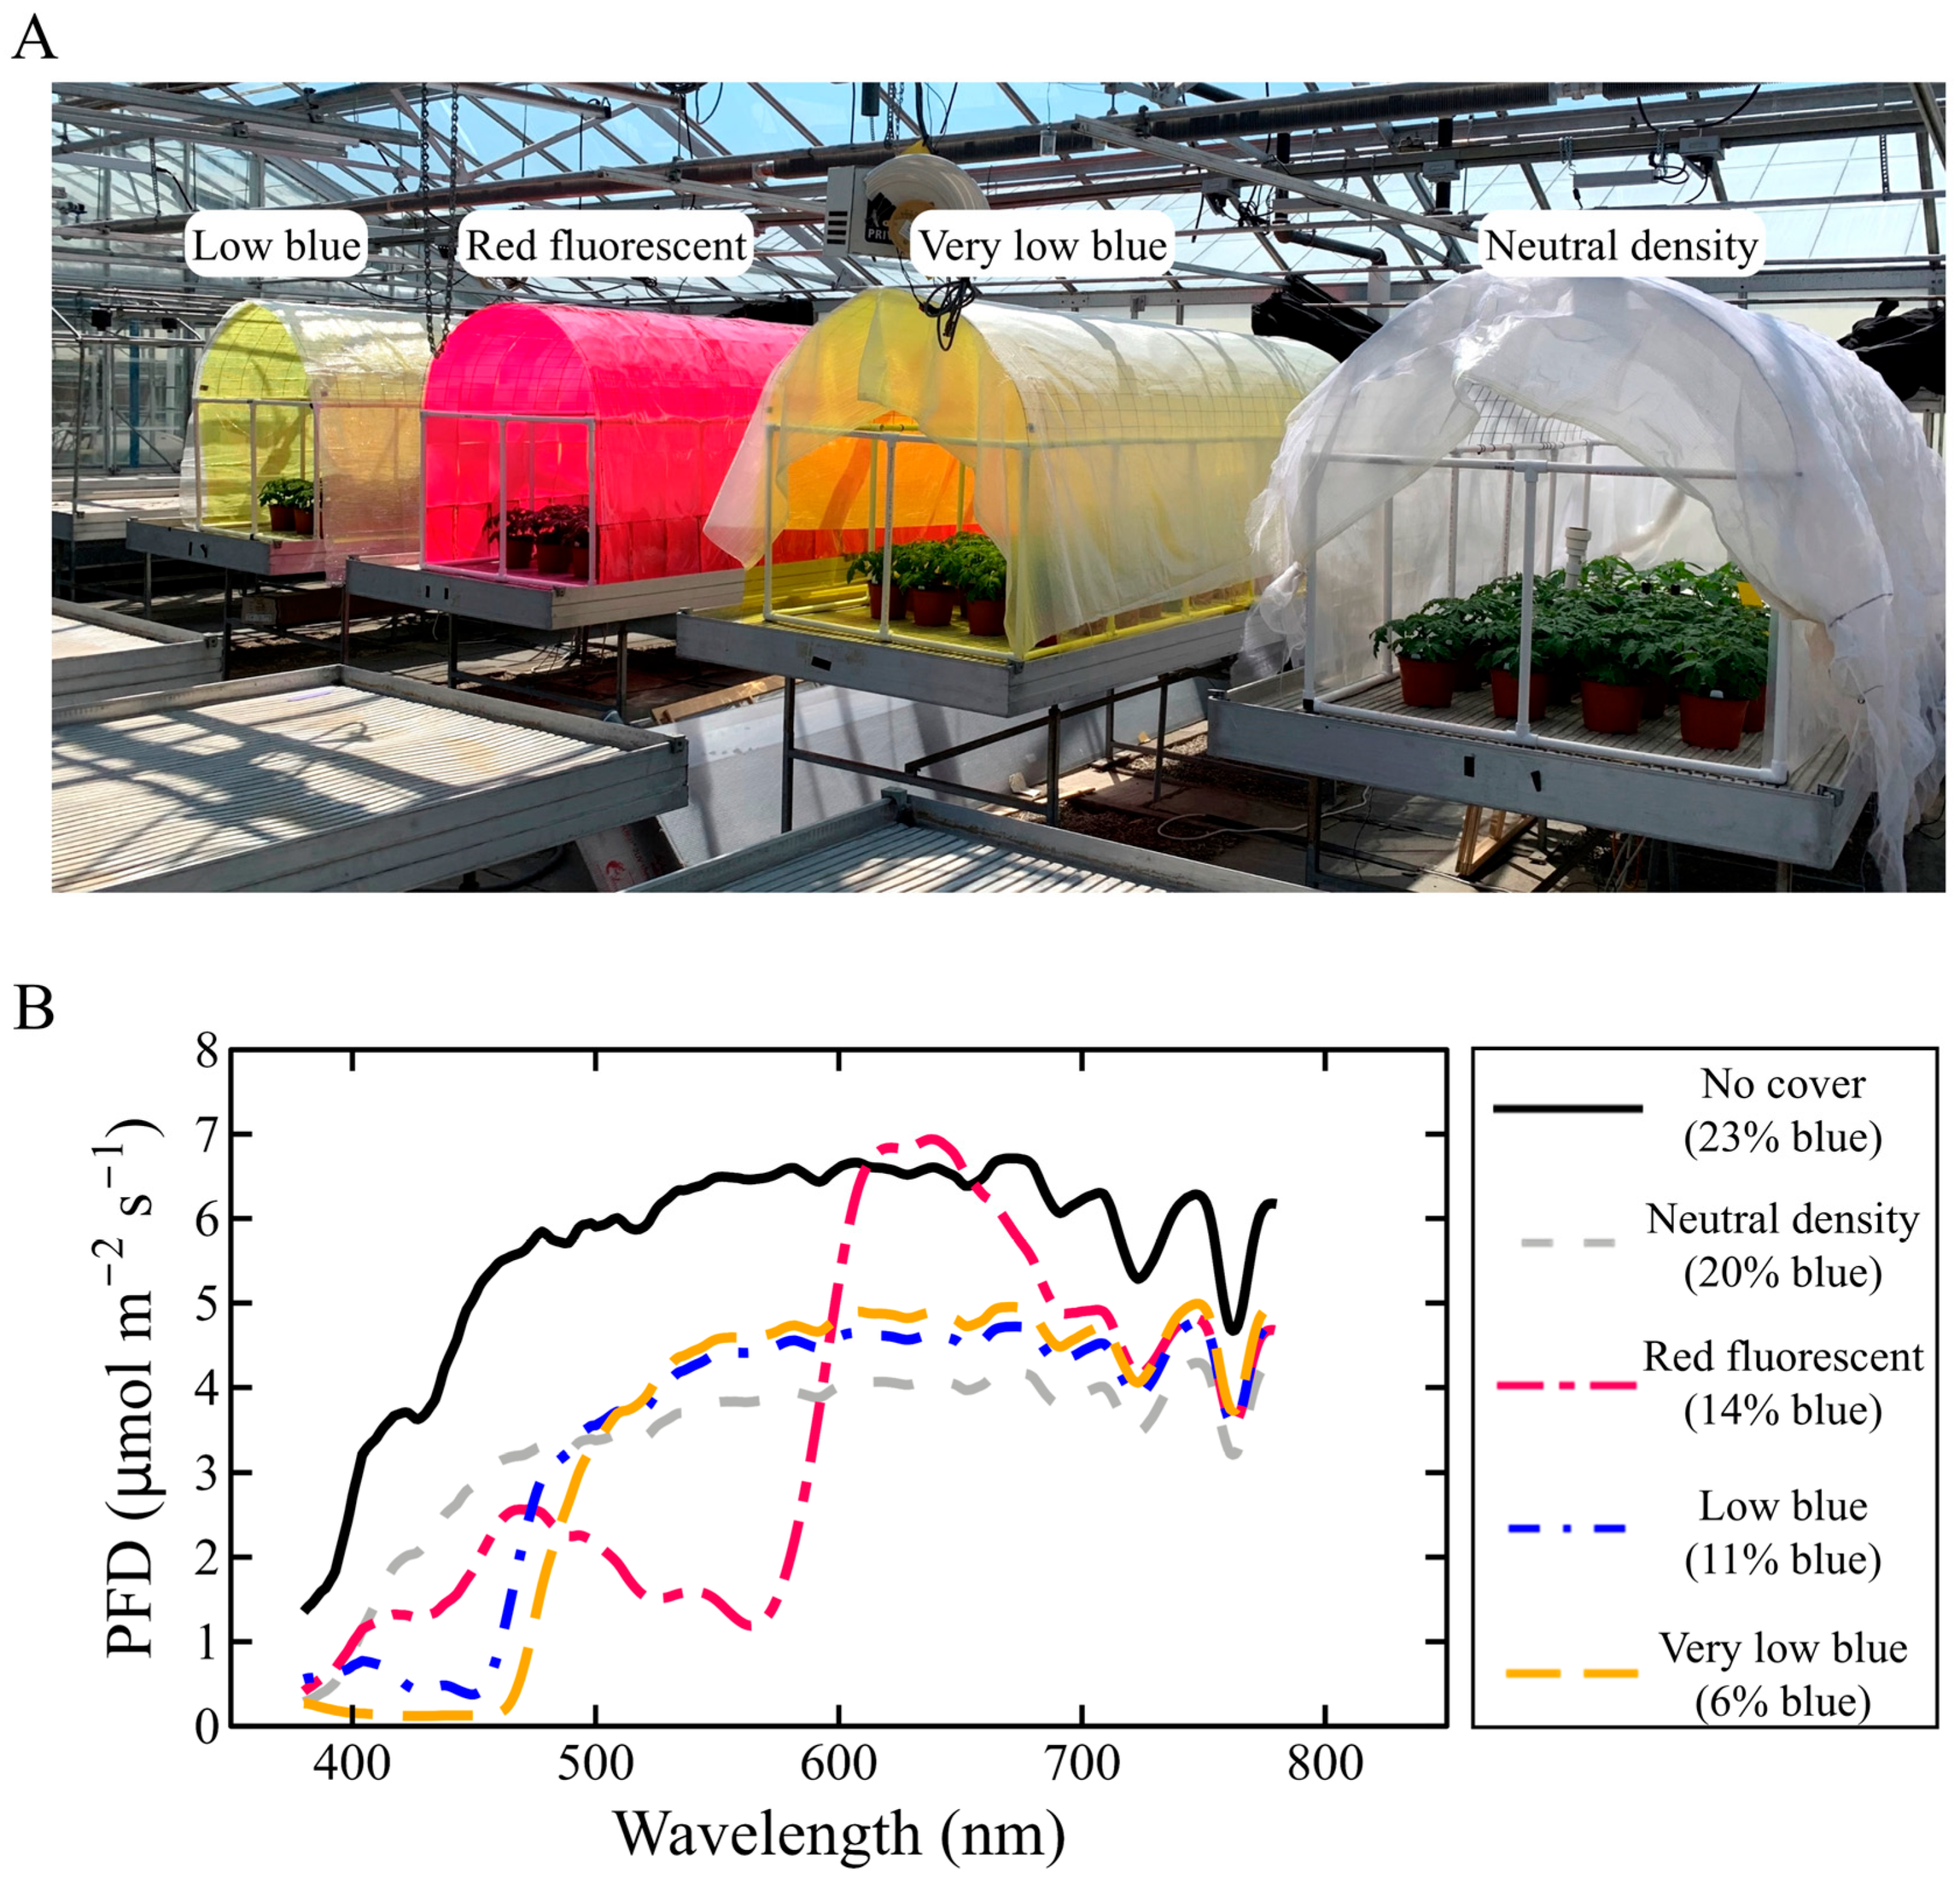
Figure 1. (A) Chambers covered with a neutral density, red fluorescent, or photoselective covering that transmitted low or very low blue light percentages inside a glass-glazed greenhouse. (B) The photon spectrum between 380 and 780 nm of the four covered treatments and one uncovered greenhouse control. The neutral density cover evenly reduced transmission at each nanometer, the red-fluorescent material absorbed blue (B; 400–499 nm) and green (G; 500–599 nm) photons and fluoresced red (R; 600–699 nm) and to a lesser extent far-red (FR; 700–750 nm) photons, and the photoselective materials absorbed different percentages of B photons. The percent B value indicates the percentage of B photons relative to the total photon flux density (TPFD; 400–750 nm). The spectral characteristics are displayed in Table S1.
Horticulturae 11 00980 g001
Figure 2. Average weekly air temperature (AC) and daily light integral (DLI; (DF)) for each treatment. Environmental conditions were measured at canopy height. Treatment spectral characteristics are displayed in Figure 1B and Table S1.
Horticulturae 11 00980 g002
Figure 3. Representative plants grown under various films with different spectral transmissions or no cover. The spectral characteristics under each treatment are in Figure 1B and Table S1. Representative photos of lettuce, tomato, and floriculture crops were taken 21, 75, and 40 d after transplant and placement inside the treatment chambers, respectively.
Horticulturae 11 00980 g003
Figure 4. Key morphological metrics for lettuce ‘Rouxai’ and ‘Butter Crunch’ (A,B), tomato ‘Red Robin’ (C,D), and petunia ‘Madness Pink’ and snapdragon ‘Snapshot Yellow’ (E,F) as a function of the percentage of blue (400–499 nm) light in the transmitted spectrum of each treatment. Values indicate means ± 95% confidence intervals. The sample size for lettuce, tomato, and floriculture crops was 20, 24, and 25, respectively. Different letters within each crop are significantly different by Tukey’s honestly significant difference test (p < 0.05). Regressions were fit through the neutral density and two photoselective treatments (i.e., the red-fluorescent and greenhouse control treatments were omitted from the regression analysis). Regression equations are displayed in Tables S8–S12. Regressions with solid lines are significant at p < 0.05 and dashed lines are not.
Horticulturae 11 00980 g004
Figure 5. Key growth metrics for lettuce ‘Rouxai’ and ‘Butter Crunch’ (A,B), tomato ‘Red Robin’ (C,D), and petunia ‘Madness Pink’ and snapdragon ‘Snapshot Yellow’ (E,F) as a function of the percentage of blue (400–499 nm) light in the transmitted spectrum of each treatment. Values indicate means ± 95% confidence intervals. The sample size for lettuce, tomato, and floriculture crops was 20, 24, and 25, respectively. Different letters within each crop are significantly different by Tukey’s honestly significant difference test (p < 0.05). Regressions were fit through the neutral density and two photoselective treatments (i.e., the red-fluorescent and greenhouse control treatments were omitted from the regression analysis). Regression equations are displayed in Tables S8–S12. Regressions with solid lines are significant at p < 0.05 and dashed lines are not.
Horticulturae 11 00980 g005
Figure 6. Instantaneous photosynthesis measurements were used to generate light response curves for each crop. Each plot is photosynthetic rate (AE) as a function of photosynthetic photon flux density (PPFD; 400–700 nm). Values represent averages ± 95% confidence intervals (n = 3). Regressions were fit according to the model by Marshall and Biscoe [36]. Regression parameters are displayed in Table S13.
Horticulturae 11 00980 g006
Figure 7. Maximum photosynthetic rate (Amax) for lettuce ‘Rouxai’ and ‘Butter Crunch’, tomato ‘Red Robin’, and petunia ‘Madness Pink’ and snapdragon ‘Snapshot Yellow’ as a function of the percentage of blue (400–499 nm) photons in the transmission spectrum of each treatment, excluding the uncover control treatment. Amax was derived from light response curves displayed in Figure 6 and Table S13.
Horticulturae 11 00980 g007
Figure 8. The average quantum yield of photosystem II (PhiPSII) of leaves near the top of the canopy on a cloudless day at solar noon (n = 20) as a function of the percentage of blue (400–499 nm) in the transmission spectrum of each treatment. The spectral characteristics of each treatment are displayed in Figure 1B and Supplementary Table S1. Different letters within each crop are significantly different by Tukey’s honestly significant difference test p < 0.05. Average values are displayed in Supplementary Table S14.
Horticulturae 11 00980 g008
Figure 9. The average stomal conductance (gsw) of leaves near the top of the canopy on a cloudless day at solar noon (n = 20) as a function of the percentage of blue (400–499 nm) in the transmission spectrum of each treatment. The spectral characteristics of each treatment are displayed in Figure 1B and Supplementary Table S1. Different letters within each crop are significantly different by Tukey’s honestly significant difference test p < 0.05. Average values are displayed in Supplementary Table S14.
Horticulturae 11 00980 g009
Disclaimer/Publisher’s Note: The statements, opinions and data contained in all publications are solely those of the individual author(s) and contributor(s) and not of MDPI and/or the editor(s). MDPI and/or the editor(s) disclaim responsibility for any injury to people or property resulting from any ideas, methods, instructions or products referred to in the content.