Article

Sucrose Transporter 2 Knockout Increases Sugar Content in Tomato Fruits

1
National Key Laboratory for Germplasm Innovation and Utilization of Horticultural Crops, Huazhong Agricultural University, Wuhan 430070, China
2
Hubei Hongshan Laboratory, Wuhan 430070, China
3
Hubei Key Laboratory of Metabolic Abnormalities and Vascular Aging, Wuhan 430022, China
*
Author to whom correspondence should be addressed.
Horticulturae 2025, 11(8), 956; https://doi.org/10.3390/horticulturae11080956
Submission received: 20 June 2025 / Revised: 18 July 2025 / Accepted: 8 August 2025 / Published: 13 August 2025
(This article belongs to the Special Issue Breeding by Design: Advances in Vegetables)

Abstract

Sugar content is pivotal in determining the flavor quality of tomato, and numerous genes related to tomato fruit quality have been identified. The distribution of sugar sources in plants primarily relies on the functionality of sugar transporters. Despite this, the specific role of SUT2, a sucrose transporter family member, in sugar accumulation within tomato fruits is still unclear. This study demonstrates that SUT2 is localized to the plasma membrane and possesses the function of transporting sucrose from the extracellular side to the intracellular side of the plasma membrane. Its expression level progressively decreases during fruit development. SUT2 knockout resulted in a significant increase in sugar content in tomato fruits. Further investigation revealed that the elevated sugar levels in knockout lines were accompanied by alterations in the expression of the sugar accumulation related genes STP1 and CDPK26/27. These findings provide new insights into the biological role of SUT2 in regulating sugar content in tomato fruits, improve our understanding of sugar accumulation mechanisms in tomato fruits, and offer valuable perspectives for quality improvement in tomato.

1. Introduction

Photosynthesis, the principal process of carbon fixation on Earth, harnesses light energy to transform carbon dioxide into triose phosphate within chloroplasts. A portion of this triose phosphate is retained in the chloroplasts for the synthesis of starch, which is later hydrolyzed into monosaccharides and transported to the cytoplasm during the night. The remaining triose phosphate is directly transported to the cytoplasm, where it is converted into sucrose through enzymatic reactions mediated by sucrose phosphate synthase [1,2].
The role of carbohydrates in plant growth and development is crucial, as they serve not only as a carbon source for energy but also as signaling molecules that regulate plants’ responses to external environments [1,3,4,5]. Sucrose serves as the predominant form of photosynthetic products in the majority of plants, through apoplastic and symplastic loading involving companion cell sieve element (CC-SE) complexes in the vascular tissues from source to sink [6,7,8].
The transport of sugars is fundamentally linked to sugar transporters, making a thorough understanding of these transporters essential for elucidating source-sink allocation in plants. Previous research has primarily categorized sugar transport families into three groups: the Monosaccharide Transport (MST) Family, the Sucrose Transport (SUT/SUC) Family, and the SWEET family [9,10]. The MST family, comprising 53 members, is subdivided into seven subfamilies: sugar transporters (STPs), polyol/monosaccharide transporter (PMTs), early response to dehydration-like (ERDLs), inositol transporters (INTs), plastid glucose transporters (pGlcTs), tonoplast sugar transporter (TSTs), and vacuolar glucose transporters (VGTs) [11,12,13,14]. Sucrose transporters (SUTs/SUCs) function as energy-dependent, proton-coupled transporters with 12 transmembrane domains and are divided into five subfamilies: SUT1-SUT5 [2,15,16,17,18,19]. The SUT1 subfamily, found exclusively in dicotyledonous plants, is localized within the plasma membrane of cells [16]. Both the SUT2 and SUT4 subfamilies are present in monocotyledonous and dicotyledonous plants, localized, respectively, in the plasma membrane and vacuolar membrane [2]. The exclusive presence of the SUT3 and SUT5 subfamilies in monocotyledonous plants suggests a potential evolutionary link among sucrose transport proteins in these species.
Sucrose transporters (SUTs) play a crucial regulatory role in sucrose transport, modulating source distribution, which is essential for plant growth, development, and stress response [20]. In Arabidopsis thaliana, AtSUC2 is pivotal in phloem-mediated sucrose transporter. Mutations in these transporters increase sugar content within source leaves, impairing overall plant growth, development, and abiotic stress tolerance [21]. In rice, OsSUT1 alters sucrose transport, leading to reduced plant height and impaired anther germination or pollen tube elongation, resulting in grain sterility [22,23]. In maize, ZmSUT1 mutation disrupts source transport, elevating leaf sugar content and stunting growth, while ZmSUT2 mutation impedes development and reduces yield [24,25]. Interfering with CiSUT1 expression notably increases sucrose content in citrus plants [26]. In melons, CmSUT3 facilitates sucrose transport to parenchyma cells in fruits, influencing sugar accumulation [27]. It has been reported that MdSUT4.1 in apples exerts a negative regulatory effect on fruit sugar content [28]. Moreover, MdAREB2 binds and activates the expression of MdSUT1, resulting in an increase in apple sugar content [29]. MdSUT2.2 is phosphorylated by specific protein kinases to enhance salt tolerance [30]. Through its interaction with SlSUT1, tomato SlSUT4 modulates the plasma membrane targeting of SlSUT1, regulating sucrose output in leaves and sugar concentration at stem tips to control flowering time [31].
The LeSUT2 in tomato exhibits responsiveness to the sucrose signal [32]. LeSUT2 shows several similarities with the yeast sugar sensors SNF3 and RGT2 and has been identified as a potential sucrose receptor in tomato. Inhibiting LeSUT2 through RNA interference leads to reduced fruit size [33], lower sugar content, and decreased seed production [34]. Although previous studies have shown that SUT2 positively influences sugar content in tomato fruits, the specific mechanisms of regulation have yet to be clarified.
Our findings reveal the phenotype and function of SUT2. Heterologous expression in yeast confirmed sucrose transport activity by SUT2 and directional transport across the plasma membrane from extracellular to intracellular compartments. Knockout of SUT2 significantly increased glucose, sucrose, and fructose content in fruits, whereas malate and citrate levels exhibited no significant changes. Further analysis suggested that low-glucose signaling following SUT2 knockout alters expression levels of Sugar Transport Protein 1 (STP1) and Calcium-dependent Protein Kinase 26/27 (CDPK26/27), ultimately leading to elevated sugar accumulation in fruits. These findings offer novel insights for improving tomato quality through molecular breeding strategies targeting sugar metabolism.

2. Materials and Methods

2.1. Plant Materials and Growth Conditions

The tomato cultivar Ailsa Craig (AC) was used for the transformation experiments. Plants were grown in a greenhouse at 25 ± 2 °C with a photoperiod of 16 h light/8 h darkness with 60–70% relative humidity. One month later, the plants were transferred to the field for routine water and fertilizer management.

2.2. Vector Construction and Tomato Transformation

SUT2-knockout lines were generated using a CRISPR/Cas9 binary vector named pTX. All primer sequences used in this study are listed in Supplementary Table S1. Agrobacterium-mediated transformation facilitated the introduction of these constructs into AC plants [35]. gDNA was extracted from T1 generation gene-edited lines for pTX vector detection to ensure complete segregation of pTX and thus exclude any influence of the vector itself on the phenotype. Subsequently, detection primers were designed to flank the target sites. Following PCR amplification, Sanger sequencing was performed. The sequencing results were then compared with the reference genome sequence to screen for two homozygous edited lines, which were used in further analysis. The codon-to-amino acid correspondence was then used to derive the amino acid sequences of the edited lines. Different amino acid sequences were considered to have distinct editing types.

2.3. Subcellular Localization

The full-length coding sequences (CDS) of SUT2, excluding termination codons, were amplified from the cDNA of “Ailsa Craig” (AC) and cloned into the 101-YFP vector under the control of the CaMV35S promoter [36]. Agrobacterium strain GV3101 harboring CaMV35S:SUT2-YFP, along with the nuclear marker CaMV35S:StERF3-RFP [37], was infiltrated into tobacco leaves. Following a 48 h incubation period, confocal laser scanning microscopy (Leica SP8, Leica, Wetzlar, Germany) was employed to visualize the fluorescence of yellow fluorescent protein (YFP) and red fluorescent protein (RFP).

2.4. Plant Phenotyping

SSC was quantified as Brix in total fruit juice from red-ripe fruits using a digital refractometer (PAL-BX|ACID 3, ATAGO, Guangzhou, China). Glucose, fructose, sucrose, malate, and citric acid were measured by gas chromatography (GC). The red-ripe fruits and leaves were ground with liquid nitrogen and further extracted with 80% methanol. The extracted samples were concentrated in vacuo and then derivatized with hydroxylamine hydrochloride, hexamethyldisilane (HMDS, Sigma, St. Louis, MI, USA), and trimethylchlorosilane (TMCS, Sigma, St. Louis, MI, USA). Derivatized supernatants were added to a 2 mL automatic injection bottle for GC-FID (Newton, MA, USA) analysis.

2.5. RNA Extraction and Gene Expression

Total RNA was extracted using the Trizol reagent (Invitrogen, Carlsbad, CA, USA) and further reverse-transcribed into cDNA using a HiScriptII 1st Strand cDNA Synthesis Kit (Vazyme, Nanjing, China). The relative transcript levels of specific genes were quantified using qRT-PCR. The relative expression of specific genes was quantified using the 2−ΔΔCt method, and the actin gene was used as a constitutive internal control.

2.6. RNA-Seq

Samples from SUT2-knockout lines and WT were collected with three biological replicates, and each replicate contained 10 red ripe fruits from three plants. RNA was extracted, and RNA-seq was performed using a HiSeq-PE150 sequencing system (Illumina, San Diego, CA, USA). We used the average FPKM (expected number of fragments per kilobase of transcript sequence per million base pairs sequenced) value as a measure of gene expression [38]. A gene yielding > 2-fold expression with p ≤ 0.05 was classified as a DEG.

2.7. Heterologous Expression in Yeast

The ORF of SUT2 was cloned into the yeast expression vector pDR196 to test the functionality of SUT2 [39]. The fragment was subcloned into the corresponding restriction sites of pDR196 to yield SUT2-pDR196, and the construct was confirmed by sequencing.
The yeast strain EBY.VW4000 was transformed with SUT2-pDR196, as described previously [40]. pDR196 and CsHT11-pDR196 were used as negative and positive controls, respectively. The plasmids pDR196, SUT2-pDR196, and CsHT11-pDR196 were transformed into the yeast strain EBY.VW4000 using a mini-preparation method. Transformants were plated on SD/-Ura (maltose) medium and incubated at 30 °C. After 3 days, single colonies were picked and expanded for culture. Yeast plasmids were extracted to confirm positive transformation. Successfully transformed yeast cultures were serially diluted (1×, 10×, 100×, 1000×) and spotted onto solid media containing distinct sugar sources (maltose, glucose, fructose, galactose, and sucrose). Growth phenotypes were documented following a 3-day incubation period.
Sucrose Analog (Esculin) Transport Assay: The plasmids pDR196, SUT2-pDR196, and AtSUC2-pDR196 (positive control) were transformed into the yeast strain W303 via mini-preparation. Transformants were plated on SD/-Ura (glucose) medium and incubated at 30 °C. After 3 days, single colonies were selected and cultured for expansion. Plasmids from yeast were extracted for positive clone verification. Cells from confirmed transformants were harvested, washed once with PPB buffer, and resuspended to an OD600 of 2.0. Esculin was added at varying concentrations under dark conditions and co-incubated for 4–8 h. Uptake was visualized using confocal laser scanning microscopy within the 465–600 nm blue light emission spectrum.

2.8. Sugar Induction Experiment

Three days post-germination, AC seeds were planted in 50-well trays. Seedlings were transplanted at the three-leaf stage and treated with a 0.2% or 2% solution of mannitol, glucose, or sucrose (wt/vol) combined with 0.2‰ Silwet L-77 surfactant at the five-leaf stage. Each treatment had three biological replicates, with three plants per replicate. After a 24 h treatment period, the leaves were washed with ddH2O and air-dried, while foil samples were immediately frozen in liquid nitrogen for later expression analysis.

3. Results

3.1. SUT2 Expression Decreased with Fruit Ripening in Tomato

Sugar transporters play an indispensable role in the source sink allocation of photosynthetic products. To investigate the function of this large gene family during fruit development, we analyzed the expression patterns of different types of sugar transporters across various fruit development stages. Using published data displaying gene expression profiles, we quantified stage-specific expression levels of individual genes, with “ACTIN” as the reference standard [41]. Heatmap analysis revealed that SUT2 expression gradually decreased during fruit development (Figure 1), while soluble solids content (SSC) progressively increased [42]. This inverse correlation suggests that SUT2 likely negatively regulates SSC accumulation during fruit development.

3.2. SUT2 Knockout Promotes Sugar Accumulation in Tomato Fruit

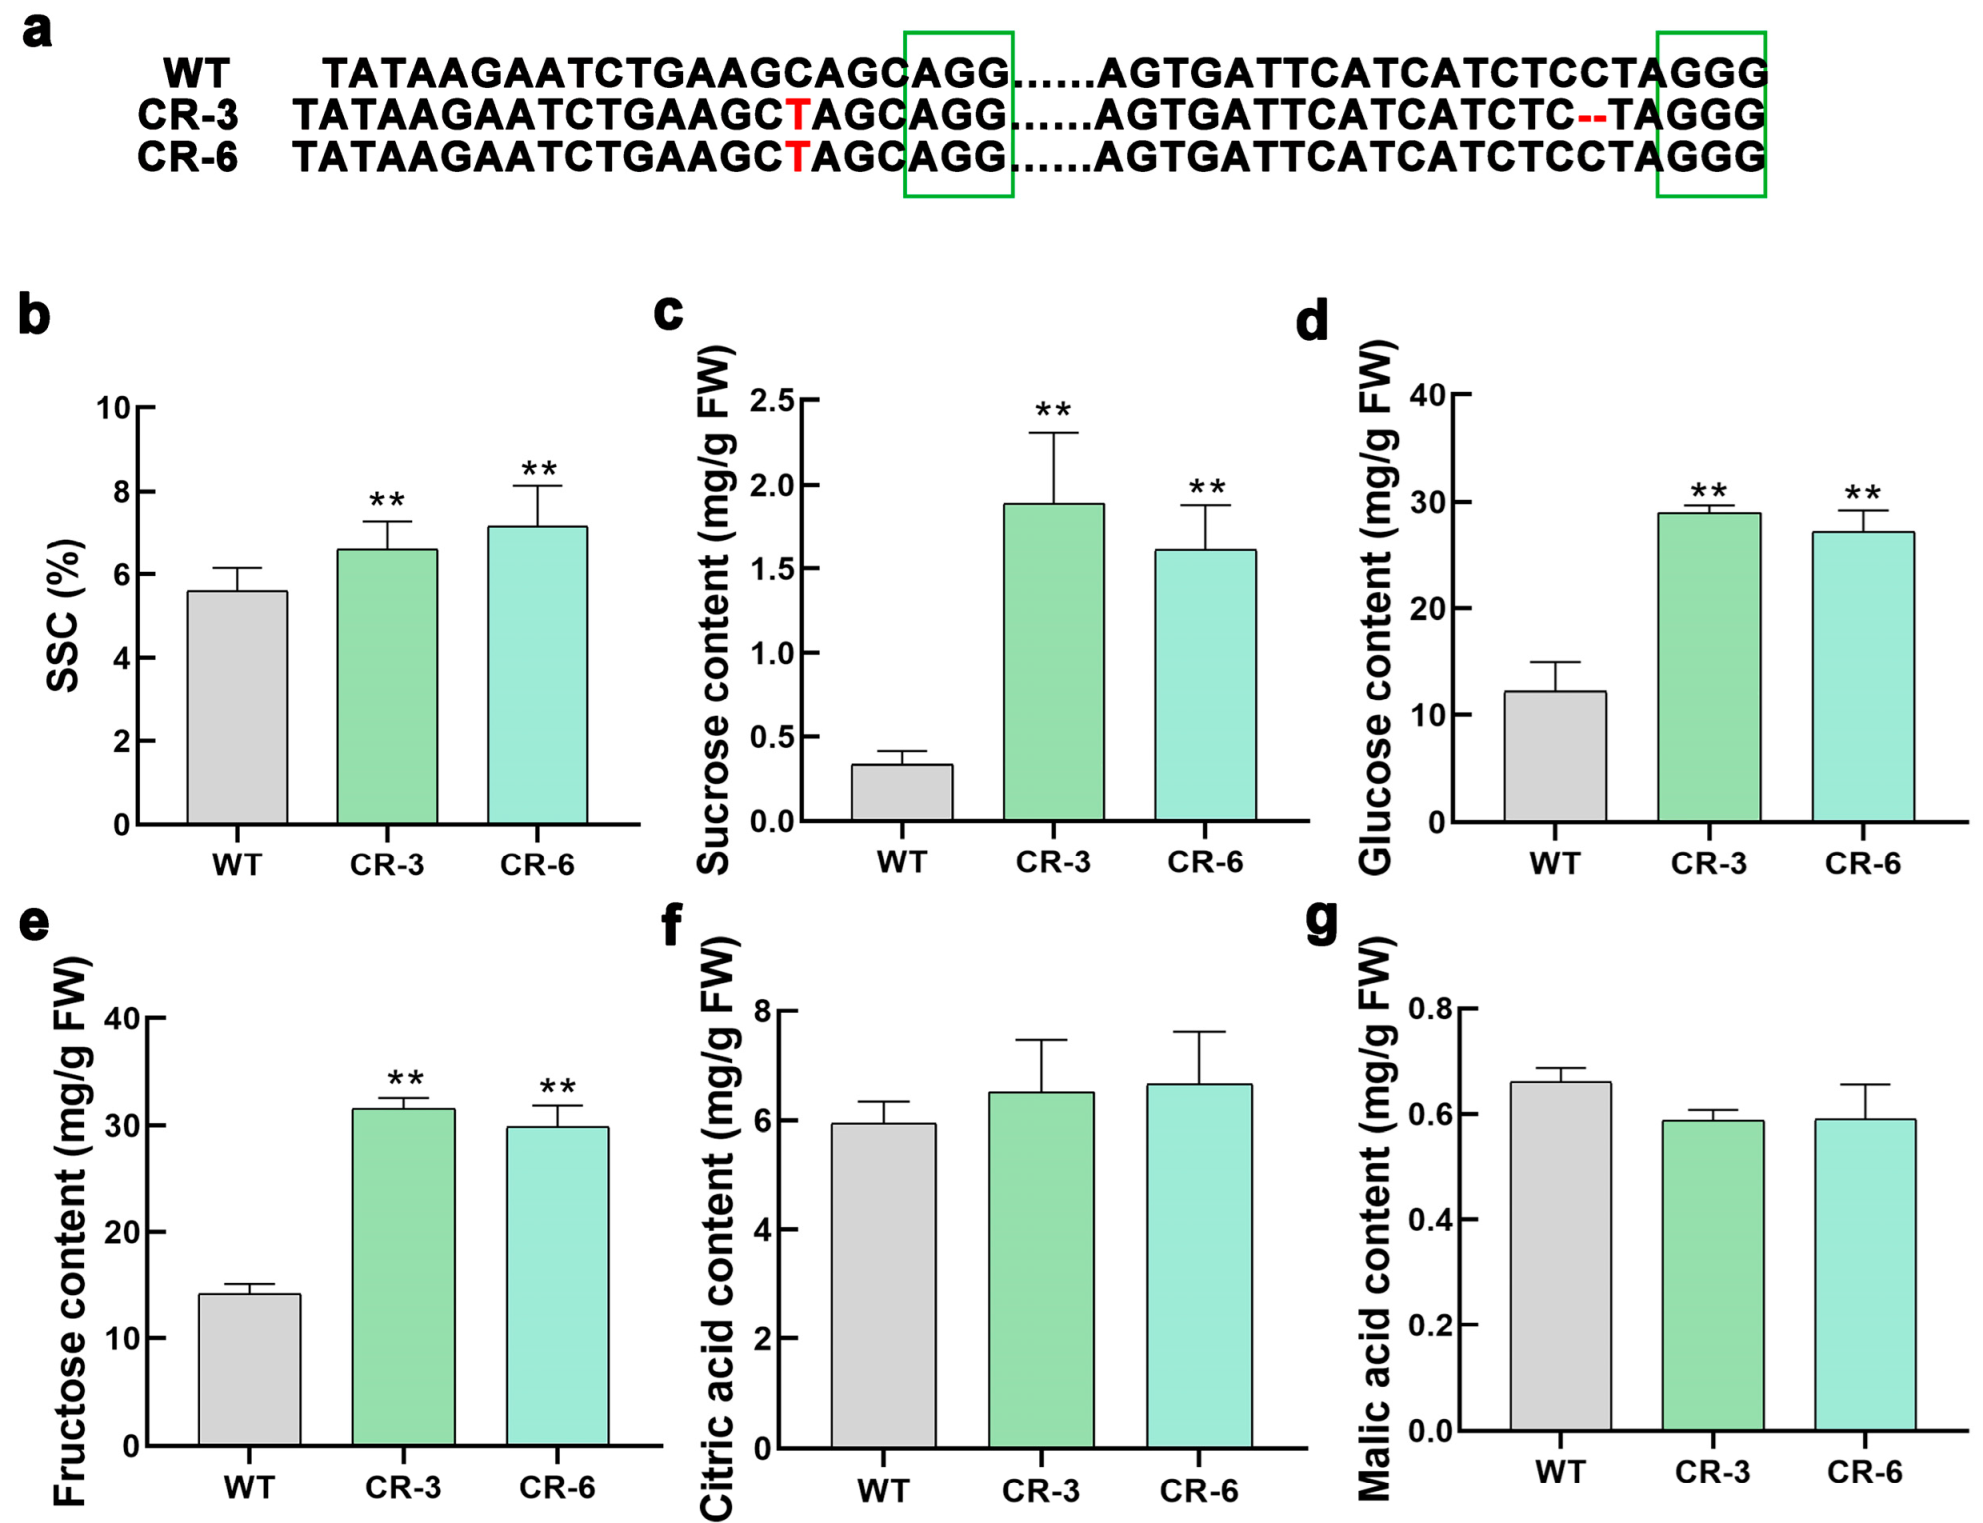
To investigate the role of SUT2 in sugar accumulation in tomato fruits, we generated knockout lines in Ailsa Craig (AC) tomato using CRISPR/Cas9 technology. Through further screening, we obtained two homozygous edited lines (Figure 2a). The qRT-PCR results showed an 84% and 89% reduction in SUT2 expression levels in the CR-3 and CR-6 lines, respectively (Supplementary Figure S1b). Both mutation types resulted in premature termination of translation, thereby affecting protein function (Supplementary Figure S1c).
We performed phenotypic observations on the SUT2-knockout lines. Compared to the control, the fruit sizes of the two knockout lines were relatively reduced (Supplementary Figure S1a). We measured the soluble solids content (SSC) in mature fruits. The results showed that the SSC increased by 15% and 22% in the CR-3 and CR-6 knockout lines, respectively (Figure 2b). Furthermore, we analyzed the contents of sucrose, glucose, fructose, citric acid, and malic acid in the fruits using GC-FID. The results revealed that compared to the control, sucrose content increased 4.7-fold and 3.8-fold, glucose content increased 1.4-fold and 1.2-fold, and fructose content increased 1.2-fold and 1.0-fold in the CR-3 and CR-6 knockout lines, respectively. However, the contents of malic acid and citric acid showed no significant changes (Figure 2c–g).
Functioning as the principal source tissue for photosynthates, leaves conduct photosynthesis and translocate the resulting assimilates to the fruit through the xylem, thereby promoting fruit growth and development [43]. Given that sugar accumulation involves allocation between source and sink tissues, we further quantified the sugar and organic acid content in mature source leaves of the knockout lines. The analysis showed no significant changes in the sugar or organic acid content in the source leaves of the knockout lines (Supplementary Figure S2). These results indicate that knocking out SUT2 effectively promotes sugar accumulation in fruits but does not affect sugar and acid content in source leaves.

3.3. Temporal and Spatial Expression Profiles of SUT2

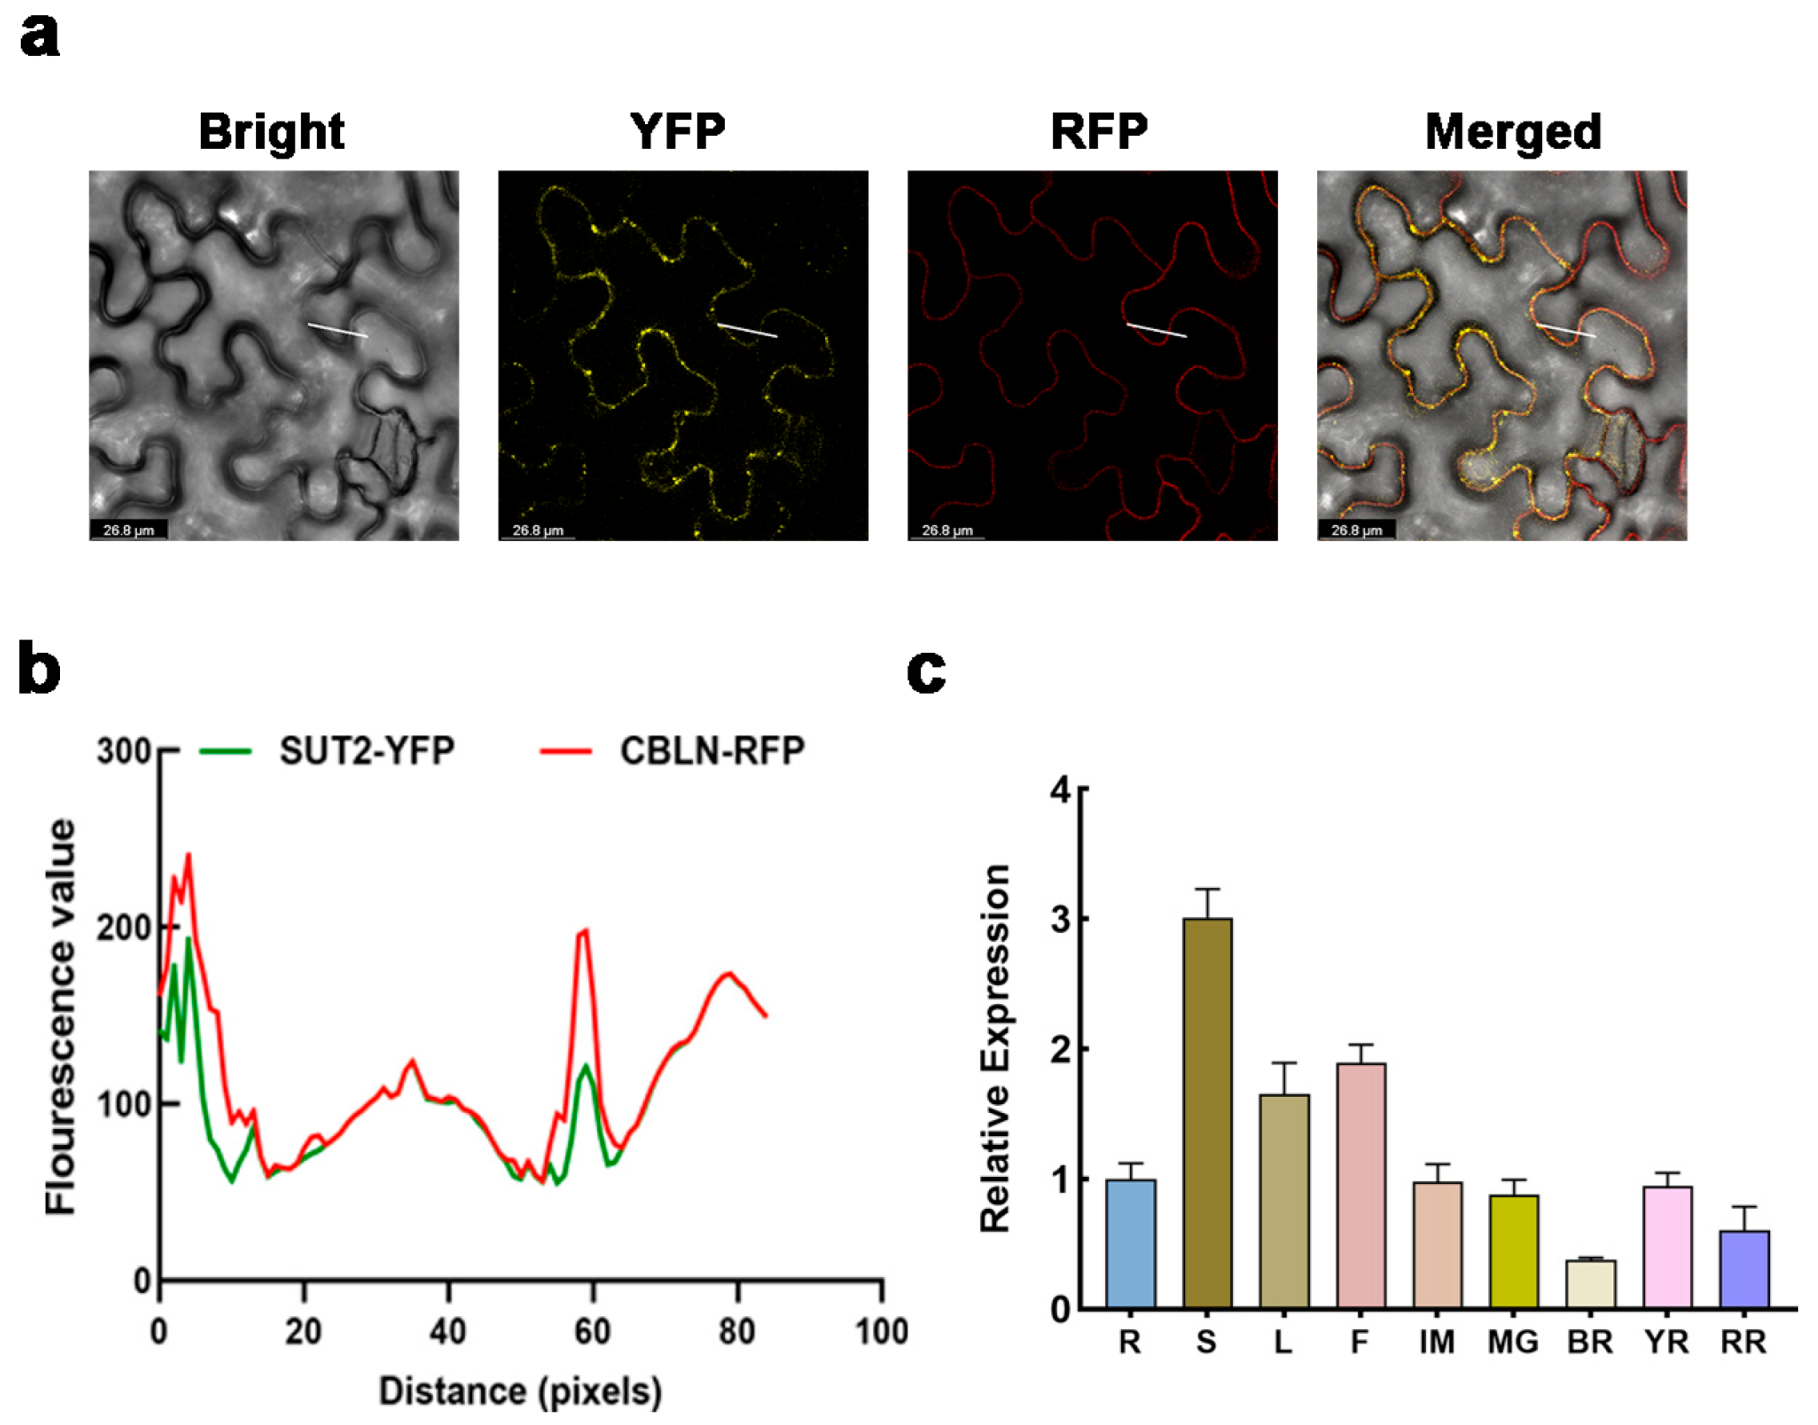
Spatial and temporal expression patterns are crucial for protein function and phenotypic regulation. We predicted, using the online server https://cello.life.nctu.edu.tw/ (accessed on 10 August 2025) indicated, that SUT2 is localized to the plasma membrane. To confirm SUT2 localization, we amplified its coding sequence (CDS) without a stop codon from AC cDNA and cloned it into the 101YFP vector via homologous recombination. The construct was co-infiltrated into Nicotiana benthamiana leaves with agrobacterium carrying plasma membrane-localized CBLN-RFP (marker). After 3 days of expression, observation under a confocal laser scanning microscope revealed distinct yellow fluorescence on the plasma membrane, which colocalized with the plasma membrane marker, resulting in orange merged fluorescence (Figure 3a,b). This indicates that SUT2 is indeed localized to the plasma membrane, consistent with the online prediction.
The transmembrane structure is essential for enabling transport proteins to perform their transport function. We analyzed the transmembrane structure of SUT2 using the TMHMM-2.0 webserver (https://services.healthtech.dtu.dk/services/TMHMM-2.0/ (accessed on 23 March 2023)). The results indicate that SUT2 possesses the characteristic 11 transmembrane domains (TMDs) of the sucrose transporter family and lacks a signal peptide (Supplementary Figure S3a). To investigate SUT2 expression across different tissues, total RNA was extracted from various organs of AC plants for reverse transcription. qRT-PCR results showed that SUT2 is constitutively expressed, detectable at all developmental stages, with the highest expression in leaves (Figure 3b). Further qRT-qPCR analysis of distinct fruit developmental stages revealed relatively higher SUT2 expression during early stages of fruit development, similarly to previous reports (Supplementary Figure S3b).

3.4. SUT2 Is a Plasma Membrane-Localized Sucrose Transporter

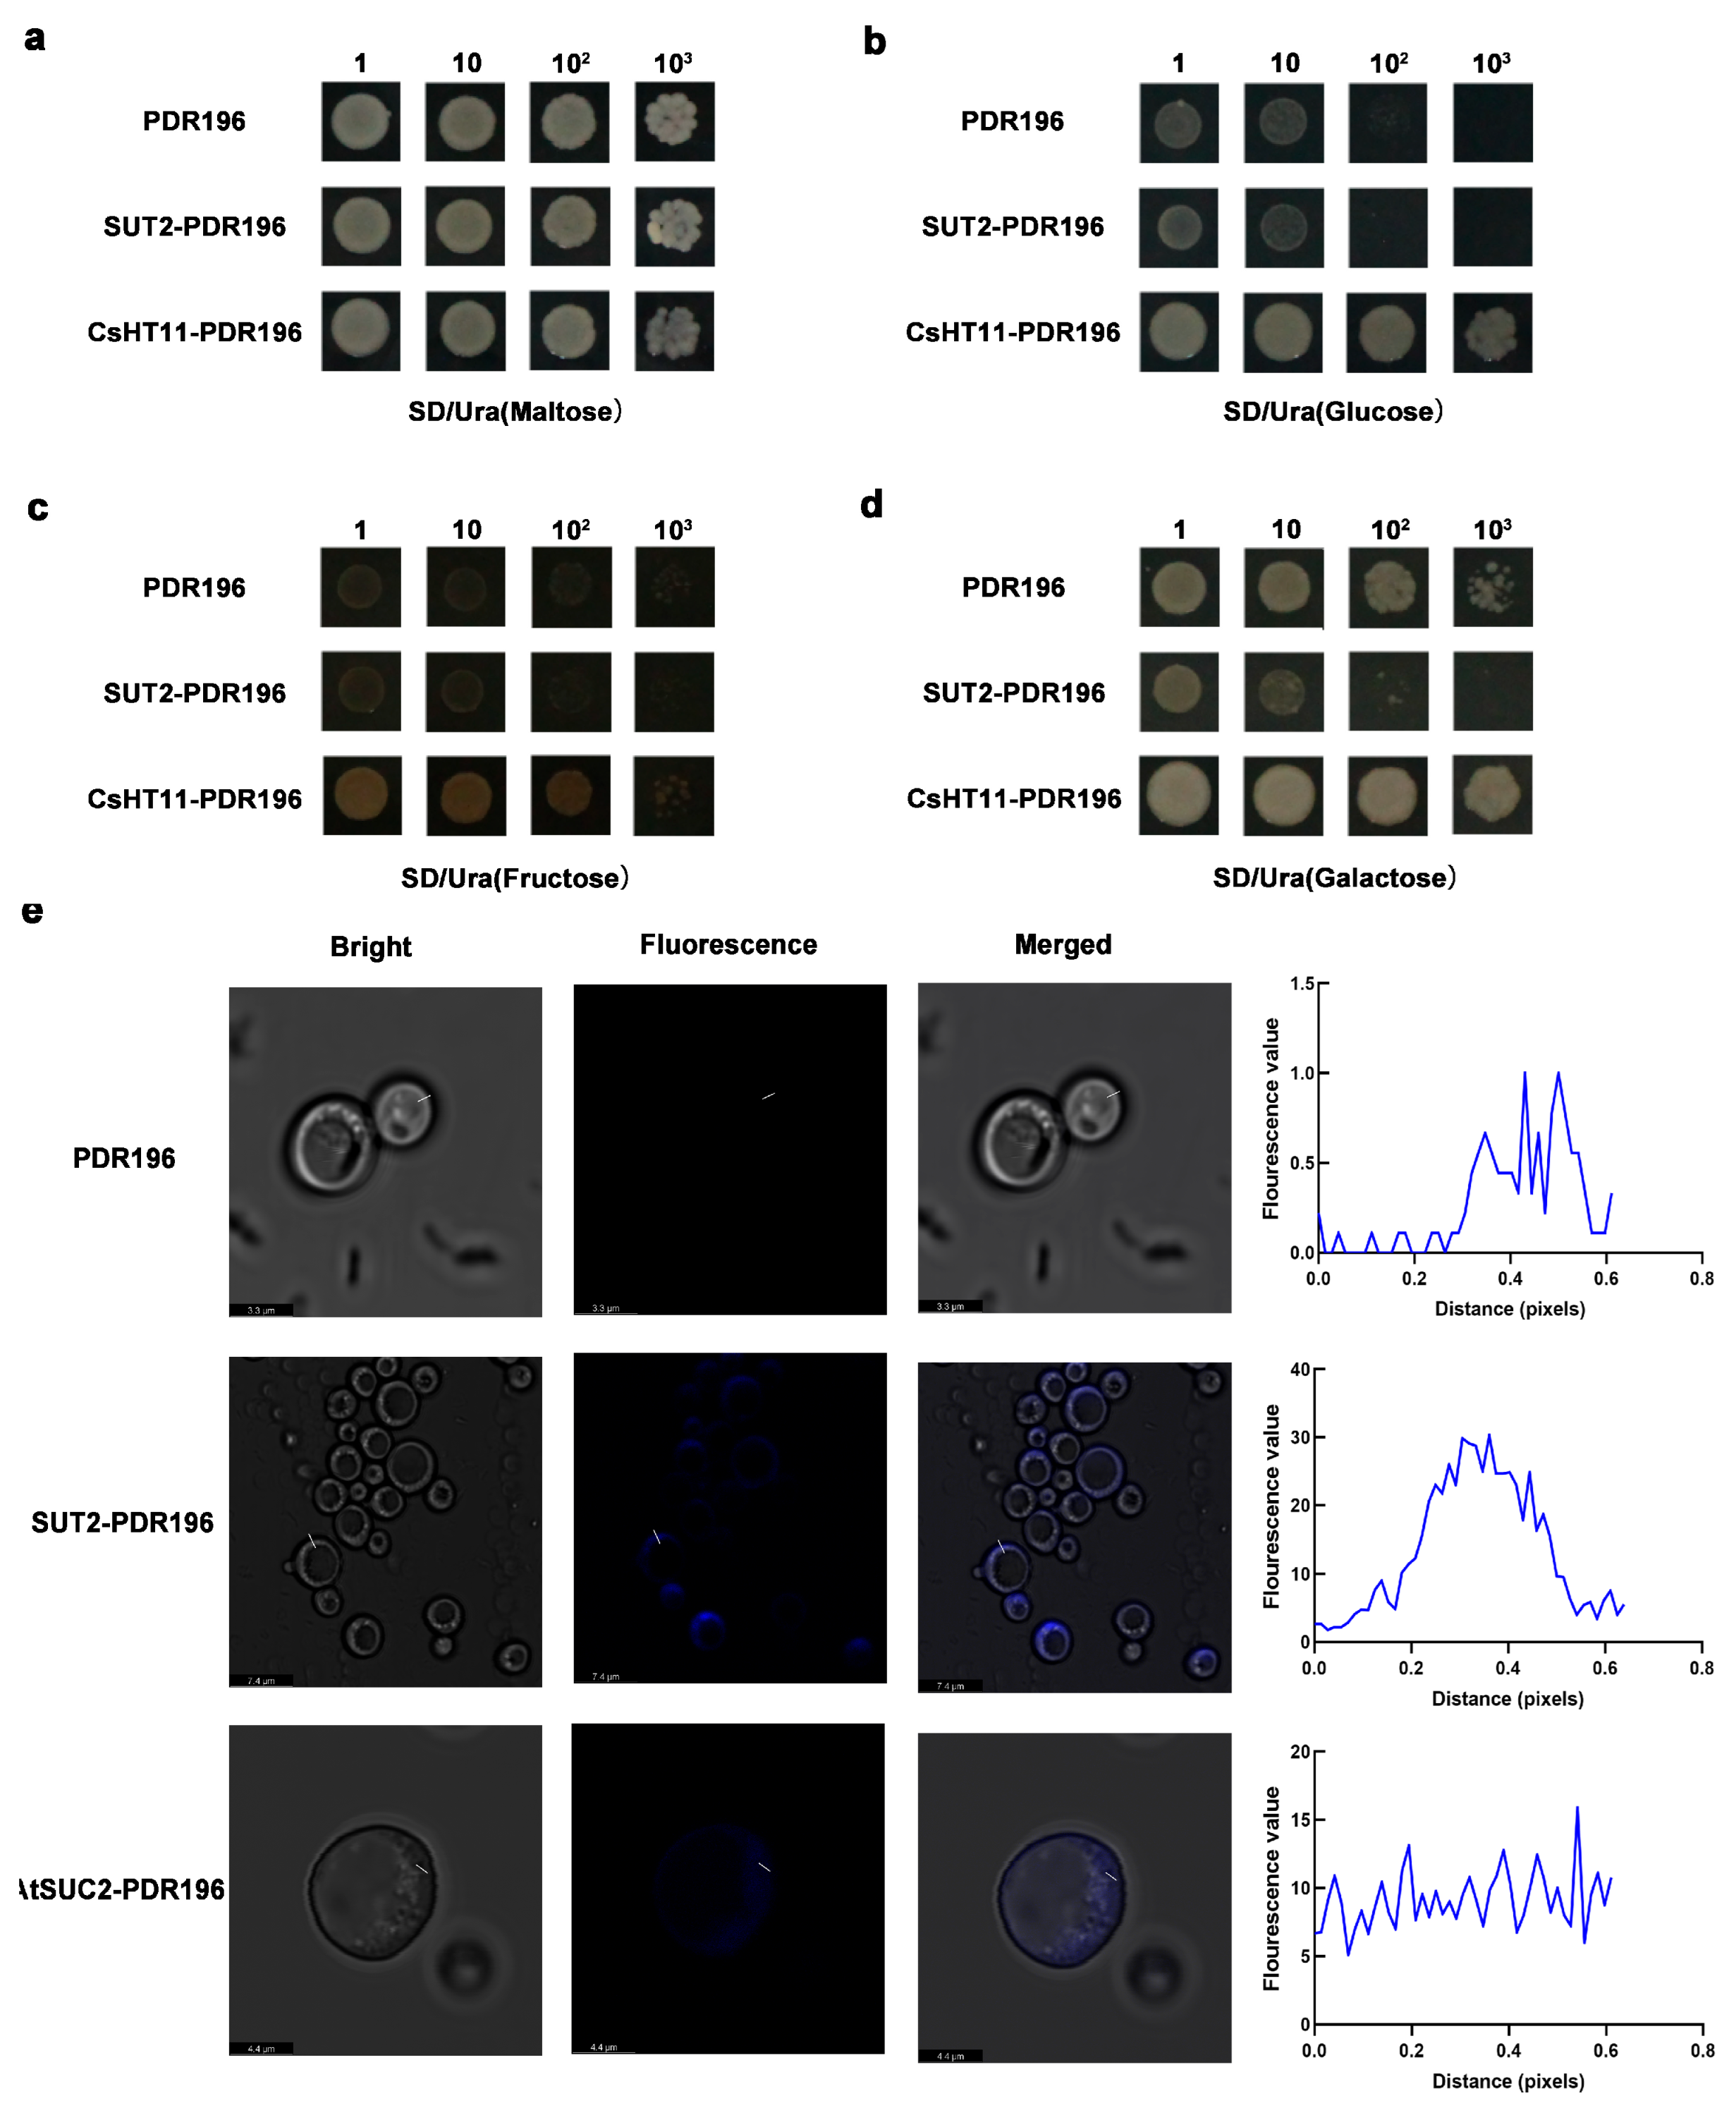
Previous studies have demonstrated the glucose transport function of SUT2, while its sucrose transport capacity remains unconfirmed [33]. To investigate the hexosaccharide transport capability of SUT2, we utilized the yeast strain EBY.VW4000, characterized by a monosaccharide absorption deficiency [44], with PDR196 serving as the negative control and CsHT11 as the positive control [45]. Our findings indicated that yeast strains expressing SUT2-PDR196 were unable to proliferate on media containing glucose, fructose, or galactose, confirming the absence of hexose transport activity in tomato SUT2 (Figure 4a–d).
To explore the specific sucrose transport function of SUT2, we carried out an incubation experiment with the SUT2-PDR196 vector in yeast strain W303 using a sucrose buffer containing the fluorescence analog of sucrose, Esculin [46]. Subsequently, microscopic observation was performed. The results revealed that no fluorescence signal was detected in the control yeast cells. Cytoplasmic fluorescence was evident in both the SUT2-PDR196 and AtSUC2 transformed yeast strains (Figure 4e). These findings suggest that SUT2 facilitates the translocation of Esculin from the plasma membrane into the cytoplasm.

3.5. Transcriptome Profiling in Tomato Fruits of SUT2-Knockout Lines

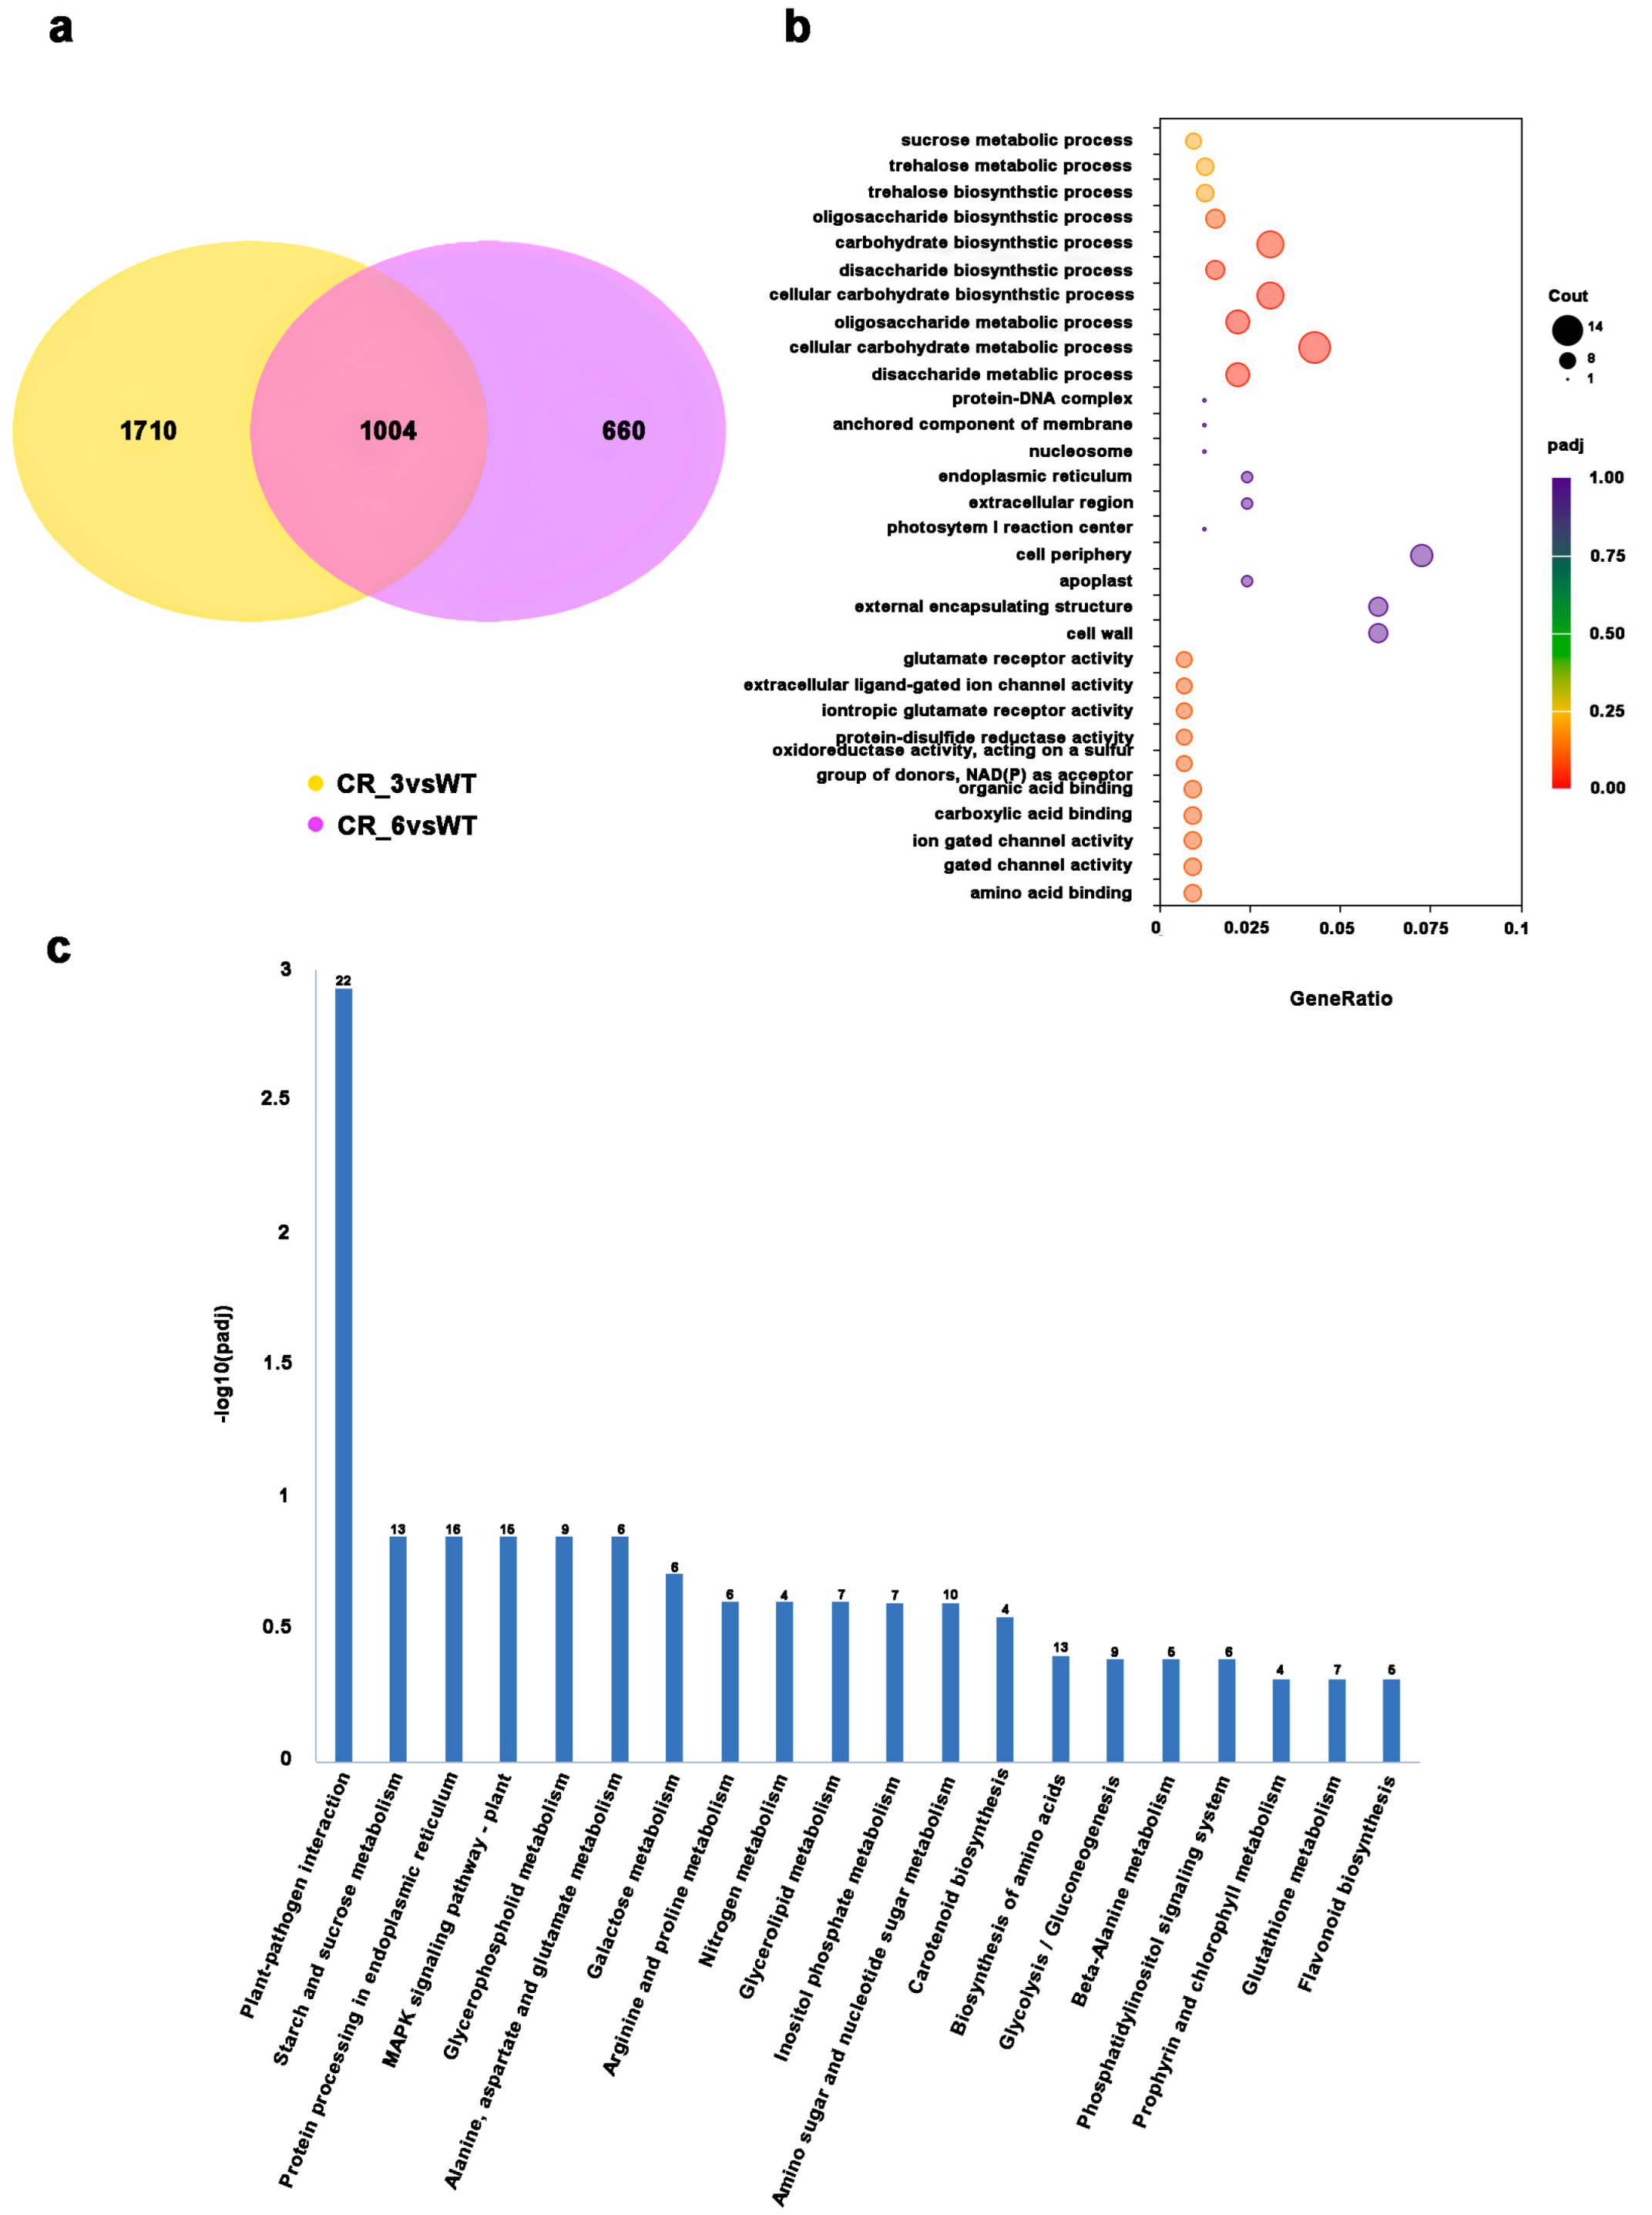
To further dissect the mechanism underlying the effect of SUT2 on SSC in tomato fruit, we conducted transcriptome sequencing of red ripe fruits from the two knockout lines, CR-3 and CR-6, and the control, AC. The analysis of the transcriptome data revealed enrichment of a total of 1004 differentially expressed genes (DEGs) (Figure 5a). Gene Ontology (GO) enrichment analysis showed that a large number of genes are involved in the sugar metabolism and synthesis processes. These include the disaccharide metabolic process, cellular carbohydrate metabolic process, oligosaccharide metabolic process, cellular carbohydrate biosynthetic process, disaccharide biosynthetic process, and carbohydrate biosynthetic process (Figure 5b).
Kyoto Encyclopedia of Genes and Genomes (KEGG) enrichment analysis indicated that the metabolic processes affected by these DEGs include plant-pathogen interaction, starch and sucrose metabolism, protein processing in the endoplasmic reticulum, and MAPK signaling pathway-plant interactions. The plant-pathogen interaction pathway exhibited the most significant enrichment of genes. This enrichment arises from the multifaceted interplay between plant immunity and sugar metabolism. Sugars not only function as signaling molecules regulating immune responses, but also serve as substrates for the synthesis of defense compounds (such as lignin). Simultaneously, plants and pathogens engage in diverse forms of competition centered on sugar transport. Therefore, knocking out genes involved in sugar accumulation impacts a broad spectrum of genes governing plant-pathogen interactions within this pathway. In summary, knocking out SUT2 exerted substantial effects on the expression of genes related to the synthesis and metabolism of primary metabolites, plant-pathogen interactions, and signal transduction in tomato. This suggests that SUT2 may play an important role in these pathways (Figure 5c).

3.6. Altered Expression of Sugar Metabolism Pathway in SUT2 Knockout Fruits

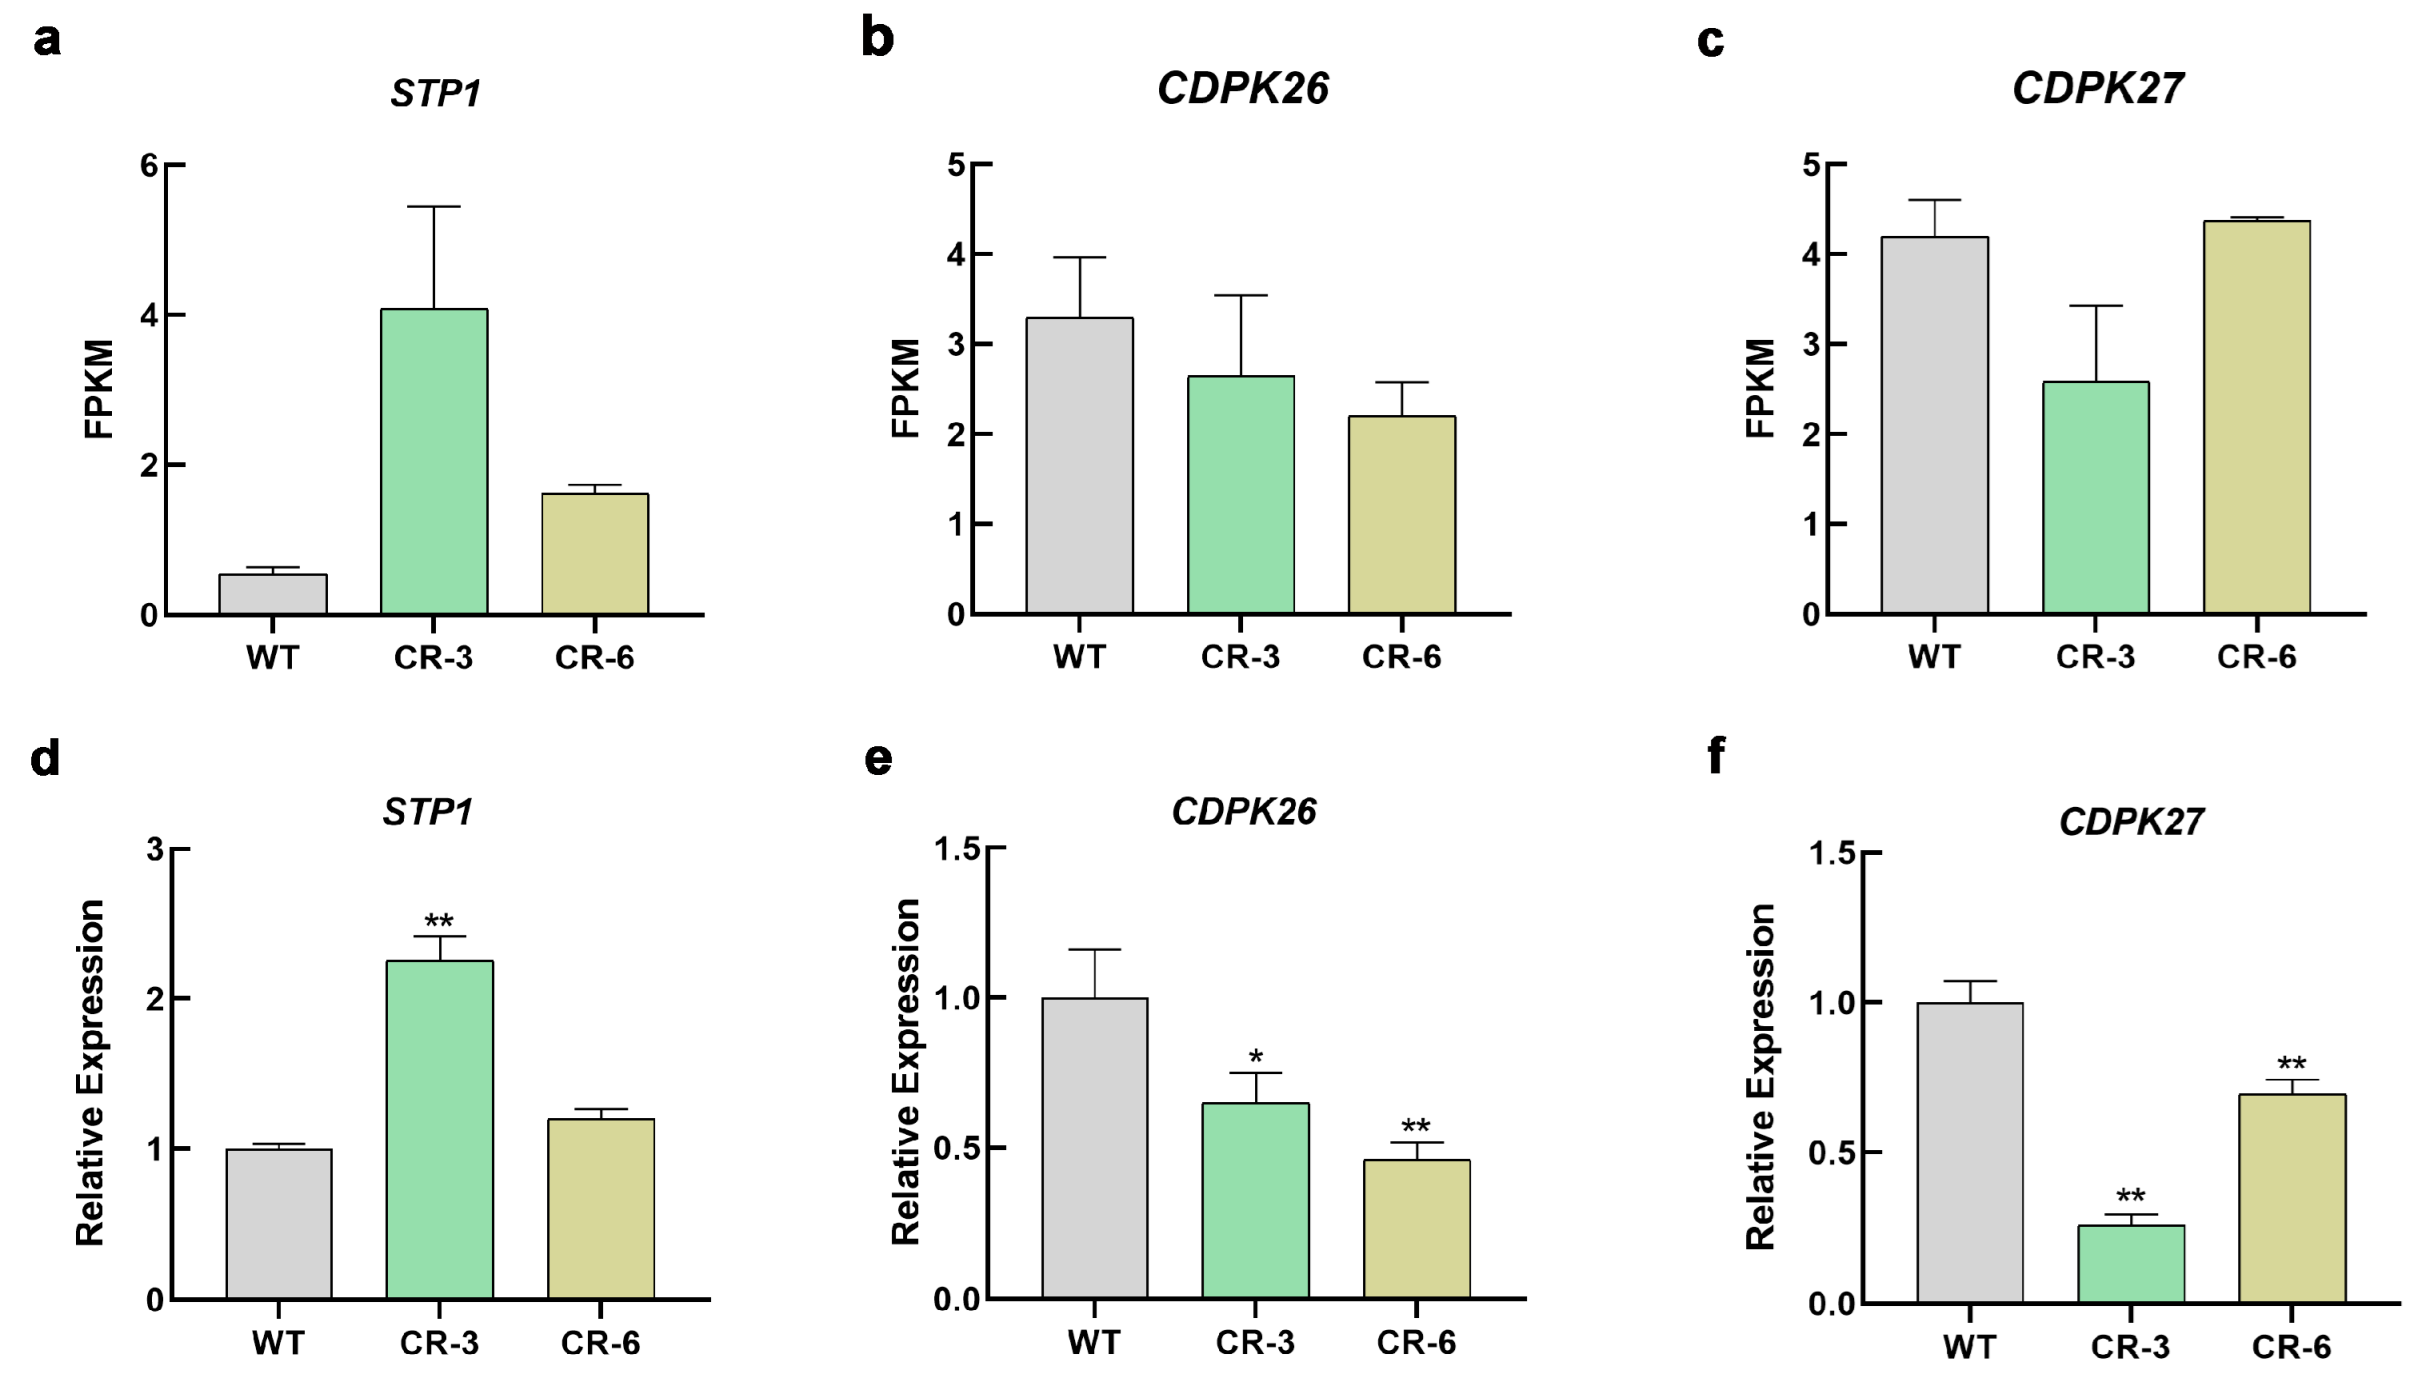
Our research shows that SUT2 is localized to the cell membrane and is capable of transporting sucrose from the extracellular space into the cell. However, in the SUT2-CR lines, the SSC in the fruit was found to increase, and previous studies have reported a decrease in sugar content in tomato fruits in SUT2-RNAi lines [34]. To explore the underlying causes of this phenomenon, we conducted an analysis of the transcriptome data. We focused on genes associated with the sugar metabolism pathway, and identified three differentially enriched genes, with one up-regulated and two down-regulated (Figure 6). Transcriptome data analysis showed that STP1 expression was up-regulated in knockout lines (Figure 6a), and the expression levels of CDPK26/27 were decreased in knockout lines (Figure 6b,c). Furthermore, in the knockout lines, the expression levels of the following genes were also altered: Sugar Transport Protein 2 (STP2), Tonoplast Monosaccharide Transporter 3 (TMT3), Fruit Sucrose Synthase (TOMSSF), Sucrose Phosphate Phosphatase, Invertase 5 (Lin5), Early-Responsive to Dehydration Protein-like (ERDL) and Sucrose Synthase (Figure S4a–g). Previous studies have demonstrated the positive regulatory role of STP1 in modulating sugar accumulation in tomato fruits [47], and CDPK26/27 acts as a negative regulator of sugar content in tomato fruits [48]. It is speculated that the increased sugar content resulting from SUT2 knockout might be attributed to the up-regulation of STP1 expression and down-regulation of CDPK26/27.
We analyzed the expression levels of relevant genes in the SUT2-CR lines. The results showed that the expression level of STP1 increased 2.3-fold and 1.2-fold in CR-3 and CR-6 lines (Figure 6d), respectively. The expression level of CDPK26 decreased by 35% and 54% (Figure 6e), while the expression level of CDPK27 decreased by 74% and 32% (Figure 6f), respectively. These findings were consistent with the transcriptome data, further supporting the hypothesis that the increased fruit sugar content in the SUT2-CR lines may be attributed to the altered expression levels of STP1 and CDPK26/27.

3.7. Low-Sugar Signaling Alters the Expression Levels of STP1 and CDPK26/27

The phenotypic differences observed between our knockout lines and the RNAi lines from previous studies may be attributed to variations in SUT2 expression levels [34]. Changes in SUT2 expression can directly impact sucrose content, and since sucrose functions as a signal, alterations in its levels may induce changes in the expression of genes involved in sugar accumulation.
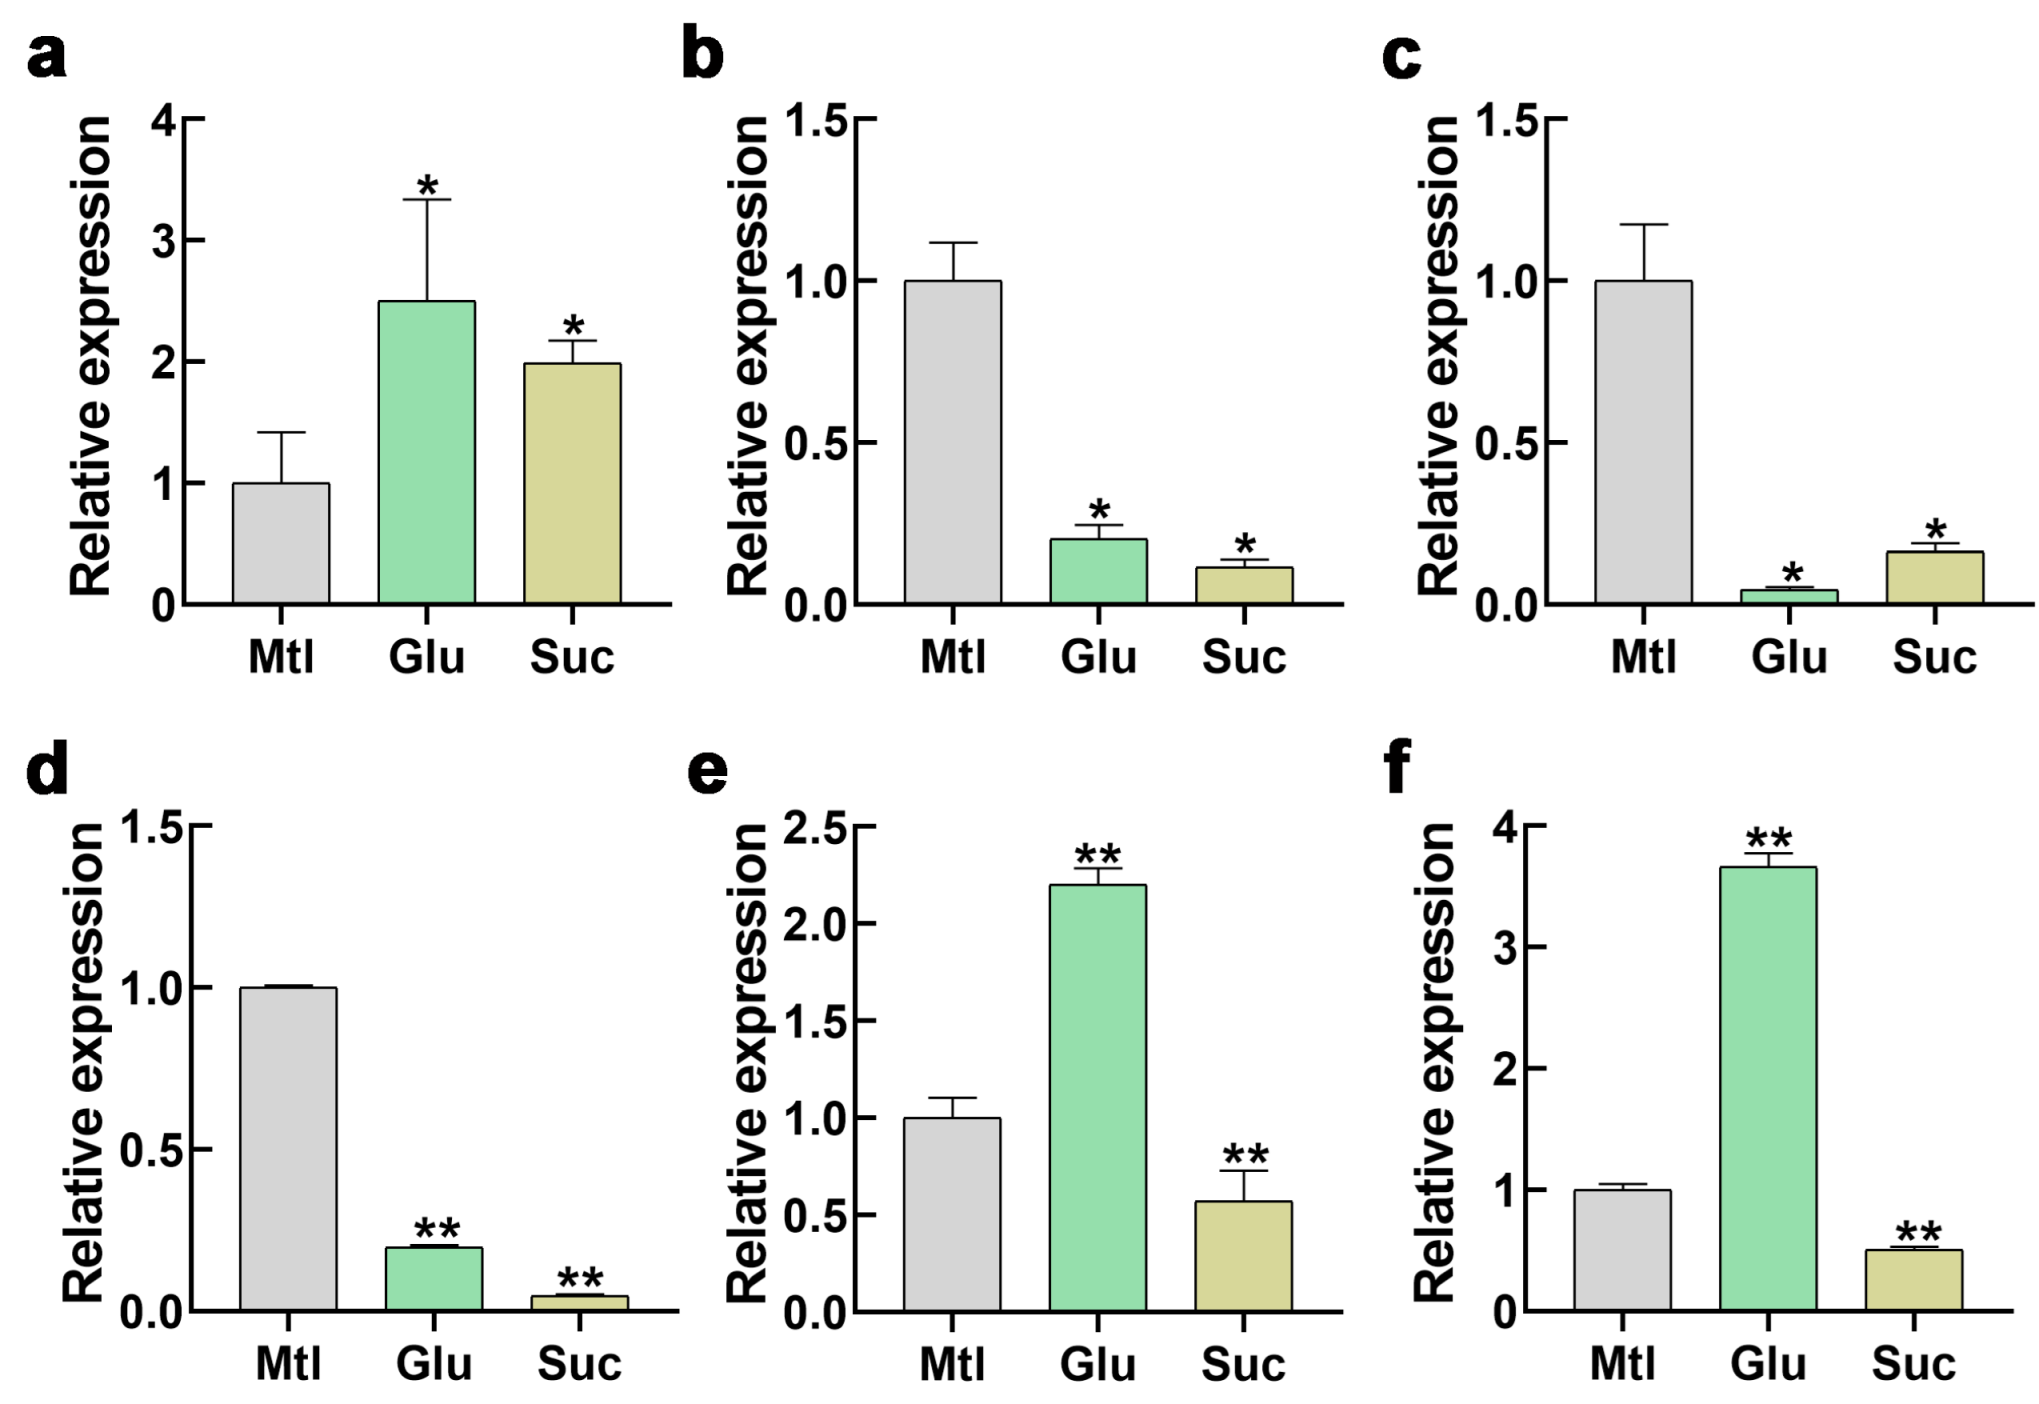
To investigate whether the expression of sugar accumulation related genes is regulated by sugar signaling, we treated the background material AC with 0.2% glucose, 0.2% sucrose, 2% glucose, and 2% sucrose, using 0.2% and 2% mannose as controls. Samples were collected 24 h post-treatment. The expression level of genes following sugar treatment was examined. At the 0.2% concentration, we observed that the relative expression of STP1 was enhanced 2.5-fold under glucose and 2.0-fold under sucrose conditions (Figure 7a), the expression of CDPK26 was reduced by 78% under glucose and 89% under sucrose conditions (Figure 7b). Additionally, the expression of CDPK27 was reduced by 96% under glucose and 84% under sucrose conditions (Figure 7c). At the 2% concentration, STP1 expression decreased by 80% under glucose and by 95% under sucrose conditions (Figure 7d), CDPK26 expression increased 2.2-fold under glucose but decreased by 43% under sucrose conditions (Figure 7e), and CDPK27 expression increased 3.7-fold under glucose but decreased by 49% under sucrose conditions (Figure 7f). These experimental results indicate that low-concentration sugar signals can increase the expression of STP1 and decrease the expression of CDPK26/27, in contrast to high-concentration sugar treatments. STP1 positively regulates sugar content in tomato fruits [47], whereas CDPK26/27 exerts negative regulation [48]. These findings provide an explanation for the increased sugar content in tomato fruits of SUT2-knockout lines.

4. Discussion

Higher plants harness photosynthesis to capture light energy and distribute the resulting photosynthates to sink organs via sugar transporters. In tomato, sucrose, the primary photosynthate, is critical for fruit quality, with sucrose transport and loading being essential processes. Known sugar transporters in tomato include SUT1, SUT2, and SUT4. Our analysis of published data reveals that SUT2 expression gradually decreased during fruit development, implying that SUT2 likely negatively regulates SSC accumulation in fruit quality [41]. Our study demonstrated that SUT2 localizes to the plasma membrane and mediates sucrose transport from the extracellular to intracellular compartments. Knockout of SUT2 induced up-regulation of STP1 while down-regulating CDPK26/27, ultimately elevating sugar accumulation in fruits [47,48].
Previous studies have shown that SUT2 exhibits glucose transport activity, and RNAi leads to a decrease in sugar content in tomato fruits [34]. We utilized the sugar-deficient yeast strains EBY.VW4000 and W303 to characterize the transport function of SUT2, confirming its high-affinity sucrose transport capability while demonstrating no detectable uptake of hexoses, including glucose and fructose (Figure 4).
Given the phenotypic discrepancy between our knockout line and previously reported RNAi lines, we performed RNA-seq to identify the potential mechanisms. Transcriptomic analysis revealed that SUT2 knockout substantially altered the expression levels of sugar metabolism-related genes, such as STP1 and CDPK26/27, indicating that decreased sucrose content triggers changes in the expression of other sugar-related genes, leading to enhanced fruit sugar content (Figure 6). Sugar signaling plays indispensable roles in plant growth and metabolism [9,49]. Altered expression of other sugar-related genes in SUT2-knockout fruits suggests that sucrose deficiency caused by functional loss of SUT2 triggers low-glucose signaling, subsequently modifying gene expression profiles. To validate this hypothesis, sugar induction experiments at varying concentrations were conducted. Quantitative analyses revealed that high sucrose/glucose concentrations suppressed STP1 expression while promoting CDPK26/27, and low sucrose/glucose concentrations induced STP1 expression while repressing CDPK26/27 (Figure 7). These results demonstrate concentration-dependent regulatory divergence in sucrose/glucose-mediated control of STP1 and CDPK26/27.
Additionally, elevated expression of STP2 and TMT3 in the knockout line may contribute to increased sugar content (Figure S4a,b), but there further investigation is still required. In addition to altered expression of genes potentially involved in direct sugar transport, fruit Sucrose synthase gene expression was elevated (Supplementary Figure S4). Concurrently, significant decreases were observed in expression levels of TOMSSF, Sucrose phosphate phosphatase, Lin5, ERDL, and sucrose synthase (Figure S4c–g). These transcriptional changes may collectively contribute to altered sugar accumulation in fruits, though the precise molecular mechanisms require further investigation.
Beyond altered sugar levels, SUT2 knockout significantly reduced fruit size—consistent with RNAi-mediated suppression phenotypes. Numerous studies have demonstrated that fruit size regulation not only involves cell division and expansion but also depends on phytohormone levels, including auxin and gibberellin [50]. Transcriptome analysis revealed down-regulated Tomato AGAMOUS-like 1 (TAGL1) (a positive regulator) and up-regulated expression of CLAVATA1 (CLV1) (a negative regulator), potentially explaining the size reduction, though the underlying mechanisms warrant deeper exploration (Supplementary Figure S4h,i) [51,52].
Our study reveals that SUT2 functions as a sucrose transporter. Knockout of SUT2 might trigger a low-sugar signal due to decreased sucrose levels, altering the expression of STP1 and CDPK26/27, which results in increased sugar accumulation in fruit. CRISPR-Cas9-mediated SUT2 gene editing significantly increased sugar content in tomato fruits (Figure 2), highlighting the potential for genetic modification to enhance fruit quality.

5. Conclusions

This study reveals the functional role of SUT2 in sugar accumulation in tomato fruits. SUT2 expression progressively decreases during the fruit ripening stage, and knocking out SUT2 results in significantly increased sugar content in fruits. SUT2 encodes a plasma membrane-localized protein and is classified as a constitutively expressed gene. Yeast transport assays demonstrated that SUT2 imports sucrose from the apoplast into the cytosol. Transcriptome analysis indicated that the elevated sugar content in SUT2-knockout fruits may result from the induced expression of STP1 while simultaneously suppressing the expression of CDPK26/27.

Supplementary Materials

The following supporting information can be downloaded at: https://www.mdpi.com/article/10.3390/horticulturae11080956/s1. Figure S1: Phenotypic characterization of SUT2 knockout (CR) lines and verification of gene editing; Figure S2: Analysis of sugar and organic acid contents in leaves of SUT2-knockout lines; Figure S3: Analysis of SUT2 transmembrane structure and expression in fruit; Figure S4: Expression of sugar-related and fruit size-related genes in SUT2-CR lines; Table S1: List of primers used in this study.

Author Contributions

Conceptualization, P.G. and Y.Z.; methodology, P.G. and Y.Z.; validation, P.G., Y.W., and Y.C.; formal analysis, P.G., Y.W., F.L., and X.Z.; investigation, P.G., Y.W., and Y.C.; data curation, J.L., H.X., Y.Y., and Z.W.; writing—original draft preparation, P.G.; writing—review and editing, P.G. and Y.Z.; visualization, P.Z., H.X., Y.Y., and Z.W.; supervision, Y.Z.; funding acquisition, Y.Z. All authors have read and agreed to the published version of the manuscript.

Funding

This study was funded by the National Key Research and Development Plan (2022YFD1200502; 2021YFD1200201-06); National Natural Science Foundation of China (32372696); Funds for High-Quality Development of Hubei Seed Industry (HBZY2023B004); Hubei Agriculture Research System (2024HBSTX4-06); and Funds of National Key Laboratory for Germplasm Innovation and Utilization of Horticultural Crops (Horti-3Y-2024-008).

Data Availability Statement

The data used and presented in this paper are available upon request from the corresponding author.

Conflicts of Interest

The authors declare no conflict of interest.

References

  1. Ruan, Y.L. Sucrose metabolism: Gateway to diverse carbon use and sugar signaling. Annu. Rev. Plant Biol. 2014, 65, 33–67. [Google Scholar] [CrossRef] [PubMed]
  2. Sun, L.X.; Deng, R.L.; Liu, J.W.; Lai, M.Y.; Wu, J.W.; Liu, X.D.; Shahid, M.Q. An overview of sucrose transporter (SUT) genes family in rice. Mol. Biol. Rep. 2022, 49, 5685–5695. [Google Scholar] [CrossRef] [PubMed]
  3. Ljung, K.; Nemhauser, J.L.; Perata, P. New mechanistic links between sugar and hormone signalling networks. Curr. Opin. Plant Biol. 2015, 25, 130–137. [Google Scholar] [CrossRef]
  4. Ruan, Y.L.; Jin, Y.; Yang, Y.J.; Li, G.J.; Boyer, J.S. Sugar input, metabolism, and signaling mediated by invertase: Roles in development, yield potential, and response to drought and heat. Mol. Plant 2010, 3, 942–955. [Google Scholar] [CrossRef] [PubMed]
  5. Tsai, A.Y.L.; Gazzarrini, S. Trehalose-6-phosphate and SnRK1 kinases in plant development and signaling: The emerging picture. Front Plant Sci. 2014, 5, 119. [Google Scholar] [CrossRef]
  6. De Schepper, V.; De Swaef, T.; Bauweraerts, I.; Steppe, K. Phloem transport: A review of mechanisms and controls. J. Exp. Bot. 2013, 64, 4839–4850. [Google Scholar] [CrossRef]
  7. Milne, R.J.; Perroux, J.M.; Rae, A.L.; Reinders, A.; Ward, J.M.; Offler, C.E.; Patrick, J.W.; Grof, C.P.L. Sucrose transporter localization and function in phloem unloading in developing stems. Plant Physiol. 2017, 173, 1330–1341. [Google Scholar] [CrossRef]
  8. Ren, Y.; Sun, H.H.; Zong, M.; Guo, S.G.; Ren, Z.J.; Zhao, J.Y.; Li, M.Y.; Zhang, J.; Tian, S.W.; Wang, J.F.; et al. Localization shift of a sugar transporter contributes to phloem unloading in sweet watermelons. New Phytol. 2020, 227, 1858–1871. [Google Scholar] [CrossRef]
  9. Guo, W.J.; Pommerrenig, B.; Neuhaus, H.E.; Keller, I. Interaction between sugar transport and plant development. J. Plant Physiol. 2023, 288, 154073. [Google Scholar] [CrossRef]
  10. Pommerrenig, B.; Ludewig, F.; Cvetkovic, J.; Trentmann, O.; Klemens, P.a.W.; Neuhaus, H.E. In concert: Orchestrated changes in carbohydrate homeostasis are critical for plant abiotic stress tolerance. Plant Cell Physiol. 2018, 59, 1290–1299. [Google Scholar] [CrossRef]
  11. Büttner, M. The monosaccharide transporter(-like) gene family in Arabidopsis. FEBS Lett. 2007, 581, 2318–2324. [Google Scholar] [CrossRef]
  12. Cho, M.H.; Lim, H.; Shin, D.H.; Jeon, J.S.; Bhoo, S.H.; Park, Y.I.; Hahn, T.R. Role of the plastidic glucose translocator in the export of starch degradation products from the chloroplasts in Arabidopsis thaliana. New Phytol. 2011, 190, 101–112. [Google Scholar] [CrossRef]
  13. Klemens, P.a.W.; Patzke, K.; Trentmann, O.; Poschet, G.; Buttner, M.; Schulz, A.; Marten, I.; Hedrich, R.; Neuhaus, H.E. Overexpression of a proton-coupled vacuolar glucose exporter impairs freezing tolerance and seed germination. New Phytol. 2014, 202, 188–197. [Google Scholar] [CrossRef] [PubMed]
  14. Strobl, S.M.; Kischka, D.; Heilmann, I.; Mouille, G.; Schneider, S. The tonoplastic inositol transporter INT1 from Arabidopsis thaliana impacts cell elongation in a sucrose-dependent way. Front Plant Sci 2018, 9, 1657. [Google Scholar] [CrossRef]
  15. Doidy, J.; Grace, E.; Kühn, C.; Simon-Plas, F.; Casieri, L.; Wipf, D. Sugar transporters in plants and in their interactions with fungi. Trends Plant Sci. 2012, 17, 413–422. [Google Scholar] [CrossRef] [PubMed]
  16. Kühn, C.; Grof, C.P.L. Sucrose transporters of higher plants. Curr. Opin. Plant Biol. 2010, 13, 287–298. [Google Scholar] [CrossRef]
  17. Reddy, V.S.; Shlykov, M.A.; Castillo, R.; Sun, E.I.; Saier, M.H. The major facilitator superfamily (MFS) revisited. FEBS J. 2013, 280, 3975. [Google Scholar] [CrossRef] [PubMed]
  18. Sauer, N. Molecular physiology of higher plant sucrose transporters. FEBS Lett. 2007, 581, 2309–2317. [Google Scholar] [CrossRef]
  19. Yan, N. Structural advances for the major facilitator superfamily (MFS) transporters. Trends Biochem. Sci. 2013, 38, 151–159. [Google Scholar] [CrossRef]
  20. Lu, R.F.; Guyer, D.E.; Beaudry, R.M. Determination of firmness and sugar content of apples using near-infrared diffuse reflectance. J. Texture Stud. 2000, 31, 615–630. [Google Scholar] [CrossRef]
  21. Gong, X.; Liu, M.L.; Zhang, L.J.; Ruan, Y.Y.; Ding, R.; Ji, Y.Q.; Zhang, N.; Zhang, S.B.; Farmer, J.; Wang, C. Arabidopsis AtSUC2 and AtSUC4, encoding sucrose transporters, are required for abiotic stress tolerance in an ABA-dependent pathway. Physiol. Plant. 2015, 153, 119–136. [Google Scholar] [CrossRef] [PubMed]
  22. Hirose, T.; Zhang, Z.J.; Miyao, A.; Hirochika, H.; Ohsugi, R.; Terao, T. Disruption of a gene for rice sucrose transporter, OsSUT1, impairs pollen function but pollen maturation is unaffected. J. Exp. Bot. 2010, 61, 3639–3646. [Google Scholar] [CrossRef] [PubMed]
  23. Wang, X.W.; Liu, X.L.; Hu, Z.; Bao, S.H.; Xia, H.H.; Feng, B.; Ma, L.; Zhao, G.M.; Zhang, D.C.; Hu, Y.B. Essentiality for rice fertility and alternative splicing of OsSUT1. Plant Sci. 2022, 314, 111065. [Google Scholar] [CrossRef]
  24. Baker, R.F.; Leach, K.A.; Boyer, N.R.; Swyers, M.J.; Benitez-Alfonso, Y.; Skopelitis, T.; Luo, A.; Sylvester, A.; Jackson, D.; Braun, D.M. Sucrose transporter ZmSUT1 expression and localization uncover new insights into sucrose phloem loading. Plant Physiol. 2016, 172, 1876–1898. [Google Scholar] [CrossRef] [PubMed]
  25. Leach, K.A.; Tran, T.M.; Slewinski, T.L.; Meeley, R.B.; Braun, D.M. Sucrose transporter 2 contributes to maize growth, development, and crop yield. J. Integr. Plant Biol 2017, 59, 390–408. [Google Scholar] [CrossRef]
  26. Islam, M.Z.; Jin, L.F.; Shi, C.Y.; Liu, Y.Z.; Peng, S.A. Citrus sucrose transporter genes: Genome-wide identification and transcript analysis in ripening and ABA-injected fruits. Tree Genet. Genom. 2015, 11, 97. [Google Scholar] [CrossRef]
  27. Wen, S.Y.; Neuhaus, H.E.; Cheng, J.T.; Bie, Z.L. Contributions of sugar transporters to crop yield and fruit quality. J. Exp. Bot. 2022, 73, 2275–2289. [Google Scholar] [CrossRef]
  28. Peng, Q.; Cai, Y.M.; Lai, E.H.; Nakamura, M.; Liao, L.; Zheng, B.B.; Ogutu, C.; Cherono, S.; Han, Y.P. The sucrose transporter MdSUT4.1 participates in the regulation of fruit sugar accumulation in apple. BMC Plant Biol. 2020, 20, 191. [Google Scholar] [CrossRef]
  29. Ma, Q.J.; Sun, M.H.; Lu, J.; Liu, Y.J.; Hu, D.G.; Hao, Y.J. Transcription factor AREB2 is involved in soluble sugar accumulation by activating sugar transporter and amylase genes. Plant Physiol. 2017, 174, 2348–2362. [Google Scholar] [CrossRef] [PubMed]
  30. Ma, Q.J.; Sun, M.H.; Kang, H.; Lu, J.; You, C.X.; Hao, Y.J. A CIPK protein kinase targets sucrose transporter MdSUT2.2 at Ser254 for phosphorylation to enhance salt tolerance. Plant Cell Environ. 2019, 42, 918–930. [Google Scholar] [CrossRef]
  31. Liang, Y.F.; Bai, J.Y.; Xie, Z.L.; Lian, Z.Y.; Guo, J.; Zhao, F.Y.; Liang, Y.; Huo, H.Q.; Gong, H.J. Tomato sucrose transporter SlSUT4 participates in flowering regulation by modulating gibberellin biosynthesis. Plant Physiol. 2023, 192, 1080–1098. [Google Scholar] [CrossRef]
  32. Chiou, T.J.; Bush, D.R. Sucrose is a signal molecule in assimilate partitioning. Proc. Natl. Acad. Sci. USA 1998, 95, 4784–4788. [Google Scholar] [CrossRef]
  33. Laurence, B.; Christina, K.; Andreas, W.; Alexander, S.; Christiane, G.; Brigitte, H.; Hanjo, H.; Waltraud, S.; John, M.W.; John, M.W. SUT2, a putative sucrose sensor in sieve elements. Plant Cell 2000, 12, 1153–1164. [Google Scholar] [CrossRef]
  34. Hackel, A.; Schauer, N.; Carrari, F.; Fernie, A.R.; Grimm, B.; Kühn, C. Sucrose transporter LeSUT1 and LeSUT2 inhibition affects tomato fruit development in different ways. Plant J. 2006, 45, 180–192. [Google Scholar] [CrossRef] [PubMed]
  35. Ouyang, B.; Chen, Y.H.; Li, H.X.; Qian, C.J.; Huang, S.L.; Ye, Z.B. Transformation of tomatoes with osmotin and chitinase genes and their resistance to Fusarium wilt. J. Horticult. Sci. Biotechnol. 2005, 80, 517–522. [Google Scholar] [CrossRef]
  36. Zhang, Y.; Ming, R.H.; Khan, M.; Wang, Y.; Dahro, B.; Xiao, W.; Li, C.L.; Liu, J.H. ERF9 of Poncirus trifoliata (L.) Raf. undergoes feedback regulation by ethylene and modulates cold tolerance via regulating a glutathione S-transferase U17 gene. Plant Biotechnol. J. 2022, 20, 183–200. [Google Scholar] [CrossRef]
  37. Tian, Z.D.; He, Q.; Wang, H.X.; Liu, Y.; Zhang, Y.; Shao, F.; Xie, C.H. The potato ERF transcription factor StERF3 negatively regulates resistance to phytophthora infestans and salt tolerance in potato. Plant Cell Physiol. 2015, 56, 992–1005. [Google Scholar] [CrossRef]
  38. Wang, Y.; Gai, W.X.; Yuan, L.D.; Shang, L.L.; Li, F.M.; Gong, Z.; Ge, P.F.; Wang, Y.R.; Tao, J.B.; Zhang, X.Y.; et al. Heat-inducible SlWRKY3 confers thermotolerance by activating the SlGRXS1 gene cluster in tomato. Hortic Plant J 2024, 10, 515–531. [Google Scholar] [CrossRef]
  39. Fan, R.C.; Peng, C.C.; Xu, Y.H.; Wang, X.F.; Li, Y.; Shang, Y.; Du, S.Y.; Zhao, R.; Zhang, X.Y.; Zhang, L.Y.; et al. Apple sucrose transporter SUT1 and sorbitol transporter SOT6 interact with cytochrome b5 to regulate their affinity for substrate sugars. Plant Physiol. 2009, 150, 1880–1901. [Google Scholar] [CrossRef] [PubMed]
  40. Morita, T.; Takegawa, K. A simple and efficient procedure for transformation of schizosaccharomyces pombe. Yeast 2004, 21, 613–617. [Google Scholar] [CrossRef]
  41. Li, J.Y.; Sun, B.L.; Xu, Q.Q.; Jiang, L.B.; Wang, N. Transcriptome-level analysis of gene expressions in different tissues of tomato and key gene identifications during seed germination. Sci. Hortic. 2024, 337, 113565. [Google Scholar] [CrossRef]
  42. Kanayama, Y. Sugar Metabolism and Fruit Development in the Tomato. Horticult J. 2017, 86, 417–425. [Google Scholar] [CrossRef]
  43. Dong, H.Q.; Li, F.M.; Xuan, X.X.; Ahiakpa, J.K.; Tao, J.B.; Zhang, X.Y.; Ge, P.F.; Wang, Y.R.; Gai, W.X.; Zhang, Y.Y. The genetic basis and improvement of photosynthesis in tomato. Hortic Plant J 2025, 11, 69–84. [Google Scholar] [CrossRef]
  44. Wieczorke, R.; Krampe, S.; Weierstall, T.; Freidel, K.; Hollenberg, C.P.; Boles, E. Concurrent knock-out of at least 20 transporter genes is required to block uptake of hexoses in Saccharomyces cerevisiae. FEBS Lett. 1999, 464, 123–128. [Google Scholar] [CrossRef] [PubMed]
  45. Wen, S.Y.; Bao, T.Y.; Zeng, X.W.; Bie, Z.L.; Cheng, J.T. CsHT11 encodes a pollen-specific hexose transporter and is induced under high level sucrose in pollen tubes of cucumber (Cucumis sativus). Plant Growth Regul. 2020, 90, 237–248. [Google Scholar] [CrossRef]
  46. Patzke, K.; Prananingrum, P.; Klemens, P.a.W.; Trentmann, O.; Rodrigues, C.M.; Keller, I.; Fernie, A.R.; Geigenberger, P.; Bölter, B.; Lehmann, M.; et al. The plastidic sugar transporter pSuT influences flowering and affects cold responses. Plant Physiol. 2019, 179, 569–587. [Google Scholar] [CrossRef]
  47. Wang, Y.; Shi, C.M.; Ge, P.F.; Li, F.M.; Zhu, L.H.; Wang, Y.R.; Tao, J.B.; Zhang, X.Y.; Dong, H.Q.; Gai, W.X.; et al. A 21-bp InDel in the promoter of STP1 selected during tomato improvement accounts for soluble solid content in fruits. Hortic. Res. 2023, 10, uhad009. [Google Scholar] [CrossRef]
  48. Zhang, J.Z.; Lyu, H.; Chen, J.; Cao, X.; Du, R.; Ma, L.; Wang, N.; Zhu, Z.G.; Rao, J.L.; Wang, J.; et al. Releasing a sugar brake generates sweeter tomato without yield penalty. Nature 2024, 635, 647–656. [Google Scholar] [CrossRef]
  49. Zou, W.J.; Yu, Q.; Ma, Y.; Sun, G.N.; Feng, X.; Ge, L. Pivotal role of heterotrimeric G protein in the crosstalk between sugar signaling and abiotic stress response in plants. Plant Physiol. Biochem. 2024, 210, 108567. [Google Scholar] [CrossRef]
  50. Niu, S.B.; He, Y.; Yan, S.W.; Sun, Z.L.; Cai, R.; Zhang, Y. Histological, transcriptomic, and gene functional analyses reveal the regulatory events underlying gibberellin-induced parthenocarpy in tomato. Hortic. Plant J. 2024, 10, 156–170. [Google Scholar] [CrossRef]
  51. Guan, H.L.; Yang, X.L.; Lin, Y.X.; Xie, B.X.; Zhang, X.Y.; Ma, C.J.; Xia, R.; Chen, R.Y.; Hao, Y.W. The hormone regulatory mechanism underlying parthenocarpic fruit formation in tomato. Front Plant Sci. 2024, 15, 1404980. [Google Scholar] [CrossRef] [PubMed]
  52. Xu, C.; Liberatore, K.L.; Macalister, C.A.; Huang, Z.J.; Chu, Y.H.; Jiang, K.; Brooks, C.; Ogawa-Ohnishi, M.; Xiong, G.Y.; Pauly, M.; et al. A cascade of arabinosyltransferases controls shoot meristem size in tomato. Nat. Genet. 2015, 47, 784–792. [Google Scholar] [CrossRef] [PubMed]
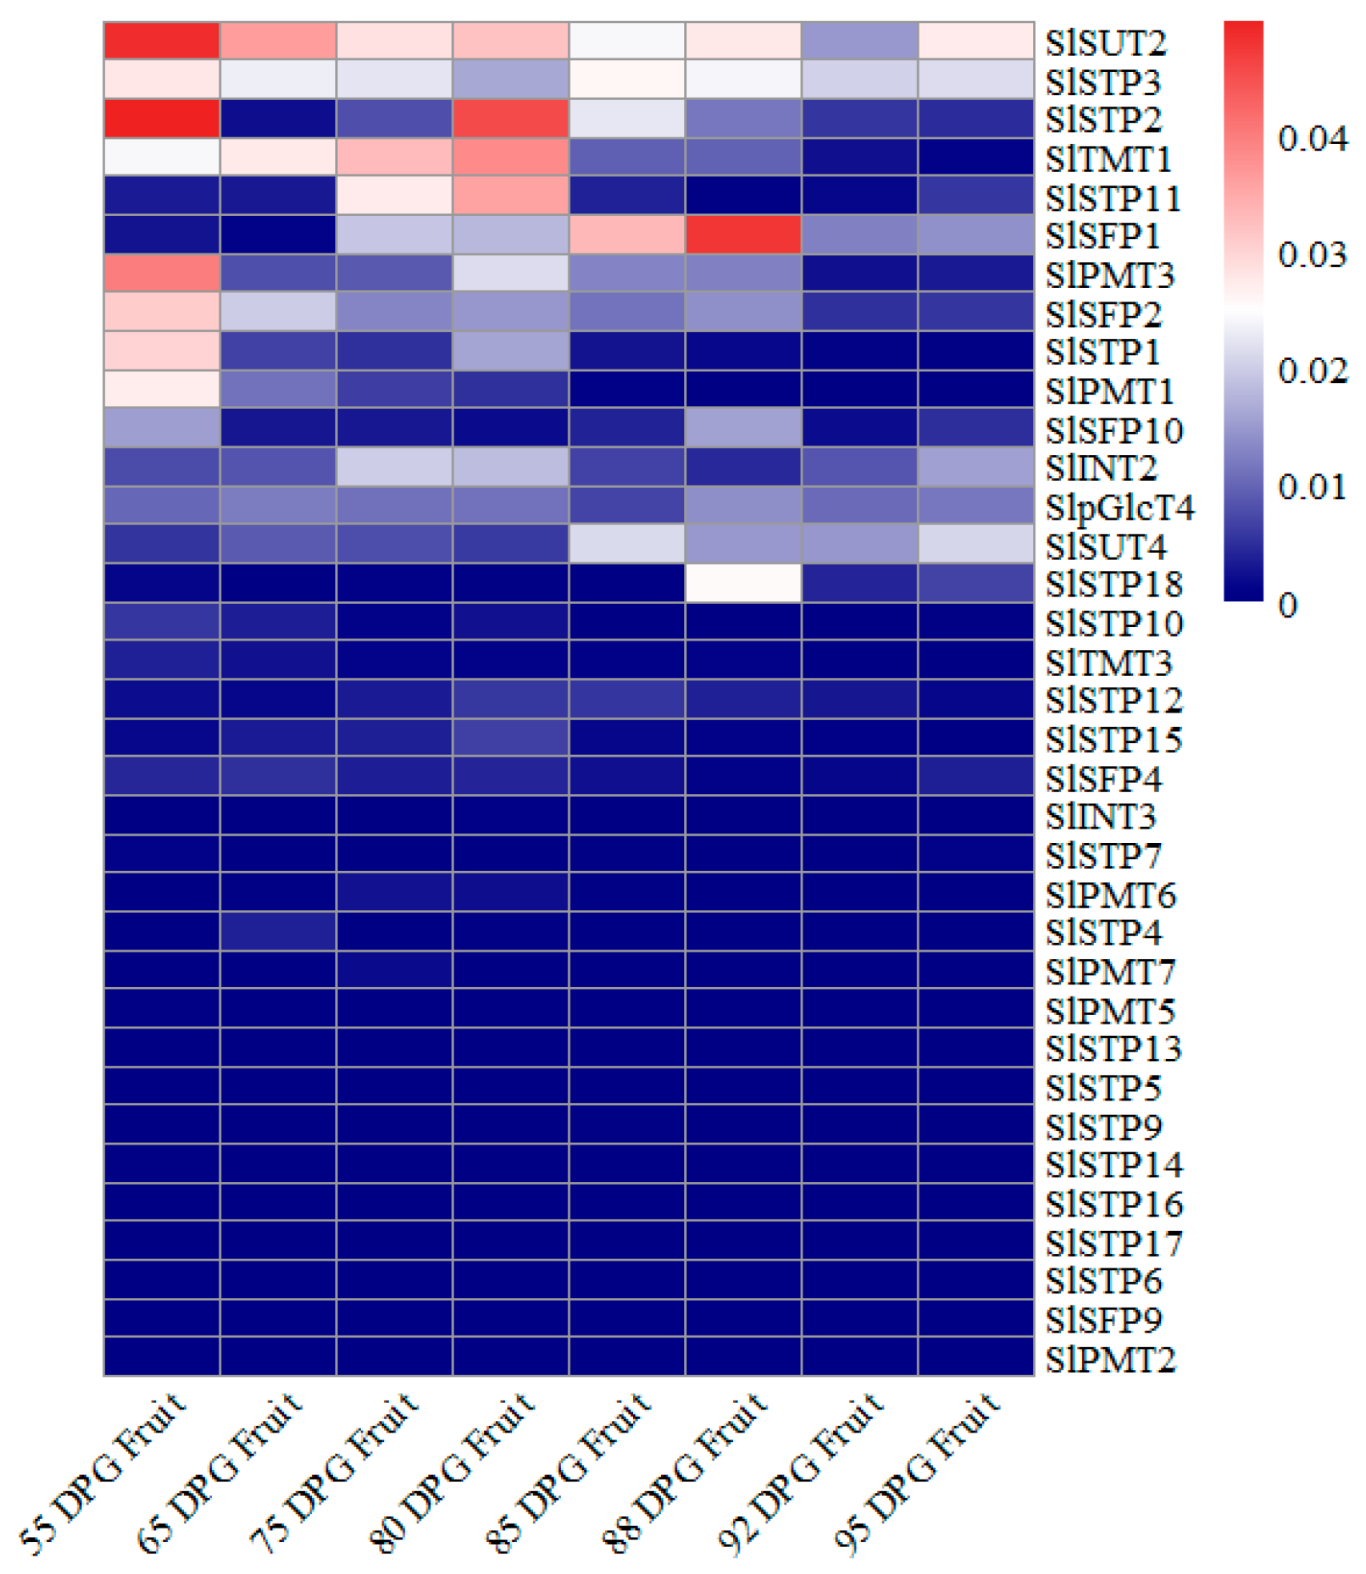
Figure 1. Expression patterns of sugar transporter in fruit ripening process. RNA seq data was retrieved from Li et al. (2024) [41] and normalized against actin gene. DPG means days post seed germination.
Horticulturae 11 00956 g001
Figure 2. Phenotypes of red-ripe fruits in the SUT2 knockout (CR) lines. (a) Mutation types of SUT2 in the CRISPR lines. WT represents the wild type Ailsa Craig (AC). CR-3 has a 1 bp insertion at the first target and a 1 bp deletion at the second target. CR-6 has a 1 bp insertion at the first target. The boxed sequence denotes the PAM sequence. (b) Soluble solids content (SSC) of WT and SUT2-CR lines. c–g. Sucrose content (c), glucose content (d), fructose content (e), citric acid content (f), and malic acid content (g) of the WT and SUT2-CR lines. The data represent means ± standard deviation. Apart from the measurement of SSC, which employed twelve replicates, all other analyses in this study were performed using three replicates. Asterisks indicate significant differences: “**” p < 0.01.
Horticulturae 11 00956 g002
Figure 3. SUT2 localization and expression analysis. (a) Subcellular localization assay in tobacco leaves confirmed SUT1 localization on the plasma membrane, as demonstrated by the complete overlap of its yellow fluorescence with the plasma membrane-specific red fluorescent marker. (b) The fluorescence intensity along the white lines indicated in panel (a) was quantified, using green to represent the signal instead of yellow. (c) Tissue-specific expression analysis of SUT2. “R” indicates root, “S” indicates stem, “L” indicates leaf, “F” indicates flower, “IM” indicates immature fruit, “MG” indicates mature green fruit, “BR” indicates breaker fruit, “YR” indicates yellow ripe fruit, and “RR” indicates red-ripe fruit. The data represent the means ± standard deviation (n = 3).
Horticulturae 11 00956 g003
Figure 4. Hexose transport activity analysis of heterologously expressed SUT2 in the yeast strains EBY.VW4000 and W303. a-d. The transformed yeast strain EBY.VW4000 grew on SD/-Ura (maltose) (a), SD/-Ura (glucose) (b), SD/-Ura (fructose) (c) and SD/-Ura (galactose) (d) media. In this figure, 1, 10, 102, and 103 represent the dilution factors. PDR196 was the negative control and CsHT11 was the positive control. (e) Blue fluorescent substances (Esculin) were found in the cytoplasm, indicating that SUT2 has a sucrose transport function; the right panel graphically quantifies the fluorescence intensity along the white lines indicated in the left panel. The empty vector PDR196 is a negative control, while AtSUC2 with sucrose transport activity serves as a positive control.
Horticulturae 11 00956 g004
Figure 5. RNA-seq analysis of SUT2-CR lines and WT. (a) Venn diagram of differentially expressed genes. (b) A GO enrichment scatterplot. The x-axis represents the ratio of the number of differentially expressed genes annotated to the GO items to the total number of differentially expressed genes, and the y-axis represents the GO items. (c) Column chart of KEGG enrichment analysis. The x-axis represents KEGG pathways, and the y-axis represents the significance level of KEGG pathway enrichment, represented by −log10 (padj).
Horticulturae 11 00956 g005
Figure 6. Expression level of genes involved in sugar transportation and accumulation in SUT2-CR lines. (ac). FPKM values of differentially expressed genes of STP1 (a), CDPK26 (b), and CDPK27 (b) in WT, CR-3, and CR-6 lines based on RNA-seq. (df). qRT-PCR quantification of expression of STP1 (d), CDPK26 (e), and CDPK27 (f) in SUT2-CR lines. Data represent means ± standard deviation (n = 3). Asterisks indicate significant differences: “*” p < 0.05, “**” p < 0.01.
Horticulturae 11 00956 g006
Figure 7. The relative expression levels of STP1, CDPK26, and CDPK27 induced by glucose and sucrose. (ac). The relative expression levels of STP1 (a), CDPK26 (b), and CDPK27 (c) induced by 0.2% glucose and 0.2% sucrose. (df). The relative expression levels of STP1 (d), CDPK26 (e), and CDPK27 (f) induced by 2% glucose and 2% sucrose. Mtl represents the negative control mannitol, Glu represents glucose, and Suc represents sucrose. The data represent the means ± standard deviation (n = 3). The asterisks indicate significant differences: “*” p < 0.05, “**” p < 0.01.
Horticulturae 11 00956 g007
Disclaimer/Publisher’s Note: The statements, opinions and data contained in all publications are solely those of the individual author(s) and contributor(s) and not of MDPI and/or the editor(s). MDPI and/or the editor(s) disclaim responsibility for any injury to people or property resulting from any ideas, methods, instructions or products referred to in the content.