Article

Comparative Genomic Analysis of Wild Cymbidium Species from Fujian Using Whole-Genome Resequencing

1
College of Landscape Architecture and Art, Fujian Agriculture and Forestry University, Fuzhou 350002, China
2
The Key Laboratory of Timber Forest, Breeding and Cultivation for Mountainous Areas in Southern China of China National Forestry and Grassland Bureau and the Key Laboratory of Forest Culture and Forest Product Processing Utilization of Fujian Province, Fujian Academy of Forestry Sciences, Fuzhou 350012, China
3
Department of Forest and Conservation Sciences, Faculty of Forestry, The University of British Columbia, Vancouver, BC V6T 1Z4, Canada
4
Fujian Satellite Data Development Co., Ltd., Fuzhou 350025, China
5
Administration Office of Yongtai Tengshan Provincial Nature Reserve, Fuzhou 350700, China
6
Administration Office of Shaowu Jiangshi Provincial Nature Reserve, Shaowu 354011, China
7
Fujian Provincial Minhou Nanyu National Forest Farm, Fuzhou 350109, China
8
Administration Office of Fujian Huboliao National Nature Reserve, Nanjing 363600, China
9
Administration Office of Fujian Xiongjiang Huangchulin National Nature Reserve, Fuzhou 350800, China
*
Author to whom correspondence should be addressed.
Horticulturae 2025, 11(8), 944; https://doi.org/10.3390/horticulturae11080944
Submission received: 26 June 2025 / Revised: 5 August 2025 / Accepted: 6 August 2025 / Published: 11 August 2025
(This article belongs to the Section Genetics, Genomics, Breeding, and Biotechnology (G2B2))

Abstract

In this study, we performed whole-genome resequencing (WGS) to investigate genomic variation and functional divergence among four wild Cymbidium species—C. ensifolium, C. sinense, C. kanran, and C. floribundum—collected from Fujian Province, China. A total of 350.58 Gbp of high-quality sequencing data was obtained from 13 samples, enabling comprehensive identification of SNPs and InDels. Genomic variants were unevenly distributed, with lower variation in gene-rich regions and higher levels in non-coding areas. Circos plots and variant density heatmaps revealed significant regional differences across chromosomes, with longer chromosomes exhibiting greater variant enrichment in 1 Mb windows. C. floribundum harbored the highest number of nonsynonymous SNPs and InDel-associated genes, whereas C. sinense and C. kanran had fewer mutations. KEGG pathway enrichment analysis revealed species-specific functional divergence, particularly in metabolism, stress response, and secondary metabolite biosynthesis. Population structure analysis and principal component analysis (PCA) indicated genetic differentiation among these species Notably, C. kanran exhibited high within-population genetic diversity. These findings provide essential genomic resources for the conservation and functional studies of wild Cymbidium species in subtropical China.

1. Introduction

The orchid genus Cymbidium is globally recognized as an important ornamental plant, admired for its unique flower shapes and rich cultural significance. It holds a prominent position in the horticultural industry and also possesses notable medicinal and ecological value [1]. As one of the centers of origin and diversity for orchids, China, particularly Fujian Province, has rich Orchidaceae species resources owing to its complex topography and diverse climatic conditions. Fujian serves as a key region for both the natural distribution and artificial cultivation of orchids [2,3]. The orchid species in Fujian exhibit a high level of diversity, not only in species composition but also in their genetic adaptability and potential for differentiation. However, in recent years, orchid populations in the wild have been severely threatened by habitat degradation, overharvesting, and climate change, leading to a decline in genetic diversity [4].
Genetic diversity is essential for the adaptation of plants to environmental changes, the stability of populations, and the realization of long-term evolutionary potential [5]. The application of whole-genome sequencing (WGS) technology enables efficient and comprehensive analysis of the genetic background of species, providing new avenues for understanding genetic diversity, population structure, and adaptive evolution [6]. Through whole-genome alignment and variant detection, researchers can systematically identify single-nucleotide polymorphisms (SNPs) and insertions/deletions (InDels), which help in analyzing population structure, genetic differentiation, and evolutionary history [7]. This approach has been widely applied to crops, fruit trees, and some wild plants, greatly enhancing our understanding of genetic diversity, adaptive genes, and the selection of optimal domestication pathways; such insights facilitate the reconstruction and optimization of domestication pathways by revealing how specific genes or alleles have been selected during domestication processes, thus guiding the development of improved cultivars with desirable agronomic traits [8,9]. In orchid genetics research, numerous population genetic studies have focused on cultivated species of high economic value such as Phalaenopsis spp. and Dendrobium spp., which have revealed mechanisms related to gene family expansion, photosynthetic pathway adaptation, and the evolution of reproductive strategies [10,11]. For wild species, research on Cymbidium faberi in the Qinling Mountains of China has revealed substantial genetic differentiation among populations, largely attributed to limited seed and pollen dispersal [12]. Genetic variation assessment of Cymbidium ensifolium revealed extensive genetic diversity among its 85 cultivars, with most of the genetic differentiation originating from within geographic groups [13]. The chromosome-level genome assembly of Cymbidium goeringii has elucidated key regulatory mechanisms governing floral organ development, flower coloration, and leaf pigmentation, offering valuable genomic resources for the genetic improvement of orchids and related ornamental plants [14]. Additionally, recent pan-genome studies on Dendrobium have further uncovered insights into the origin, evolution, and diversity of the species [15]. However, genomic studies in orchids are still in their early stages, especially when it comes to the genetic diversity and population structure of orchids in Fujian Province. Existing research has largely been limited to gene marker analysis of specific cultivars, failing to provide a comprehensive understanding of the genetic diversity and evolutionary relationships of orchids in Fujian. Given the impact of climate and geographical factors on the orchid populations in the region, they may possess a unique genetic background and adaptive mechanisms [16]. Whole-genome sequencing of these orchids would not only provide new insights into their genetic diversity but also offer theoretical support for orchid conservation, genetic resource utilization, and cultivar improvement. This is particularly relevant in the context of global climate change and the increasing intensity of human activities, highlighting the scientific significance of studying orchid genetic resource diversity.
Therefore, this study utilizes whole-genome sequencing technology, combined with comprehensive comparative genomic and functional annotation analyses, to reveal the genetic characteristics of wild Cymbidium species distributed in Fujian. It aims to provide foundational data for the future conservation and improvement of orchid genetic resources. By deeply exploring the genetic diversity of Fujian orchids, this study aims to identify key genetic variations and explore potential functional genes related to their adaptation and evolution. Ultimately, this research aims to provide theoretical support and data for orchid genetic resource conservation, cultivar development, and precision breeding.

2. Materials and Methods

2.1. Sample Collection and Whole-Genome Resequencing of Wild Cymbidium Species

A total of 13 leaf samples from wild Cymbidium species native to Fujian Province, China, were collected, including Cymbidium ensifolium, C. floribundum, C. kanran, and C. sinense. These species are widely distributed across subtropical and temperate regions of China, particularly in mountainous forested habitats (C. ensifolium is primarily distributed in southern China, including Fujian, Guangdong, Guangxi, and Yunnan provinces; C. floribundum has a relatively broad range and is found in southeastern China (e.g., Fujian, Zhejiang, Jiangxi), Taiwan, and parts of Indochina. C. kanran is found in central to southern China, including Fujian, Zhejiang, Hunan, and Sichuan. C. sinense is widely distributed in southern and southwestern China (e.g., Fujian, Yunnan, Sichuan, Hunan)).
Specifically, sample CE-YTCF (C. ensifolium) was collected from Yongtai County, Fujian Province, China; CF-JAGS-3 (C. floribundum) from Gushan, Fuzhou City, Fujian Province, China; CF-JOJY-1 (C. floribundum) from Jian’ou City, Fujian Province, China; CF-MHQS (C. floribundum) from Minhou County, Fujian Province, China; CF-SWJS-2 (C. floribundum) and CF-SWJS-3 (C. floribundum) from Shaowu City, Fujian Province, China; CF-YTDY-2 and CF-YTXD-1 (C. floribundum) from Yongtai County, Fujian Province, China; CK-MHDH-1 and CK-MHLY-1 (C. kanran) from Minhou County, Fujian Province, China; CK-YTHBL5 and CK-YTNK2 (C. kanran) from Yongtai County, Fujian Province, China; and CS-NJHBL2 (C. sinense) from Nanjing County, Zhangzhou City, Fujian Province, China (Figure 1). All samples were collected from healthy, young leaves, immediately frozen in dry ice for express transportation, and stored at −80 °C until further analysis. Genomic DNA was extracted using a modified CTAB method [17]. The DNA purity and concentration were assessed with a NanoDrop 2000 spectrophotometer (Thermo Fisher Scientific, Waltham, MA, USA). Library preparation was conducted following the standard protocols of the Illumina/BGI platform, with an average insert size of 350 bp, followed by quality control checks. Sequencing was performed by Biomarker Technologies (Beijing, China) using Illumina NovaSeq platforms with a paired-end read length of 150 bp [18].

2.2. Variant Detection and Annotation

Raw paired-end reads were subjected to quality control using fastp (v0.23.2) with the following parameters: -q 20 (to filter out bases with an average quality score below 20). After filtering, high-quality clean reads were obtained for downstream analyses [19]. Clean reads were aligned to the C. ensifolium reference genome (GCA_023213395.1) [20] using BWA-MEM [21], and the alignment results were processed with SAMtools for conversion into sorted BAM files for downstream variant calling. Single-nucleotide polymorphisms (SNPs) and small insertions/deletions (InDels) were identified using the Genome Analysis Toolkit (GATK) [22]. Initially, HaplotypeCaller was used to generate individual gVCF files per sample. These files were then combined using Combine GVCFs and genotyped with Genotype GVCFs to generate the final variant call format (VCF) file. To ensure variant quality, SNPs and InDels were filtered using SelectVariants and hard filtering with Variant Filtration, removing low-quality or potential false-positive variants. SNPs were filtered based on a minor allele frequency (MAF) ≥ 0.05 and site integrity (INT) ≥ 0.8, resulting in a high-confidence SNP dataset comprising 11,861,203 loci for downstream analyses. Small InDels were defined as ≤50 bp in length and variants with QUAL ≥ 30. For functional annotation of the variants, BLAST v2.12.0 [23] was used to align variant-containing sequences against functional databases such as the Kyoto Encyclopedia of Genes and Genomes (KEGG) to predict gene functions and metabolic pathways. KEGG pathway enrichment was performed using KOBAS 3.0 based on hypergeometric tests [24], with significance thresholds set at p ≤ 1 × 10⁻⁵ and a false discovery rate (FDR) ≤ 0.01, ensuring the statistical reliability of the results for downstream biological interpretation.

2.3. Genetic Evolution Analysis

Phylogenetic analysis was conducted using MEGA X [25] with the neighbor-joining (NJ) method and the Kimura 2-parameter model, employing 1000 bootstrap replicates. Population structure was analyzed using ADMIXTURE v1.3.0 [26]. The number of ancestral populations (K) was predefined from 1 to 10, and the optimal K was determined based on the lowest cross-validation error. Principal component analysis (PCA) was performed using EIGENSOFT v7.2.1 [27] to assess the genetic clustering among the samples. Pairwise kinship coefficients were estimated using GCTA (v1.92.1) [28] to evaluate genetic relationships and visualize them via a kinship heatmap. Linkage disequilibrium (LD) analysis was performed using PopLDdecay (v3.41) [29], which evaluated LD decay patterns across SNP pairs within 1000 kb on the same chromosome. Population genetic diversity parameters, including the expected and observed heterozygosity, allele number, Nei’s gene diversity index, Shannon–Wiener index, and polymorphism information content (PIC), were calculated using PowerMarker v3.25 and GenAlEx v6.5 based on filtered SNP data. The PIC and Nei’s index were computed with default parameters in PowerMarker, while the Shannon–Wiener index was assessed in GenAlEx [30,31]. To provide a more comprehensive assessment of genetic diversity suitable for whole-genome data, population differentiation indices such as Fst were further estimated using VCFtools v0.1.16 and PLINK v1.90b6.24 [32,33], which allowed better characterization of genomic variation and inbreeding levels.

3. Results

3.1. Whole-Genome Resequencing and Variant Detection of Cymbidium Species in Fujian

To better conserve the wild Cymbidium species in Fujian Province, a total of 13 samples representing four species were collected: C. floribundum (CF-YTDY-2, CF-YTXD-1, CF-JAGS-3, CF-JOJY-1,CF-SWJS-2, CF-SWJS-3, CF-MHQS), C. sinense (CS-NJHBL2), C. kanran (CK-MHLY1, CK-YTNK2, CK-YTHBL5, CK-MHDH-1), and C. ensifolium (CE-YTCF). Whole-genome resequencing was performed using C. ensifolium as the reference genome. In total, 350.58 Gbp of high-quality clean data were generated across all samples, with an average Q30 score of 98.03%, indicating high sequencing accuracy. The mean mapping rate to the reference genome was 97.93%, with an average sequencing depth of 6× and a genome coverage of 66.77%. Among the species, C. ensifolium exhibited the highest mapping rate of 99.26% and a genome coverage of 78.63% (Table 1). Additionally, the sequencing depth across chromosomes was evenly distributed, and the sequencing reads showed good randomness (Figure S1). These results indicate that the data quality is sufficient to support downstream analyses of genetic variation and population structure.

3.2. Genomic Distribution of Indel and SNP Variants in Cymbidium Species from Fujian

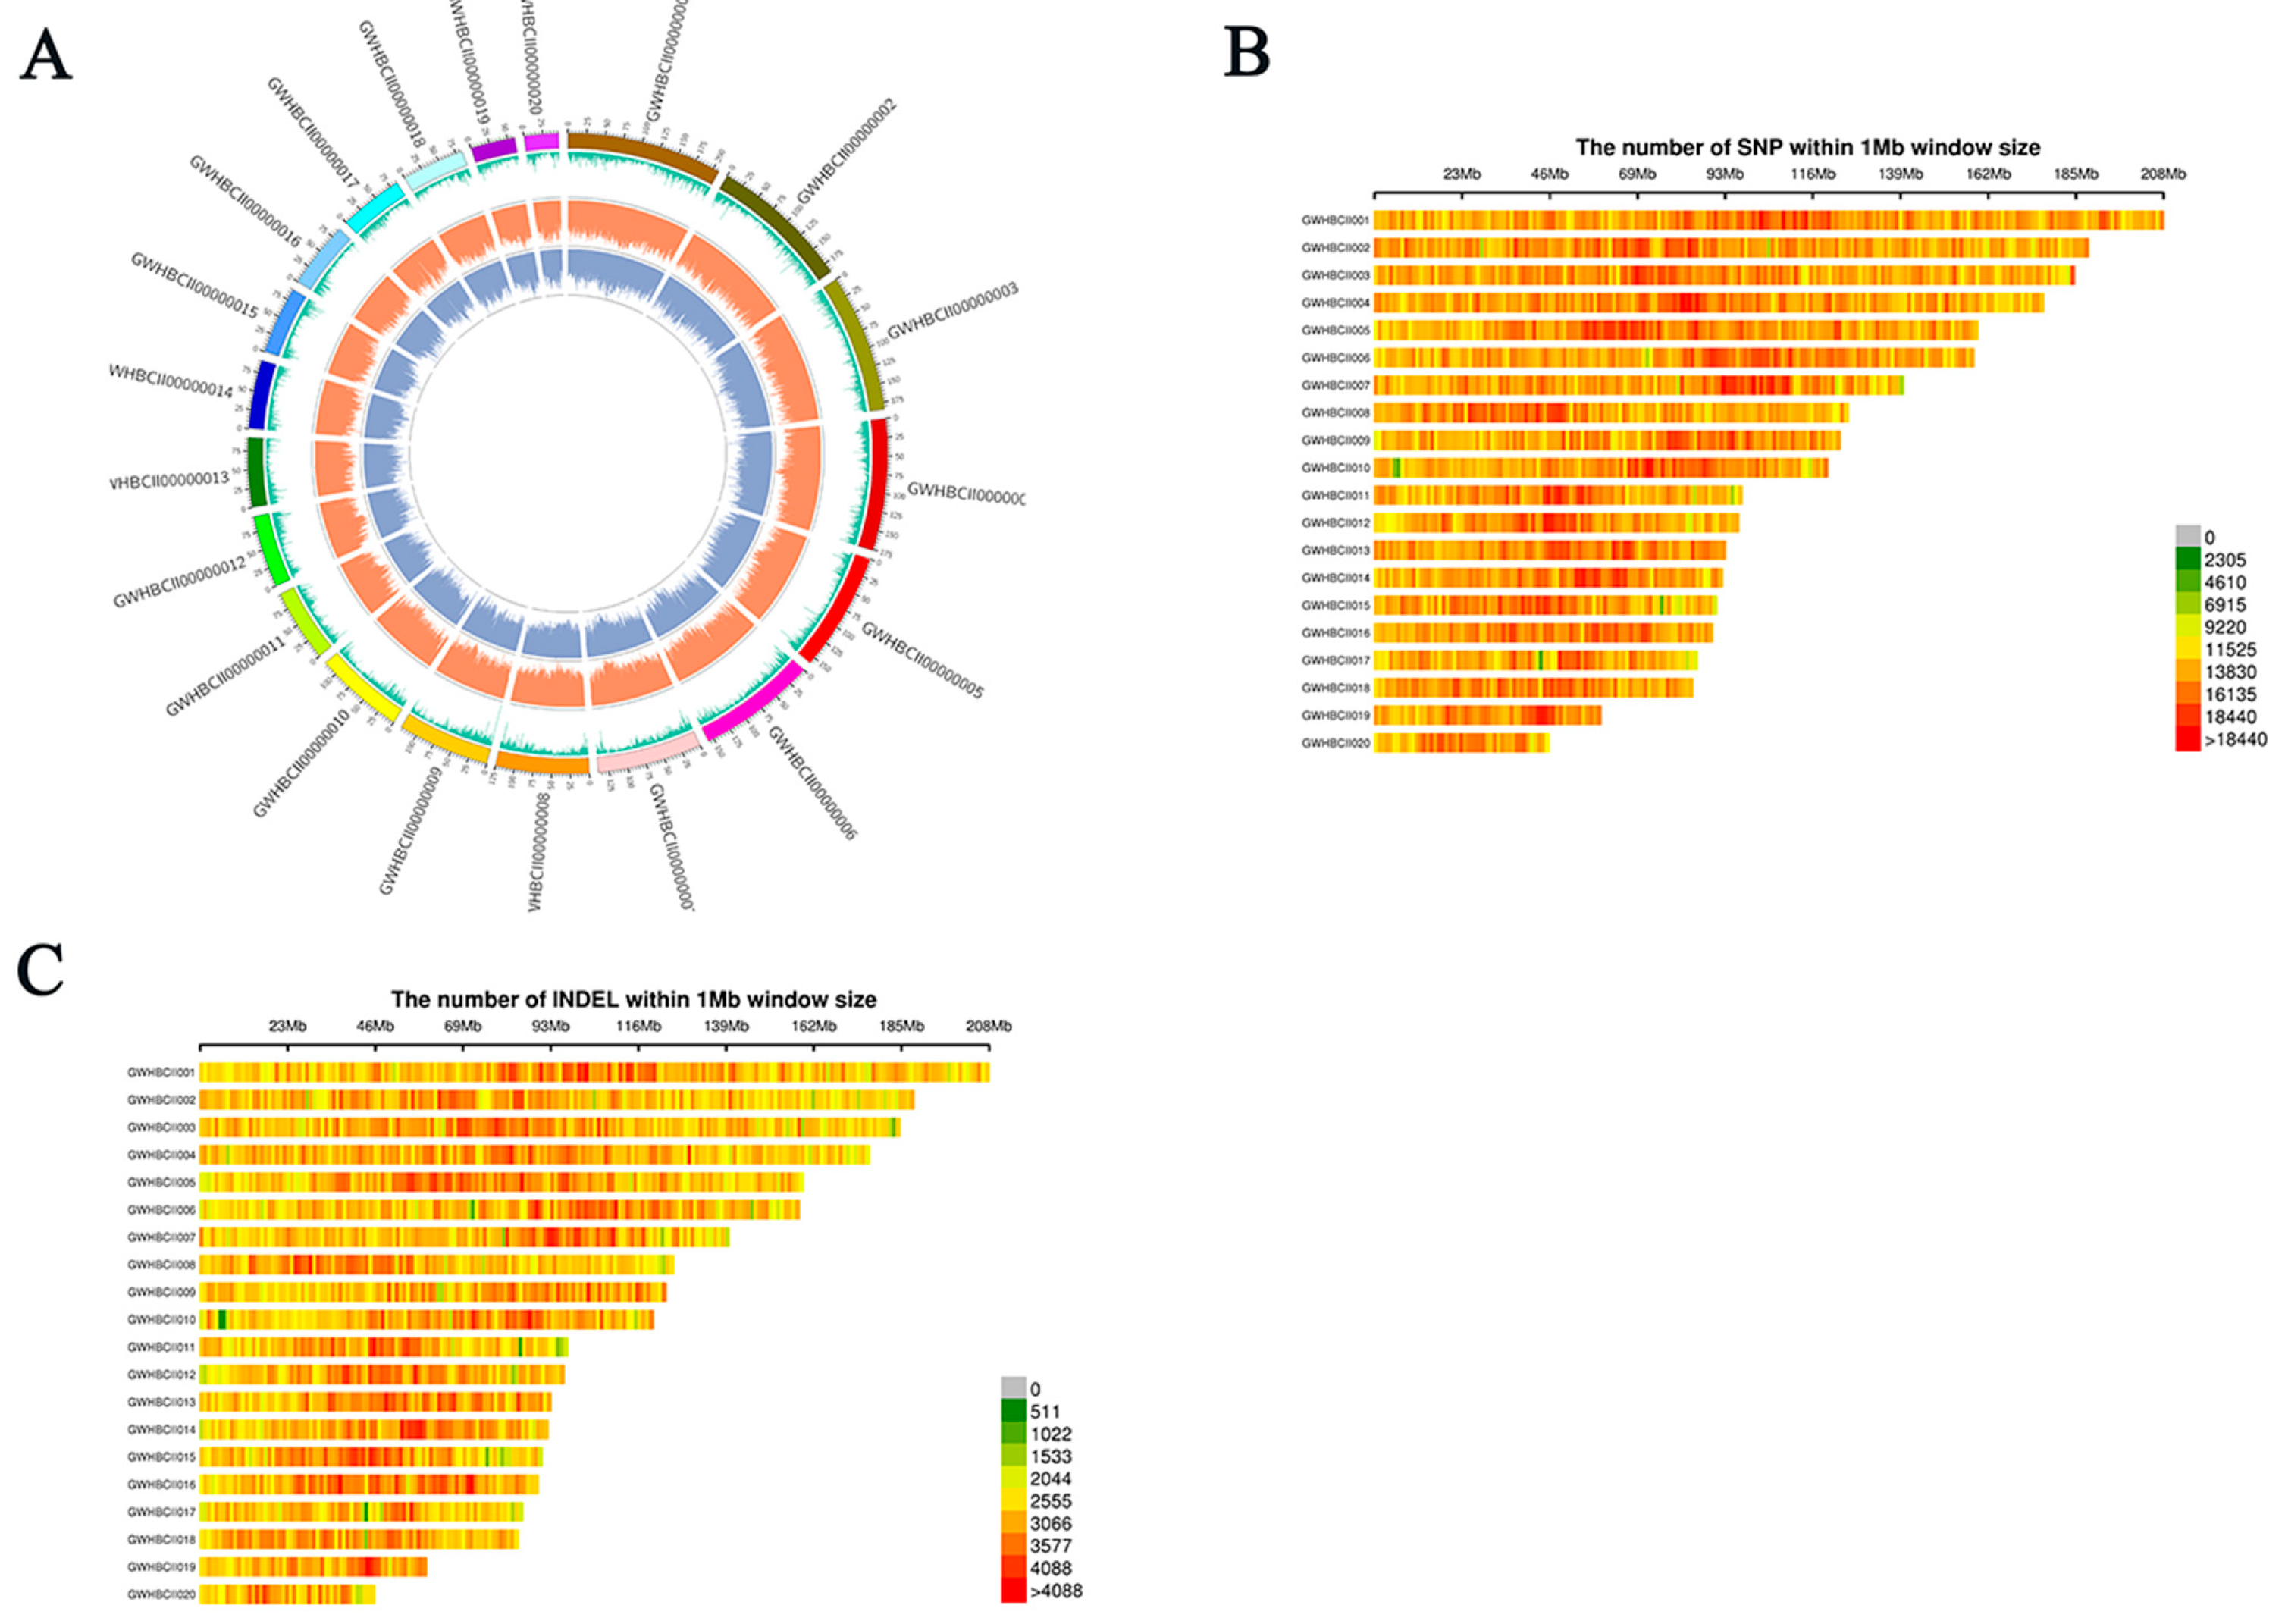
Based on high-quality whole-genome resequencing data, SNP and InDel variations were identified across 13 samples, including CE-YTCF; CF-JAGS-3, CF-JOJY-1, CF-MHQS, CF-SWJS-2, CF-SWJS-3, CF-YTDY-2, CF-YTXD-1; CK-MHDH-1, CK-MHLY-1, CK-YTHBL5, CK-YTNK2; and CS-NJHBL2. The results revealed a highly heterogeneous distribution of variants across the genome (Figure 2A). Regions with high gene density generally exhibited lower levels of SNP variation, while non-coding regions showed higher variability. A Circos plot was constructed to illustrate genome-wide variant distributions, including (from outer to inner layers) chromosome coordinates, gene density, SNP density, and InDel density. Significant regional differences were observed in variant density along chromosomes (or scaffolds), with SNPs and InDels showing distinct non-uniform distribution patterns. The SNP and InDel density heatmaps (Figure 2B,C) further confirmed this trend. At a 1 Mb window resolution, chromosomes GWHBCII001 and GWHBCII002 exhibited the highest SNP density (>18,440 SNPs/Mb), whereas shorter chromosomes (e.g., GWHBCII018–GWHBCII020) showed lower SNP enrichment. A positive correlation was also observed between SNP density and chromosome length, with longer chromosomes harboring more variants. The distribution of InDel variants was generally consistent with that of SNPs. For instance, GWHBCII001 and GWHBCII002 also exhibited the highest InDel density (>4088 InDels/Mb), while shorter chromosomes had lower InDel abundance. Certain genomic regions exhibited co-enrichment of both SNPs and InDels.
Among all samples, the CF group (e.g., CF-JAGS-3, CF-JOJY-1, and CF-MHQS) showed the highest numbers of genes affected by non-synonymous SNPs (~18,200–18,300) and InDels (~6800–6900), whereas CK and CS group samples had fewer variant-associated genes—approximately 17,100–17,700 non-synonymous SNP-related genes and 4400–4700 InDel-related genes. Notably, CF-YTXD-1 contained the highest number of InDel variants (6911).
SNP substitutions were classified into six categories. In all samples, the C:G > T:A and T:A > C:G transitions were markedly more abundant than other types, with C:G > T:A being the most prevalent (Figure S2). A systematic characterization of SNP features was performed, including total SNP counts, transition-to-transversion ratios (Ti/Tv), and the proportions of heterozygous versus homozygous SNPs. The total number of SNPs varied significantly among samples, ranging from 6,803,293 (CE-YTCF) to 13,279,985 (CS-NJHBL2), indicating distinct levels of genetic variation across different Cymbidium species or populations. Samples CK-MHDH-1, CK-MHLY-1, CK-YTHBL5, and CS-NJHBL2 harbored significantly higher SNP counts than other individuals, suggesting these genotypes may possess more complex genetic backgrounds or have accumulated more genetic variation over time (Table S1).

3.3. Functional Characterization of Variant Genes in Four Wild Cymbidium Species from Fujian Based on KEGG Enrichment Analysis

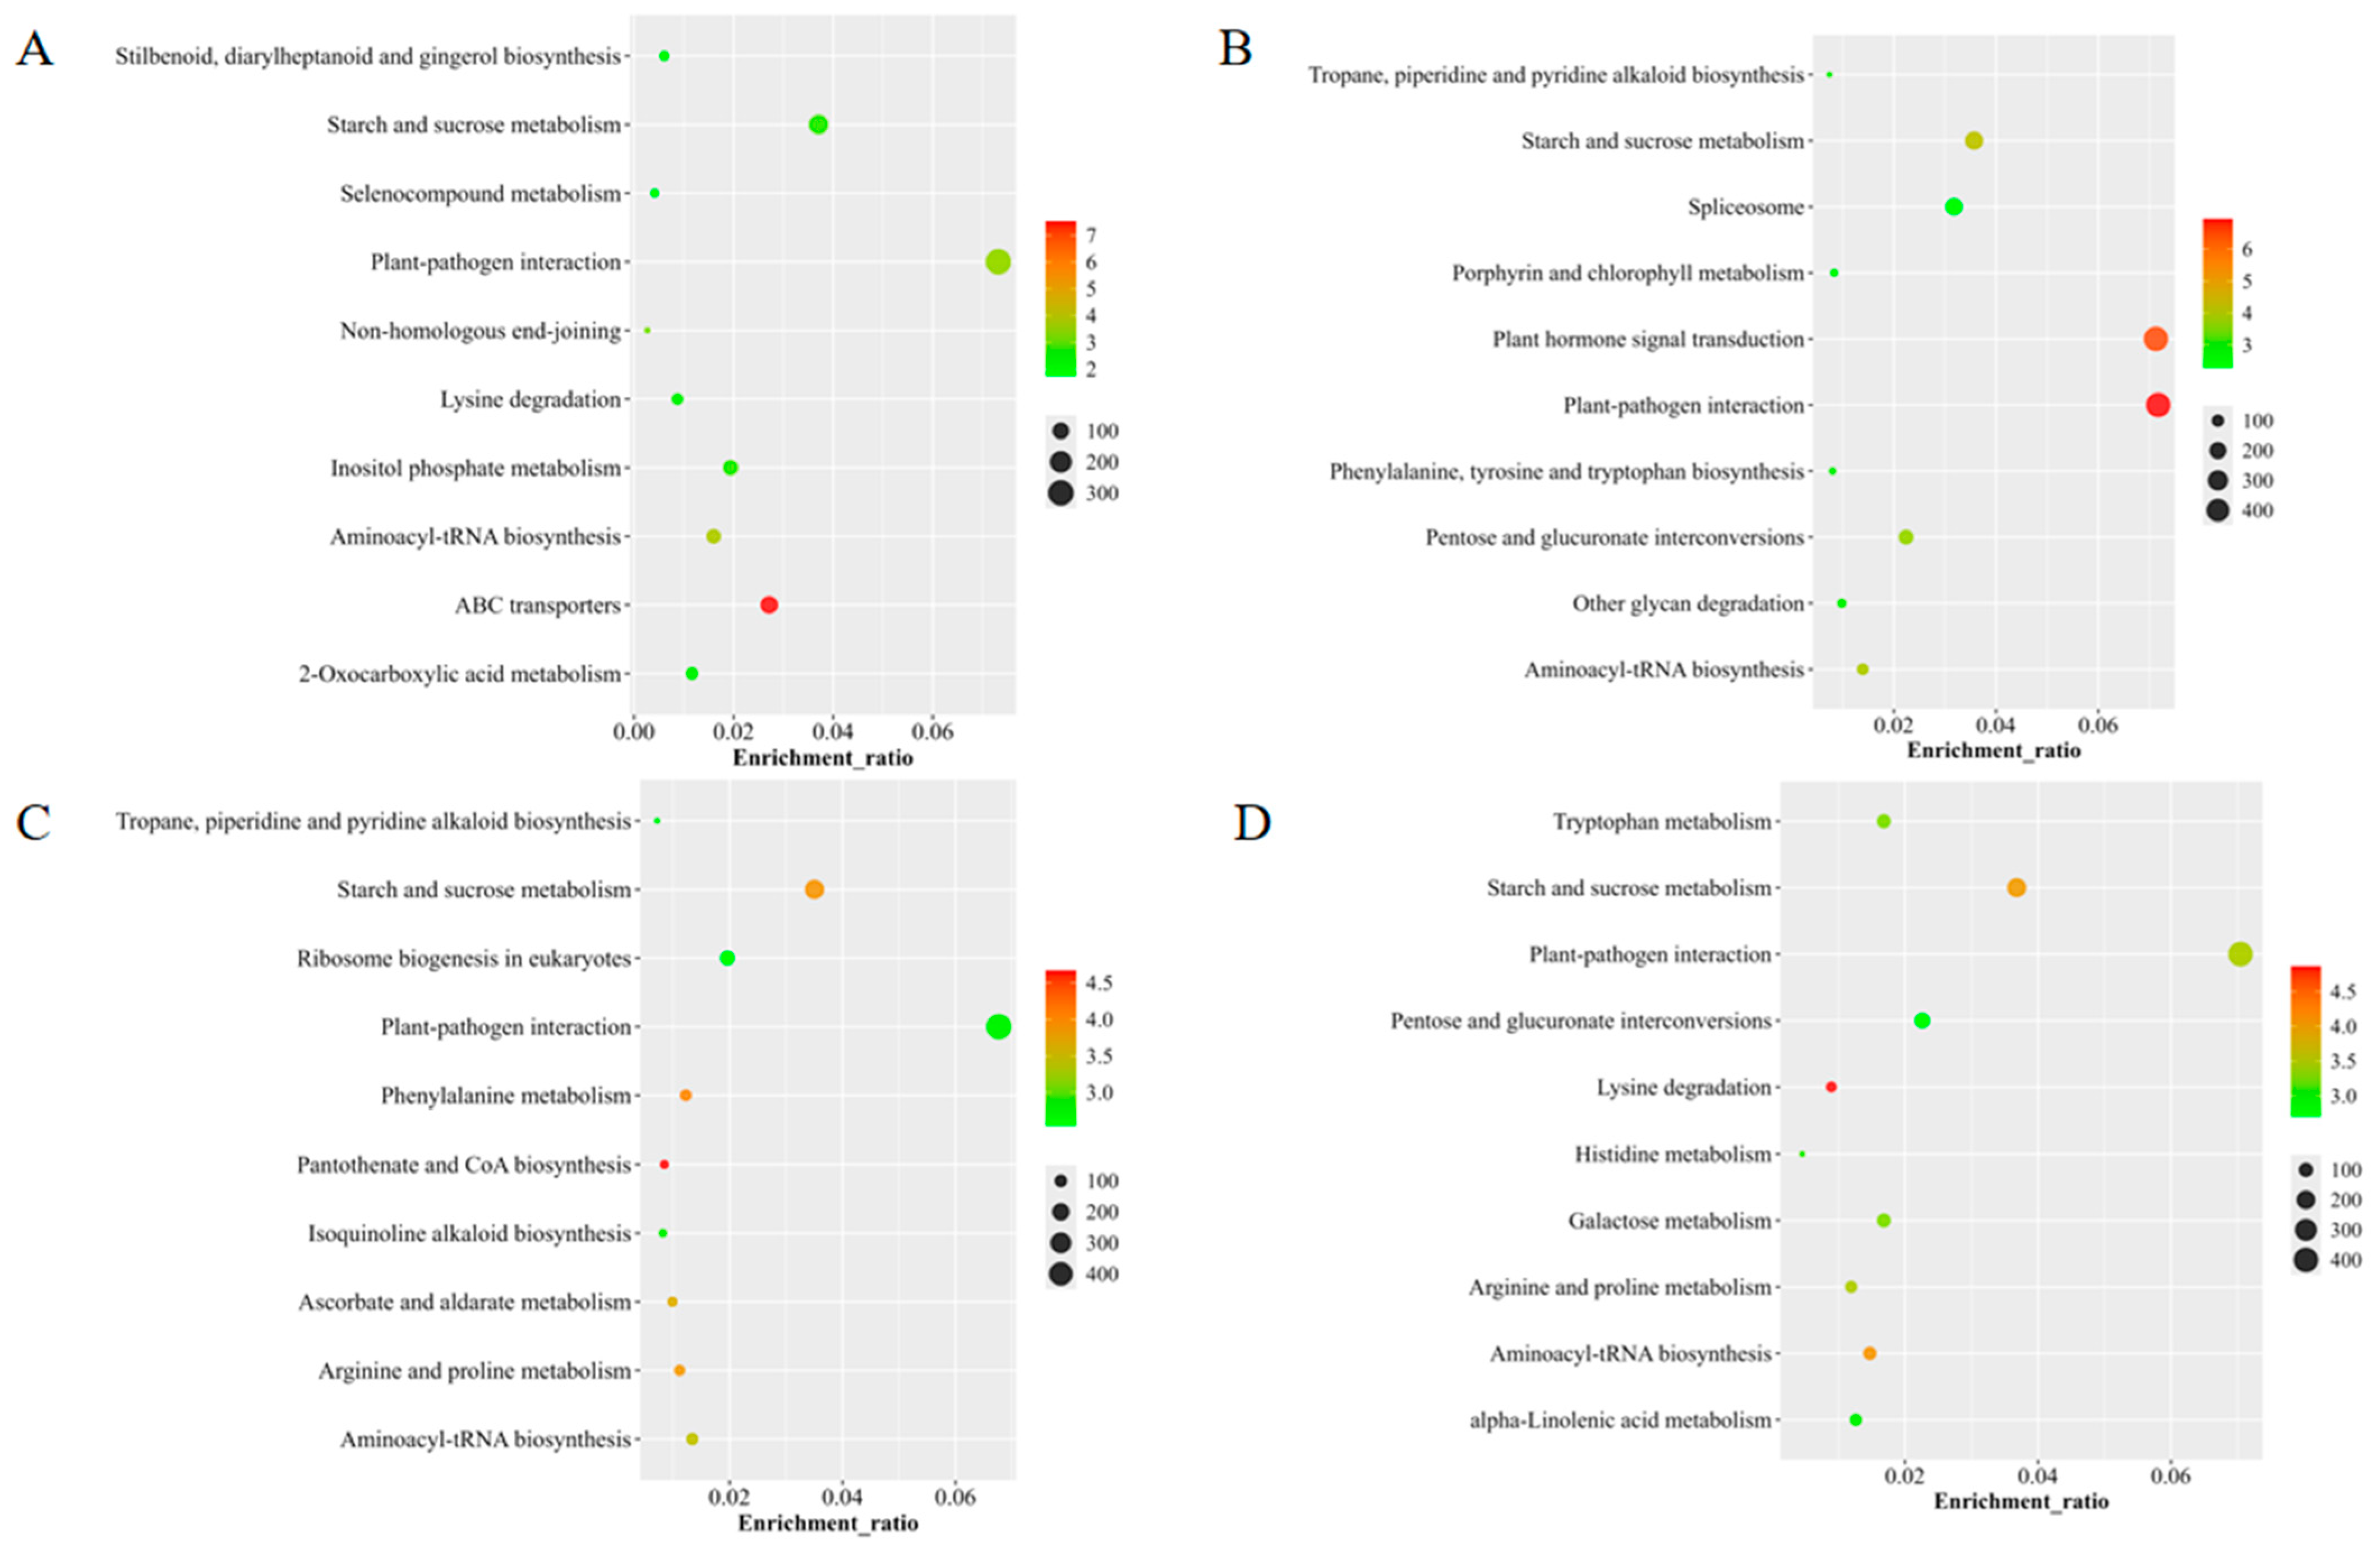
To elucidate the functional characteristics of genomic variation among four wild Cymbidium species native to Fujian Province—C. ensifolium (CE), C. floribundum (CF), C. sinense (CS), and C. kanran (CK)—KEGG pathway enrichment analysis was performed on genes containing sequence variants, revealing distinct differences in metabolic regulation and biological functions among the species. In C. ensifolium (Figure 3A), the most significantly enriched pathways included “Starch and sucrose metabolism”, “ABC transporters”, and “Plant–pathogen interaction”, suggesting active carbohydrate metabolism and transport mechanisms. In addition, enrichment in the “Phenylpropanoid, diarylheptanoid and gingerol biosynthesis” pathways implies a potential role in secondary metabolite production for developmental or environmental adaptation. By contrast, C. floribundum (Figure 3B) showed prominent enrichment in the “Plant hormone signal transduction” and “Plant–pathogen interaction” pathways, with the latter being the most enriched. This suggests an enhanced response to biotic and abiotic stresses mediated by hormonal signaling. Other enriched pathways, such as “Porphyrin and chlorophyll metabolism” and “Phenylalanine, tyrosine and tryptophan biosynthesis”, indicate involvement in pigment formation and amino acid metabolism. In C. kanran (Figure 3C), the variant genes were primarily enriched in the “Pantothenate and CoA biosynthesis” pathway, which is central to energy metabolism, fatty acid biosynthesis, and stress response. This suggests that C. kanran may rely on this pathway to adapt to environmental conditions. For C. sinense (Figure 3D), enrichment analysis revealed that variant genes were mainly involved in the “Lysine degradation” pathway, indicating potential activity in amino acid catabolism and secondary metabolite biosynthesis.
Overall, although the four Cymbidium species share several common pathways, such as “Starch and sucrose metabolism” and “Aminoacyl-tRNA biosynthesis”, KEGG analysis revealed substantial divergence in terms of metabolic specialization, stress resistance, and secondary metabolism. These functional differences in variant genes may suggest potential adaptive evolution under diverse ecological conditions in Fujian; however, given the limited sample size, further studies with expanded sampling are necessary to confirm these patterns.

3.4. Population Structure and Genetic Evolution Analysis of Four Wild Cymbidium Species in Fujian

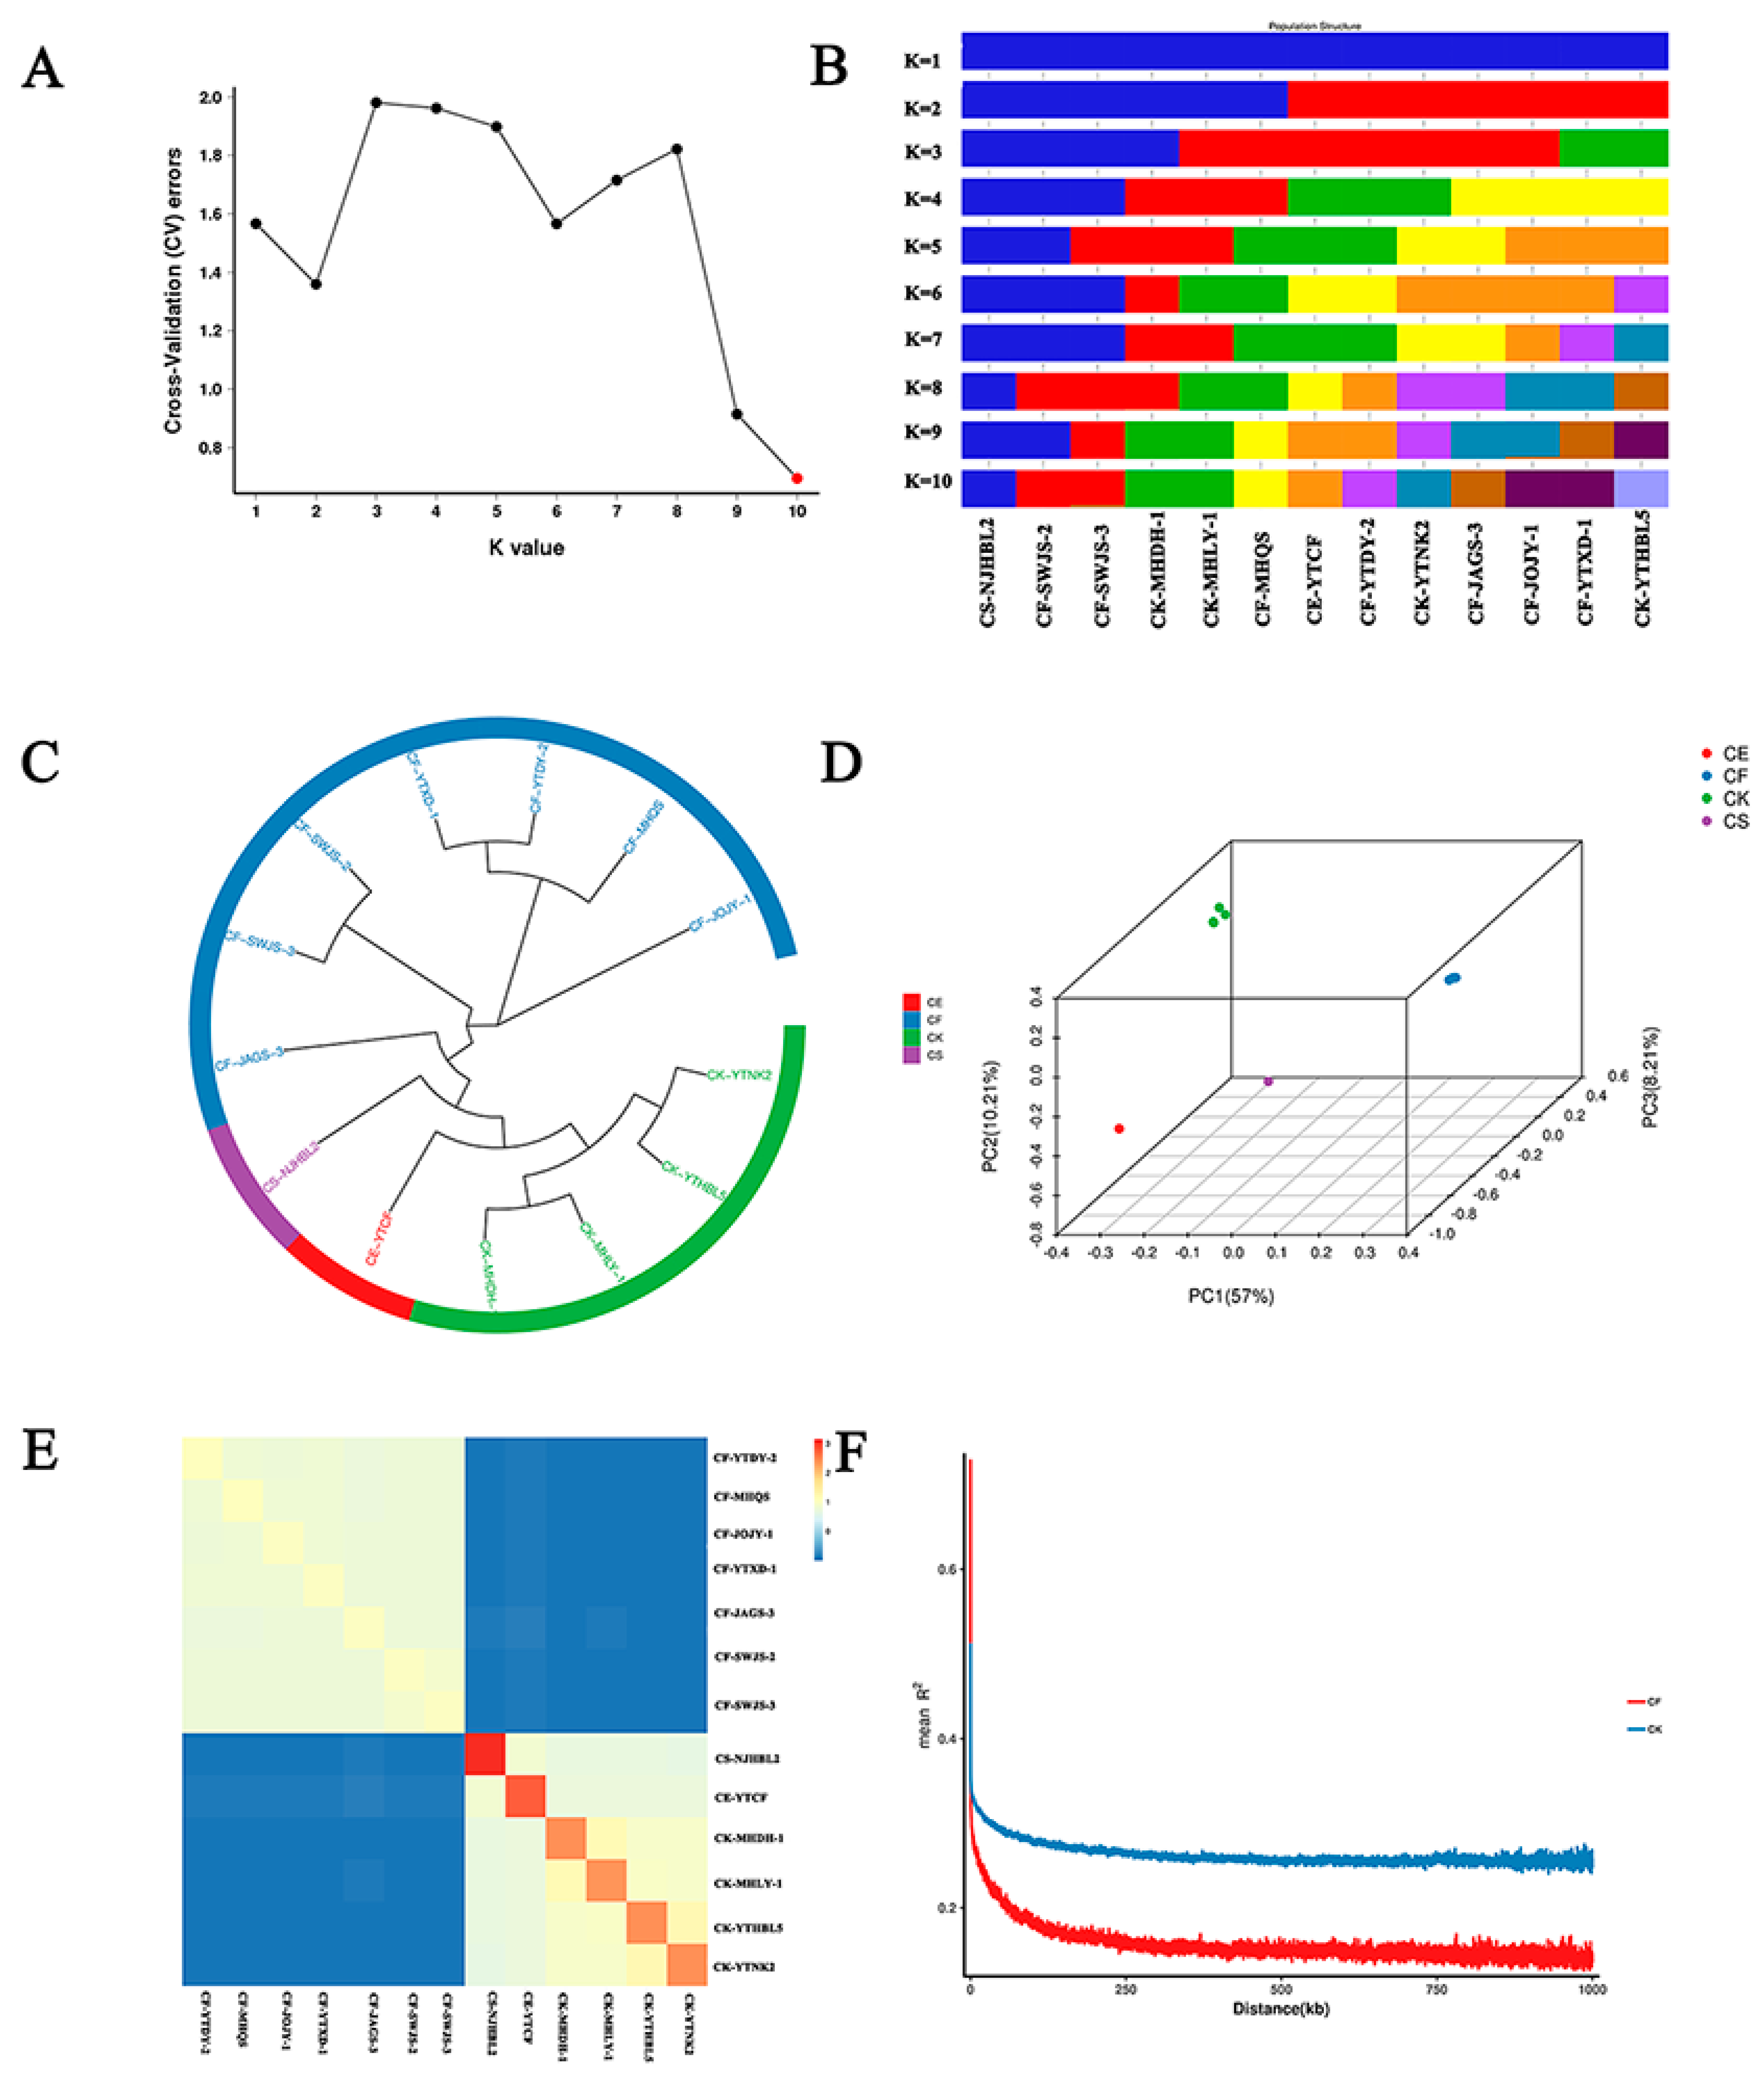
Population structure and genetic evolutionary analyses provide valuable insights into the genetic diversity of wild Cymbidium species in Fujian. ADMIXTURE analysis revealed that the optimal number of genetic clusters was K = 10, as determined by the lowest cross-validation (CV) error (Figure 4A), suggesting that this K value best represents the genetic structure of the studied populations. According to the ADMIXTURE results at K = 10, the wild Cymbidium populations in Fujian exhibited clear genetic differentiation (Table S2). C. floribundum (CF) samples were primarily assigned to clusters Q2, Q4, Q6, Q8, and Q9. For instance, CF-SWJS-3 showed a 93% assignment to Q2 but retained 6.5% from Q8, indicating possible gene flow or historical hybridization. CF-MHQS was exclusively assigned to Q4, while CF-YTXD-1 clustered into Q9 and shared ancestry components with C. kanran (CK) samples such as CK-MHDH-1, suggesting potential genetic background overlap between these species. In contrast, the C. sinense (CS) sample CS-NJHBL2 was entirely assigned to Q1, showing a relatively homogeneous genetic background. The C. kanran (CK) population exhibited more complex structure: CK-MHLY-1 and CK-MHDH-1 belonged to Q3, whereas CK-YTNK2 and CK-YTHBL5 were grouped into Q7 and Q10, respectively, implying diverse evolutionary trajectories among CK populations in Fujian. The C. ensifolium (CE) sample CE-YTCF was assigned to Q5 with no admixture from other species, further supporting its genetic distinctiveness (Figure 4B).
Phylogenetic analysis based on genetic distances revealed that the four species formed separate evolutionary clades (Figure 4C). CE and CF were located on distinct major branches, while CK and CS clustered more closely together, indicating higher genetic similarity between them. Principal component analysis (PCA, Figure 4D) supported the ADMIXTURE e findings. PC1, PC2, and PC3 explained 57.00%, 10.21%, and 3.21% of the variation, respectively. The PCA plot showed that CE, CF, CK, and CS samples formed relatively distinct clusters, although some overlap occurred between CF and CK. PC1 largely separated CF from CK/CS, highlighting strong interspecific divergence. PC2 reflected within-group variation, particularly among CF samples, where CF-SWJS-3 and CF-YTXD-1 showed deviations. This pattern may be attributed to gene flow or local adaptation, potentially indicating historical or recent genetic exchange among closely related Cymbidium lineages, including possible introgression events. Neighbor-joining phylogenetic trees further confirmed high genetic diversity within the CF population as CF individuals were scattered across multiple subclades instead of forming a single monophyletic group, suggesting recurrent introgression events.
A kinship heatmap constructed from genome-wide SNPs showed two main genetic groups. Group I consisted primarily of CF samples (e.g., CF-YTDX-2, CF-HRDS, CF-JQYH-1, CF-YTKD-1, CF-JJASG-3, CF-SNJS-2, and CF-SNJS-3), with strong genetic similarity indicated by light-colored blocks (Figure 4E), reflecting close kinship and low genetic distance. Group II included samples from CS, CE, and CK series (e.g., CS-NRBLB2, CE-YTCF, CK-KADKH-1, CK-KAHY-1, CK-YHRLS, and CK-YTKR2), which also showed strong intragroup relationships, particularly between CS-NRBLB2 and CE-YTCF. A clear separation between CF and CS/CK groups was evident in the heatmap, confirming significant intragroup genetic divergence. Linkage disequilibrium (LD) decay analysis showed that the CF population had a faster LD decay rate (Figure 4F), suggesting frequent recombination events and more complex population structure. In contrast, the CK population exhibited slower LD decay, possibly due to stronger selection pressure or inbreeding effects. This inbreeding could be further assessed by estimating the Froh inbreeding index based on runs of homozygosity (ROHs), a method we recommend for future research. Genetic diversity statistics further illustrated differences among the four wild Cymbidium species. The CF population had an average minor allele frequency (MAF) of 0.24, with expected allele numbers ranging from 1.000 to 2.000 (mean = 1.101) and observed allele numbers between 1.000 and 2.000 (mean = 1.189), indicating a rich genetic variation. The expected and observed heterozygosity values were 0.321 and 0.362, respectively, slightly lower than those in the CK population (0.396 and 0.409) but still at a high level. Polymorphic marker counts varied greatly between groups: approximately 2,246,164 in CF and up to 4,492,871 in CK, suggesting higher genomic variation in the CK population. Polymorphism information content (PIC) values were 0.260 for CF and 0.314 for CK, again supporting the higher genetic diversity of CK. The Shannon–Wiener index, another key measure of genetic diversity, averaged 0.490 for CF and 0.581 for CK (Table S3), reinforcing the inference of higher diversity in C. kanran.
Taken together, these analyses demonstrate clear intraspecific genetic variation among wild Cymbidium populations in Fujian. C. kanran exhibits the highest level of genetic diversity, while C. floribundum shows lower diversity but still maintains a substantial pool of genetic variation. Further conclusions for CE and CS populations were limited by their small sample sizes in this study.

4. Discussion

In this study, we employed whole-genome resequencing (WGS) to investigate the genetic diversity and population structure of four wild Cymbidium species—C. kanran, C. sinense, C. floribundum, and C. ensifolium—distributed in Fujian Province, China. A total of 350.58 Gbp of high-quality data were obtained from 13 individuals, enabling genome-wide exploration of genetic variation among the four species. The identification of genome-wide single-nucleotide polymorphisms (SNPs) and insertions/deletions (InDels) revealed substantial interspecific genetic variation. Notably, genomic variants were unevenly distributed, with lower variation in gene-dense regions and elevated variation in non-coding regions. This pattern is consistent with previous findings in other plant genomes, suggesting that regions with high gene density may be subject to stronger purifying selection, leading to reduced polymorphism levels [34]. The Circos plot and variant density heatmaps further illustrated the chromosomal distribution of SNPs and InDels, with higher densities observed in longer chromosomes. The positive correlation between chromosome length and variant abundance may reflect the functional significance and complexity of these chromosomal regions [35].
The overall genetic variation observed among the four Cymbidium species showed species-specific patterns. In particular, C. floribundum and C. kanran exhibited clear genetic differentiation, likely reflecting distinct adaptive evolutionary processes. Previous research has shown that structural variations contributed to the adaptive evolution of Hordeum brevisubulatum [36], while global studies on 17 angiosperm species demonstrated that local adaptation and pleiotropy can be maintained under selection and migration pressures [37]. In contrast, C. kanran exhibited higher genetic diversity, potentially due to its wider distribution and strong environmental adaptability across multiple ecological zones in Fujian. Higher genetic diversity typically enhances the ability of a species to respond to environmental changes, suggesting that C. kanran may harbor unique genotypes adapted to local conditions. Importantly, C. sinense displayed intermediate to high within-species genetic variation, possibly resulting from both its mixed reproductive strategy and long-term human cultivation in southeastern China. Comparable patterns of genetic diversity and population structure have been reported in other Orchidaceae species with similar life histories and niche overlaps—for instance, Dendrobium officinale, which shows moderate to high AFLP-based diversity across wild populations [38], and Paphiopedilum micranthum, where chloroplast genome studies highlight strong inter-population divergence and ecological adaptations [39]. These parallels reinforce the idea that both natural adaptation and anthropogenic influences shape population genetics in cultivated orchids.
KEGG pathway enrichment analysis revealed notable interspecific differences in metabolic and stress response pathways. The genes differentially represented between C. ensifolium and C. floribundum were significantly enriched in the “Starch and sucrose metabolism”, “ABC transporters”, and “Aminoacyl-tRNA biosynthesis” pathways, indicating enhanced carbohydrate metabolism and transport activity in these species. Previous studies have demonstrated that genes involved in starch and sucrose metabolism regulate aroma biosynthesis and cell wall formation in C. ensifolium floral tissues [40]. In contrast, C. sinense and C. kanran were enriched in amino acid metabolism, pigment biosynthesis, and stress-related pathways. For instance, the genome of C. sinense revealed insights into traits such as colorful leaves, dark floral pigmentation, and volatile production [41], while transcriptomic analyses of C. kanran uncovered floral color differentiation between white- and purple-red varieties [42]. These functional divergences may reflect distinct ecological strategies for stress tolerance and habitat adaptation. Interestingly, the “Plant hormone signal transduction” pathway was enriched in C. floribundum, suggesting its involvement in hormone-mediated regulation and abiotic stress responses. Hormones such as auxins, cytokinins, and abscisic acid play pivotal roles in plant adaptation. In C. sinense, immune-related genes like NPR1 and PR1 have been shown to be essential for biotic and abiotic stress tolerance [43]. Moreover, the enrichment of the lysine degradation pathway in C. sinense may indicate active amino acid catabolism and the biosynthesis of secondary metabolites involved in stress responses [44].
Population structure analyses, including PCA and ADMIXTURE (K = 10), revealed clear genetic stratification among species. The greatest divergence was observed between C. floribundum and C. kanran. Differences in within-population diversity may be attributed to historical gene flow, geographical isolation, and environmental selection. For example, restricted gene flow significantly shaped the population structure of Cypripedium macranthos in northern China [45]. In this study, linkage disequilibrium (LD) decay patterns further illustrated population differentiation: C. floribundum showed rapid LD decay, suggesting higher historical recombination and larger effective population size, while C. kanran exhibited slower LD decay, possibly due to past demographic events such as population bottlenecks or limited gene flow in certain wild populations. Although C. kanran is widely cultivated, the individuals analyzed in this study were collected from wild populations, suggesting that reduced LD decay may also reflect historical population contractions or local selection pressures in the wild [46]. These findings are consistent with LD patterns observed in cultivated crops such as rice (Oryza sativa), maize (Zea mays), and wheat (Triticum aestivum), where wild species show faster LD decay compared to cultivated ones [47,48,49]. Despite its higher LD, C. kanran showed relatively high genetic diversity, likely due to the integration of multiple cultivated lines. In contrast, C. floribundum, which may occupy more specialized or isolated environments, exhibited lower gene flow and greater differentiation. Similar patterns have been reported in alpine orchids with uneven population sizes across altitudes [50]. Thus, LD and genetic diversity reflect different evolutionary processes: LD is shaped by selection and recombination history, whereas diversity reflects current allelic variation. The observed genomic divergence among species may be partially attributed to ecological niche differentiation. For example, C. kanran occupies a broader range of habitats across Fujian, which may contribute to its higher genetic diversity, while C. floribundum and C. kanran are often restricted to narrower ecological niches, possibly leading to stronger selective pressures. These habitat differences likely underlie the enrichment of stress- and hormone-related pathways in certain species. Integrating ecological niche modeling with genomic data in future studies could further clarify the role of environmental adaptation in shaping genetic divergence.
Overall, these findings contribute valuable genomic insights into Cymbidium conservation and breeding. In particular, populations like C. kanran, which maintain high genetic diversity, may serve as reservoirs for future genetic improvement. The identified differences in gene function and metabolic pathways provide new perspectives for understanding the environmental adaptation of wild Cymbidium species. Whole-genome resequencing represents a powerful tool to identify candidate genes for trait improvement and adaptation. Future studies should expand sample sizes and include diverse habitats to further elucidate the genomic mechanisms of orchid adaptation. Integrating genomics with ecological data may provide a more comprehensive understanding of evolutionary processes in wild orchids.

5. Conclusions

This study applied whole-genome resequencing and population genetic approaches to systematically evaluate the genetic diversity and population structure of four wild Cymbidium species in Fujian Province. The results revealed abundant genetic variation and significant interspecific differences in gene function, metabolic pathways, and adaptive potential. These findings not only provide a foundation for the conservation of wild Cymbidium germplasm but also offer valuable insights for future breeding programs. The integration of genomic and functional analyses enhances our understanding of how Cymbidium species respond to environmental pressures and highlights the potential of using genomics in the development of improved cultivars.

Supplementary Materials

The following supporting information can be downloaded, https://www.mdpi.com/article/10.3390/horticulturae11080944/s1, Figure S1: Sample chromosome coverage depth distribution map; Figure S2: SNP mutation distribution map; Table S1: Classification statistics of differential genes caused by SNP and InDel variations; Table S2: Population genetic diversity.

Author Contributions

Conceptualization, B.C.; methodology, B.C. and X.X.; software, X.X. and S.L.; validation, X.X. and B.C.; investigation, B.C., J.Z., L.Z., Y.H., J.L., Z.L. (Zhiyong Lin), W.X., J.W., Z.L. (Zhiru Lai), X.H., J.H., W.W. and L.S.; writing—original draft preparation, X.X.; writing—review and editing, B.C. and Y.A.E.-K.; supervision, B.C.; project administration, B.C.; funding acquisition, B.C. All authors have read and agreed to the published version of the manuscript.

Funding

This research was funded by the China Government Central Finance through the projects Conservation of Biological and Species Resources “Collection, Conservation, Propagation and Utilization of Ludisia discolor and Cymbidium floribundum Resources”, “Collection, Conservation, Propagation and Utilization of Four Wild Orchid Species Resources”, and “Collection, Conservation, Propagation and Utilization of Four Wild Orchidaceae Species Resources” Cai Zi Huan [2023] No. 115, Min Cai Zi Huan Zhi [2023] No. 60 Min Lin Ke Bian Han [2023] No. 26, and “Conservation, Propagation, Reintroduction and Utilization of Cymbidium kanran and Other Orchidaceae Species (Min Cai Zhi [2025] No. 59).

Data Availability Statement

The resequencing data have been deposited in the Sequence Read Archive (SRA) database in NCBI (BioProject accession numbers: PRJNA1220718, PRJNA1221072, PRJNA1221286, and PRJNA1221308).

Conflicts of Interest

Author Sijia Liu was employed by the company Fujian Satellite Data Development Co., Ltd. The remaining authors declare that the research was conducted in the absence of any commercial or financial relationships that could be construed as a potential conflict of interest.

References

  1. Fay, M.F.; Pailler, T.; Dixon, K.W. Orchid conservation: Making the links. Ann. Bot. 2015, 116, 377–379. [Google Scholar] [CrossRef]
  2. Zhang, M.; Zhang, X.; Ge, C.; Chen, B. Danxiaorchis mangdangshanensis (Orchidaceae, Epidendroideae), a new species from central Fujian Province based on morphological and genomic data. PhytoKeys 2022, 212, 37–55. [Google Scholar] [CrossRef]
  3. Liu, J.; Lan, S.; He, B.; Liang, Y. Bulbophyllum pingnanense (Orchidaceae, Epidendroideae, Dendrobiinae), a new species from Fujian, China. PhytoKeys 2016, 65, 107–112. [Google Scholar] [CrossRef]
  4. Fay, M.F. Orchid conservation: How can we meet the challenges in the twenty-first century? Bot. Stud. 2018, 59, 16. [Google Scholar] [CrossRef] [PubMed]
  5. Chhina, A.K.; Abhari, N.; Mooers, A.; Lewthwaite, J.M.M. Linking the spatial and genomic structure of adaptive potential for conservation management: A review. Genome 2024, 67, 403–423. [Google Scholar] [CrossRef] [PubMed]
  6. Meienberg, J.; Bruggmann, R.; Oexle, K.; Matyas, G. Clinical sequencing: Is WGS the better WES? Hum. Genet. 2016, 135, 359–362. [Google Scholar] [CrossRef]
  7. Tysklind, N.; Blanc-Jolivet, C.; Mader, M.; Meyer-Sand, B.R.V.; Paredes-Villanueva, K.; Honorio Coronado, E.N.; García-Dávila, C.R.; Sebbenn, A.M.; Caron, H.; Troispouxet, V.; et al. Development of nuclear and plastid SNP and INDEL markers for population genetic studies and timber traceability of Carapa species. Conserv. Genet. Resour. 2019, 11, 337–339. [Google Scholar] [CrossRef]
  8. Liu, S.; Xu, Y.; Yang, K.; Huang, Y.; Lu, Z.; Chen, S.; Gao, X.; Xiao, G.; Chen, P.; Zeng, X.; et al. Origin and de novo domestication of sweet orange. Nat. Genet. 2025, 57, 754–762. [Google Scholar] [CrossRef]
  9. Kong, W.; Kong, X.; Xia, Z.; Li, X.; Wang, F.; Shan, R.; Chen, Z.; You, X.; Zhao, Y.; Hu, Y.; et al. Genomic analysis of 1,325 Camellia accessions sheds light on agronomic and metabolic traits for tea plant improvement. Nat. Genet. 2025, 57, 997–1007. [Google Scholar] [CrossRef]
  10. Cai, J.; Liu, X.; Vanneste, K.; Proost, S.; Tsai, W.; Liu, K.; Chen, L.-J.; He, Y.; Xu, Q.; Bian, C.; et al. The genome sequence of the orchid Phalaenopsis equestris. Nat. Genet. 2015, 47, 65–72. [Google Scholar] [CrossRef]
  11. Yang, L.; Zhou, R.; Xue, T.; Yuan, Y. Evolutionary Conservation and Expression Patterns of Flavonoid Biosynthetic Genes in Dendrobium catenatum. Russ. J. Plant Physiol. 2023, 70, 157. [Google Scholar] [CrossRef]
  12. Liang, H.; Wang, X.; Chen, W.; Hu, S.; Yang, F.; Yang, X. Spatial genetic structure of terrestrial orchid Cymbidium faberi in the Qinling Mountains revealed by microsatellite loci. Plant Syst. Evol. 2021, 307, 5. [Google Scholar] [CrossRef]
  13. Wang, H.; Lu, J.; Hu, X.; Liu, J. Genetic variation and cultivar identification in Cymbidium ensifolium. Plant Syst. Evol. 2011, 293, 101–110. [Google Scholar] [CrossRef]
  14. Sun, Y.; Chen, G.; Huang, J.; Liu, D.; Xue, F.; Chen, X.; Chen, S.-Q.; Liu, C.-G.; Liu, H.; Ma, H.; et al. The Cymbidium goeringii genome provides insight into organ development and adaptive evolution in orchids. Ornam. Plant Res. 2021, 1, 10. [Google Scholar] [CrossRef]
  15. Li, Y.; Zhang, B.; Zhang, S.; Wong, C.E.; Liang, Q.; Pang, S.; Wu, Y.; Zhao, M.; Yu, H. Pangeneric genome analyses reveal the evolution and diversity of the orchid genus Dendrobium. Nat. Plants 2025, 11, 421–437. [Google Scholar] [CrossRef]
  16. Hoffmeister, T.S.; Vet, L.E.M.; Biere, A.; Holsinger, K.; Filser, J. Ecological and Evolutionary Consequences of Biological Invasion and Habitat Fragmentation. Ecosystems 2005, 8, 657–667. [Google Scholar] [CrossRef]
  17. Yang, F.; Gao, J.; Li, J.; Wei, Y.; Xie, Q.; Jin, J.; Lu, C.; Zhu, W.; Wong, S.-M.; Zhu, G. The China orchid industry: Past and future perspectives. Ornam. Plant Res. 2024, 4, e002. [Google Scholar] [CrossRef]
  18. Schenk, J.J.; Becklund, L.E.; Carey, S.J.; Fabre, P.P. What is the “modified” CTAB protocol? Characterizing modifications to the CTAB DNA extraction protocol. Appl. Plant Sci. 2023, 11, e11517. [Google Scholar] [CrossRef]
  19. Dong, S.; Li, X.; Liu, Q.; Zhu, T.; Tian, A.; Chen, N.; Tu, X. Comparative genomics uncovers evolutionary drivers of locust migratory adaptation. BMC Genom. 2025, 26, 203. [Google Scholar] [CrossRef]
  20. Zhu, K.; Du, P.; Xiong, J.; Ren, X.; Sun, C.; Tao, Y.; Ding, Y.; Xu, Y.; Meng, H.; Wang, C.-C.; et al. Comparative Performance of the MGISEQ-2000 and Illumina X-Ten Sequencing Platforms for Paleogenomics. Front. Genet. 2021, 12, 745508. [Google Scholar] [CrossRef]
  21. Ai, Y.; Li, Z.; Sun, W.; Chen, J.; Zhang, D.; Ma, L.; Chen, M.-K.; Zheng, Q.-D.; Liu, J.-F.; Jiang, Y.-T.; et al. The Cymbidium genome reveals the evolution of unique morphological traits. Hortic. Res. 2021, 8, 255. [Google Scholar] [CrossRef] [PubMed]
  22. Jung, Y.; Han, D. BWA-MEME: BWA-MEM emulated with a machine learning approach. Bioinformatics 2022, 38, 2404–2413. [Google Scholar] [CrossRef]
  23. Van der Auwera Geraldine, A.; Carneiro, M.O.; Hartl, C.; Poplin, R.; Del Angel, G.; Levy-Moonshine, A.; Jordan, T.; Shakir, K.; Roazen, D.; Thibault, J.; et al. From FastQ data to high confidence variant calls: The Genome Analysis Toolkit best practices pipeline. Curr. Protoc. Bioinform. 2013, 43, 11.10.1–11.10.33. [Google Scholar] [CrossRef]
  24. Bu, D.; Luo, H.; Huo, P.; Wang, Z.; Zhang, S.; He, Z.; Wu, Y.; Zhao, L.; Liu, J.; Guo, J.; et al. KOBAS-i: Intelligent prioritization and exploratory visualization of biological functions for gene enrichment analysis. Nucleic Acids Res. 2021, 49, W317–W325. [Google Scholar] [CrossRef]
  25. Kumar, S.; Stecher, G.; Li, M.; Knyaz, C.; Tamura, K. MEGA X: Molecular Evolutionary Genetics Analysis across Computing Platforms. Mol. Biol. Evol. 2018, 35, 1547–1549. [Google Scholar] [CrossRef]
  26. Lawson, D.J.; Van Dorp, L.; Falush, D. A tutorial on how not to over-interpret STRUCTURE and ADMIXTURE bar plots. Nat. Commun. 2018, 9, 3258. [Google Scholar] [CrossRef]
  27. Herrando-Pérez, S.; Tobler, R.; Huber, C.D. Smartsnp, an r package for fast multivariate analyses of big genomic data. Methods Ecol. Evol. 2021, 12, 2084–2093. [Google Scholar] [CrossRef]
  28. Ong, J.; MacGregor, S. Implementing MR-PRESSO and GCTA-GSMR for pleiotropy assessment in Mendelian randomization studies from a practitioner’s perspective. Genet. Epidemiol. 2019, 43, 609–616. [Google Scholar] [CrossRef]
  29. Zhang, C.; Dong, S.; Xu, J.; He, W.; Yang, T. PopLDdecay: A fast and effective tool for linkage disequilibrium decay analysis based on variant call format files. Bioinformatics 2019, 35, 1786–1788. [Google Scholar] [CrossRef] [PubMed]
  30. Liu, K.; Muse, S.V. PowerMarker: An integrated analysis environment for genetic marker analysis. Bioinformatics 2005, 21, 2128–2129. [Google Scholar] [CrossRef] [PubMed]
  31. Peakall, R.; Smouse, P.E. GenAlEx 6.5: Genetic analysis in Excel. Population genetic software for teaching and research—An update. Bioinformatics 2012, 28, 2537–2539. [Google Scholar] [CrossRef] [PubMed]
  32. Danecek, P.; Auton, A.; Abecasis, G.; Albers, C.A.; Banks, E.; DePristo, M.A.; Handsaker, R.E.; Lunter, G.; Marth, G.T.; Sherry, S.T.; et al. The variant call format and VCFtools. Bioinformatics 2011, 27, 2156–2158. [Google Scholar] [CrossRef] [PubMed]
  33. Chang, C.C.; Chow, C.C.; Tellier, L.C.; Vattikuti, S.; Purcell, S.M.; Lee, J.J. Second-generation PLINK: Rising to the challenge of larger and richer datasets. Gigascience 2015, 4, 7. [Google Scholar] [CrossRef]
  34. Yang, X.; Dong, X.; Li, K.; Zhang, Y.; Xu, C.; Huo, H.; Tian, L.; Xu, J.; Liu, C.; Qi, D.; et al. The Genetic Diversity, Population Structure, and Historical Dynamics of Wild Pyrus Species on the Yunnan–Kweichow Plateau. Horticulturae 2025, 11, 106. [Google Scholar] [CrossRef]
  35. Li, X.; Gao, W.; Guo, H.; Zhang, X.; Fang, D.D.; Lin, Z. Development of EST-based SNP and InDel markers and their utilization in tetraploid cotton genetic mapping. BMC Genom. 2014, 15, 1046. [Google Scholar] [CrossRef]
  36. Feng, H.; Du, Q.; Jiang, Y.; Jia, Y.; He, T.; Wang, Y.; Chapman, B.; Yu, J.; Zhang, H.; Gu, M.; et al. Hordeum I genome unlocks adaptive evolution and genetic potential for crop improvement. Nat. Plants 2025, 11, 438–4352. [Google Scholar] [CrossRef]
  37. Nocchi, G.; Whiting, J.R.; Yeaman, S. Repeated global adaptation across plant species. Proc. Natl. Acad. Sci. USA 2024, 121, e2406832121. [Google Scholar] [CrossRef]
  38. Li, X.; Li, W.; Di, C.; Xie, M.; Jin, L.; Huang, C.; Wu, D. Development of Genic Simple Sequence Repeat Panels for Population Classification of Chinese Cymbidium Species. J. Am. Soc. Hortic. Sci. 2016, 141, 125–130. [Google Scholar] [CrossRef]
  39. Chen, X.; Peng, D.; Lan, S.; Chen, J.; Fu, W. Characterization of the complete chloroplast genome of Paphiopedilum micranthum, an Endangered orchid in China. Mitochondrial DNA Part B Resour. 2020, 5, 115–116. [Google Scholar] [CrossRef]
  40. Li, X.; Xu, W.; Chowdhury, M.R.; Jin, F. Comparative proteomic analysis of labellum and inner lateral petals in Cymbidium ensifolium flowers. Int. J. Mol. Sci. 2014, 15, 19877–19897. [Google Scholar] [CrossRef]
  41. Yang, F.; Gao, J.; Wei, Y.; Ren, R.; Zhang, G.; Lu, C.-Q.; Jin, J.-P.; Ai, Y.; Wang, Y.-Q.; Chen, L.-J.; et al. The genome of Cymbidium sinense revealed the evolution of orchid traits. Plant Biotechnol. J. 2021, 19, 2501–2516. [Google Scholar] [CrossRef]
  42. Zhou, Z.; Ying, Z.; Wu, Z.; Yang, Y.; Fu, S.; Xu, W.; Yao, L.; Zeng, A.; Huang, J.; Lan, S.; et al. Anthocyanin Genes Involved in the Flower Coloration Mechanisms of Cymbidium kanran. Front. Plant Sci. 2021, 12, 737815. [Google Scholar] [CrossRef]
  43. Ren, R.; Wei, Y.; Ahmad, S.; Jin, J.; Gao, J.; Lu, C.; Zhu, G.; Yang, F. Identification and Characterization of NPR1 and PR1 Homologs in Cymbidium orchids in Response to Multiple Hormones, Salinity and Viral Stresses. Int. J. Mol. Sci. 2020, 21, 1977. [Google Scholar] [CrossRef] [PubMed]
  44. Lu, J.; Hu, X.; Liu, J.; Wang, H. Genetic diversity and population structure of 151 Cymbidium sinense cultivars. Afr. J. Wood Sci. For. 2013, 1, 104–114. [Google Scholar]
  45. Wu, Q.; Dong, S.; Zhao, Y.; Yang, L.; Qi, X.; Ren, Z.; Dong, S.; Cheng, J. Genetic diversity, population genetic structure and gene flow in the rare and endangered wild plant Cypripedium macranthos revealed by genotyping-by-sequencing. BMC Plant Biol. 2023, 23, 254. [Google Scholar] [CrossRef]
  46. Morrell, P.L.; Buckler, E.S.; Ross-Ibarra, J. Crop genomics: Advances and applications. Nat. Rev Genet. 2012, 13, 85–96. [Google Scholar] [CrossRef]
  47. Huang, X.; Wei, X.; Sang, T.; Zhao, Q.; Feng, Q.; Zhao, Y.; Li, C.; Zhu, C.; Lu, T.; Zhang, Z.; et al. Genome-wide association studies of 14 agronomic traits in rice landraces. Nat. Genet. 2010, 42, 961–967. [Google Scholar] [CrossRef]
  48. Yan, J.; Shah, T.; Warburton, M.L.; Buckler, E.S.; McMullen, M.D.; Crouch, J. Genetic characterization and linkage disequilibrium estimation of a global maize collection using SNP markers. PLoS ONE 2009, 4, e8451. [Google Scholar] [CrossRef]
  49. Liu, J.; Huang, J.; Guo, H.; Lan, L.; Wang, H.; Xu, Y.; Yang, X.; Li, W.; Tong, H.; Xiao, Y.; et al. The Conserved and Unique Genetic Architecture of Kernel Size and Weight in Maize and Rice. Plant Physiol. 2017, 175, 774–785. [Google Scholar] [CrossRef]
  50. Geppert, C.; Perazza, G.; Wilson, R.J.; Bertolli, A.; Prosser, F.; Melchiori, G.; Marini, L. Consistent population declines but idiosyncratic range shifts in Alpine orchids under global change. Nat. Commun. 2020, 11, 5835. [Google Scholar] [CrossRef] [PubMed]
Figure 1. Cymbidium species sample locations from Fujian, China (sample CE-YTCF (C. ensifolium) was collected from Yongtai County, CS_NJHBL2 (C. sinense) was collected from Nanjing County, Zhangzhou City; CF-JAGS-3 from Gushan, Fuzhou City; CF-JOJY-1 from Jian’ou City; CF-MHQS from Minhou County; CF-SWJS-2 and CF-SWJS-3 from Shaowu City; CF-YTDY-2 and CF-YTXD-1 from Yongtai County (C. floribundum); CK-MHDH-1 and CK-MHLY-1 from Minhou County; and CK-YTHBL5 and CK-YTNK2 from Yongtai County (C. kanran)).
Horticulturae 11 00944 g001
Figure 2. Distribution of variant genes across chromosomes. (A) Genome-wide distribution of variant genes. (B). Chromosomal density distribution of genes containing SNP variants. (C). Chromosomal density distribution of genes containing InDel variants.
Horticulturae 11 00944 g002
Figure 3. Variant genes enriched in KEGG pathways. (A). C. ensifolium. (B). C. floribundum. (C). C. kanran. (D). C. sinense.
Horticulturae 11 00944 g003
Figure 4. Genetic evolutionary relationships of four Cymbidium species from Fujian. (A). Cross-validation error rate of K value. (B). Clustering results of samples corresponding to each K value. (C). NJ phylogenetic tree of four Cymbidium species. (D). 3D principal component analysis (PCA) clustering. (E). Heatmap of genetic relatedness. (F). Linkage disequilibrium (LD) decay patterns among populations.
Horticulturae 11 00944 g004
Table 1. Quality statistics of whole-genome resequencing data for Cymbidium species in Fujian.
Sample IDSpeciesTotal ReadsQ30 (%)GC (%)Mapped (%)Coverage_1X (%)
CE-YTCFC. ensifolium182,181,61097.9834.8199.2678.63
CF-JAGS-3C. floribundum179,063,05498.0334.3896.9860.93
CF-JOJY-1C. floribundum182,426,59097.9835.6294.5260.44
CF-MHQSC. floribundum179,429,90698.3335.3697.6060
CF-SWJS-2C. floribundum177,184,41898.0234.8597.6459.82
CF-SWJS-3C. floribundum179,751,90897.8633.6497.2660.55
CF-YTDY-2C. floribundum182,340,75298.3034.6697.7360.06
CF-YTXD-1C. floribundum180,713,39297.7834.4096.8660.46
CK-MHDH-1C. kanran182,680,74297.9035.3899.1474.49
CK-MHLY-1C. kanran182,416,93098.0634.9499.2674.42
CK-YTHBL5C. kanran181,081,04297.8235.1899.1473.90
CK-YTNK2C. kanran176,434,47698.2938.1198.8370.35
CS-NJHBL2C. sinense181,733,73498.0734.9598.8274.01
Disclaimer/Publisher’s Note: The statements, opinions and data contained in all publications are solely those of the individual author(s) and contributor(s) and not of MDPI and/or the editor(s). MDPI and/or the editor(s) disclaim responsibility for any injury to people or property resulting from any ideas, methods, instructions or products referred to in the content.