Article

Transcriptome Analysis Reveals Potential Mechanism of Regulating Fruit Shape of ‘Laiyang Cili’ Pear with Calyx Excision Treatment

1
Shandong Institute of Pomology, LongTan Road No. 66, Taian 271000, China
2
Wenzhou Academy of Agricultural Sciences, Liuhongqiao Road No. 1000, Wenzhou 325006, China
*
Authors to whom correspondence should be addressed.
Horticulturae 2025, 11(8), 939; https://doi.org/10.3390/horticulturae11080939
Submission received: 1 July 2025 / Revised: 4 August 2025 / Accepted: 6 August 2025 / Published: 8 August 2025

Abstract

Fruit shape is an important quality and yield trait of pear, and the fruit shape of ‘Laiyang Cili’ presents a spindle shape which seriously affects its commercial value. Calyx excision treatment could change the fruit shape, while the underlying genes and their regulatory mechanism remain poorly understood. In this study, we constructed RNA-seq libraries of pear treated with calyx excision to explore underlying regulatory mechanisms. At the early stage of the calyx excision treatment, the numbers of differentially expressed genes (DEGs) between each comparison group were relatively high and gradually decreased along with fruit development. The expression pattern of the DEGs ranked in the top 30 of the six groups had obvious divergence, and DEGs were mainly distributed in the “after calyx excision treatment (0 days)” (AC0d) and AC2d groups. The DEGs were mainly enriched in plant hormone signal transduction and plant defense response. We identified 17 candidate genes related to fruit shape and tested their expression patterns along with fruit development. Among them, nine candidate genes expression trends were consistent with fragments per kilobase of exon model per million mapped fragment (FPKM) values, including MYB62, outer envelope pore protein 62 (OEP62), auxin response factor 3 (ARF3), auxin-responsive protein 50 (SAUR50), protein phosphatase 2C 51 (PP2C 51), major allergen Pyr c 1 (PYRC1), aquaporin TIP1-3 (TIP1-3), transcription factor TGA4 (TGA4) and auxin-responsive protein 17 (IAA17). And then, weighted gene co-expression network analysis (WGCNA) analysis revealed that the OVATE family protein (OFP) and SUN domain-containing protein (SUN) were divided into the MEblue model, which had a positive correlation with calyx excision treatment, and the expression trend of LOC103960706 (OFP8) appeared cohesive with FPKM values. Pbr014104.1 and Pbr016952.1, which were the ortholog genes of LOC103960706, were further identified from the pear genome, and were found to be highly expressed in pear fruit through RT-PCR analysis. Taken together, the key stage determining the development of fruit shape was in the early stage after calyx excision treatment, and fruit shape regulation and development were co-regulated by multiple genes.

1. Introduction

Fruit shape was one of the important indexes of fruit and vegetable grading, which is a quantitative trait controlled by multiple genes. Several key protein families, including SUN, OFP, and TRM (TONNEAU1 recruiting motif) have been cloned and shown to play important roles in the regulation of fruit shape/size in arabidopsis, tomato, rice, and other species [1,2,3]. SUN is one of the major genes controlling the elongated fruit shape of tomato. SUN encodes a protein belonging to the IQ67 domain (IQD) family and is a positive regulatory factor involved in regulating fruit shape development [4]. The IQD domain is one of important components of NET3C-KLCR1-IQD2, acting as an actin–microtubule bridging complex, regulating cytoskeletal and ER structure at endoplasmic reticulum–plasma membrane (ER-PM) contact sites [5]. IQD could recruit the calmodulin (CaM) to the microtube to integrate intracellular Ca2+ signals, and then regulate fruit shape development [5,6]. Additionally, IQD provided an assortment of platform proteins for integrating CaM-dependent Ca2+ signaling at multiple cellular sites to regulate cell function, shape, and growth [7]. CsSUN could be key in forming the round shape of cucumber [8]. In arabidopsis, auxin application could lead to the expression of certain IQDs being up-regulated, implying a link between certain IQD family members and auxin [9]. OFP regulates the structure of cytoskeleton and encodes a negative regulatory factor that inhibits fruit elongation. A single mutation with a premature stop codon causes the transition of tomato fruit from round to pear-shaped [10,11]. AtOFP1 is an active transcriptional repressor that has a role in regulating cell elongation through the gibberellin pathway, and AtGA20ox1 is a target gene of AtOFP1 [12]. CsOFP13 encoding an OVATE family protein controls fruit shape in melon [13]. OVATE could interact with KNOX and BELL to impact fruit shape during the early stage of gynoecium development [11,14]. In addition, OFP can also interact with TRM to regulate fruit shape via microtubule array organization [15]. In peach, PpOFP1 could interact with PpTRM17 and repress vertical elongation in flat-shaped fruits at the early stage of development, resulting in the flat fruit shape [16,17]. Plant hormones and transcription factors are all closely related to fruit shape, especially auxin and gibberellins (GA), basic helix–loop–helix (bHLH), and AP2/ERF. In wild-type tomato, exogenous application of gibberellin synthesis inhibitor can make fruits larger and flatter [18]. The paclobutrazol-resistant 2 (PRE2) belonged to the bHLH family protein is induced by GA and mediates the plant response to gibberellin [19,20,21].
Pear fruit shape is diverse, and the types of variations are abundant. The mechanism of regulating pear fruit shape is complex, due to their being perennial crops with a long juvenile period and a highly heterozygous genetic background. Therefore, research on pear fruit shape regulation is relatively slow and lagging behind. Five quantitative trait loci (QTL) detected for fruit shape index were identified using amplified fragment length polymorphism (AFLP), sequence-related amplified polymorphism (SRAP), and simple sequence repeat (SSR) genetic linkage map from LG01, LG02, LG07, and LG08 [22]. PbGA2ox11 might regulate the shape of pear fruit by regulating gibberellin metabolism, and the formation of pear fruit shape during the young fruit period was preliminarily determined [23]. A total of 28 PbOFP members were identified from the pear genome, and the PbOFP11 expression level was increased in young fruit [24]. Although some QTL for fruit shape have been reported in pear, the genes responsible and the underlying mechanisms remain poorly understood.
‘Laiyang Cili’ pear (Pyrus pyrifolia) is a local cultivar from Shandong Province, China, with a cultivation history of over 300 years [25]. The fruit shape of ‘Laiyang Cili’ is spindle and the appearance trait is poor, leading to a decrease in the rate of high-quality fruit and seriously affecting economic benefits. Artificial calyx excision is one of the commonly used methods to improve its fruit shape in the cultivation and production process. It can effectively change the fruit shape from spindle to round. The plant hormones might be redistributed caused by calyx excision treatment, leading to differential expression of key genes in the plant hormone regulatory pathway, thereby affecting cell division and changes in fruit shape. On the other hand, calyx excision may alter the timing of gene expression, and inhibits or promotes the expression of potential genes in the fruit shape regulation process. In order to identify the key genes regulating pear fruit shape, we constructed relevant transcriptome data and screened potential key genes regulating fruit shape development, providing a theoretical basis for further exploration of their molecular mechanisms. It could contribute to discovering new genes regulating fruit shape and studying the relationships between these genes. Additionally, it not only provides theoretical guidance for targeted development of molecular markers, but also constructs a high-density genetic map for precise localization and accelerates the process of pear molecular breeding.

2. Materials and Methods

2.1. Plant Material

The calyx of ‘Laiyang Cili’ was removed at 21 days after flowering. A total of 12 trees were selected, and half of them were used as controls. The samples near the calyx clipping area were harvested 12 h (AC0d), 2 days (AC2d), and 30 days (AC30d) after calyx excision treatment. The pulp was cut into small pieces, and they were put into the liquid nitrogen and then transferred to −80 °C refrigerator for storage. The experiment was conducted for three biological replications. Additionally, the longitudinal diameter and transverse diameter of pear were tested at maturity stages.

2.2. Differentially Expressed Genes Screening

Total RNA was extracted using the mirVana miRNA Isolation Kit (Ambion, Austin, TX, USA) referring the manufacturer’s protocol. Agilent 2100 Bioanalyzer (Agilent, Santa Clara, CA, USA) as used to tested RNA integrity, and the libraries were constructed using TruSeq Stranded mRNA LTSample Prep Kit following the manufacturer’s instructions. Illumina sequencing platform (Illumina HiSeq × Ten) was used to sequenced these libraries. Raw data (raw reads) were processed using FASTP (V0.19.4). Low-quality reads, containing more than 5 N bases, lengths less than 75 bp, and >40% base mass <Q15, were removed to obtain clean reads. The published genome database of Pyrus_bretschneider was used as a reference to analyze the sequencing results. The sequences were annotated using the blast2GO software (V3.3) tool combined with the NR database. Then the clean reads were mapped to the pear genome using hisat2 [26]. The FPKM value of each gene was calculated using cufflinks, and the read counts of each gene were obtained by htseq-count [27]. DESeq2 was applied to carry out the elimination of biological mutations, and the threshold for significantly differential expression was defined as p < 0.05 and fold change > 2 [28]. The analysis methods of Gene Ontology (GO) enrichment and Kyoto Encyclopedia of Genes and Genomes (KEGG) pathway enrichment mainly referred to previously described [29,30,31].

2.3. The Heatmap Analysis of DEGs Ranked Top 30 of Each Group

Firstly, the DEGs ranked in the top 30 of each comparison groups, including AC0d-vs-CK1, AC0d-vs-AC2d, AC0d-vs-AC30d, AC2d-vs-CK2, AC2d-vs-AC30d, and AC30d-vs-CK3, were collected combined with p values. And then, we acquired the union of DEGs from the six groups, and 131 DEGs were identified. The average FPKM values of DEGs were immediately screened from the six groups. The FPKM values of each DEGs were standardized by log2 methods, and the heatmap analysis was performed using Metware Cloud (https://cloud.metware.cn) (accessed on 10 June 2024).

2.4. WGCNA Analysis

WGCNA is a systematic biology method used to describe the gene association patterns between different samples [32,33]. Firstly, the genes of six comparison groups were screened and the criterion was |fold change| > 1.5. Then, 4398 genes were obtained, and their FPKM values were acquired further. WGCNA was performed using the R::WGCNA software tool (R version 4.3.1, WGCNA v1.72-1), and 3298 genes were obtained through further screening. The following parameters were set: power = 10; mergeCutHeight = 0.3.

2.5. Identification and Tissue Expression Analysis of PbrOFP from Pear Genome

The PbrOFP genes were identified from the pear genome based on a previous report [24]. The sequences of arabidopsis, rice, and tomato were downloaded from Phytozome V14 (Phytozome) (accessed on 2 October 2024). The amino acid sequences of OFP were used to construct the phylogenetic tree by MEGA7.0 with NJ methods.
We downloaded PbrOFP FPKM values from the Pear Expression Database (Pear Tissue Gene) (accessed on 16 February 2025). The heatmap analysis was performed using the OmicShare Tools, a free online platform for data analysis, with the default parameters.

2.6. Reverse Transcription-Quantitative Real-Time Polymerase Chain Reaction (RT-qPCR) and RT-PCR Analysis

RT-PCR is mainly used for qualitative detection of gene expression, which contains the processes of reverse transcription and polymerase chain reaction. Moreover, the RT-qPCR is mainly used for quantitative detection of gene expression, which adding fluorescent groups to the PCR reaction system, using fluorescence signal accumulation to monitor the entire PCR process in real time, and finally quantitatively analyzing unknown templates through standard curves.
The fruits were acquired from ‘Laiyang Cili’, and the root, stem, leaf, petal, pollen, fruit, and style for RT-PCR were acquired from ‘Dangshan Suli’. The samples were stored at −80 °C. Total RNA was extracted from the frozen tissue using a Plant Total RNA Isolation Kit based on the manufacturer’s instructions (RC411, Vazyme, Nanjing, China). Reverse transcription of RNA into cDNA was conducted with HiScript III RT SuperMix, and 1 μg of total RNA was used for each sample.
RT-qPCR analysis was performed on QuantStudio™ 3 System and carried out using ChamQ SYBR qPCR Master Mix (Low ROX Premixed) (q331-03, Vazyme, Nanjing, China) according to the manufacturer’s protocol. We performed each reaction using a 20 μL mixture containing 10 μL of ChamQ SYBR qPCR Master Mix, 7 μL of nuclease-free water, 1 μL of each primer, and 1 μL of diluted cDNA. The RT-qPCR began with 5 min at 94 °C, followed by 55 cycles at 94 °C for 3 s, 60 °C for 10 s, and 30 s of extension at 72 °C. The relative expression level was calculated by the 2−ΔΔCt method [34]. The unique primers were designed using an RT-qPCR primer database (qPrimerDB—a resource for real-time quantitative PCR primers), and are shown in Table S1. Pyrus GADPH was used as the internal control gene. All RT-qPCR experiments were performed with three biological replicates.
RT-PCR analysis was performed on REpure-E Gene amplification instrument and carried out using 2 × Rapid Taq Master Mix according to the manufacturer’s protocol (P222-02, Vazyme, Nanjing, China). We performed each reaction using a 50 μL mixture containing 25 μL of 2 × Rapid Taq Master Mix, 22 μL of nuclease-free water, 1 μL of each primer, and 1 μL of diluted cDNA. The qRT-PCR began with 3 min at 95 °C, followed by 35 cycles at 95 °C for 15 s, 60 °C for 15 s and 5 s of extension at 72 °C, and then 5 min of extension at 72 °C. The PCR products were tested by polyacrylamide gel electrophoresis. The unique primers shown in Table S1. Pyrus ACT (accession no. AF386514) was used as the internal control gene.

2.7. Statistical Analysis

Statistical analysis was conducted utilizing GraphPad prism Software (V6.01). Comparisons among groups were assessed via Student’s t-test. Results are presented as mean ± standard deviation (SD). p-value < 0.05 was considered as statistically significant. The correlation between FPKM and qRT-PCR values were tested using Pearson method combined with the GraphPad prism software tool (V6.01).

3. Results

3.1. Effect of Calyx Excision on Fruit Quality of ‘Laiyang Cili’

To explore the effect of calyx excision on the ‘Laiyang Cili’, the calyx was removed at 21 days after flowering. The fruit shape traits of calyx excision had no obvious difference compared to the control at 30 days after calyx excision treatment (Figure 1A). However, the pear fruit shape changed from spindle to roundness at the maturity stage (Figure 1B). Excising calyx could significantly improve the fruit appearance quality. The average fruit weights obviously reduced compared to the control, and the longitudinal and transverse diameter significantly decreased, so the fruit shape index also decreased (Figure 1C). The above results indirectly indicated that calyx excision treatment may cause differences in genes related to fruit shape regulation, thus leading to differences in fruit shape.

3.2. Screening and Analysis of Differentially Expressed Genes (DEGs)

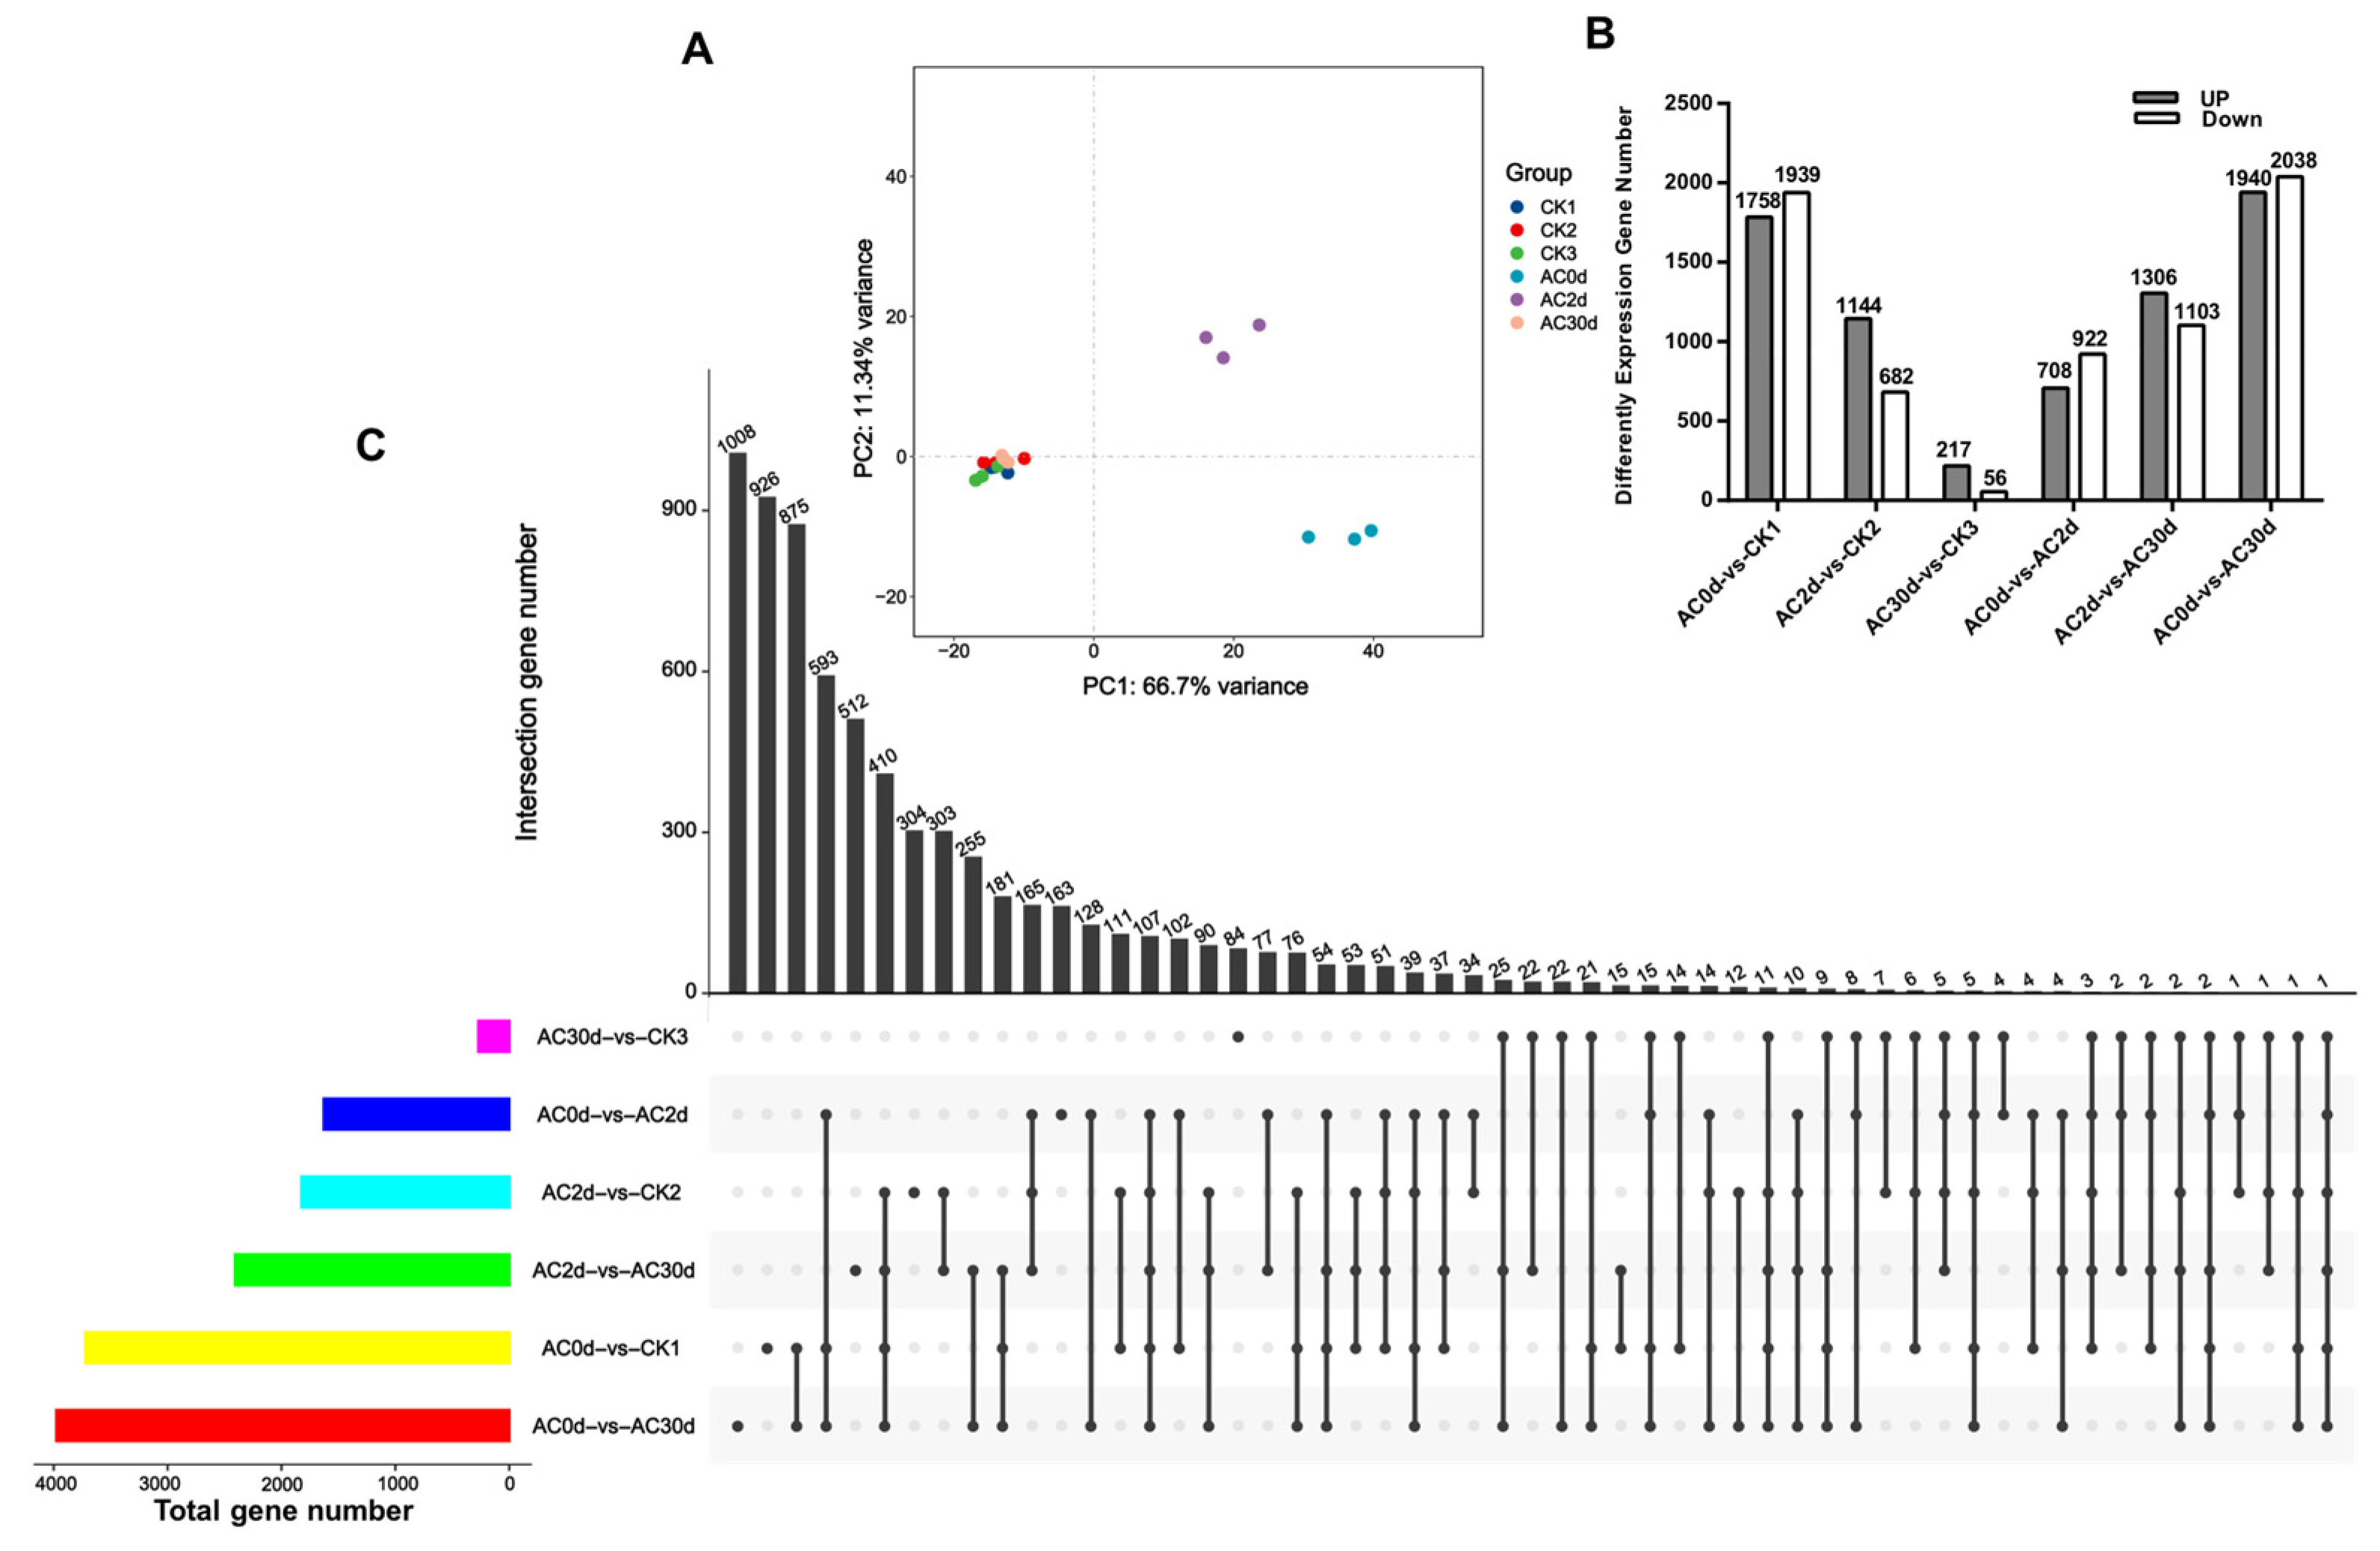
To explore the potential mechanism of fruit shape regulated by calyx excision treatment, the RNA-seq library was established along with different development processes after calyx excision treatment, including 12 h (AC0d), 2 days (AC2d), and 30 days (AC2d) after treatment. The effective data volume of the samples ranged from 6.31 to 7.5 G, and the Q30 base distribution was 92.52% to 94.1%. The average GC content was 46.37%, and the comparison rate with the reference genome was 79.6% to 81.03%. PCA analysis showed that the clusters of each group were relatively dispersed, among which the clusters of CK1, CK2, CK3, and AC30d were relatively concentrated, and the clusters of AC0d and AC2d were relatively dispersed (Figure 2A).
We established six comparison groups to further analyze DEGs after calyx excision treatment, including AC0d-vs-CK1, AC0d-vs-AC2d, AC0d-vs-AC30d, AC2d-vs-CK2, AC2d-vs-AC30d, and AC30d-vs-CK3. The DEG numbers of the six comparison groups were largely different, and the DEG numbers of AC0d-vs-CK1, AC2d-vs-CK2, AC30d-vs-CK3, AC0d-vs-AC2d, AC2d-vs-AC30d, and AC0d-vs-AC30d were 3697, 1826, 273, 1630, 2409, and 3978, respectively. Among them, the unique DEG numbers of each comparison group were 926, 304, 84, 163, 512, and 1008, respectively (Figure 2B,C). It is interesting that LOC103930013 (Aquaporin TIP1-3) was the unique common DEG among six comparison groups. In the AC30d-vs-CK3 group, the DEGs were relatively fewer than those in other groups, implying that the DEGs expressed might be the result of calyx excision treatment, and the regulatory effects of calyx excision treatment on pear growth and development might disappear after 30 days. Additionally, in the AC0d-vs-AC2d, AC2d-vs-AC30d, and AC0d-vs-AC30d groups, the number of DEGs gradually increased, but there were relatively few common genes, implying that DEGs might be involved in regulating different growth stages during fruit growth. Therefore, the key genes involved in fruit shape regulation may be expressed in the early stages under calyx excision treatment, and the two comparison groups AC2d-vs-CK2 and AC0d-vs-AC2d were the focus the following study.

3.3. Expression Level Analysis of DEGs

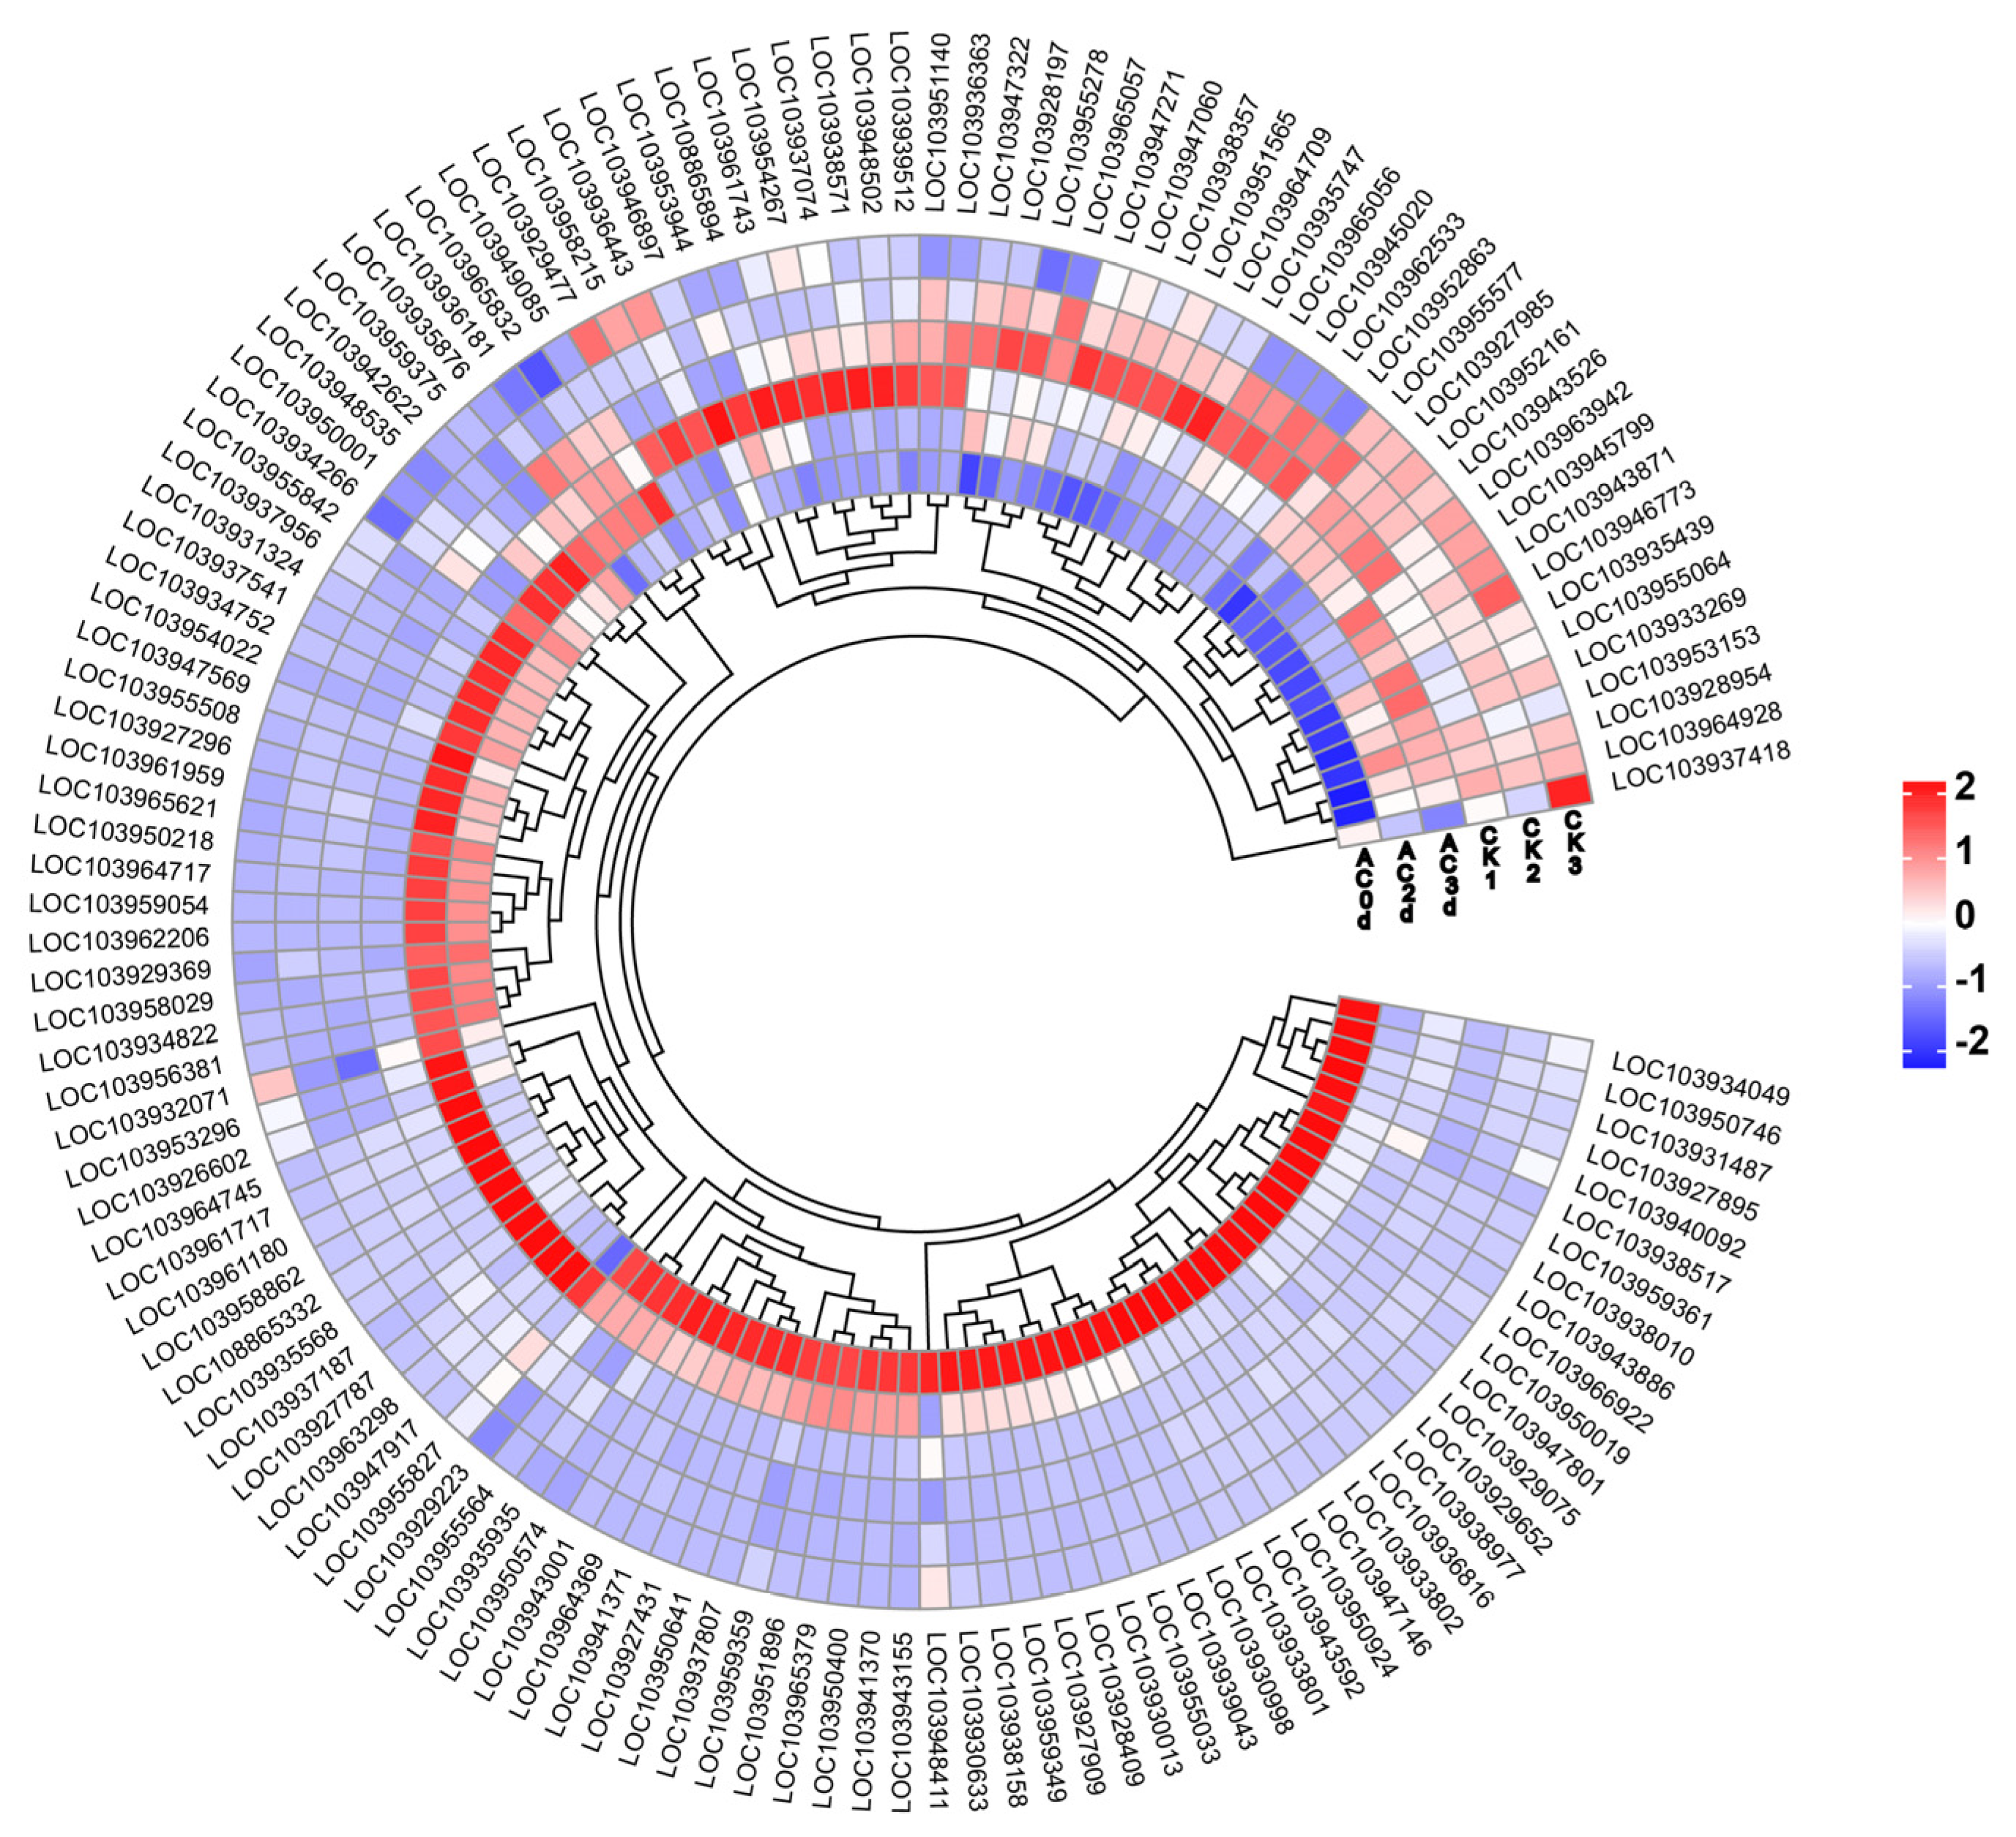
To further investigate the expression trends of DEGs of the six comparison groups, we selected the top 30 DEGs from the six groups based on p-values, and then merged them to collect 131 DEGs. The heatmap results showed that the DEGs represented obvious difference in each group. A total of 47 and 41 DEGs showed a higher expression level in AC0d and AC2d, respectively, including LOC103930998 and LOC103930013. Along with fruit development after calyx excision treatment, only 14 DEGs were expressed in AC30d, and the DEGs exhibited no obvious differences between CK groups (Figure 3). The above results implied that the number of DEGs increased at the beginning of calyx excision treatment and then decreased, implying that the genes regulating fruit growth and development had temporal and spatial expression characteristics. Additionally, in the AC0d group, the DEGs with highest FPKM values mainly included LOC103930013 (TIP1-3), LOC103959359 (Major allergen Pyr c 1), LOC103933802 (Protein exordium, EXO), LOC103950641 (MYB62), and LOC103930998 (Protein DMR6-Like oxygenase 2, DLO2). In the AC2d, the DEGs mainly included LOC103959359 (OEP162), LOC103930013 (TIP1-3), LOC103955842 (PME11), and LOC103930998 (DLO2).

3.4. GO and KEGG Analysis of DEGs

Based on the above results, we speculated that the key genes regulating fruit shape were mainly expressed in the early stage after calyx excision. Therefore, we focused on studying the DEGs of the AC2d-vs-CK2 and AC0d-vs-AC2d groups, and further analyzed the GO and KEGG pathways of the DEGs. In the AC2d-vs-CK2 group, DEGs were mainly enriched in the response to abscisic acid (54), ethylene-activated signaling pathway (36), response to oxidative stress (36), plasmodesma (83), extracellular region (95), DNA-binding transcription factor activity (170), and sequence-specific DNA binding (91). In the AC0d-vs-AC2d, most of the DEGs were mainly enriched in cell division (43), response to wounding (35), microtubule (53), apoplast (53), DNA-binding transcription factor activity (150), and microtubule binding (42) (Figure S1). In the AC2d-vs-CK2 group, the DEGs were mainly enriched in plant hormone signal transduction (ko04075), starch and sucrose metabolism (ko00500), and phenylpropanoid biosynthesis (ko00940). In the AC0d-vs-AC2d group, the DEGs were mainly enriched in amino sugar and nucleotide sugar metabolism (ko00520), cell cycle (ko04110), and terpenoid backbone biosynthesis (ko00900) (Figure S2). In the early stage, the DEGs were mainly enriched in immune regulation process, and gradually enriched towards biosynthesis-related pathways along with fruit development. Additionally, the genes involved in regulating pear fruit shape development mainly contained LOC103930090 (Auxin-responsive protein SAUR50), LOC103956683 (Auxin transporter-like protein 3), LOC103928970 (Transcription factor TGA4), LOC103931292 (Auxin-responsive protein IAA17), LOC103936499 (Auxin transporter-like protein 1), LOC103939008 (Indole-3-acetic acid-induced protein ARG7), LOC103943066 (Protein TIFY 6B), LOC103943370 (Auxin-responsive protein SAUR32), LOC103943417 (Protein phosphatase 2C 51), LOC103945995 (Auxin-induced protein AUX28), and LOC103955436 (Protein brassinazole-resistant 1).

3.5. Expression Trend Analysis of the Candidate Genes

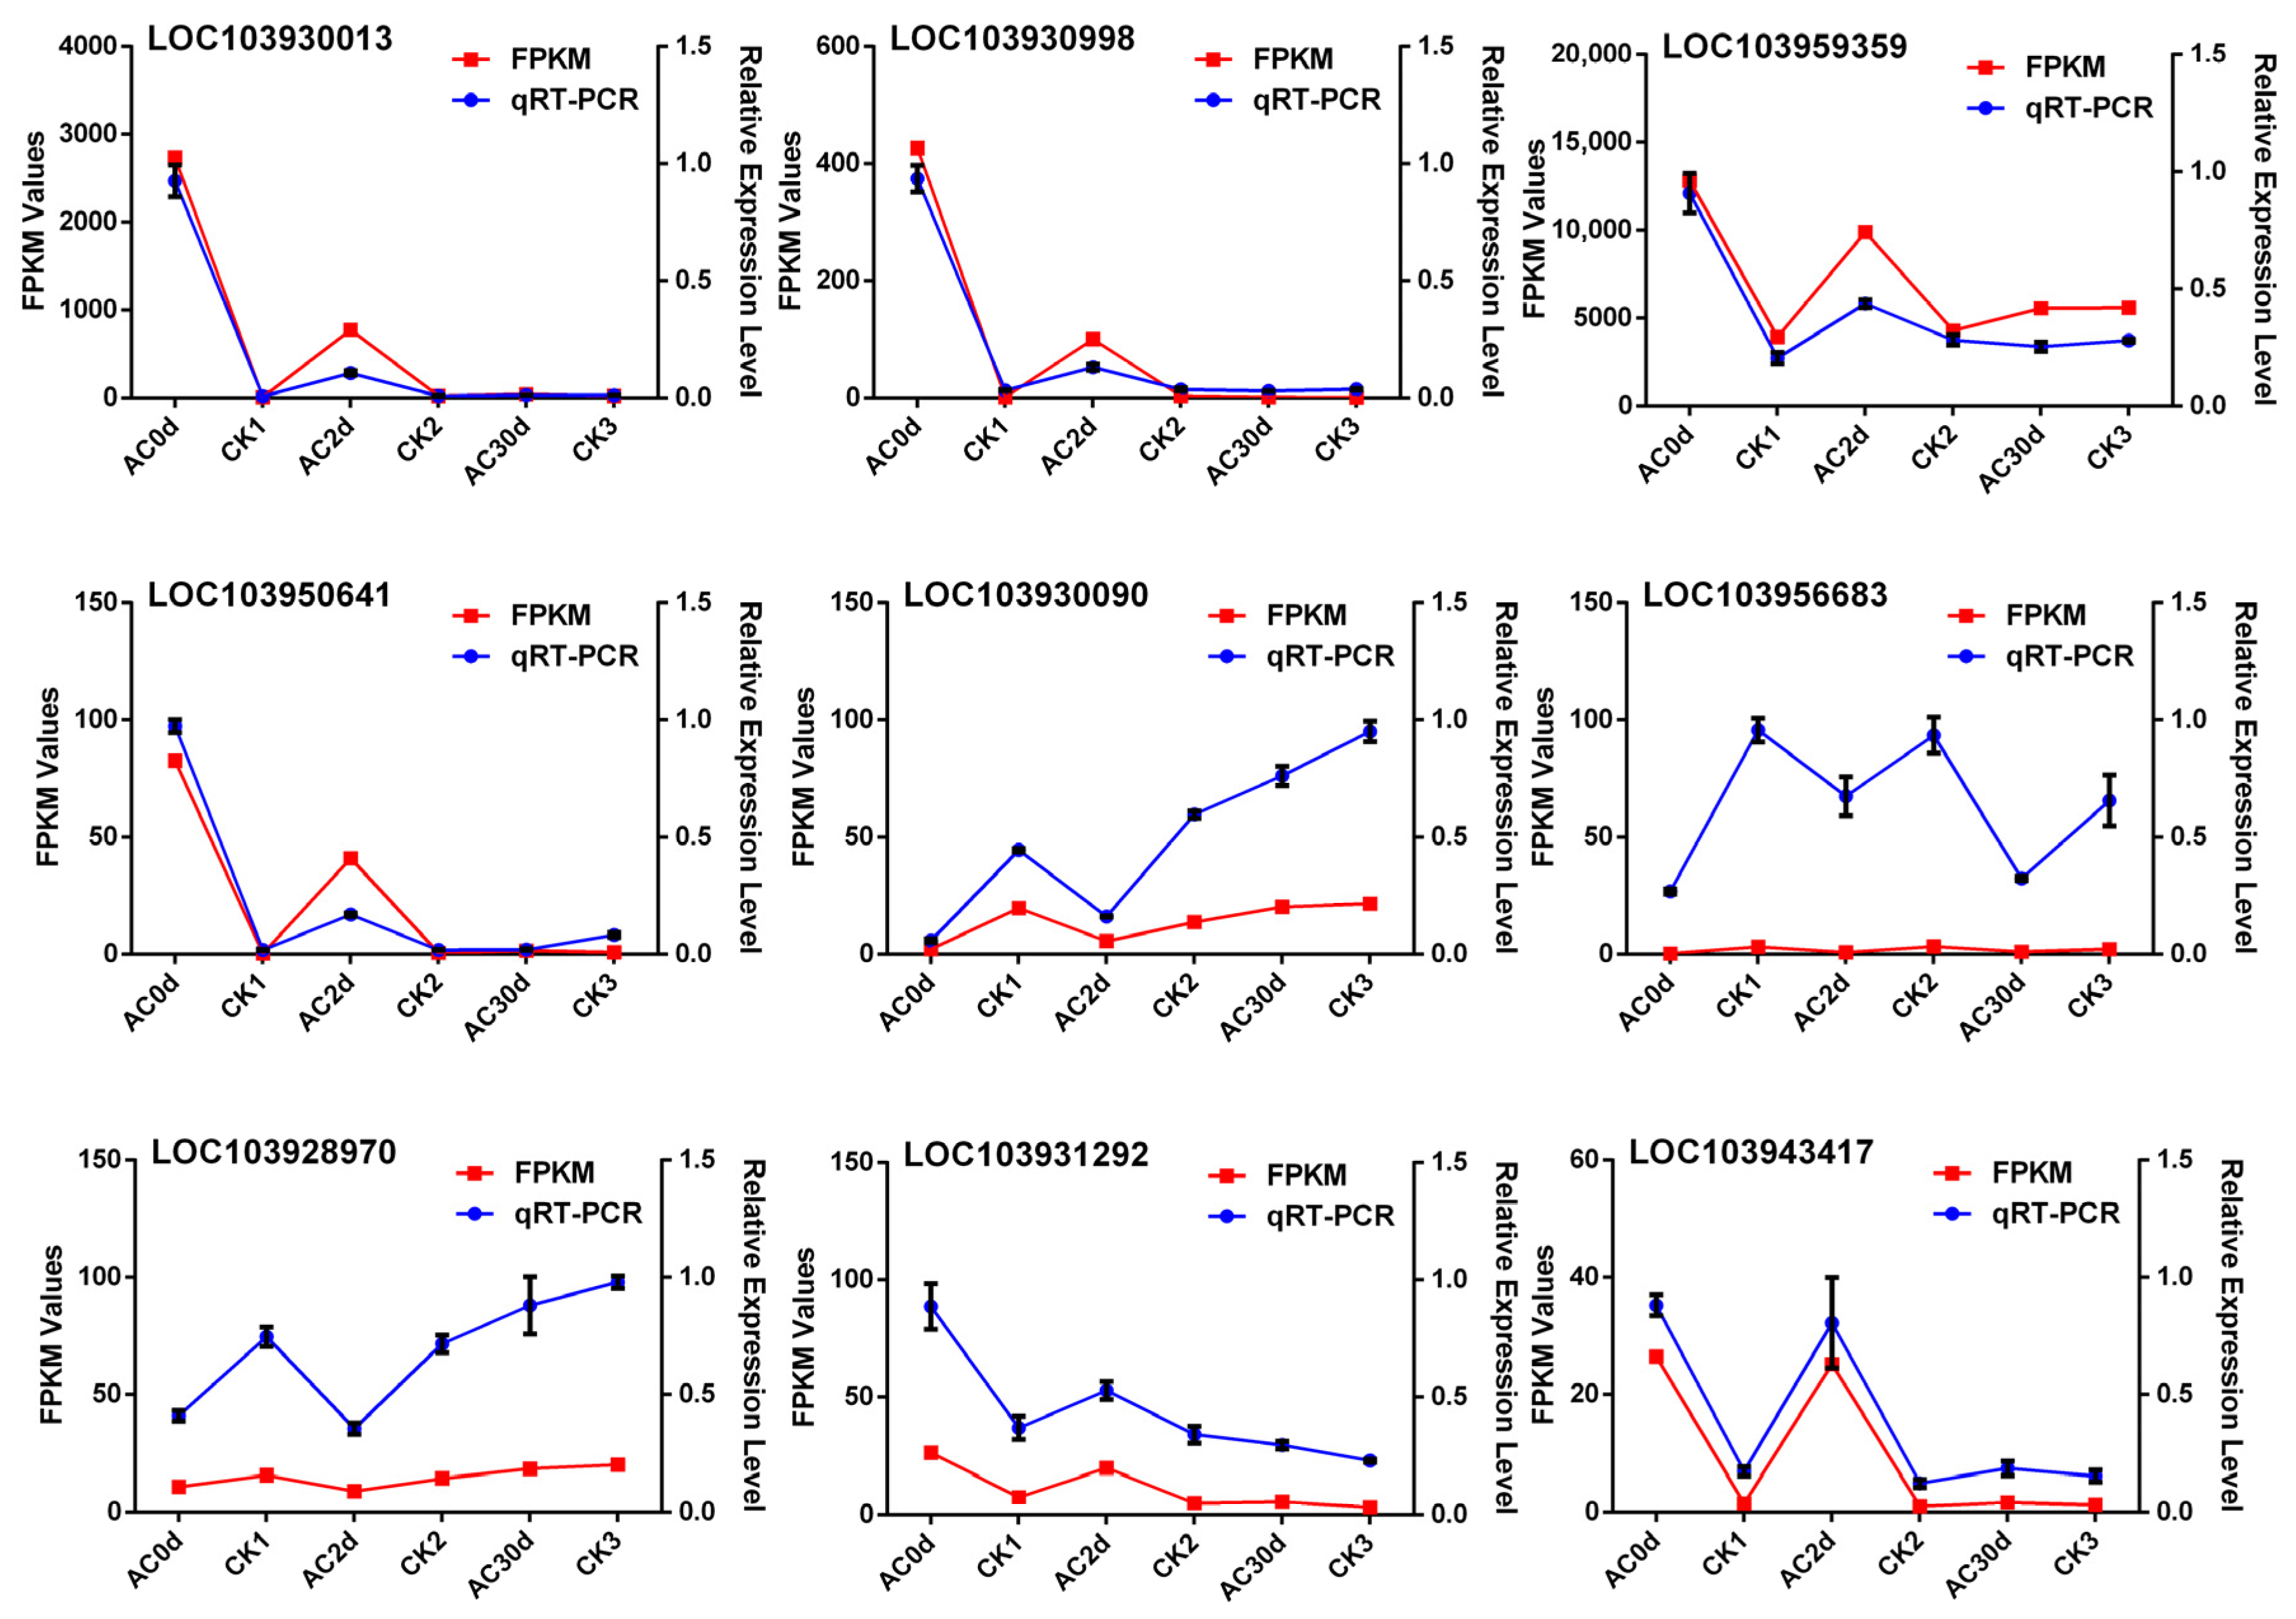
Based on the above results, we further explored the expression trend of the screened candidate genes. A total of 17 DEGs were collected to test their expression levels using RT-qPCR. The results showed that the expression trends of nine DEGs were consistent with FPKM values, including LOC103930013 (Aquaporin TIP1-3), LOC103930998, LOC103959359 (Major allergen Pyr c 1), LOC103950641 (MYB62), LOC103930090 (Auxin-responsive protein SAUR50), LOC103956683 (Auxin transporter-like protein 3, ARF3), LOC103928970 (Transcription factor TGA4), LOC103931292 (Auxin-responsive protein IAA17), and LOC103943417 (Protein phosphatase 2C 51). There was significant positive correlation between the FPKM values and RT-PCR expression levels of nine DEGs (r > 0.89, p < 0.01) (Table S2). Among them, the expression levels of LOC103930013, LOC103930998, LOC103959359, LOC103950641, LOC103931292, and LOC103943417 were higher than those in control groups. LOC103930090, LOC103956683, and LOC103928970 expression levels were down-regulated compared to the control groups (Figure 4). Additionally, the expression trends of eight DEGs were basically consistent with FPKM values (Figure S3, Table S2). The DEGs were mainly involved in plant defense response, transcriptional regulation, and plant hormone signal transduction process, implying that fruit shape regulation was a complex biological process requiring the coordinated regulation of multiple genes. Hence, the nine DEGs whose expression trends were consistent with FPKM values could serve as candidate genes for further research on exploring the mechanism of fruit shape regulation.

3.6. Identification of Potential Key Genes for Pear Shape Regulation

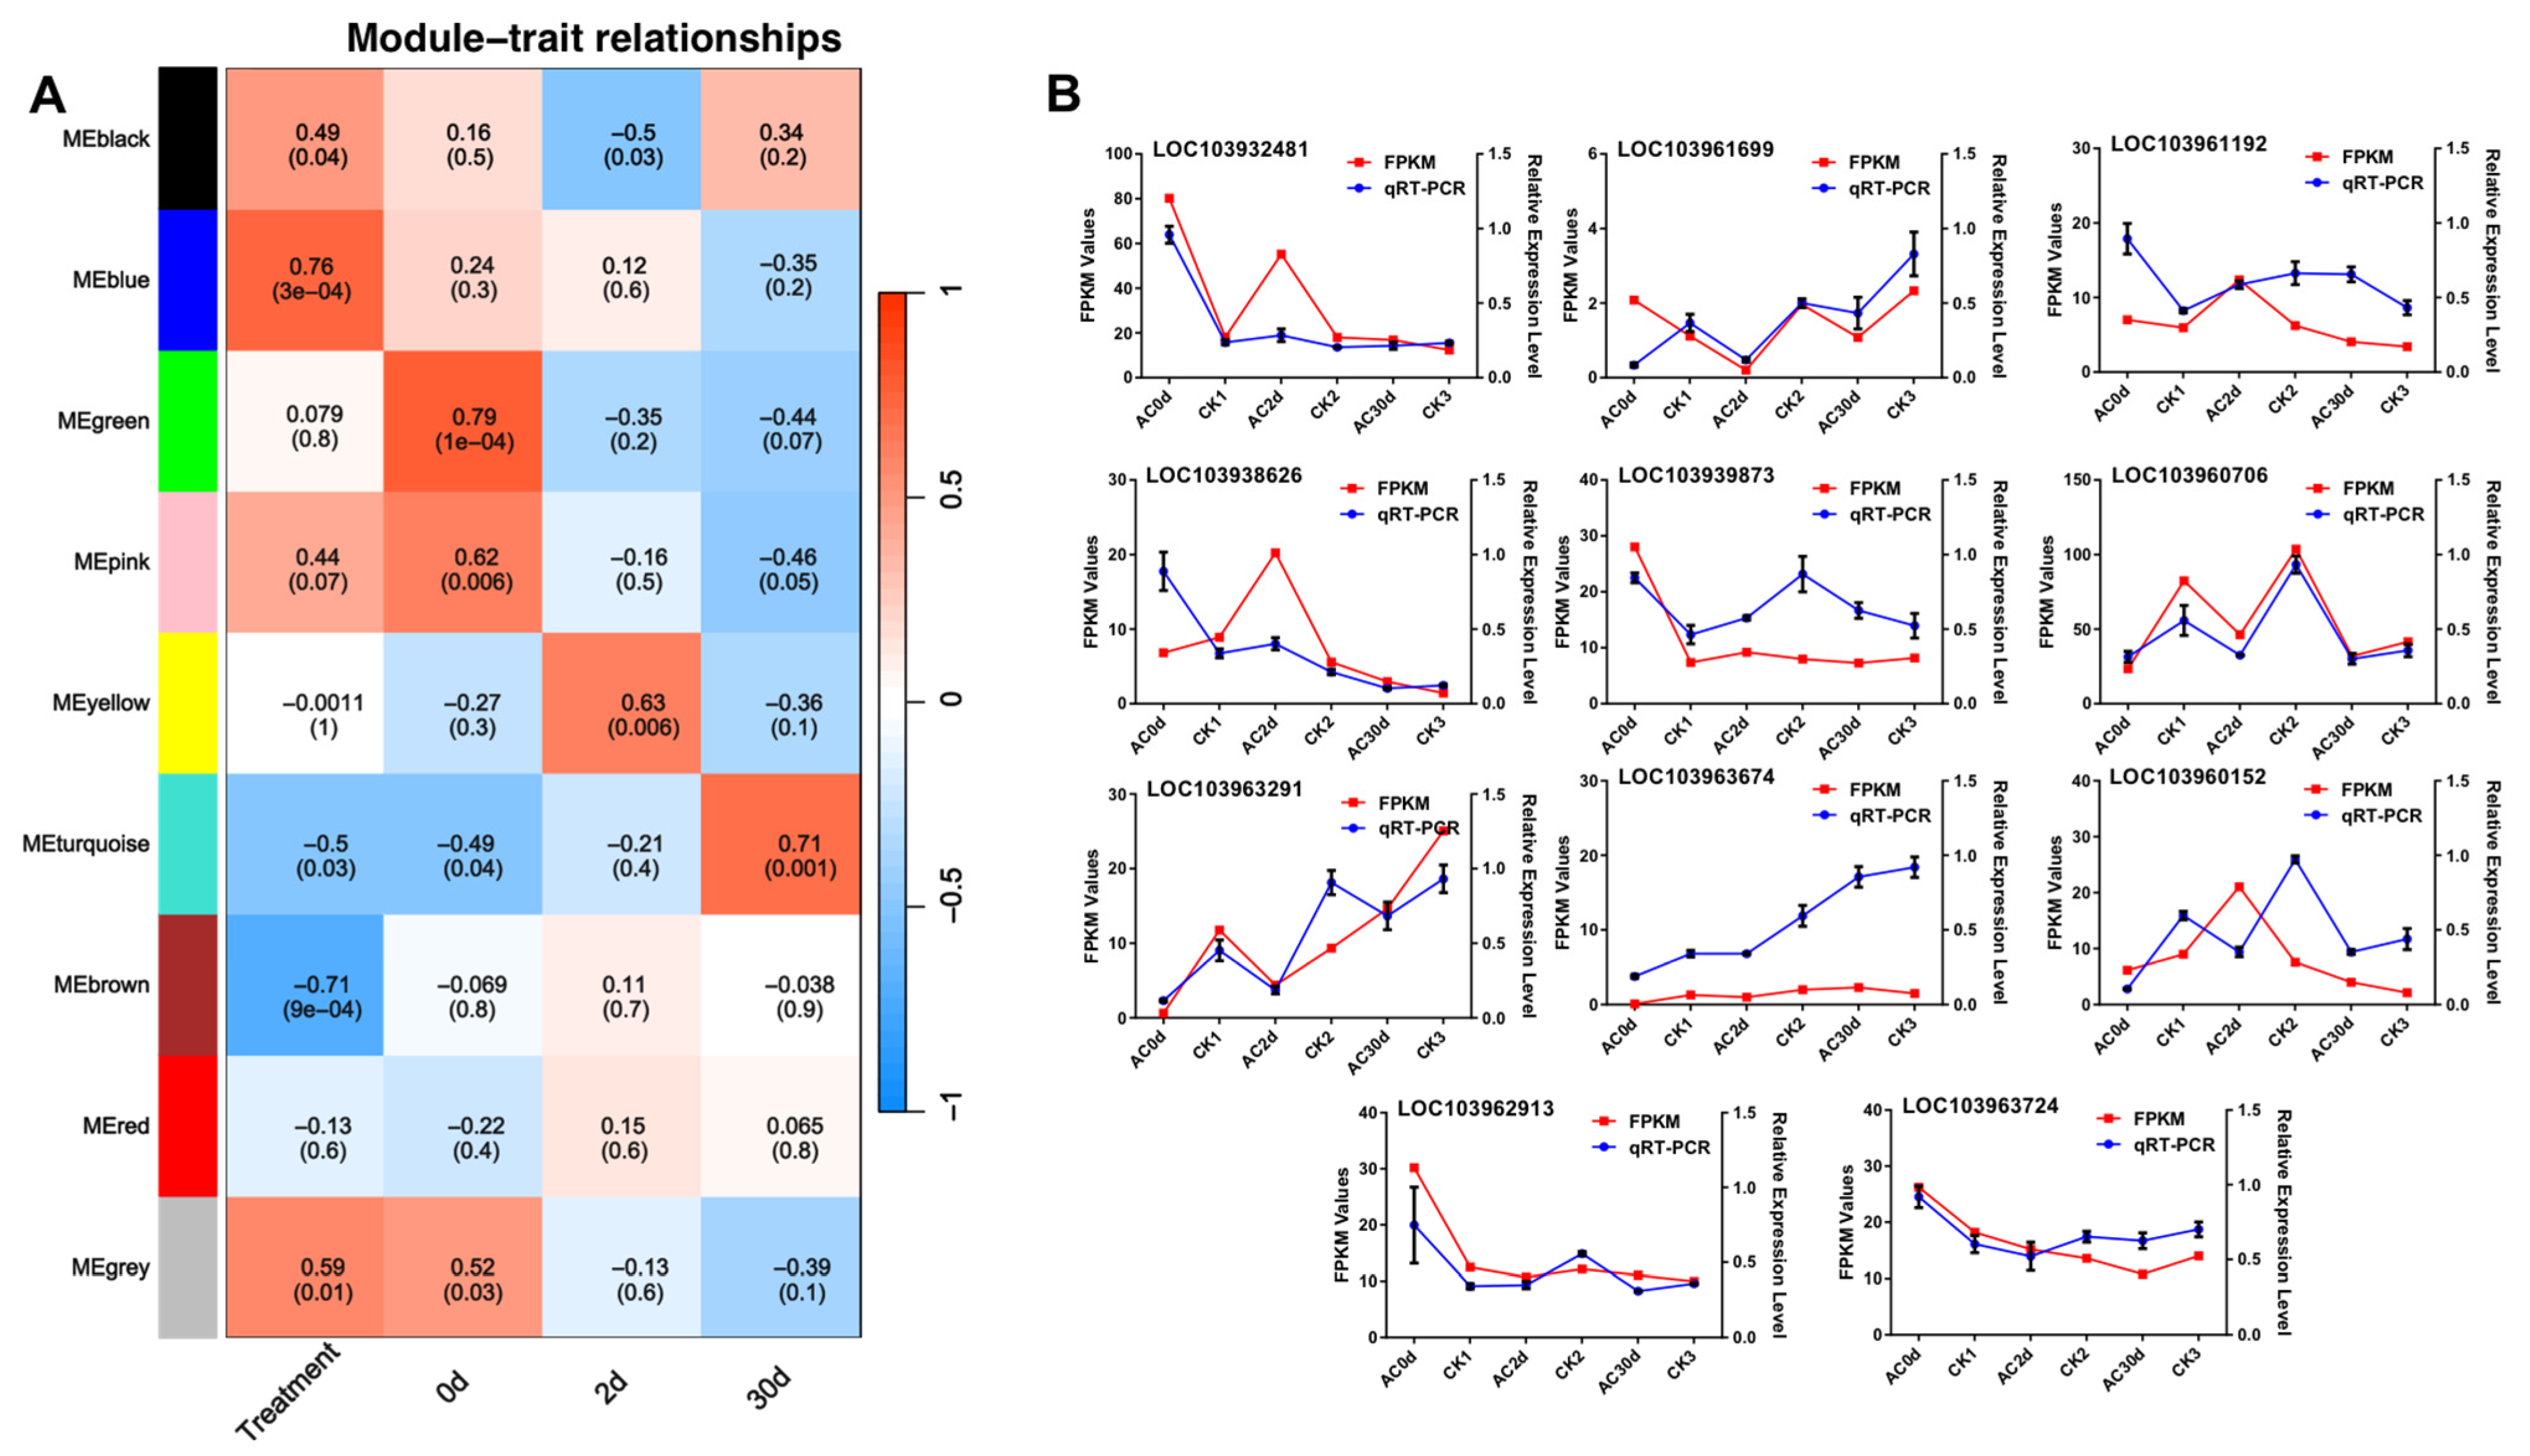
To comprehensively identify potential genes involved in fruit shape regulation, we further analyzed the association between each group using WGCNA, and nine modules were divided based on various colors. The MEblue module showed positive correlation with fruit shape regulation, indicating that the genes in this aggregation might be involved in common growth and development processes. The hub gene was LOC103932481 (Sodium/calcium exchanger NCL) and was enriched in multiple GO entries, mainly including plant-type vacuoles, calcium–sodium antiporter activity, calcium ion binding, the plasma membrane, and cellular calcium ion homeostasis. In this module, we also identified three OFP genes, including LOC103961699, LOC103961192, and LOC103938626, which were reported to contribute to regulating fruit shape. The LOC103961192 and LOC103938626 FPKM values were up-regulated at 2 days after calyx excision treatment, while LOC103961699 demonstrated the opposite expression pattern. The OFP was a transcriptional repressor and was enriched in DNA binding, nucleolus, cytoskeleton, DNA repair, negative regulation of transcription (DNA-templated), and regulation of unidimensional cell growth. Additionally, the LOC103939873 (SUN4) was also grouped into the blue module, which was reported to regulate fruit shape through the IQD domain responding to Ca2+ signals. Additionally, we also further analyzed the module containing TRM genes and found that LOC103957421 was assigned to the MEturquoise module, and the FPKM values were initially high and then exhibited a gradually decreasing trend along with calyx excision treatment. The TRM genes were enriched in DNA binding, DNA-binding transcription factor activity, nucleus, regulation of transcription (DNA-templated), and protein dimerization activity (Figure 5A). Based on the above results and previous reports, SUN, OFP, and TRM also contributed to regulating pear fruit shape, and the genes in these two aggregations might be involved in common growth and development processes.
Combined with WGCNA results, we also tested their expression levels using RT-qPCR. The results showed that the hub gene LOC103932481 (Sodium/calcium exchanger NCL) expression level was consistent with the FPKM value (r = 0.8672, p = 0.0253). The LOC103961699, LOC103961192, LOC103938626, and LOC103939873 expression levels were basically consistent with FPKM values. Their expression levels were obviously various at the early stage of calyx excision treatment, and the expression of LOC103957421 was not detected using RT-qPCR. Additionally, we also filtered all the OFP and TRM from the RNA-seq database. Four OFP and two TRM genes, which were not divided into WGCNA analysis, were detected, and their expression levels were further explored. The expression levels of LOC103960706 (r = 0.9392, p = 0.0054) and LOC103963291 (r = 0.8777, p = 0.0215) were completely consistent with FPKM values, while those of LOC103963674 and LOC103960152 were not consistent with FPKM values along with calyx excision treatment. The expression levels of two TRM genes, LOC103962913 and LOC103963724, were basically consistent with FPKM values (Figure 5B) (Table S2). Therefore, LOC103932481, LOC103960706, and LOC103962193 were identified for further exploring.

3.7. OFP Family Gene Expression Patterns Analysis

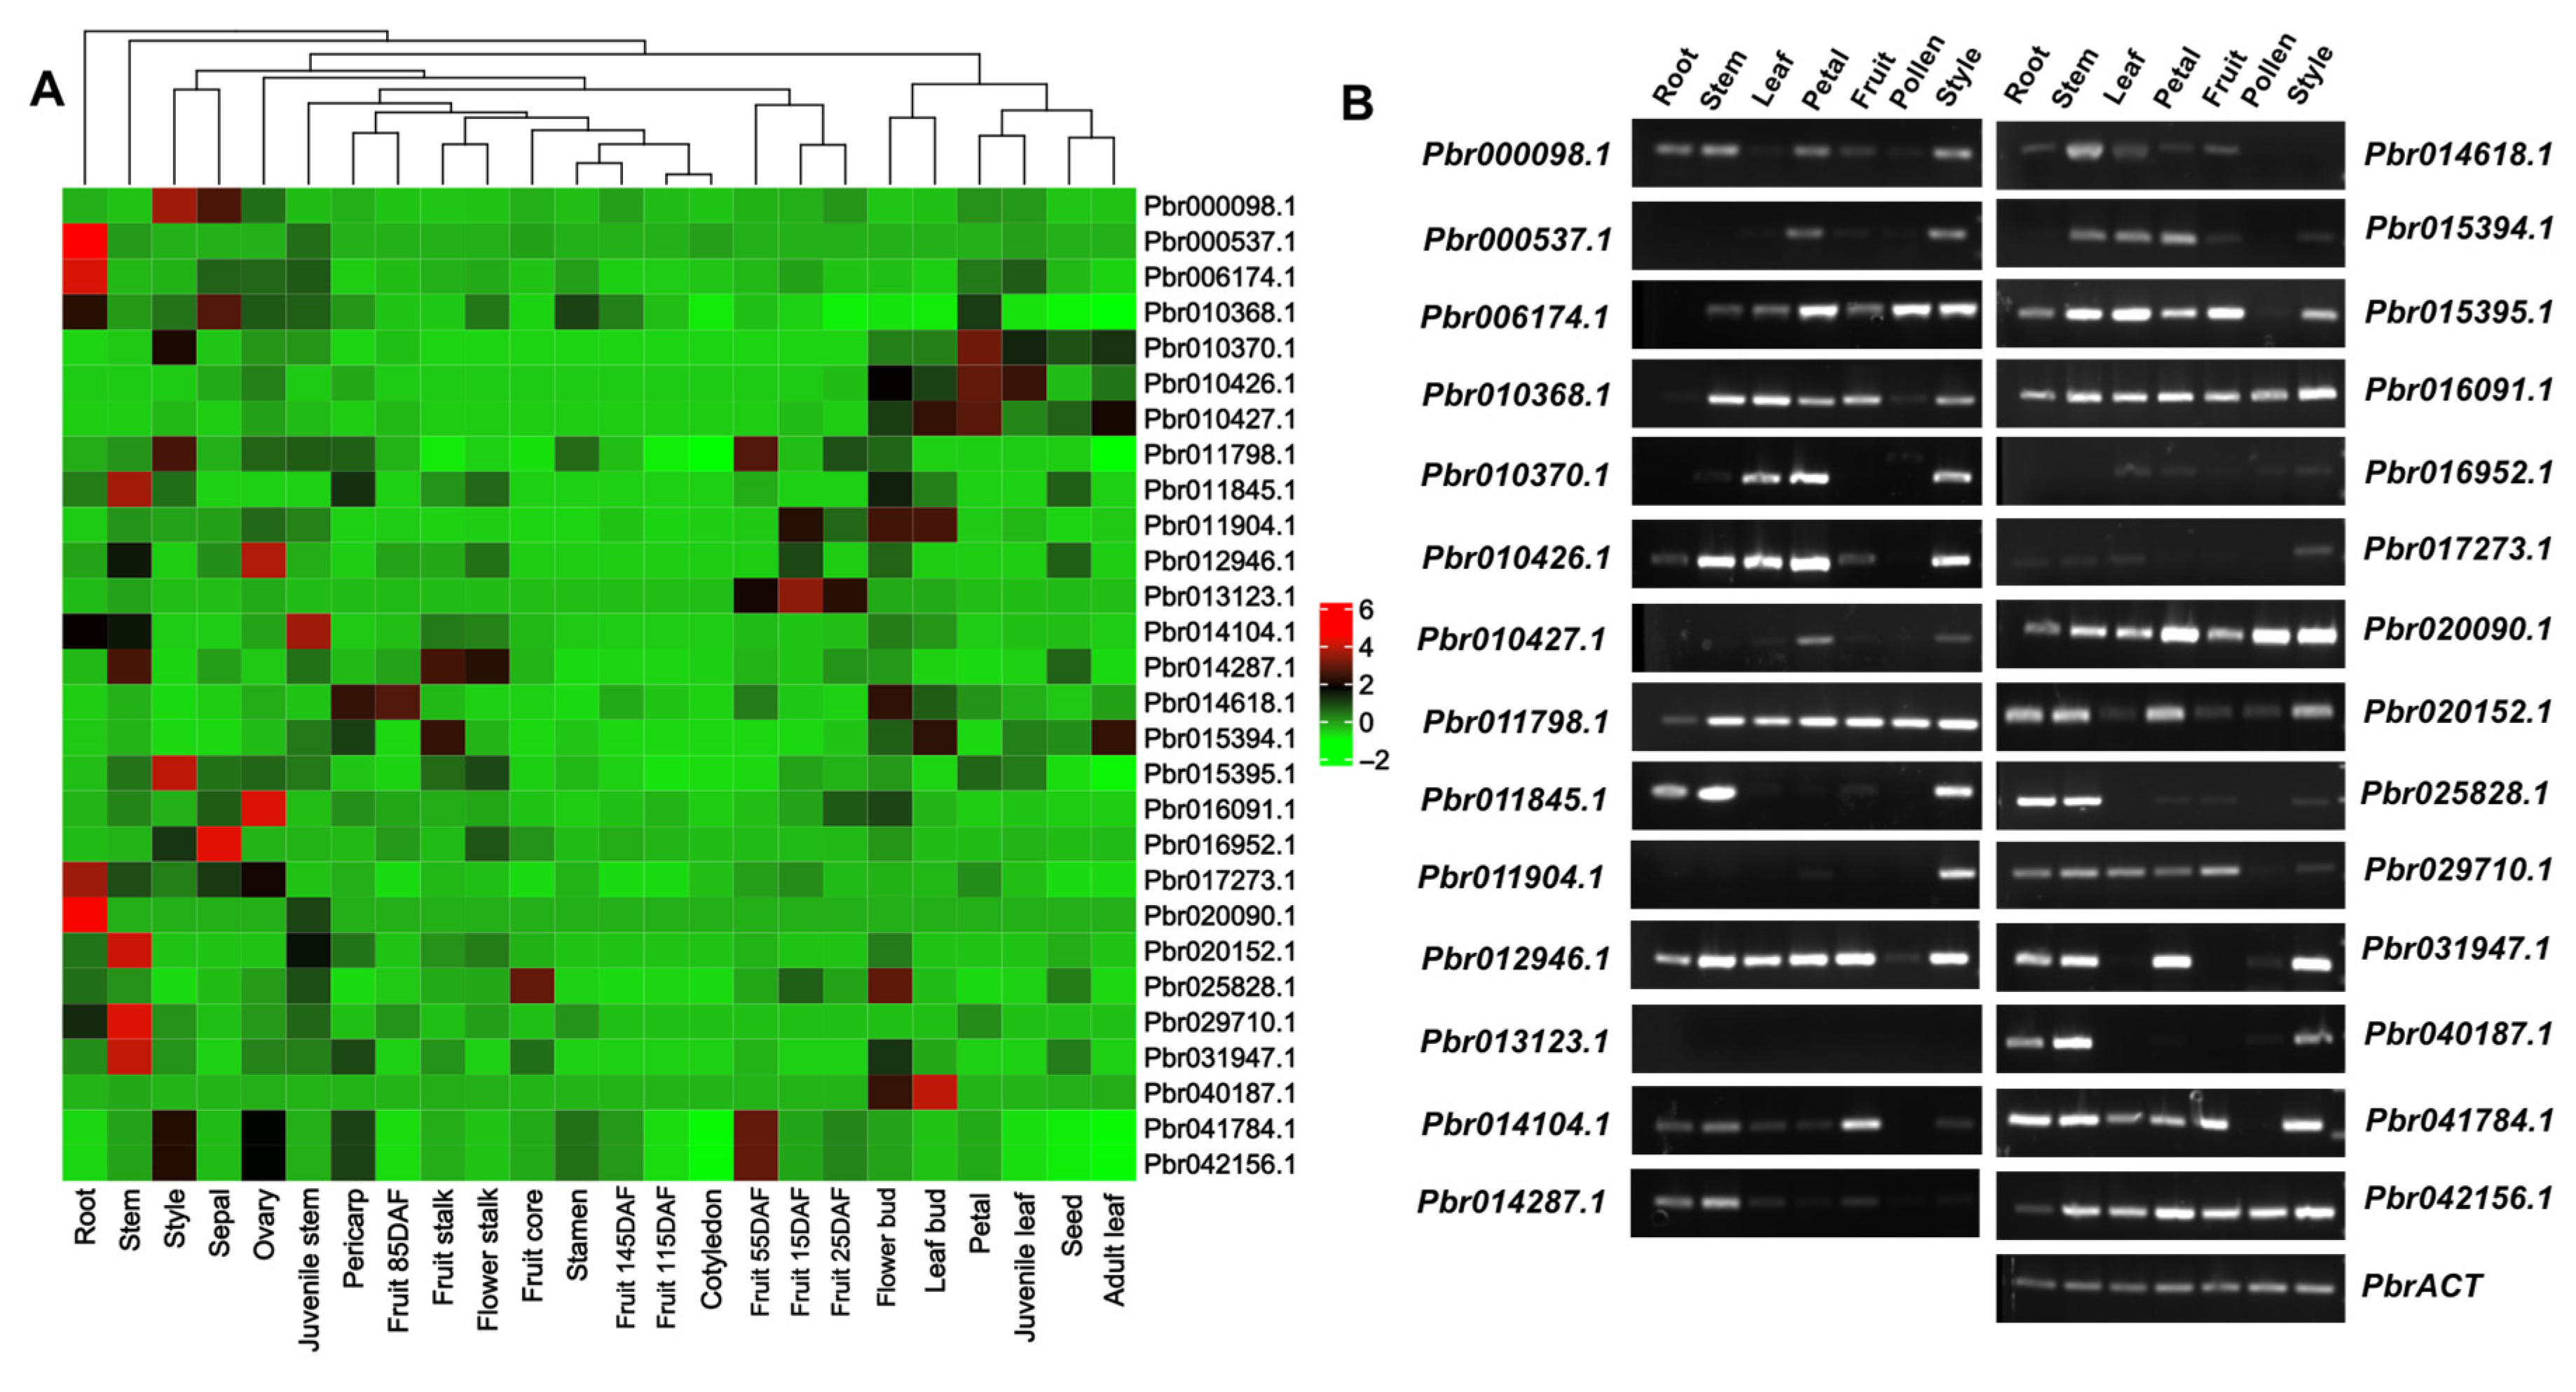
Based on WGCNA and RT-qPCR results, we speculated that the LOC103960706 might play a key role in regulating pear fruit shape, not only treated by calyx excision. Hence, we further identified the expression patterns of 28 PbrOFPs. The genes with the highest homology to LOC103960706 were Pbr014104.1 and Pbr016952.1. The expression patterns of PbrOFPs were systematically analyzed based on the RNA-seq database of different pear tissues. The heatmap results also showed that PbrOFPs were expressed in various pear tissues. Among them, five genes were highly expressed during the dynamic development of fruits. Pbr013123.1 was highly expressed in young fruits 15 days after flowering (Fruits 15 DAF) and fruits 25 DAF, but its expression level exhibited a decreasing trend. Pbr041784.1, Pbr042156.1, and Pbr011798.1 expressed in fruits 55 DAF, while Pbr014618.1 was expressed in fruits 85 DAF. In addition, multiple genes also exhibited high expression in other tissues. Pbr017273.1, Pbr020090.1, and Pbr006174.1 were highly expressed in roots, and Pbr015395.1 was expressed in styles. Pbr025828.1 and Pbr040187.1 were expressed in flower buds and leaf buds, respectively (Figure 6A). Additionally, based on previous reports, we screened the OFP genes from other species, including arabidopsis, rice, and tomato. Phylogenetic tree analysis showed that the cluster of PbrOFP was relatively scattered. Pbr014104.1, Pbr029710.1, Pbr016952.1, and Pbr014287.1 were clustered in the same branch with OVATE, SlOFP6, and SlOFP9. Pbr013123.1 and Pbr041784.1 were grouped into the same branch with AtOFP2, AtOFP3, OsOFP6, and OsOFP22. Pbr042156.1, Pbr011798.1, and Pbr011904.1 were clustered in the same sub branch with SlOFP10 and SlOFP29 (Figure S4).
Then, we further examined their expression patterns in root, stem, leaf, petal, fruit, pollen, and style. The results showed that multiple genes were expressed in various tissues. Among them, expression localization information of all the PbrOFP was detected, except Pbr013123.1. Pbr041784.1 was expressed in six tissues, except pollen. Pbr042156.1 and Pbr011798.1 were expressed in seven tissues, and their expression patterns were identical. Pbr014104.1 was highly expressed in fruit, and Pbr029710.1, Pbr016952.1, and Pbr014287.1 were poorly expressed in fruit. Pbr011904.1 was only expressed in the style (Figure 6B). The above results implied that PbrOFPs might have various functions and involved in multiple pear growth and development processes, such as flower bud differentiation, root morphology composition, pollination, and fertilization processes. Therefore, Pbr014104.1, Pbr041784.1, Pbr042156.1, and Pbr011798.1 might be the candidate genes involved in regulating fruit shape development.

4. Discussion

In the early stage of pear fruit development, fruit could be changed from spindle to round shape by excising calyx. Fruit shape is a complex quantitative trait and controlled by multiple QTL. The early stage of fruit development, namely the young fruit stage, is a critical period for regulating fruit shape formation. Plant hormones, especially auxin and gibberellins, directly or indirectly affect the division and expansion of fruit cells, and ultimately determine the fruit size and shape [35]. Auxin application approximately 3 weeks before anthesis could result in elongated pear-shaped ovaries and fruits [36]. Additionally, fruit shape changes caused by spraying auxin were similar withed by sun and ovate, implying that they may regulate fruit shape through a common genetic pathway [37]. Sl-IAA17 RNAi fruits were larger than the wild type through affecting cell size [35]. SlARF7 regulated cell division and expansion by regulating auxin and GA signaling pathways, and the SlARF7-RNAi could lead to heart-shaped fruit [38]. SlARF7/SlIAA9 and SlDELLA co-regulated the expression of fruit growth-related genes to affect fruit development by responding to auxin and GA signaling pathways [39]. In this study, the number of DEGs displayed a gradually decreasing trend along with fruit development after calyx excision treatment, implying that the regulatory effect of excising calyx was also gradually disappearing and the early stage was the critical period in the regulation of fruit shape. SAUR50, IAA17, and ARF3 were also identified, of which, the expression level of IAA17 was up-regulated while that of SAUR50 and ARF3 was down-regulated at AC0d and AC2d. PP2C 51 was also examined, which was described as a negative regulator within the abscisic acid (ABA)-mediated signaling network, and the expression level was up-regulated under calyx excision treatment. Hence, in the early stage of calyx excision, the synthesis and distribution of auxin and abscisic acid are altered, thereby affecting the division and expansion of fruit cells, regulating fruit growth, and ultimately affecting the shape of the fruit. Additionally, auxin-related genes may also be involved in regulating the expression of SUN or OFP, improving fruit shape from spindle shape to round shape. Meanwhile, we also found multiple transcription factors exhibiting differential expressions, including MYB62 and TGA4, and the study of their participation in the regulation of fruit shape development process, remains poorly elucidated. We speculated that MYB62 and TGA4 might regulate fruit shape development through plant hormone signaling pathway under calyx excision treatment, and their relationship needs further verification. Therefore, the above results showed that auxin, ABA and GA were the major plant hormones involved in regulating fruit shape, and there may be antagonistic or synergistic effects between them and ultimately affected fruit shape under calyx excision treatment.
Aquaporin TIP1-3 belongs to the superfamily of the major intrinsic proteins (MIPs) that contribute to the diffusion of water and uncharged solutes across membranes [40]. TIPs specifically transport a rather diverse spectrum of different compounds, such as urea, ammonia and hydrogen peroxide [41]. Additionally, they may be beneficial for growth under stress, including salt and drought stress [42,43]. TIP1;1 and TIP1;2 were the channels of hydrogen peroxide, and TIP1;1 might play a role in reactive oxygen species-induced stress signaling at the cellular level [40]. Aquaporin TIP1-3 was the unique DEG identified from the six comparison groups, and its expression level trend was consistent with FPKM values, implying that the gene might be a potential biomarker and essential for calyx excision treatment. In pear, Aquaporin TIP1-3 might be located in the plasma membrane, and may respond to signal molecules to regulate fruit shape development under calyx excision treatment.
In order to identify the key sites that regulate the shape of pear fruit and provide a theoretical basis for further developing corresponding molecular markers to accelerate pear breeding, based on the screening of candidate genes through calyx cutting treatment, the OFP gene was identified, which may serve as a key gene involved in the regulation of fruit shape by plant hormones and transcription factors. Additionally, as previous research reported, SUN, OFP, and TRM were also the key genes involved in fruit shape regulation. Similarly, we identified 7 OFP, 3 SUN, and 3 TRM genes from the RNA-seq database through analysis. Interestingly, we found that the OFP gene was expressed in five of the comparison groups, except AC30d-vs-CK3, indicating that about 2 days after the removal of the calyx was the key stage of regulating fruit shape. OFP and SUN genes were enriched in the MEBlue module using WGCNA analysis, indicating that the enriched genes in this module may synergistically participate in the fruit shape process. OFP was the negative regulatory factor controlling fruit development. Overexpression of OFP could change fruit shape from pear-shape to round [44]. A total of 28 PbrOFP ortholog genes of OFP were screened from the pear genome. To identify the genes that play a key role in fruit shape regulation, the tissue expression information was tested. However, the key PbrOFP genes determined by phylogenetic tree and heatmap were not the same as those determined by RT-PCR analysis. This may be due to the different mechanism of fruit shape regulation in different species. Another possible reason may be that the fruit shape regulation mechanism was changed by calyx excision treatment compared to that of normal pear. Pbr014104.1, Pbr041784.1, Pbr042156.1, and Pbr011798.1 might be the candidate genes involved in fruit shape regulation under calyx excision treatment. It was also suggested that there may be functional redundancy or competitive regulation mechanisms of OFP in pears. In addition, multiple PbrOFP genes were expressed in other tissues, indicating the diversity of the gene’s function. Additionally, the expression level of hub gene NCL in the MEBlue module was consistent with FPKM values, and may respond to Ca2+ signals to regulate fruit shape. The expression trend of SUN4 containing the IQD domain was basically consistent with FPKM values, implying that SUN4 and NCL participated in fruit shape development, and their regulatory relationship needs to be explored further.

5. Conclusions

In this study, we systematically analyzed the effect of calyx excision on fruit shape and screened candidate genes involved in the regulation of fruit shape development by constructing transcriptome data. The numbers of DEGs decreased along with fruit development, and the early stage of calyx excision was the key period for regulating fruit shape development. In total, we identified 13 candidate genes involved in regulating fruit shape development, mainly including PP2C 51, MYB62, OEP62, SAUR50, ARF3, IAA17, PYRC1, TIP1-3, TGA4, SUN4, OFP8, TRM, and NCL. Additionally, 28 ortholog genes of the OFP8 were identified from the pear genome, and Pbr014104.1, Pbr041784.1, Pbr042156.1, and Pbr011798.1 were highly expressed in fruit and served as candidate genes involved in regulating fruit shape development. Therefore, the early stage of fruit development was the key period controlling fruit shape, and the molecular mechanism is relatively complex and requires the coordinated cooperation of multiple genes under calyx excision treatment. Excising calyx may lead to hormone redistribution, resulting in differential expression of some related genes or transcription factors, thereby synergistically regulating fruit shape development.

Supplementary Materials

The following supporting information can be downloaded at: https://www.mdpi.com/article/10.3390/horticulturae11080939/s1, Figure S1: GO functional clustering analysis of DEGs ranked top 30 of each group, including AC2d-vs-CK2(A) and AC0d-vs-AC2d(B); Figure S2: KEGG enrichment analysis of DEGs ranked top 20 of each group, including AC2d-vs-CK2(A) and AC0d-vs-AC2d(B); Figure S3: RT-qPCR analysis of the 8 DEGs after calyx excision treatment. AC0d, AC2d and AC30d correspond to the 12 h, 2 days and 30 days after calyx excision. CK1, CK2 and CK3 were control groups at the corresponding time point. Bars are SD (n = 3); Figure S4: Phylogenetic analysis of OFP proteins in pear and other species. The analysis was performed with 1000 bootstrap replications to assess the statistical support for each clade; Table S1: Primer for the genes selected for RT-qPCR and RT-PCR in this study; Table S2: The correlation analysis between RT-qPCR and FPKM of each DEGs.

Author Contributions

H.J. and Y.C.: conceived the experimental design, data analyses, and original draft preparation. Q.C. and C.X.: contributed the transcriptome data analysis, review and editing. Q.G. and S.W.: revised the manuscript and funding acquisition. All authors have read and agreed to the published version of the manuscript.

Funding

This research was funded by the National Natural Science Foundation of China (32402510), the Agricultural Science and Technology Innovation Project of Shandong Academy of Agricultural Sciences (CXGC2025C20), the earmarked fund for China Agriculture Research System (CARS-28-37), the Central Guidance for Local Scientific and Technological Development Funds (YDZX2023067), and Major Science and Technology Projects of Xinjiang Uygur Autonomous Region (2024A02006-3).

Institutional Review Board Statement

Not applicable.

Informed Consent Statement

Not applicable.

Data Availability Statement

Data is contained within the article and Supplementary Materials.

Conflicts of Interest

The authors declare no conflicts of interest.

Abbreviations

AC0dAfter calyx excision treatment (12 h)
AC2dAfter calyx excision treatment (2 days)
AC30dAfter calyx excision treatment (30 days)
ARF3Auxin response factor 3
AFLPAmplified fragment length polymorphism
bHLHBasic helix–loop–helix
CaMCalmodulin
DEGsDifferentially Expressed Genes
DAFDays after flowering
ER-PMEndoplasmic Reticulum–Plasma Membrane
FPKMFragments Per Kilobase of Exon Model Per Million Mapped Fragment
GAGibberellins
GOGene Ontology
IAA17Auxin-responsive protein 17
KEGGKyoto Encyclopedia of Genes and Genomes
MYB62Myeloblastosis 62
OEP62Outer envelope pore protein 62
OFPOVATE Family Protein
PP2C 51Protein phosphatase 2C 51
PME11Pectin methylesterase 11
PYRC1Major allergen Pyr c 1
QTLQuantitative trait loci
RT-PCRReverse Transcription Polymerase Chain Reaction
RT-qPCRReverse Transcription-quantitative real-time Polymerase Chain Reaction
SUNSUN domain-containing protein
SAUR50Auxin-responsive protein 50
SRAPSequence-related amplified polymorphism
SSRSimple sequence repeat
SDStandard deviation
TIP1-3Aquaporin TIP1-3
TGA4Transcription factor
TRMTONNEAU1 Recruiting Motif
WGCNAWeighted gene co-expression network analysis

References

  1. Rodríguez, G.R.; Muños, S.; Anderson, C.; Sim, S.C.; Michel, A.; Causse, M.; Gardener, B.B.; Francis, D.; Van der Knaap, E. Distribution of SUN, OVATE, LC, and FAS in the tomato germplasm and the relationship to fruit shape diversity. Plant Physiol. 2011, 156, 275–285. [Google Scholar] [CrossRef]
  2. Van der Knaap, E.; Chakrabarti, M.; Chu, Y.H.; Clevenger, J.P.; Illa-berenguer, E.; Huang, Z.J.; Keyhaninejad, N.; Mu, Q.; Sun, L.; Wang, Y.P.; et al. What lies beyond the eye: The molecular mechanisms regulating tomato fruit weight and shape. Front. Plant Sci. 2014, 5, 227. [Google Scholar] [CrossRef]
  3. Pan, Y.P.; Wang, Y.H.; McGregor, C.; Liu, S.; Luan, F.S.; Gao, M.L.; Weng, Y.Q. Genetic architecture of fruit size and shape variation in cucurbits: A comparative perspective. Theor. Appl. Genet. 2020, 133, 1–21. [Google Scholar] [CrossRef] [PubMed]
  4. Xiao, H.; Jiang, N.; Schaffner, E.; Stockinger, E.J.; Van der Knaap, E. A retrotransposon-mediated gene duplication underlies morphological variation of tomato fruit. Science 2008, 319, 1527–1530. [Google Scholar] [CrossRef] [PubMed]
  5. Zang, J.; Klemm, S.; Pain, C.; Duckney, P.; Bao, Z.R.; Stamm, G.; Bürstenbinder, K.; Hussey, P.J.; Wang, P.W. A novel plant actin-microtubule bridging complex regulates cytoskeletal and ER structure at ER-PM contact sites. Curr. Biol. 2021, 31, 1251–1260. [Google Scholar] [CrossRef] [PubMed]
  6. Levy, M.; Wang, Q.M.; Kaspi, R.; Parrella, M.P.; Abel, S. Arabidopsis IQD1, a novel calmodulin-binding nuclear protein, stimulates glucosinolate accumulation and plant defense. Plant J. 2005, 43, 79–96. [Google Scholar] [CrossRef] [PubMed]
  7. Bürstenbinder, K.; Möller, B.; Plötner, R.; Stamm, G.; Hause, G.; Mitra, D.; Abel, S. The IQD family of calmodulin-binding proteins links calcium signaling to microtubules, membrane subdomains, and the nucleus. Plant Physiol. 2017, 173, 1692–1708. [Google Scholar] [CrossRef]
  8. Pan, Y.P.; Liang, X.J.; Gao, M.L.; Liu, H.Q.; Meng, H.W.; Weng, Y.Q.; Cheng, Z.H. Round fruit shape in WI7239 cucumber is controlled by two interacting quantitative trait loci with one putatively encoding a tomato SUN homolog. Theor. Appl. Genet. 2017, 130, 573–586. [Google Scholar] [CrossRef]
  9. Wendrich, J.R.; Yang, B.J.; Mijnhout, P.; Xue, H.W.; Rybel, B.D.; Weijers, D. IQD proteins integrate auxin and calcium signaling to regulate microtubule dynamics during Arabidopsis development. BioRxiv 2018, 275560. [Google Scholar] [CrossRef]
  10. Liu, J.P.; Eck, J.V.; Cong, B.; Tanksley, S.D. A new class of regulatory genes underlying the cause of pear-shaped tomato fruit. Proc. Natl. Acad. Sci. USA 2002, 99, 13302–13306. [Google Scholar] [CrossRef]
  11. Hackbusch, J.; Richter, K.; Salamini, F.; Uhrig, J.F. A central role of Arabidopsis thaliana ovate family proteins in networking and subcellular localization of 3-aa loop extension homeodomain proteins. Proc. Natl. Acad. Sci. USA 2005, 102, 4908–4912. [Google Scholar] [CrossRef] [PubMed]
  12. Wang, S.C.; Chang, Y.; Guo, J.J.; Chen, J.G. Arabidopsis Ovate Family Protein 1 is a transcriptional repressor that suppresses cell elongation. Plant J. 2007, 50, 858–872. [Google Scholar] [CrossRef]
  13. Ma, J.; Li, C.C.; Zong, M.; Qiu, Y.H.; Liu, Y.M.; Huang, Y.T.; Xie, Y.L.; Zhang, H.J.; Wang, J.S. CmFSI8/CmOFP13 encoding an OVATE family protein controls fruit shape in melon. J. Exp. Bot. 2022, 73, 1370–1384. [Google Scholar] [CrossRef]
  14. Wang, Y.-K.; Chang, W.-C.; Liu, P.-P.; Hsiao, M.-K.; Lin, C.-T.; Lin, S.-M.; Pan, R.-L. Ovate family protein 1 as a plant Ku70 interacting protein involving in DNA double-strand break repair. Plant Mol. Biol. 2010, 74, 453–466. [Google Scholar] [CrossRef] [PubMed]
  15. Wu, S.; Zhang, B.; Keyhaninejad, N.; Rodríguez, G.R.; Kim, H.J.; Chakrabarti, M.; Illa-Berenguer, E.; Taitano, N.K.; Gonzalo, M.J.; Díaz, A.; et al. A common genetic mechanism underlies morphological diversity in fruits and other plant organs. Nat. Commun. 2018, 9, 4734. [Google Scholar] [CrossRef] [PubMed]
  16. Guo, J.; Cao, K.; Deng, C.; Li, Y.; Zhu, G.R.; Fang, W.C.; Chen, C.W.; Wang, X.W.; Wu, J.L.; Guan, L.P.; et al. An integrated peach genome structural variation map uncovers genes associated with fruit traits. Genome Biol. 2020, 21, 1–19. [Google Scholar] [CrossRef]
  17. Zhou, H.; Ma, R.J.; Gao, L.; Zhang, J.Y.; Zhang, A.D.; Zhang, X.J.; Ren, F.; Zhang, W.H.; Liao, L.; Yang, Q.R.; et al. A 1.7-Mb chromosomal inversion downstream of a PpOFP1 gene is responsible for flat fruit shape in peach. Plant Biotechnol. J. 2021, 19, 192–205. [Google Scholar] [CrossRef] [PubMed]
  18. Zhao, P.P.; Wang, F.P.; Deng, Y.J.; Zhong, F.J.; Tian, P.; Lin, D.B.; Deng, J.H.; Zhang, Y.X.; Huang, T.B. Sly-miR159 regulates fruit morphology by modulating GA biosynthesis in tomato. Plant Biotechnol. J. 2022, 20, 833–845. [Google Scholar] [CrossRef] [PubMed]
  19. Zhu, Z.G.; Chen, G.P.; Guo, X.H.; Yin, W.C.; Yu, X.H.; Hu, J.T.; Hu, Z.L. Overexpression of SlPRE2, an atypical bHLH transcription factor, affects plant morphology and fruit pigment accumulation in tomato. Sci. Rep. 2017, 7, 5786. [Google Scholar] [CrossRef] [PubMed]
  20. Zhu, Z.G.; Liang, H.L.; Chen, G.P.; Li, F.F.; Wang, Y.S.; Liao, C.G.; Hu, Z.L. The bHLH transcription factor SlPRE2 regulates tomato fruit development and modulates plant response to gibberellin. Plant Cell Rep. 2019, 38, 1053–1064. [Google Scholar] [CrossRef]
  21. Li, J.; Gong, J.; Zhang, L.C.; Shen, H.; Chen, G.P.; Xie, Q.L.; Hu, Z.L. Overexpression of SlPRE5, an atypical bHLH transcription factor, affects plant morphology and chlorophyll accumulation in tomato. J. Plant Physiol. 2022, 273, 153698. [Google Scholar] [CrossRef]
  22. Zhang, R.-P.; Wu, J.; Li, X.G.; Khan, M.A.; Chen, H.; Korban, S.S.; Zhang, S.L. An AFLP, SRAP, and SSR genetic linkage map and identification of QTLs for fruit traits in pear (Pyrus L.). Plant Mol. Biol. Report. 2013, 31, 678–687. [Google Scholar] [CrossRef]
  23. Xue, Z.Y.; Yang, R.; Wang, Y.D.; Ma, Y.C.; Lin, Y.J.; Li, Z.G.; Song, Y.Q.; Feng, X.X.; Li, L.L. Candidate gene mining of GA-mediated regulation of pear fruit shape. Hortic. Environ. Biotechnol. 2024, 65, 403–412. [Google Scholar] [CrossRef]
  24. Xue, Z. Identification and Expression Characteristics Analysis of Pear Fruit Shape Related Genes. Master’s Thesis, Shanxi Agricultural University, Taiyuan, China, 2023. [Google Scholar]
  25. Teng, Y. Pyrus: Origin, Diversity and Cultivar Differentiation; Science Press: Beijing, China, 2024; pp. 149–151. [Google Scholar]
  26. Kim, D.; Langmead, B.; Salzberg, S.L. HISAT: A fast spliced aligner with low memory requirements. Nat. Methods 2015, 12, 357–360. [Google Scholar] [CrossRef] [PubMed]
  27. Anders, S.; Pyl, P.T.; Huber, W. HTSeq—A Python framework to work with high-throughput sequencing data. Bioinformatics 2015, 31, 166–169. [Google Scholar] [CrossRef] [PubMed]
  28. Love, M.I.; Huber, W.; Anders, S. Moderated estimation of fold change and dispersion for RNA-seq data with DESeq2. Genome Biol. 2014, 15, 550. [Google Scholar] [CrossRef]
  29. Bolger, A.M.; Lohse, M.; Usadel, B. Trimmomatic: A flexible trimmer for Illumina sequence data. Bioinformatics 2014, 30, 2114–2120. [Google Scholar] [CrossRef] [PubMed]
  30. Kanehisa, M.; Araki, M.; Goto, S.; Hattori, M.; Hirakawa, M.; Itoh, M.; Katayama, T.; Kawashima, S.; Okuda, S.; Tokimatsu, T.; et al. KEGG for linking genomes to life and the environment. Nucleic Acids Res. 2008, 36, 480–484. [Google Scholar] [CrossRef]
  31. Anders, S.; Huber, W. Differential Expression of RNA-Seq Data at the Gene Level—The DESeq Package; European Molecular Biology Laboratory: Heidelberg, Germany, 2012. [Google Scholar]
  32. Zhang, B.; Horvath, S. A General Framework for Weighted Gene Co-Expression Network Analysis. Stat. Appl. Genet. Mol. Biol. 2005, 4, 1. [Google Scholar] [CrossRef] [PubMed]
  33. Langfelder, P.; Horvath, S. WGCNA: An R package for weighted correlation network analysis. BMC Bioinform. 2008, 9, 559. [Google Scholar] [CrossRef] [PubMed]
  34. Livak, K.J.; Schmittgen, T.D. Analysis of relative gene expression data using real-time quantitative PCR and the 2−ΔΔCT method. Methods 2001, 25, 402–408. [Google Scholar] [CrossRef] [PubMed]
  35. Su, L.Y.; Bassa, C.; Audran, C.; Mila, I.; Cheniclet, C.; Chevalier, C.; Buzayen, M.; Roustan, J.-P.; Chervin, C. The auxin Sl-IAA17 transcriptional repressor controls fruit size via the regulation of endoreduplication-related cell expansion. Plant Cell Physiol. 2014, 55, 1969–1976. [Google Scholar] [CrossRef]
  36. Wang, S.; Cheng, D.W.; Gu, H.; Li, M.; He, S.S.; Li, F.F.; Gu, S.C.; Chen, J.Y. Effects of plant growth regulators on the seedless rate and fruit quality of ‘shine muscat’ grape. J. Fruit Sci. 2019, 36, 1675–1682. (In Chinese) [Google Scholar]
  37. Wang, Y.P.; Clevenger, J.P.; Illa-Berenguer, E.; Meulia, T.; Van der Knaap, E.; Sun, L. A comparison of sun, ovate, fs8.1 and auxin application on tomato fruit shape and gene expression. Plant Cell Physiol. 2019, 60, 1067–1081. [Google Scholar] [CrossRef]
  38. Jong, M.D.; Wolters-Arts, M.; García-Martínez, J.L.; Mariani, C.; Vriezen, W.H. The Solanum lycopersicum AUXIN RESPONSE FACTOR 7 (SlARF7) mediates cross-talk between auxin and gibberellin signalling during tomato fruit set and development. J. Exp. Bot. 2011, 62, 617–626. [Google Scholar] [CrossRef]
  39. Hu, J.H.; Israeli, A.; Ori, N.M.; Sun, T.-P. The Interaction between DELLA and ARF/IAA Mediates Crosstalk between Gibberellin and Auxin Signaling to Control Fruit Initiation in Tomato. Plant Cell 2018, 30, 1710–1728. [Google Scholar] [CrossRef] [PubMed]
  40. Schüssler, M.D.; Alexandesson, E.; Bienert, G.P.; Kicjhey, T.; Laursen, K.H.; Johanson, U.; Kjellbom, P.; Schjoerring, J.K.; Jahn, T.P. The effects of the loss of TIP1; 1 and TIP1; 2 aquaporins in Arabidopsis thaliana. Plant J. 2008, 56, 756–767. [Google Scholar] [CrossRef]
  41. Bienert, G.P.; Møller, A.L.B.; Kristiansen, K.A.; Schulz, A.; Møller, I.M.; Schjoerring, J.K.; Jahn, T.P. Specific aquaporins facilitate the diffusion of hydrogen peroxide across membranes. J. Biol. Chem. 2007, 282, 1183–1192. [Google Scholar] [CrossRef]
  42. Lin, W.L.; Peng, Y.H.; Li, G.W.; Arora, R.; Tang, Z.C.; Su, W.A.; Cai, W.M. Isolation and functional characterization of PgTIP1, a hormone-autotrophic cells-specific tonoplast aquaporin in ginseng. J. Exp. Bot. 2007, 58, 947–956. [Google Scholar] [CrossRef]
  43. Peng, Y.H.; Lin, W.L.; Cai, W.M.; Arora, R. Overexpression of a Panax ginseng tonoplast aquaporin alters salt tolerance, drought tolerance and cold acclimation ability in transgenic Arabidopsis plants. Planta 2007, 226, 729–740. [Google Scholar] [CrossRef] [PubMed]
  44. Van der Knaap, E.; Lippman, Z.B.; Tanksley, S.D. Extremely elongated tomato fruit controlled by four quantitative trait loci with epistatic interactions. Theor. Appl. Genet. 2002, 104, 241–247. [Google Scholar] [CrossRef] [PubMed]
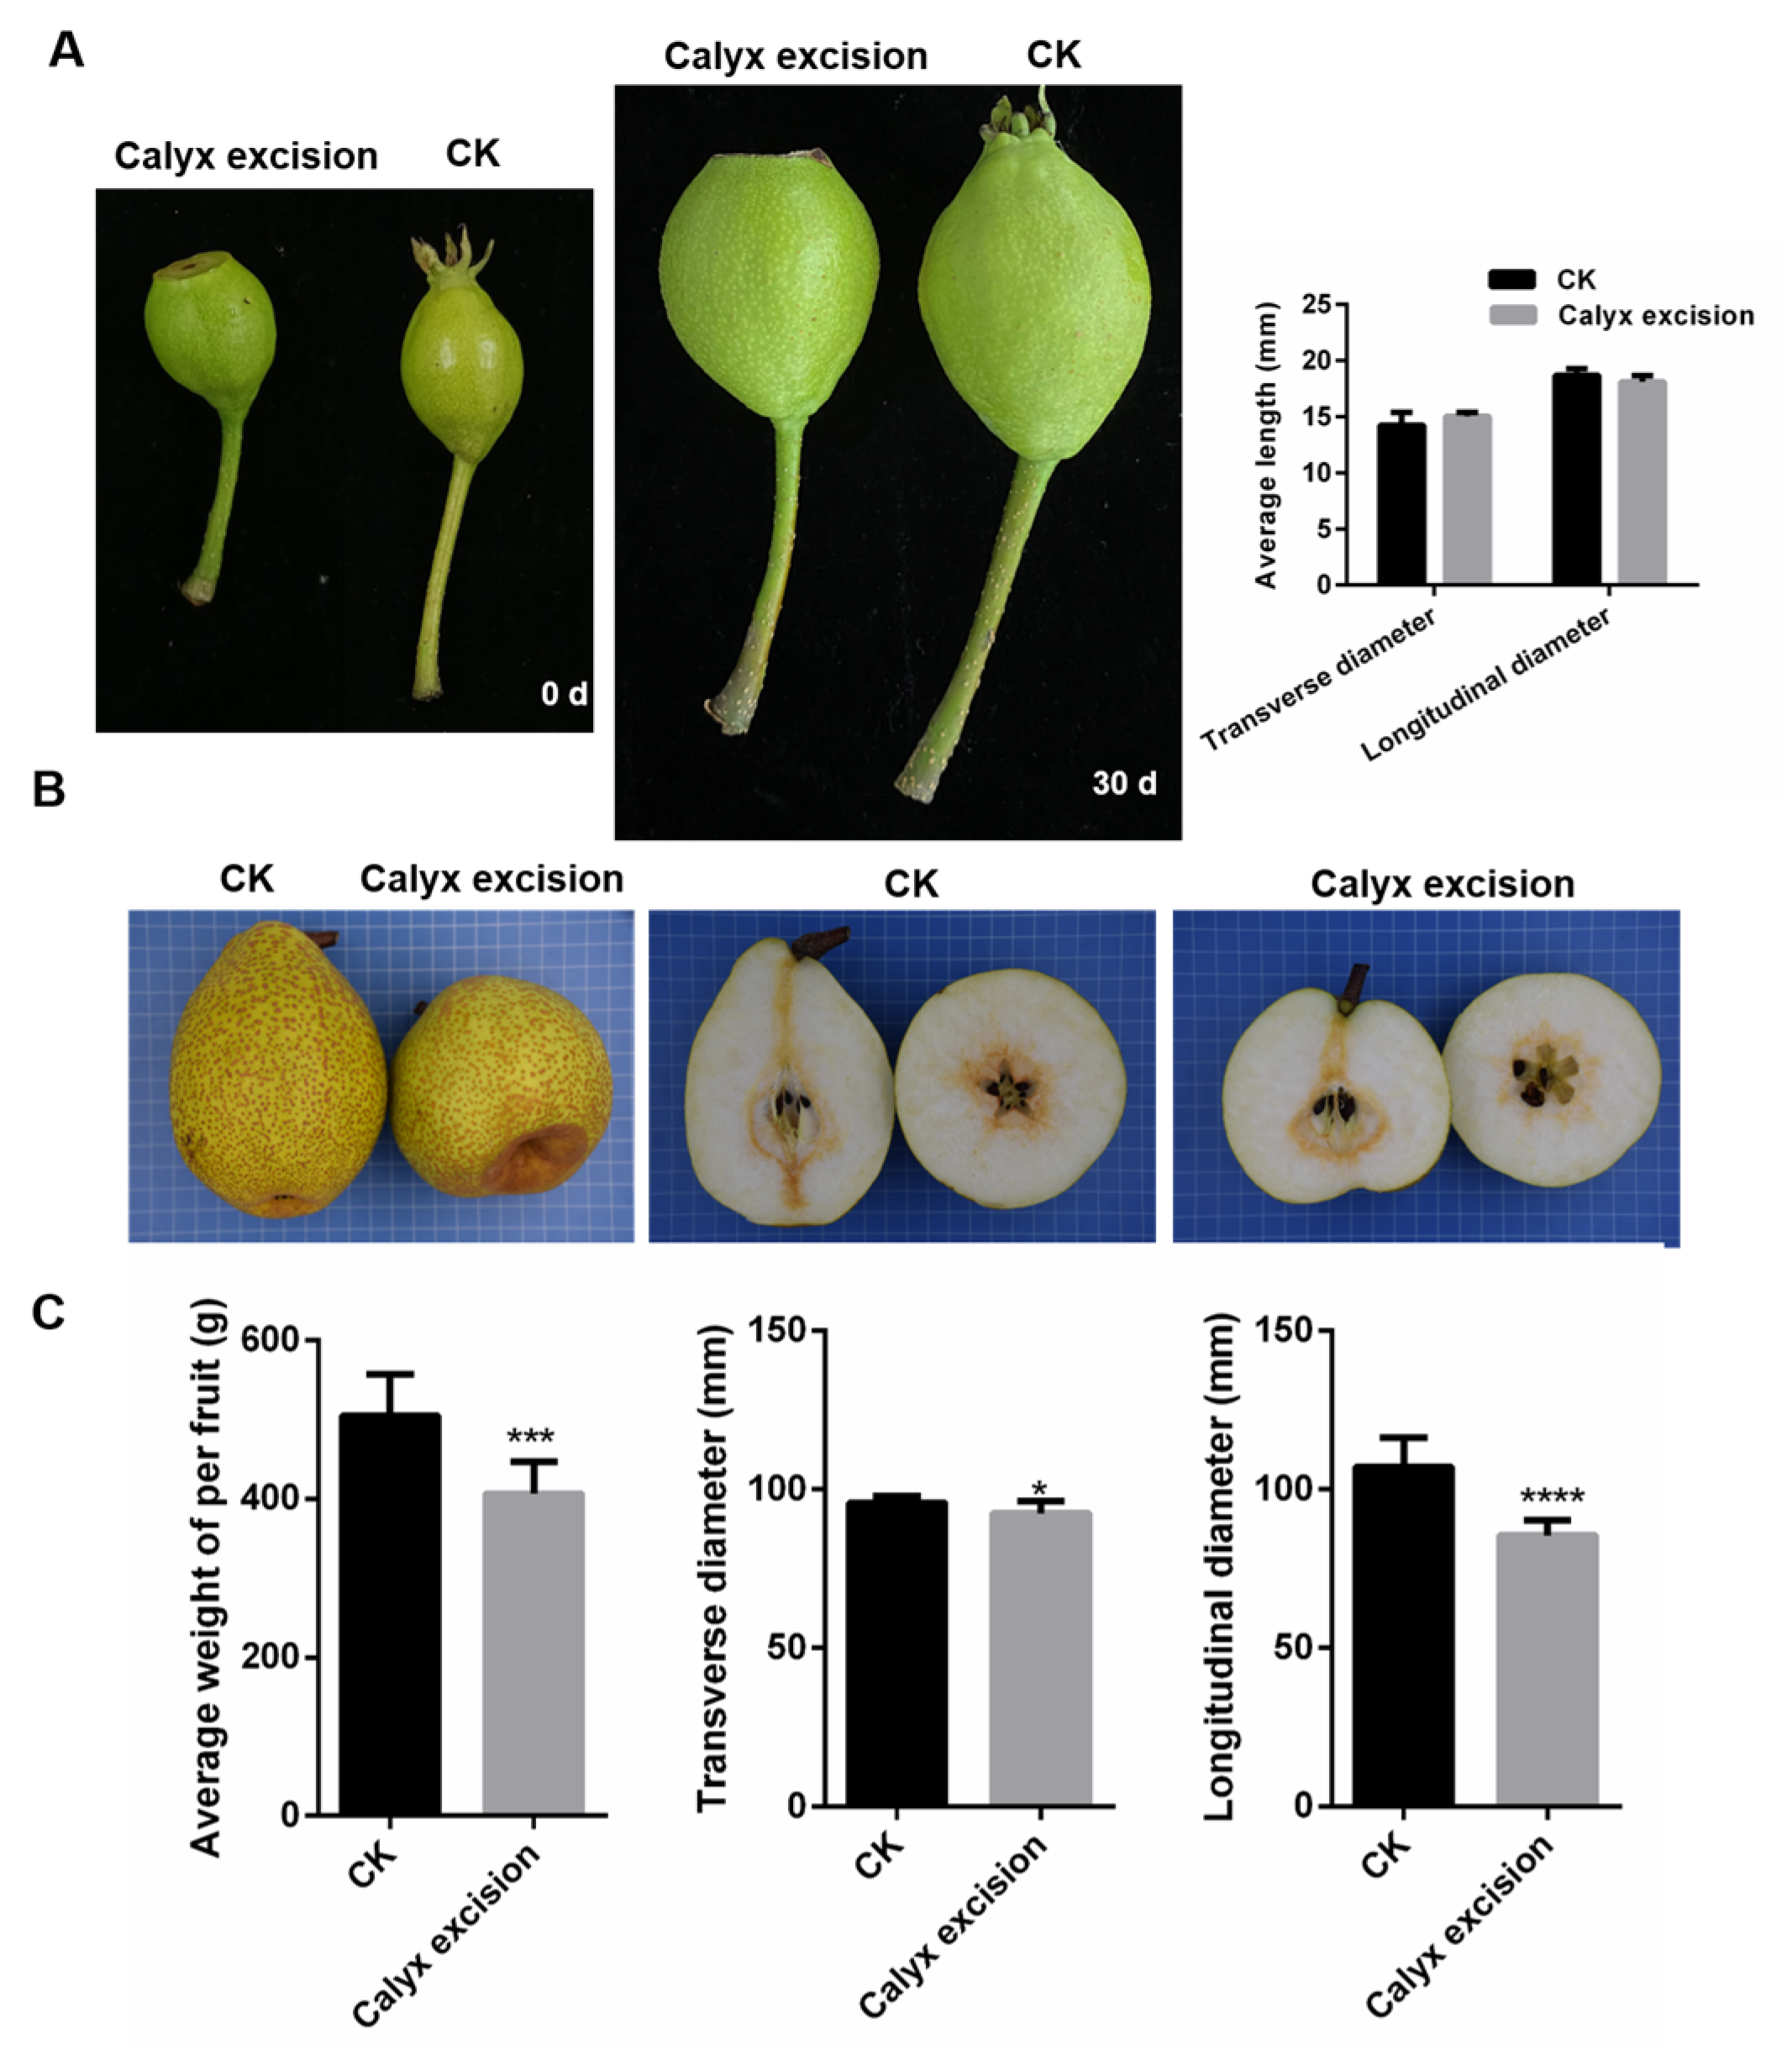
Figure 1. Effects of calyx excision treatment on ‘Laiyang Cili’. (A) The fruit shape of pear under calyx excision treatment. (B) The fruit shape of pear under calyx excision treatment at the maturity stage. (C) The index statistics of pear, including average fruit weight, transverse diameter, and longitudinal diameter. Bars are SD (n = 3). Student’s t-test: * p < 0.05; ***, **** p < 0.01.
Horticulturae 11 00939 g001
Figure 2. Differentially expressed genes analysis of six comparison groups. (A) PCA analysis of six groups. (B) Statistics on the number of DEGs in different comparison groups. (C) Venn analysis of DEGs among different comparison groups.
Horticulturae 11 00939 g002
Figure 3. The heatmap analysis of DEGs ranked in the top 30 of each group. Light blue indicates low expression, and red indicates high expression.
Horticulturae 11 00939 g003
Figure 4. RT-qPCR analysis of the DEGs after calyx excision treatment. AC0d, AC2d, and AC30d correspond to the 12 h, 2 days, and 30 days after calyx excision. CK1, CK2, and CK3 were control groups at the corresponding time point. Bars are SD (n = 3).
Horticulturae 11 00939 g004
Figure 5. WGCNA and RT-qPCR analysis of the DEGs after calyx excision. (A) WGCNA analysis of the DEGs; the depth of color indicates the level of correlation. (B) The expression trends of relevant genes in the MEblue module. AC0d, AC2d, and AC30d correspond to the 12 h, 2 days, and 30 days after calyx excision. CK1, CK2, and CK3 were control groups at the corresponding time point. Bars are SD (n = 3).
Horticulturae 11 00939 g005
Figure 6. The expression pattern analysis of PbrOFP family. (A) The heatmap analysis of PbrOFPs in various tissues combined with RNA-seq database. Light green indicates low expression and red indicates high expression. (B) The localization information of PbrOFPs using RT-PCR, including root, stem, leaf, petal, fruit, pollen, and style.
Horticulturae 11 00939 g006
Disclaimer/Publisher’s Note: The statements, opinions and data contained in all publications are solely those of the individual author(s) and contributor(s) and not of MDPI and/or the editor(s). MDPI and/or the editor(s) disclaim responsibility for any injury to people or property resulting from any ideas, methods, instructions or products referred to in the content.