Article

Characterization of the HSP70 Gene Family and Its Expression Under Heat Stress in Non-Heading Chinese Cabbage

1
Anhui Provincial Key Laboratory of the Conservation and Exploitation of Biological Resources, College of Life Sciences, Anhui Normal University, Wuhu 241000, China
2
School of Horticulture and Landscape Architecture, Wuhu Institute of Technology, Wuhu 241006, China
3
Anhui Academy of Medical Sciences, Anhui Medical College, Hefei 230061, China
4
The Institute of Bioinformatics, College of Life Sciences, Anhui Normal University, Wuhu 241000, China
*
Author to whom correspondence should be addressed.
Horticulturae 2025, 11(8), 938; https://doi.org/10.3390/horticulturae11080938
Submission received: 17 June 2025 / Revised: 21 July 2025 / Accepted: 29 July 2025 / Published: 8 August 2025
(This article belongs to the Section Biotic and Abiotic Stress)

Abstract

Heat stress, intensified by global warming, is an increasing challenge for the growth and yield of the economically important crop Brassica rapa subsp. chinensis (NHCC). The Heat Shock Protein 70 (HSP70) family plays an important role in plant thermotolerance, but its molecular characteristics and regulatory mechanisms in this subspecies have not been investigated. Herein, we conducted a comprehensive genomic and transcriptional profiling of the BrcHSP70 gene lineage and revealed a total of 31 members. Our phylogenetic analysis revealed a closer evolutionary relationship to genes from B. rapa ssp. pekinensis (HCC) than to those found in Arabidopsis. Genomic analysis demonstrated that segmental duplication, with eight pairs identified, was the primary driving force for the family’s expansion, rather than tandem duplication. Additionally, the BrcHsp70 gene promoters are enriched with cis-acting elements responsive to phytohormones (particularly ABA) and abiotic stresses. Critically, under 38 °C high-temperature stress, the heat-resistant variety ‘SHI’ and heat-sensitive variety ‘Aijiaohuang’ exhibited distinct expression patterns, identifying key candidate genes implicated in thermotolerance. These results elucidate the evolutionary and regulatory features of the HSP70 family in NHCC, providing a new understanding of the molecular mechanisms of plant heat tolerance.

1. Introduction

Plants encounter significant challenges when exposed to high temperatures, a primary abiotic stress factor that hampers their growth and productivity [1,2]. The increasing occurrence of high-heat events, driven by climate change, now affects plants throughout their entire life cycle [3,4,5]. Consequently, high-temperature stress is becoming a crucial concern [6]. Furthermore, numerous species experience a reduction in their vegetative growth period due to significantly elevated ambient temperatures [7]. Despite the challenges posed by high-temperature stress, plants have developed sophisticated coping strategies. Such mechanisms involve modified gene expression, osmotic regulation, and strengthened antioxidant defense systems [8,9]. Multiple investigations in this area have provided compelling evidence linking a plant’s ability to withstand heat to its production of heat shock proteins (HSPs) [10,11]. Nevertheless, the intricate molecular processes governing the expression of HSPs in plants remain poorly understood. Therefore, further research is needed to elucidate the complex interactions between heat shock proteins and plant stress responses.
HSPs are stress-responsive molecules that are activated by various environmental pressures, including heat, drought, salinity, and heavy metals [12,13,14,15,16]. First identified in Drosophila in the mid-20th century, these proteins are found across nearly all life forms [14]. The HSP superfamily is categorized into five distinct families based on their size: 100, 90, 70, 60 kDa, and the low-molecular-weight sHSP class [17,18]. Among these, HSP70 is the most studied. Its significance lies in its ability to regulate protein aggregation by monitoring protein structure, correcting misfolded conformations, and performing other housekeeping functions associated with protein folding and quality assurance [19,20]. Its primary structure contains three main regions: a highly conserved ATPase domain at the N-terminus (NBD), a central domain for substrate binding (SBD), and a variable “lid” region at the C-terminus, which mediates co-chaperone interactions [21,22]. This structural organization enables HSP70 to perform its chaperone and folding functions efficiently.
Non-heading Chinese cabbage (NHCC, Brassica rapa subsp. chinensis) is a highly valued vegetable in Asia. Its widespread consumption makes it a vital crop for ensuring global food security [23,24]. Belonging to the Brassicaceae family, a group that includes numerous significant oilseed and vegetable crops and medicinal plants [25,26], NHCC also serves as an excellent model system for scientific research. Nevertheless, this crop is also under considerable stress due to global warming, with heat stress being a primary concern. Therefore, exploring the molecular basis for heat resistance in NHCC is crucial for improving its growth, development, and breeding [27,28].
The HSP70 gene family has been extensively researched in various plants, including Arabidopsis, rice, and rape, with 18, 32, and 28 members identified, respectively [29,30,31]. For instance, Tabusam et al. (2022) identified 28 potential HSP70 members in heading Chinese cabbage (HCC, Brassica rapa ssp. pekinensis) and confirmed via qRT-PCR that these genes were inducible by both cold and heat stress [31]. However, the characteristics of these genes in NHCC have not yet been explored.
The aim of this study was to clarify the structural and functional properties of the members of the HSP70 gene family in NHCC. Our main tasks were to (1) identify and analyze the HSP70 gene members, (2) construct a phylogenetic tree and determine their collinearity, and (3) analyze the gene expression within a heat-tolerant and a heat-sensitive variety under thermal stress using qRT-PCR. This research clarifies the structure and expression of the HSP70 genes in NHCC. It also offers a deeper understanding of the molecular mechanisms of plant responses to heat.

2. Materials and Methods

2.1. Growth and Stress Treatments

NHCC seeds were sourced from the Institute of Horticulture at the Shanghai Academy of Agricultural Sciences. After careful consideration, two varieties were selected: the heat-sensitive material ‘AiJiaohuang’ and the heat-resistant variety ‘SHI’.
To initiate cultivation, seeds were sown onto Petri dishes containing well-hydrated filter paper substrate and incubated with a photoperiod of 14 h of light and 10 h of darkness at 25 °C/20 °C, respectively. After sprouting, seedlings were transplanted into soil and grown for one month. Following this initial growth phase, the NHCC seedlings were subjected to heat stress by moving them to a light incubator with conditions programmed for a 14 h light/10 h dark photoperiod at 38 °C/25 °C.

2.2. NHCC: Genome-Wide Characterization of the HSP70 Genes

The complete proteome data for NHCC was retrieved from the Non-heading Chinese Cabbage Database [25]. To identify putative HSP70 genes, two parallel methods were used. First, a BLASTP search (version 2.17.0) was performed utilizing the Arabidopsis HSP70 amino acid sequences as queries against the proteome. Second, the proteome was screened using the HMM signature for the HSP70 family (PF00012), retrieved from the Pfam database [32,33,34].
The findings from these two searches were merged, and duplicates were removed, applying an E-value cutoff of <1 × 10⁻⁵. The remaining candidate sequences were then validated using the NCBI Conserved Domain Search database [35] and InterProScan. Ultimately, we identified 31 putative HSP70 genes in NHCC.
The theoretical molecular mass (kDa), isoelectric points (pI), and the GRAVY (grand average of hydropathy) score for each HSP70 were determined via the pI/MW and PROTPARAM tools, respectively, from the ExPASy server [36]. Subcellular localization analysis was conducted using CELLO v2.5 [37].

2.3. Phylogenetic Analysis

To investigate the evolutionary relationships of the HSP70 gene family in NHCC, we selected members from Arabidopsis and HCC. The sequence data for Arabidopsis were downloaded from the TAIR database, while the data for HCC were obtained from the Brassicaceae Database (BRAD) [38]. The sequences were aligned using the MAFFT v7.313 algorithm as implemented in PhyloSuite v1.2.2 [39]. Subsequently, a phylogenetic tree was built based on the maximum-likelihood (ML) approach using RAxML 8.2.12 [40]. The analysis was performed with the PROTGRAMMAAUTO model, 1000 thorough bootstrap replicates, and a bootstrapping convergence criterion. Additionally, a parallel tree was generated using Bayesian inference (BI) with MrBayes v3.2.7a over 10 million generations, sampling one tree per thousand generations. This process involved two independent runs, each with four chains. Ultimately, the generated phylogenetic tree was visualized with the Interactive Tree of Life (iTOL) v6 [41].

2.4. Analysis of HSP70 Gene Structure and Conserved Analysis

To gather insights into the exon–intron structure of HSP70 genes, we employed GSDS v2.0 [42] for an analysis of their genomic and coding sequences in FASTA format. Additionally, conserved sequence motifs in the proteins were identified with the MEME suite 5.5.8 [43] and visualized with TBtools software v2.311 [44].

2.5. Chromosomal Location, Duplication, and Promoter Analysis

The genomic positions of the HSP70 members were plotted using the MapGene2Chrom v2 [45] based on genome annotation files. To investigate gene duplication, a collinearity analysis was conducted. First, an all-against-all BLASTP search was performed. The results were then processed by MCScanX v1.0 to detect and visualize collinear blocks [46]. For promoter analysis, the 1.5 kb bp sequence preceding for each HSP70 member was analyzed using the PlantCARE server to predict potential cis-acting regulatory motifs [47]. The distribution of these elements was then plotted using TBtools. To calculate the selection pressure on duplicated gene pairs within NHCC, we aligned the sequences using ParaAT 2.0 [48] and subsequently calculated the non-synonymous (Ka) and synonymous (Ks) substitution rates and the Ka/Ks ratio using the Model Averaging (MA) method [49] in KaKs_Calculator 2.0 [50]. The Ka/Ks ratio is a key indicator of selective pressure, where a value >1 indicates positive selection, =1 indicates neutral selection, and <1 suggests purifying selection.

2.6. RNA-Seq Analysis

To analyze the expression of BrcHSP70 genes, an existing transcriptomic dataset was used, publicly accessible under the NCBI BioProject ID PRJNA1030162. This dataset, previously generated by our group, includes samples from ‘Aijiaohuang’ and ‘SHI’ cultivars subjected to heat stress for 0, 6, and 24 h. The experiments were conducted with three biological replicates. In this study, a value representing fragments per kilobase of exon per million mapped reads (FPKM) was used to quantify transcript abundance. The significant differentially expressed genes were defined as those meeting |log2(fold change)| ≥ 1 and FDR-adjusted p-value < 0.05. A heatmap was created from the normalized expression values with the TBtools software.

2.7. Total RNA Isolation and Quantitative PCR Methodology

RNA isolation was performed on the leaves of NHCC plants exposed to heat stress (38 °C) for 0, 6, and 24 h. Following extraction, cDNA synthesis was conducted using the NovoScript Plus all-in-one 1st Strand cDNA Synthesis SuperMix (gDNA Purge) (Novoprotein, Suzhou, China).
Primers specific to each gene were created with Primer3web (Table S1), and Bract2 (the actin2 gene from NHCC) was used as the reference gene. qRT-PCR assays were conducted using the NovoStart SYBR qPCR SuperMix Plus kit (Novoprotein, Suzhou, China) with a 20 μL reaction volume. Each reaction contained 1 μL of cDNA, 10 μL of 2× SuperMix, 1 μL of each primer (1.0 μM), and 7 μL of ddH2O. The thermal cycling conditions included a 1 min denaturation at 95 °C, and then 40 cycles of 20 s at 95 °C, 20 s at 54 °C, and 30 s at 72 °C. In terms of technical details, three biological replicates were carried out, and three technical replicates were set for each biological replicate, with a total reaction volume of 20 μL. Real-time quantitative PCR was performed using a LightCycler® 96 System (Roche, Basel, Switzerland). The 2−ΔΔCT method was employed to determine relative transcript abundance [51].

3. Results

3.1. Identification of HSP70 Genes in B. rapa ssp. chinensis

Using the BLASTP and HMMER search methods, we identified a total of 31 putative HSP70 proteins in the NHCC genome. The physicochemical properties of the corresponding proteins, including their predicted length, molecular weight (MW), and pI, are summarized in Table 1. The proteins varied between 557 and 875 aa, with corresponding MWs of 60.8–97.5 kDa and pI of 4.96–5.82. Notably, we observed that proteins in Group I were generally larger than those in the other groups.
Subcellular localization analysis showed that the majority of HSP70 members were localized in the cytoplasm, followed by the endoplasmic reticulum (ER), mitochondria, and chloroplasts. Notably, only one member was predicted in the nucleus.
HSP70 proteins are classified into five groups, as shown in Table 1 and Figure 1. Group 1, known as the HSP110/SSE subfamily, has larger molecular weights than the other groups, and its members were primarily identified in the cytoplasm and ER. The Group 1 members from HCC and A. thaliana were also predicted to be localized in the cytoplasm. In contrast, Groups 2 through 5, belonging to the DnaK subfamily, showed highly specific and conserved localizations in various organelles. The members of Groups 2, 3, 4, and 5 from NHCC were observed in the chloroplasts, mitochondria, ER, and cytoplasm, respectively, with the exception of BrcHSP70-9.2 (Group 3) and BrcHSP70-13.1 (Group 4). Furthermore, the corresponding orthologs in Groups 2 through 5 from HCC and A. thaliana also followed these same organelle-specific localization patterns, confirming the high degree of functional conservation within each group.

3.2. Phylogenetic Analysis of HSP70 Proteins in Brassica and Arabidopsis

To analyze the phylogeny of 79 HSP70 members from Brassica and Arabidopsis, a tree was constructed using ML and BI methods. The resulting tree revealed the presence of five distinct clusters, each comprising a varying number of HSP70s. Specifically, 30 HSP70s were found in HCC, 31 in NHCC, and 18 in Arabidopsis. Within the five phylogenetic groups, Group 5 was the largest (31 members), while Group 2 was the smallest (10 members). The remaining groups, Group 1 (14), Group 3 (11), and Group 4 (13), had a similar number of members. Notably, these phylogenetic groupings show a strong correlation with the subcellular localization of the proteins. This remarkable consistency confirms that the clades identified in the phylogenetic analysis represent functionally distinct subfamilies.
The phylogenetic tree shows that HSP70 proteins from HCC and NHCC are more closely related to each other than to those from Arabidopsis. This reflects the closer evolutionary relationship between the two Brassica species. Notably, representatives from all HSP70 subfamilies were found in A. thaliana. This finding demonstrates that each Brassica HSP70 subfamily has an orthologous counterpart in the A. thaliana genome, as shown in Figure 1.

3.3. Motif, Gene Structure, and Domain Analysis of BrcHSP70s

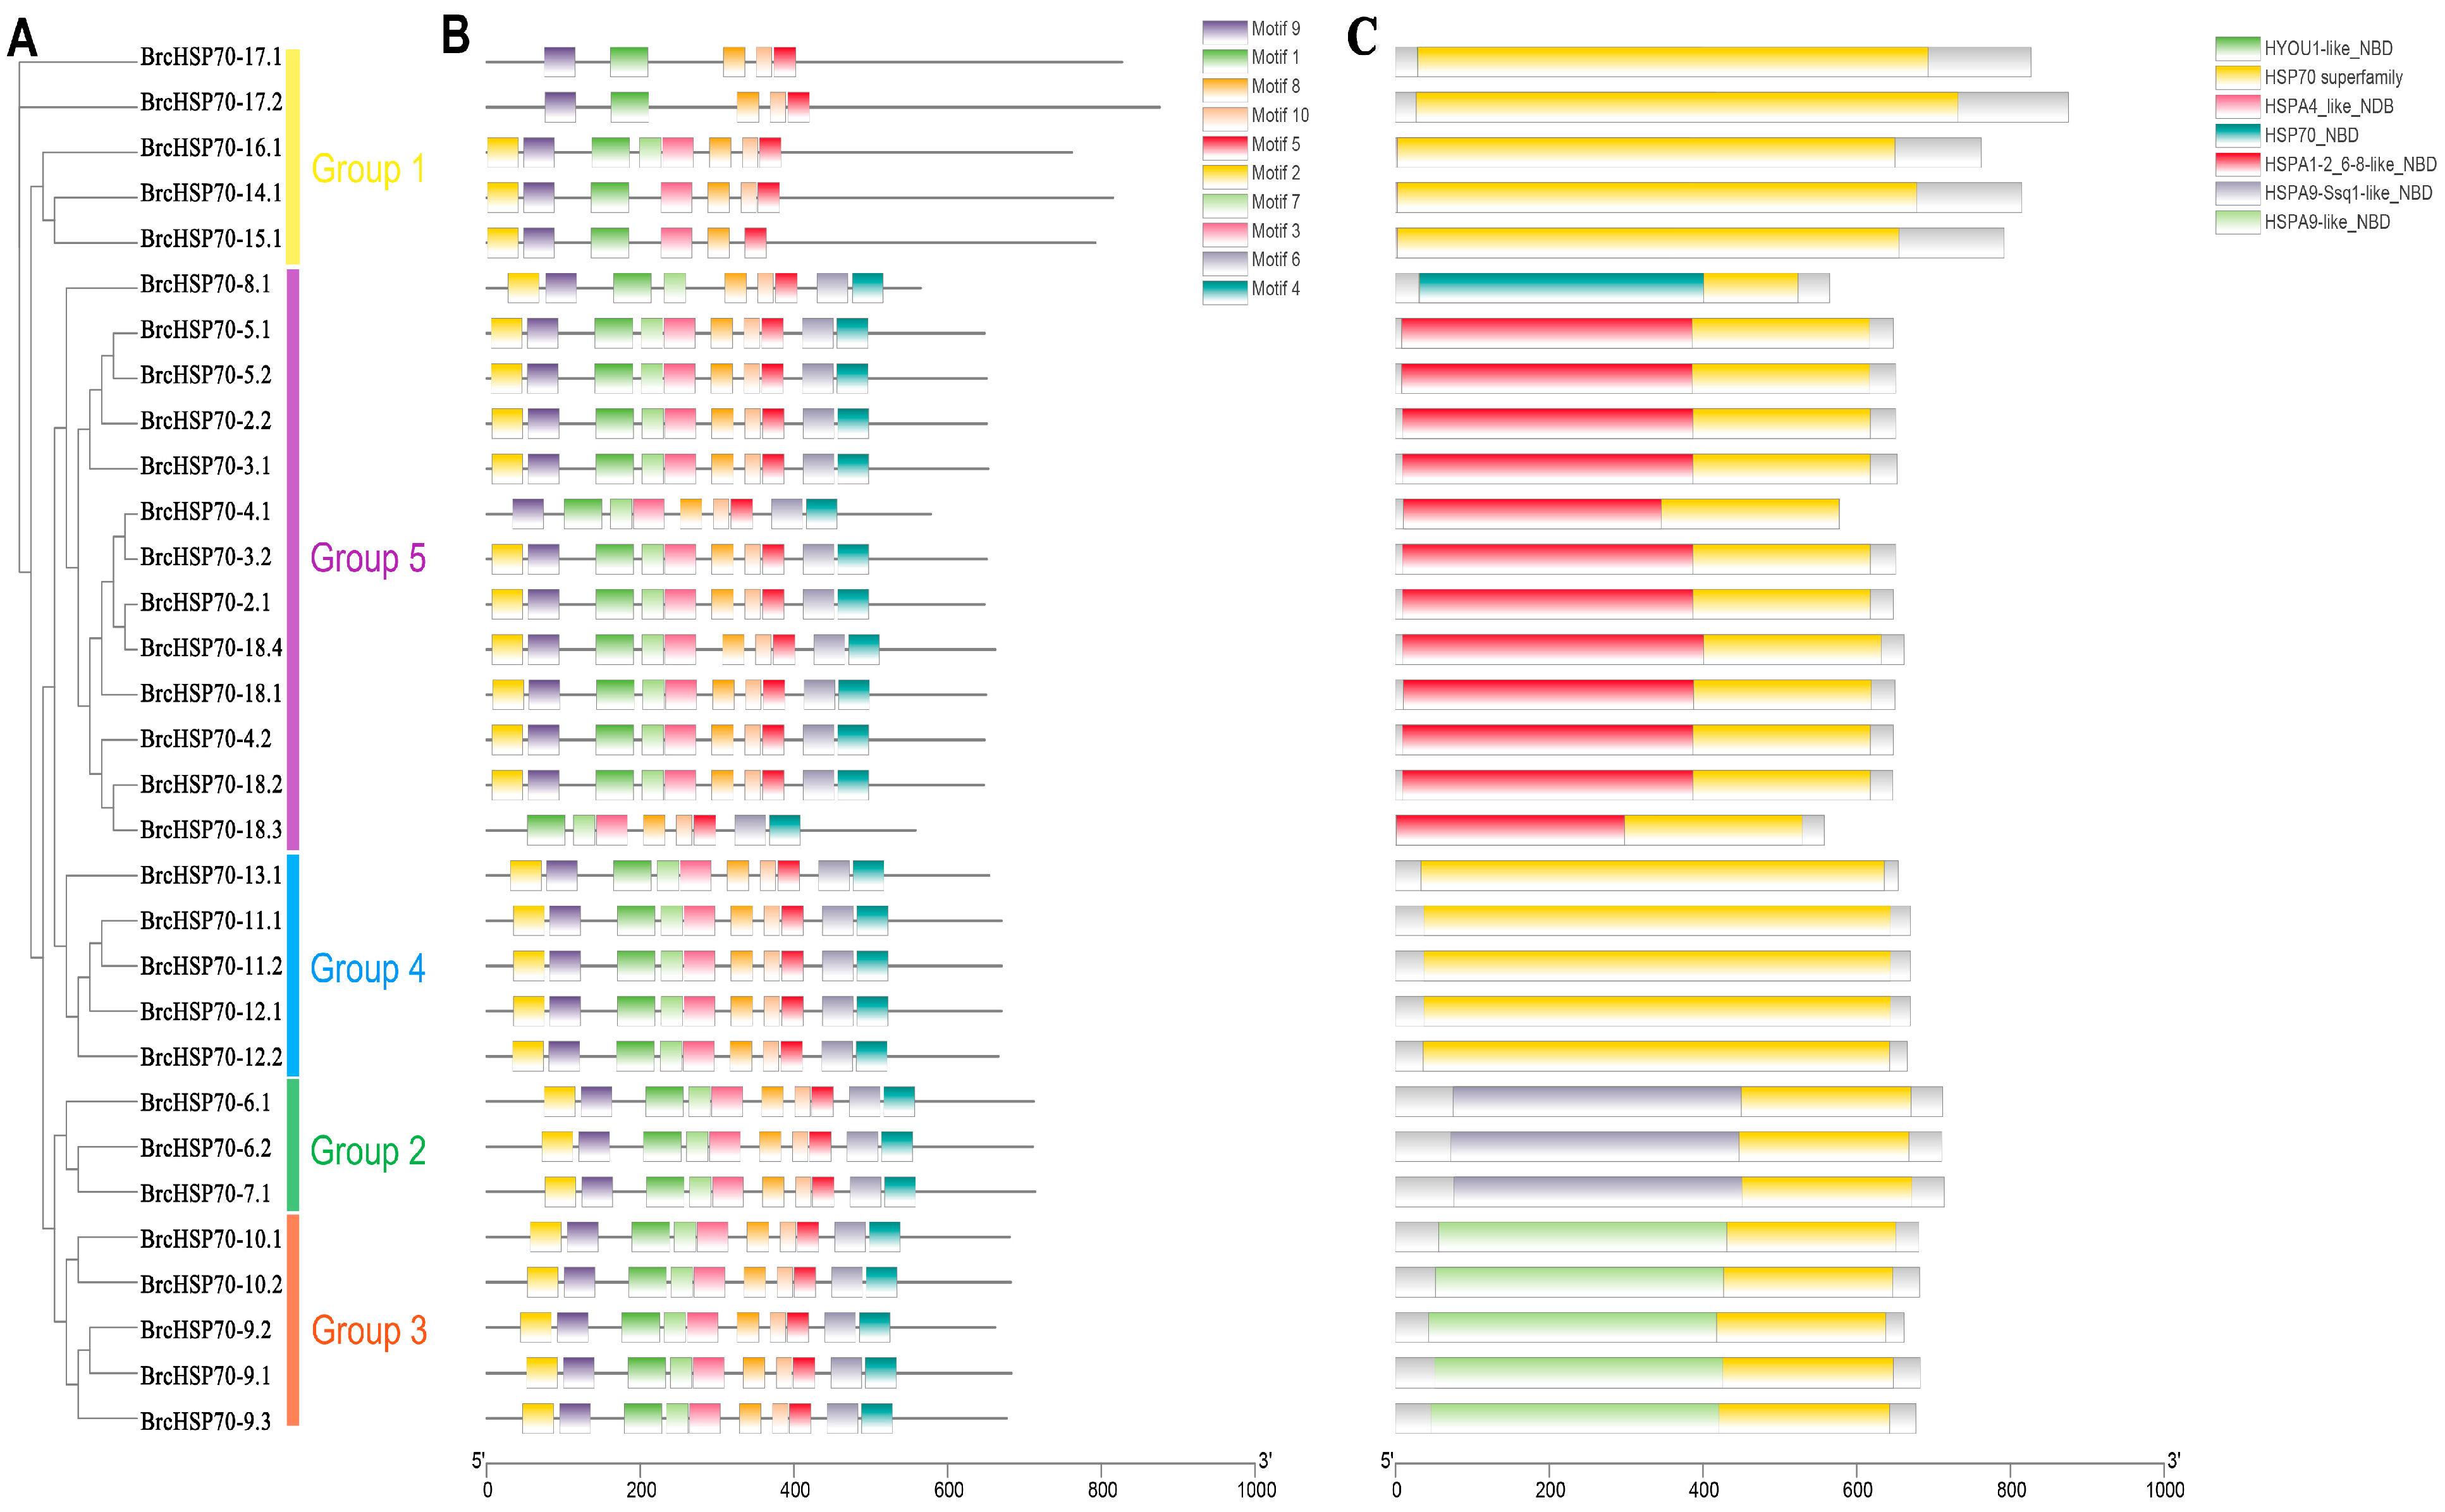
To investigate the functional domains of the HSP70 gene family in NHCC, we analyzed its conserved motifs using the MEME tool. The analysis revealed that only three conserved motifs (M1, M5, and M8) were present in all BrcHSP70 proteins, while the other seven were distributed among different subgroups. We further investigated the motifs through phylogenetic analysis, which suggested that closely related HSP70 proteins share similar motif patterns (Figure 2A). For instance, Group 1 proteins had the fewest motifs, lacking motifs 4 and 6. Notably, motif 9 is present in all the BrcHSP70 proteins except in one of the Group 5 members (Figure 2B). In addition, a more detailed analysis indicated that all BrcHSP70s possessed HSP70 and NBD (Nucleotide-Binding Domain) domains, as shown in Figure 2C.
We also examined the gene structure, specifically the number and distribution of introns, in 31 NHCC HSP70 genes (Figure 3). The intron count varied significantly among these genes, ranging from zero to fifteen. The gene structures in Group 5 were the simplest, with three genes (BrcHSP70-5.1, -5.2, and -18.3) being completely intronless, while eight others (BrcHSP70-2.1, -2.2, -3.1, -3.2, -8.1, -4.2, -18.1, and -18.2) each contained a single intron. In another instance of structural similarity, BrcHSP70-6.1, -6.2, and -7.1 all shared the same number of seven introns. In contrast to the simpler structures, BrcHSP70-17.1 contained the highest number of introns at 15.

3.4. Chromosomal Distribution and Duplication Dynamics of BrcHSP70 Family

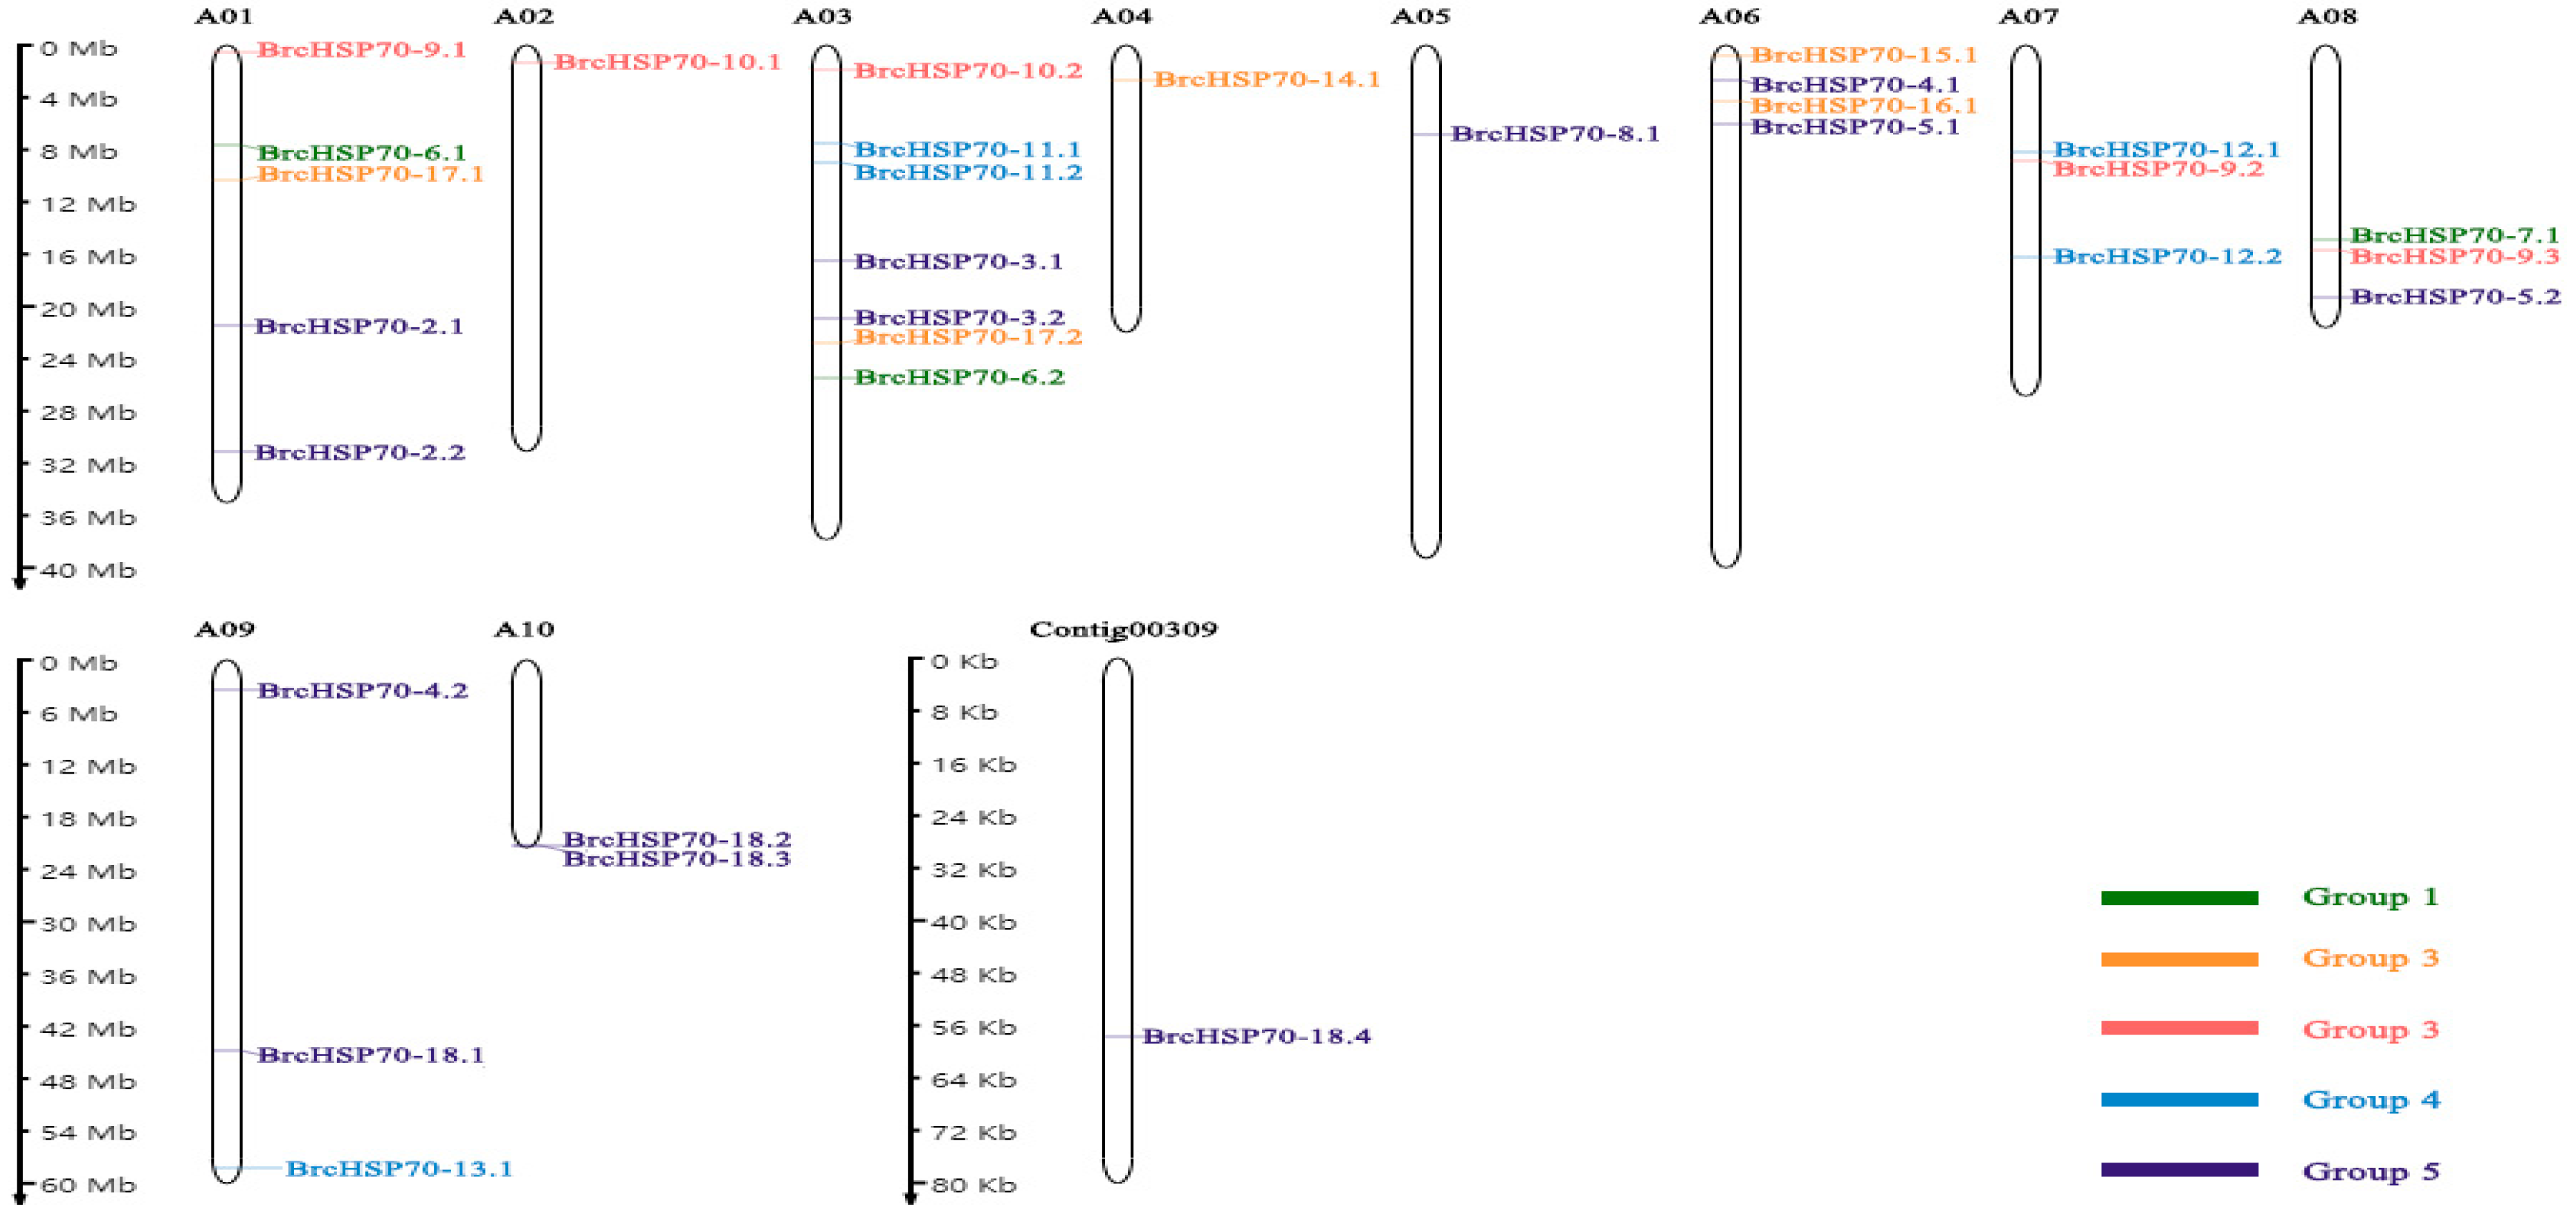
To determine the chromosomal distribution of the HSP70 gene family members within NHCC, we conducted a genomic analysis. In total, 31 BrcHSP70 genes were identified, unevenly distributed across 10 chromosomes. The highest gene densities were on chromosome A03 (seven members), A01 (five members), and A06, A07, and A08. In contrast, chromosomes 2, 4, and 5 each contained only a single member. Importantly, BrcHSP70-18.4 was not found on these primary chromosomes but was uniquely located on Contig00309 (Figure 4). No significant correlation was observed between the chromosome length and the quantity of HSP70 genes.
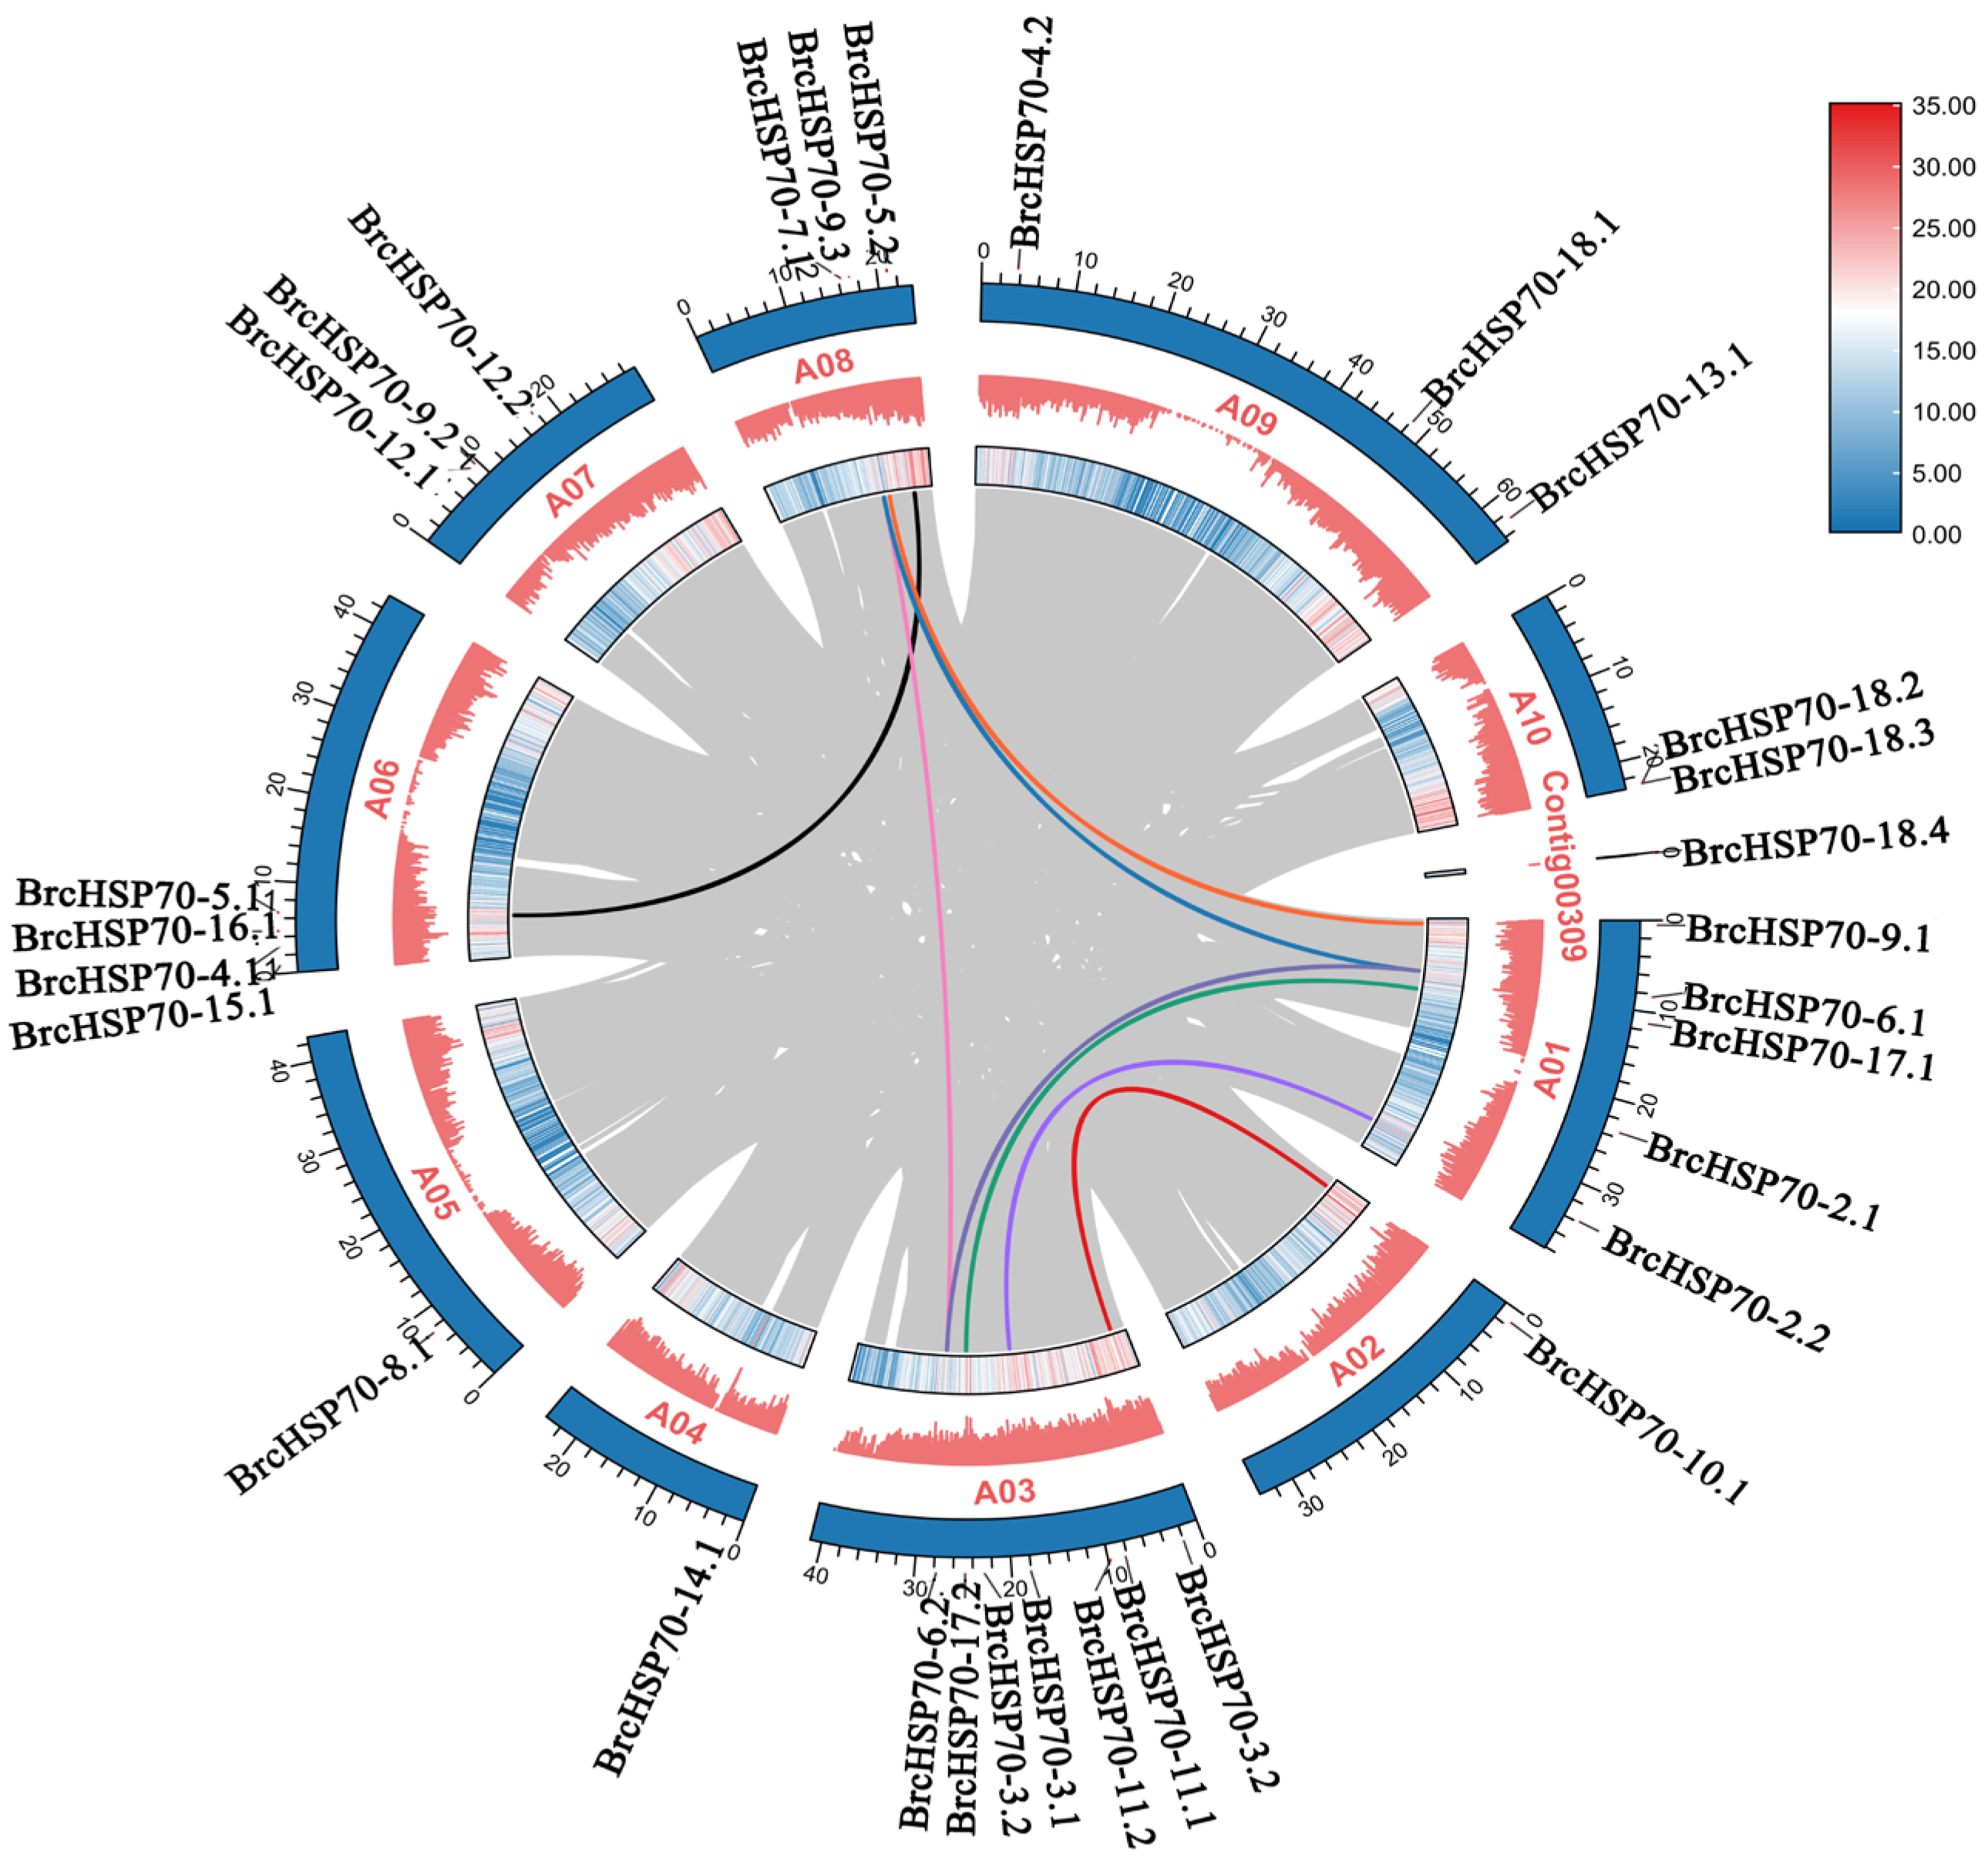
To investigate the role of gene duplication in the expansion of the BrcHSP70 family in NHCC, we analyzed the genome for segmental and tandem duplication events. Our analysis identified eight segmental duplication pairs but no tandem duplications, indicating that segmental duplication was the primary expansion mechanism.
The segmentally duplicated gene pairs were BrcHSP70-7.1/BrcHSP70-6.2, BrcHSP70-7.1/BrcHSP70-6.1, BrcHSP70-9.3/BrcHSP70-9.1, BrcHSP70-5.2/BrcHSP70-5.1, BrcHSP70-6.2/BrcHSP70-6.1, BrcHSP70-17.2/BrcHSP70-17.1, BrcHSP70-3.1/BrcHSP70-2.2, and BrcHSP70-10.2/BrcHSP70-10.1 (Figure 5). Particularly, BrcHSP70-7.1 pairs not only with fragment BrcHSP70-6.2, but also with fragment BrcHSP70-6.1. Furthermore, to elucidate the evolutionary rate of the duplicated BrcHSP70 genes, we calculated the Ka/Ks ratio for eight paralogous pairs. An analysis of all eight paralogous BrcHSP70 pairs revealed Ka/Ks ratios lower than 1, ranging from 0.0078 (BrcHSP70-3.1/BrcHSP70-2.2 pair) to 0.1019 (BrcHSP70-17.2/BrcHSP70-17.1 pair) (Table 2). This result strongly indicates that these BrcHSP70 members, produced by gene duplication events, have undergone strong purifying selection.
To investigate how HSP70 genes expanded and clustered, we carried out a syntenic comparison among NHCC, HCC, and A. thaliana. This comparative analysis revealed 20 collinear HSP70 gene pairs between A. thaliana and NHCC, while 42 pairs were found between NHCC and HCC (Figure S1 and Table S2). Moreover, we observed that genes showing collinearity were clustered into the same phylogenetic lineage (Figure 1), implying likely functional conservation.

3.5. Characterization of BrcHSP70 Promoter Cis-Elements

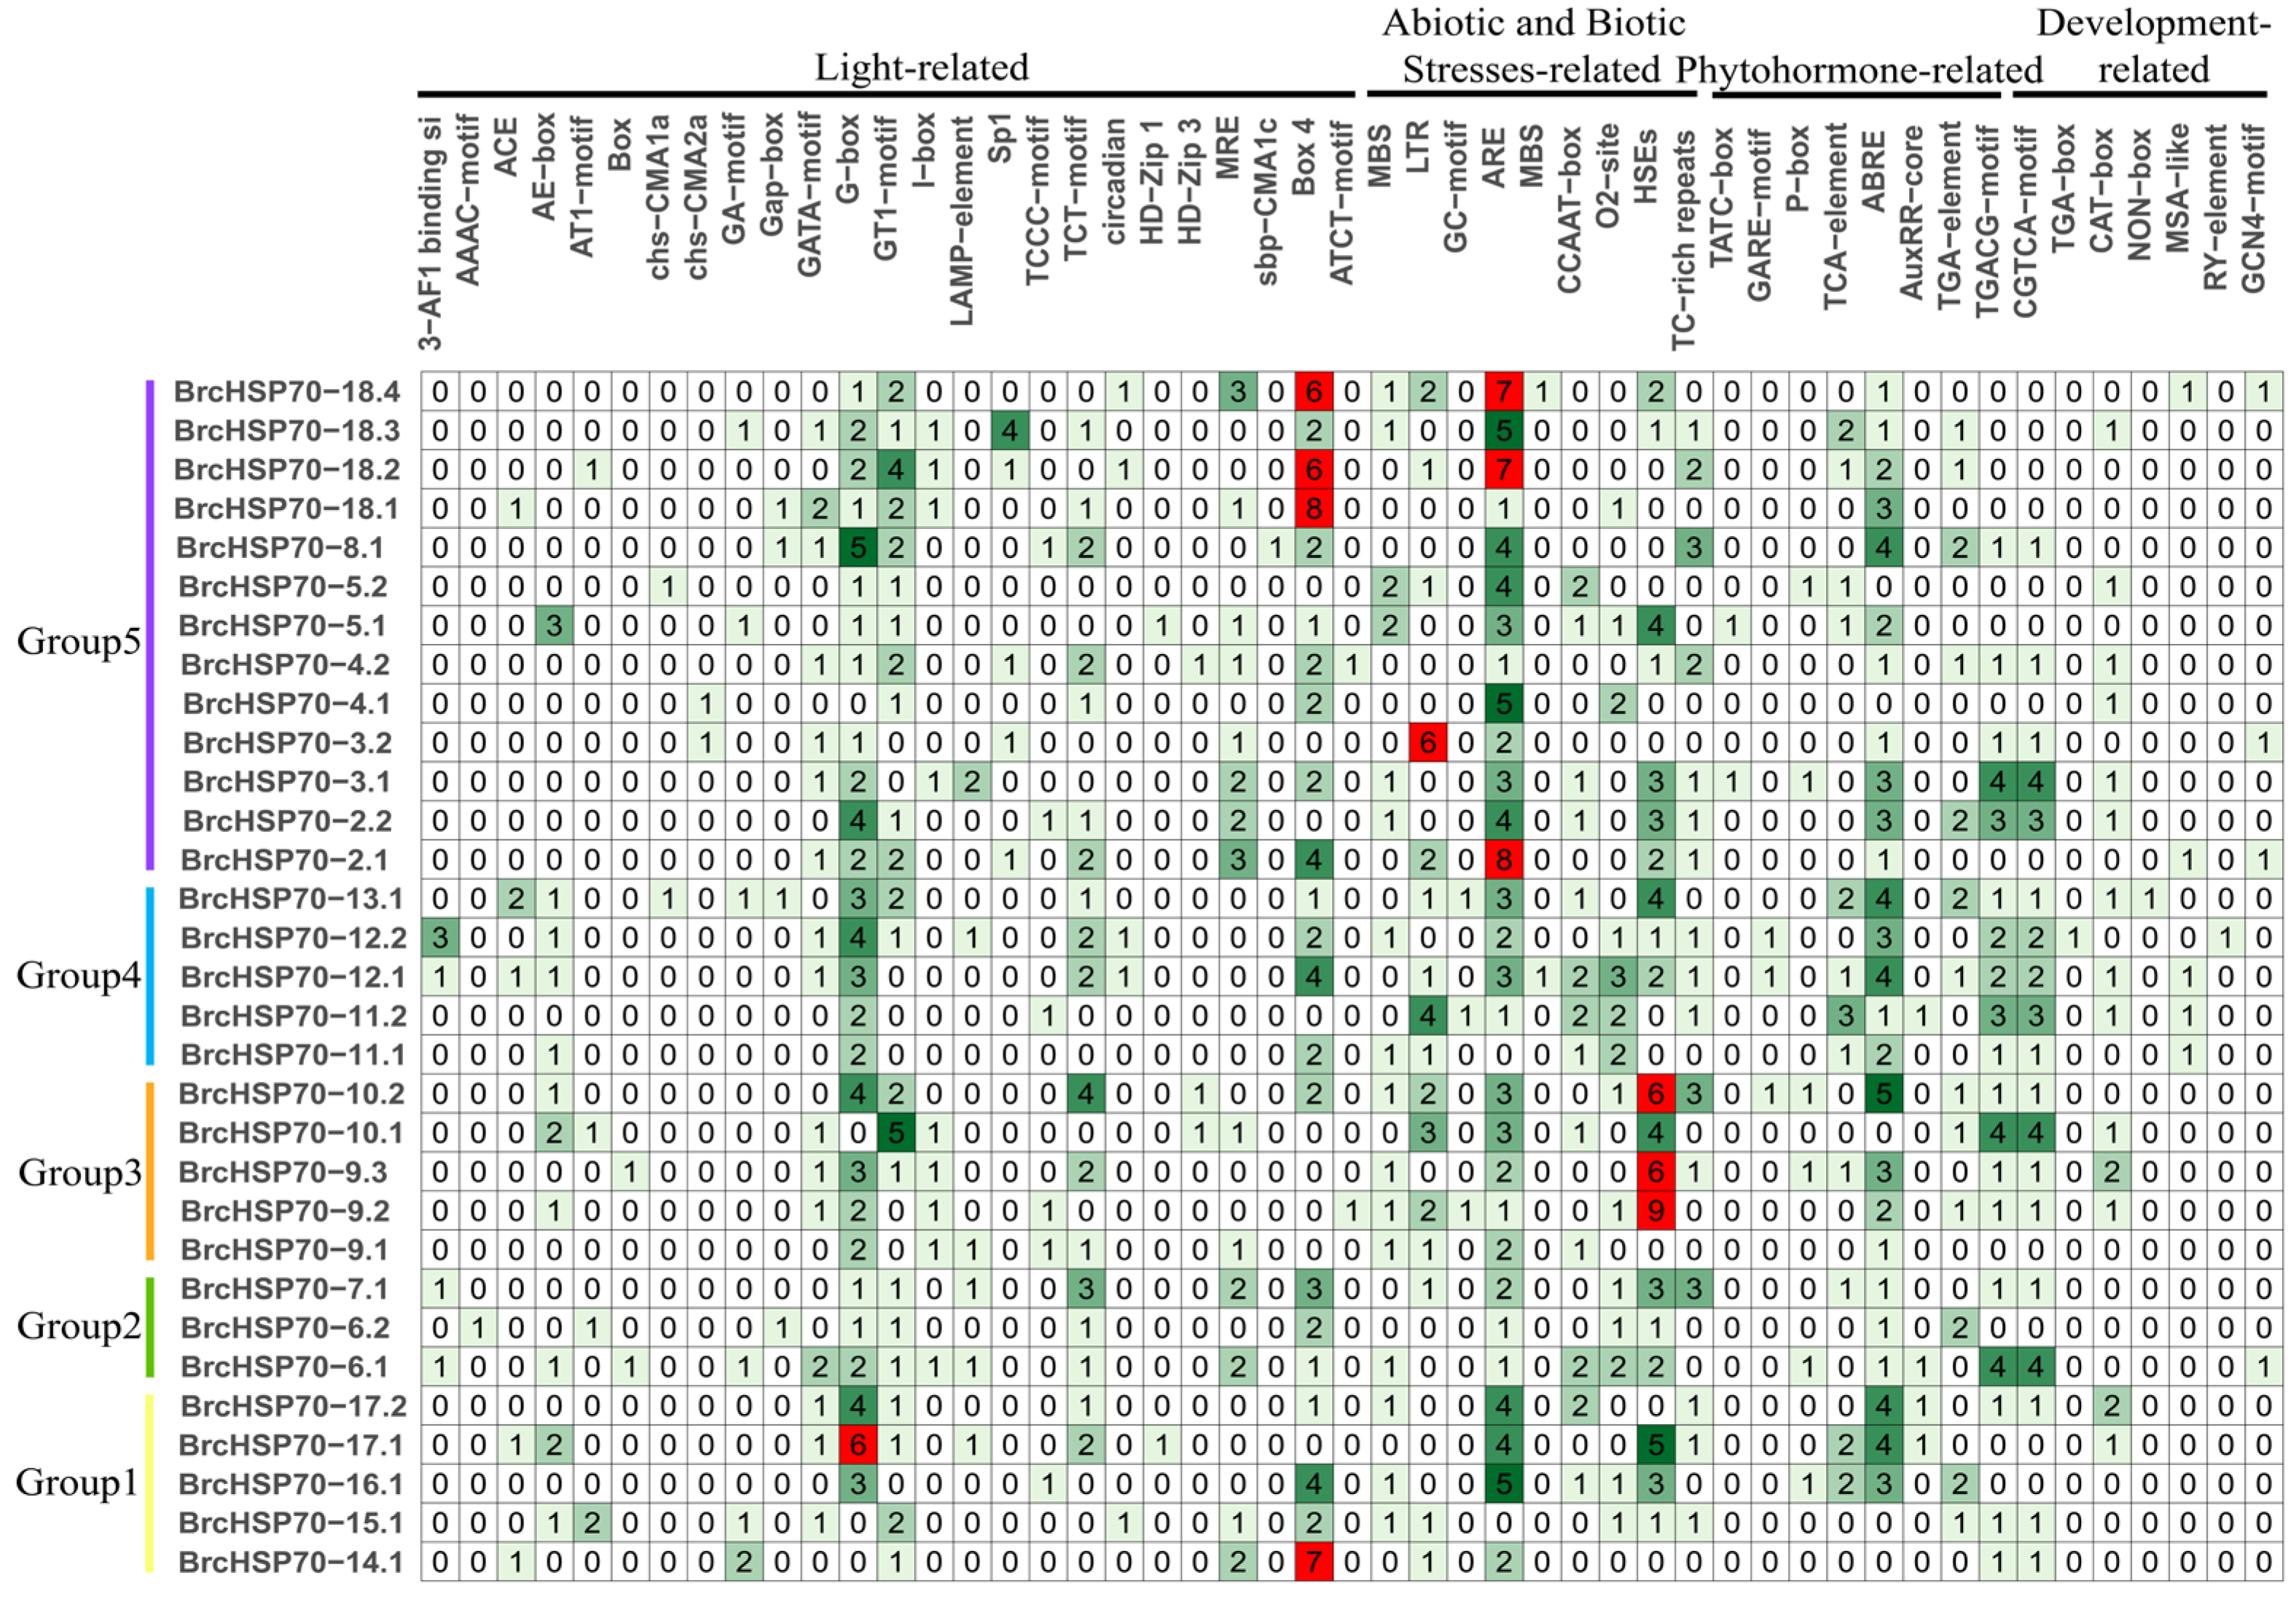
To elucidate the regulatory control of BrcHSP70 genes, we analyzed 2000 bp of their upstream promoter regions for putative cis-elements using the PlantCARE database. This analysis revealed 52 different classes of cis-regulatory elements, encompassing not only basal TATA-box and CAAT-box elements but also numerous motifs associated with light signaling, responses to abiotic and biotic stresses, hormonal regulation, and developmental processes (Figure 6). Among these, we specifically analyzed the distribution of canonical heat-shock elements (HSEs), which are crucial for the heat stress response. Our analysis revealed that 20 of the 31 BrcHSP70 gene promoters contained at least one HSE. These elements occurred in copy numbers ranging from one to nine per promoter.
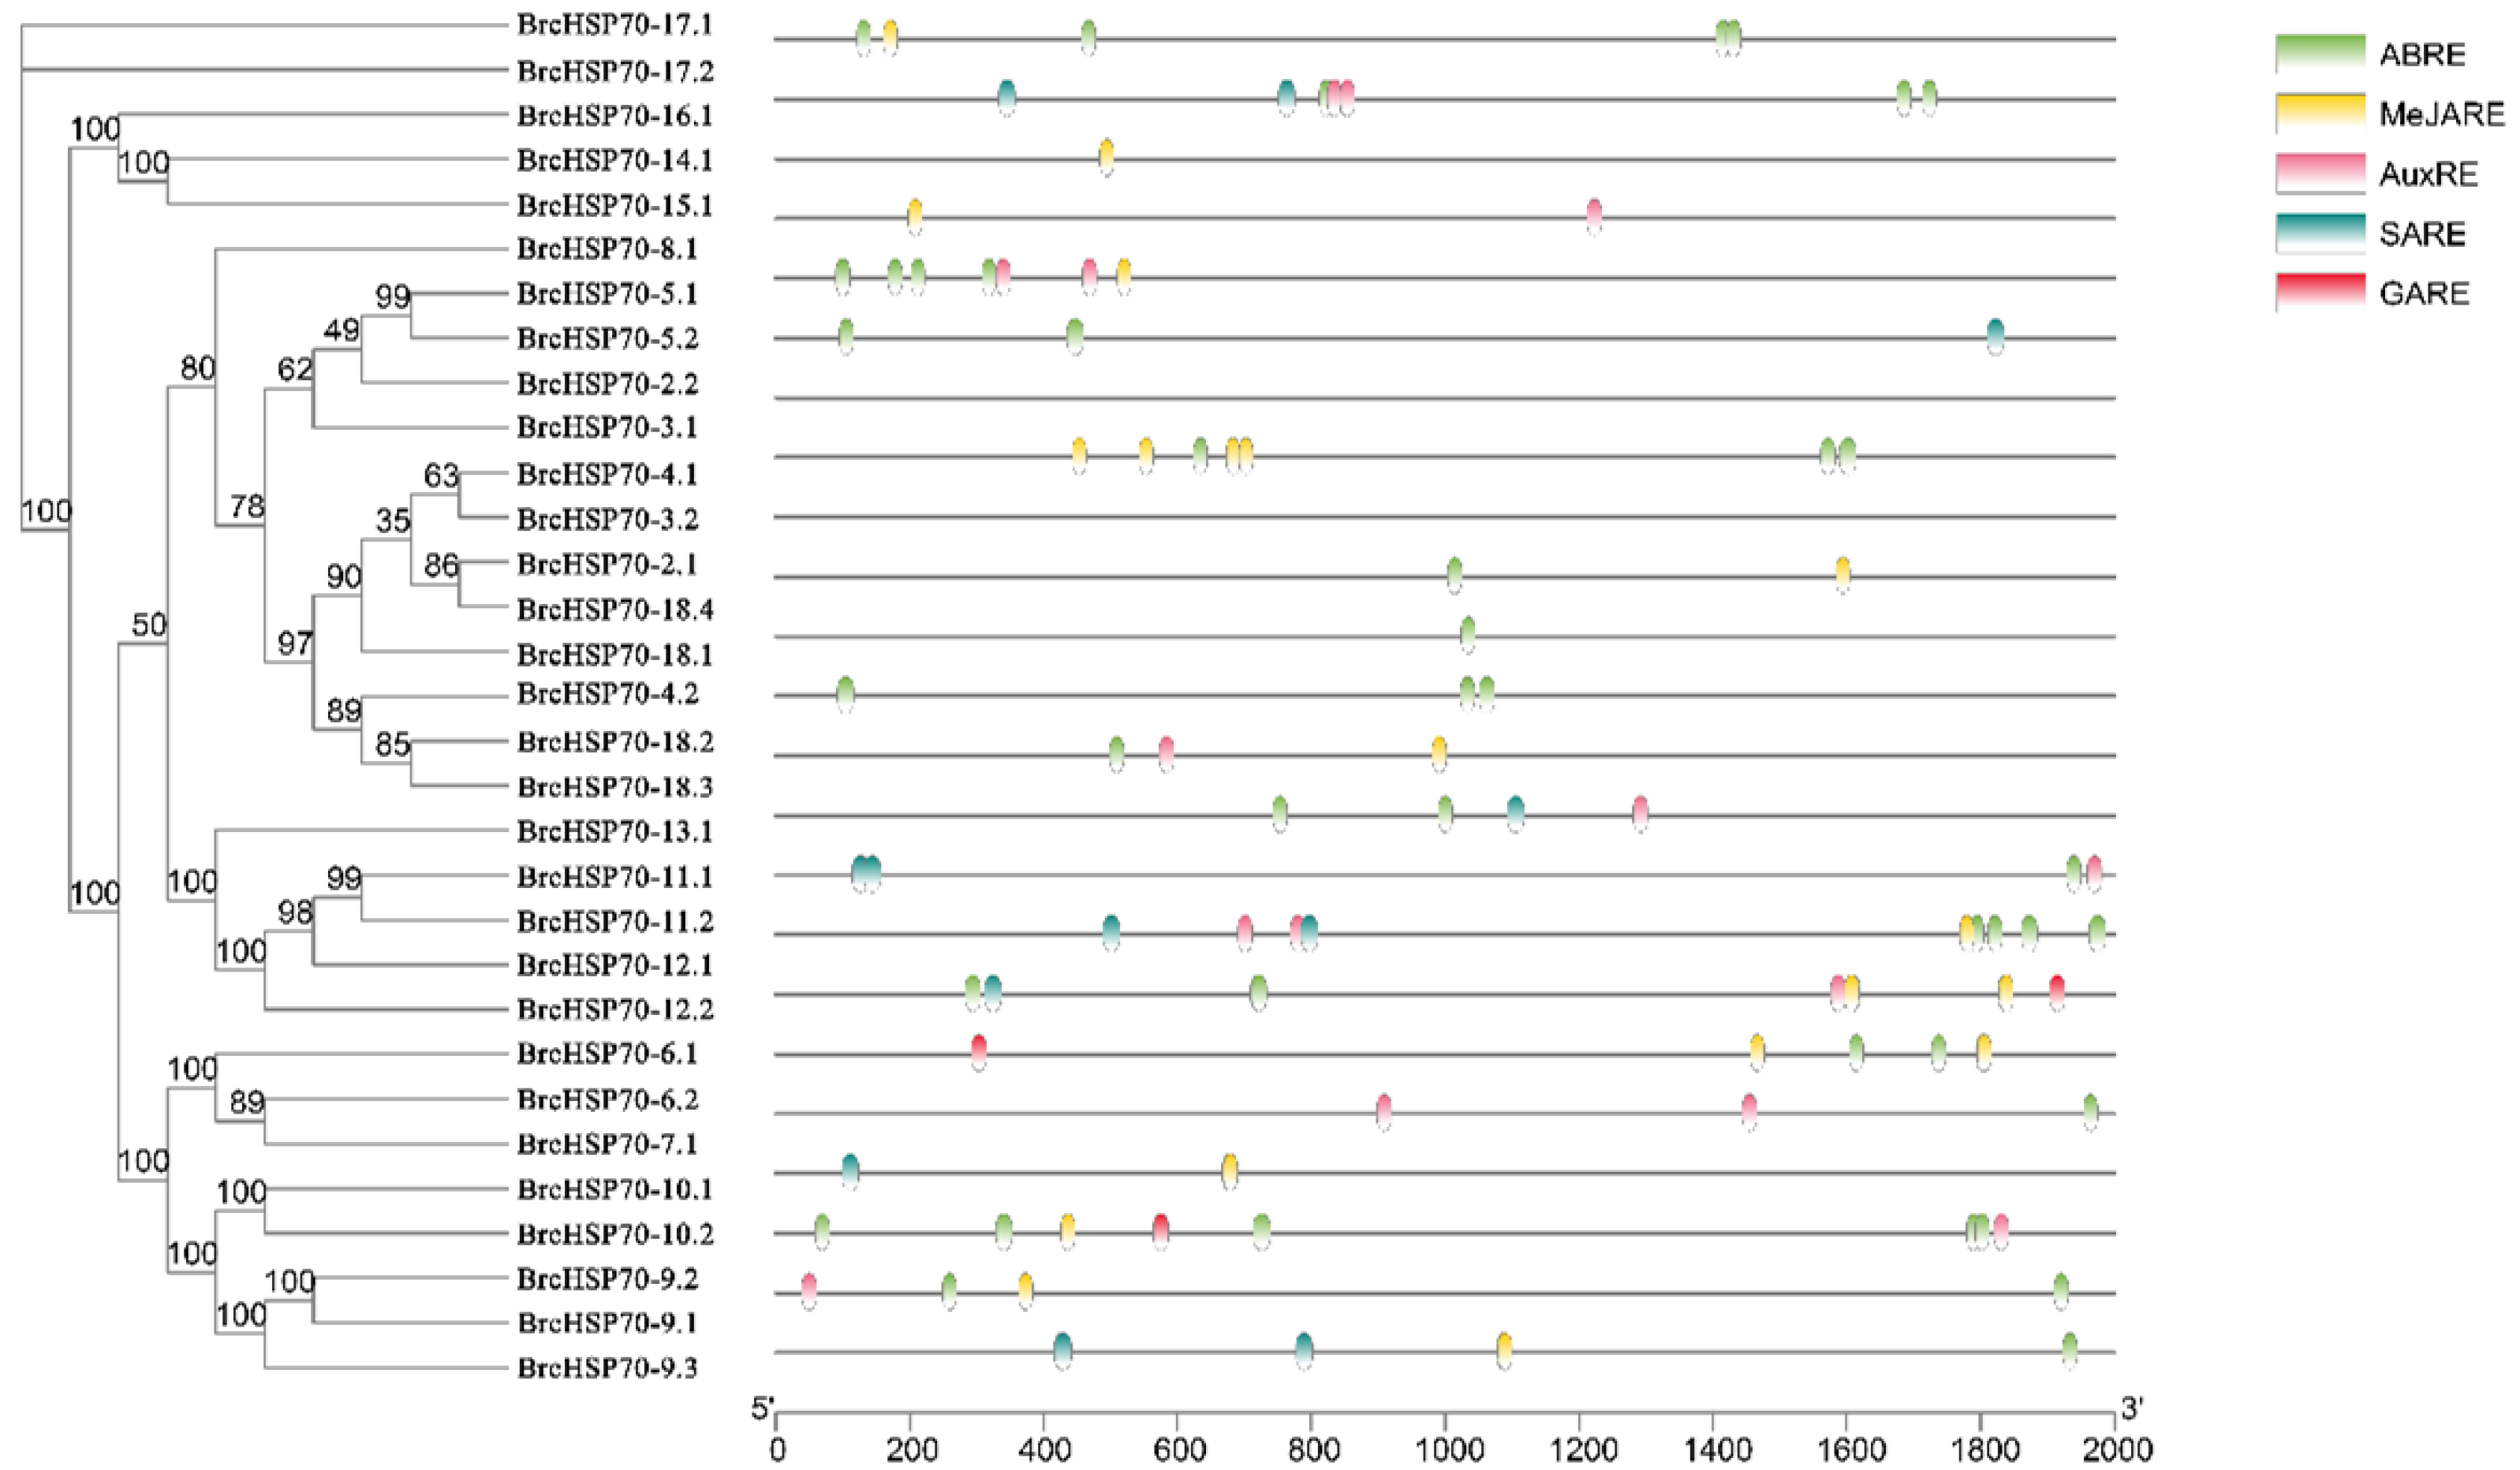
Our analysis revealed that light-responsive elements exhibited the greatest representation, with 25 out of the 52 cis-elements analyzed, indicating substantial light-mediated transcriptional regulation (Figure 7). Hormone-responsive elements were the second-largest group identified. Among these, elements responsive to Abscisic Acid (ABA) and Methyl Jasmonate (MeJA) motifs demonstrated the highest abundance, which implies they exert a key regulatory function for the BrcHSP70 gene family. Other hormone-related elements found were linked to ethylene, auxin, salicylic acid, and gibberellin (Figure 8).
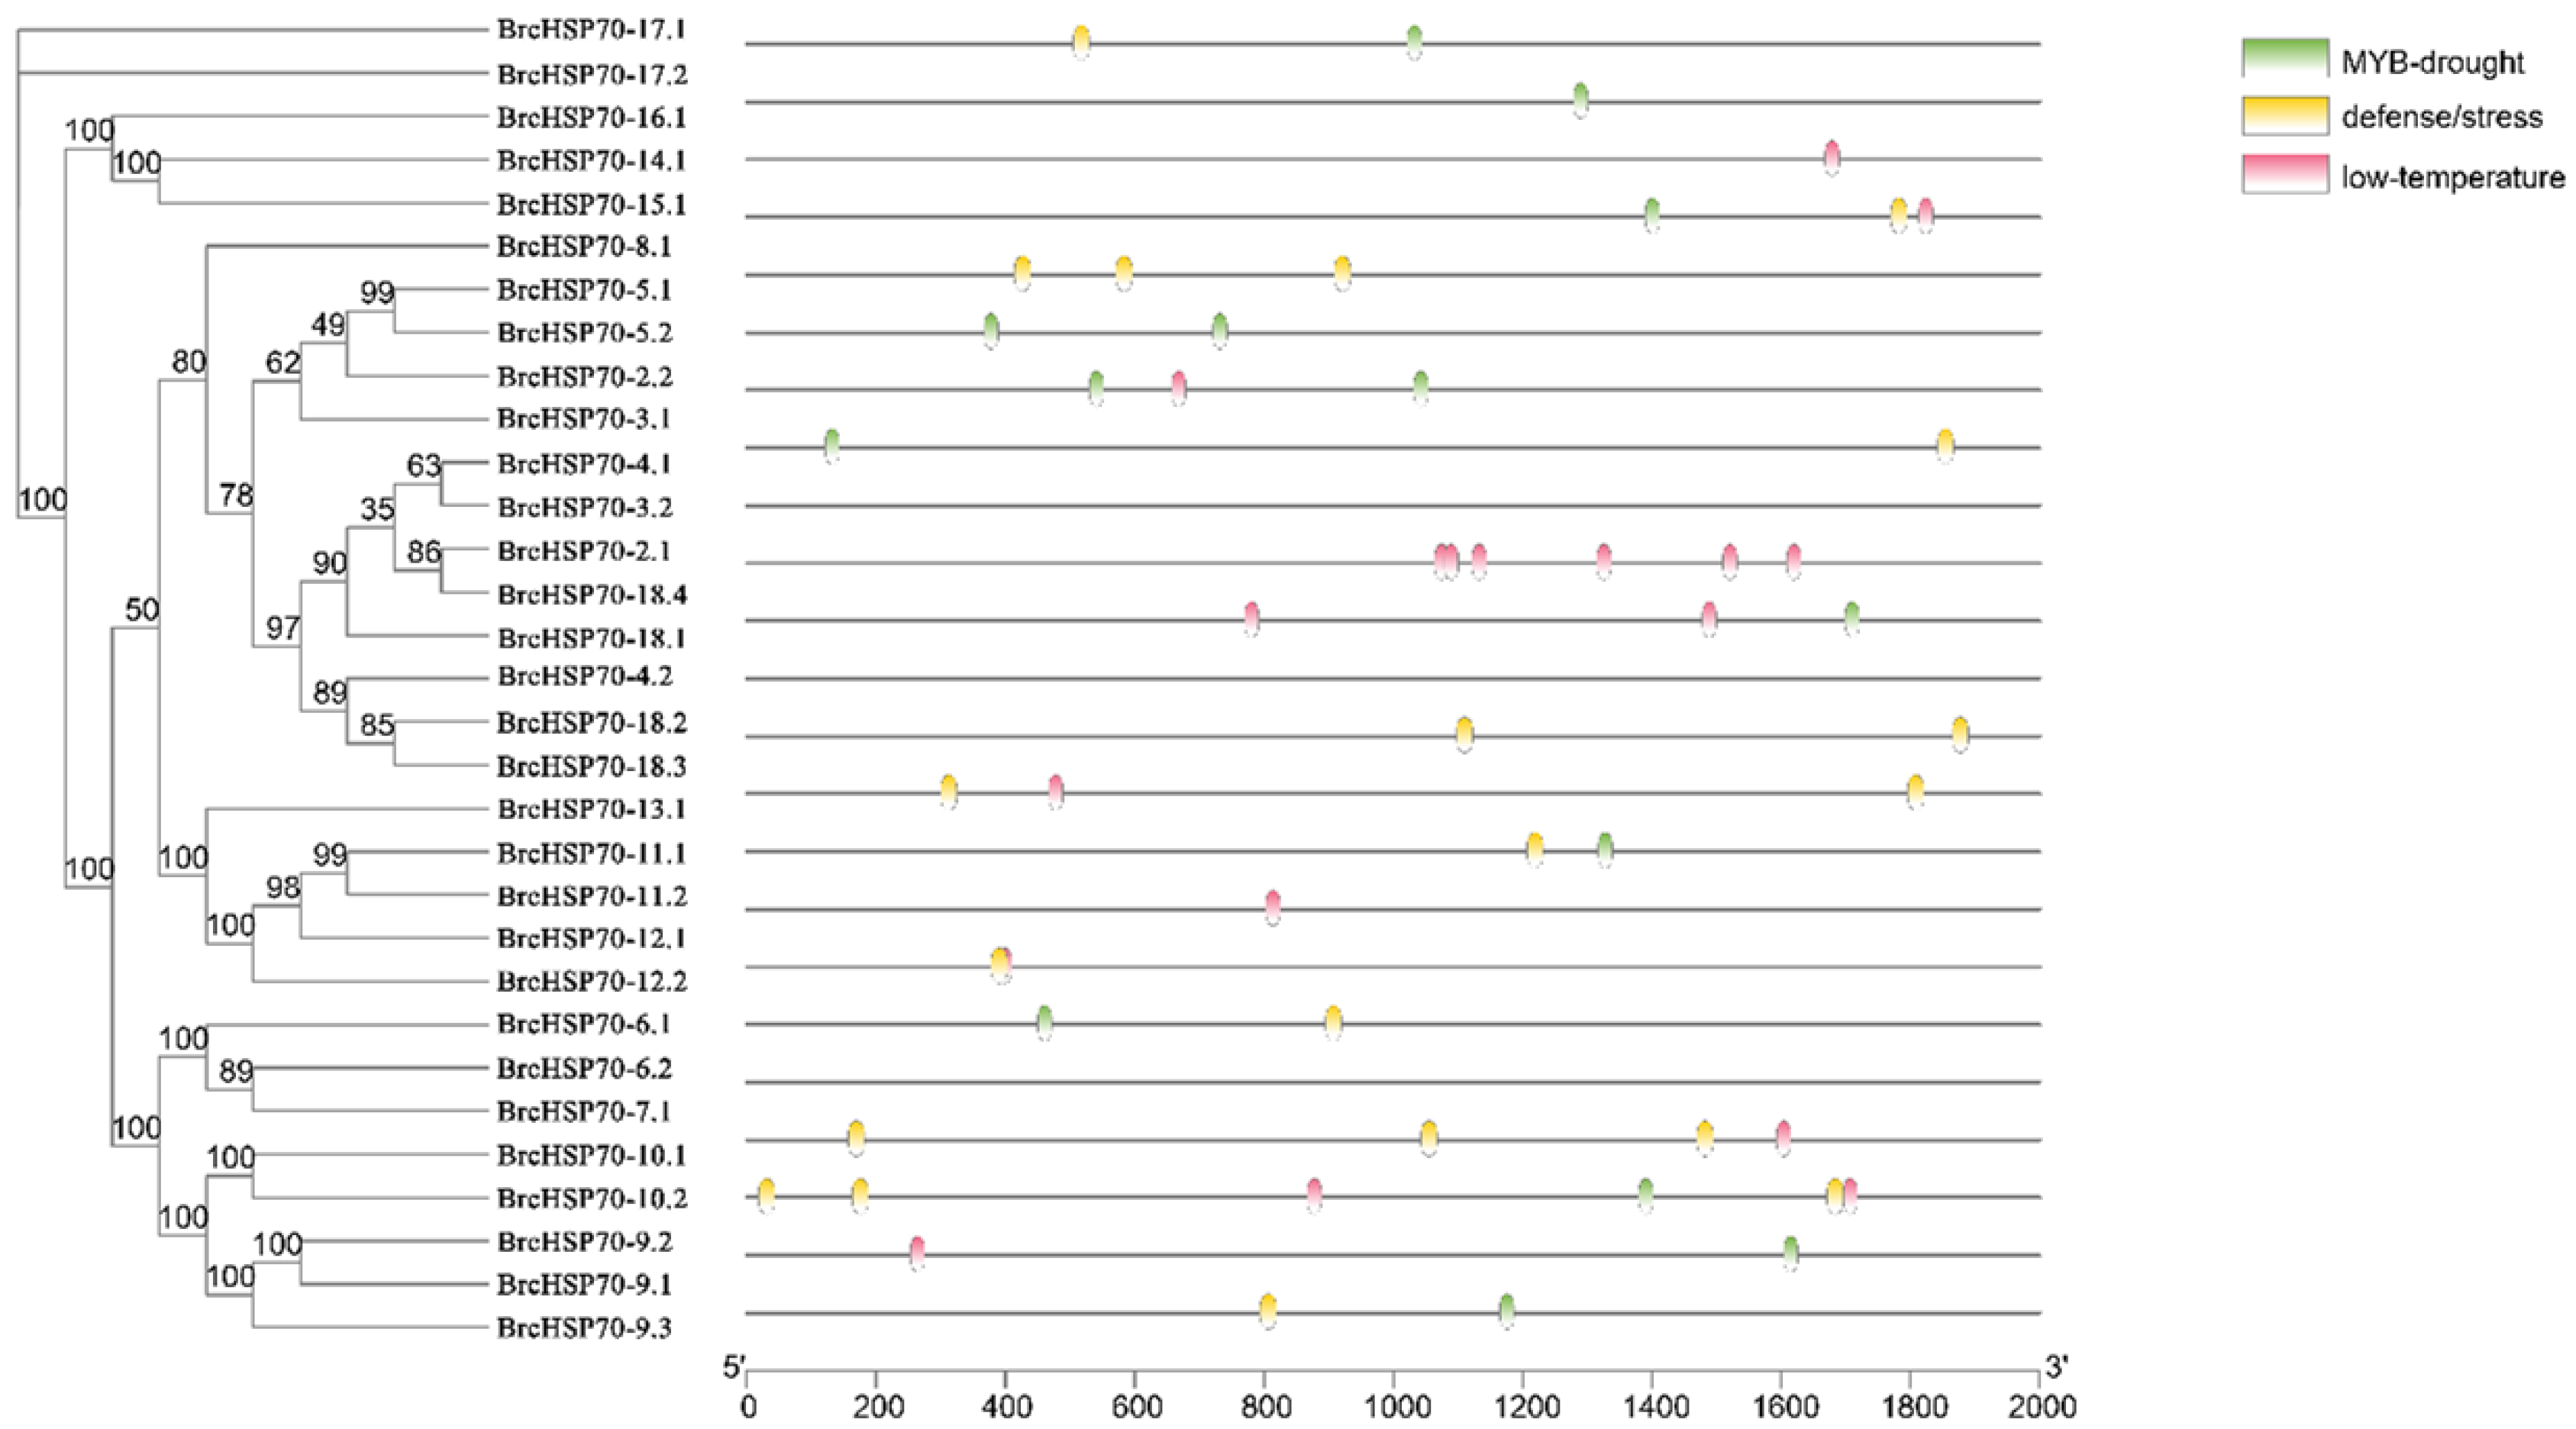
Stress-related cis-elements were also prevalent. We identified elements associated with anaerobic induction, cold responsiveness, desiccation tolerance, immunity, and MYB-binding sites. Furthermore, we found a significant presence of the meristem expression element (CAT-box), which is involved in plant growth and development.
Therefore, these cis-regulatory elements suggest that the BrcHSP70 genes are regulated by diverse environmental, hormonal, and developmental signals.

3.6. Expression Profile of the BrcHSP70 Gene Family

To investigate the expression profile of the BrcHSP70 gene family under heat stress, we analyzed existing transcriptome data (NCBI BioProject: PRJNA1030162) for two NHCC varieties (heat-resistant variety ‘SHI’ and heat-sensitive variety ‘Aijiaohuang’). Samples were collected after 6 and 24 h of exposure to 38 °C.
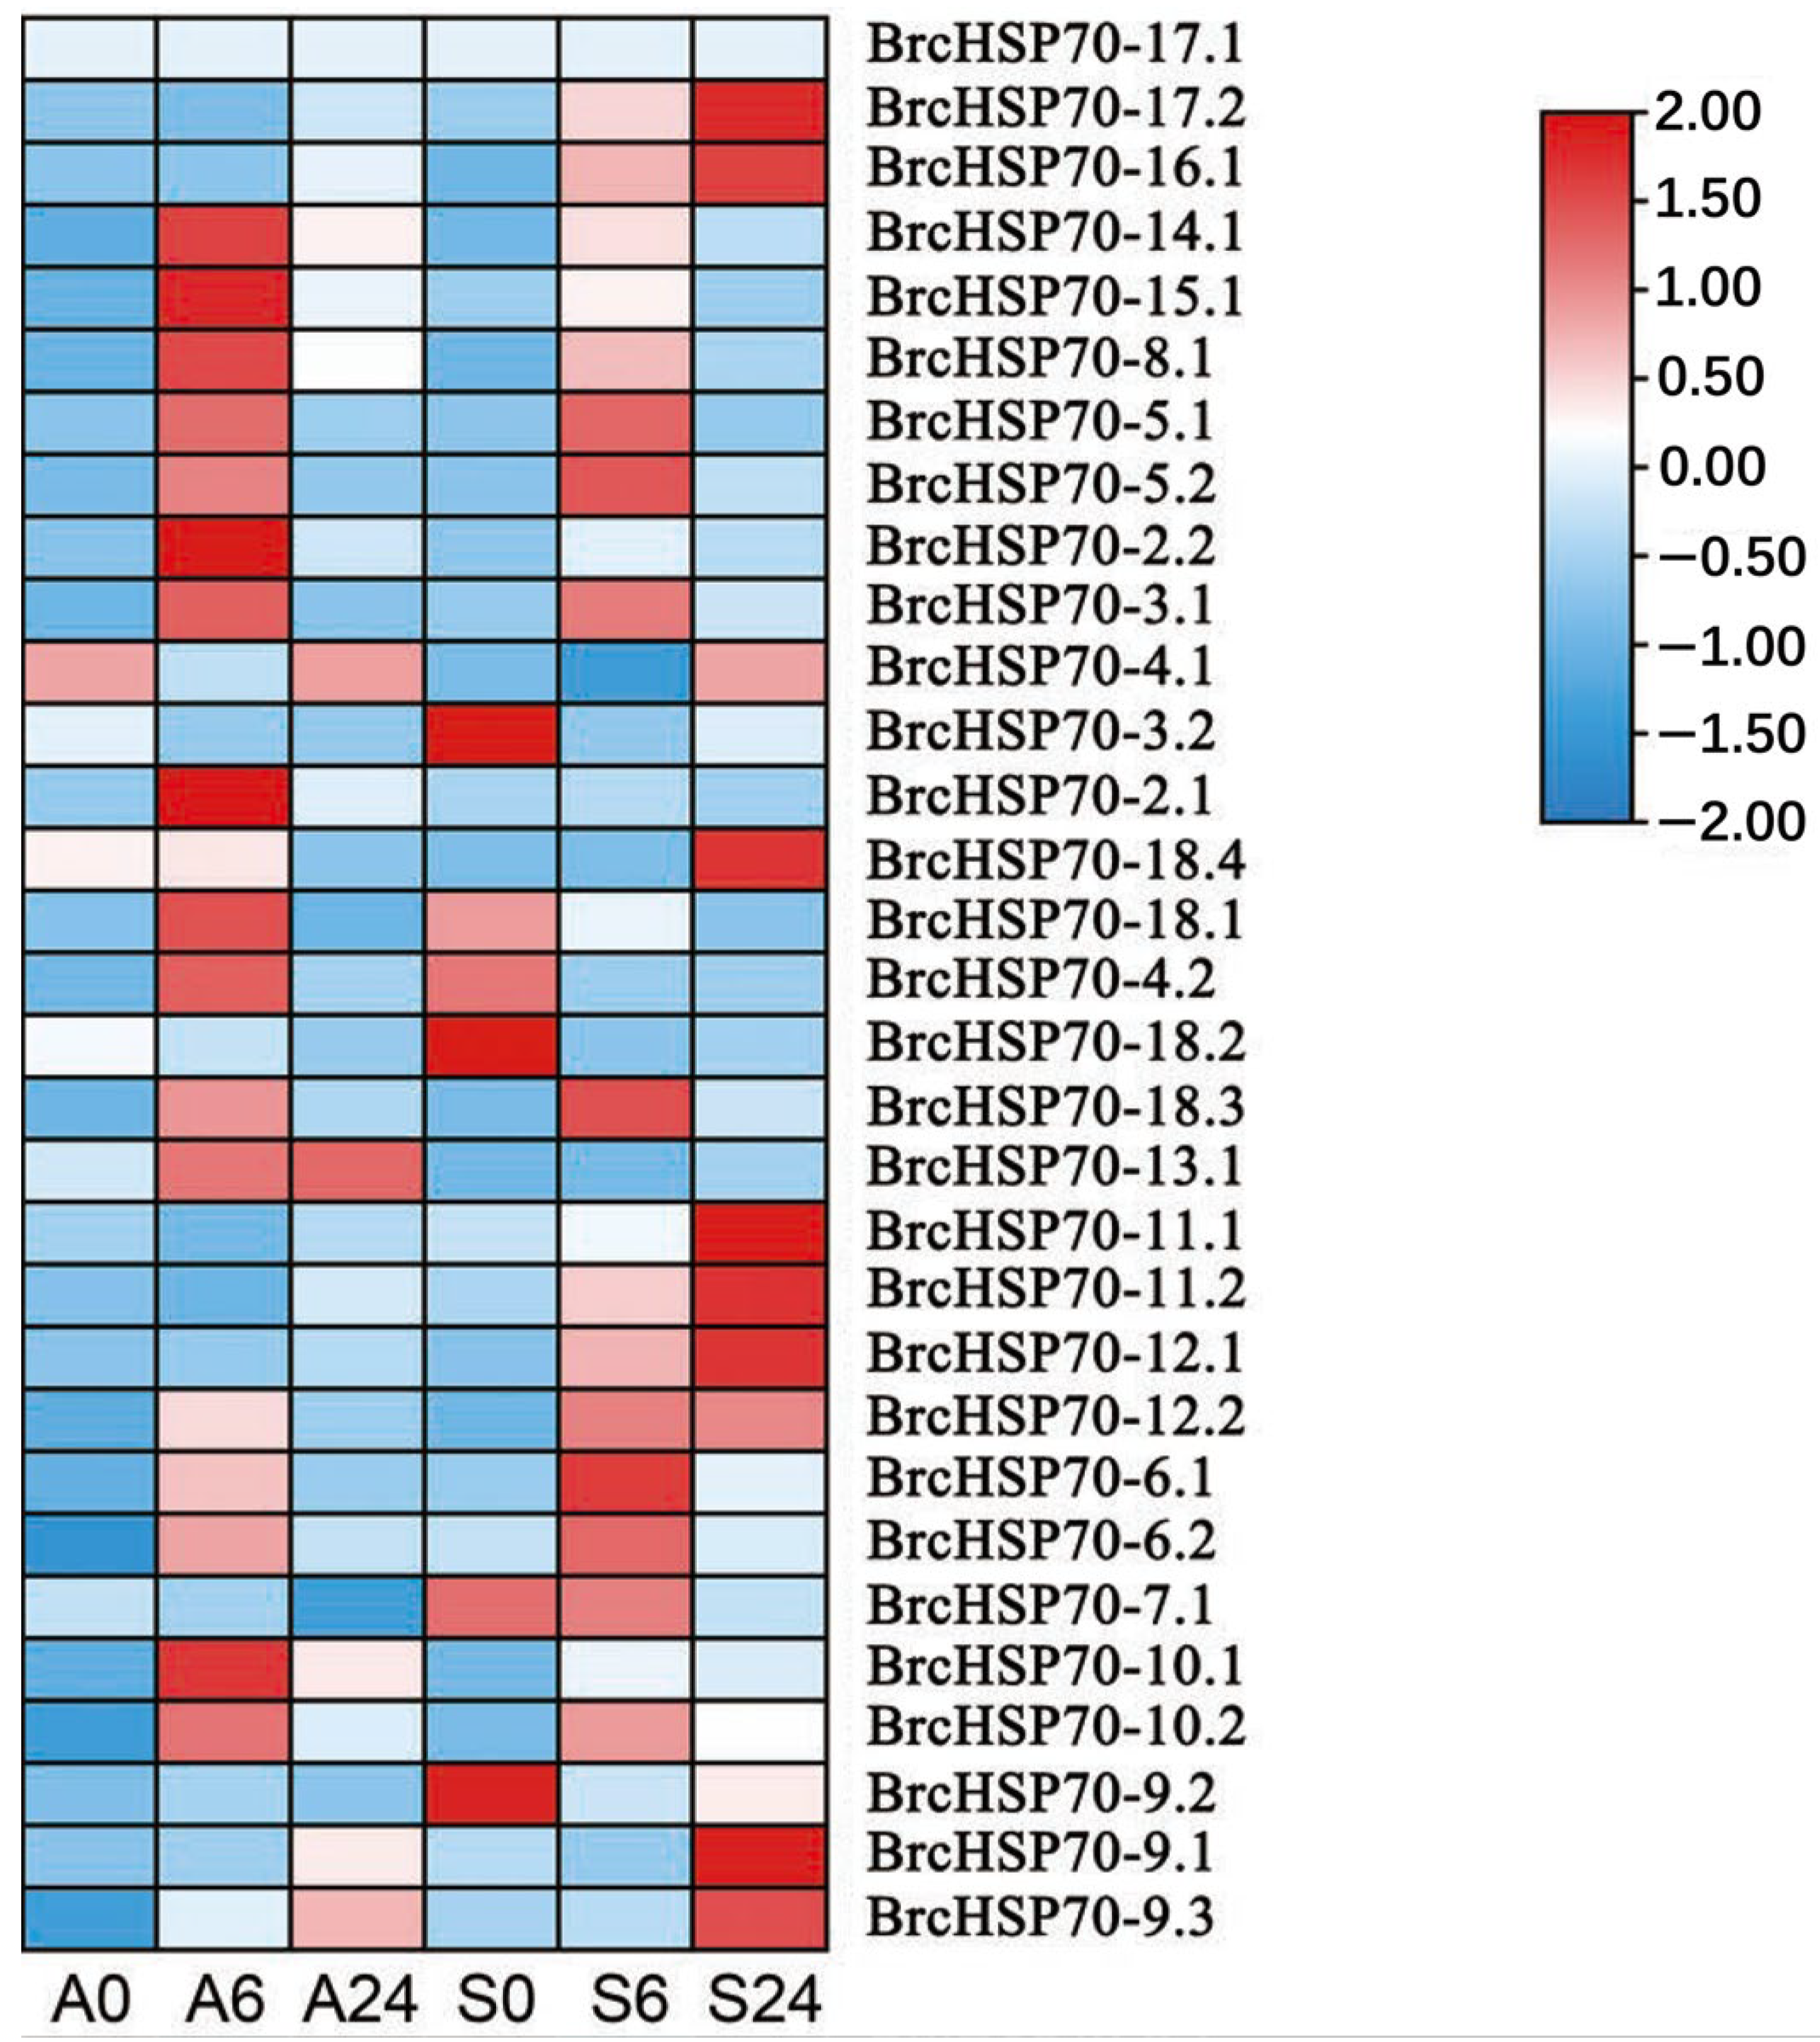
Under standard growth conditions, the transcript levels of most BrcHSP70 genes in ‘Aijiaohuang’ were low, whereas six genes of this family (such as BrcHSP70-3.2, BrcHSP70-9.2, and BrcHSP70-18.2) showed relatively high expression in ‘SHI’ (Figure 9). However, following exposure to 38 °C thermal stress, the transcription levels of most genes increased to varying degrees. Notably, in the ‘SHI’ variety, most of the genes upregulated after 6 h of heat stress were from Groups 1–3, while those upregulated after 24 h predominantly belonged to Group 4. In contrast, in the ‘Aijiaohuang’ variety, most genes in Group 1 and Group 5 showed an upward trend at 6 h, followed by a downward trend at 24 h. In general, in ‘Aijiaohuang’, most genes were more readily upregulated at 6 h, but downregulated at 24 h. In contrast, in ‘SHI’, the upregulation of most genes seemed to occur more slowly, and these genes remained upregulated at 24 h. This sustained upregulation in the tolerant ‘SHI’ genotype is likely crucial for its ability to adapt to long-lasting heat waves. The fold changes and q-values for each gene at 0, 6, and 24 h for ‘Aijiaohuang’ and ‘SHI’ are shown in Table S1.
Specifically, the transcription levels of BrcHSP70-11.1, 11.2, 12.1, 16.1, and 18.4 decreased with prolonged heat stress in “Aijiaohuang” but significantly increased in ‘SHI’. This indicates that these candidate genes could be key to the heat shock adaptive response of NHCC. Among these, BrcHSP70-11.1, 11.2, and 12.1 belong to the subgroup of Group 4. These genes exhibited a strong homology within their evolutionary branches and displayed similar expression trends, indicating they may be functionally redundant.
To further validate the robustness of the transcriptome-derived expression profiles, we selected nine key BrcHSP70 genes for a qPCR experiment (Figure 10). Our findings revealed that the expression patterns of these nine genes were in strong agreement with the RNA-Seq data. Under basal conditions, the transcript abundance of these genes was low. However, after the 38 °C thermal treatment, their transcriptional levels increased significantly.

4. Discussion

HSP70s are versatile molecular chaperones, crucial for maintaining protein homeostasis across various physiological and stress conditions [53,54]. The functional repertoire of these 70 kDa chaperones is extensive, including protein conformation, oligomerization, transport, and proteolysis [55,56]. Additionally, in response to stress, HSP70 proteins are implicated in programmed cell death (PCD). For example, HSP70s can block the telomerase activation signal transduction pathway, which promotes apoptosis.
This gene family performs an essential function in plant ontogeny and has undergone extensive investigation in many model organisms, including A. thaliana, common bean, pumpkin, Vigna radiata, and rice [57,58,59,60]. Although this family has been analyzed in HCC, comprehensive studies in the closely related NHCC subspecies remain scarce. Therefore, we conducted a detailed investigation of this gene family by applying multiple bioinformatics approaches to assess its possible function in heat stress response.
Altogether, 31 HSP70 genes were detected in NHCC, compared to 32 in rice, 28 in HCC, and 21 in pumpkin [30,31,58]. Our study identified 30 HSP70 genes in HCC, compared to 28 reported previously. Such a discrepancy is common in genome-wide analyses and is typically attributable to different analytical methods or genome versions. The expansion of gene families is a recognized evolutionary trend in plants. For instance, studies have shown that 80% of members within gene families in Arabidopsis have increased over time, suggesting that gene families have generally expanded [61]. The count of HSP70 genes within the NHCC was comparable to that observed in the closely related HCC. The NHCC HSP70 gene family comprises 31 members, including 26 DnaK genes and 5 HSP110/SSE genes. In contrast, Arabidopsis has been reported to possess only 14 DnaK and 4 HSP110 genes in [53]. These findings indicate a substantial expansion of the HSP70 gene family within NHCC, leading to nearly twice the count of DnaK gene copies as found in Arabidopsis. This considerable expansion may be linked to specific adaptation needs or the greater complexity of the NHCC genome.
Previous studies have established that HSP70 genes with close evolutionary relationships are typically localized to the same subcellular region and exhibit similar functions [62]. Our findings corroborate this principle. We observed significantly greater similarities in the motifs, intron/exon counts, and subcellular localizations among the closely related subfamilies. For example, the genes within Group 2 (BrcHSP70-6.1, BrcHSP70-6.2, and BrcHSP70-7.1) were all localized to the chloroplast, displayed a consistent distribution of motifs, and shared an identical gene structure of eight exons and seven introns. Our findings strongly indicate that genes clustered within a common cluster in the phylogenetic tree are likely to share similar functional roles.
Gene duplication is a critical phenomenon [63,64] and serves as the principal impetus for gene family expansion through tandem and segmental events [65]. Notably, gene duplication is classified into a segmental category if the gene pairs reside on separate chromosomes, whereas tandem duplication involves pairs situated on the same chromosome [66].
Further investigation revealed that segmental duplication (SD), not tandem duplication (TD), was the primary driver of the BrcHSP70 gene’s expansion, with all eight identified gene pairs resulting from this mechanism. This conclusion is supported by other researchers who found that all duplicated HSP70s in HCC were also segmentally duplicated. Moreover, previous reports have indicated that SD has a more substantial role than TD in the growth of the HSP family, which is consistent with our findings [58].
In summary, this analysis provides insight into the specific mechanisms expanding the BrcHSP70 gene family. The prevalence of segmental duplications demonstrates their importance for generating genetic diversity and new functional capabilities within the HSP70 gene lineage.
The BrcHSP70 promoter regions contain a high density of cis-acting regulatory elements related to diverse functions, including development, light response, and stress/hormone signaling, the latter of which was particularly abundant. Among these, elements responsive to ABA and drought exhibited the highest frequency, with 42 and 18 components, respectively.
The abundance of these motifs is significant because stress tolerance is mediated by transcription factors (TFs), like MYB, and hormones, like ABA, that bind to these specific promoter sites [67,68,69,70]. Our findings are consistent with reports showing that MYB-binding sites enhance drought resistance in wheat and that the ABA-responsive element (ABRE) is crucial for stress signaling in Arabidopsis [71]. In summary, this promoter analysis provides molecular insight into how BrcHSP70 expression is modulated by water deficit. Identifying these regulatory motifs elucidates the genetic basis of the adaptive responses of NHCC to drought. It is worth noting that drought and heat stress often co-occur in nature, which likely explains the versatility of the BrcHSP70 promoters in responding to both types of abiotic stress. The varied abundance of HSEs (1–9 copies), the binding sites for heat shock factors (HSFs), is functionally critical and provides a mechanism for differential gene induction under heat stress. This regulatory architecture could explain the more robust and sustained upregulation of key BrcHSP70 genes observed in the heat-tolerant ‘SHI’ cultivar, offering a molecular basis for its enhanced thermotolerance.
To explore the role of BrcHSP70s under heat stress, we analyzed their gene expression in the leaves of two B. rapa ssp. chinensis varieties with contrasting heat tolerance. While most BrcHSP70 genes were upregulated by heat in both varieties, their expression patterns differed significantly. Notably, five specific genes (BrcHSP70-11.1, 11.2, 12.1, 16.1, and 18.4) demonstrated upregulation in the heat-tolerant ‘SHI’ variety, whereas they were downregulated in the heat-sensitive ‘Aijiaohuang’ variety. This differential expression strongly suggests these five genes are crucial for mediating the heat stress response in B. rapa ssp. chinensis.
Overall, this research provides a genetic characterization and expression analysis that helps unravel the regulatory mechanisms of plant HSP70s under thermal stress.

5. Conclusions

Our research represents the first genome-wide identification, evolutionary analysis, and transcriptional profiling of the HSP70 gene family within NHCC. We identified 31 BrcHSP70 genes that exhibit diversity in their physicochemical properties and subcellular localization, which can be classified into five subgroups. Phylogenetic and collinearity analyses revealed a closer evolutionary relationship with HCC and showed that the family’s expansion was primarily driven by segmental duplication rather than by tandem duplication. Furthermore, analysis of the promoter regions identified 52 types of cis-acting elements, many of which are associated with light response, hormones (especially ABA), and abiotic stress responses. Most significantly, expression analysis under heat stress revealed markedly different expression patterns between the thermo-resistant ‘SHI’ and thermo-sensitive ‘Aijiaohuang’ varieties. This distinction allowed for the identification of key candidate genes linked to heat tolerance.

Supplementary Materials

The following supporting information can be downloaded at: https://www.mdpi.com/article/10.3390/horticulturae11080938/s1, Figure S1: Synteny relationships of HSP70 genes among NHCC, HCC, and A. thaliana; Table S1: q-PCR primer sequences utilized in this study; Table S2: Differential expression of BrcHSP70 gene family members; Table S3: Relative expression levels of BrHSP70 Genes in different Chinese cabbage cultivars as determined by qRT-PCR.

Author Contributions

Conceptualization, X.K.; methodology, B.Z.; software, J.J.; validation, S.Z.; formal analysis, C.D.; investigation, Y.X.; resources, J.J.; data curation, B.Z.; writing—original draft preparation, B.Z. and J.J.; writing—review and editing, X.K.; supervision, X.K.; project administration, X.K.; funding acquisition, B.Z. All authors have read and agreed to the published version of the manuscript.

Funding

This research was funded by the Science and Technological Project of Wuhu, grant number 2023yf077, the 2024 Annual Open Research Topics of Anhui Provincial Rural Revitalization Collaborative Technical Service Center, China (Grant No. KF202402), and the 2024 Open Fund Projects of National-Local Joint Engineering Laboratory for Crop Stress Resistance Breeding and Disaster Mitigation (Grant No. NELCOF20240103).

Data Availability Statement

All data supporting the findings of this study are available. The sequence data were sourced from public genome resources. The RNA-seq dataset analyzed during the current study is available in the NCBI Sequence Read Archive (SRA) repository under accession number PRJNA1030162. All new quantitative RT-PCR results generated during this study are presented within the article and its Supplementary Materials (Table S3).

Acknowledgments

The authors thank the two anonymous reviewers for their valuable comments and suggestions.

Conflicts of Interest

The authors declare no conflicts of interest.

References

  1. Ohama, N.; Sato, H.; Shinozaki, K.; Yamaguchi-Shinozaki, K. Transcriptional Regulatory Network of Plant Heat Stress Response. Trends Plant Sci. 2017, 22, 53–65. [Google Scholar] [CrossRef]
  2. Chai, W.; Peng, X.; Liu, B.; Wang, J.; Zhu, Z.; Liu, Y.; Zhao, K.; Cheng, B.; Si, W.; Jiang, H. Comparative Genomics, Whole-Genome Re-sequencing and Expression Profile Analysis of Nucleobase:Cation Symporter 2 (NCS2) Genes in Maize. Front. Plant Sci. 2018, 9, 856. [Google Scholar] [CrossRef] [PubMed]
  3. Zhao, J.; Lu, Z.; Wang, L.; Jin, B. Plant Responses to Heat Stress: Physiology, Transcription, Noncoding RNAs, and Epigenetics. Int. J. Mol. Sci. 2020, 22, 117. [Google Scholar] [CrossRef] [PubMed]
  4. Nakashima, K.; Yamaguchi-Shinozaki, K.; Shinozaki, K. The transcriptional regulatory network in the drought response and its crosstalk in abiotic stress responses including drought, cold, and heat. Front. Plant Sci. 2014, 5, 170. [Google Scholar] [CrossRef] [PubMed]
  5. Kai, H.; Hirashima, K.; Matsuda, O.; Ikegami, H.; Winkelmann, T.; Nakahara, T.; Iba, K. Thermotolerant cyclamen with reduced acrolein and methyl vinyl ketone. J. Exp. Bot. 2012, 63, 4143–4150. [Google Scholar] [CrossRef]
  6. Sakata, T.; Oshino, T.; Miura, S.; Tomabechi, M.; Tsunaga, Y.; Higashitani, N.; Miyazawa, Y.; Takahashi, H.; Watanabe, M.; Higashitani, A. Auxins reverse plant male sterility caused by high temperatures. Proc. Natl. Acad. Sci. USA 2010, 107, 8569–8574. [Google Scholar] [CrossRef]
  7. Lippmann, R.; Babben, S.; Menger, A.; Delker, C.; Quint, M. Development of Wild and Cultivated Plants under Global Warming Conditions. Curr. Biol. 2019, 29, R1326–R1338. [Google Scholar] [CrossRef]
  8. Liu, J.; Zhang, R.; Xu, X.; Fowler, J.C.; Miller, T.E.X.; Dong, T. Effect of summer warming on growth, photosynthesis and water status in female and male Populus cathayana: Implications for sex-specific drought and heat tolerances. Tree Physiol. 2020, 40, 1178–1191. [Google Scholar] [CrossRef]
  9. Wahid, A.; Gelani, S.; Ashraf, M.; Foolad, M.R. Heat tolerance in plants: An overview. Environ. Exp. Bot. 2007, 61, 199–223. [Google Scholar] [CrossRef]
  10. Garbuz, D.G. Regulation of heat shock gene expression in response to stress. Mol. Biol. 2017, 51, 400–417. [Google Scholar] [CrossRef]
  11. Yan, H.; Zhang, A.; Chen, J.; He, X.; Xu, B.; Xie, G.; Miao, Z.; Zhang, X.; Huang, L. Genome-Wide Analysis of the PvHsp20 Family in Switchgrass: Motif, Genomic Organization, and Identification of Stress or Developmental-Related Hsp20s. Front. Plant Sci. 2017, 8, 1024. [Google Scholar] [CrossRef]
  12. Guihur, A.; Rebeaud, M.E.; Bourgine, B.; Goloubinoff, P. How do humans and plants feel the heat? Trends Plant Sci. 2022, 27, 630–632. [Google Scholar] [CrossRef] [PubMed]
  13. Guihur, A.; Rebeaud, M.E.; Goloubinoff, P. How do plants feel the heat and survive? Trends Biochem. Sci. 2022, 47, 824–838. [Google Scholar] [CrossRef] [PubMed]
  14. Mitsugi, R.; Itoh, T.; Fujiwara, R. Expression of Human DNAJ (Heat Shock Protein-40) B3 in Humanized UDP-glucuronosyltransferase 1 Mice. Int. J. Mol. Sci. 2015, 16, 14997–15008. [Google Scholar] [CrossRef] [PubMed]
  15. Xiong, L.; Zhu, J.K. Molecular and genetic aspects of plant responses to osmotic stress. Plant Cell Environ. 2002, 25, 131–139. [Google Scholar] [CrossRef]
  16. Yang, J.; Ding, H.; Kan, X. Codon usage patterns and evolution of HSP60 in birds. Int. J. Biol. Macromol. 2021, 183, 1002–1012. [Google Scholar] [CrossRef]
  17. Hu, C.; Yang, J.; Qi, Z.; Wu, H.; Wang, B.; Zou, F.; Mei, H.; Liu, J.; Wang, W.; Liu, Q. Heat shock proteins: Biological functions, pathological roles, and therapeutic opportunities. MedComm 2022, 3, e161. [Google Scholar] [CrossRef]
  18. Wang, L.; Liu, F.; Ju, L.; Xue, B.; Wang, Y.; Wang, D.; Hou, D. Genome Structures and Evolution Analysis of Hsp90 Gene Family in Brassica napus Reveal the Possible Roles of Members in Response to Salt Stress and the Infection of Sclerotinia sclerotiorum. Front. Plant Sci. 2022, 13, 854034. [Google Scholar] [CrossRef]
  19. Song, Z.; Pan, F.; Lou, X.; Wang, D.; Yang, C.; Zhang, B.; Zhang, H. Genome-wide identification and characterization of Hsp70 gene family in Nicotiana tabacum. Mol. Biol. Rep. 2019, 46, 1941–1954. [Google Scholar] [CrossRef]
  20. Mayer, M.P.; Bukau, B. Hsp70 chaperones: Cellular functions and molecular mechanism. Cell Mol. Life Sci. 2005, 62, 670–684. [Google Scholar] [CrossRef]
  21. Chappell, T.G.; Konforti, B.B.; Schmid, S.L.; Rothman, J.E. The ATPase core of a clathrin uncoating protein. J. Biol. Chem. 1987, 262, 746–751. [Google Scholar] [CrossRef]
  22. Flynn, G.C.; Chappell, T.G.; Rothman, J.E. Peptide binding and release by proteins implicated as catalysts of protein assembly. Science 1989, 245, 385–390. [Google Scholar] [CrossRef]
  23. Guo, M.; Xu, L.; Long, Y.; Huang, F.; Liu, T.; Li, Y.; Hou, X. BcHTT4 Inhibits Branching of Non-Heading Chinese Cabbage at the Vegetative Stage. Plants 2021, 10, 510. [Google Scholar] [CrossRef] [PubMed]
  24. Li, Y.; Liu, G.F.; Ma, L.M.; Liu, T.K.; Zhang, C.W.; Xiao, D.; Zheng, H.K.; Chen, F.; Hou, X.L. A chromosome-level reference genome of non-heading Chinese cabbage [Brassica campestris (syn. Brassica rapa) ssp. chinensis]. Hortic. Res. 2020, 7, 212. [Google Scholar] [CrossRef] [PubMed]
  25. Li, Z.; Li, Y.; Liu, T.; Zhang, C.; Xiao, D.; Hou, X. Non-Heading Chinese Cabbage Database: An Open-Access Platform for the Genomics of Brassica campestris (syn. Brassica rapa) ssp. chinensis. Plants 2022, 11, 5. [Google Scholar] [CrossRef]
  26. Ye, Y.; Ding, H.; Bi, D.; Ge, W.; Yang, J.; Han, S.; Zhang, S.; Liu, Y.; Kan, X. The ABC1K gene family in Chinese cabbage: Phylogeny, structure and function. Genet. Resour. Crop Evol. 2024, 71, 4647–4667. [Google Scholar] [CrossRef]
  27. Song, X.; Liu, G.; Huang, Z.; Duan, W.; Tan, H.; Li, Y.; Hou, X. Temperature expression patterns of genes and their coexpression with LncRNAs revealed by RNA-Seq in non-heading Chinese cabbage. BMC Genom. 2016, 17, 297. [Google Scholar] [CrossRef]
  28. Valdés-López, O.; Batek, J.; Gomez-Hernandez, N.; Nguyen, C.T.; Isidra-Arellano, M.C.; Zhang, N.; Joshi, T.; Xu, D.; Hixson, K.K.; Weitz, K.K.; et al. Soybean Roots Grown under Heat Stress Show Global Changes in Their Transcriptional and Proteomic Profiles. Front. Plant Sci. 2016, 7, 517. [Google Scholar] [CrossRef]
  29. Sung, D.Y.; Vierling, E.; Guy, C.L. Comprehensive expression profile analysis of the Arabidopsis Hsp70 gene family. Plant Physiol. 2001, 126, 789–800. [Google Scholar] [CrossRef]
  30. Sarkar, N.K.; Kundnani, P.; Grover, A. Functional analysis of Hsp70 superfamily proteins of rice (Oryza sativa). Cell Stress Chaperones 2013, 18, 427–437. [Google Scholar] [CrossRef]
  31. Tabusam, J.; Shi, Q.; Feng, D.; Zulfiqar, S.; Shen, S.; Ma, W.; Zhao, J. HSP70 Gene Family in Brassica rapa: Genome-Wide Identification, Characterization, and Expression Patterns in Response to Heat and Cold Stress. Cells 2022, 11, 2316. [Google Scholar] [CrossRef] [PubMed]
  32. Mistry, J.; Chuguransky, S.; Williams, L.; Qureshi, M.; Salazar, G.A.; Sonnhammer, E.L.L.; Tosatto, S.C.E.; Paladin, L.; Raj, S.; Richardson, L.J.; et al. Pfam: The protein families database in 2021. Nucleic Acids Res. 2021, 49, D412–D419. [Google Scholar] [CrossRef]
  33. Eddy, S.R. Accelerated Profile HMM Searches. PLoS Comput. Biol. 2011, 7, e1002195. [Google Scholar] [CrossRef] [PubMed]
  34. Finn, R.D.; Clements, J.; Eddy, S.R. HMMER web server: Interactive sequence similarity searching. Nucleic Acids Res. 2011, 39, W29–W37. [Google Scholar] [CrossRef] [PubMed]
  35. Lu, S.; Wang, J.; Chitsaz, F.; Derbyshire, M.K.; Geer, R.C.; Gonzales, N.R.; Gwadz, M.; Hurwitz, D.I.; Marchler, G.H.; Song, J.S. CDD/SPARCLE: The conserved domain database in 2020. Nucleic Acids Res. 2020, 48, D265–D268. [Google Scholar] [CrossRef]
  36. Wilkins, M.R.; Gasteiger, E.; Bairoch, A.; Sanchez, J.C.; Williams, K.L.; Appel, R.D.; Hochstrasser, D.F. Protein identification and analysis tools in the ExPASy server. Methods Mol. Biol. 1999, 112, 531–552. [Google Scholar] [CrossRef]
  37. Jones, T.S.; Oliveira, S.M.D.; Myers, C.J.; Voigt, C.A.; Densmore, D. Genetic circuit design automation with Cello 2.0. Nat. Protoc. 2022, 17, 1097–1113. [Google Scholar] [CrossRef]
  38. Chen, H.; Wang, T.; He, X.; Cai, X.; Lin, R.; Liang, J.; Wu, J.; King, G.; Wang, X. BRAD V3.0: An upgraded Brassicaceae database. Nucleic Acids Res. 2021, 50, D1432–D1441. [Google Scholar] [CrossRef]
  39. Zhang, D.; Gao, F.; Jakovlić, I.; Zou, H.; Zhang, J.; Li, W.X.; Wang, G.T. PhyloSuite: An integrated and scalable desktop platform for streamlined molecular sequence data management and evolutionary phylogenetics studies. Mol. Ecol. Resour. 2020, 20, 348–355. [Google Scholar] [CrossRef]
  40. Stamatakis, A. RAxML version 8: A tool for phylogenetic analysis and post-analysis of large phylogenies. Bioinformatics 2014, 30, 1312–1313. [Google Scholar] [CrossRef]
  41. Letunic, I.; Bork, P. Interactive tree of life (iTOL) v3: An online tool for the display and annotation of phylogenetic and other trees. Nucleic Acids Res. 2016, 44, W242–W245. [Google Scholar] [CrossRef]
  42. Hu, B.; Jin, J.; Guo, A.-Y.; Zhang, H.; Luo, J.; Gao, G. GSDS 2.0: An upgraded gene feature visualization server. Bioinformatics 2015, 31, 1296–1297. [Google Scholar] [CrossRef]
  43. Bailey, T.L.; Johnson, J.; Grant, C.E.; Noble, W.S. The MEME Suite. Nucleic Acids Res. 2015, 43, W39–W49. [Google Scholar] [CrossRef] [PubMed]
  44. Bailey, T.L.; Boden, M.; Buske, F.A.; Frith, M.; Grant, C.E.; Clementi, L.; Ren, J.; Li, W.W.; Noble, W.S. MEME SUITE: Tools for motif discovery and searching. Nucleic Acids Res. 2009, 37, W202–W208. [Google Scholar] [CrossRef] [PubMed]
  45. Jiangtao, C.; Yingzhen, K.; Qian, W.; Yuhe, S.; Daping, G.; Jing, L.; Guanshan, L. MapGene2Chrom, a tool to draw gene physical map based on Perl and SVG languages. Yi Chuan 2015, 37, 91–97. [Google Scholar] [CrossRef]
  46. Wang, Y.; Tang, H.; Debarry, J.D.; Tan, X.; Li, J.; Wang, X.; Lee, T.H.; Jin, H.; Marler, B.; Guo, H.; et al. MCScanX: A toolkit for detection and evolutionary analysis of gene synteny and collinearity. Nucleic Acids Res. 2012, 40, e49. [Google Scholar] [CrossRef]
  47. Lescot, M.; Déhais, P.; Thijs, G.; Marchal, K.; Moreau, Y.; Van de Peer, Y.; Rouzé, P.; Rombauts, S. PlantCARE, a database of plant cis-acting regulatory elements and a portal to tools for in silico analysis of promoter sequences. Nucleic Acids Res. 2002, 30, 325–327. [Google Scholar] [CrossRef]
  48. Zhang, Z.; Xiao, J.; Wu, J.; Zhang, H.; Liu, G.; Wang, X.; Dai, L. ParaAT: A parallel tool for constructing multiple protein-coding DNA alignments. Biochem. Biophys. Res. Commun. 2012, 419, 779–781. [Google Scholar] [CrossRef]
  49. Posada, D.; Buckley, T.R. Model selection and model averaging in phylogenetics: Advantages of Akaike information criterion and Bayesian approaches over likelihood ratio tests. Syst. Biol. 2004, 53, 793–808. [Google Scholar] [CrossRef]
  50. Wang, D.; Zhang, Y.; Zhang, Z.; Zhu, J.; Yu, J. KaKs_Calculator 2.0: A toolkit incorporating gamma-series methods and sliding window strategies. Genom. Proteom. Bioinform. 2010, 8, 77–80. [Google Scholar] [CrossRef]
  51. Livak, K.J.; Schmittgen, T.D. Analysis of relative gene expression data using real-time quantitative PCR and the 2−ΔΔCT Method. Methods 2001, 25, 402–408. [Google Scholar] [CrossRef] [PubMed]
  52. Liu, W.; Dai, Z.; Jia, J.; Li, X.; Zhu, H.; Kan, X.; Zhu, B. Comparative physiological, transcriptomic, and WGCNA analyses reveal the key genes and regulatory pathways associated with heat stress in non-heading Chinese cabbage. Res. Sq. 2025. preprint. [Google Scholar] [CrossRef]
  53. Lin, B.L.; Wang, J.S.; Liu, H.C.; Chen, R.W.; Meyer, Y.; Barakat, A.; Delseny, M. Genomic analysis of the Hsp70 superfamily in Arabidopsis thaliana. Cell Stress Chaperones 2001, 6, 201–208. [Google Scholar] [CrossRef] [PubMed]
  54. Ye, Q.; Yu, J.; Zhang, Z.; Hou, L.; Liu, X. VvBAP1, a Grape C2 Domain Protein, Plays a Positive Regulatory Role Under Heat Stress. Front. Plant Sci. 2020, 11, 544374. [Google Scholar] [CrossRef]
  55. Reeg, S.; Jung, T.; Castro, J.P.; Davies, K.J.A.; Henze, A.; Grune, T. The molecular chaperone Hsp70 promotes the proteolytic removal of oxidatively damaged proteins by the proteasome. Free Radic. Biol. Med. 2016, 99, 153–166. [Google Scholar] [CrossRef]
  56. Cho, E.K.; Choi, Y.J. A nuclear-localized HSP70 confers thermoprotective activity and drought-stress tolerance on plants. Biotechnol. Lett. 2009, 31, 597–606. [Google Scholar] [CrossRef]
  57. Büyük, İ.; Inal, B.; Ilhan, E.; Tanriseven, M.; Aras, S.; Erayman, M. Genome-wide identification of salinity responsive HSP70s in common bean. Mol. Biol. Rep. 2016, 43, 1251–1266. [Google Scholar] [CrossRef]
  58. Davoudi, M.; Chen, J.; Lou, Q. Genome-Wide Identification and Expression Analysis of Heat Shock Protein 70 (HSP70) Gene Family in Pumpkin (Cucurbita moschata) Rootstock under Drought Stress Suggested the Potential Role of these Chaperones in Stress Tolerance. Int. J. Mol. Sci. 2022, 23, 1918. [Google Scholar] [CrossRef]
  59. Jasrotia, R.S.; Jaiswal, S.; Yadav, P.K.; Raza, M.; Iquebal, M.A.; Rai, A.; Kumar, D. Genome-Wide Analysis of HSP70 Family Protein in Vigna radiata and Coexpression Analysis Under Abiotic and Biotic Stress. J. Comput. Biol. 2020, 27, 738–754. [Google Scholar] [CrossRef]
  60. Jung, K.H.; Gho, H.J.; Nguyen, M.X.; Kim, S.R.; An, G. Genome-wide expression analysis of HSP70 family genes in rice and identification of a cytosolic HSP70 gene highly induced under heat stress. Funct. Integr. Genom. 2013, 13, 391–402. [Google Scholar] [CrossRef]
  61. Lespinet, O.; Wolf, Y.I.; Koonin, E.V.; Aravind, L. The role of lineage-specific gene family expansion in the evolution of eukaryotes. Genome Res. 2002, 12, 1048–1059. [Google Scholar] [CrossRef] [PubMed]
  62. Rehman, A.; Atif, R.M.; Qayyum, A.; Du, X.; Hinze, L.; Azhar, M.T. Genome-wide identification and characterization of HSP70 gene family in four species of cotton. Genomics 2020, 112, 4442–4453. [Google Scholar] [CrossRef] [PubMed]
  63. Freeling, M. Bias in plant gene content following different sorts of duplication: Tandem, whole-genome, segmental, or by transposition. Annu. Rev. Plant. Biol. 2009, 60, 433–453. [Google Scholar] [CrossRef] [PubMed]
  64. Doyle, J.J.; Flagel, L.E.; Paterson, A.H.; Rapp, R.A.; Soltis, D.E.; Soltis, P.S.; Wendel, J.F. Evolutionary genetics of genome merger and doubling in plants. Annu. Rev. Genet. 2008, 42, 443–461. [Google Scholar] [CrossRef]
  65. Zhang, J.B.; Wang, X.P.; Wang, Y.C.; Chen, Y.H.; Luo, J.W.; Li, D.D.; Li, X.B. Genome-wide identification and functional characterization of cotton (Gossypium hirsutum) MAPKKK gene family in response to drought stress. BMC Plant Biol. 2020, 20, 217. [Google Scholar] [CrossRef]
  66. Li, Y.; Chen, X.; Chen, Z.; Cai, R.; Zhang, H.; Xiang, Y. Identification and Expression Analysis of BURP Domain-Containing Genes in Medicago truncatula. Front. Plant Sci. 2016, 7, 485. [Google Scholar] [CrossRef]
  67. Baldoni, E.; Genga, A.; Cominelli, E. Plant MYB Transcription Factors: Their Role in Drought Response Mechanisms. Int. J. Mol. Sci. 2015, 16, 15811–15851. [Google Scholar] [CrossRef]
  68. Yu, Y.; Ni, Z.; Chen, Q.; Qu, Y. The wheat salinity-induced R2R3-MYB transcription factor TaSIM confers salt stress tolerance in Arabidopsis thaliana. Biochem. Biophys. Res. Commun. 2017, 491, 642–648. [Google Scholar] [CrossRef]
  69. Wei, Q.; Luo, Q.; Wang, R.; Zhang, F.; He, Y.; Zhang, Y.; Qiu, D.; Li, K.; Chang, J.; Yang, G.; et al. A Wheat R2R3-type MYB Transcription Factor TaODORANT1 Positively Regulates Drought and Salt Stress Responses in Transgenic Tobacco Plants. Front. Plant Sci. 2017, 8, 1374. [Google Scholar] [CrossRef]
  70. Gao, F.; Zhou, J.; Deng, R.Y.; Zhao, H.X.; Li, C.L.; Chen, H.; Suzuki, T.; Park, S.U.; Wu, Q. Overexpression of a tartary buckwheat R2R3-MYB transcription factor gene, FtMYB9, enhances tolerance to drought and salt stresses in transgenic Arabidopsis. J. Plant Physiol. 2017, 214, 81–90. [Google Scholar] [CrossRef]
  71. Fujita, Y.; Yoshida, T.; Yamaguchi-Shinozaki, K. Pivotal role of the AREB/ABF-SnRK2 pathway in ABRE-mediated transcription in response to osmotic stress in plants. Physiol. Plant 2013, 147, 15–27. [Google Scholar] [CrossRef]
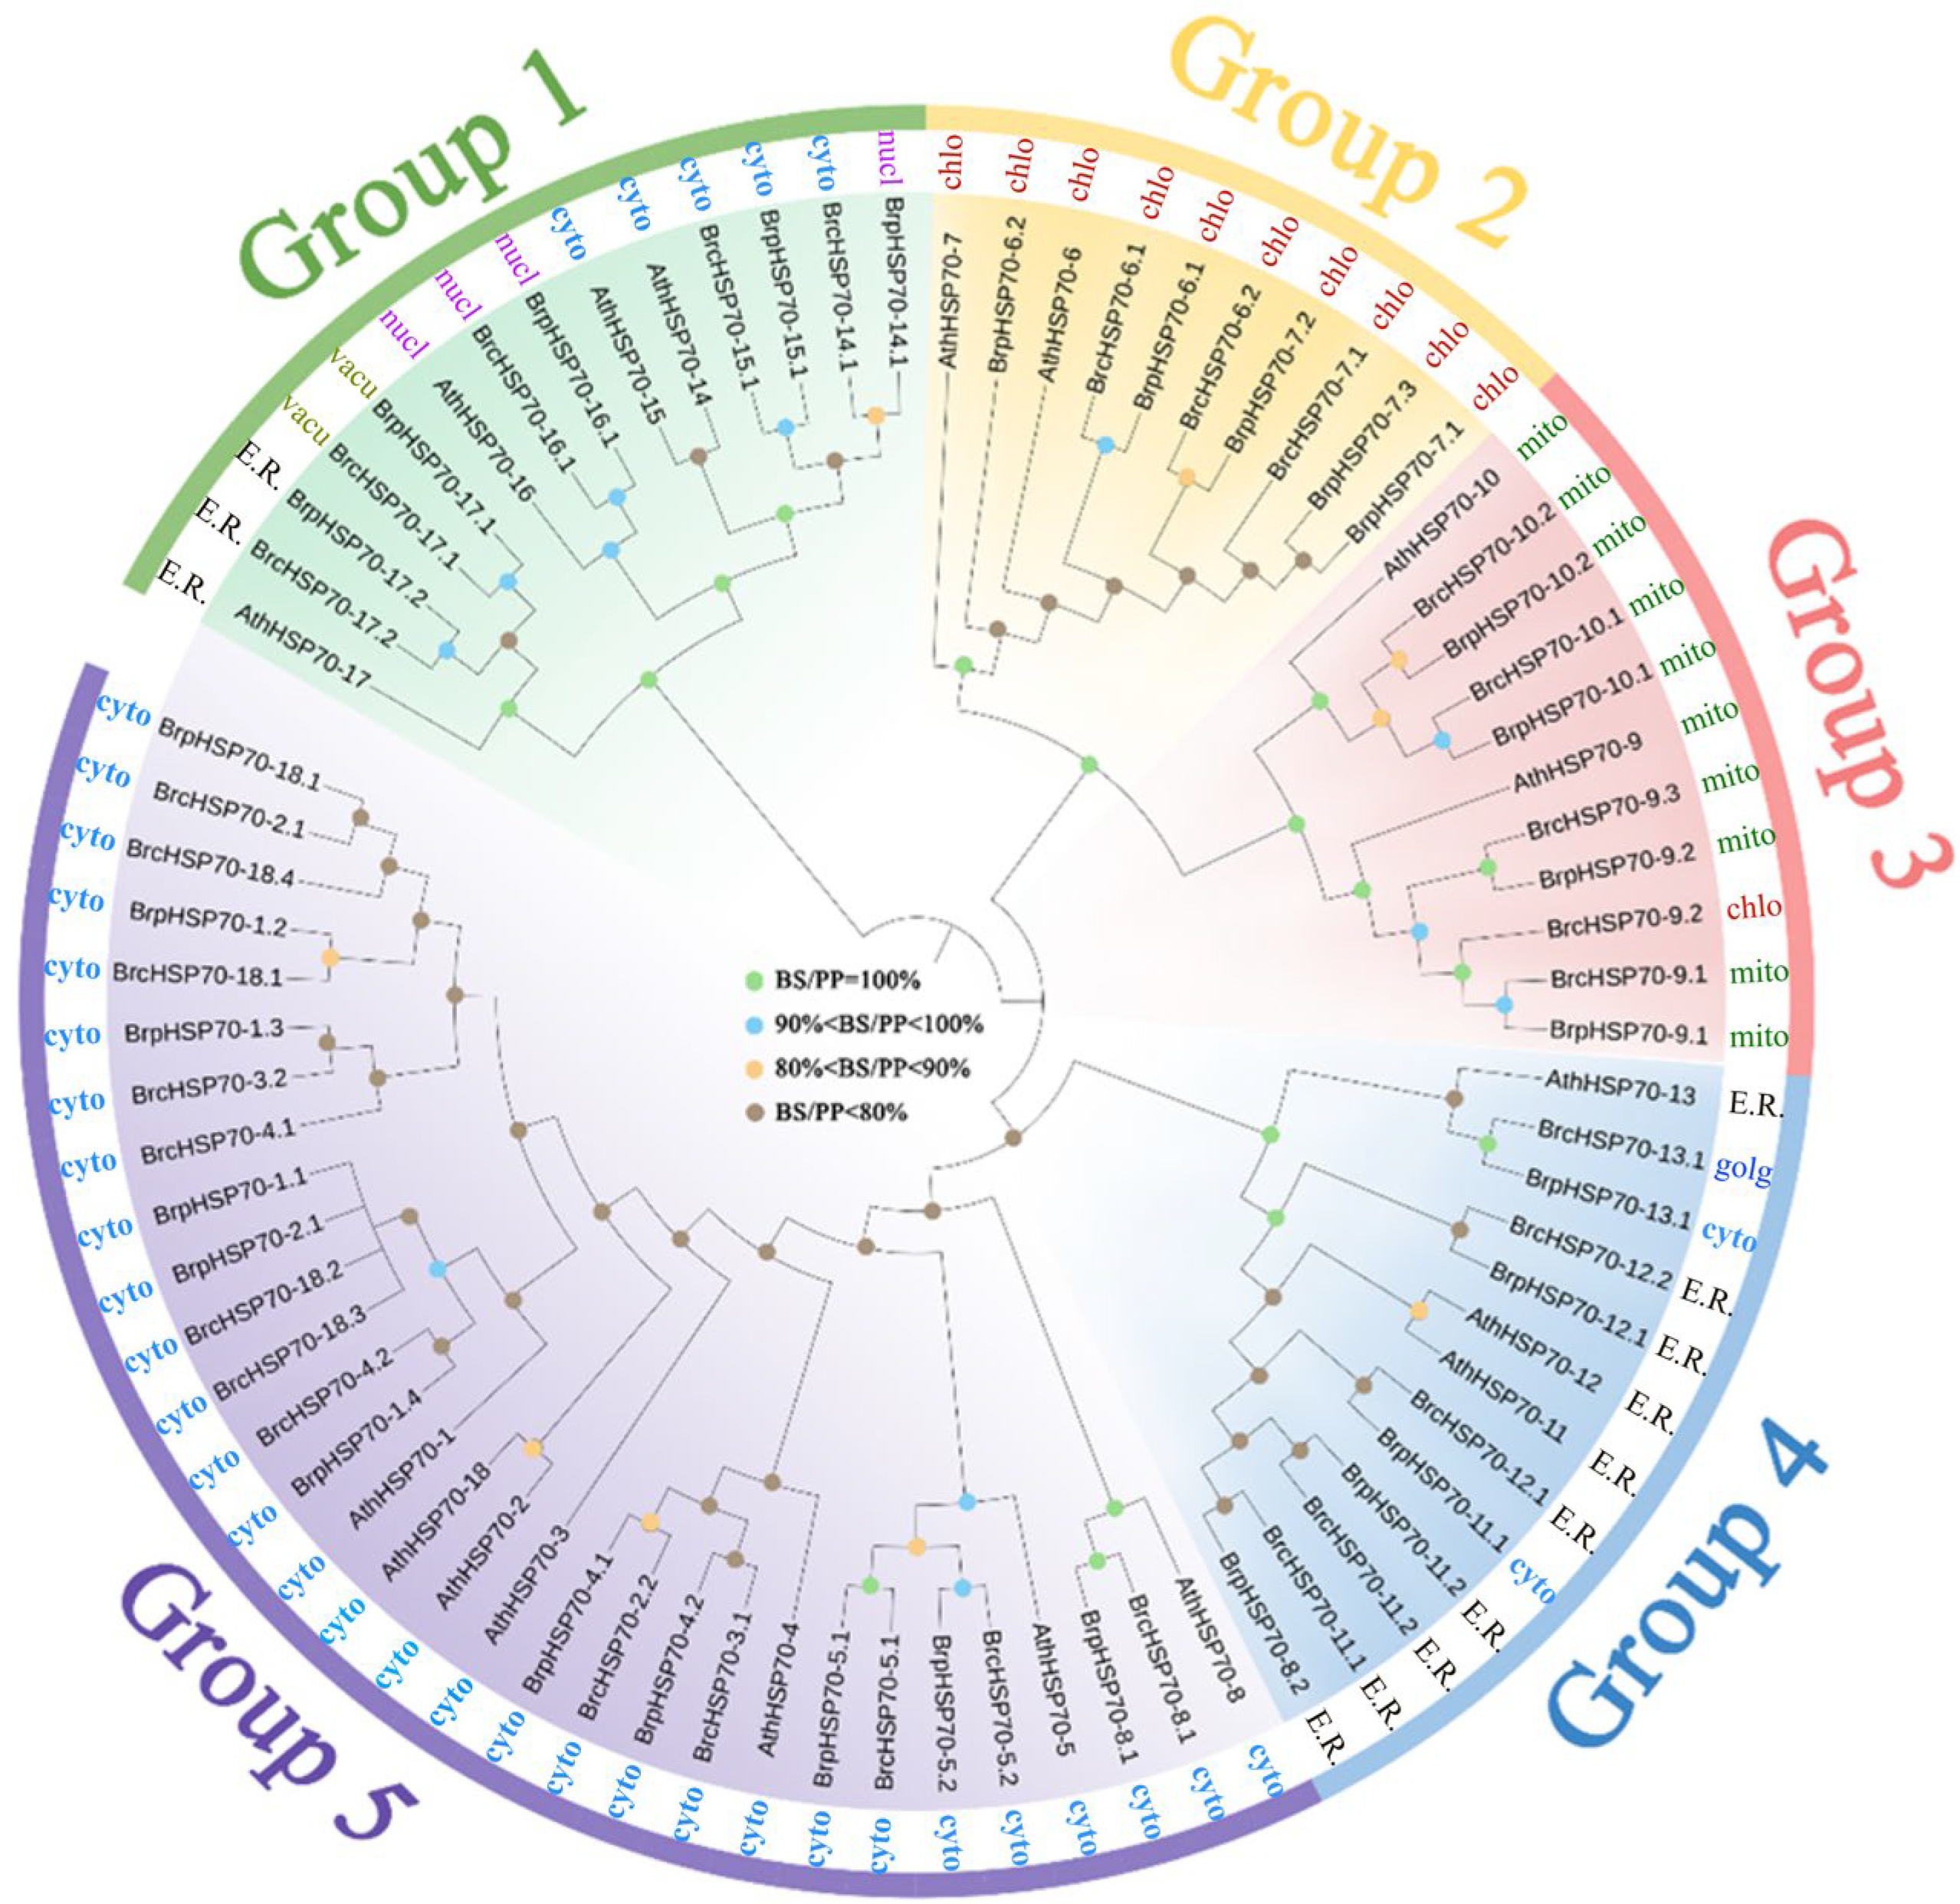
Figure 1. Phylogenetic tree of 79 HSP70 proteins from NHCC (Brc.), HCC (Brp.), and A. thaliana (Ath.). The unrooted tree shows proteins clustered into five distinct groups (Groups 1–5), highlighted by different background colors. Predicted subcellular localizations are indicated by abbreviations next to each protein name. The colored circles at the nodes represent bootstrap (BS) and posterior probability (PP) support values as follows: green indicates BS/PP = 100%; blue indicates 90% < BS/PP < 100%; orange indicates 80% < BS/PP < 90%; and brown indicates BS/PP < 80%.
Horticulturae 11 00938 g001
Figure 2. Phylogeny, motifs, and domains of BrcHSP70 proteins. (A) The phylogenetic tree of the BrcHSP70 protein family, showing a classification into five subgroups. (B) The conserved motifs represented by colored boxes. (C) Conserved domains visualized by TBtools, with domain names provided in the key.
Horticulturae 11 00938 g002
Figure 3. Gene structure of BrcHSP70 genes in NHCC. Exons, untranslated regions (UTRs), and introns are indicated by yellow boxes, blue boxes, and black lines, respectively. The scale bar at the bottom represents the gene length.
Horticulturae 11 00938 g003
Figure 4. Distribution of BrcHSP70 genes on the chromosomes. Each chromosomal bar is labeled at the top with its name, and the size scale is in megabases (Mb).
Horticulturae 11 00938 g004
Figure 5. Chromosomal distribution and syntenic analysis of BrcHSP70 genes in the NHCC genome. The outer track displays the NHCC chromosomes (A01–A10 and one contig), with the locations of individual BrcHSP70 genes marked by black ticks. The inner data track represents gene density along the chromosomes (red indicates high density and blue indicates low density), with the scale shown on the top right. The colored lines in the center connect duplicated BrcHSP70 gene pairs (paralogs), highlighting gene duplication events. The gray ribbons in the background illustrate the collinear syntenic blocks within the genome.
Horticulturae 11 00938 g005
Figure 6. Cis-regulatory elements in the promoter region of BrcHSP70 genes. Red corresponds to a relatively high value, indicating a large number of gene elements, while green represents a relatively low value, indicating a small number of gene elements.
Horticulturae 11 00938 g006
Figure 7. Distribution of hormone-responsive cis-elements in the promoters of BrcHSP70 genes. The figure combines a phylogenetic tree of BrcHSP70 genes (left) with a map of five key hormone-responsive elements in their 2000 bp promoters (right). The colored icons represent ABRE (Abscisic Acid-Responsive Element), MeJARE (Methyl Jasmonate-Responsive Element), AuxRE (Auxin-Responsive Element), SARE (Salicylic Acid-Responsive Element), and GARE (Gibberellin-Responsive Element).
Horticulturae 11 00938 g007
Figure 8. Stress-responsive cis-elements within the promoters of BrcHSP70 genes and phylogenetic analysis. The tree (left) shows gene relationships. The map (right) illustrates the distribution of three element types: MYB-binding sites related to drought (green, e.g., MBS), defense/stress-responsive elements (yellow, e.g., TC-rich repeats), and low-temperature-responsive elements (pink, e.g., LTR).
Horticulturae 11 00938 g008
Figure 9. Heatmap of the expression profiles of BrcHSP70 candidate genes in AiJiaohuang and SHI. The heatmap visualizes the expression profiles based on Z-score normalized FPKM values from our RNA-Seq data. Note: A represents the heat-sensitive material Aijiaohuang, S represents the heat-resistant material SHI, and 0, 6, and 24 represent the duration of exposure to heat stress in hours. The dataset was generated as part of our previous work [52].
Horticulturae 11 00938 g009
Figure 10. qPCR expression profile of the nine BrcHSP70 genes in different cultivars and at different durations of exposure to heat stress.
Horticulturae 11 00938 g010
Table 1. HSP70 genes in B. rapa ssp. chinensis genome and their corresponding protein properties.
GroupGene IDTranscript_IDLength (aa)Molecular Weight (KDa)pIRGAVYLocalization Predictor
1BrcHSP70-14.1BraC04g004760.181490.061245.2−0.421Cytoplasmic
BrcHSP70-15.1BraC06g001210.179187.80875.11−0.409Cytoplasmic
BrcHSP70-16.1BraC06g008220.176184.48945.78−0.486Nuclear
BrcHSP70-17.1BraC01g020590.182692.444715.4−0.468Vacuole
BrcHSP70-17.2BraC03g048540.187597.497745.78−0.488ER
2BrcHSP70-6.1BraC01g015450.171176.00555.09−0.325Chloroplast
BrcHSP70-6.2BraC03g053490.171075.982785.27−0.313Chloroplast
BrcHSP70-7.1BraC08g021270.271376.378095.15−0.319Chloroplast
3BrcHSP70-9.1BraC01g001110.168273.002765.56−0.297Mitochondrial
BrcHSP70-9.2BraC07g009150.166171.304085.39−0.275Chloroplast
BrcHSP70-9.3BraC08g022530.167672.489365.79−0.281Mitochondrial
BrcHSP70-10.1BraC02g003110.168072.871415.82−0.335Mitochondrial
BrcHSP70-10.2BraC03g004180.168172.745255.61−0.331Mitochondrial
4BrcHSP70-11.1BraC03g016780.166973.631285.08−0.468ER
BrcHSP70-11.2BraC03g019710.166973.60735.08−0.461ER
BrcHSP70-12.1BraC07g008480.166973.848585.08−0.477ER
BrcHSP70-12.2BraC07g020710.166573.493225.11−0.466ER
BrcHSP70-13.1BraC09g070470.165372.527444.96−0.43Golgi apparatus
5BrcHSP70-2.1BraC01g030020.164770.883355.07−0.404Cytoplasmic
BrcHSP70-2.2BraC01g043750.165071.271685.13−0.429Cytoplasmic
BrcHSP70-3.1BraC03g036010.165271.387725.13−0.45Cytoplasmic
BrcHSP70-3.2BraC03g044790.165071.17665.04−0.42Cytoplasmic
BrcHSP70-4.1BraC06g004500.157763.666235.37−0.381Cytoplasmic
BrcHSP70-4.2BraC09g006520.164770.947415.04−0.401Cytoplasmic
BrcHSP70-5.1BraC06g011730.164771.043545.48−0.408Cytoplasmic
BrcHSP70-5.2BraC08g030530.165071.370635.28−0.435Cytoplasmic
BrcHSP70-8.1BraC05g012920.256460.816755.390.051Chloroplast
BrcHSP70-18.1BraC09g044850.164971.295775.07−0.386Cytoplasmic
BrcHSP70-18.2BraC10g035070.164670.87445.07−0.396Cytoplasmic
BrcHSP70-18.3BraC10g035090.155761.273755.07−0.397Cytoplasmic
BrcHSP70-18.4BraCxxg008040.166172.347025.11−0.407Cytoplasmic
Note: pI, isoelectric point; GRAVY, grand average of hydropathy.
Table 2. Analysis of selection pressures on duplicated BrcHSP70 gene pairs.
Gene PairKaKsKa/Ks Ratio
BrcHSP70-3.1/BrcHSP70-2.20.008321.066570.00780
BrcHSP70-5.2/BrcHSP70-5.10.026880.919470.02923
BrcHSP70-6.2/BrcHSP70-6.10.026430.491630.05376
BrcHSP70-7.1/BrcHSP70-6.10.028600.455050.06286
BrcHSP70-7.1/BrcHSP70-6.20.020010.471050.04248
BrcHSP70-9.3/BrcHSP70-9.10.028380.431730.06574
BrcHSP70-10.2/BrcHSP70-10.10.017980.441040.04078
BrcHSP70-17.2/BrcHSP70-17.10.031070.305070.10185
Disclaimer/Publisher’s Note: The statements, opinions and data contained in all publications are solely those of the individual author(s) and contributor(s) and not of MDPI and/or the editor(s). MDPI and/or the editor(s) disclaim responsibility for any injury to people or property resulting from any ideas, methods, instructions or products referred to in the content.