Article

Monitoring Chrysanthemum Cultivation Areas Using Remote Sensing Technology

by
Yin Ye
1,
Meng-Ting Wu
1,
Chun-Juan Pu
1,*,
Jing-Mei Chen
1,
Zhi-Xian Jing
2,
Ting-Ting Shi
2,
Xiao-Bo Zhang
2 and
Hui Yan
1,*
1
Jiangsu Collaborative Innovation Center of Chinese Medicinal Resources Industrialization, National and Local Collaborative Engineering Center of Chinese Medicinal Resources Industrialization and Formulae Innovative Medicine, Nanjing University of Chinese Medicine, Nanjing 210023, China
2
State Key Laboratory Breeding Base of Dao-di Herbs, National Resource Center for Chinese Materia Medica, China Academy of Chinese Medical Sciences, Beijing 100700, China
*
Authors to whom correspondence should be addressed.
Horticulturae 2025, 11(8), 933; https://doi.org/10.3390/horticulturae11080933 (registering DOI)
Submission received: 27 June 2025 / Revised: 1 August 2025 / Accepted: 5 August 2025 / Published: 7 August 2025
(This article belongs to the Section Medicinals, Herbs, and Specialty Crops)

Abstract

Chrysanthemum has a long history of medicinal use with rich germplasm resources and extensive cultivation. Traditional chrysanthemum cultivation involves complex patterns and long flowering periods, with the ongoing expansion of planting areas complicating statistical surveys. Currently, reliable, timely, and universally applicable standardized monitoring methods for chrysanthemum cultivation areas remain underdeveloped. This research employed 16 m resolution satellite imagery spanning 2021 to 2023 alongside 2 m resolution data acquired in 2022 to quantify chrysanthemum cultivation extent across Sheyang County, Jiangsu Province, China. After evaluating multiple classifiers, Maximum Likelihood Classification was selected as the optimal method. Subsequently, time-series-based post-classification processing was implemented: initial cultivation information extraction was performed through feature comparison, supervised classification, and temporal analysis. Accuracy validation via Overall Accuracy, Kappa coefficient, Producer’s Accuracy, and User’s Accuracy identified critical issues, followed by targeted refinement of spectrally confused features to obtain precise area estimates. The chrysanthemum cultivation area in 2022 was quantified as 46,950,343 m2 for 2 m resolution and 46,332,538 m2 for 16 m resolution. Finally, the conversion ratio characteristics between resolutions were analyzed, yielding adjusted results of 38,466,192 m2 for 2021 and 47,546,718 m2 for 2023, respectively. These outcomes demonstrate strong alignment with local agricultural statistics, confirming method viability for chrysanthemum cultivation area computation.

1. Introduction

Chrysanthemum has been used in traditional medicine for millennia, containing bioactive compounds such as flavonoids, volatile oils, and polysaccharides, which demonstrate anti-inflammatory, antimicrobial, antitumor, and cardiovascular protective effects [1]. Cultivation has expanded due to diverse applications in food, pharmaceuticals, and cosmetics, with annual production exceeding one million tons. This industry drives rural employment and economic growth, serving as a key component of rural revitalization. Commercial products vary significantly due to varietal differences, geographical origins, and processing techniques, with Chrysanthemum morifolium cv. ‘Hangju’ representing the largest cultivated area nationally [2,3]. Current primary production zones for C. morifolium cv. ‘Hangju’ are concentrated in Jiangsu, Hubei, and Zhejiang provinces. After years of development, the annual cultivation area in Sheyang County (Yancheng City, Jiangsu Province) and surrounding regions has stabilized at approximately 66,700,000 m2, accounting for more than 50% of China’s total C. morifolium cv. ‘Hangju’ production. The local industry features robust infrastructure and efficient processing systems, with household cultivation covering comparable areas to concentrated field planting. Traditional area estimation methods calculated the total area by dividing the annual yield by the average yield per unit area. However, this approach is inaccurate due to the external chrysanthemum influx processed in Sheyang County and cannot provide township-level data. Chrysanthemum cultivation provides vital economic sustenance for rural communities. Accurate monitoring of planting areas and yield projections enables market equilibrium maintenance, guides sustainable rotation planning to prevent continuous cropping issues, and avoids production data misreporting. Consequently, there exists an urgent need for rapid, reliable, and scientific approaches to quantify cultivation extent.
In contrast, remote sensing technology employs satellite or unmanned aerial vehicle (UAV)-mounted sensors to acquire surface imagery, enabling the extraction of cultivation areas through classification algorithms. This approach constitutes a practical and efficient methodology for acquiring crop planting area data. Techniques, including vegetation index calculation, semi-supervised classification, and time-series-based classification, applied to optical or radar satellite data enable precise target extraction [4,5,6,7]. These methods are extensively utilized in agriculture, forestry, hydrology, and environmental sectors, such as crop classification, forest cover monitoring, flood prediction, and marine surveillance [8,9,10,11,12].
However, applications remain limited in medicinal plant monitoring. Zhang et al. [13] achieved 83.69% accuracy in Astragalus cultivation area estimation using principal component analysis on satellite imagery with random forest classification. Wang et al. [14] mapped Eucommia ulmoides Oliver using the Jeffries–Matusita distance and random forest, achieving an Overall Accuracy (OA) of more than 95% with producer’s accuracy (PA) and user’s accuracy (UA), ranging between 80% and 90%. Shi et al. [15] developed a GoogLeNet-based deep learning model using unmanned aerial vehicle data, achieving 97.5% classification accuracy and 94.6% area estimation precision for honeysuckle cultivation.
Key challenges persist in structurally complex regions, where higher spatial resolution alone fails to ensure precision [16]. Thus, leveraging crop phenological distinctiveness and planting regime variations is essential for improving accuracy [17,18]. Analyzing crop-specific temporal signatures enables reliable separation from confounding features and mitigates commission errors and omission errors in supervised classification. Novel classification methodologies continue to emerge for result optimization. Wang et al. [10] developed Cropformer, a novel deep learning framework employing a two-stage methodology: self-supervised pretraining followed by fine-tuning. Comparative evaluation against established methods demonstrated its superior performance. Nevertheless, even advanced methods exhibit instability, with Average Accuracy and OA failing to consistently achieve 80% across diverse crop types.
Prior research has afforded limited attention to PA and UA, with post-classification processing primarily targeting noise removal. Here, we employ a post-classification refinement approach to extract chrysanthemum cultivation parcels in Sheyang County. Accuracy was validated through OA, Kappa coefficient, PA, and UA analyses. Identified limitations were addressed by integrating visual interpretation to eliminate errors, achieving precise delineation of chrysanthemum fields. This study aims to establish a standardized remote sensing-based monitoring method for the medicinal chrysanthemum industry, enabling timely, reliable, and universally applicable cultivation area quantification. This addresses the absence of precise monitoring methodologies for complex cropping patterns, thereby supporting regulatory decision-making and industrial policy formulation by national authorities.

2. Materials and Methods

2.1. Study Area Description

Yancheng City is located in the eastern coastal region of Jiangsu Province, and is the province’s largest prefecture-level city by land area, with the longest coastline. The total land area covers 17,700 km2. Sheyang County, part of Yancheng City, is situated at the eastern starting point of the north–south divide of mainland China and lies at the intersection of the land and sea boundary. It contains Jiangsu Province’s largest marine and wetland areas. The county has an average annual temperature of 14.4 °C, receives 992.6 mm of annual precipitation, and experiences 2202.7 h of annual sunshine. The average relative humidity is approximately 78%, exhibiting clear monsoon climate characteristics.
Chrysanthemum cultivation in Yancheng City exhibits the following phenology: this perennial herb experiences vegetative growth from May to July and flowers between September and November. It is typically rotated with wheat and rapeseed; detailed planting cycles are documented in Table S1. The study area is primarily located within the chrysanthemum planting concentration zone of Sheyang County, extending from 33°31′12″ N to 34°07′15″ N and 119°55′48″ E to 120°34′47″ E. The basic steps of the experimental setup are described in Figure 1.

2.2. Acquisition of Remote Sensing Data

Remote sensing images with a cloud coverage percentage below 30% were selected. To support subsequent time-series analysis, data acquisition ensured coverage across multiple phenological stages (seedling, leafing, and flowering) for each year and spatial resolution. For a spatial resolution of 16 m, multispectral image data utilized included Gaofen, Ziyuan, and Huanjing satellite series imagery for the years 2021, 2022, and 2023. For a spatial resolution of 2 m, multispectral image data utilized included Ziyuan series satellite imagery for the year 2022. Mosaicked monthly datasets provided complete coverage of Sheyang County. Remote sensing imagery was commercially procured from the China Center for Resources Satellite Data and Application (https://data.cresda.cn/, accessed on 23 September, 13 October, and 24 October 2023). These data are commercially available for purchase through third-party vendor Beijing Aitelasi Information Technology Co., Ltd., Beijing, China. Additionally, the data used in this study are publicly accessible at the official Satellite Application Center for Natural Resources Cloud Service Platform (https://www.sasclouds.com). Due to file sizes exceeding 500 MB per scene, source data cannot be uploaded as supplementary material, but are available from the corresponding author upon request. Detailed specifications are provided in Tables S2 and S3.
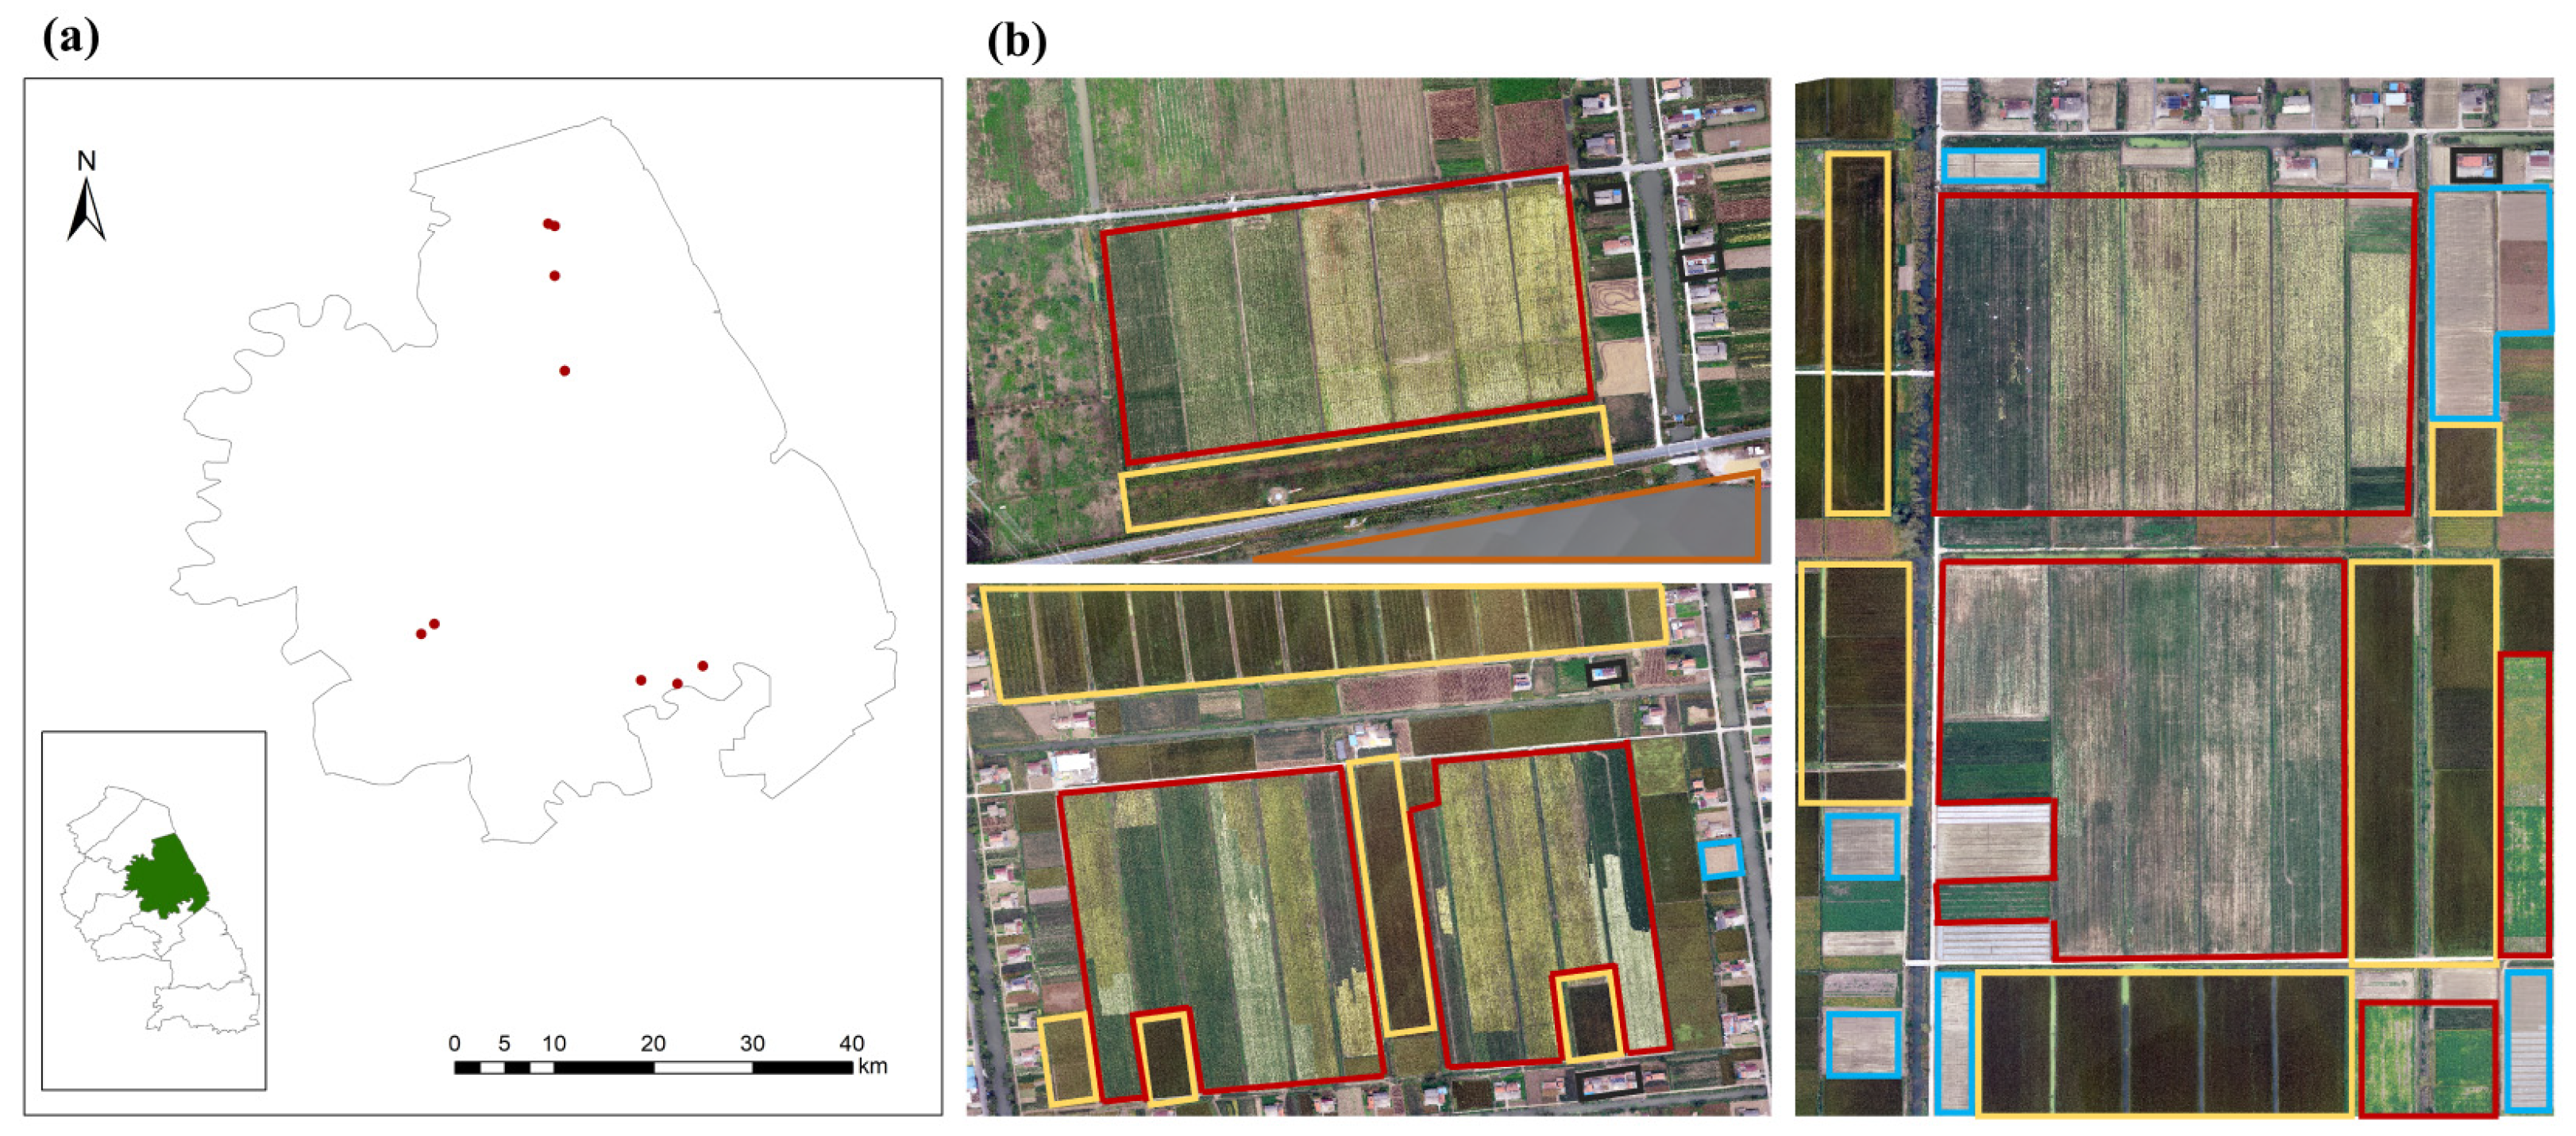
Field investigations were conducted across multiple chrysanthemum cultivation regions in Sheyang, Funing, and Xiangshui Counties (Yancheng City) from 16 to 19 October 2022. During subsequent field surveys on 10–11 October 2023, UAV-based imagery documented 12 chrysanthemum cultivation regions, including 9 within Sheyang County. Specific geolocation points are illustrated in Figure 2a.
This study utilized the DJI Phantom 4 RTK (manufactured by Shenzhen Da-Jiang Innovations Science and Technology Co., Ltd., Shenzhen, China) for aerial imaging, conducting aerial surveys at 120 m altitude with 80% along-track and 70% side overlap. Orthoimages were generated for designated sample plots by importing UAV imagery with geolocation data. Point clouds were densified and matched, followed by standardized preprocessing of image data during aerial triangulation. Data quality was validated prior to generating digital surface models and orthomosaics. Subsequently, orthoimages were preprocessed into map tiles with quadtree indexing, mosaicked, ultimately generating sample plot imagery at a 3 cm resolution. These high-resolution UAV datasets have been used to assist visual interpretation of land cover features in satellite imagery.

2.3. Preprocessing of Remote Sensing Data

Multispectral imagery from Gaofen, Ziyuan, and Huanjing satellites was preprocessed using the ENVI (Environment for Visualizing Images v. 5.3) software. Radiometric calibration was first applied, followed by atmospheric correction using the FLAASH model to remove radiation errors induced by atmospheric scattering. Detailed parameter settings for the radiometric calibration, atmospheric correction, and orthorectification procedures are provided in Figure S1. Subsequent preprocessing steps included geometric correction, image fusion, mosaicking, clipping, and registration.

2.4. Calculation of the Vegetation Indices (VIs)

We evaluated five vegetation indices for discriminating chrysanthemum cultivation from other land cover types: Normalized Difference Vegetation Index (NDVI), Green Normalized Difference Vegetation Index (GNDVI), Simple Ratio (SR), Enhanced Vegetation Index 2 (EVI2), and Green Chlorophyll Index (CIgreen) [19]. The specific formula is as follows:
N D V I = b 1 b 2 b 1 + b 2
G N D V I = b 1 b 3 b 1 + b 3
S R = b 1 b 2
E V I 2 = 2.5 × ( b 1 b 2 ) 1 + b 1 + 2.4 × b 2
CI green = b 1 b 3 1
In the calculation process, the bands should be explicitly converted to a float data type, where b1, b2, and b3 represent the NIR, red, and green bands. This standardization ensures consistent data formats and prevents computational errors.

2.5. Unsupervised Classification and Supervised Classification

This study also compared various supervised and unsupervised classification methods for chrysanthemum cultivation area extraction, selecting the optimal method for primary extraction.
Unsupervised classification is a method of dividing land cover categories based solely on the spectral and statistical characteristics of remote sensing images without prior knowledge. This experiment employed the K-Means classification [20] and ISODATA classification [21], implemented through the ENVI 5.3 software package. Classification results were optimized primarily by adjusting four key parameters: Number of Classes, Maximum Iterations, Change Threshold, and Maximum Class Standard Deviation. Detailed parameter configurations are provided in Figure S2.
Supervised classification, on the other hand, involves selecting training samples in the study area based on prior knowledge, allowing the classification system to learn and establish discriminant functions and rules. The entire image is then classified according to these rules. In this experiment, the algorithms used included Maximum Likelihood Classification (MLC), Parallelepiped Classification (PC), Minimum Distance Classification (MDC), Neural Network Classification (NNC), Support Vector Machine Classification (SVM), and Mahalanobis Distance Classification (MaDC), all provided by ENVI 5.3 software [22,23,24]. Training samples were established and optimized via visual interpretation to discriminate chrysanthemum from other land cover types, with primary classes comprising bare soil, cropland, chrysanthemum, rivers, and buildings. Parameter configurations are detailed in Figure S3.

2.6. Accuracy Validation

Results from the aforementioned classification methods were evaluated via confusion matrices, the prevailing approach for remote sensing accuracy assessment. It quantitatively validates classification results through a two-dimensional contingency matrix constructed by comparing predicted classes with ground reference data. Overall Accuracy (OA) refers to the ratio of correctly classified pixels to the total number of pixels. Producer’s Accuracy (PA) is the ratio of correctly classified pixels in a specific class to the total number of validation samples in that class, while User’s Accuracy (UA) refers to the ratio of correctly classified pixels in a specific class to the total number of pixels classified in that class. The kappa coefficient is used to measure the agreement between two classified images and is an indicator of classification accuracy [25]. Commission Errors (CEs) refer to pixels that are incorrectly classified into the user’s class of interest but actually belong to a different class, while Omission Errors (OEs) refer to pixels that belong to a true surface classification but were not classified into the corresponding class by the classifier.
k a p p a = T × ( T P + T N ) ( T P + F P ) × ( T P + F N ) + ( F N + T N ) × ( F P + T N ) T × T ( T P + F P ) × ( T P + F N ) + ( F N + T N ) × ( F P + T N )
O A = T P + T N T × 100 %
U A = T P T P + F P × 100 %
P A = T P T P + F N × 100 %
C E + U A = 1
O E + P A = 1
Total (T): The total number of pixels in the image.
True Positive (TP): The actual correctly classified pixels of a class.
False Negative (FN): Number of pixels of a class that are predicted as true but are actually false.
False Positive (FP): Number of pixels of a class that are predicted as false but are actually true.
True Negative (TN): Number of pixels of a class that are correctly predicted as false [26].
Four primary metrics were selected to evaluate the accuracy of medicinal plant cultivation area extraction: OA, Kappa coefficient, PA, and UA. Among these, OA and the Kappa coefficient reflect the spatial distribution accuracy of the extracted medicinal planting areas, where increasing values indicate higher precision.

3. Results

3.1. Analysis of Drone Image Features

UAV surveys across nine Sheyang County sample plots generated 3 cm resolution imagery. Analysis revealed distinct spectral and textural characteristics differentiating chrysanthemum from soybean, bare soil, and buildings. As illustrated in Figure 2b, chrysanthemum exhibited identifiable yellowish-white or pale green signatures, visually contrasting with other land cover types such as brownish-green soybean fields and bare soil with brown tones. These UAV observations provided essential reference data for satellite imagery interpretation.

3.2. Analysis of Satellite Remote Sensing Image Features

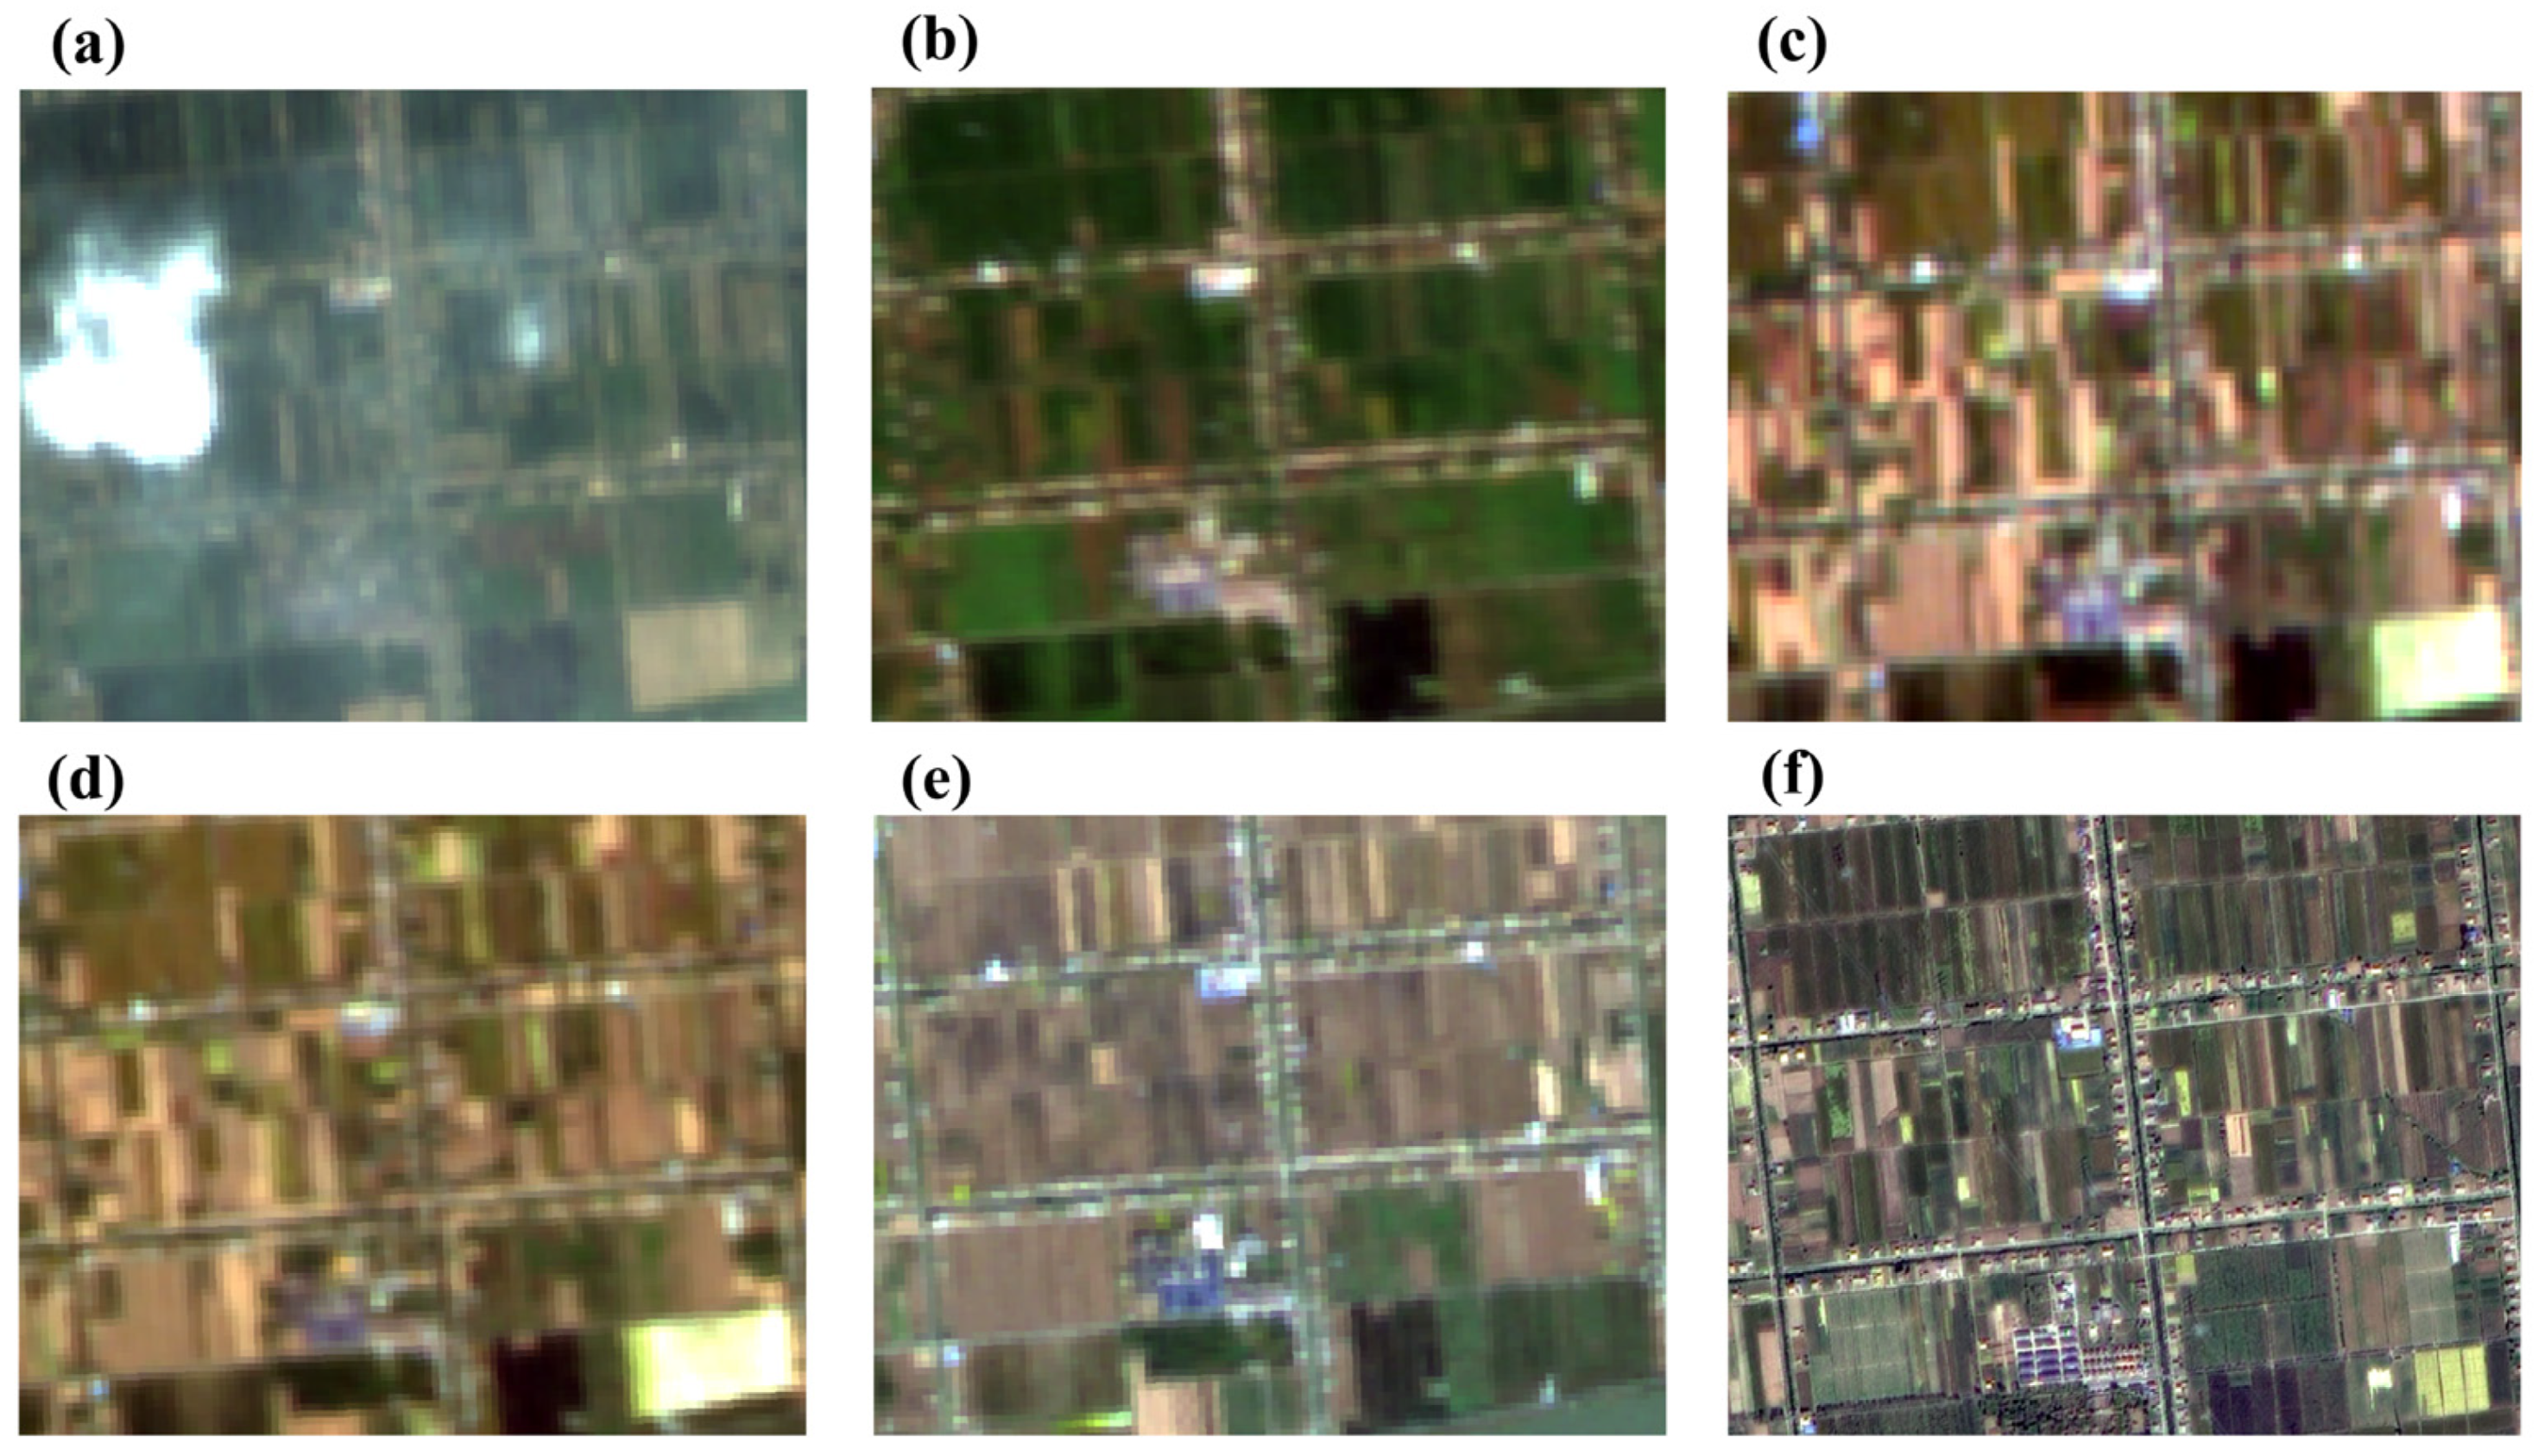
To better visualize chrysanthemum phenology, high-density cultivation areas were selected. Multi-temporal remote sensing imagery (August, September, October) at both 16 m and 2 m spatial resolutions from identical plots was comparatively analyzed (Figure 3). The imagery demonstrates three distinct phenological stages in chrysanthemum cultivation areas: bare soil, green vegetation, and yellow-white flowering canopy. These temporal spectral characteristics distinguish chrysanthemums from other plants. Consequently, time-series-based post-classification refinement effectively differentiates chrysanthemum cultivation through these phenophases.

3.3. VI Calculation for Sheyang County

We attempted VI-based discrimination between chrysanthemum and other land cover types, with results visualized in Figure S4. The VIs effectively separated cropland from rivers and bare soil. However, none of these indices successfully distinguished chrysanthemum from bare soil. This limitation stems from the consistently high reflectance of chrysanthemum across NIR, red, and green spectral bands, resulting in spectral confusion with bare soil. The phenomenon was particularly pronounced for white flowering chrysanthemums, which exhibited near-identical spectral signatures to bare soil surfaces. Additionally, chrysanthemum fields during growth phases exhibited VI signatures closely similar to those of conventional cropland. These spectral–temporal characteristics impeded reliable crop differentiation. Consequently, VIs proved ineffective for precise chrysanthemum area quantification, and we implemented unsupervised and supervised classification for precise area delineation.

3.4. Assessment Results of Unsupervised and Supervised Classification Methods

Training samples for chrysanthemum and other land cover classes were established through visual interpretation of UAV imagery. These samples were subsequently employed for supervised classification.
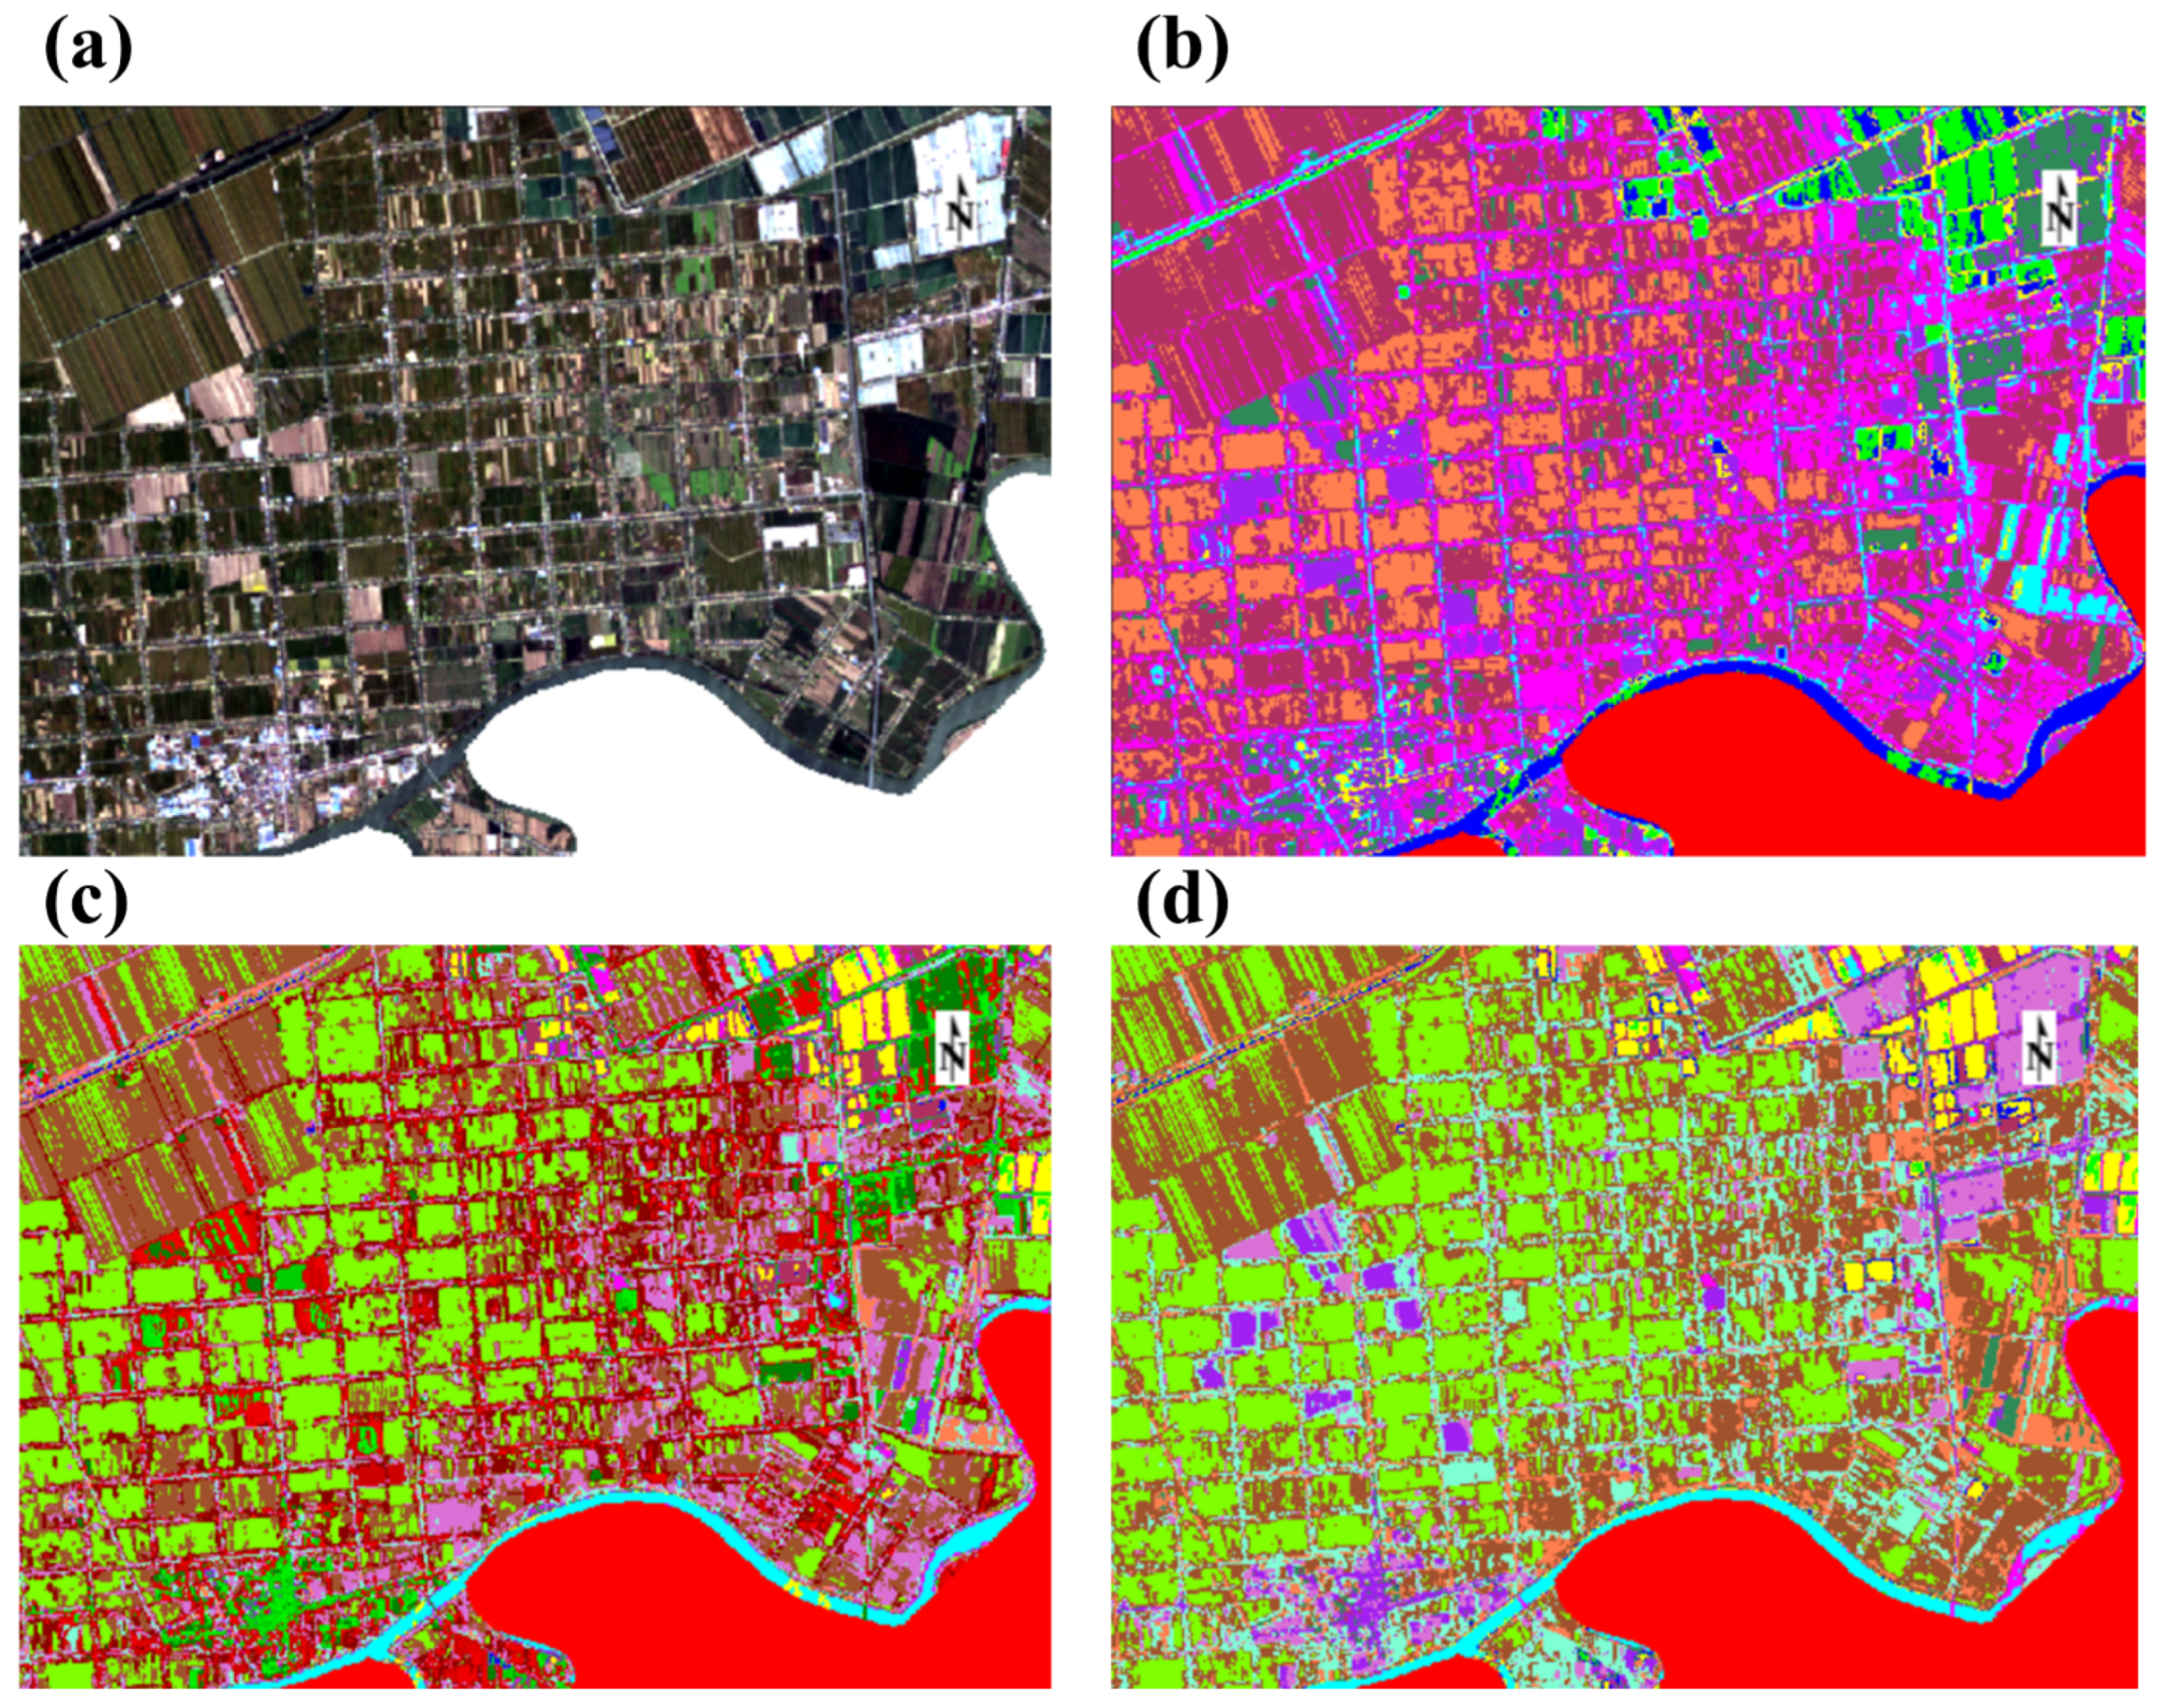
Figure 4 displays a zoomed-in view of unsupervised classification results from Sheyang County. Figure 4b demonstrates that unsupervised classification with insufficient categories fails to discriminate chrysanthemum from spectrally similar land cover, resulting in significant confusion among land cover types. Conversely, Figure 4c shows that excessive categories fragment chrysanthemum fields into multiple subclasses due to variations in flowering stages and petal colors. Although chrysanthemums are classified into several categories, chrysanthemums at early growth stages and crops such as soybeans exhibit similar green hues, resulting in less distinguishable spectral characteristics compared to other land cover types. Consequently, these vegetation types are commonly grouped together during classification.
Therefore, unsupervised classification is unsuitable for this study. The lack of rigorously defined training samples results in confusion between vegetation types with similar spectral characteristics, preventing effective discrimination during automated categorization.
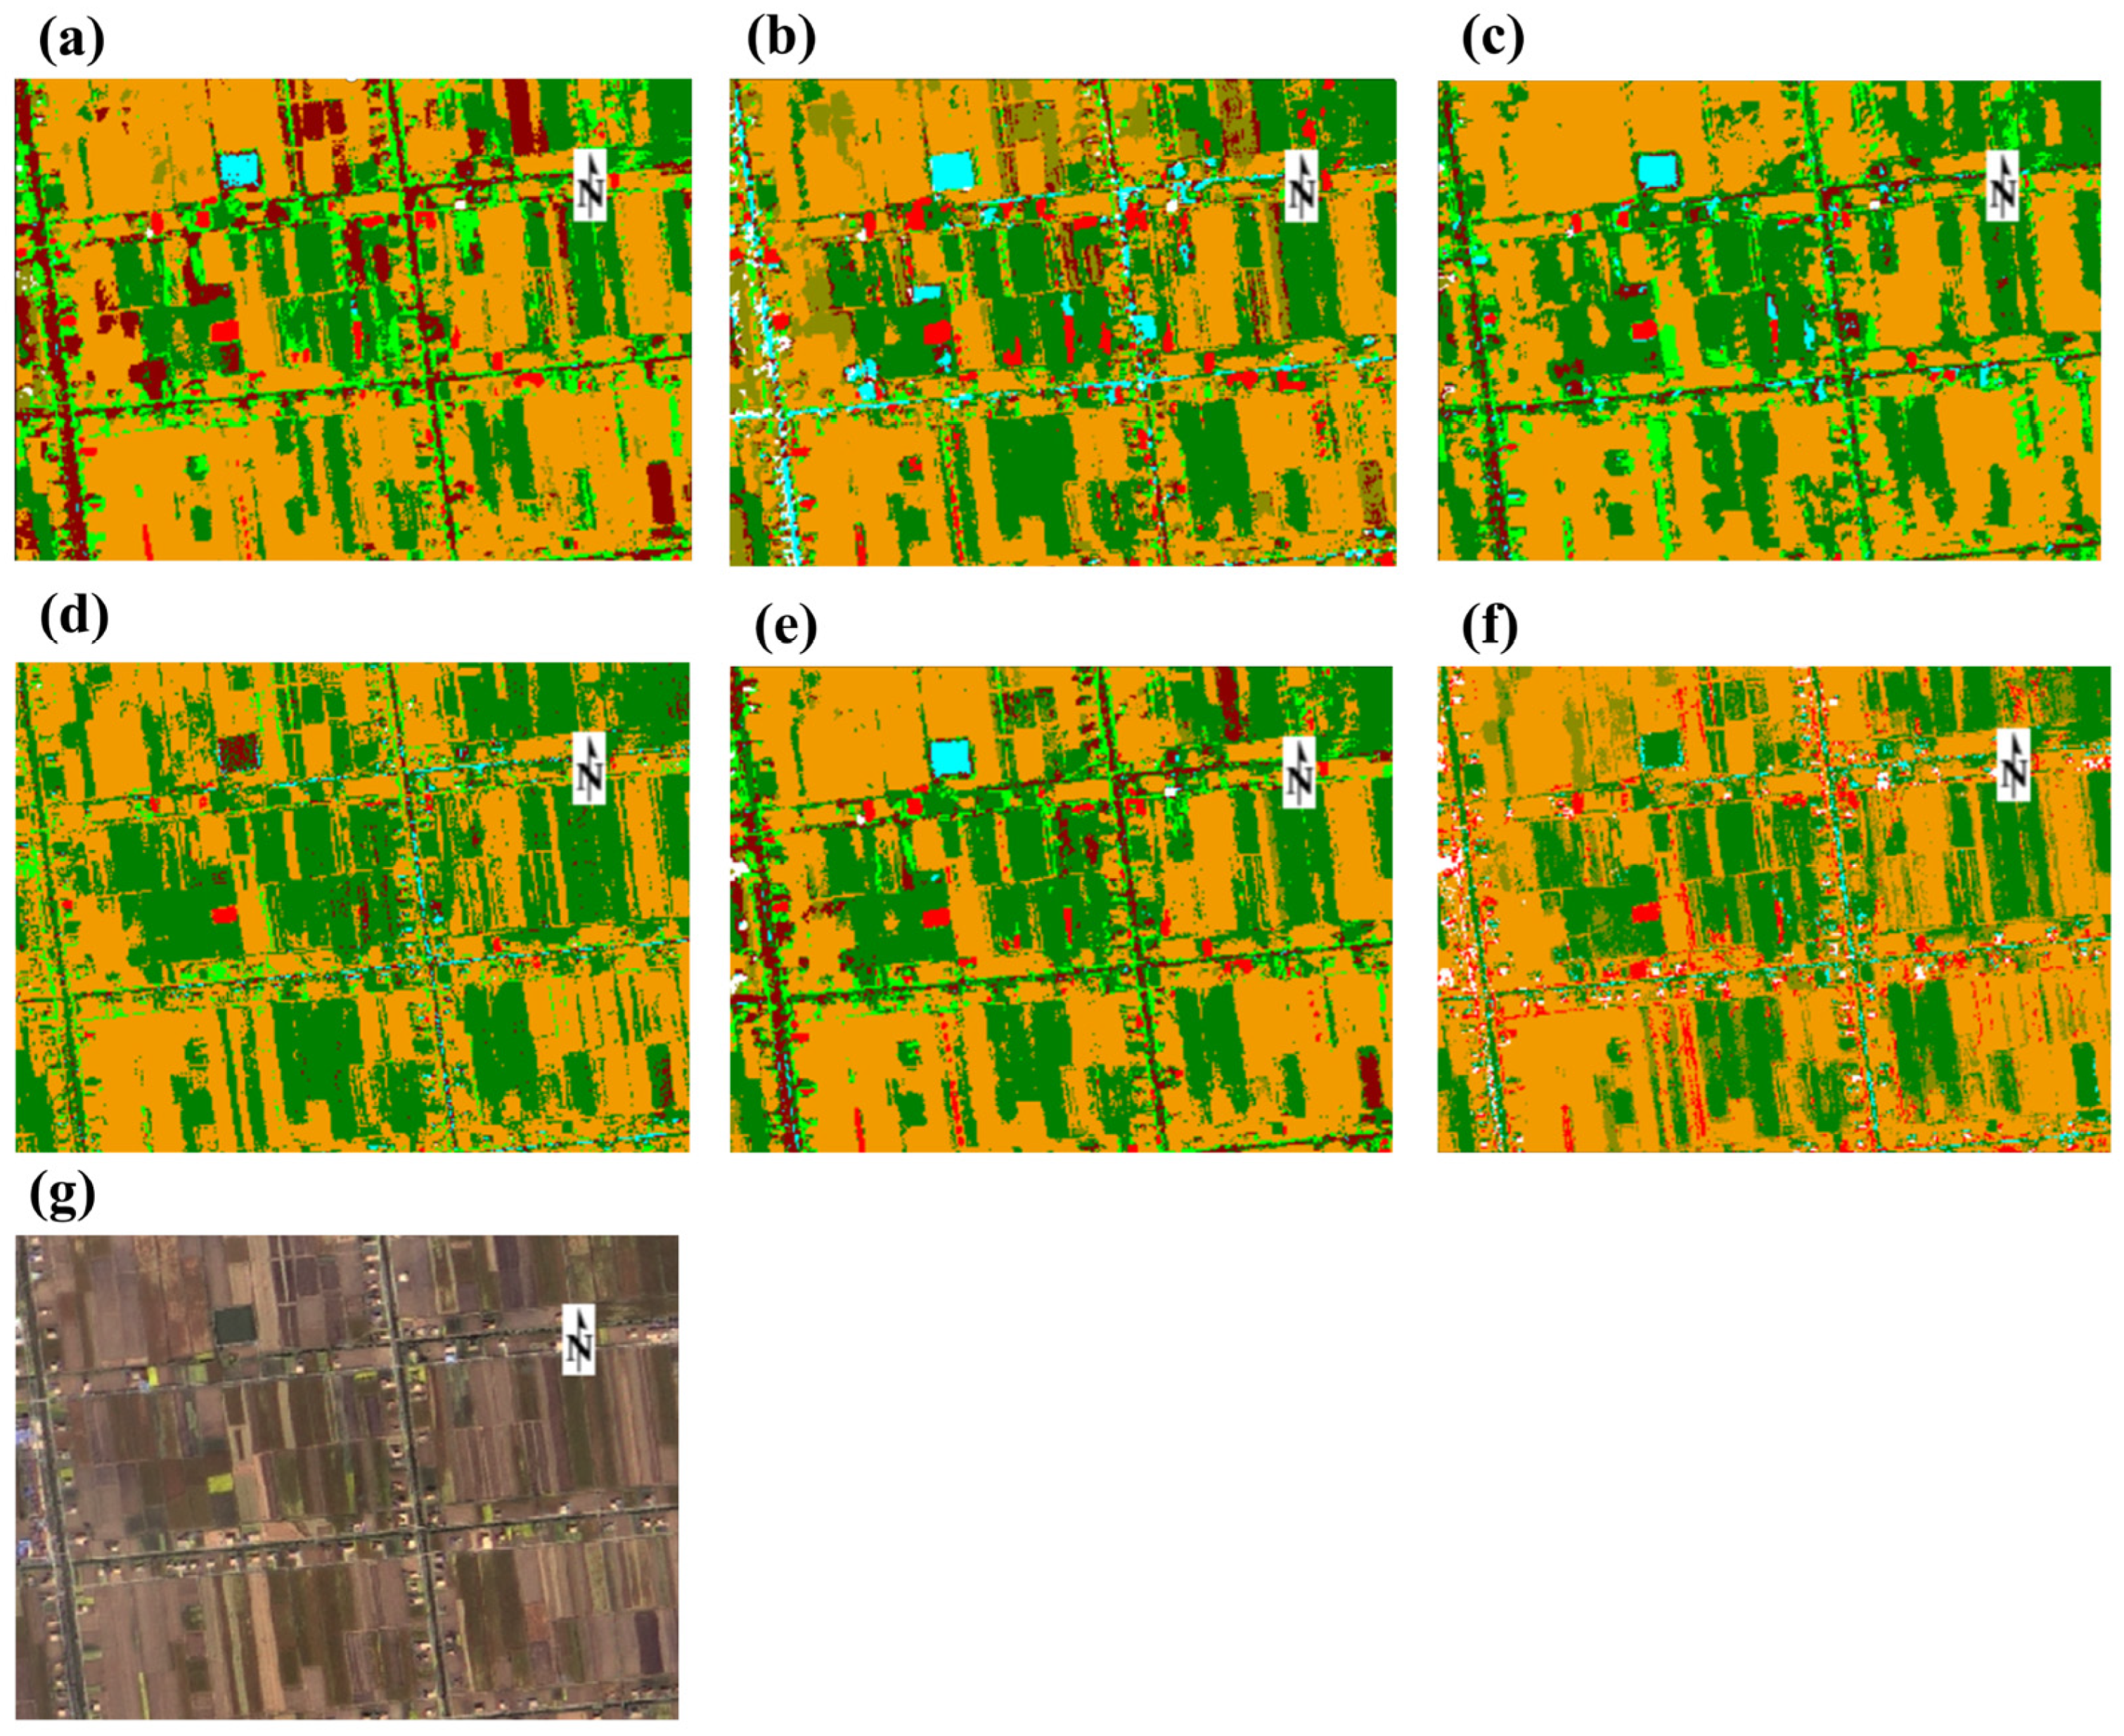
Supervised classification methods, including MDC, PC, MLC, NNC, MaDC, and SVM algorithms, were subsequently evaluated. These methods demonstrated successful spectral differentiation between chrysanthemum cultivation and other land cover features, with representative classification results illustrated in Figure 5.
Visual interpretation confirmed that supervised classification effectively differentiated chrysanthemum cultivation from other land cover types. Consequently, accuracy validation was performed, with results presented in Table 1. Comparative classification accuracies for major land cover classes within Yangma Town across different supervised methods are detailed in Table S4.
Results in Table 1 indicate that SVM achieved the highest classification accuracy, with an overall accuracy of 97.55% and a Kappa coefficient of 0.97, followed by MLC, with an overall accuracy of 95.45% and a Kappa coefficient of 0.94. Notably, while SVM yielded the highest PA for chrysanthemum identification, it required excessively long computational times, particularly for 2 m resolution imagery, where processing occasionally exceeded 24 h and caused system failures. Both MLC and SVM produced comparable results with superior accuracy metrics, corroborated by visual interpretation. Conversely, PC exhibited low UA and high CE, erroneously assigning non-chrysanthemum features to the target class and substantially overestimating the cultivation area. MDC and MaDC methods demonstrated inverse limitations: high UA but low PA with significant OE, leading to severe underestimation of chrysanthemum extent.
Overall, both MLC and SVM methods demonstrated comparatively favorable classification performance. However, the computational time required by SVM significantly exceeded that of MLC, particularly when processing 2 m resolution imagery. Excessively large images occasionally caused system failures due to computational overload, with results sometimes remaining unobtainable after 24 h of processing. Given their comparable classification accuracy, MLC was prioritized as the supervised classification method in this study. SVM remains recommendable when processing time is not constrained and sufficient computational resources are available.

3.5. Time-Series-Based Post-Classification Processing

3.5.1. Processing of Initial Classification Results

Sheyang County’s land use is predominantly agricultural, with chrysanthemum cultivation occurring through both concentrated fields and scattered household plantings. Cultivation zones show significant spatial clustering.
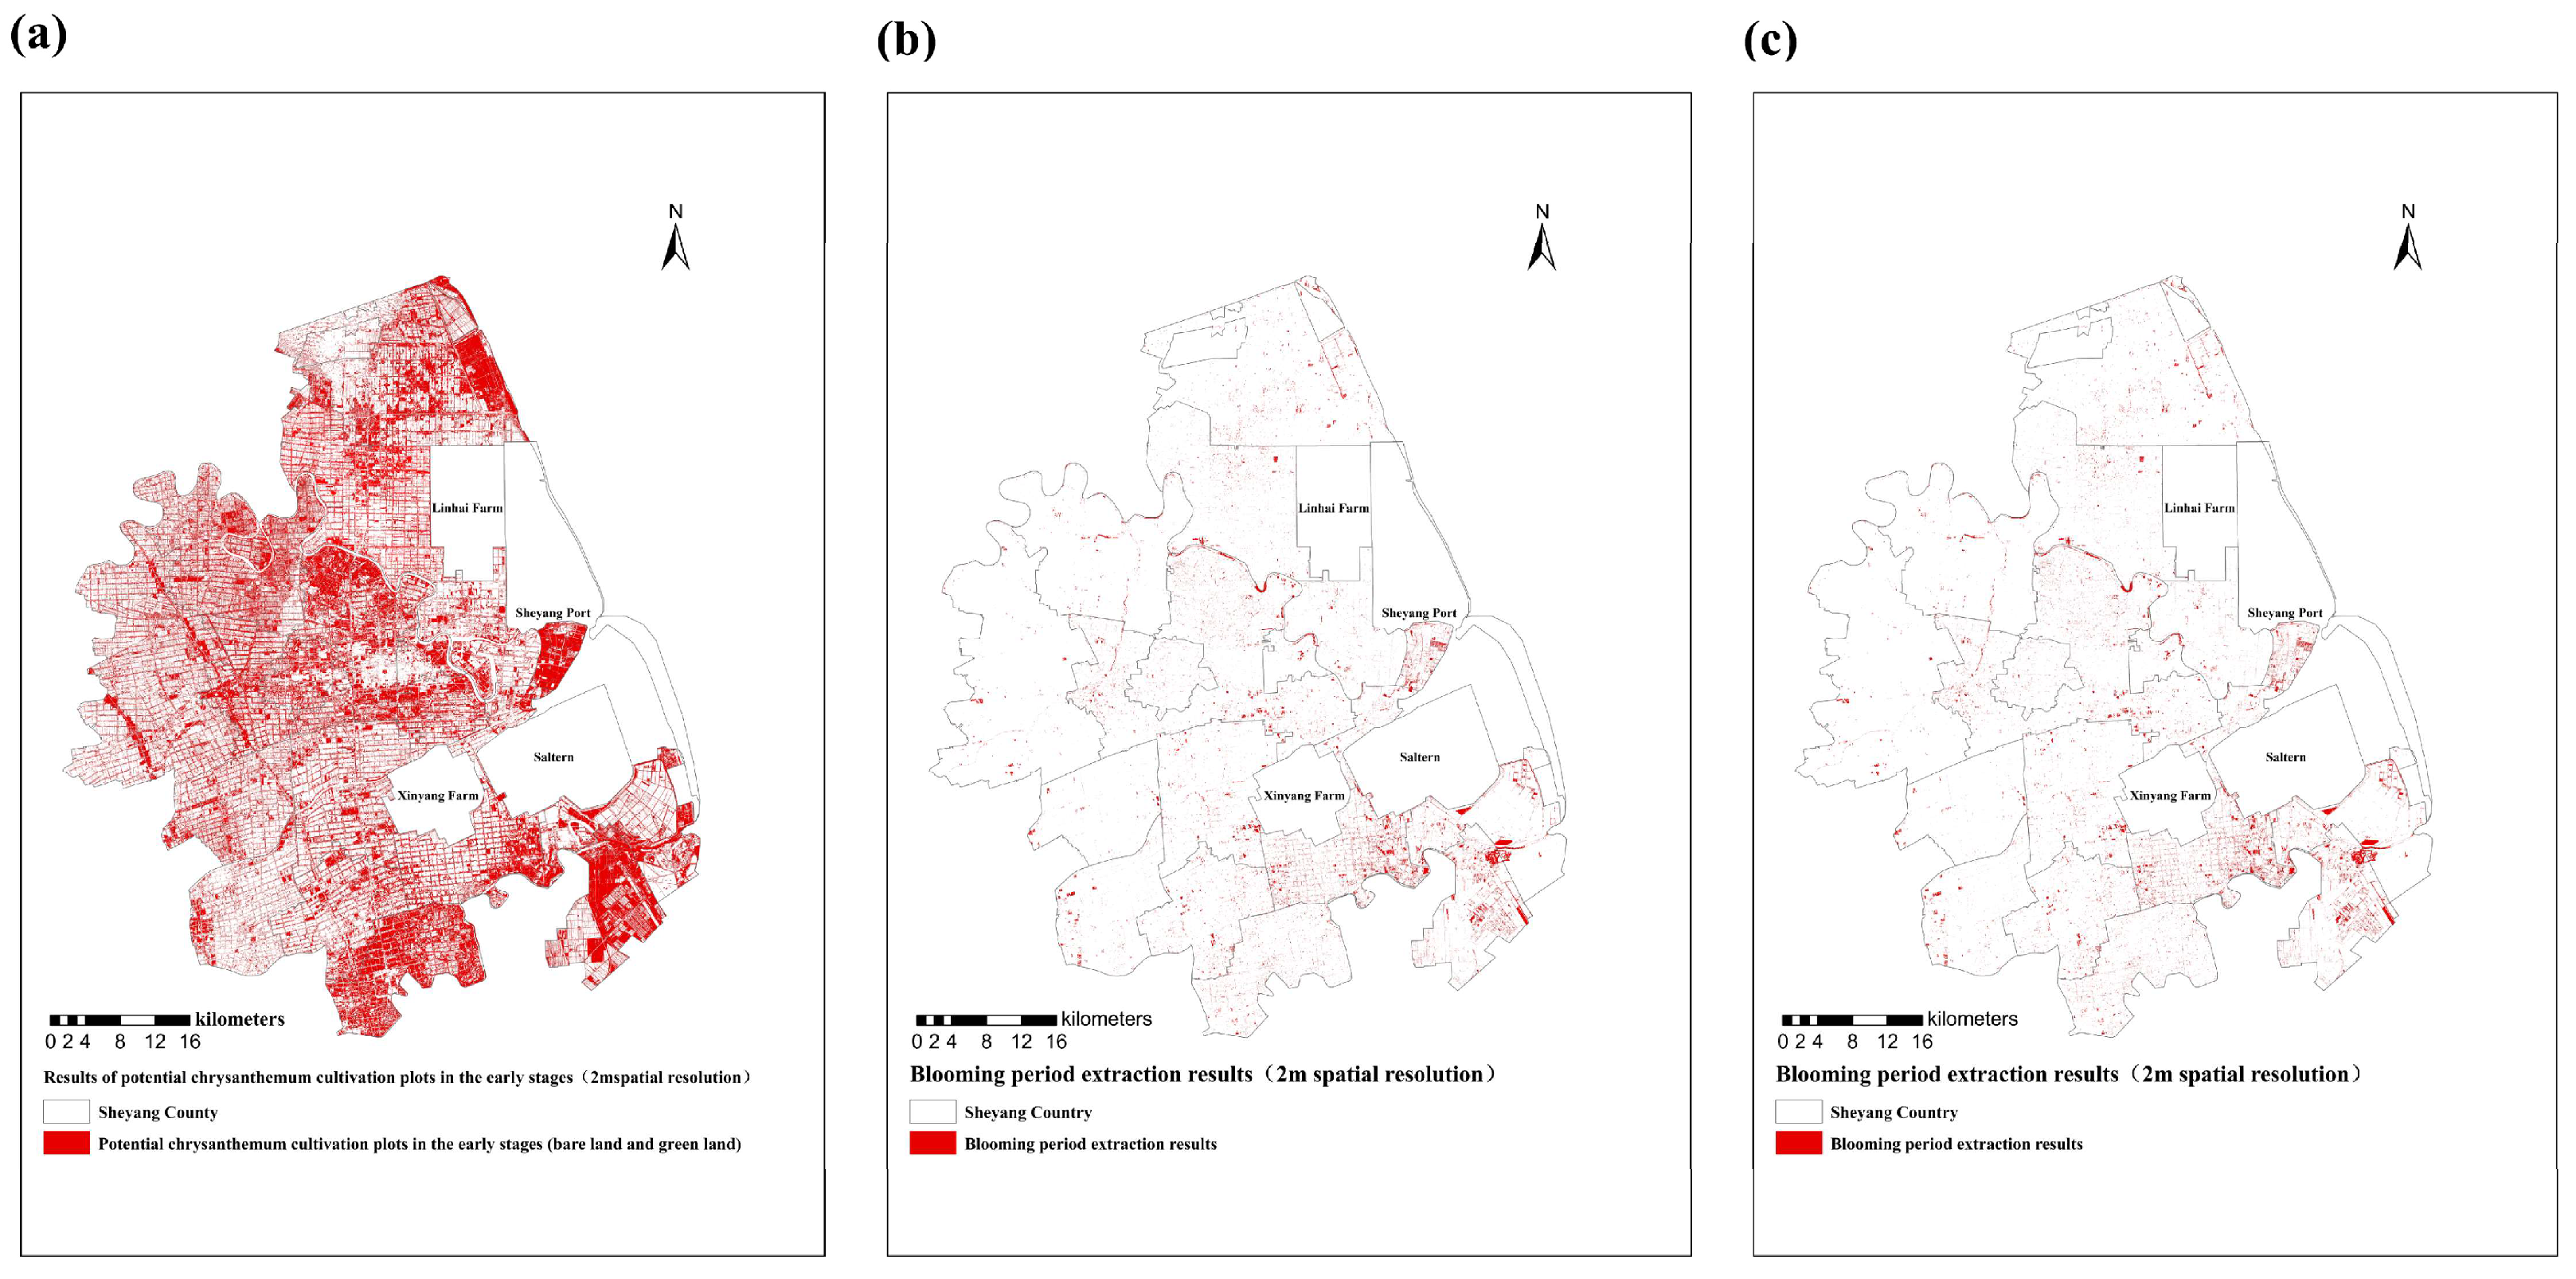
MLC was applied to extract monthly chrysanthemum distributions. The chrysanthemum classifications (similar to bare land and green land) from the images in August and September were superimposed, and similarly, the chrysanthemum classifications (yellow or yellow-white, cyan-green) from the images in October and November were superimposed. This resulted in two classification maps (Figure 6a,b). The spatial intersection of these composite layers was computed to generate the final chrysanthemum cultivation map (Figure 6c).
Due to the high accuracy of the 2 m resolution satellite, which contains a lot of detailed information, precise identification can be achieved. Therefore, the 2 m resolution satellite remote sensing images were first divided by town using vector maps, and then supervised classification was performed for each section.
For the 16 m spatial resolution satellite imagery, the entire Sheyang County was directly used for supervised classification. Only the chrysanthemum cultivation concentration area in Yangma Town was separately classified. Identical processing protocols were strictly maintained for both resolutions.

3.5.2. Accuracy Assessment

Following visual confirmation that all UAV-surveyed chrysanthemum plots were accurately classified, we evaluated classification performance using confusion matrices. OA, PA, UA, and Kappa coefficient for chrysanthemum classification are shown in Table 2 and Table S5.
Table 2 and Table S5 revealed that the supervised classification achieved satisfactory accuracy. OA, Kappa coefficient, and PA were stably high across towns and months in Sheyang County. However, UA remained notably lower, sometimes falling below 70%. This indicates that other land cover types were erroneously identified as chrysanthemum cultivation areas, requiring further refinement.

3.5.3. Handling of Confused Objects

To address this limitation, visual interpretation identified spectral confusion with water bodies as the primary error source. Consequently, water masks were applied to the previously intersected classification results.
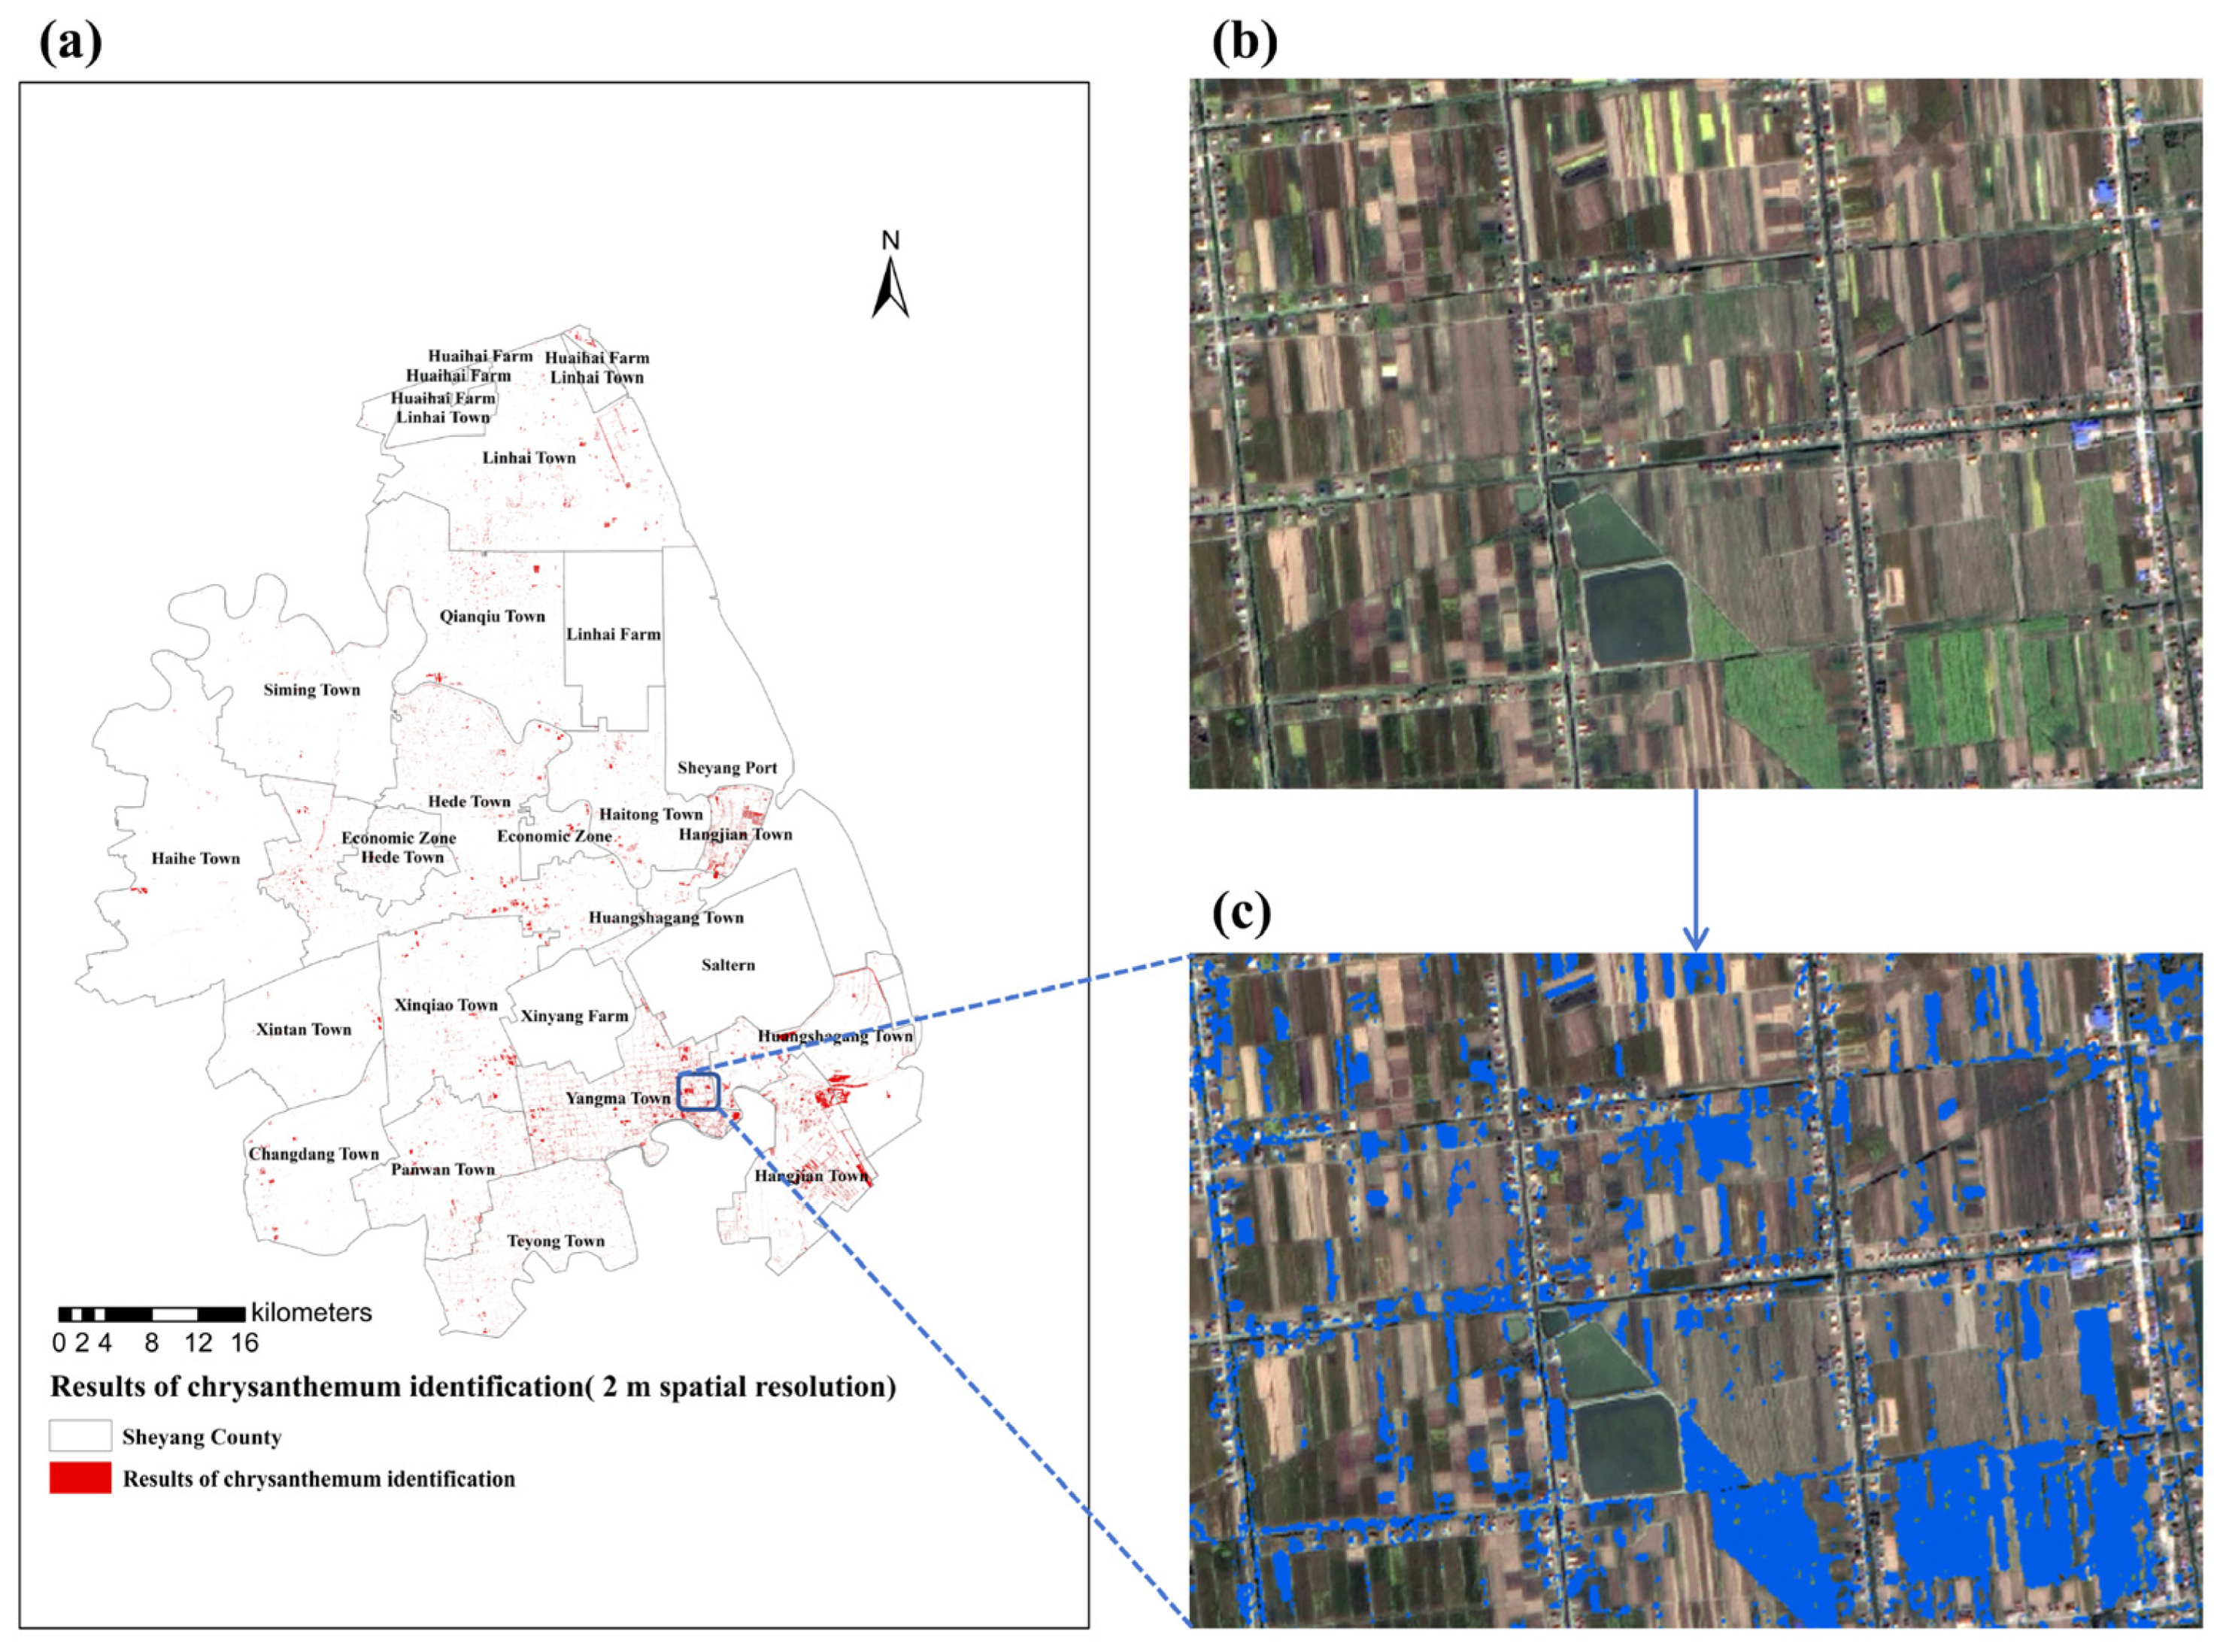
These masks were derived from NIR band thresholds exploiting water’s strong absorption versus vegetation’s high reflectance in NIR wavelengths. This refinement enabled precise removal of misclassified water features from the intersected classification results (Figure S5), yielding a final chrysanthemum cultivation extent of 46,950,343 m2 for Sheyang County. Spatial distribution and statistical results are presented in Table 3 and Figure 7.
Table 3 reveals discrepancies in chrysanthemum area identification between the 2 m and 16 m resolution imagery, as observed in towns such as Xintan, Haihe, and Hede. Visual interpretation and comparative analysis confirmed that these discrepancies primarily stem from inherent classification limitations associated with the 16 m resolution processing across the county. Two distinct error mechanisms were identified: (1) the 16 m resolution satellite data cannot adequately capture small-scale household cultivation, resulting in an underestimation of chrysanthemum area; (2) medium-sized chrysanthemum plots cause entire 16 m × 16 m pixels to be misclassified as chrysanthemum, leading to an overestimation of the actual cultivated area. Consequently, the 2 m resolution satellite remote sensing results should serve as the reference standard.
After calculating chrysanthemum areas from 2021 and 2023, 16 m resolution imagery using identical time-series-based classification post-processing methods, we calibrated the cropland area estimates with township-specific scaling factors derived from 2022 data. The final calibrated areas are presented in Table 4.
According to the calculation results, the chrysanthemum area calculations for different towns at various resolutions are generally similar. Cultivation was predominantly concentrated in southern Sheyang County, such as Yangma Town and Huangjian Town. Validation using georeferenced points from field investigations confirmed that all UAV documented chrysanthemum cultivation plots were fully identified in the supervised classification results of satellite imagery.
To investigate pre-refinement misclassification of chrysanthemum with other land cover types, spatial intersection analysis was performed between: (a) October and November chrysanthemum phase identification results and August cultivated land, (b) non-water-masked results and near-infrared-derived water bodies. The results are shown in Figure S6. The results indicate widespread misclassification across study areas. Post-classification processing reduced CE between chrysanthemum and other cultivated land by approximately 10%. Crucially, confusion between water and chrysanthemum yielded misclassification ratios reaching 40–50%. These findings demonstrate the necessity of post-classification processing for significant accuracy improvement.
The estimated chrysanthemum cultivation areas for all Sheyang County townships (2021–2023) underwent verification by local government and Agriculture and Rural Affairs Bureau officials, receiving confirmation of accuracy. These estimates aligned closely with local records, particularly the locally reported statistical value of approximately 40,020,000 m2. The 2 m resolution classification demonstrated superior accuracy. These results confirm the feasibility of satellite-based remote sensing for chrysanthemum area quantification, enabling accurate regional monitoring of this crop.

4. Discussion

Chrysanthemum cultivation has grown under rural revitalization initiatives due to its economic value and versatile applications. However, severe continuous cropping obstacles resulting from monoculture practices, including soil acidification, phenolic compound accumulation, and microbial dysbiosis, reduce seedling survival, plant height, leaf size, and disease resistance, ultimately compromising product quality and yield sustainability [27,28,29]. Crop rotation is the primary method to address continuous cropping obstacles [30,31]. Consequently, chrysanthemum cultivation plots shift yearly alongside expanding planting areas, while widespread small-scale household plantings increase monitoring complexity. Furthermore, traditional methods estimate total chrysanthemum planting area by dividing the total annual yield by the average yield per unit area. However, scattered plantings cannot be captured in yield statistics, and the processing of externally sourced chrysanthemums in Sheyang County further interferes with the results. Thus, establishing a standardized remote sensing method for universally applicable, timely, and accurate monitoring of chrysanthemum cultivation areas is essential, particularly for dynamic cropping systems with frequent field rotation and fragmented cultivation patterns.
Prior research has yielded novel methodologies and recognition paradigms, such as multimodal UAV data using Deep Neural Networks to enhance soybean yield prediction accuracy and multi-scale superpixel segmentation coupled with synthetic kernels for land use classification [32,33]. While these approaches improve target classification performance, deep learning requires extensive training samples to achieve high accuracy [34].
Even so, sometimes the results of a trained model may not perform well when applied to other locations, which is unacceptable for targets in structurally complex cultivation zones demanding high precision yet prone to spectral confusion with other features, necessitating human-assisted fine-scale identification. Furthermore, current post-classification processing primarily focuses on noise reduction in classified imagery, lacking granular analysis of accuracy metrics, particularly insufficient attention to PA and UA.
This study establishes a standardized remote sensing monitoring method for chrysanthemum cultivation, addressing the lack of timely and reliable area quantification methods. After selecting the optimal classification method, we conducted feature comparison and temporal analysis to extract initial cultivation information, followed by an accuracy assessment. Unlike prior research focusing solely on OA and the kappa coefficient, we specifically analyzed the causes of low UA and implemented targeted refinement through visual interpretation to eliminate confusion between chrysanthemum and other land cover types. For structurally complex plots, our post-classification processing approach enhances error tolerance compared to conventional direct-classification methods that prioritize maximum initial accuracy. This technique imposes no theoretical constraints on time-series length or post-processing complexity. Finally, conversion ratios derived from 2022 different resolution data substantially improved the accuracy and reliability of the 2021 and 2023 chrysanthemum area estimates based on 16 m resolution imagery.
Compared to conventional methods, our approach offers enhanced authenticity and reliability. By leveraging temporal features and visual interpretation, it effectively differentiates chrysanthemums from other land cover types. This methodology is also suitable for other crops displaying two or more distinct spectral characteristics throughout their growth cycles. This study demonstrates considerable feasibility and notable application potential, enabling governmental bodies to obtain accurate cultivation intelligence and validate data reported by farmers or enterprises. This capability could replace traditional reporting systems, effectively preventing false claims and missing reports. Furthermore, it facilitates continuous cropping alerts to reduce pest and disease outbreaks, detects illegal cropland occupation, identifies cultivation clusters, and optimizes processing facility siting.
However, our methodology has several limitations: (1) weather conditions significantly affect results. In regions or years with adverse climates, high cloud coverage causes land cover classification omissions, directly compromising experimental outcomes. More robust time-series analysis methods are needed to reduce dependency on flawless single imagery. (2) Requiring training set development and classification for each image increases workload and introduces unavoidable subjectivity. Future work should explore automated classification workflows with transferable training sets. (3) Results depend heavily on initial classification accuracy. Large scale errors in supervised classification cannot be rectified through post-processing, requiring visual interpretation of every classified image to prevent significant errors. (4) Even at 2 m resolution, mixed pixel issues persist for extremely elongated plots or small chrysanthemum plots that are fragmented and embedded within complex land types. Higher resolution imagery and additional field verification are required for validation.
In this study, we used multispectral satellite data, characterized by its practical 4–10 spectral bands. This data type delivers operational advantages for large-area monitoring through compact data volume and cost-effectiveness. This efficiency significantly accelerates processing workflows. In contrast, hyperspectral imagery provides superior spectral resolution with continuous narrow bands numbering in the hundreds, enabling refined material identification. Such capabilities advance precision in critical applications, including detailed land cover classification and environmental diagnostics. In the future, advancements in satellite remote sensing, including enhanced spatial resolution and shortened revisit cycles, will enable more accessible access to high-quality imagery. Concurrent optimization and innovation in classification methods and transfer learning will significantly improve feature analysis and classification accuracy [35,36]. Furthermore, remote sensing will support predictive monitoring of medicinal crop yield, irrigation management, fertilization management, pest incidence, disease incidence, as well as compound content. These developments will enable rapid extraction and analysis of growth information, support precision management decision-making, and ultimately facilitate real-time, stable, scalable monitoring platforms for medicinal plant resources [37,38].

5. Conclusions

This study presents a satellite remote sensing methodology for monitoring chrysanthemum cultivation areas, delivering technical support for nationwide periodic monitoring of medicinal chrysanthemum industry data. The approach mitigates false claims and missing reports, providing credible foundational data to government agencies, industries, and stakeholders. Moreover, this approach exhibits replicability and scalability for monitoring cultivation areas of medicinal plants that similarly undergo multiple distinct spectral characteristic phases during their growth cycles.
Unlike methods reliant on maximizing single-scene classification accuracy, our time-series-based post-classification processing incorporates targeted visual interpretation to eliminate spectrally similar land cover types. This significantly enhances classification robustness in complex cultivation regions by leveraging temporal spectral signatures to address spectral confusion phenomena. Analysis of UA and quantified misclassification ratios across spectrally similar land cover types confirmed the necessity of post-classification processing. Future research will focus on establishing transferable training sets and developing deep learning-based automated time-series classification workflows, extending methodological generalizability to other crops, implementing advanced classifiers to improve recognition precision and accuracy, and acquiring higher-resolution imagery for classification validation and scaling factor calibration.

Supplementary Materials

The following supporting information can be downloaded at https://www.mdpi.com/article/10.3390/horticulturae11080933/s1, Figure S1. Parameter settings for radiometric calibration, atmospheric correction, and orthometric correction; Figure S2. Parameter configurations for unsupervised classification in ENVI; Figure S3. Parameter configurations for unsupervised classification in ENVI; Figure S4. Detailed view of vegetation indices results derived from remote sensing imagery; Figure S5. Targeted refinement of confused features (water bodies); Figure S6. Proportion of land cover types confused with chrysanthemums; Table S1. The local cropping system in Yancheng city; Table S2. Remote sensing data collection dates; Table S3. Spectral bands for NDVI calculation and NIR extraction across satellite systems; Table S4. Classification accuracy of various land cover types for different supervised classification methods in Yangma Town in November; Table S5. Accuracy evaluation results for 16 m spatial resolution in Sheyang County.

Author Contributions

Y.Y.: conceptualization, data curation, formal analysis, investigation, methodology, validation, writing —original draft, writing—review and editing. M.-T.W.: methodology. C.-J.P.: conceptualization, supervision, writing—review and editing. J.-M.C.: methodology, writing—review and editing. Z.-X.J.: conceptualization, data curation, methodology. T.-T.S.: data curation, writing—review and editing. X.-B.Z.: conceptualization, data curation, writing—review and editing. H.Y.: conceptualization, funding acquisition, investigation, methodology, supervision, writing—review and editing. All authors have read and agreed to the published version of the manuscript.

Funding

This research was funded by the China Academy of Chinese Medical Sciences (Grant number: ZYZX-2023-KY-087); Earmarked Fund for China Agriculture Research System (Grant number: CARS-21); Innovation Team and Talents Cultivation Program of National Administration of Traditional Chinese Medicine (Grant number: ZYYCXTD-D-202005); Jiangsu Province 333 High-level Talents Training Project; Jiangsu Province Qing Lan Project.

Data Availability Statement

The original contributions presented in this study are included in the article/Supplementary Materials. Further inquiries can be directed to the corresponding authors.

Acknowledgments

Thanks to Yan-Qiu Shen, Xiu-Mei Liu, Xiao-Dong Sun, and Gen-Lin Ji from the Yangma Town People’s Government of Sheyang County for their field support and provision of local agricultural data.

Conflicts of Interest

The authors declare no conflicts of interest.

Abbreviations

The following abbreviations are used in this manuscript:
CECommission Errors
CIgreenGreen Chlorophyll Index
EVI2Enhanced Vegetation Index 2
GNDVIGreen Normalized Difference Vegetation Index
MaDCMahalanobis Distance classification
MDCMinimum Distance classification
MLCMaximum Likelihood classification
NDVINormalized Difference Vegetation Index
NNCNeural Network classification
OAOverall Accuracy
OEOmission Errors
PAProducer’s Accuracy
PCParallelepiped classification
SRSimple Ratio
SVMSupport Vector Machine classification
UAVunmanned aerial vehicle
VIsVegetation indices

References

  1. Zhang, Z.J.; Hu, W.J.; Yu, A.Q.; Wu, L.H.; Yang, D.Q.; Kuang, H.X.; Wang, M. Review of polysaccharides from Chrysanthemum morifolium Ramat.: Extraction, purification, structural characteristics, health benefits, structural-activity relationships and applications. Int. J. Biol. Macromol. 2024, 278 Pt 3, 134919. [Google Scholar] [CrossRef]
  2. Yuan, H.W.; Jiang, S.; Liu, Y.; Daniyal, M.; Jian, Y.Q.; Peng, C.Y.; Shen, J.L.; Liu, S.F.; Wang, W. The flower head of Chrysanthemum morifolium Ramat. (Juhua): A paradigm of flowers serving as Chinese dietary herbal medicine. J. Ethnopharmacol. 2020, 261, 113043. [Google Scholar] [CrossRef]
  3. Hao, N.; Gao, X.; Zhao, Q.; Miao, P.Q.; Cheng, J.W.; Li, Z.; Liu, C.Q.; Li, W.L. Rapid origin identification of chrysanthemum morifolium using laser-induced breakdown spectroscopy and chemometrics. Postharvest Biol. Technol. 2023, 197, 112226. [Google Scholar] [CrossRef]
  4. Laban, N.; Abdellatif, B.; Ebeid, H.M.; Shedeed, H.A.; Tolba, M.F. Seasonal Multi-temporal Pixel Based Crop Types and Land Cover Classification for Satellite Images Vsing Convolutional Neural Networks. In Proceedings of the 2018 13th International Conference on Computer Engineering and Systems (ICCES), Cairo, Egypt, 18–19 December 2018; pp. 21–26. [Google Scholar] [CrossRef]
  5. Bazzi, H.; Baghdadi, N.; El Hajj, M.; Zribi, M.; Minh, D.H.T.; Ndikumana, E.; Courault, D.; Belhouchette, H. Mapping Paddy Rice Using Sentinel-1 SAR Time Series in Camargue, France. Remote Sens. 2019, 11, 887. [Google Scholar] [CrossRef]
  6. Hong, D.; Yokoya, N.; Xia, G.S.; Chanussot, J.; Zhu, X.X. X-ModalNet: A semi-supervised deep cross-modal network for classification of remote sensing data. ISPRS J. Photogramm. Remote Sens. 2020, 167, 12–23. [Google Scholar] [CrossRef]
  7. Ló, T.B.; Corrêa, U.B.; Araújo, R.M.; Johann, J.A. Temporal convolutional neural network for land use and land cover classification using satellite images time series. Arab. J. Geosci. 2023, 16, 585. [Google Scholar] [CrossRef]
  8. Kikaki, K.; Kakogeorgiou, L.; Mikeli, P.; Raitsos, D.E.; Karantzalos, K. MARIDA: A benchmark for Marine Debris detection from Sentinel-2 remote sensing data. PLoS ONE 2022, 17, e0262247. [Google Scholar] [CrossRef]
  9. Munawar, H.S.; Hammad, A.W.A.; Waller, S.T. Remote Sensing Methods for Flood Prediction: A Review. Sensors 2022, 22, 960. [Google Scholar] [CrossRef] [PubMed]
  10. Wang, H.; Chang, W.; Yao, Y.; Yao, Z.Y.; Zhao, Y.Y.; Li, S.M.; Liu, Z.; Zhang, X.D. Cropformer: A new generalized deep learning classification approach for multi-scenario crop classification. Front. Plant Sci. 2023, 14, 1130659. [Google Scholar] [CrossRef] [PubMed]
  11. Aziz, G.; Minallah, N.; Saeed, A.; Frnda, J.; Khan, W. Remote sensing based forest cover classification using machine learning. Sci. Rep. 2024, 14, 69. [Google Scholar] [CrossRef] [PubMed]
  12. Kasampalis, D.A.; Alexandridis, T.K.; Deva, C.; Challinor, A.; Moshou, D.; Zalidis, G. Contribution of remote sensing on crop models: A review. J. Imaging 2018, 4, 52. [Google Scholar] [CrossRef]
  13. Zhang, R.; Zhang, M.; Yan, Y.; Chen, Y.; Jiang, L.L.; Wei, X.X.; Zhang, X.B.; Li, H.T.; Li, M.H. Promoting the Development of Astragalus mongholicus Bunge Industry in Guyang County (China) Based on MaxEnt and Remote Sensing. Front. Plant Sci. 2022, 13, 908114. [Google Scholar] [CrossRef] [PubMed]
  14. Wang, J.; Wei, X.; Sun, S.; Li, M.; Shi, T.; Zhang, X. Assessment of Carbon Sequestration Capacity of E. ulmoides in Ruyang County and Its Ecological Suitability Zoning Based on Satellite Images of GF-6. Sensors 2023, 23, 7895. [Google Scholar] [CrossRef] [PubMed]
  15. Shi, T.T.; Zhang, X.B.; Guo, L.P.; Jing, Z.X.; Huang, L.Q. Research on remote sensing recognition of wild planted Lonicera japonica based on deep convolutional neural network. China J. Chin. Mater. Medica 2020, 45, 5658–5662. [Google Scholar] [CrossRef]
  16. Wu, B.F.; Zhang, M.; Zeng, H.W.; Tian, F.Y.; Potgieter, A.B.; Qin, X.L.; Yan, N.N.; Chang, S.; Zhao, Y.; Dong, Q.H.; et al. Challenges and opportunities in remote sensing-based crop monitoring: A review. Natl. Sci. Rev. 2023, 10, nwac290. [Google Scholar] [CrossRef]
  17. Qian, Y.; Yang, Z.; Di, L.; Rahman, M.S.; Tan, Z.; Xue, L.; Gao, F.; Yu, E.G.; Zhang, X. Crop Growth Condition Assessment at County Scale Based on Heat-Aligned Growth Stages. Remote Sens. 2019, 11, 2439. [Google Scholar] [CrossRef]
  18. Meroni, M.; d’Andrimont, R.; Vrieling, A.; Fasbender, D.; Lemoine, G.; Rembold, F.; Seguini, L.; Verhegghen, A. Comparing land surface phenology of major European crops as derived from SAR and multispectral data of Sentinel-1 and-2. Remote Sens. Environ. 2021, 253, 112232. [Google Scholar] [CrossRef]
  19. Jewan, S.Y.Y.; Singh, A.; Billa, L.; Sparkes, D.; Murchie, E.; Gautam, D.; Cogato, A.; Pagay, V. Can Multi-Temporal Vegetation Indices and Machine Learning Algorithms Be Used for Estimation of Groundnut Canopy State Variables? Horticulturae 2024, 10, 748. [Google Scholar] [CrossRef]
  20. Hartigan, J.A.; Wong, M.A. Algorithm AS 136: A K-means clustering algorithm. J. R. Stat. Soc. (Appl. Stat.) 1979, 28, 100–108. [Google Scholar] [CrossRef]
  21. Krishna, K.; Murty, M.N. Genetic K-means algorithm. IEEE Trans. Syst. Man Cybern. Part B Cybern. 1999, 29, 433–439. [Google Scholar] [CrossRef]
  22. Zeng, L.; Li, T.B.; Huang, H.T.; Zeng, P.; He, Y.X.; Jing, L.H.; Yang, Y.; Jiao, S.T. Identifying Emeishan basalt by supervised learning with Landsat-5 and ASTER data. Front. Earth Sci. 2023, 10, 1097778. [Google Scholar] [CrossRef]
  23. Escobar-Flores, J.G.; Sandoval, S.; Gámiz-Romero, E. Unmanned aerial vehicle images in the machine learning for agave detection. Environ. Sci. Pollut. Res. Int. 2022, 29, 61662–61673. [Google Scholar] [CrossRef] [PubMed]
  24. Elfarra, F.G.; Calin, M.A.; Parasca, S.V. Computer-aided detection of bone metastasis in bone scintigraphy images using parallelepiped classification method. Ann. Nucl. Med. 2019, 33, 866–874. [Google Scholar] [CrossRef] [PubMed]
  25. Yang, X.C.; Qin, Q.M.; Grussenmeyer, P.; Koehl, M. Urban surface water body detection with suppressed built-up noise based on water indices from Sentinel-2 MSI imagery. Remote Sens. Environ. 2018, 219, 259–270. [Google Scholar] [CrossRef]
  26. Qazi, U.K.; Ahmad, I.; Minallah, N.; Zeeshan, M. Classification of tobacco using remote sensing and deep learning techniques. Agron. J. 2023, 116, 839–847. [Google Scholar] [CrossRef]
  27. Song, A.; Zhao, S.; Chen, S.; Jiang, J.F.; Chen, S.M.; Li, H.Y.; Chen, Y.; Chen, X.; Fang, W.M.; Chen, F.D. The abundance and diversity of soil fungi in continuously monocropped chrysanthemum. Sci. World J. 2013, 2013, 632920. [Google Scholar] [CrossRef]
  28. Wang, T.; Yang, K.; Ma, Q.; Jiang, X.; Zhou, Y.Q.; Kong, D.L.; Wang, Z.Y.; Parales, R.E.; Li, L.; Zhao, X. Rhizosphere Microbial Community Diversity and Function Analysis of Cut Chrysanthemum During Continuous Monocropping. Front. Microbiol. 2022, 13, 801546. [Google Scholar] [CrossRef]
  29. Wu, C.; Peng, J.; Song, T. An Integrated Investigation of the Relationship between Two Soil Microbial Communities (Bacteria and Fungi) and Chrysanthemum Zawadskii (Herb.) Tzvel. Wilt Disease. Microorganisms 2024, 12, 337. [Google Scholar] [CrossRef]
  30. Xiao, X.; Zhu, W.; Du, C.; Shi, Y.D.; Wang, J.F. Effects of crop rotation and bio-organic manure on soil microbial characteristics of Chrysanthemum cropping system. Ying Yong Sheng Tai Xue Bao 2015, 26, 1779–1784. [Google Scholar] [CrossRef]
  31. Liu, D.H.; Liao, Z.Y.; Liu, Q.; Bao, W.Z.; Jiang, J.Y.; Wang, M.H.; Miao, Y.H.; Ma, Y.P.; Bao, J.F. Ecological planting mode of “one cultivation, two changes and three adjustments” of Fubaiju in Macheng. Biot. Resour. 2022, 44, 484–491. [Google Scholar] [CrossRef]
  32. Maitiniyazi, M.; Sagan, V.; Sidike, P.; Hartling, S.; Esposito, F.; Fritschi, F.B. Soybean yield prediction from UAV using multimodal data fusion and deep learning. Remote Sens. Environ. 2020, 237, 111599. [Google Scholar] [CrossRef]
  33. Wang, H.; Li, W.W.; Huang, W.; Niu, J.Q.; Nie, K. Research on land use classification of hyperspectral images based on multiscale superpixels. Math. Biosci. Eng. 2020, 17, 5099–5119. [Google Scholar] [CrossRef]
  34. Xu, J.F.; Zhu, Y.; Zhong, R.H.; Lin, Z.X.; Xu, J.L.; Jiang, H.; Huang, J.F.; Li, H.F.; Lin, T. DeepCropMapping: A multi-temporal deep learning approach with improved spatial generalizability for dynamic corn and soybean mapping. Remote Sens. Environ. 2020, 247, 111946. [Google Scholar] [CrossRef]
  35. Potgieter, A.B.; Zhao, Y.; Zarco-Tejada, P.J.; Chenu, K.; Zhang, Y.F.; Porker, K.; Biddulph, B.; Dang, Y.P.; Neale, T.; Roosta, F.; et al. Evolution and application of digital technologies to predict crop type and crop phenology in agriculture. Silico Plants 2021, 3, diab017. [Google Scholar] [CrossRef]
  36. Gu, C.; Liang, J.; Liu, X.Y.; Sun, B.Y.; Sun, T.S.; Yu, J.G.; Sun, C.X.; Wan, H.W.; Gao, J.X. Application and prospects of hyperspectral remote sensing in monitoring plant diversity in grassland. Chin. J. Appl. Ecol. 2024, 35, 1397–1407. [Google Scholar] [CrossRef]
  37. Guo, J.X.; Zhang, M.X.; Wang, C.C.; Zhang, R.; Shi, T.T.; Wang, X.Y.; Zhang, X.B.; Li, M.H. Application of remote sensing technology in medicinal plant resources. China J. Chin. Mater. Medica 2021, 46, 4689–4696. [Google Scholar] [CrossRef]
  38. Futerman, S.I.; Laor, Y.; Eshel, G.; Cohen, Y. The potential of remote sensing of cover crops to benefit sustainable and precision fertilization. Sci. Total Environ. 2023, 891, 164630. [Google Scholar] [CrossRef]
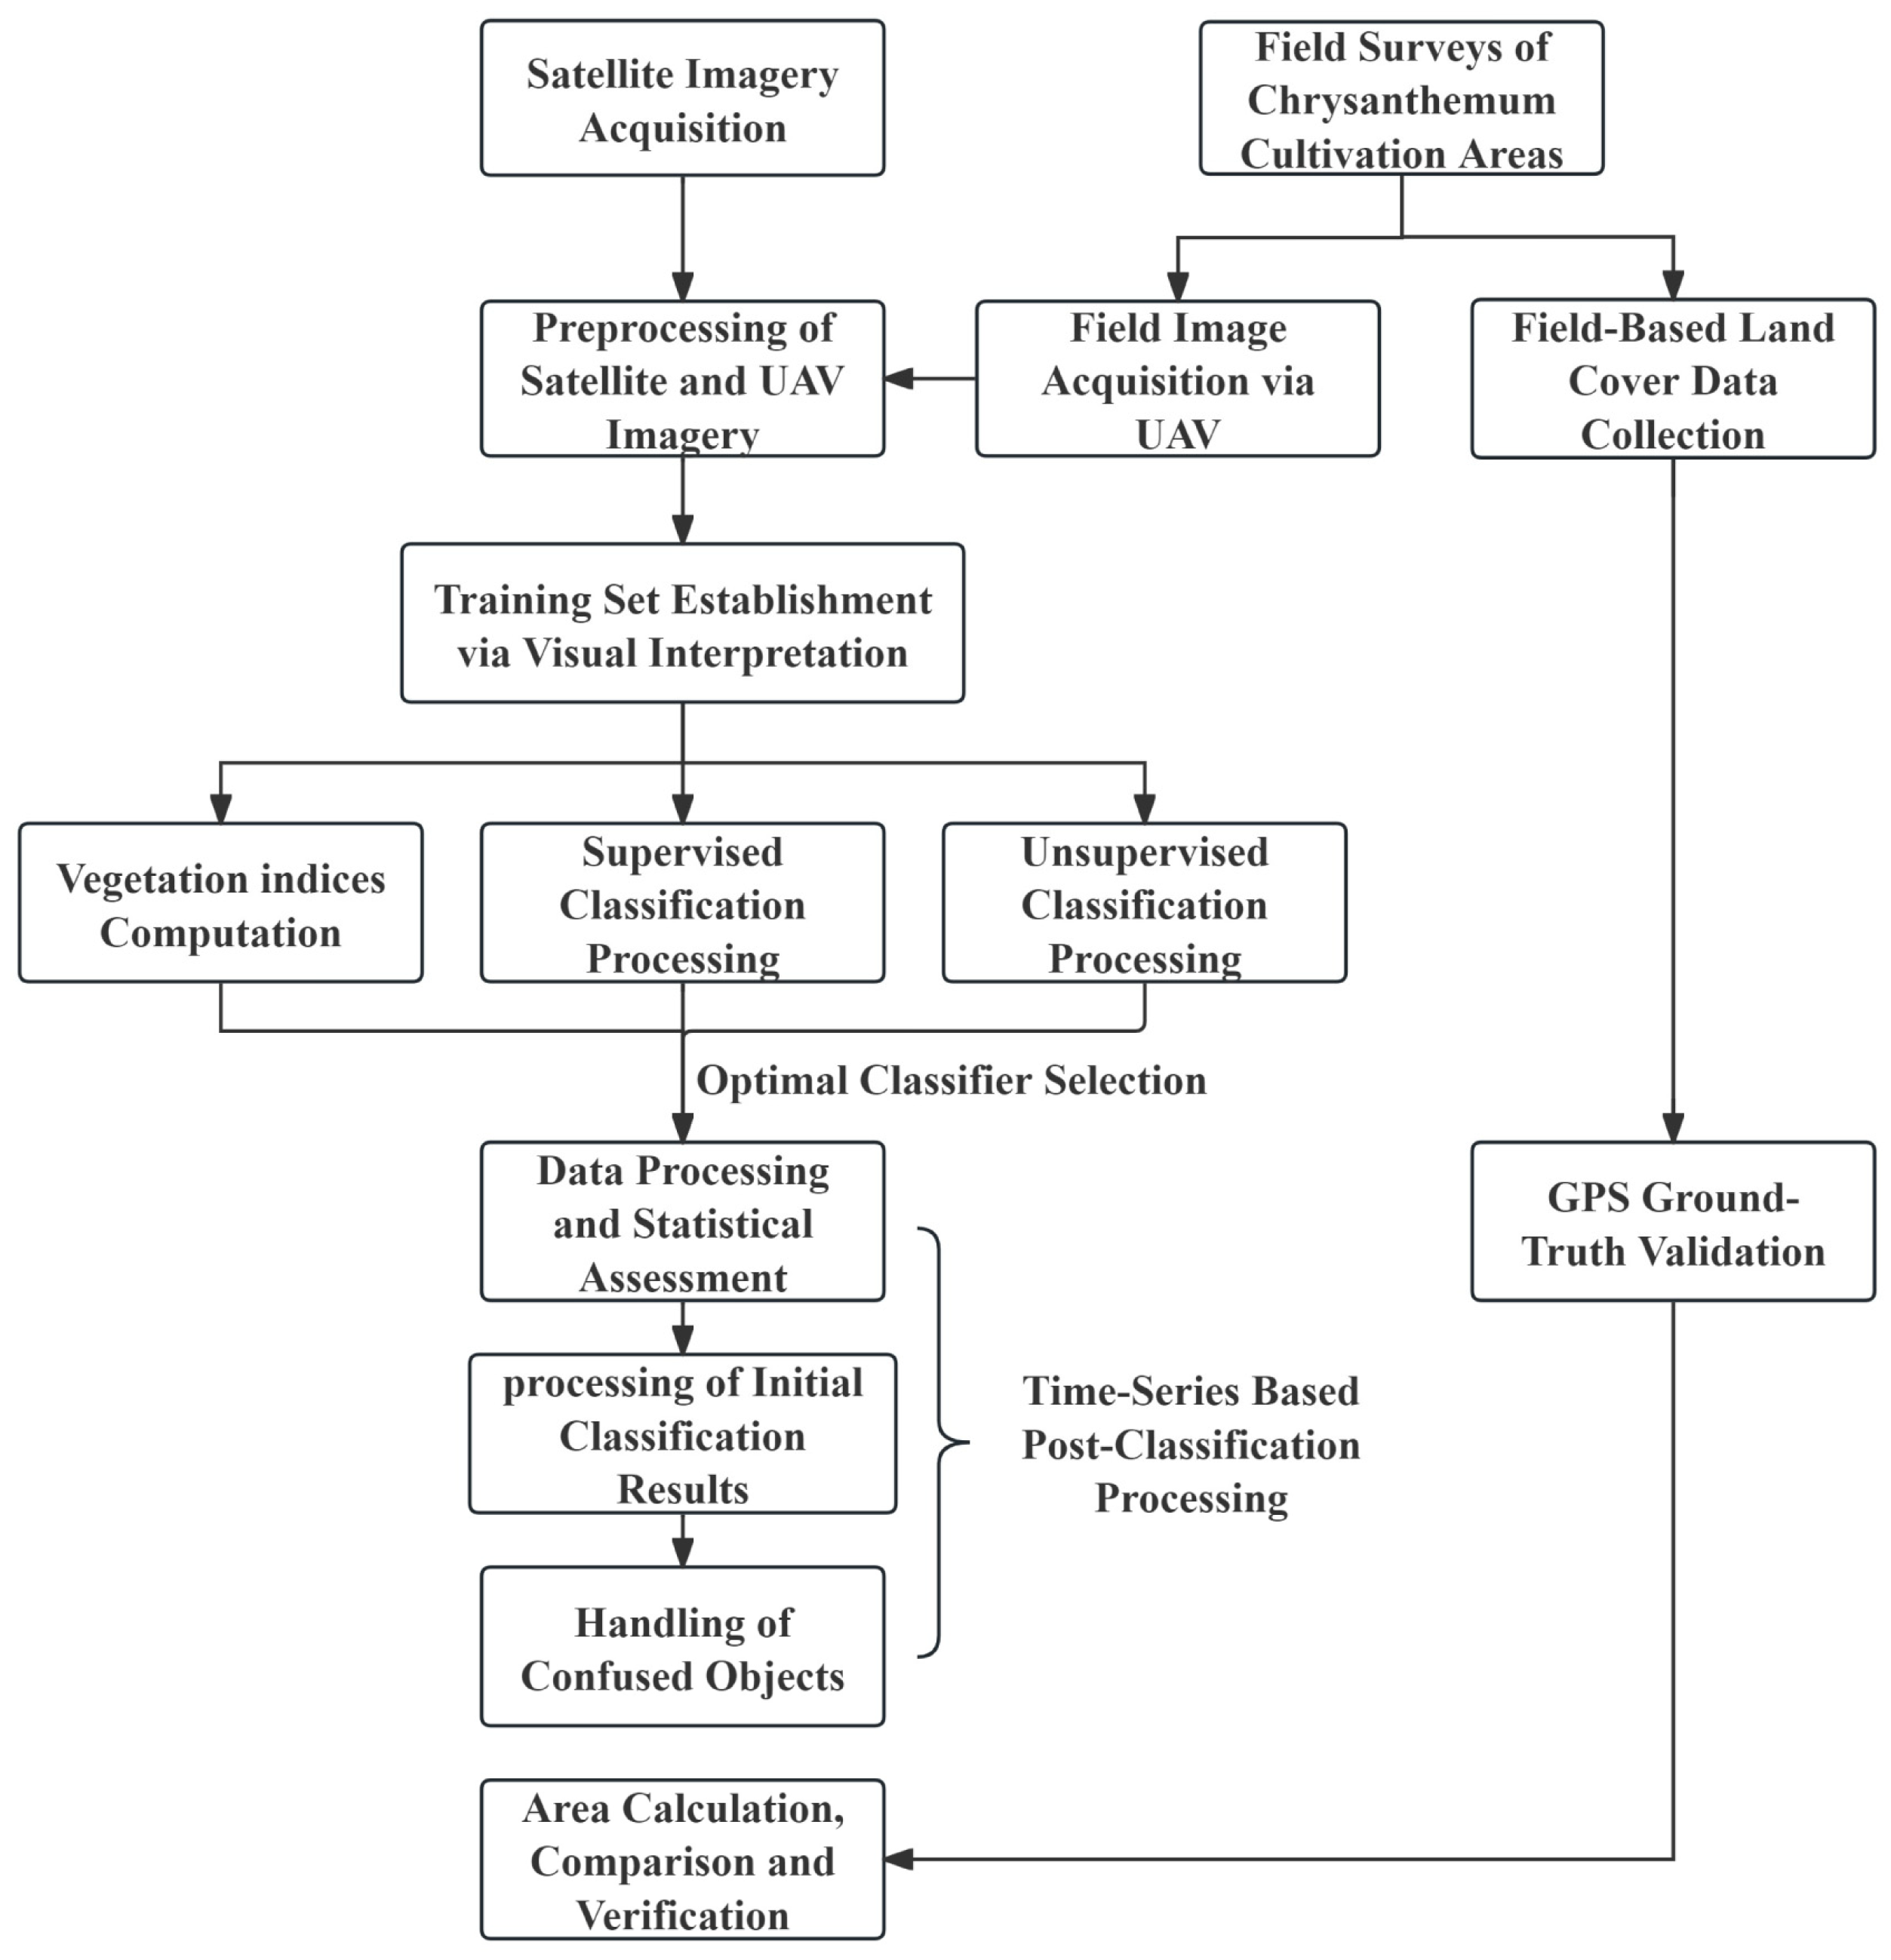
Figure 1. Flowchart of the chrysanthemum area monitoring methodology.
Horticulturae 11 00933 g001
Figure 2. Drone data collection locations and sample images from the UAV survey in Sheyang County. (a) The location of drone survey in Sheyang County; (b) images of some of the sample plots taken by drones. In the figure, chrysanthemum is marked with red rectangles, soybean with yellow, river with orange, bare soil with blue, and buildings with black.
Horticulturae 11 00933 g002
Figure 3. Satellite remote sensing images of the same plot at different times. The remote sensing images were acquired on 12 August (16 m spatial resolution) (a); 17 September (16 m spatial resolution) (b); 15 October (16 m spatial resolution) (c); 21 October (16 m spatial resolution) (d); 6 November (16 m spatial resolution) (e); 19 October (2 m spatial resolution) (f).
Horticulturae 11 00933 g003
Figure 4. Unsupervised classification results for Sheyang County. (a) Original satellite image; (b) result processed by IsoDate classification; (c) ISODATA classification result with 10 classes; (d) ISODATA classification result with 21 classes.
Horticulturae 11 00933 g004
Figure 5. Results of different supervised classification methods for Yangma Town in November. (Red represents chrysanthemums, green represents cultivated land, yellow represents bare land, blue represents rivers, and reddish-brown represents other land cover types). (a) Result processed by MLC; (b) result processed by NNC; (c) result processed by MaDC; (d) result processed by MDC; (e) result processed by SVM; (f) result processed by PC; (g) remote sensing original image.
Horticulturae 11 00933 g005
Figure 6. Extraction results of potential chrysanthemum cultivation plots in the early stages, blooming period extraction results, and intersection results. (a) Bare land and green land extraction results in August; (b) overlay of chrysanthemum extraction results for October and November; (c) intersection of (a,b).
Horticulturae 11 00933 g006
Figure 7. Results of chrysanthemum identification in Sheyang County using 2 m spatial resolution remote sensing images and local enlarged view. (a) Results of chrysanthemum identification; (b) remote sensing original image; (c) schematic diagram of the locally enlarged results.
Horticulturae 11 00933 g007
Table 1. Classification accuracy and processing time of different supervised classification methods for Yangma Town.
Classification MethodsOverall Accuracy (OA)/%Kappa CoefficientProducer’s Accuracy (PA)/%User’s Accuracy (UA)/%Chrysanthemum Area with 2 m Spatial Resolution/m2Processing Time for 2 m Spatial Resolution Imagery/sProcessing Time for 16 m Spatial Resolution Imagery/s
Maximum Likelihood Classification (MLC)95.450.9497.999.71685,579.03372
Neural Network Classification (NNC)95.340.9397.595.172,697,192.589192226
Mahalanobis Distance Classification (MaDC)91.680.8888.7299.68392,595.25371
Parallelepiped Classification (PC)88.850.8490.0156.665,699,213.42121
Minimum Distance Classification (MDC)85.870.8060.02100102,925.11131
Support Vector Machine Classification (SVM)97.550.9799.0299.48707,741.6920,2768
Table 2. Accuracy evaluation results for 2 m spatial resolution in Sheyang County.
RegionsMonthOA/%KappaPA/%UA/%
Linhai TownAugust99.340.9997.9489.15
September97.480.9698.8868.10
October88.950.8493.4853.50
November93.800.9198.1619.99
Yangma TownAugust86.920.8296.1291.99
October96.250.9596.7098.08
November96.010.9497.78100.00
Huangjian TownAugust92.000.8896.9393.01
October96.400.9496.3060.69
November88.140.8397.2019.43
Teyong TownAugust94.620.9265.1488.95
October95.370.9162.6774.04
November94.990.9295.96100.00
Hede TownAugust87.150.8195.4784.93
September97.770.9799.9856.75
October91.860.8366.2851.94
November98.590.9887.8346.26
Huangshagang TownAugust90.920.8698.3774.42
October98.220.9783.5192.60
November89.200.82100.0097.18
Haitong TownAugust93.480.8896.0290.77
October96.050.9486.1929.53
November93.510.8995.8017.94
Xinqiao Town, Panwan TownAugust96.610.9592.2555.15
October93.980.8786.3757.65
November87.580.8193.9731.84
Changdang TownAugust91.340.8799.2697.85
September96.400.9499.5365.02
October97.840.9299.2335.22
November97.620.9692.3025.03
Xintan Town, Haihe Town, Siming TownAugust88.170.8398.5789.71
October92.840.8985.8374.62
November93.690.8991.6144.48
Qianqiu TownAugust97.970.9799.1799.75
October89.350.8085.3220.04
November91.200.8684.5540.49
Table 3. Calculated chrysanthemum cultivation areas and scaling factors by township in Sheyang County for year 2022.
RegionsChrysanthemum Area with 2 m Spatial Resolution/m2Chrysanthemum Area with 16 m Spatial Resolution/m2Conversion Ratio/%
Linhai Town2,592,552.132,776,735.7393.37
Yangma Town10,603,930.939,956,659.343106.50
Huangjian Town9,244,783.375,358,070.392172.54
Teyong Town2,342,952.753,237,189.98372.38
Hede Town7,214,260.954,050,060.313178.13
Huangshagang Town3,478,411.903,221,309.184107.98
Haitong Town1,307,883.312,880,202.8445.41
Xinqiao Town, Panwan Town5,085,690.695,072,248.433100.27
Changdang Town1,066,312.372,053,597.2151.92
Xintan Town, Haihe Town, Siming Town1,613,960.995,390,912.3429.94
Qianqiu Town2,399,604.052,335,552.518102.74
Total46,950,343.4446,332,538.29/
Table 4. Chrysanthemum area in Sheyang County for years 2021 and 2023.
RegionsArea Before Conversion in 2021/m2Area After Conversion in 2021/m2Area Before Conversion in 2023/m2Area After Conversion in 2023/m2
Linhai Town3,207,711.59 2,994,940.94 3,267,248.00 3,050,528.24
Yangma Town8,438,880.70 8,987,483.15 11,338,732.64 12,075,851.31
Huangjian Town3,872,972.99 6,682,404.98 1,706,032.06 2,943,577.75
Teyong Town2,466,405.83 1,785,089.03 4,103,990.97 2,970,309.74
Hede Town4,530,806.73 8,070,601.30 5,689,998.01 10,135,436.83
Huangshagang Town1,225,233.69 1,323,023.40 2,108,460.24 2,276,743.02
Haitong Town2,051,333.97 931,498.79 1,776,734.57 806,804.80
Xinqiao Town, Panwan Town3,437,713.15 3,446,823.63 7,506,761.21 7,526,655.31
Changdang Town1,143,205.88 593,599.64 1,368,774.40 710,724.13
Xintan Town, Haihe Town, Siming Town4,553,457.80 1,363,239.24 7,495,043.56 2,243,907.36
Qianqiu Town2,226,428.92 2,287,487.79 2,729,306.55 2,804,156.62
Total37,154,151.24 38,466,191.89 49,091,082.22 47,546,718.12
Disclaimer/Publisher’s Note: The statements, opinions and data contained in all publications are solely those of the individual author(s) and contributor(s) and not of MDPI and/or the editor(s). MDPI and/or the editor(s) disclaim responsibility for any injury to people or property resulting from any ideas, methods, instructions or products referred to in the content.