Article

Effect of Biostimulant Applications on Eco-Physiological Traits, Yield, and Fruit Quality of Two Raspberry Cultivars

by
Francesco Giovanelli
*,
Cristian Silvestri
and
Valerio Cristofori
*
Department of Agriculture and Forest Sciences (DAFNE), University of Tuscia, 01100 Viterbo, Italy
*
Authors to whom correspondence should be addressed.
Horticulturae 2025, 11(8), 906; https://doi.org/10.3390/horticulturae11080906 (registering DOI)
Submission received: 30 June 2025 / Revised: 21 July 2025 / Accepted: 24 July 2025 / Published: 4 August 2025
(This article belongs to the Section Fruit Production Systems)

Abstract

Enhancing the yield and qualitative traits of horticultural crops without further hampering the environment constitutes an urgent challenge that could be addressed by implementing innovative agronomic tools, such as plant biostimulants. This study investigated the effects of three commercial biostimulants—BIO1 (fulvic/humic acids), BIO2 (leonardite-humic acids), and BIO3 (plant-based extracts)—on leaf ecophysiology, yield, and fruit quality in two raspberry cultivars, ‘Autumn Bliss’ (AB) and ‘Zeva’ (Z), grown in an open-field context, to assess their effectiveness in raspberry cultivation. Experimental activities involved two Research Years (RYs), namely, year 2023 (RY 1) and 2024 (RY 2). Leaf parameters such as chlorophyll, flavonols, anthocyanins, and the Nitrogen Balance Index (NBI) were predominantly influenced by the interaction between Treatment, Year and Cultivar factors, indicating context-dependent responses rather than direct biostimulant effects. BIO2 showed a tendency to increase yield (g plant−1) and berry number plant−1, particularly in RY 2 (417.50 g plant−1, +33.93% vs. control). Fruit quality responses were cultivar and time-specific: BIO3 improved soluble solid content in AB (12.8 °Brix, RY 2, Intermediate Harvest) and Z (11.43 °Brix, +13.91% vs. BIO2). BIO2 reduced titratable acidity in AB (3.12 g L−1) and increased pH in Z (3.02, RY 2) but also decreased °Brix in Z. These findings highlight the potential of biostimulants to modulate raspberry physiology and productivity but underscore the critical role of cultivar, environmental conditions, and specific biostimulant composition in determining the outcomes, which were found to critically depend on tailored application strategies.

1. Introduction

Researchers and stakeholders dealing with agriculture in its broadest sense are called to a common, challenging effort: improving the sector’s overall sustainability in order to mitigate the phenomenon of global warming and its deleterious effects, without hampering crops’ yields and quality traits, therefore assuring food security to a worldwide population that is estimated to reach 10 billion by 2050 [1].
In this complex scenario, crops that enrich and contribute to the variability of the human diet, while not representing a primary source of food, must not be left behind. Accordingly, crops like raspberries are widely recognized as beneficial for the human health thanks to their intrinsic content in terms of bioactive compounds such as polyphenols, flavonols, and anthocyanins [2,3], in addition to being highly appreciated by consumers for their sweet and aromatic taste, mainly related to sugars, organic acids, and secondary metabolism molecules [4].
Looking at land use for raspberry cultivation, the Russian Federation, Poland, and Serbia were recorded to be the top three countries worldwide in the year 2023, with, respectively, 31.006, 21.400, and 19.016 hectares devoted to this crop [5]. From a yield standpoint, Portugal, Mexico, and Switzerland were recorded to be the first, second, and third biggest countries, as of the year 2023 [5]. These data suggest that large acreages do not necessarily translate into higher yields, and, therefore, there might be room for improvement and innovation within the raspberry cultivation sector.
Plant biostimulants represent an innovative and environmentally friendly typology of products that are able to favour plants in enhancing their eco-physiological development and agronomic behaviour, as well as fostering higher yields and improvements in the qualitative profile of the produce [6]. However, their wide heterogeneity in terms of origin and composition has posed a challenge among researchers and lawmakers in defining and categorizing them, resulting in an ongoing sequence of different proposals [7,8,9]. Despite this, biostimulants represent a growingly popular choice among farmers as they are usually based on an organic matrix (humic substances, seaweeds, microorganisms, and plant-based hydrolysed proteins, etc.), thus making them suitable for environmentally friendly and cost-effective agricultural systems [10]. In spite of their versatility, however, research concerning plant biostimulants hardly ever investigated their effect in the context of raspberry cultivation: this assumption is further validated by the existing literature regarding biostimulant usage in berry cultivation [11], where very few studies on this matter are reported [12,13]. More in-depth research within the scientific literature demonstrates how only a handful of studies were carried out to assess the impact of biostimulants on raspberry cultivation and quality, as well as their possible role in fortifying tolerance towards abiotic stresses, such as drought and heat [14,15,16,17]. Among these, a remarkable improvement in terms of yield (+42.1%) was reported by Kazakov et al. upon the administration of an Ascophyllum nodosum-based extract [14]. Quality-wise, Drobek et al. tested a selection of microbial biostimulants on three raspberry cultivars, throughout two growing seasons, and witnessed a qualitative improvement of the produce, also highlighting a season- and cultivar-specific response to treatments [15]. However, many typologies of biostimulants, such as fulvic/humic acids and plant-based protein hydrolysates, still have not been assessed in raspberry cultivation. This lack of scientific material calls for studies aimed at better investigating the feasibility of implementing these novel resources within raspberry cultivation systems.
The study presented in this work aimed at seeking innovation in open-field raspberry cultivation and was developed around the following hypothesis: biostimulants can positively impact raspberry cultivation in terms of yield and quality, through their alleged properties in triggering specific eco-physiological responses and altering resource allocation dynamics at plant level.

2. Materials and Methods

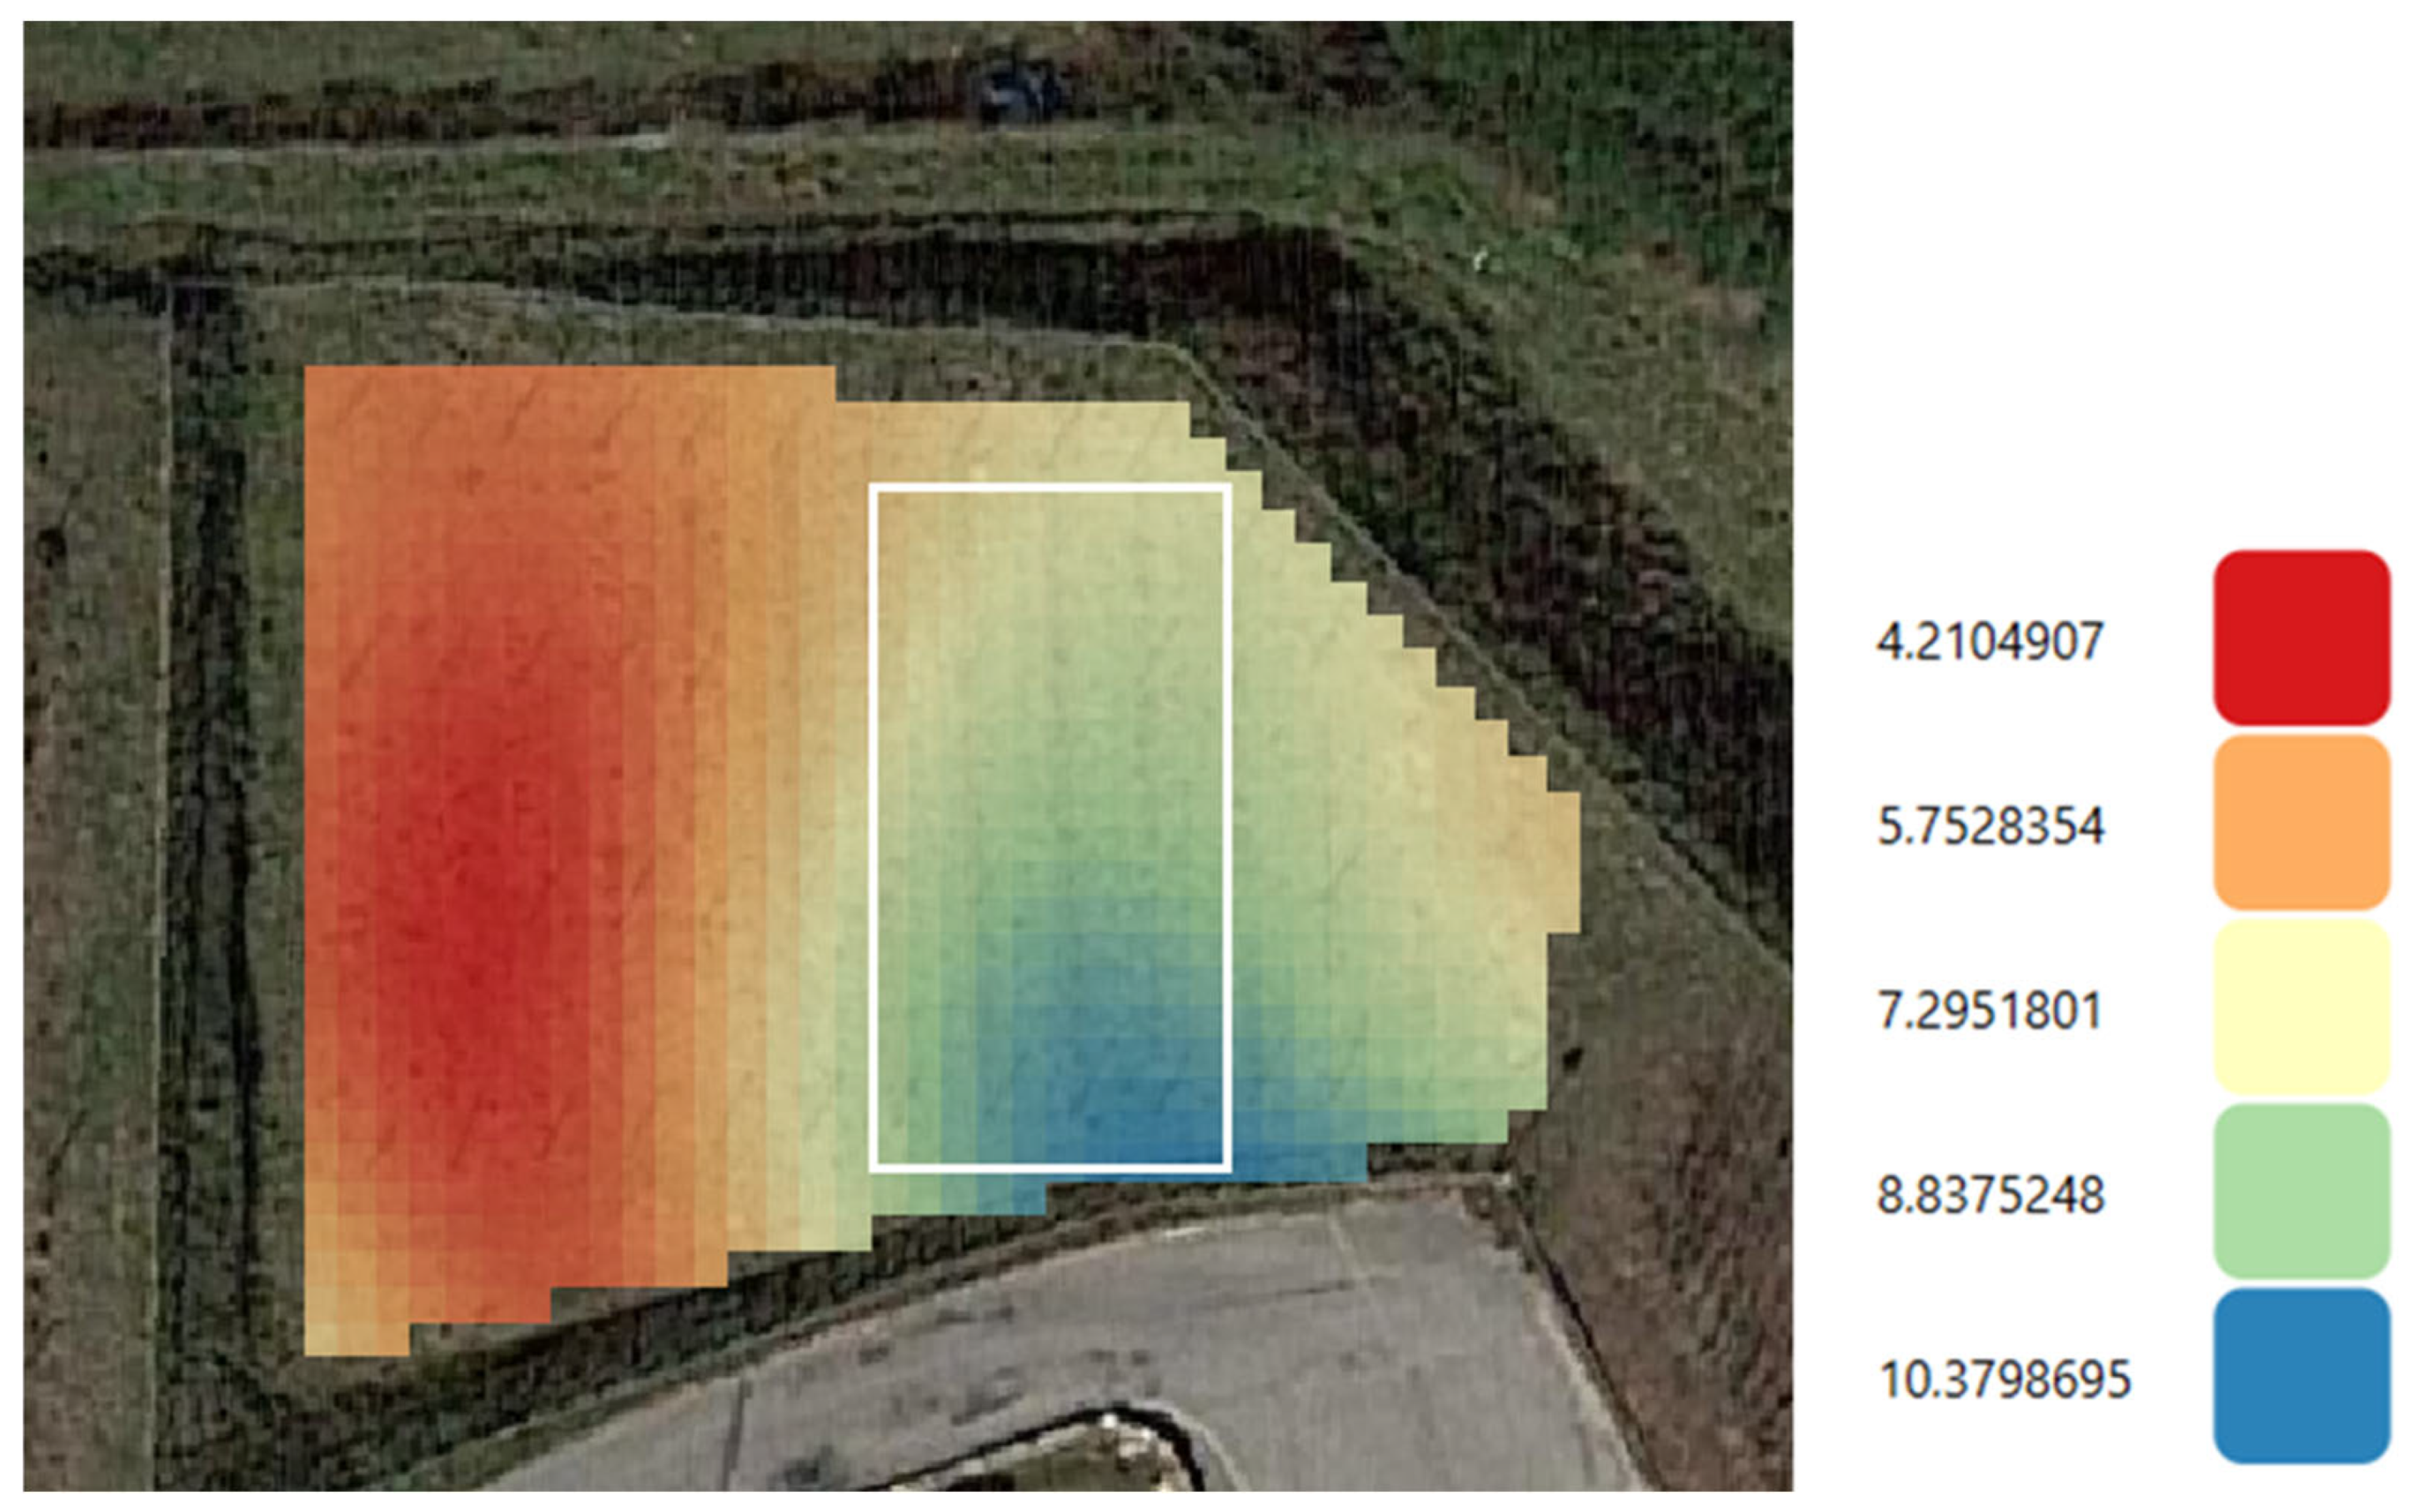
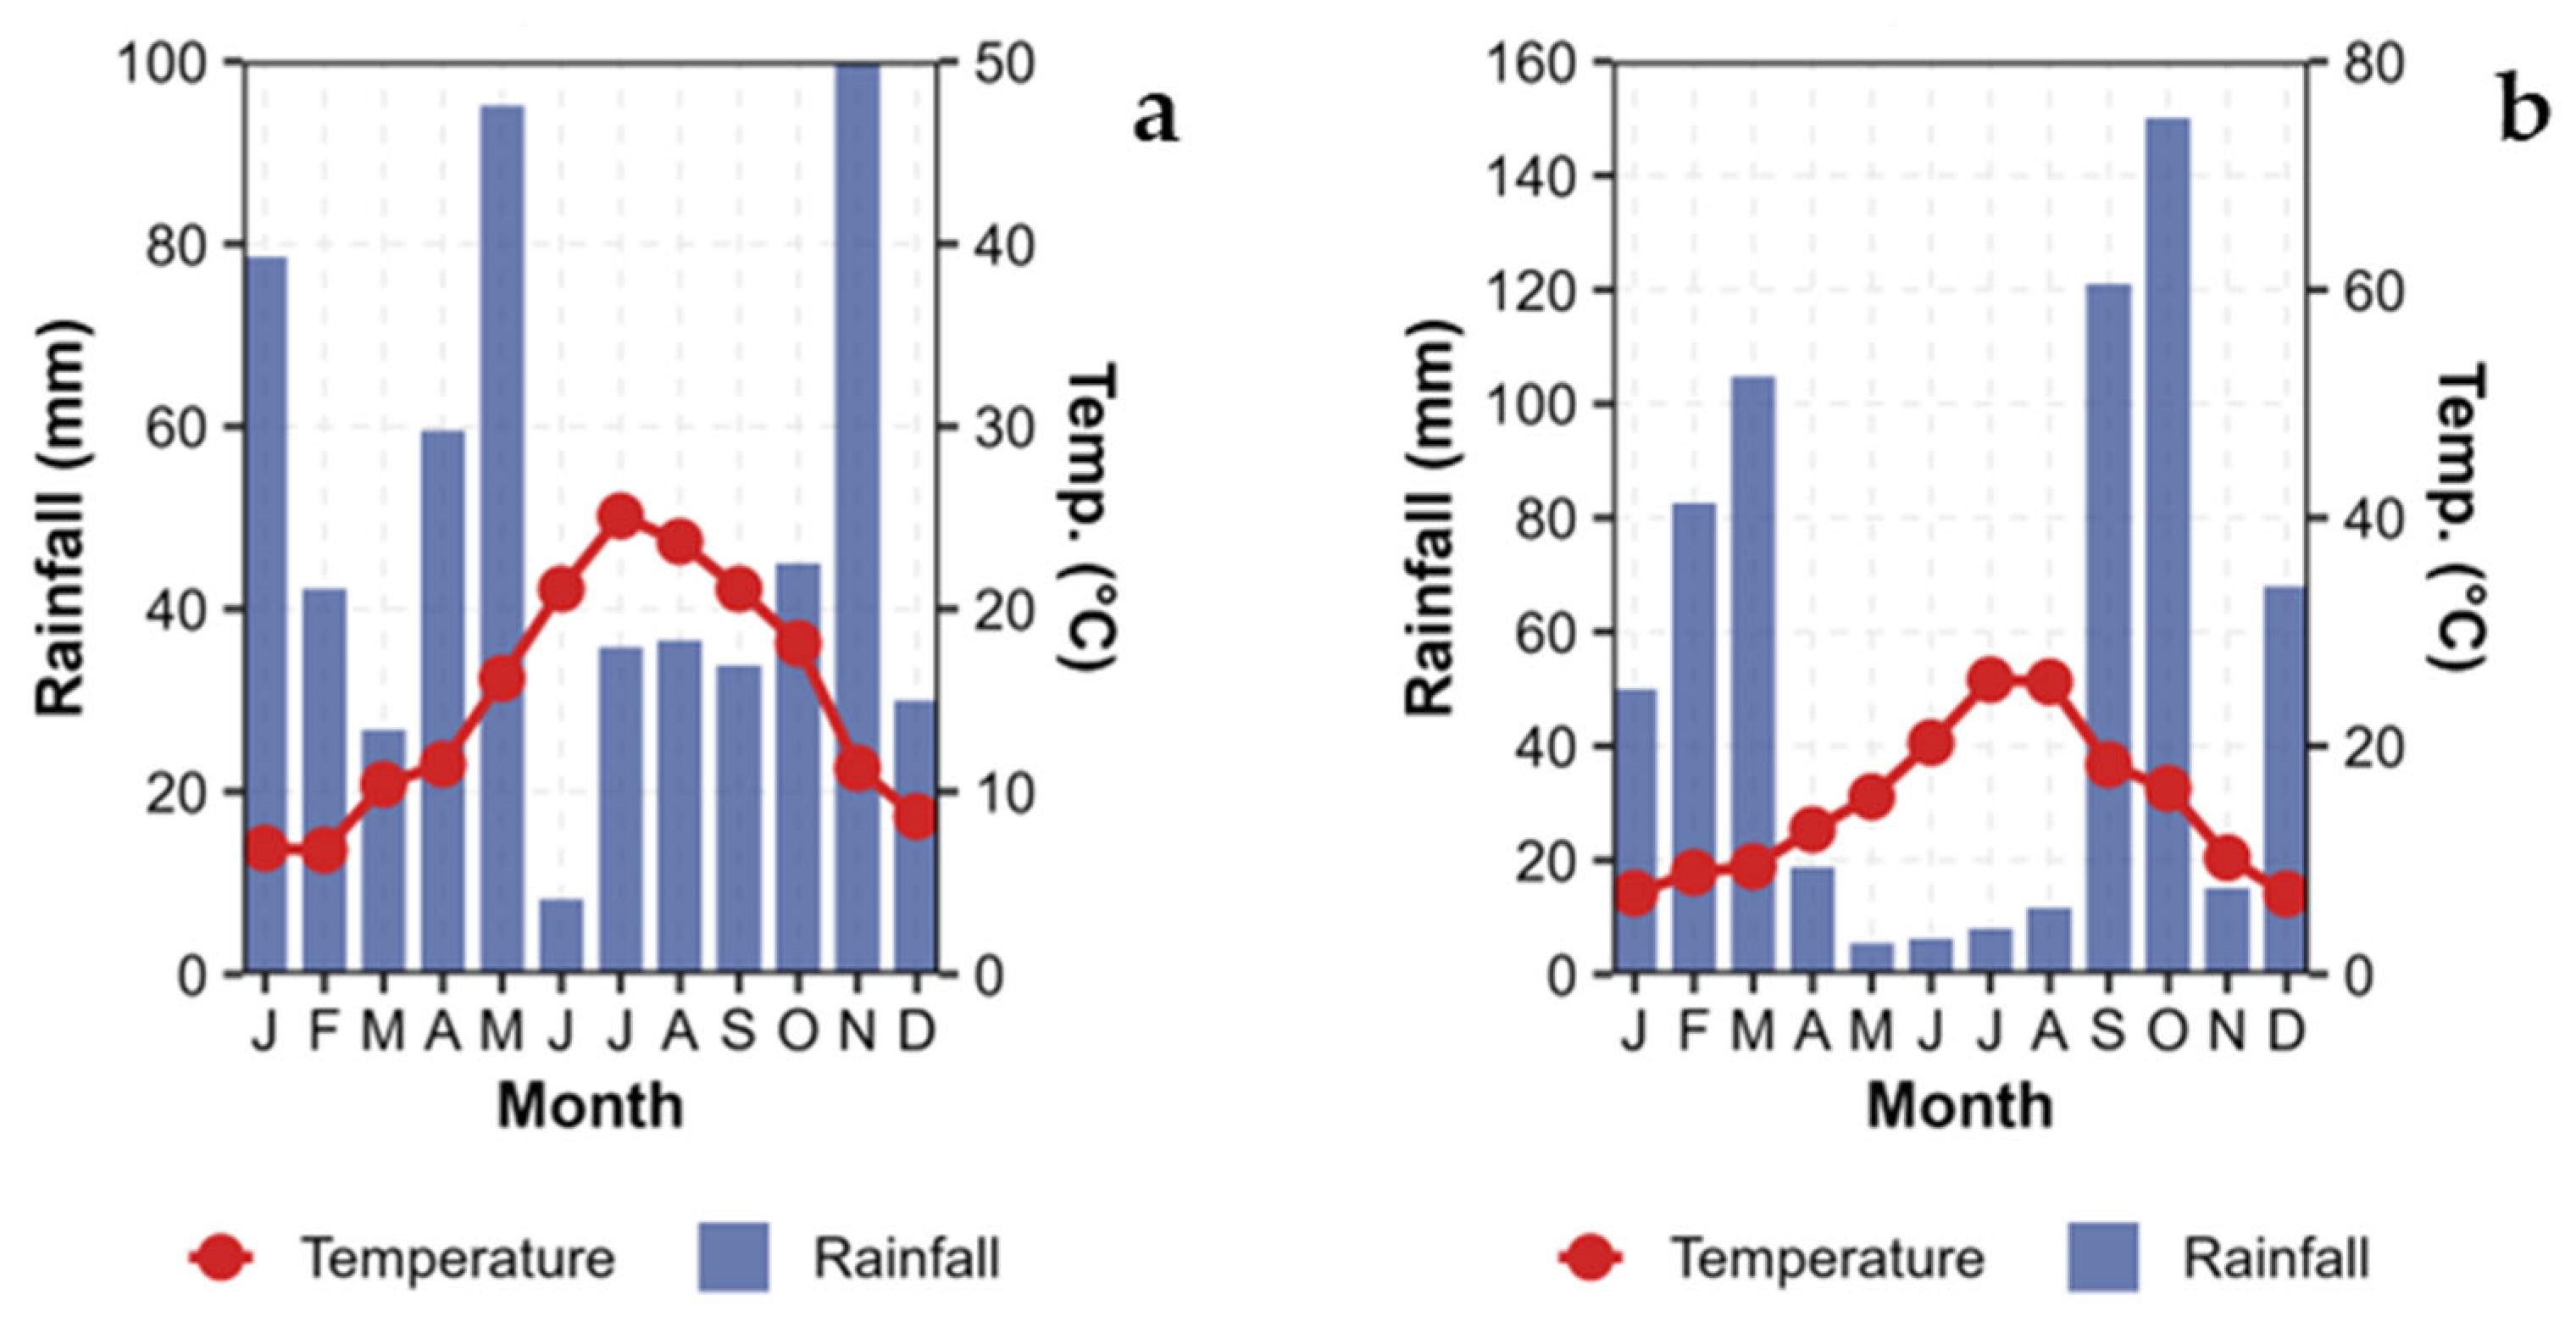
2.1. Site Description

A two-year long trial (growing seasons 2023–2024, henceforth referred to as RY 1 and RY 2, respectively) was conducted on an open-field raspberry (Rubus idaeus, L.) orchard located in Caprarola (Viterbo, Latium, Italy; 42°19′37″ N, 12°12′55″ E; 653 m a.s.l.). Soil analyses on the 0–30 cm layer highlighted a sandy-loamy texture (44% and 42%, respectively) and the following chemical characteristics: EC at +25 °C = 8.47 mS cm−2; pH 6.98; C N−1 ratio = 13.1; CEC = 15.3 meq 100 g−1 (Figure A1). The raspberry orchard, which was organically managed, received annual organic fertilizer inputs, and was irrigated with drip irrigation system in the period from June to August, through water balance calculation on a weekly basis. The experimental site hosts a fully equipped agrometeorological station (TERRASENSE AS100-AS300, Terrasystem s.r.l., Viterbo, Italy), which guarantees a continuous monitoring of temperature (average, lowest, highest), relative humidity, rainfall, solar radiation, and wind (speed and direction); the station output was used to acquire the climographs that characterized RY 1 and RY 2 (Figure A2).
On-field activities took place between February–September and March–September RY 1 and RY 2, respectively. Ten-year-old raspberry plants were organized in four rows, each of them being 25 m long and spaced at 2.5 m × 0.65 m (plot area of 190 m2; 38 plants per row), with a training system that allowed rows to assume a hedge-like shape. Two rows featured plants belonging to ‘Autumn Bliss’ cultivar (henceforth called AB), while the other two hosted ‘Zeva’ (Z) plants, both varieties characterized by a double fruiting window within the same growing season.
On February the 17th for RY 1 and March the 14th for RY 2, early operations such as pruning and interrow weeding were performed in order to achieve adequate and homogeneous conditions for the upcoming spring.

2.2. Biostimulant Treatments

Each raspberry row was divided in four equal portions; three out of four parts were subjected to biostimulant application with randomized block approach, while the remaining one served as a non-treated control (from now on referred to as C). Treatments were carried out by using a selection of three biostimulants, all of them professional formulations that are available for purchase as fertilizing products. Their characteristics are summarized in Table 1.
Interventions were performed with the usage of a handheld, electric-powered spray pump, and they were executed three times per year, once every 20 days (11 May, 31 May, and 19 June for RY 1; 8 May, 28 May, and 18 June for RY 2). Since treatments were applied through foliar spraying, they were carried out once the plants had developed a broad canopy to effectively receive the active principles. The three biostimulants were diluted to the appropriate dosage by loading the spray pump tank with 10 L of water and a variable quantity of product depending on producers’ recommendations (Table 1).

2.3. Eco-Physiological Leaf Measurements

Analyses concerning chlorophyll (µg cm−2), flavonols (Arbitrary Unit, A.U.) and anthocyanin (A.U.) content at leaf level, as well as Nitrogen Balance Index (NBI) estimation representing the ratio of leaf chlorophyll to flavonoid concentrations, were performed on a weekly basis starting after the first round of treatments (13 reading sessions per season in total). Readings were performed through a non-destructive approach by using a portable optical leafclip metre (DUALEX®, Force-A, France) in four plants per Treatment × Cultivar combination (two plants per treatment on each row). On each plant, readings were executed on six young, well-developed leaves (three measurements per row side).
Eco-physiological leaf measurements were performed on a weekly basis, starting on May 25th for RY 1 and May 22nd in RY 2, until the end of field trials (i.e., 29 September and 27 September, respectively). Measurements were performed on the same plants across the two seasons.

2.4. Yield and Berry Qualitative Traits

Within each row, berries were harvested on two representative plants per treatment, i.e., the same plants that had been subjected to the eco-physiological leaf measurements. Due to the continuous flowering and the double-bearing behaviour of both AB and Z varieties, harvest sessions were carried out weekly throughout the productive season.
Upon harvesting, raspberries were sorted in labelled plastic bags, in order to keep track of the plant of origin and the harvest date. Subsequently, fruits were weighted individually to quantify their fresh weight and counted. Fruit weight and fruit number were then further processed to calculate plant yield and average fruit weight. After counting and weighting, samples were stored at −20 °C inside a freezer for subsequent qualitative analyses.
Quality analyses comprised total soluble solids (TSSs), fruit juice pH, and titratable acidity evaluation and were carried out exclusively on produce belonging to three main harvest sessions for each year, representing Early, Intermediate, and Late Harvests (i.e., 5 July, 31 August and 21 September for RY 1 and 27 June, 25 July and 7 August for RY 2, respectively). Fruits were processed by treating each plant as a stand-alone biological replicate (each replicate was composed of five berries; n = 4).
The TSS, expressed in °Brix, was assessed by using a portable refractometer (Model RZT, Exacta + Optech® GmbH, München, Germany); juice pH was assessed with a digital pH metre; ultimately, titratable acidity, expressed as g L−1 citric acid, was determined by following the standard procedure involving raspberry juice as analyte and a solution containing NaOH (0.1 N) as reagent.

2.5. Statistical Analyses

Data were analyzed using R statistical software ver. 4.4.3 (R core team, Wien, Austria) [18]. For each measured parameter, Linear Mixed-Effects Models (LMMs) were employed to assess the effects of Cultivar, Treatment, and Year, including all their two-way and three-way interactions (for qualitative traits, statistical tests were run independently for each cultivar and contemplated Treatment, Year and Harvest window as factors). Statistical analyses were performed through the implementation of the lmerTest package (ver. 3.1.3) [19]. Plant ID (or experimental unit ID) was included as a random intercept effect to account for potential non-independence of repeated measurements or clustered observations within experimental units. When needed, log-transformations were applied to specific variables prior to LMM analysis to better meet model assumptions of normality and homoscedasticity of residuals, as assessed by visual inspection of diagnostic plots (residuals vs. fitted values, Normal Q-Q plots, scale-location plots, and residuals vs. leverage plots).
Analysis of Variance (ANOVA) for fixed effects was conducted using Type III sums of squares with Satterthwaite’s approximation for denominator degrees of freedom to determine the significance of main effects and interactions.
When significant effects (p < 0.05) were identified in the ANOVA, post hoc pairwise comparisons of estimated marginal means (EMMs) were performed using the emmeans R package (ver. 1.11.0) [20]. p-values for these comparisons were adjusted using the Sidak method to control the family-wise error rate. Compact letter displays (CLDs) were generated by using the multcomp package (ver. 1.4.28) [21] in order to visually summarize significant differences among group means, with letters assigned in decreasing order of EMMs.

3. Results

Table 2 and Table 3 give, respectively, an overview regarding the outcomes of the omnibus ANOVA on each investigated parameter, highlighting the factors (and interactions thereof) that exerted a significant influence on them.

3.1. Eco-Physiological Measurements

While chlorophyll (Chl) and anthocyanin (Anth) content were analyzed by processing non-transformed data, a log-transformation for flavonols (Flav) and NBI was performed in order to better satisfy the model’s assumptions. Table 4 and Table 5 show EMMs, calculated on non-transformed data, regarding the monitored eco-physiological parameters, sorted by the main factors of the experiment.
Every eco-physiological parameter acquired through leaf-level readings was not found to significantly react to biostimulant treatments per se; on the contrary, such measurements appeared to be highly susceptible to the Year effect, as demonstrated by ANOVA results (p < 0.001 for all Dualex® parameters). Cultivar, as a single factor, was found to significantly affect chlorophyll content (p = 0.045).
Interestingly, two-way interaction effects among Treatment and Year appeared to have a significant impact on chlorophyll, flavonols and anthocyanins, as well as in the NBI (p < 0.001 for all parameters). Ultimately, three-way interactions between Treatment, Year and Cultivar were found to be statistically significant across all of the four monitored parameters (p < 0.001, p = 0.004, p = 0.02, p = 0.009 for Chl, Flav, Log-Anth, and Log-NBI, respectively), thus being the most reliable in depicting the dynamics that characterized eco-physiological traits during the experimental trials.
When looking at chlorophyll content (μg cm−2), data clustered by the interaction between the three main factors suggested a more stable outlook in RY 1 across treatments and cultivars (Figure 1a,b). This was proven to be especially true for Z plants, in which no significant difference whatsoever was found for RY 1, regardless of treatment regime. RY 2, however, was characterized by more noticeable changes, which depended on both biostimulant application and plant variety. For instance, it was observed how BIO1 seemingly improved chlorophyll content in AB plants while obtaining a rather opposite effect in Z (CLDs ‘abc’ and ‘d’, respectively). Lastly, looking across growing seasons, it was revealed that BIO3, in AB plants, resulted in significant variations from RY 1 to RY 2 (EMMs ≈ 23.63 and 20.04 μg cm−2, respectively), recording a 15.19% decrease in chlorophyll content from one year to the next.
Flavonol values, expressed as Arbitrary Units (A.U.s), were affected by the triple interaction among Cultivar, Treatment, and Year (p = 0.004). From a broader standpoint, flavonols were found to be significantly higher in RY 1 than in RY 2, regardless of cultivar and treatment (Figure 1c,d). By inspecting the interaction more closely, non-treated AB plants, in RY 1, recorded significantly higher flavonol content in comparison to every other level in RY 2 (EMM ≈ 2.08, average +16.31%).
Anthocyanins were found to significantly react to the interaction between Cultivar, Treatment, and Year (p = 0.02). Figure 1e,f synthetizes the dynamics this parameter underwent in its log-transformed version. Here, the most notable differences could be found when looking at biostimulant treatments in AB and the way their effect magnitude changed from one year to another. Namely, BIO1, which made anthocyanins rise up to 0.19 A.U. in AB plants in RY 1, witnessed a significant decline in the following year (EMM ≈ 0.17 on the original scale), which translated into an approx. 10% drop in anthocyanin content. A very similar pattern was distinguishable in the Control, AB plants.
Elaborations on the log-transformed data related to the NBI (i.e., the ratio between chlorophyll and flavonol content) and their response to Cultivar, Treatment, and Year combined (p = 0.009) are provided in Figure 1g,h. Overall, a slight increase in the NBI could be seen from RY 1 to RY 2 across all treatments and cultivars, even though this tendency rarely translated into a significant difference. Interestingly, AB plants seemed to respond differently to the various treatments passing from one season to the next, as demonstrated by BIO1 and the Control, which, in RY 2, significantly improved the NBI, accounting for an average 15% increase in comparison to values recorded in RY 1.

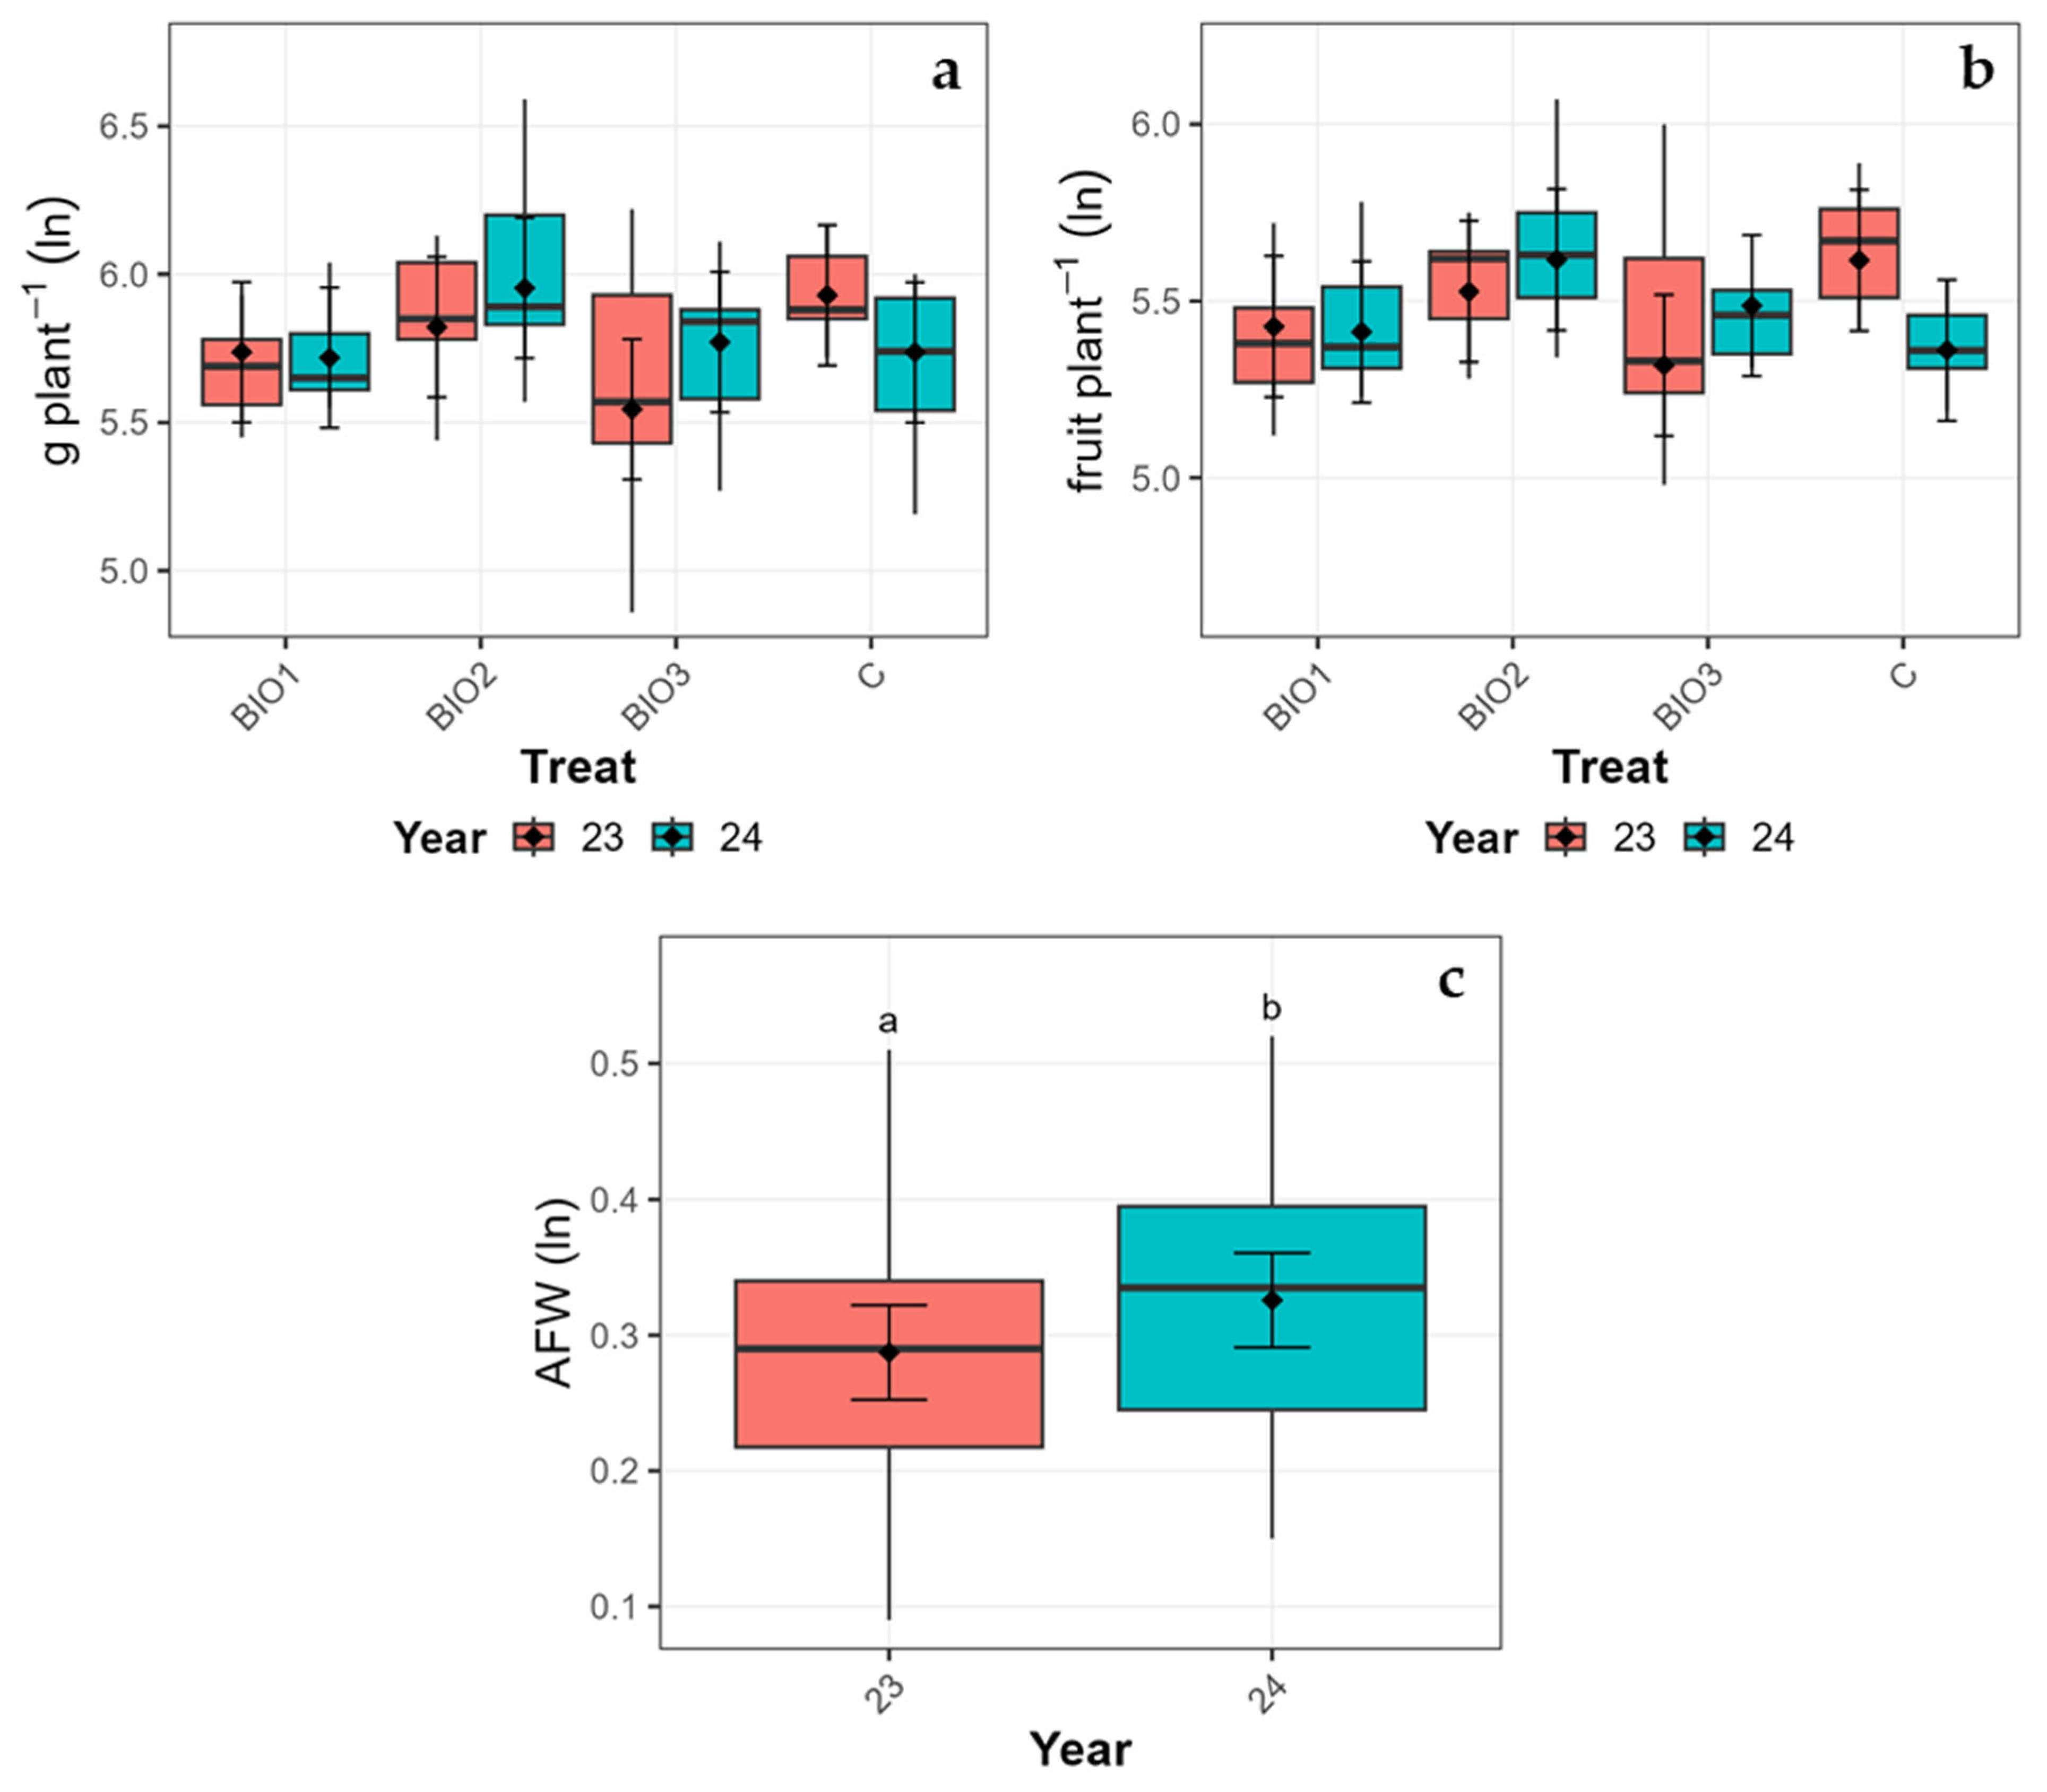
3.2. Yield Performance

Table 6 gives an overview regarding the estimated marginal means for yield data in their original scale, while Figure 2 depicts the seasonal trends of the harvest events during both seasons and for both varieties. Within the first year, eleven and twelve harvests were identified for AB and Z, respectively, with the latter showing a slightly more extended productive window in comparison to the former. This difference concerning cultivar behaviour did not occur in RY 2, where AB and Z followed a synchronized advancement across the productive phase, resulting in fourteen separate harvest sessions. Interestingly, RY 1 was characterized by two clearly distinguishable productive waves, with little to no raspberries being harvested throughout August. On the other hand, in the following RY 2, most of the production was rather concentrated between June and July, with progressively smaller harvests that went on until late September.
In terms of g plant−1, statistical analysis performed on log-transformed values highlighted a significant Year × Treatment interaction, which, however, was not confirmed by the post hoc test and Sidak correction. Nevertheless, by looking at Figure 3a, it can be seen how plants treated with BIO2 showed higher average values in both RY 1 and RY 2, with an increasing trend from one season to the following one. Indeed, the application of BIO2 in RY 2 led to the highest yield in terms of g plant−1 (i.e., 417.50 g), which accounted for a +33.93% increase in production when compared to C within the same year (311.73 g).
A similar pattern was observed by looking at the number of berries produced by each plant, which was found to be, on average, 247.31 per season on aggregated data. Even in this case, a previously stated significant effect to be ascribed to the interaction between Year and Treatment was nullified by further post hoc analyses. However, BIO2 treatments in RY 2 seemed to have exerted a stimulating effect on fruit bearing, which resulted in plants producing 35.13% more raspberries than the control within the same season (Figure 3b).
Ultimately, average fruit weight was significantly influenced by the Year effect as depicted in Figure 3c. Here, raspberries harvested in RY 2 appeared to be 3.73% heavier than the ones that were produced in RY 1 (1.39 g fruit−1 versus 1.34 g fruit−1, respectively). On the other hand, biostimulant treatments did not seem to cause any kind of response on this parameter and failed to show any significant interaction with the other factors.

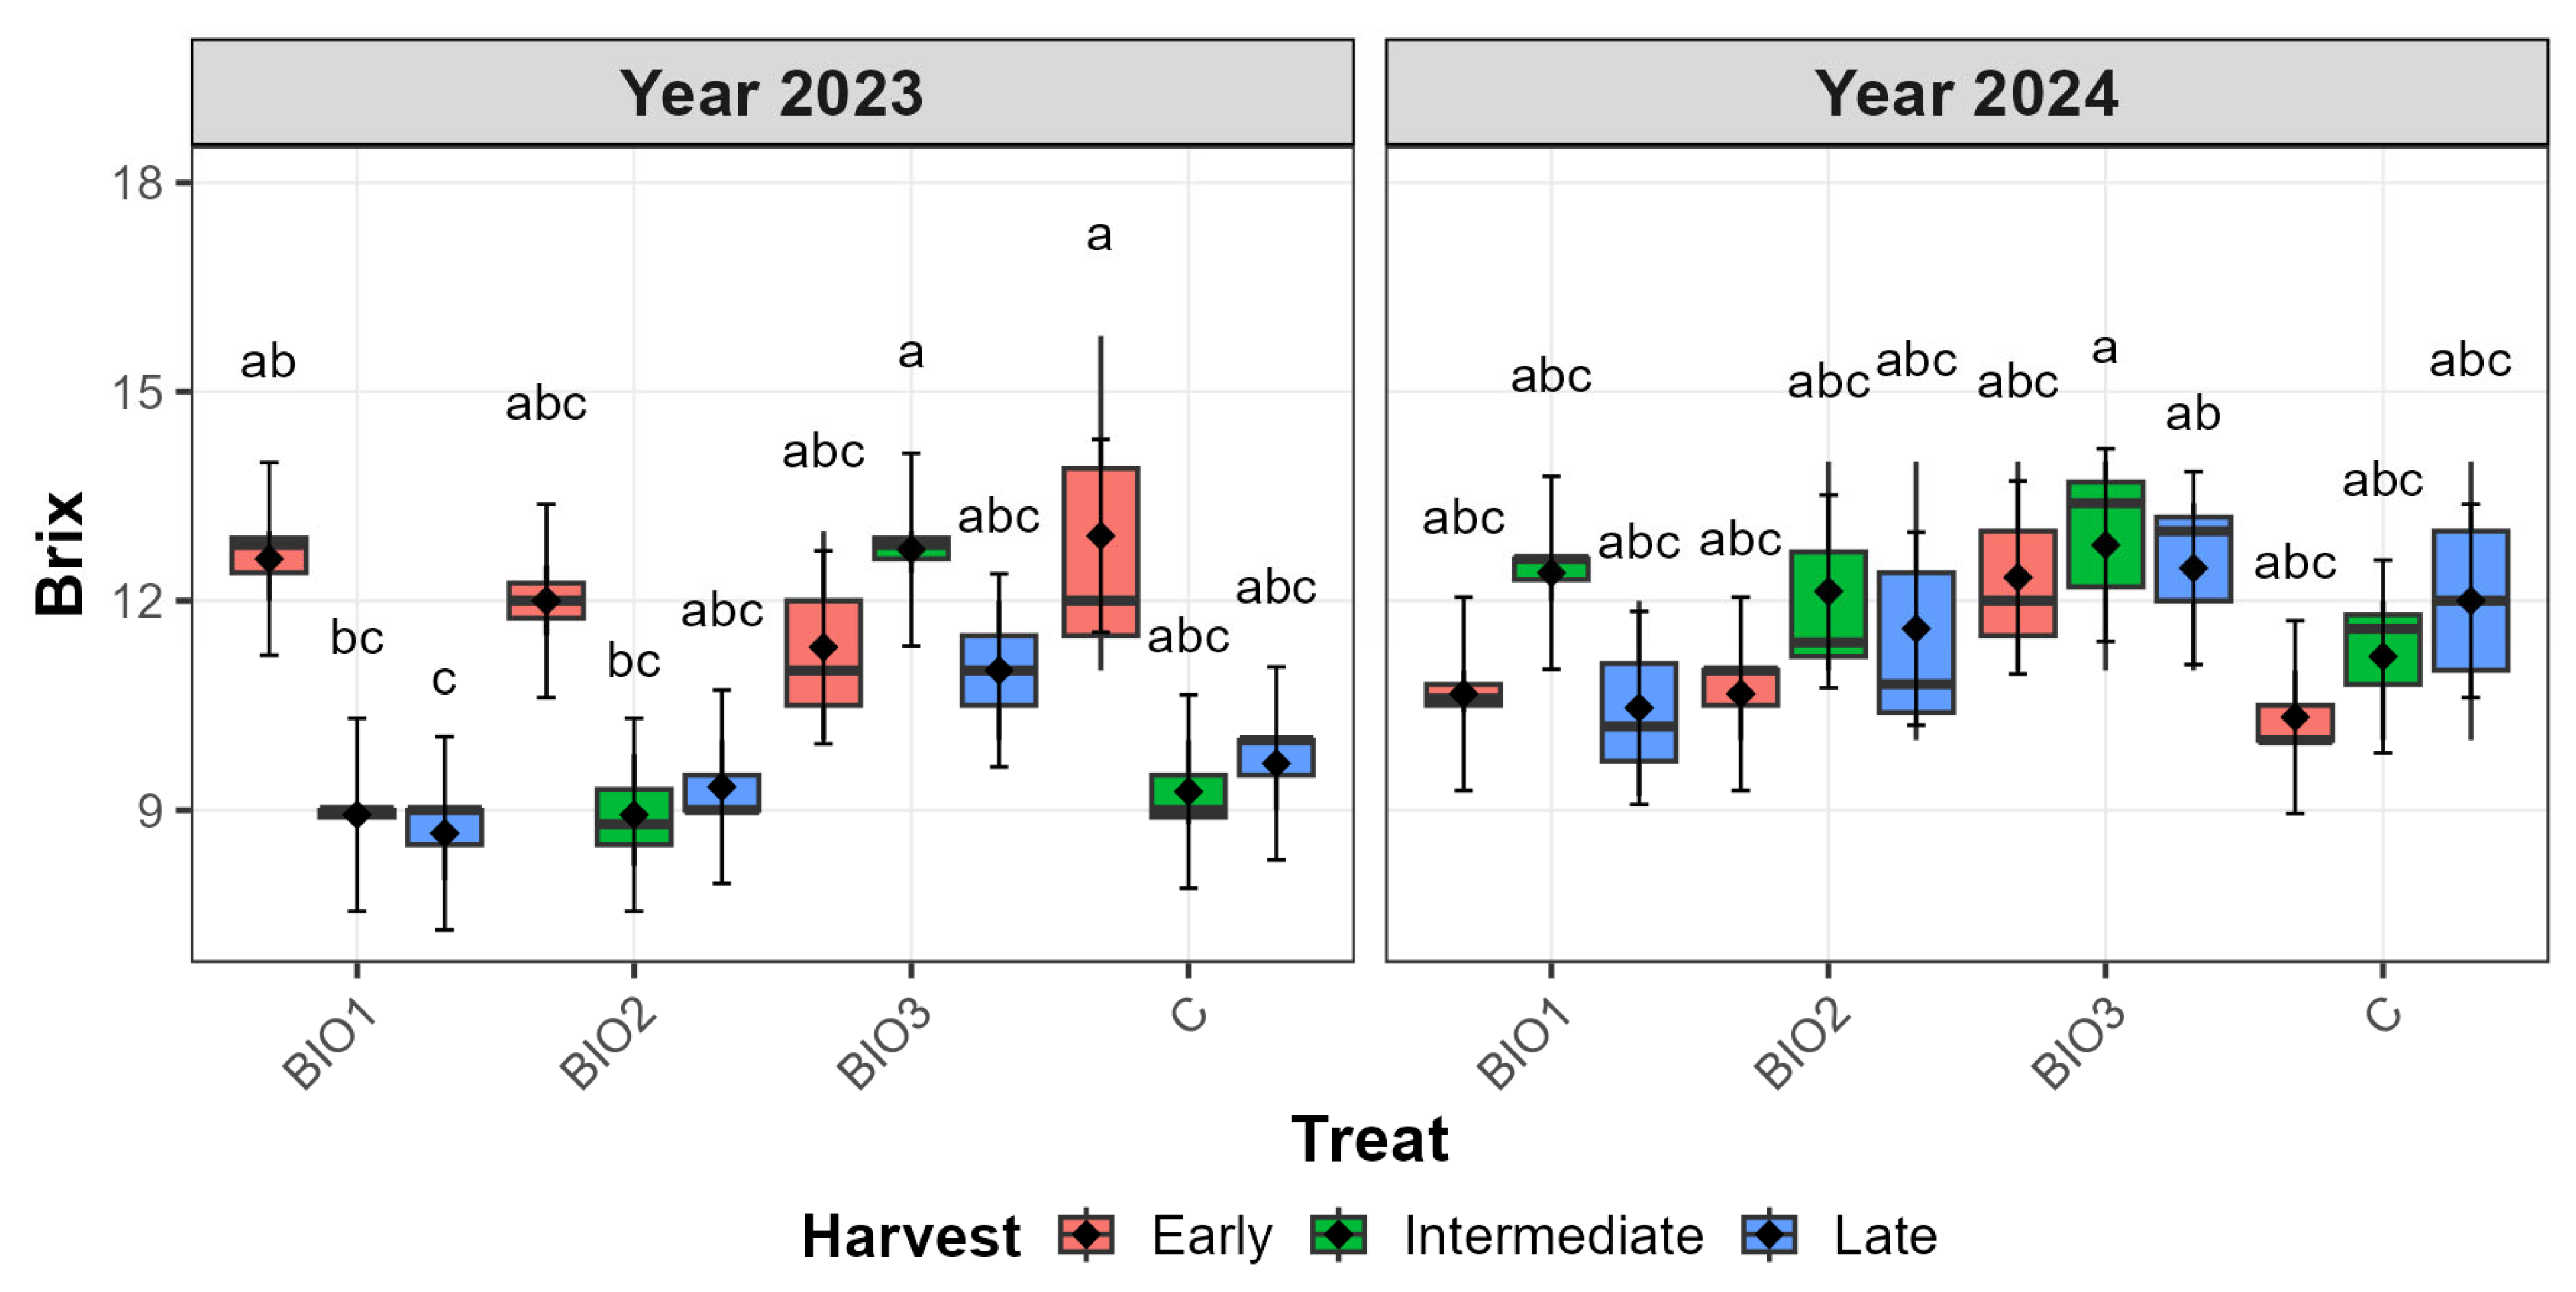
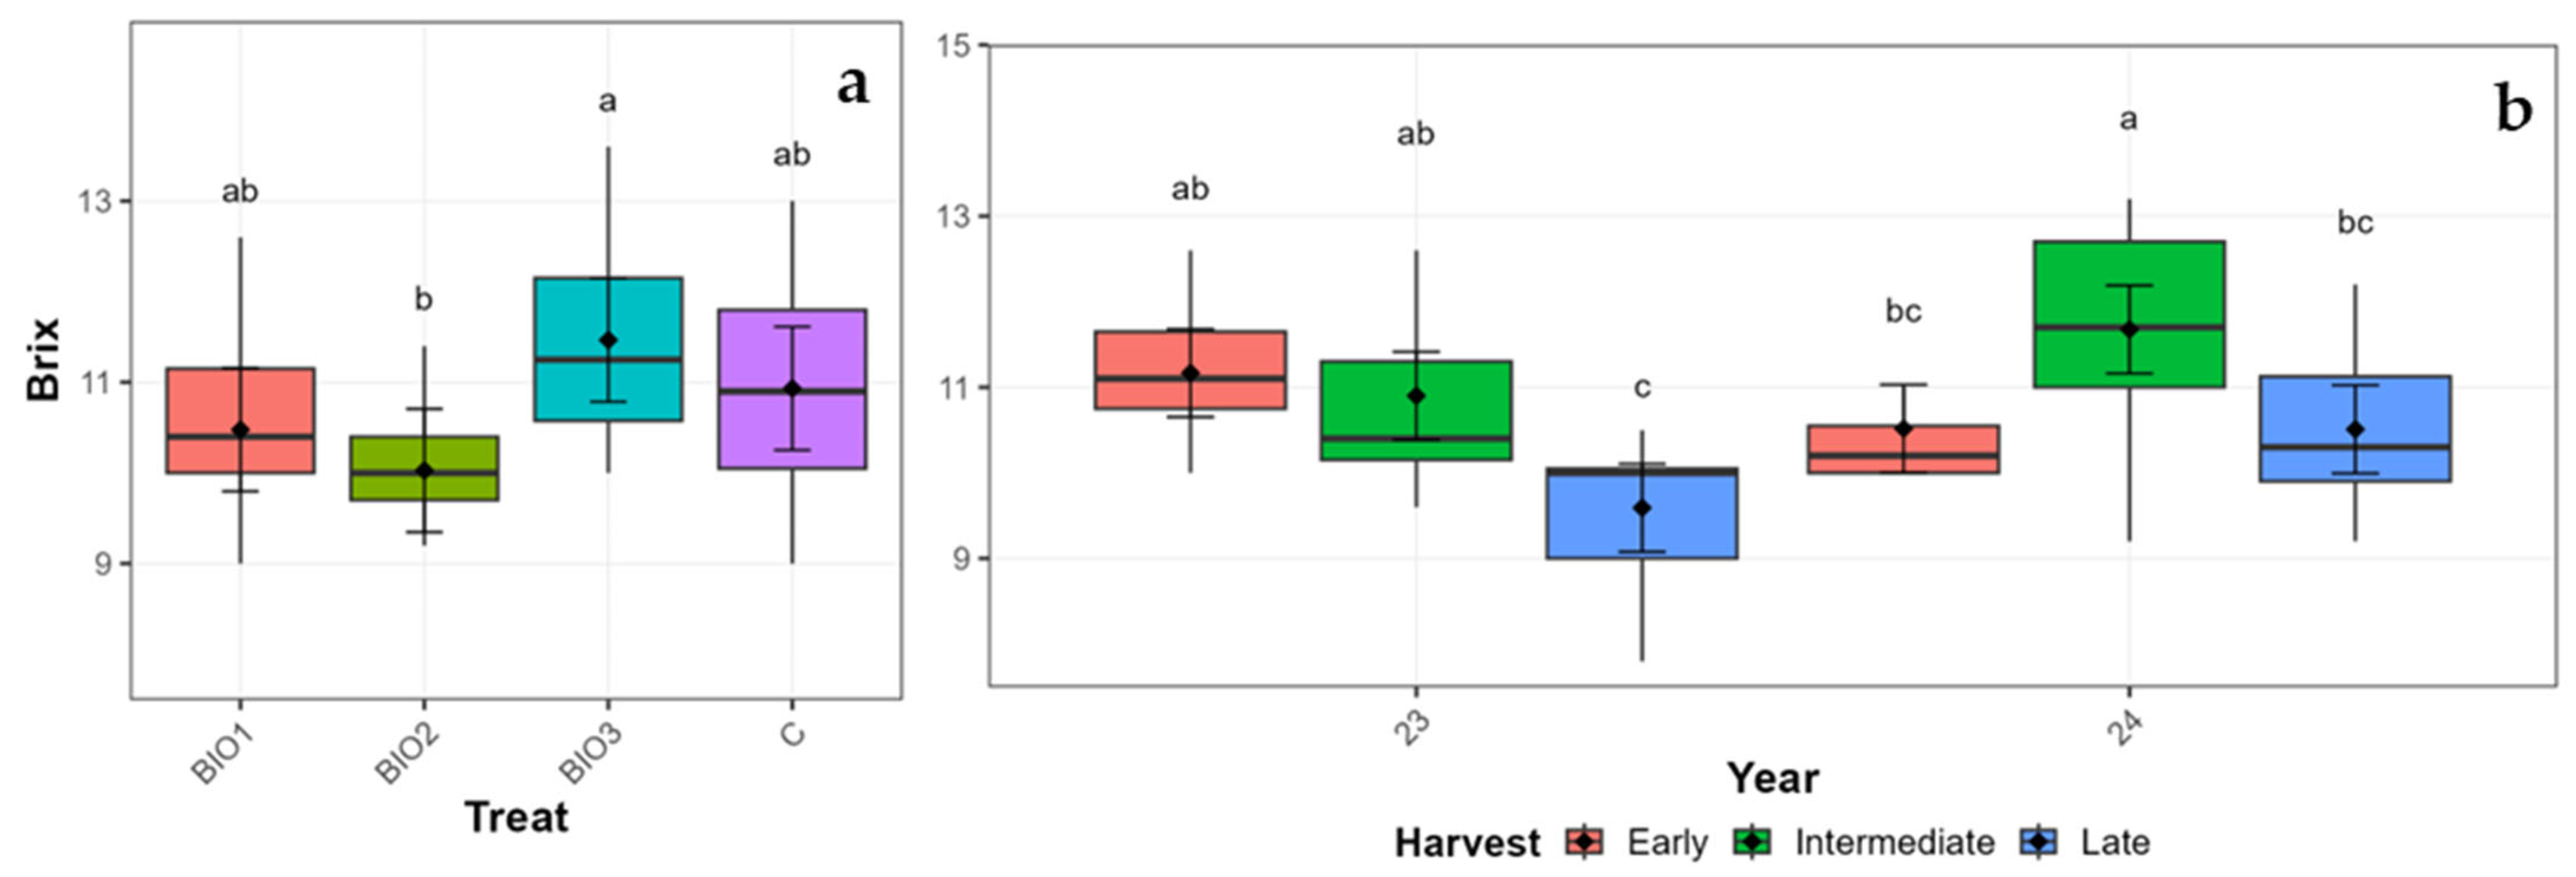
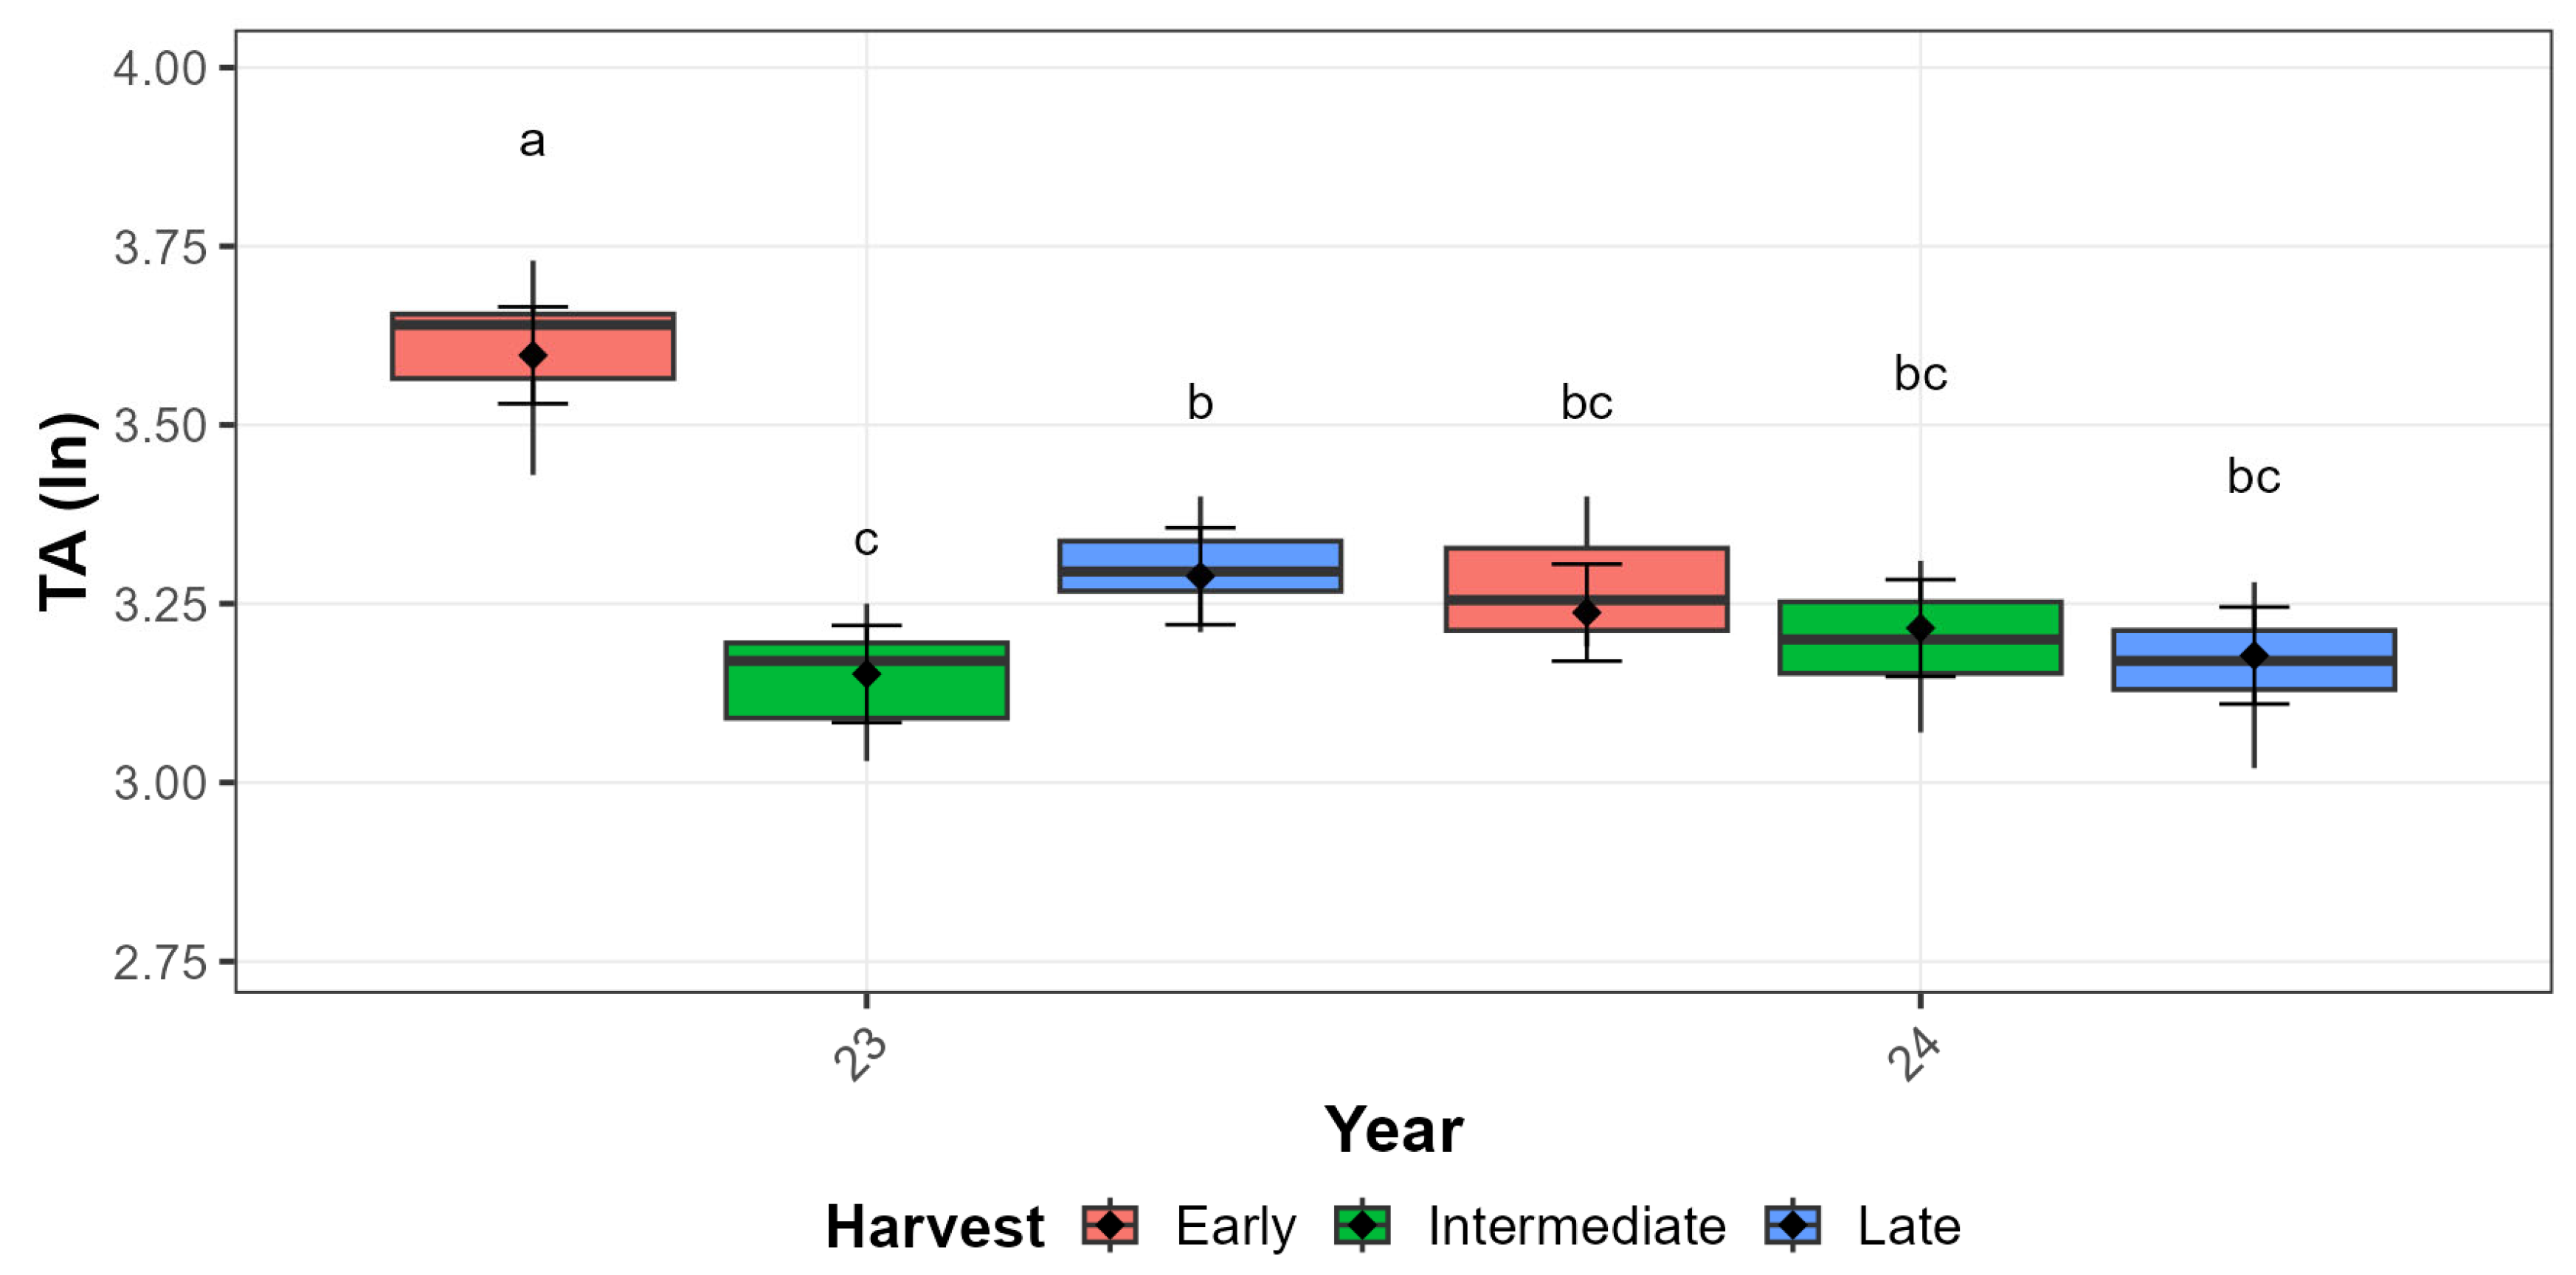
3.3. Berries Total Soluble Solid, pH, and Titratable Acidity

As previously stated, analyses comprising qualitative traits were performed on produce belonging to three selected harvests per productive season. Here, statistical analyses were carried out separately for each cultivar, excluding this factor from the linear mixed model; in its place, Harvest factor (declined as Early, Intermediate and Late) was introduced. For both AB and Z samples, data regarding titratable acidity was log-transformed before further elaborations. The estimated marginal means of non-transformed data sorted by Year, Harvest, and Treatment are visualized on Table 7.

3.3.1. ‘Autumn Bliss’ Qualitative Traits

In AB plants, °Brix values proved to respond to each of the three factors in a significant way (p = 0.021, p = 0.001 and p = 0.028 for Treatment, Year, and Harvest, respectively). Moreover, a Year x Harvest interaction was detected (p < 0.001). Most notably, however, the three factors were found to significantly interact with each other in a Treatment × Year × Harvest interaction (p = 0.040). Figure 4 represents data sorted according to this three-way interaction.
As a general trend, °Brix values showed a tendency to increase from RY 1 to RY 2 in the Intermediate and Late Harvest, while a rather opposite behaviour was detected in produce harvested during the Early window, with the only exception being the control. The Intermediate Harvest was characterized by a noticeable growth in terms of °Brix values from one year to the next across all treatments, but such difference within the same treatment was never found to be significant. °Brix values related to BIO3, however, were found to be significantly higher than RY 1 BIO1 (both Intermediate and Late) and RY 1 BIO2 (Intermediate Harvest), with an average increase of 44.46% in terms of soluble solid content.
pH from raspberry juice did not show a response to any of the main factors, when considered individually, but it was indeed influenced by interactions among those in a significant way. Namely, Treatment × Harvest, Year × Harvest, and Treatment × Year × Harvest were found to significantly affect pH values (p = 0.009, p < 0.001 and p < 0.001, respectively). An overview of the three-way interaction can be seen in Figure 5.
The pH juice values were characterized by remarkable fluctuations across treatments, productive seasons, and harvest windows; however, said variations seldom resulted in significant differences among groups. A rather interesting pattern can be distinguished within data from Early Harvest, RY 1: here, treatments BIO1, BIO2, and BIO3 have been proven to significantly affect pH values, resulting in an average 10.67% increase in this qualitative trait in comparison to the control (Figure 5).
Statistical elaborations performed on the log-transformed titratable acidity values highlighted significant single effects by each of the three factors involved (p < 0.001, p = 0.009, and p < 0.001 for Treatment, Year, and Harvest, respectively). Moreover, a two-way interaction between Year and Harvest was proven to exert a significant influence on this parameter (p < 0.001). A visual representation of data aggregated by Treatment and by Year and Harvest combined is reported in Figure 6a,b.
Post hoc comparisons of estimated marginal means (EMMs) using the Sidak method on the log-transformed scale indicated that the BIO2 treatment resulted in significantly lower titratable acidity compared to BIO1, BIO3, and the Control. The latter three treatments did not statistically differ from each other. In particular, BIO2 samples recorded, on the original scale, an average value of 22.97 g L−1; comparison with the average EMM of BIO1, BIO3, and the control (calculated on the log-transformed scale and then retransformed) revealed that BIO2 led to an approximate 12% reduction in titratable acidity (Figure 6a).
By analyzing the effects of the interaction between Year and Harvest on the titratable acidity (log-transformed scale) through Sidak post hoc comparisons, statistically significant differences were observed (Figure 6b). During RY 2, a slightly decreasing pattern from one harvest window to another could be observed; however, this trend did not lead to any significant difference, and it was not backed up by a similar behaviour in RY 1, where the Intermediate Harvest was characterized by the lowest titratable acidity values (EMM on original scale ≈ 20.49 g L−1), thus showing statistically significant differences with Early and Late Harvest, RY 1 (p < 0.001 for both comparisons), and Early and Intermediate Harvest, RY 2 (p < 0.001 and p = 0.004, respectively).

3.3.2. ‘Zeva’ Qualitative Traits

Similarly to what was witnessed in data belonging to AB samples, soluble solid content significantly responded to Treatment (p = 0.042) and Harvest (p < 0.001) factors. The same cannot be said about Year, which did not result in °Brix values changing in a significant way. However, an interaction between Year and Harvest was found to significantly influence this qualitative trait (p = 0.002).
Data grouped by Treatment, as seen in Figure 7a, highlight a significant difference in °Bx in BIO2 raspberries in comparison to every other treatment. Moreover, BIO2 formulation resulted in an 8.36% decrease in terms of soluble solid content in comparison to C, BIO1, and BIO3 (Table 7). Within these three regimes, BIO3 recorded the highest average value (i.e., 11.47 °Bx), but differences between the other two treatments were not found to be statistically significant.
The significant interaction between Year and Harvest (p = 0.002) indicated that the pattern of Brix accumulation across harvest times differed between the two years (Figure 7b). In RY 1, °Brix values progressively decreased with later harvests. The Late Harvest (EMM ≈ 9.59 °Bx) was significantly lower than both the Early (EMM ≈ 11.17 °Bx) and Intermediate (EMM ≈ 10.90 °Bx) harvests of that year, resulting in an approximate 14.15% reduction in soluble solid content from the Early to the Late Harvest. RY 2, however, was not characterized by a similar pattern: here, average °Brix values were found to be the highest in the Intermediate Harvest (EMM ≈ 11.68 °Bx), which was significantly higher than both the Early Harvest (EMM ≈ 10.52 °Bx) and the Late Harvest (EMM ≈ 10.51 °Bx). Finally, comparing across all conditions, the Intermediate Harvest of RY 2 (EMM ≈ 11.68 °Bx) and the Late Harvest of RY 1 (EMM ≈ 9.59 °Bx) represented the overall highest and lowest Brix levels observed, respectively.
As far as pH is concerned, statistical elaborations upon qualitative analyses in Z raspberries detected a significant effect on Treatment (p < 0.001), Treatment × Year (p = 0.001), and Year x Harvest (p < 0.001).
The significant Treatment × Year interaction (p = 0.001) is detailed in Figure 8a. Each treatment, control included, did not result in significant changes from one year to the next; however, comparisons across treatments and years did show significant differences: in RY 1, pH values across treatments were relatively similar, with BIO1 (EMM ≈ 2.98; CLD ‘ab’) and BIO2 (EMM ≈ 2.97; CLD ‘abc’) trending slightly higher than BIO3 (EMM ≈ 2.93; CLD ‘bc’) and control (EMM ≈ 2.95; CLD ‘bc’), though clear distinctions were limited. On the other hand, RY 2 exhibited a more pronounced separation, namely, the one between BIO2 and the Control. Focusing on this comparison, the biostimulant treatment led to an absolute difference in pH values of approximately 0.10 units (EMM ≈ 3.01 and 2.92 for BIO2 and C, respectively).
Figure 8b depicts pH values according to the interaction between Year and Harvest (p < 0.001). Here, the two productive seasons followed a rather specular behaviour: in fact, while in RY 1 pH progressively decreased as the season went on, eventually leading to a significant drop in pH from Early to Late Harvest (0.11 units in terms of absolute difference between EMMs), RY 2 was characterized by increasingly growing values, spacing from 2.89 (Early) up to 3.04 (Late).
Statistical analyses performed on log-transformed titratable acidity data, revealed that both Year and Harvest, as well as the interaction among these two factors, proved to exert a significant effect on such parameters (p < 0.001 in each case). Unlike AB, biostimulant treatments were not found to induce any kind of significant response in Z plants (p = 0.55).
When looking at data clustered by Year and Harvest (Figure 9), titratable acidity in Z samples followed a very similar pattern in comparison to the one that was highlighted upon analyzing AB production. Again, despite RY 2 being characterized by a rather decreasing trend in citric acid concentrations, the same could not be noted for the first season of experimentations, where Early Harvest stood out as the one yielding the highest values overall (i.e., ≈ 36.51 g L−1 on original scale), with post hoc analyses detecting significant differences from all other five groups.

4. Discussion

Biostimulant-based treatments did not exert a clear and unambiguous impact on leaf-level eco-physiological parameters, which were all significantly influenced by the combination of Year, Cultivar, and Treatment. This outcome corroborates the theory that frames biostimulants as an agronomic tool whose effectiveness is highly context-dependent [22].
When looking at leaf chlorophyll content, for instance, our findings seemed to suggest a cultivar-specific response to treatments, namely, when looking at the difference between AB and Z cultivars treated with BIO1 (fulvic and humic acid-based) in RY 2; this phenomenon has been previously observed both in raspberry [16] as well as in other crops [23,24], and it could be dependent on the genotype-related efficiency of fulvic and humic acid uptake [25].
Leaf-level flavonols exert a crucial role in stress response due to their antioxidant properties and their effectiveness in scavenging Oxygen Reactive Species (ROS) [26]. In our results, the Year factor seemed to have a strong impact on flavonol accumulation (Table 2), with significantly higher values in RY 1 compared to RY 2, regardless of treatment and cultivar. Interestingly, non-treated plants, in both years and cultivars, always recorded higher values in comparison to the other treatments (Figure 1c,d); this behaviour culminated in RY 1, where non-treated AB plants featured significantly higher flavonols concentrations than any treatment in RY 2, regardless of cultivar, with BIO3 (plant-based hydrolysates) showing a remarkable capability in keeping flavonols values low. Coherently, plant-based protein hydrolysates have been previously shown to induce this kind of response [27]. A transversal drop in leaf-level flavonols in RY 2 could also be linked to a limited amount of rainfall during the summer (Figure A2b), as suggested by other studies that have associated water deficit with a decrease in these leaf pigments [28].
Anthocyanins represent another class of leaf pigments associated with plants’ response to abiotic stresses, with a critical role in reducing photoinhibition through the absorption of green light [29]. Even though the Treatment factor proved to have an impact on anthocyanin accumulation, said impact was reported to be significant only in relation to Cultivar and Year. In this three-way interaction context, our results did not show a clearly distinguishable pattern; however, in RY 2, in both cultivars, every biostimulant treatment was associated with higher anthocyanin content in comparison to non-treated plants (Figure 1f). Anthocyanin production has been shown to decrease as temperature rises to critical values [30]. Although differences between treatments and control were not significant, our results might suggest that biostimulants had an effect on keeping anthocyanins’ biosynthesis at higher rates, potentially impacting plants in a significant manner in case of more pronounced abiotic stresses, as already reported by previous studies on raspberry [16].
The NBI provides a more accurate estimation of nitrogen availability within the leaf, and it is more dependent on stress-derived fluctuations rather than the plant’s phenological stage [31,32]. Even in this case, the magnitude of the Year effect was found to be the greatest, as suggested by the ANOVA omnibus test (Table 2). However, as the significance of the three-way interaction among factors suggests, meaningful differences among groups were also ascribed to biostimulant treatments (Figure 1g,h). In particular, AB plants treated with BIO1 (humic and fulvic acids) witnessed a statistically significant improvement in terms of the NBI from RY 1 to RY 2. These findings could suggest an enhancement in nitrogen uptake or remobilization efficiency mediated by the humic/fulvic acid formulation [33]. Ultimately, this effect might have been favoured by the climatic conditions that shaped RY 2, which might have been more stressful for the monitored plants, as seemingly signalled by the flavonol readings (Figure 1c,d).
Overall, the lack of a coherent tendency across leaf-level pigment analyses, with subtle influences to be ascribed to the biostimulant treatments, paired with a stronger effect stemming from the experimental year (Table 2), could imply that biostimulants, when considering eco-physiological traits, gain effectiveness especially when plants are facing abiotic stresses, as stated by previous works [9,34].
Data concerning yield and fruit set, despite being initially proven to be significantly affected by the Year × Treatment interaction, failed to maintain said significance upon post hoc analyses through Sidak correction. However, treatments with BIO2 seemingly resulted in an increase in terms of g plant−1 and fruit set in RY 2, despite the lack of rainfall experienced in said year (Figure A2b); this might suggest the insurgence of a fortifying effect to be ascribed to this specific biostimulant, which might be particularly beneficial under limiting environmental conditions. On the other hand, average fruit weight was found to be influenced exclusively by the Year factor. These results find confirmation in the existing literature involving biostimulant application in raspberry [17]. Nevertheless, yield data, visual inspection of the data (Figure 3a), and mean values (Table 2) seem to highlight an enhancing effect to be ascribed to BIO2 (humic acid-based). Indeed, plants treated with BIO2 exhibited higher average yields in both RY 1 and RY 2, with a notable increase from the former to the latter. Moreover, BIO2 application in RY 2 resulted in the highest recorded yield (417.50 g plant−1), accounting for a substantial 33.93% increase compared to the untreated control (C) in the same year. Among the alleged benefits linked to humic and fulvic acid administration, enhanced plant growth and nutrient uptake efficiency are well-established [25]. It is reasonable to assume that such physiological improvements can translate into greater yield and/or fruit set, as previously observed in other fruit crops [35,36].
Quality-wise, our study revealed complex and often cultivar-dependent responses of soluble solid content, pH, and titratable acidity to the applied biostimulants; these responses were often found to be further modulated by the reference year and harvest time within the season.
The TSSs, which represent a reliable indicator of soluble sugar concentration, are a major contributor to fruit sweetness and overall consumer acceptance for raspberry [37]. In AB plants, °Brix went through a general increase from RY 1 to RY 2, especially when looking at the Intermediate and Late Harvests (Figure 4). This phenomenon might find explanation in the lack of rainfall that characterized the second year of experimentations (Figure A2b), as the effect of water deficit in increasing total soluble solids in raspberry is well documented [38,39]. Application of plant-based extracts (BIO3) in RY 2 resulted in significantly sweeter raspberries in the Intermediate Harvest window, when compared to several treatment combinations dating RY 1. A comparable effect was witnessed in Z plants (Figure 7a), where BIO3 application resulted in the highest average °Brix values, independently of year and harvest window, further supporting the potential usefulness of such treatment in enhancing raspberries’ quality profile. On the other hand, humic and fulvic acid administration (BIO2) led to a significant 8.36% decrease in °Brix compared to the control and other biostimulants in Z plants; this outcome is in contrast with the positive effects resulting from the same treatment in terms of yield (Figure 3a), thus suggesting the occurrence of a dilution effect, where more fruits (i.e., sinks) competed for a limited amount of photoassimilates in the scope of source/sink dynamics [40]. Failure to significantly enhance TSSs through humic and fulvic acid application in raspberry was already documented by previous trials [17].
While pH was significantly impacted by treatments in both varieties, the same cannot be said about variations in titratable acidity, which significantly responded to biostimulants only in AB plants.
The pH analyses in AB plants highlighted how treated fruits from RY 1, Early Harvest, went through a significant reduction in acidity in comparison to untreated samples (Figure 4). For BIO2 specifically, this outcome was consistent with the findings related to titratable acidity, where such biostimulants caused a remarkable reduction in citric acid content in comparison to BIO1 and control (Figure 6a). The same product resulted in similar results in Z plants, where BIO2 application, in RY 2, led to significantly higher pH values than the control (Figure 8a); however, for this cultivar, changes in titratable acidity related to biostimulant application were negligible, once again highlighting a cultivar-specific response to treatments. In summary, BIO2 (fulvic and humic substances) was found to positively influence pH and acidity in raspberries: indeed, higher pH and lower titratable acidity are usually perceived by consumers as positive traits when considering raspberries’ overall taste [41,42], and humic substance administration could have led to sensible changes to organic acid pathways within plants, as suggested by previous works [43,44]. Still, it is worth noting that the very same treatment resulted in a decrease in °Bx, which is typically an undesirable trait in raspberry [45,46].

5. Conclusions

This work represents one of the first steps in better understanding the feasibility of implementing plant biostimulants on raspberry cultivation. Our results, based on a two-year trial, outline a rather complex scenario, where responses in the monitored parameters hardly ever depended on single factors, as they rather varied as a consequence of double or even triple interactions. Such dynamics shaped the response in leaf-level eco-physiological parameters, where, for instance, chlorophyll content and the NBI were positively affected by BIO1 (fulvic/humic acids) on AB plants in RY 2, while causing a significant drop in chlorophyll for Z. Results concerning anthocyanins and flavonols, however, show potential for biostimulants to have a beneficial role in mitigating abiotic stresses and their detrimental effects, with possibly more tangible results if applied in plants grown in controlled, sub-optimal conditions.
Treatments were seemingly successful in affecting plant production, but such an impact was subsequently nullified by post hoc analyses. Nevertheless, BIO2 resulted in promising results in enhancing plant yield, namely, in the second year of the trial (RY 2), where it led to a 33.93% yield increase over the control.
Lastly, qualitative traits were characterized by a wide and complex range of responses that exacerbated the interconnection among biostimulants and the context they are applied. In fact, while BIO3 was found to significantly improve °Brix values in both AB (Intermediate Harvest) and Z (across all harvest windows), BIO2 led to a general decrease in soluble solid content, possibly as a consequence of its beneficial effects on yield. However, the same treatment resulted in lower titratable acidity in AB and higher pH in Z samples, potentially improving taste perception. Overall, despite the intricate nature of our results, we can assume that, while BIO2 was proven to be potentially helpful in increasing yield, BIO3 had a major impact on qualitative traits. For this reason, we speculate that, depending on growers’ specific priorities, implementing a leonardite-based product —like BIO2—or a biostimulant based on plant extracts—such as BIO3—might result in beneficial effects on yield or quality, respectively.
As a final remark, we reckon that future studies should be performed in order to thoroughly comprehend biostimulants’ mode of action and evaluate their potentialities with greater awareness, even in controlled cultivation systems. Research should also aim to shed light on product-genotype responses, possibly under different environmental stresses, ultimately unravelling the potential of biostimulants in raspberry production systems.

Author Contributions

Conceptualization, V.C. and F.G.; methodology, V.C., F.G. and C.S.; formal analysis, F.G. and C.S.; investigation, F.G. and C.S.; data curation, F.G. and C.S.; writing—original draft preparation, F.G.; writing—review and editing, V.C., F.G. and C.S.; supervision, V.C. All authors have read and agreed to the published version of the manuscript.

Funding

This work was supported by the following: (1) Agreement between Department of Agricultural and Forest Sciences (DAFNE) and Parco Scientifico e Tecnologico dell’Alto Lazio S.C. a r.l. for Ph.D. scholarship SPVA—Cycle XXXVIII (University of Tuscia); (2) ARSIAL (Regional Agency for Innovation and Development of Agriculture in Latium—Project DDG n. 296 of 8 May 2023), and (3) by the Italian Ministry for University and Research (MUR) for financial support (Law 232/2016, Italian University Departments of excellence) under the D.I.Ver.So. project.

Data Availability Statement

Data are contained within the article.

Acknowledgments

We thank Roberto Mariotti for on-site logistical support and the ARSIAL technicians for the seasonal management of the raspberry orchard.

Conflicts of Interest

The authors declare no conflicts of interest.

Appendix A

Figure A1. Electrical conductivity (EC) of the experimental site, expressed as mS m−1. Values refer to the 0–30 cm layer. Reference values, coupled with the corresponding colour, are provided. The white box identifies the raspberry experimental plots subjected to biostimulation.
Horticulturae 11 00906 g0a1
Figure A2. Climograph representing monthly accumulated rainfall and average temperatures (°C) for (a) RY 1 and (b) RY 2.
Horticulturae 11 00906 g0a2

References

  1. UN DESA UN DESA Databases. Available online: https://www.un.org/en/desa/products/un-desa-databases (accessed on 14 November 2023).
  2. Skrovankova, S.; Sumczynski, D.; Mlcek, J.; Jurikova, T.; Sochor, J. Bioactive Compounds and Antioxidant Activity in Different Types of Berries. Int. J. Mol. Sci. 2015, 16, 24673–24706. [Google Scholar] [CrossRef] [PubMed]
  3. Ponder, A.; Hallmann, E. The Effects of Organic and Conventional Farm Management and Harvest Time on the Polyphenol Content in Different Raspberry Cultivars. Food Chem. 2019, 301, 125295. [Google Scholar] [CrossRef]
  4. Mikulic-Petkovsek, M.; Schmitzer, V.; Slatnar, A.; Stampar, F.; Veberic, R. Composition of Sugars, Organic Acids, and Total Phenolics in 25 Wild or Cultivated Berry Species. J. Food Sci. 2012, 77, C1064–C1070. [Google Scholar] [CrossRef]
  5. Food and Agriculture Organization of the United Nations (FAO) FAOSTAT. Available online: https://www.fao.org/faostat/en/#data/QCL (accessed on 9 June 2025).
  6. Andreotti, C.; Rouphael, Y.; Colla, G.; Basile, B. Rate and Timing of Application of Biostimulant Substances to Enhance Fruit Tree Tolerance toward Environmental Stresses and Fruit Quality. Agronomy 2022, 12, 603. [Google Scholar] [CrossRef]
  7. du Jardin, P. Plant Biostimulants: Definition, Concept, Main Categories and Regulation. Sci. Hortic. 2015, 196, 3–14. [Google Scholar] [CrossRef]
  8. La Torre, A.; Battaglia, V.; Caradonia, F. An Overview of the Current Plant Biostimulant Legislations in Different European Member States. J. Sci. Food Agric. 2016, 96, 727–734. [Google Scholar] [CrossRef]
  9. Yakhin, O.I.; Lubyanov, A.A.; Yakhin, I.A.; Brown, P.H. Biostimulants in Plant Science: A Global Perspective. Front. Plant Sci. 2017, 7, 2049. [Google Scholar] [CrossRef]
  10. Mandal, S.; Anand, U.; López-Bucio, J.; Radha; Kumar, M.; Lal, M.K.; Tiwari, R.K.; Dey, A. Biostimulants and Environmental Stress Mitigation in Crops: A Novel and Emerging Approach for Agricultural Sustainability under Climate Change. Environ. Res. 2023, 233, 116357. [Google Scholar] [CrossRef]
  11. Mounaimi, S.; Hamim, A.; El Boukhari, M.E.M.; Elarroussi, H.; Lyamlouli, K. A Comprehensive Review of Integrating Biostimulants and Biopesticides for Organic Berry Farming: Exploring Challenges and Opportunities for Africa. Front. Sustain. Food Syst. 2024, 8, 1452823. [Google Scholar] [CrossRef]
  12. Trzciński, P.; Frąc, M.; Lisek, A.; Przybył, M.; Frąc, M.; Sas-Paszt, L. Growth Promotion of Raspberry and Strawberry Plants by Bacterial Inoculants. Acta Sci. Pol. Hortorum Cultus 2021, 20, 71–82. [Google Scholar] [CrossRef]
  13. Balcı, G.; Keles, H.; Cakmakcı, R. The Effects of Biofertilizers on Some Physological Responses in Heritage Raspberries. KSU J. Agric. Nat. 2020, 23, 1422–1427. [Google Scholar] [CrossRef]
  14. Kazakov, P.; Alseekh, S.; Ivanova, V.; Gechev, T. Biostimulant-Based Molecular Priming Improves Crop Quality and Enhances Yield of Raspberry and Strawberry Fruits. Metabolites 2024, 14, 594. [Google Scholar] [CrossRef]
  15. Drobek, M.; Cybulska, J.; Zdunek, A.; Sas-Paszt, L.; Frąc, M. Effect of Microbial Biostimulants on the Antioxidant Profile, Antioxidant Capacity and Activity of Enzymes Influencing the Quality Level of Raspberries (Rubus idaeus L.). Food Chem. 2024, 454, 139746. [Google Scholar] [CrossRef] [PubMed]
  16. Makonya, G.M.; Bryla, D.R.; Hardigan, M.A.; Hoashi-Erhardt, W.; DeVetter, L.W. Biostimulants with Glycine Betaine or Kelp Extract Alleviate Heat Stress in Red Raspberry (Rubus Idaeus). Sci. Rep. 2025, 15, 2251. [Google Scholar] [CrossRef]
  17. Aguilar, N.A.S.; Fuentes, J.A.G.; Luis Alonso, V.A.; López Pérez, M.G.; MacIas, J.M.; Benavides-Mendoz, A.; Morales, S.G. Effect of Elicitors and Biostimulants on the Content of Bioactive Compounds in Raspberry Fruits. Hortic. Sci. 2023, 50, 101–111. [Google Scholar] [CrossRef]
  18. R Core Team R: A Language and Environment for Statistical Computing. Available online: https://www.R-project.org/ (accessed on 9 May 2025).
  19. Kuznetsova, A.; Brockhoff, P.B.; Christensen, R.H.B.; Jensen, S.P. lmerTest: Tests in Linear Mixed Effects Models. J. Stat. Softw. 2017, 82, 1–26. [Google Scholar] [CrossRef]
  20. Lenth, R.V.; Banfai, B.; Bolker, B.; Buerkner, P.; Giné-Vázquez, I.; Herve, M.; Jung, M.; Love, J.; Miguez, F.; Piaskowski, J.; et al. Emmeans: Estimated Marginal Means, Aka Least-Squares Means. Available online: https://cran.r-project.org/web/packages/emmeans/index.html (accessed on 9 May 2025).
  21. Hothorn, T.; Bretz, F.; Westfall, P.; Heiberger, R.M.; Schuetzenmeister, A.; Scheibe, S. Multcomp: Simultaneous Inference in General Parametric Models. Biom. J. 2008, 50, 346–363. [Google Scholar] [CrossRef]
  22. Rouphael, Y.; Colla, G. Editorial: Biostimulants in Agriculture. Front. Plant Sci. 2020, 11, 40. [Google Scholar] [CrossRef]
  23. Wadas, W.; Dziugieł, T. Changes in Assimilation Area and Chlorophyll Content of Very Early Potato (Solanum tuberosum L.) Cultivars as Influenced by Biostimulants. Agronomy 2020, 10, 387. [Google Scholar] [CrossRef]
  24. Franzoni, G.; Ferrante, A. Plant Extract Improves Quality Traits of Green and Red Lettuce Cultivars. Heliyon 2024, 10, e39224. [Google Scholar] [CrossRef]
  25. Canellas, L.P.; Olivares, F.L.; Aguiar, N.O.; Jones, D.L.; Nebbioso, A.; Mazzei, P.; Piccolo, A. Humic and Fulvic Acids as Biostimulants in Horticulture. Sci. Hortic. 2015, 196, 15–27. [Google Scholar] [CrossRef]
  26. Agati, G.; Azzarello, E.; Pollastri, S.; Tattini, M. Flavonoids as Antioxidants in Plants: Location and Functional Significance. Plant Sci. 2012, 196, 67–76. [Google Scholar] [CrossRef]
  27. Francesca, S.; Najai, S.; Zhou, R.; Decros, G.; Cassan, C.; Delmas, F.; Ottosen, C.-O.; Barone, A.; Rigano, M.M. Phenotyping to Dissect the Biostimulant Action of a Protein Hydrolysate in Tomato Plants under Combined Abiotic Stress. Plant Physiol. Biochem. 2022, 179, 32–43. [Google Scholar] [CrossRef]
  28. Kravic, N.; Babic, V.; Vukadinovic, J.; Ristic, D.; Dragicevic, V.; Mladenovic Drinic, S.; Andjelkovic, V. Alteration of Metabolites Accumulation in Maize Inbreds Leaf Tissue under Long-Term Water Deficit. Biology 2021, 10, 694. [Google Scholar] [CrossRef]
  29. Neill, S.O.; Gould, K.S. Anthocyanins in Leaves: Light Attenuators or Antioxidants? Funct. Plant Biol. 2003, 30, 865–873. [Google Scholar] [CrossRef] [PubMed]
  30. Shao, L.; Shu, Z.; Sun, S.-L.; Peng, C.-L.; Wang, X.-J.; Lin, Z.-F. Antioxidation of Anthocyanins in Photosynthesis Under High Temperature Stress. J. Integr. Plant Biol. 2007, 49, 1341–1351. [Google Scholar] [CrossRef]
  31. Cerovic, Z.G.; Masdoumier, G.; Ghozlen, N.B.; Latouche, G. A New Optical Leaf-Clip Meter for Simultaneous Non-Destructive Assessment of Leaf Chlorophyll and Epidermal Flavonoids. Physiol. Plant. 2012, 146, 251–260. [Google Scholar] [CrossRef] [PubMed]
  32. Fan, K.; Li, F.; Chen, X.; Li, Z.; Mulla, D.J. Nitrogen Balance Index Prediction of Winter Wheat by Canopy Hyperspectral Transformation and Machine Learning. Remote Sens. 2022, 14, 3504. [Google Scholar] [CrossRef]
  33. Rose, M.T.; Patti, A.F.; Little, K.R.; Brown, A.L.; Jackson, W.R.; Cavagnaro, T.R. A Meta-Analysis and Review of Plant-Growth Response to Humic Substances: Practical Implications for Agriculture. Adv. Agron. 2014, 124, 37–89. [Google Scholar] [CrossRef]
  34. Ciriello, M.; Fusco, G.M.; Woodrow, P.; Carillo, P.; Rouphael, Y. Unravelling the Nexus of Plant Response to Non-Microbial Biostimulants under Stress Conditions. Plant Stress 2024, 11, 100421. [Google Scholar] [CrossRef]
  35. Aghaeifard, F.; Babalar, M.; Fallahi, E.; Ahmadi, A. Influence of Humic Acid and Salicylic Acid on Yield, Fruit Quality, and Leaf Mineral Elements of Strawberry (Fragaria × Ananassa Duch.) Cv. Camarosa. J. Plant Nutr. 2016, 39, 1821–1829. [Google Scholar] [CrossRef]
  36. Zydlik, Z.; Zydlik, P. The Effect of a Preparation Containing Humic Acids on the Growth, Yield, and Quality of Strawberry Fruits (Fragaria × Ananassa (Duchesne Ex Weston) Duchesne Ex Rozier). Agronomy 2023, 13, 1872. [Google Scholar] [CrossRef]
  37. Ladyzhenskaya, O.; Aniskina, T.; Simakhin, M.; Donskih, V.; Pashutin, V.; Tazin, I.; Kryuchkova, V. Productivity of Modern Raspberry Varieties and Prospects for Their Selection. Crops 2025, 5, 1. [Google Scholar] [CrossRef]
  38. Ortega-Farias, S.; Meza, S.E.; López-Olivari, R.; Araya-Alman, M.; Carrasco-Benavides, M. Effects of Four Irrigation Regimes on Yield, Fruit Quality, Plant Water Status, and Water Productivity in a Furrow-Irrigated Red Raspberry Orchard. Agric. Water Manag. 2022, 273, 107885. [Google Scholar] [CrossRef]
  39. Morales, C.G.; Pino, M.T.; Del Pozo, A. Phenological and Physiological Responses to Drought Stress and Subsequent Rehydration Cycles in Two Raspberry Cultivars. Sci. Hortic. 2013, 162, 234–241. [Google Scholar] [CrossRef]
  40. Sonnewald, U.; Fernie, A.R. Next-Generation Strategies for Understanding and Influencing Source–Sink Relations in Crop Plants. Curr. Opin. Plant Biol. 2018, 43, 63–70. [Google Scholar] [CrossRef] [PubMed]
  41. Spasojević, S.; Maksimović, V.; Milosavljević, D.; Djekić, I.; Radivojević, D.; Sredojević, A.; Milivojević, J. Variation in Chemical, Textural and Sensorial Traits Among Remontant Red Raspberry (Rubus idaeus L.) Cultivars Maintained in a Double-Cropping System. Plants 2024, 13, 3382. [Google Scholar] [CrossRef]
  42. Janick, J. Plant Breeding Reviews, Volume 32: Raspberry Breeding and Genetics; John Wiley & Sons: Hoboken, NJ, USA, 2011; ISBN 978-0-470-59381-3. [Google Scholar]
  43. Nardi, S.; Pizzeghello, D.; Muscolo, A.; Vianello, A. Physiological Effects of Humic Substances on Higher Plants. Soil Biol. Biochem. 2002, 34, 1527–1536. [Google Scholar] [CrossRef]
  44. Nardi, S.; Schiavon, M.; Francioso, O. Chemical Structure and Biological Activity of Humic Substances Define Their Role as Plant Growth Promoters. Molecules 2021, 26, 2256. [Google Scholar] [CrossRef] [PubMed]
  45. Milivojević, J.; Maksimović, V.; Nikolić, M.; Bogdanović, J.; Maletić, R.; Milatović, D. Chemical and Antioxidant Properties of Cultivated and Wild Fragaria and Rubus Berries. J. Food Qual. 2011, 34, 1–9. [Google Scholar] [CrossRef]
  46. Stavang, J.A.; Freitag, S.; Foito, A.; Verrall, S.; Heide, O.M.; Stewart, D.; Sønsteby, A. Raspberry Fruit Quality Changes during Ripening and Storage as Assessed by Colour, Sensory Evaluation and Chemical Analyses. Sci. Hortic. 2015, 195, 216–225. [Google Scholar] [CrossRef]
Figure 1. Estimated marginal means (EMMs) for leaf-level eco-physiological parameters as influenced by the interaction of Cultivar, Treatment, and Year: (a,b) chlorophyll content (μg cm−2); (c,d) flavonol content (A.U.); (e,f) log-transformed anthocyanin content (A.U.); (g,h) log-transformed NBI. Coloured boxplots illustrate the distribution of the raw data, while the horizontal black line represents the median. Black dots represent the estimated marginal means (EMMs), with error bars indicating 95% confidence intervals (CIs). Different lowercase letters above the error bars denote statistically significant differences among EMMs based on Sidak’s multiple comparison test (α = 0.05).
Horticulturae 11 00906 g001
Figure 2. Yield per plant according to the whole harvest window, sorted by biostimulant treatment typology: (a) AB, RY 1; (b) Z, RY 1; (c) AB, RY 2; (d) Z, RY 2. Data expressed as mean values per cv. Bars represent the standard deviation (SD).
Horticulturae 11 00906 g002
Figure 3. Estimated marginal means (EMMs) for yield parameters on log-transformed data: (a) grams of produce per plant as influenced by the interaction of Year and Treatment; (b) number of fruits per plant as influenced by the interaction of Year and Treatment; (c) Average fruit weight (AFW, grams per fruit) as influenced by Year. Coloured boxplots illustrate the distribution of the raw data, while the horizontal black line represents the median. Black dots represent the estimated marginal means (EMMs), with error bars indicating 95% confidence intervals (CIs). Different lowercase letters above the error bars denote statistically significant differences among EMMs based on Sidak’s multiple comparison test (α = 0.05).
Horticulturae 11 00906 g003
Figure 4. Estimated marginal means (EMMs) for °Brix on ‘Autumn Bliss’ samples, as influenced by the interaction of Year, Harvest, and Treatment. Coloured boxplots illustrate the distribution of the raw data, while the horizontal black line represents the median. Black dots represent the estimated marginal means (EMMs), with error bars indicating 95% confidence intervals (CIs). Different lowercase letters above the error bars denote statistically significant differences among EMMs based on Sidak’s multiple comparison test (α = 0.05).
Horticulturae 11 00906 g004
Figure 5. Estimated marginal means (EMMs) for pH on ‘Autumn Bliss’ samples, as influenced by the interaction of Year, Harvest, and Treatment. Coloured boxplots illustrate the distribution of the raw data, while the horizontal black line represents the median. Black dots represent the estimated marginal means (EMMs), with error bars indicating 95% confidence intervals (CIs). Different lowercase letters above the error bars denote statistically significant differences among EMMs based on Sidak’s multiple comparison test (α = 0.05).
Horticulturae 11 00906 g005
Figure 6. Estimated marginal means (EMMs) for titratable acidity (TA) on log-transformed data, sorted by (a) Treatment and (b) Year × Harvest, in ‘Autumn Bliss’ samples. Coloured boxplots illustrate the distribution of the raw data, while the horizontal black line represents the median. Black dots represent the estimated marginal means (EMMs), with error bars indicating 95% confidence intervals (CIs). Different lowercase letters above the error bars denote statistically significant differences among EMMs based on Sidak’s multiple comparison test (α = 0.05).
Horticulturae 11 00906 g006
Figure 7. Estimated marginal means (EMMs) for °Brix on ‘Zeva’ samples, sorted by (a) Treatment and (b) Year × Harvest. Coloured boxplots illustrate the distribution of the raw data, with black horizontal lines representing the median. Black dots represent the estimated marginal means (EMMs), with error bars indicating 95% confidence intervals (CIs). Different lowercase letters above the error bars denote statistically significant differences among EMMs based on Sidak’s multiple comparison test (α = 0.05).
Horticulturae 11 00906 g007
Figure 8. Estimated marginal means (EMMs) for pH on ‘Zeva’ samples, sorted by (a) Year × Treatment and (b) Year × Harvest. Coloured boxplots illustrate the distribution of the raw data, with black horizontal lines representing the median. Black dots represent the estimated marginal means (EMMs), with error bars indicating 95% confidence intervals (CIs). Different lowercase letters above the error bars denote statistically significant differences among EMMs based on Sidak’s multiple comparison test (α = 0.05).
Horticulturae 11 00906 g008
Figure 9. Estimated marginal means (EMMs) for titratable acidity (TA) on log-transformed data from ‘Zeva’ samples, sorted by Year × Harvest. Coloured boxplots illustrate the distribution of the raw data, with black horizontal lines representing the median. Black dots represent the estimated marginal means (EMMs), with error bars indicating 95% confidence intervals (CIs). Different lowercase letters above the error bars denote statistically significant differences among EMMs based on Sidak’s multiple comparison test (α = 0.05).
Horticulturae 11 00906 g009
Table 1. Overview regarding the investigated biostimulant products.
Treatment CodeCommercial ProductManufacturerMain ComponentsCommercial ClaimDosage (10 L)
BIO1EVEO®Thermoflora, Pordenone, ItalyFulvic and humic acidsImproved abiotic stress response20 g
BIO2BLACKJAK BIO®Sipcam Italia Spa, ItalyLeonardite
(humic acids)
Vegetative growth, photosynthesis enhancement, stress mitigation20 mL
BIO3MEGAFOL®Valagro Spa, Atessa, Chieti, ItalyPlant-based extracts (vinasse, corn steep liquor, potassium acetate, urea)Improved abiotic stress response60 mL
Table 2. ANOVA omnibus test overview regarding eco-physiological and yield parameters. F-values are provided with level of significance, denoted with bold typeface. ***, p < 0.001; **, p < 0.01; *, p ≤ 0.05.
ChlFlavAnth
(Ln)
NBI
(Ln)
g Plant−1 (Ln)Fruits Plant−1 (Ln)g Fruit−1 (Ln)
Cultivar1.43 *1.160.020.070.020.050.06
Treatment1.431.891.450.220.940.761.47
Year101.97 ***1161.48 ***44.89 ***203.91 ***0.570.0048.39 **
C × T0.070.680.270.240.30.410.69
C × Y1.730.271.310.590.710.341.38
T × Y32.80 ***7 65 ***8.75 ***8.20 ***3.56 *4.16 *1.33
C × T × Y15.08 ***4.48 ***3.23 ***3.85 **0.021.231.41
Table 3. ANOVA omnibus test overview regarding quality parameters. F-values are provided with level of significance, denoted with bold typeface. ***, p < 0.001; **, p < 0.01; *, p ≤ 0.05.
°BxpHTA (Ln)°BxpHTA (Ln)
Autumn BlissZeva
Treatment5.7 *2.778.48 ***4.37 *6.81 ***0.76
Year12.05 **0.47.42 **3.510.3231.49 ***
Harvest3.94 *2.1526.62 ***15.24 ***0.9434.7 ***
T × Y0.40.042.50.486.16 **0.44
T × H1.693.37 **1.481.490.530.78
Y × H15.32 ***10.92 ***23.33 ***7.29 **59.47 ***25.95 ***
T × Y × H2.47 *5.89 ***1.310.520.331.21
Table 4. Estimated marginal means (EMMs) for chlorophyll content and flavonols sorted by Cultivar, Year, and Treatment. Standard error (SE) and confidence intervals (95% CIs) are provided.
FactorLevelChlorophyll Content (µg cm−2)Flavonols (A.U.)
95% CI 95% CI
MeanSELowerUpperMeanSELowerUpper
CultivarAB22.210.2021.8022.621.930.021.891.97
Z21.700.1421.4121.991.910.011.881.94
Year2322.520.1322.2422.792.050.012.032.08
2421.390.1321.1221.661.790.011.761.81
TreatmentBIO121.870.2521.3722.371.930.021.881.97
BIO222.080.2521.5722.581.910.021.871.96
BIO321.590.2521.0922.091.880.021.841.93
C22.280.2521.7722.781.960.021.912.01
Table 5. Estimated marginal means (EMMs) for anthocyanins and NBI sorted by Cultivar, Year and Treatment. Standard error (SE) and confidence intervals (95% CIs) are provided.
FactorLevelAnthocyanins (A.U.)NBI
95% CI 95% CI
MeanSELowerUpperMeanSELowerUpper
CultivarAB0.180.000.170.1811.110.1510.8011.42
Z0.180.000.170.1812.530.1512.2212.84
Year230.190.000.180.1911.840.2411.3512.33
240.170.000.170.1711.800.1711.4512.14
TreatmentBIO10.180.000.170.1811.690.2911.0912.28
BIO20.170.000.170.1812.010.2911.4112.61
BIO30.180.000.180.1911.910.2911.3112.50
C0.180.000.170.1811.670.2911.0812.27
Table 6. Estimated marginal means (EMMs) for plant yield, fruit set, and average fruit weight sorted by cultivar, year, and treatment. Standard error (SE) and confidence intervals (95% CIs) are provided.
FactorLevelPlant Yield (g Plant−1)Fruit Set (Fruit Plant−1)Avg. Fruit Weight (g Fruit−1)
95% CI 95% CI 95% CI
MeanSELowerUpperMeanSELowerUpperMeanSELowerUpper
CultivarAB332.4828.75273.60391.37241.9617.33206.45277.471.370.041.301.44
Z343.4120.33301.77385.05249.9812.26224.87275.091.360.031.311.41
Year23330.3519.45291.04369.66246.4812.00222.28270.681.340.021.291.38
24345.5419.45306.23384.85245.4612.00221.26269.661.390.021.341.44
TreatmentBIO1314.8035.21242.68386.91230.1221.23186.64273.611.370.041.281.46
BIO2377.8335.21305.71449.95270.1221.23226.64313.611.380.041.291.47
BIO3310.2835.21238.16382.39236.9621.23193.47280.451.290.041.201.38
C348.8835.21276.76421.00246.6721.23203.18290.151.420.041.331.51
Table 7. Estimated marginal means (EMMs) for soluble solid content (SSC), pH, and titratable acidity (TA) sorted by year, harvest and treatment in ‘Autumn Bliss’ (AB), and ‘Zeva’ (Z). Standard error (SE) and confidence intervals (95% CIs) are provided.
CultivarFactorLevelSSC (°Brix)pHTA (g L−1 Citric Acid)
95% CI 95% CI 95% CI
MeanSELowerUpperMeanSELowerUpperMeanSELowerUpper
ABYear2310.620.2010.2111.032.980.012.953.0126.510.4825.5527.47
2411.590.2011.1812.002.970.012.943.0024.350.4823.3925.31
HarvestEarly11.610.2411.1112.102.950.022.912.9827.730.5826.5528.90
Inter.11.050.2410.5611.542.990.022.963.0322.370.5821.2023.55
Late10.650.2410.1611.142.980.022.943.0126.190.5825.0127.36
TreatmentBIO110.620.299.9611.282.950.022.903.0127.230.6825.8728.58
BIO210.780.2910.1211.443.000.022.943.0522.970.6821.6124.33
BIO312.110.2911.4512.773.010.022.963.0725.290.6823.9326.65
C10.900.2910.2411.562.930.022.872.9826.230.6824.8727.59
95% CI 95% CI 95% CI
MeanSELowerUpperMeanSELowerUpperMeanSELowerUpper
ZYear2310.550.1710.1810.922.960.012.942.9728.990.6227.6630.32
2410.900.1710.5311.272.960.012.952.9824.990.6223.6526.32
HarvestEarly10.840.2010.4311.252.950.012.932.9731.250.7029.8032.70
Inter.11.290.2010.8811.702.960.012.952.9824.230.7022.7725.68
Late10.050.209.6410.462.970.012.952.9825.480.7024.0326.93
TreatmentBIO110.480.299.8011.162.960.012.942.9827.361.0724.9029.82
BIO210.030.299.3510.712.990.012.973.0125.781.0723.3228.24
BIO311.470.2910.7912.152.960.012.942.9826.821.0724.3629.28
C10.930.2910.2511.612.930.012.912.9527.991.0725.5330.45
Disclaimer/Publisher’s Note: The statements, opinions and data contained in all publications are solely those of the individual author(s) and contributor(s) and not of MDPI and/or the editor(s). MDPI and/or the editor(s) disclaim responsibility for any injury to people or property resulting from any ideas, methods, instructions or products referred to in the content.

