Article

Amaranth Microgreen Cultivation: Seeding Density, Substrate Type, Electrical Conductivity, and Application Interval of Nutrient Solutions

by
Mairton Gomes da Silva
1,*,
Hans Raj Gheyi
2,*,
Izaiana dos Santos Barros
1,
Edna de Souza Souza
1,
Andressa dos Santos Rodrigues
1,
Toshik Iarley da Silva
1,
Luan Silva Sacramento
1 and
Glaucia Silva de Jesus Pereira
1
1
Center for Agrarian, Environmental and Biological Sciences, Federal University of Recôncavo da Bahia, Cruz das Almas 44380-000, BA, Brazil
2
Center of Technology and Natural Resources, Federal University of Campina Grande, Campina Grande 58429-900, PB, Brazil
*
Authors to whom correspondence should be addressed.
Horticulturae 2025, 11(8), 870; https://doi.org/10.3390/horticulturae11080870
Submission received: 4 June 2025 / Revised: 17 July 2025 / Accepted: 19 July 2025 / Published: 24 July 2025
(This article belongs to the Special Issue Production and Cultivation of Microgreens)

Abstract

The present study aimed to optimize amaranth microgreen production by evaluating key factors such as the seeding density (SD), substrate type (ST), electrical conductivity (EC), and the application intervals of the nutrient solution. A split-plot experimental design was employed, with three EC levels (tap water at 0.3 dS m−1) and nutrient solutions at 1.0 (50% half-strength) and 2.0 dS m−1 (100% full-strength) assigned to the main plots. The subplots combined two ST (coconut fiber and phenolic foam) with four SD (25, 50, 75, and 100 g m−2). Two experiments were conducted using this setup, varying the application intervals of water or nutrient solutions for either two or four hours. Asteca amaranth microgreens were cultivated for eight days (a total of 10 days from sowing). The traits analyzed were seedling height (SH), seedling fresh matter (SFM), SFM yield (SFMY), seedling dry matter (SDM), SDM yield (SDMY), water content in seedling, and water productivity of SFM. The results showed that using a half-strength nutrient solution was sufficient for amaranth production compared to using water alone. Coconut fiber outperformed phenolic foam across all evaluated parameters. Based on these findings, we recommend cultivating amaranth microgreens at a SD of 80 g m−2 on coconut fiber substrate using a nutrient solution of 1.0 dS m−1 EC applied at 2 h intervals.

1. Introduction

Cultivating microgreens has gained increasing popularity due to their high nutritional value and rapid growth cycle. Harvest typically occurs during the seedling stage when the cotyledon leaves are fully developed, usually between one and three weeks after sowing [1,2,3]. Despite the brief cultivation period, both the quality and yield of microgreens are highly influenced by growing conditions, including substrate type (ST) [4,5,6,7], seeding density (SD) [8,9], and nutrient solution composition [10,11,12], among other factors. Microgreen production is labor-efficient and can be easily integrated into hydroponic systems, as it utilizes the basic inputs—substrates and nutrient solutions [13,14]. Furthermore, microgreens can be grown in small spaces such as indoor environment and even within homes using artificial lighting [14,15,16]. They can also be cultivated in greenhouses (with natural light and/or supplemental artificial lighting) [8,17,18,19].
Regarding the growth medium, a variety of materials can be used as substrates for growing microgreens, such as rockwool, perlite, pumice, expanded clay, hemp, and coconut coir dust (coconut fiber) [13,20,21,22,23,24]. According to Bantis and Koukounaras [25], an ideal substrate should serve as both a water and nutrient reservoir while allowing easy absorption by the seedlings. The selection of a substrate is largely influenced by the availability of local materials, with growers often choosing options that offer both cost-effectiveness and technical suitability for their specific production systems. Coconut fiber, standing out as a widely available and cost-effective substrate, has proven to be both an economically viable and technically recommended alternative for cultivating various plant species [20,22]. For instance, earthworm humus, coconut fiber, blotting paper, and soil were evaluated as substrates for rocket (Eruca sativa Miller) [21] and beet (Beta vulgaris L.) [26] microgreens. Both coconut fiber and earthworm humus yielded higher fresh and dry mass of rocket microgreens. In the case of beet microgreens, coconut fiber produced the highest fresh mass, while both coconut fiber and earthworm humus demonstrated superior performance in dry mass accumulation. Similarly, green and red basil (Ocimum basilicum L.) and rocket microgreens were grown using three different substrates (coconut fiber, vermiculite, and jute) [27]. The results varied significantly depending on both the ST and plant species. Specifically, green basil cultivated in coconut fiber exhibited the highest fresh mass yield, whereas red basil and rocket achieved the highest yields when grown in vermiculite and jute, respectively.
Phenolic foam is another substrate commonly used for hydroponic seedling production and, as previously mentioned, can be readily adapted for microgreen cultivation. In a study on rocket microgreens, phenolic foam was evaluated together with four other substrates (CSC® vermiculite, S10 Beifiur® organic, Carolina Soil® seedlings, and Carolina Soil® organic) [28]. The results varied depending on the ST and irrigation method (only with water or with nutrient solution). In another study involving rocket microgreens, phenolic foam was also used as the growing medium [29]. Despite its use in these studies, research specifically evaluating phenolic foam as a substrate for microgreen production remain limited.
Regarding SD, the production costs associated with seeds are high as large quantities of seeds per unit area are required [9,29]. SD varies depending on factors such as seed size [18,30,31] and species being cultivated [2,5,7,9,12,15,32]. Increasing SD enhances fresh biomass yield up to a threshold, as demonstrated in studies with radish (Raphanus sativus) by Thuong and Minh [33] and with rocket by Lerner et al. [34]. However, beyond this optimum point, excessive seedling density intensifies competition for light, water, and nutrients, leading to reduced individual seedling development and consequently lower yield per area [35]. Moreover, higher SD promotes hypocotyl elongation, producing more fragile seedlings that are more susceptible to damping-off disease [36]. The SD has been widely studied across various plant species, such as red beet (Beta vulgaris L. ssp. esculenta) [8], red cabbage (Brassica oleracea var. capitata f. rubra) [36], kohlrabi (Brassica oleracea convar. acephala var. gongylodes L.), mustard (Sinapis alba), and radish (Brassica oleracea) [37].
As previously noted, concentration of nutrient solution is another critical factor in microgreen production. Numerous studies have reached a consensus that irrigation with water alone is insufficient to produce microgreens that meet commercial quality standards [25,28,29,34,38]. The concentration of nutrient in hydroponic solutions is commonly measured through electrical conductivity (EC). Microgreen responses to nutrient availability depend on the cultivated species and vary according to the applied EC level. For instance, in a study conducted by El-Nakhel et al. [10], the use of nutrient solution with an EC of 0.4 dS m−1 (equivalent to 25% of Hoagland solution) resulted in fresh weight productivity increases of approximately 90, 14, and 10% in rocket, green Brussels sprouts (Brassica oleracea var. gemmifera), and green cabbage (Brassica oleracea var. capitata), respectively, compared to plants irrigated with distilled water. Similarly, Lerner et al. [34] evaluated rocket microgreens irrigated with tap water (EC of 0.15 dS m−1) and three nutrient solutions with EC levels of 1.0, 2.0, and 3.0 dS m−1, corresponding to 50, 100, and 150% concentrations of the formulation proposed by Santos [39]. Conducted across two growing seasons (winter and spring), the study identified 1.0 dS m−1 EC as the optimal level for microgreen growth.
These results underscore the importance of applying nutrient solutions tailored to specific microgreen production systems. Importantly, higher nutrient concentrations do not necessarily result in greater seedling yields. Thus, the optimal combination of the production factors—such as ST, SD, and nutrient concentration—varies according to the cultivated species, highlighting the need for species-specific adjustments. Several studies have investigated the interaction among these factors across different microgreen crops. For instance, research has examined the effect of varying ST and nutrient solution concentrations on the growth of rocket [28] and purple cabbage [38], as well the interaction between ST and SD in radish [33]. The combined effects of nutrient solution concentration and SD have also been analyzed in rocket [29,34], kohlrabi, mustard, and radish [37].
In addition to key factors, microgreen cultivation systems also require careful management practices, particularly in the application of nutrient solutions and/or water. Automation of these processes is especially important for commercial-scale operations. In small-scale experiments, irrigation is typically performed manually [22,25,29,35,40], whereas larger-scale studies often employ automated irrigation systems [8,28,34,38]. For instance, Tavan et al. [41] implemented a sensor-based irrigation system in a soilless vertical farming setup to cultivate Toscano black kale (Brassica oleracea var. acephala) microgreens. Despite advances in automation, no studies to date have specifically evaluated the optimal intervals for nutrient solution application throughout the day in substrate-based systems. Therefore, in addition to ST, SD, and nutrient solution concentration (expressed in terms of EC), integrated management represents a critical component for optimizing microgreen production systems.
The present study evaluated the four key cultivation factors (ST, SD, EC, and nutrient solution application intervals) for the production of amaranth (Amaranthus cruentus L.) microgreens. These factors were selected due to the limited availability of consistent and comprehensive information on the cultivation of this species. In Brazil, the Asteca is the predominant commercial cultivar used for microgreen production. It was chosen for this study because of its characteristic red/purple foliar pigmentation [42], which enhances its visual appeal for fresh salads and represents a strategic approach for diversifying amaranth crop applications [43]. SD has shown considerable variation across previous studies on amaranth microgreens, with reported values of 53 [44,45], 96 [46], and 120 g m−2 [47]. Arya et al. [47] found that cultivation in cocopeat resulted in higher fresh and dry matter yields compared to other substrates (sterile sand, coir mat, tissue paper, and newspaper). Gunjal et al. [48] reported no significant differences (p > 0.05) in microgreen yield between cocopeat-based substrates and sandy loam soil. Other studies have used a variety of substrates, including a soil mixture (composed of 60% loam, 25% sand, and 15% compost) [43], as well as peat [44,49] and burlap [50]. Thus, similar to SD, the choice of substrate for cultivation of amaranth microgreens has varied widely across studies. With the exception of Meas et al. [44] and Gudžinskaitė et al. [49], who did not specify the irrigation water used, all other studies relied exclusively on irrigations only with water, i.e., without addition of nutrients.
Given these considerations, this study aimed to evaluate amaranth microgreen response to different cultivation conditions, including SD, ST, EC, and nutrient solution application intervals.

2. Materials and Methods

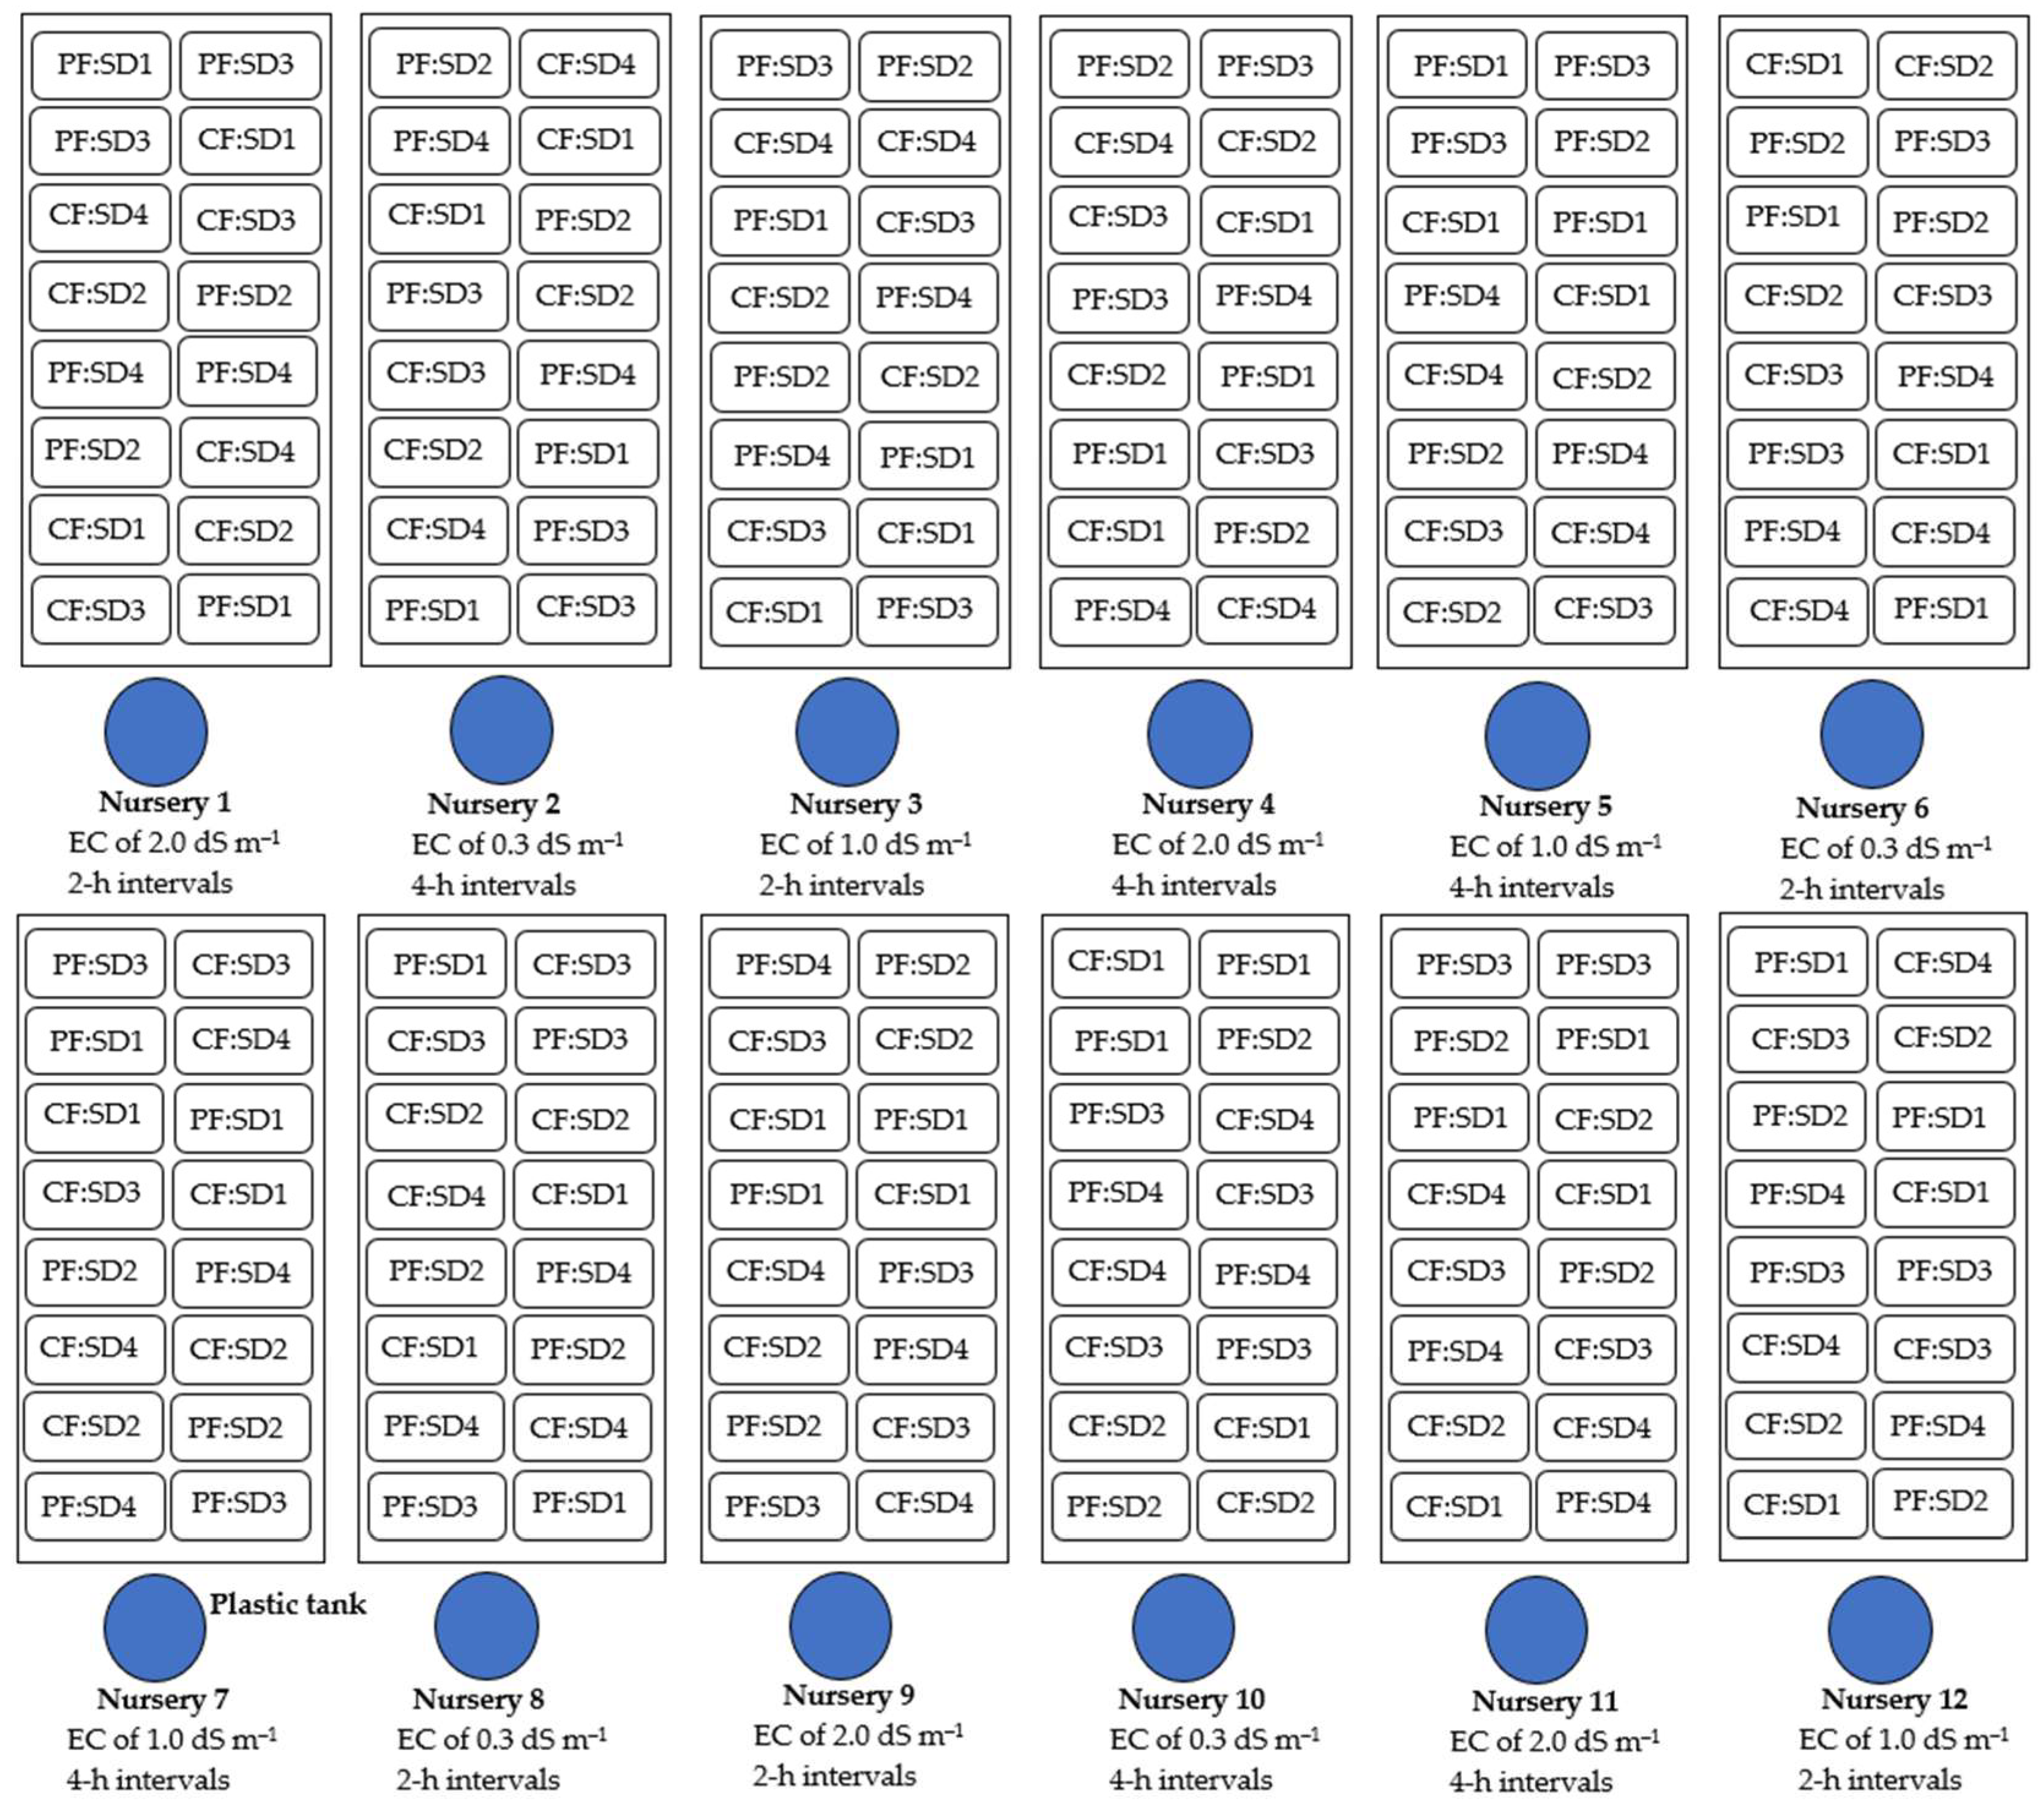
2.1. Study Site, Experimental Design, and Growth Conditions

The study was conducted in a greenhouse (7.0 m wide and 24 m long) located within the experimental area of the Post Graduate Program in Agricultural Engineering at the Federal University of Recôncavo da Bahia (UFRB), in Cruz das Almas-BA (12°40′19″ S, 39°06′23″ W, at an elevation of 220 m), Brazil. The greenhouse (east–west orientation and operating under uncontrolled conditions with natural sunlight) was protected on sides by black screens with 70% shading, and the roof was covered with 150 μm thick polyethylene transparent film. A reflective aluminized screen was installed at a ceiling height of 2.5 m. To monitor environmental conditions, a DHT11 sensor was positioned 2.0 m above ground level at the center of greenhouse to measure air temperature and relative humidity of air. This sensor was connected to an Arduino Uno equipped with a data logging shield integrating a real-time clock (RTC) for tracking date, time, and calendar data. All components were sourced from a Brazilian supplier (Usina Ind. Comércio e Importação, Santo Ângelo, RS, Brazil). The recorded data were stored on a memory card, with means logged every minute. During the experimental period, air temperatures ranged from a minimum 24.45 °C to a maximum 33.84 °C, with a mean of 27.47 ± 2.25 °C. Relative humidity values varied between 65.94 and 94.99%, with a mean of 86.62 ± 6.67%.
Two experiments were conducted simultaneously under the same experimental design. A split-plot arrangement was employed with three levels of electrical conductivity (EC) (tap water at 0.3 dS m−1 and nutrient solutions with EC levels at 1.0 and 2.0 dS m−1) assigned to main plots. The subplots consisted of a combination of two substrate types (ST) (coconut fiber and phenolic foam) and four seeding densities (SD) (25, 50, 75, and 100 g m−2), with four replications. Within this setup, in each experiment the application intervals of nutrient solution or water varied either every two or four hours. Six cultivation nurseries receiving nutrient solution or water at 2 h intervals were grouped into one experimental set, while those the other six nurseries with 4 h intervals formed a separate experimental group (Figure 1).
The EC levels of 1.0 and 2.0 dS m−1 corresponded to 50 and 100% concentrations, respectively, of the macronutrient formulation proposed by Furlani et al. [51] for leafy vegetables. The following nutrient concentrations were used (in mg L−1) at 50 (half-strength) and 100% (full-strength), respectively: 375 and 750 calcium nitrate, 250 and 500 potassium nitrate, 75 and 150 monoammonium phosphate, and 200 and 400 magnesium sulfate. Micronutrients were provided using 12.5 and 25.0 mg L−1 of Micromix® and 8.0 and 16.0 mg L−1 of GeoQuel® 13% Fe-EDTA (Rigrantec Tecnologias para Sementes e Plantas Ltd., Porto Alegre, RS, Brazil). All nutrient solutions were prepared using deionized water to ensure precise control of nutrient concentrations. Electrical conductivity was measured using a DM-3P benchtop conductivity meter (Digimed Analítica Ltd., São Paulo, Brazil).
The SD was established using Styrofoam trays with 15 × 22 cm with a usable area of 201.25 cm2 (11.5 cm × 17.5 cm), following Meas et al. [44]. In that study, 2 g of amaranth seeds were sown in a 17 × 22 cm tray, corresponding to an estimated density of approximately 50 g m−2. Based on this reference, the present study adopted both lower (25 g m−2) and higher (75 and 100 g m−2) SD.
Asteca amaranth seeds (Isla® Sementes, Porto Alegre, RS, Brazil) were sown on 30 April 2024. Regarding the substrate, a layer of approximately 1.0 cm of Golden Mix coconut fiber (pH = 6.0 ± 0.3 and EC = 1.2 ± 0.6 dS m−1—values obtained from the manufacturer specifications) (Amafibra Ltd., Artur Nogueira, SP, Brazil) was placed in each tray. For the phenolic foam treatment, 1.0 cm thick Seicho® foam specifically developed for microgreen cultivation (pH = 4.3 and EC = 0.2 dS m−1—values obtained from the manufacturer specifications) (Mizu Indústria e Comércio de Produtos Ornamentais e Agrícolas, Holambra, SP, Brazil) was used. Both substrates were moistened prior to sowing. Subsequently, the seeds were evenly distributed over the substrates at the specified densities (0.5, 1.0, 1.5, or 2.0 g tray−1, corresponding to 25, 50, 75, and 100 g m−2, respectively). After sowing, trays were kept covered for two days before being transferred to the hydroponic system.
The hydroponic system consisted of 12 cultivation nurseries. Each nursery included a cultivation bench (constructed from a plastic corrugated roof sheet measuring 2.44 × 0.50 m, installed at a 6% slope). A 34 W electric drain pump originally designed for washing machines (Samatec Comerce Serviços e Peças Ltd., Santo André, SP, Brazil) was used to inject either nutrient solution or water to the bench top. A 60 L plastic reservoir served as the storage tank for the nutrient solution or water (with an effective volume of 50 L). To facilitate capillary irrigation, a double-sided plastic sheet was placed on the bench, with the white side facing outward. The trays had perforated bottoms allowing the substrate to be moistened from below. When the nutrient solution or water was injected onto the surface of the plastic sheet, it spread evenly and reach the trays through capillary action. A 20 mm diameter PVC pipe perforated with 4 cm spaced holes was installed along the upper section of each nursery to distribute the solution or water uniformly at a flow rate of 0.7 L min−1. Within each main plot (i.e., each nursery), two replications of each ST and SD treatments were arranged, totaling 16 trays per nursery, as shown in Figure 1. Regarding irrigation scheduling, nurseries were grouped by application interval: nurseries 1, 3, 6, 8, 9, and 12 operated at 2 h intervals, while nurseries 2, 4, 5, 7, 10, and 11 operated at 4 h intervals. Each system functioned independently and was controlled by an analog timer, which automatically delivered nutrient solution or water every two or four hours for a duration of 15 min per irrigation event, between 8:00 a.m. and 6:00 p.m., with no irrigation during nighttime.

2.2. Evaluated Variables

At 10 days after sowing (corresponding to eight days under experimental conditions), all seedlings from each tray were harvested by cutting approximately 5 mm above the substrate surface. The following variables were evaluated: seedling height (SH, in cm) and seedling fresh matter (SFM, in g tray−1). SH was measured using a graduated ruler. All seedlings from each tray were weighed collectively using a precision balance (0.01 g resolution) (BEL Equipamentos Analíticos Ltd., Piracicaba, SP, Brazil). Immediately after fresh weight measurement, the seedlings were placed in paper bags and dried in a Q314M forced-air oven (Quimis®, Diadema, SP, Brazil) at 65 °C until reaching constant weight to determine seedling dry matter (SDM, in g tray−1). The values of SFM and SDM were then used to estimate amaranth microgreen yield on per-square-meter basis, expressed in kg m−2 and g m−2, respectively. All analyses were performed using the same methodology as described by Barros et al. [14] and Silva et al. [29].
Water content (WC) was calculated based on the difference between the fresh (FM) and dry (DM) matter of microgreen seedlings using the following equation: WCS (%) = [(FM − DM)/FM] × 100. Water productivity was evaluated by determining the volume of water or nutrient solution consumed (WC) to produce 1 kg of SFM of amaranth microgreens. Water consumption was determined at the end of the experiment by restoring all reservoirs to their initial volume of 50 L, using tap water for treatments without nutrient solution and distilled water for those with nutrient solution.

2.3. Statistical Analysis

The Shapiro–Wilk test (p ≤ 0.05) was used to evaluate data normality, followed by analysis of variance by the F-test (p ≤ 0.05). Tukey’s test (p ≤ 0.05) compared the means obtained according to EC levels (nutrient solution or water) and ST. The data on SD were analyzed by polynomial (linear and quadratic) regression analysis. The statistical analysis was performed with the SISVAR 5.3 statistical program [52]. All graphs were created using Microsoft Excel® 2019 Professional Plus.

3. Results

As shown in Figure 2, amaranth microgreens grown in coconut fiber exhibited superior growth compared to those cultivated in phenolic foam. Additionally, plants irrigated with nutrient solutions outperformed those receiving only tap water. Visual assessments also indicated progressively improved production with increasing seeding densities (SD—50, 75, and 100 g m−2) relative to the lowest SD (25 g m−2).
Table 1 presents the traits evaluated in the experiment: seedling height (SH), seedling fresh matter (SFM), SFM yield (SFMY), seedling dry matter (SDM), SDM yield (SDMY), water content in seedlings (WCS), and water productivity (WP) of SFM. The isolated effects of levels of electrical conductivity (EC) (nutrient solution or tap water) and substrate types (ST) significantly influenced SH, as well as WCS in addition to the SD under cultivation with nutrient solution or tap water application at 2 h intervals. All isolated factors and all interactions significantly affected SFM and SFMY. For SDM and SDMY, isolated factors also had significant effects; however, significant interactions occurred only between EC levels and SD and between ST and SD. Similarly, all isolated factors significantly influenced WP, with significant interactions observed between EC levels and ST and between EC levels and SD.
In the experiment where nutrient solutions or tap water were applied at 4 h intervals, SH exhibited a response similar to that observed under 2 h intervals (Table 1). All isolated factors significantly affected all traits, except for WCS, which was influenced only by ST and SD. All interactions significantly affected SFM and SFMY, except for the interaction between EC levels and ST in SDM and SDMY. Similar to the responses observed for SDM and SDMY, significant interactions were also found for WP. In contrast, WCS was significantly influenced by all interactions.
In both experiments, where a nutrient solution or tap water was applied every two or four hours (Figure 3A), the highest SH values were observed in treatments using nutrient solutions, with increases of approximately 27 and 32%, respectively, compared to tap water. Similarly, SH increased by about 23 and 25% in amaranth microgreens grown on coconut fiber compared to those cultivated on phenolic foam.
Table 2 presents the follow-up analysis of SFM and SFMY for the experiment in which nutrient solution or tap water was applied at 2 h intervals, revealing a similar trend for both traits. As with SH, microgreens cultivated exclusively in water (EC of 0.3 dS m−1) exhibited lower overall mean values of SFM and SFMY, varying depending on ST and SD. Cultivation with nutrient solutions at EC levels of 1.0 or 2.0 dS m−1 showed that SFM and SFMY mean values varied according to ST and SD. For instance, except under the lowest SD (25 g m−2), the highest SFM and SFMY means were observed with coconut fiber compared to phenolic foam at 1.0 dS m−1, whereas, at 2.0 dS m−1 EC, the highest values for both traits were observed at SD values of 50 and 100 g m−2.
In other combinations, the data were well-fitted to the quadratic model when analyzing SD within each ST and EC level, except when combining phenolic foam and tap water, which did not achieve a satisfactory fit of any regression model to describe the data (Table 2). In the combination of coconut fiber substrate and tap water, the highest SFM and SFMY means were 11.20 g tray−1 and 0.683 kg m−2, estimated at SD values of approximately 80 and 93 g m−2, respectively. Under 1.0 dS m−1 EC, SFM values were 14.10 and 24.85 g tray−1 for phenolic foam and coconut fiber, occurring at SD values of around 70 and 79 g m−2, respectively. For SFMY, the corresponding estimates were 0.731 and 1.030 kg m−2 at SD values of approximately 72 and 69 g m−2, respectively. At 2.0 dS m−1 EC, SFM values of 15.80 g tray−1 (phenolic foam) and 22.65 g tray−1 (coconut fiber) were estimated at SD values of around 67 and 71 g m−2, respectively. The highest SFMY values—0.691 and 1.415 kg m−2—were estimated at SD of approximately 62 and 83 g m−2 for phenolic foam and coconut fiber, respectively.
In the experiment where nutrient solution or tap water was applied at 4 h intervals, SFM and SFMY varied significantly with EC levels, depending on ST and SD (Table 3). For instance, under cultivation with tap water and nutrient solution at 1.0 dS m−1 EC, the highest SFM and SFMY means were observed in treatments using coconut fiber compared to phenolic foam, except at the lowest SD (25 g m−2), where no significant differences were detected. At 2.0 dS m−1 EC, no significant differences were observed under the highest SD (100 g m−2). When analyzing SD within each treatment combination, no regression model provided a satisfactory fit for cultivation with tap water or with nutrient solution at 1.0 dS m−1 EC using phenolic foam. However, under the same EC condition using coconut fiber, the data were well fitted to quadratic and linear models. For cultivation with tap water, the maximum estimated SFM and SFMY values were 13.87 g tray−1 and 0.547 kg m−2, respectively, at SDs of approximately 80 and 69 g m−2. At 1.0 dS m−1 EC, SFM values at SDs of 25 and 100 g m−2 were 11.52 and 25.27 g tray−1, while SFMY values were 0.572 and 1.262 kg m−2, respectively. At 2.0 dS m−1 EC, the data for phenolic foam fitted a linear model with SFM increasing from 5.72 and 16.61 g tray−1 and SFMY from 0.284 and 0.824 kg m−2 as SD increased from 25 to 100 g m−2. In contrast for coconut fiber under same EC level, no regression model adequately described the data.
In the follow-up analysis of the interaction between EC levels and SD for SDM (Figure 3B) and SDMY (Figure 3D) under 2 h intervals, the highest mean values were observed with nutrient solutions treatments, regardless of SD, consistent with the trends observed for SFM and SFMY. Both SDM and SDMY increased with increasing SD at all EC levels. For instance, SDM values ranged from 0.334 and 0.881 g tray−1 at 0.3 dS m−1, from 0.567 to 1.347 g tray−1 at 1.0 dS m−1, and from 0.614 to 1.319 g tray−1 at 2.0 dS m−1, across SD of 25 to 100 g m−2. Similarly, SDMY values ranged from 16.64 to 44.13 g m−2, 18.20 to 56.89 g m−2, and 30.48 to 65.58 g m−2, respectively. Likewise, cultivation in coconut fiber substrate consistently resulted in higher SDM (Figure 3C) and SDMY (Figure 3E) across all SD compared to phenolic foam. Both SDM and SDMY increased with SD. For SDM, values ranged from 0.573 to 1.488 g tray−1 in coconut fiber and from 0.437 to 0.880 g tray−1 in phenolic foam. For SDMY, values ranged from 28.48 to 74.01 g m−2 and from 21.73 to 43.73 g m−2, respectively.
In the experiment involving nutrient solutions or tap water at 4 h intervals, SDM and SDMY responded differently to the combinations of EC levels and ST at each SD (Table 3). For instance, the coconut fiber substrate consistently presented the highest mean values under most conditions, except at SD of 25 g m−2 (EC levels of 0.3 and 1.0 dS m−1) and 75 g m−2 (2.0 dS m−1 EC), where no significant differences were observed. When SD was analyzed within each treatment combination, a linear response was observed for SDM and SDMY in coconut fiber substrate at EC levels of 1.0 and 2.0 dS m−1. At SD of 25 and 100 g m−2, SDM values ranged from 0.667 to 1.642 g tray−1 at 1.0 dS m−1 and from 0.687 to 1.662 g tray−1 at 2.0 dS m−1. Corresponding SDMY values increased from 33.33 to 81.87 g m−2 and from 34.18 to 82.72 g m−2, respectively. In contrast, cultivation in phenolic foam followed a quadratic regression model when irrigated with tap water, with maximum SDM and SDMY values estimated at 0.854 g tray−1 and 48.52 g m−2, respectively, at SD of approximately 79 and 87 g m−2. For phenolic foam under nutrient solution treatments, a linear model was appropriate for 1.0 dS m−1 EC, where SDM increased from 0.506 to 0.964 g tray−1, and SDMY from 25.19 to 47.77 g m−2 across SD of 25 to 100 g m−2. At 2.0 dS m−1 EC, a quadratic model best described the data with maximum SDM and SDMY values estimated at 0.969 g tray−1 and 47.97 g m−2 at SD of approximately 82 and 94 g m−2, respectively).
In the experiment where nutrient solution or tap water was applied at 2 h intervals, the WCS decreased with increasing SD, ranging from 93.40% at 25 g m−2 to 90.87% at 100 g m−2 (Figure 3F). As observed for traits, the lowest WCS values occurred under cultivation with tap water and phenolic foam substrate (Figure 3G). Under 4 h irrigation intervals (Table 3), coconut fiber substrate exhibited higher WCS than phenolic foam only at an SD of 50 g m−2 when irrigated with tap water. At 1.0 dS m−1 EC, the superiority of coconut fiber was not observed only at 25 g m−2. At 2.0 dS m−1 EC, WCS was higher at the lowest SD using coconut fiber substrate, but the mean value was lower than that of phenolic foam at the highest SD. When evaluating SD within each combination, data from coconut fiber at 2.0 dS m−1 EC followed a linear trend, with WCS decreasing from 95.03 to 90.06% as SD increased from 25 to 100 g m−2. In contrast, under cultivation with tap water, a quadratic regression model best described the data with maximum WCS of 93.21% estimated at SD of approximately 67 g m−2. For phenolic foam, satisfactory model fits were found only at 1.0 dS m−1 EC, where a linear model indicated a decline in WCS from 92.71 to 88.96% across the same SD range.
Regarding WP, the experiment with 2 h interval applications of nutrient solutions or tap water demonstrated that cultivation at the lowest SD (25 g m−2) required the highest water volumes—204.11, 104.57, and 101.47 L kg−1—at EC levels of 0.3, 1.0, and 2.0 dS m−1, respectively. The lowest WP values (i.e., highest efficiency) were estimated at SDs of approximately 81, 74, and 71 g m−2, corresponding to mean water volumes of 93.19, 42.25, and 36.89 L kg−1, respectively (Figure 3H). When EC levels were analyzed within each SD, cultivation with water alone consistently required significantly greater water volumes than nutrient solutions, regardless of SD. In the follow-up analysis of the interaction between EC levels and ST (Figure 3I), cultivation in phenolic foam demanded significantly more water than cultivation in coconut fiber. Similarly, the use of water alone resulted in higher water consumption compared to nutrient solution treatments.
In the experiment with 4 h interval applications of nutrient solutions or tap water, similar trends were observed regarding to the use of water (EC of 0.3 dS m−1). The lowest SD (25 g m−2) again resulted in the highest water requirements, with estimated values of 203.42 and 211.28 L kg−1 for coconut fiber and phenolic foam substrates, respectively (Table 3). The lowest WP values were estimated at SDs of approximately 78 and 83 g m−2, corresponding to WP of 30.19 and 83.68 L kg−1, respectively. When cultivated with a 1.0 dS m−1 EC, only the coconut fiber substrate yielded a satisfactory regression model fit, with estimated WP decreasing from 60.21 and 21.04 L kg−1 at SD increased from 25 to 81 g m−2. At the highest EC level (2.0 dS m−1), only the phenolic foam substrate showed a satisfactory regression model fit, with water requirements ranging from 147.84 to 32.52 L kg−1 at SD of 25 to 82 g m−2, respectively. When analyzing ST and EC levels within each SD, phenolic foam showed the highest water requirements at EC levels of 0.3 and 1.0 dS m−1, except at the lowest SD (25 g m−2), where no significant differences were detected between substrates. At 2.0 dS m−1, phenolic foam showed the highest water requirements at an SD of 25 and 50 g m−2, with no significant differences observed at higher SD. Overall, when analyzing SD and EC levels within each ST, amaranth microgreens cultivated with water alone consistently required greater water volumes than those grown with nutrient solutions.

4. Discussion

The absence of significant isolated or interaction effects on amaranth SH (Table 1) suggests that light competition was not intensified under the experimental conditions, even at higher SD. SH is a critical parameter for microgreens quality, as excessive elongation may compromise structural fragility and increase susceptibility to damping-off diseases, as noted by various authors [36,53]. Additionally, SH directly influences the feasibility and efficiency of harvesting operations [34,54,55,56]. In the present study, seedlings grown in coconut fiber substrate and irrigated with nutrient solutions (isolated effects, Figure 3A) exhibited greater SH compared to those grown with tap water and phenolic foam. Notably, the half-strength nutrient solution (EC of 1.0 dS m−1) supported SH equivalent to that of full-strength solution (EC of 2.0 dS m−1), indicating potential for input optimization. These findings align with Lerner et al. [34], who emphasized the importance of nutrient supplementation for achieving optimal shoot development in microgreens.
Fresh biomass is a key parameter in the commercial value of microgreens. In the present study, the SFMY under cultivation in phenolic foam increased by 3.6- and 3.4-fold at EC levels of 1.0 and 2.0 dS m−1, respectively, compared to cultivation with tap water at 2 h intervals. When cultivated in coconut fiber, the increases were 1.5- and 2.1-fold at the same EC levels. In the experiment with nutrient solution or tap water at 4 h intervals, phenolic foam cultivation resulted in 1.6- and 3.4-fold increases in SFMY at EC levels of 1.0 and 2.0 dS m−1, respectively, compared to tap water alone. For coconut fiber, the increases were of 2.3- and 1.4-fold, respectively. These findings are consistent with previous studies that have demonstrated enhanced microgreen yields under nutrient solution fertilizations. For instance, Wieth et al. [28] reported that the SFMY of rocket microgreens increased 2.4-fold when grown with nutrient solutions (EC of 1.2 and 2.0 dS m−1) compared to rainwater, using phenolic foam as a substrate. In a separate study, Wieth et al. [38] observed 1.7- and 2.1-fold increases in SFMY of purple cabbage at EC levels of 1.2 and 2.0 dS m−1, respectively, compared to rainwater (EC ≈ 0 dS m−1), regardless of the substrate type. Similarly, Silva et al. [29] found that the SFMY of rocket microgreens increased by 2.0- and 2.3-fold at EC levels of 1.0 and 1.2 dS m−1, respectively, compared to tap water (0.3 dS m−1 EC). These results collectively reinforce that cultivation using water alone is not recommended for optimal microgreen production, given the consistently lower biomass yields reported across multiple studies. Notably, previous studies involving amaranth microgreens have relied on irrigation with only water (i.e., without addition of nutrients) [43,45,46,47,48], while others, such as Meas et al. [44] and Gudžinskaitė et al. [49], did not provide irrigation details.
In the present study, although the use of nutrient solutions led to greater relative increases in SFMY when phenolic foam was used as a substrate, coconut fiber consistently produced the highest fresh biomass yields of amaranth microgreens (Table 2 and Table 3). As illustrated in Figure 2, seedling development was less uniform in phenolic foam due to its resistance to root penetration. This limitation hindered full seedling coverage of the substrate, leaving exposed areas that dried more rapidly under light exposure. Similarly, Wieth et al. [28] reported difficulties in root anchorage when using phenolic foam substrates for rocket microgreens. In addition to its physical limitations, phenolic foam is more expensive than coconut fiber, reducing its cost-effectiveness for large-scale microgreen production. Coconut fiber, on other hand, is widely recommended for seedling production across various species due to its favorable physical properties, making it both an affordable and suitable substrate for microgreen cultivation [21,26,27]. The coconut fiber substrate used in this study exhibited 50% (w/w) porosity, a level that supports optimal moisture conditions for seedling growth. This porosity ensures adequate aeration and drainage—preventing waterlogging and root rot—while also retaining adequate moisture to meet seeding hydration needs.
These comparisons highlight the importance of selecting a suitable growth medium based on local availability and crop-specific responses. For instance, Balik et al. [6] reported that a vermiculite-based substrate was the most effective for maximizing broccoli microgreen yield, whereas a peat-based substrate yielded better results for black radish and red beet. Similarly, in a study by Gunjal et al. [48] comparing cocopeat-based substrate and sandy loam soil, they found no significant differences in yield across several microgreen species—including flaxseed, radish sango, broccoli, cabbage, pak choi, beetroot, and red amaranth—indicating that both substrates were equally effective under those specific conditions.
In summary, SFM and SFMY increased with SD up to a threshold under nutrient solution and tap water applications at 2 h intervals (Table 2), consistent with findings from other studies [14,34]. Similarly, other authors have reported increased fresh biomass with increasing SD [36,53]. In the present study, the optimal cultivation conditions were achieved using coconut fiber substrate combined with irrigation using a nutrient solution at an EC of 1.0 dS m−1, which resulted in a maximum SFM of 24.85 g tray−1 at SD of approximately 79 g m−2. Both SDM (Figure 3B,C) and SDMY (Figure 3D,E) increased with SD, indicating that the increase in fresh biomass is primarily attributable to increased water accumulation in the seedling tissues [14,29]. In the experiment involving 4 h intervals (Table 3), fresh biomass increased with SD, reaching a maximum SFM of 25.27 g tray−1 at 100 g m−2 when grown in coconut fiber substrate with a nutrient solution at 1.0 dS m−1 EC. A similar pattern was observed for seedling dry biomass, further reinforcing the influence of SD and nutrient availability on microgreen productivity.
Although the application intervals for nutrient solutions or water were analyzed separately, a comparative assessment of both intervals provides valuable insights. Fresh biomass yields remained consistent between 2 and 4 h intervals when cultivating amaranth microgreens in coconut fiber substrate with nutrient solution at 1.0 dS m−1 EC. However, a significant yield reduction was observed at the 4 h interval when using nutrient solution at 2.0 dS m−1 EC (Table 2 and Table 3). Given the lack of prior studies evaluating irrigation frequency for nutrient solutions or water in microgreen production, the present results suggest that 2 h application intervals are more effective in ensuring optimal yield performance. Previous studies have typically used intermittent sub-irrigation systems but did not evaluate interval frequency. Studies conducted by Wieth et al. [38] on purple cabbage and Wieth et al. [28] and Lerner et al. [34] on rocket employed wooden pool-type structures to support trays and applied nutrient solution via intermittent sub-irrigation to moisten the trays. In the first study, nutrient solution was applied at 1 h intervals (15 min per irrigation), from 8:00 a.m. to 6:00 p.m., with two supplemental 15 min irrigations at night. In other studies, a similar irrigation protocol was implemented from 9:00 a.m. to 5:00 p.m., supplemented by a single 15 min irrigation cycle at night. In contrast, Freitas et al. [8] cultivated red beet microgreens on ebb-and-flow irrigation tables, applying the nutrient solution once daily for 15 min. These studies highlight the diversity of irrigation strategies used in microgreen cultivation but do not directly compare irrigation intervals, further reinforcing the novelty and importance of the current findings.
A comprehensive evaluation of the results supports the recommendation to cultivate amaranth microgreens in a coconut fiber substrate, using a half-strength nutrient solution (EC of 1.0 dS m−1) applied at 2 h intervals. Biomass production analysis revealed that maximum fresh matter yield can be achieved at a SD of up to 80 g m−2, which also contributes to optimizing both seed and nutrient solution inputs. Although SD, nutrient solution EC levels, and ST are widely studied in microgreen cultivation across different species, these factors are often analyzed individually or in pairwise combinations. For instance, Lerner et al. [34] investigated the interaction between four EC levels (0.15, 1.0, 2.0, and 3.0 dS m−1) and four SD values (50, 100, 150, and 200 g m−2) across two growing seasons (winter and spring) for rocket microgreens. Their findings indicated that cultivation using tap water (EC of 0.15 dS m−1) is not recommended, and that the best results were achieved with nutrient solutions at EC of 1.0 dS m−1 and SD values of 150 and 175 g m−2 for winter and spring, respectively.
The findings of the present study gain further relevance when considering water productivity, defined as the volume of water or nutrient solution required to produce 1 kg of SFM. Optimizing WP in microgreen production is essential for improving sustainability, resource efficiency, and cost-effectiveness. In the experiment with nutrient solution or tap water at 2 h intervals, the WP was significantly influenced by the interactions between EC levels and SD (Figure 3H), as well as EC levels and ST (Figure 3I). Under optimal cultivation conditions—coconut fiber substrate and half-strength nutrient solution (EC of 1.0 dS m−1)—WP reached 42.25 L kg−1 at SD of approximately 74 g m−2. Notably, at this same EC level, cultivation in coconut fiber required 60% less water than phenolic foam. At the 4 h irrigation intervals (Table 3) and under the same optimal conditions, WP reached 21.04 L kg−1 at SD of approximately 81 g m−2. The WP remains an understudied parameter in microgreen research, primarily because many studies rely on non-irrigated cultivation systems. Nevertheless, the WP values observed in this study are consistent with those reported by Silva et al. [29], who found an average water requirement of 37 L kg−1 SFM using nutrient solutions (1.0–1.2 dS m−1 EC) in phenolic foam cultivation. These findings reinforce the value of WP as a key metric for evaluating the efficiency and sustainability of microgreen production systems.

5. Conclusions

A half-strength nutrient solution (electrical conductivity—EC of 1.0 dS m−1) proved more effective than water alone for amaranth microgreen production, ensuring adequate nutrient supply while optimizing resource use. The coconut fiber substrate consistently outperformed phenolic foam across all evaluated traits. Under these optimal conditions, coconut fiber cultivation at EC 1.0 dS m−1 required 60% less irrigation water or nutrient solution than phenolic foam, demonstrating significantly higher water productivity. Since fresh biomass is a critical factor in the commercial value of microgreens, we recommend cultivating amaranth microgreens using coconut fiber substrate and a nutrient solution at EC of 1.0 dS m−1 applied at 2 h intervals, with a seeding density of 80 g m−2 to achieve maximum yield efficiency.

Author Contributions

Conceptualization, software, data curation, supervision, and project administration, M.G.d.S.; methodology and investigation, M.G.d.S., I.d.S.B., E.d.S.S., A.d.S.R., L.S.S. and G.S.d.J.P.; validation, formal analysis, visualization, writing—original draft preparation, and writing—review and editing, M.G.d.S., H.R.G. and T.I.d.S.; funding acquisition, H.R.G. All authors have read and agreed to the published version of the manuscript.

Funding

This research was funded by Conselho Nacional Desenvolvimento Científico e Tecnológico (CNPq), Brazil, grant number 408511/2023-0.

Data Availability Statement

The raw data supporting the conclusions of this article will be made available by the authors on request.

Acknowledgments

To Instituto Nacional de Ciência e Tecnologia em Agricultura Sustentável no Semiárido Tropical—INCTAgriS (grant number CNPq/FUNDECE/INCT: 406570/2022-1) and to Instituto de Ciência, Inovação e Tecnologia do Estado da Bahia—Recursos Hídricos e Desenvolvimento Sustentável (INCITE Economia Verde: INCITE No. 005/2022—order term No. 4137/2022) for the all support provided for this research. The authors also thank the Post Graduate Program in Agricultural Engineering (PPGEA) of the Federal University of Recôncavo da Bahia for supporting the research project.

Conflicts of Interest

The authors declare no conflicts of interest.

References

  1. Alloggia, F.P.; Bafumo, R.F.; Ramirez, D.A.; Maza, M.A.; Camargo, A.B. Brassicaceae microgreens: A novel and promissory source of sustainable bioactive compounds. Curr. Res. Food Sci. 2023, 6, 100480. [Google Scholar] [CrossRef] [PubMed]
  2. Di Gioia, F.; Hong, J.C.; Pisani, C.; Petropoulos, S.A.; Bai, J.; Rosskopf, E.N. Yield performance, mineral profile, and nitrate content in a selection of seventeen microgreen species. Front. Plant Sci. 2023, 14, 1220691. [Google Scholar] [CrossRef] [PubMed]
  3. Partap, M.; Sharma, D.; Hn, D.; Thakur, M.; Verma, V.; Ujala; Bhargava, B. Microgreen: A tiny plant with superfood potential. J. Funct. Foods 2023, 107, 105697. [Google Scholar] [CrossRef]
  4. Bonato, A.; Lemos, G.R.; Callegaro, G.M.; Nagel, J.C.; Sommer, L.R. Substratos e qualidade de luz na produção de microverdes. Res. Soc. Dev. 2022, 11, e239111335448. [Google Scholar] [CrossRef]
  5. Li, T.; Lalk, G.T.; Arthur, J.D.; Johnson, M.H.; Bi, G. Shoot production and mineral nutrients of five microgreens as affected by hydroponic substrate type and post-emergent fertilization. Horticulturae 2021, 7, 129. [Google Scholar] [CrossRef]
  6. Balik, S.; Dasgan, H.Y.; Ikiz, B.; Gruda, N.S. The performance of growing-media-shaped microgreens: The growth, yield, and nutrient profiles of broccoli, red beet, and black radish. Horticulturae 2024, 10, 1289. [Google Scholar] [CrossRef]
  7. Li, T.; Arthur, J.D.; Bi, G.; White, S. Hydroponic fiber mats altered shoot growth and mineral nutrient composition of five herbal microgreens. Horticulturae 2024, 10, 1298. [Google Scholar] [CrossRef]
  8. Freitas, I.S.; Mello, S.C.; Nemali, K. Supplemental light quality affects optimal seeding density of microgreens. Urban Agric. Region Food Syst. 2024, 9, e20064. [Google Scholar] [CrossRef]
  9. Signore, A.; Somma, A.; Leoni, B.; Santamaria, P. Optimising sowing density for microgreens production in rapini, kale and cress. Horticulturae 2024, 10, 274. [Google Scholar] [CrossRef]
  10. El-Nakhel, C.; Pannico, A.; Graziani, G.; Kyriacou, M.C.; Gaspari, A.; Ritieni, A.; De Pascale, S.; Rouphael, Y. Nutrient supplementation configures the bioactive profile and production characteristics of three Brassica L. microgreens species grown in peat-based media. Agronomy 2021, 11, 346. [Google Scholar] [CrossRef]
  11. Petropoulos, S.A.; El-Nakhel, C.; Graziani, G.; Kyriacou, M.C.; Rouphael, Y. The effects of nutrient solution feeding regime on yield, mineral profile, and phytochemical composition of spinach microgreens. Horticulturae 2021, 7, 162. [Google Scholar] [CrossRef]
  12. Li, T.; Arthur, J.D.; Bi, G. Shoot yield and mineral nutrient concentrations of six microgreens in the Brassicaceae family affected by fertigation rate. Horticulturae 2023, 9, 1217. [Google Scholar] [CrossRef]
  13. Rajan, P.; Lada, R.R.; MacDonald, M.T. Advancement in indoor vertical farming for microgreen production. Am. J. Plant Sci. 2019, 10, 1397–1408. [Google Scholar] [CrossRef]
  14. Barros, I.S.; Silva, M.G.; Souza, E.S.; Rodrigues, A.S.; Silva, T.I.; Gheyi, H.R.; Pereira, G.S.J.; Sacramento, L.S.; Andrade, A.S.; Oliveira, P.S.; et al. Densidade de semeio de microverdes de amaranto sob diferentes condutividades elétricas das soluções nutritivas. Water Resour. Irrig. Manag. 2025, 14, 14–29. [Google Scholar] [CrossRef]
  15. Yadav, L.P.; Koley, T.K.; Tripathi, A.; Singh, S. Antioxidant potentiality and mineral content of summer season leafy greens: Comparison at mature and microgreen stages using chemometric. Agric. Res. 2019, 8, 165–175. [Google Scholar] [CrossRef]
  16. Hamilton, A.N.; Fraser, A.M.; Gibson, K.E. Barriers to implementing risk management practices in microgreens growing operations in the United States: Thematic analysis of interviews and survey data. Food Control 2023, 152, 109836. [Google Scholar] [CrossRef]
  17. Pescarini, H.B.; Silva, V.G.; Mello, S.C.; Purquerio, L.F.V.; Sala, F.C.; Cesar, T.Q.Z. Updates on microgreens grown under artificial lighting: Scientific advances in the last two decades. Horticulturae 2023, 9, 864. [Google Scholar] [CrossRef]
  18. Dubey, S.; Harbourne, N.; Harty, M.; Hurley, D.; Elliott-Kingston, C. Microgreens production: Exploiting environmental and cultural factors for enhanced agronomical benefits. Plants 2024, 13, 2631. [Google Scholar] [CrossRef] [PubMed]
  19. Seth, T.; Mishra, G.P.; Chattopadhyay, A.; Roy, P.D.; Devi, M.; Sahu, A.; Sarangi, S.K.; Mhatre, C.S.; Lyngdoh, Y.A.; Chandra, V.; et al. Microgreens: Functional food for nutrition and dietary diversification. Plants 2025, 14, 526. [Google Scholar] [CrossRef] [PubMed]
  20. Eswaranpillai, U.; Murugesan, P.; Karuppiah, P. Assess the impact of cultivation substrates for growing sprouts and microgreens of selected four legumes and two grains and evaluation of its nutritional properties. Plant Sci. Today 2023, 10, 160–169. [Google Scholar] [CrossRef]
  21. Santos, J.R.; Lima, C.S.M.; Rosa, G.G. Diferentes substratos no cultivo de microverdes de rúcula (Eruca sativa Miller). Rev. Iberoam. Tecnol. Postcosecha 2022, 23, 66–73. [Google Scholar]
  22. Nagel, J.C.; Sommer, L.R.; Freitag, S.F.; Driemeier, D.S.; Heinzmann, N.; Valandro, G.B. Produção de microverdes de alface Deva em diferentes substratos. Rev. Soc. Cient. 2024, 7, 2507–2515. [Google Scholar] [CrossRef]
  23. Marta, A.E.; Stoica, F.; Ostaci, Ș.; Jităreanu, C.D. The antioxidant profile of some species of microgreens cultivated on hemp and coconut substrate under the action of a biostimulator based on humic acids. Horticulturae 2024, 10, 1238. [Google Scholar] [CrossRef]
  24. Negri, M.; Bulgari, R.; Santoro, P.; Ferrante, A. Evaluation of different growing substrates for microgreens production. Acta Hortic. 2021, 1305, 109–116. [Google Scholar] [CrossRef]
  25. Bantis, F.; Koukounaras, A. Microgreen vegetables’ production can be optimized by combining the substrate and nutrient solution in a PFAL. Sci. Hortic. 2024, 333, 113277. [Google Scholar] [CrossRef]
  26. Santos, F.L.; Costa, E.S.; Lima, C.S.M. Diferentes substratos no desenvolvimento e na pós-colheita de microverdes de beterraba (Beta vulgaris L.). Rev. Iberoam. Tecnol. Postcosecha 2020, 21, 1–11. [Google Scholar]
  27. Bulgari, R.; Negri, M.; Santoro, P.; Ferrante, A. Quality evaluation of indoor-grown microgreens cultivated on three different substrates. Horticulturae 2021, 7, 96. [Google Scholar] [CrossRef]
  28. Wieth, A.R.; Pinheiro, W.D.; Duarte, T.S. Commercial substrates and nutrient concentrations in the production of arugula microgreens. Agron. Colomb. 2021, 39, 5–11. [Google Scholar] [CrossRef]
  29. Silva, M.G.; Sacramento, L.S.; Pereira, G.S.J.; Ribeiro, M.C.B.O.; Barros, I.S.; Gheyi, H.R. Rocket microgreen cultivation under seeding densities and nutrient solution concentrations. Water Resour. Irrig. Manag. 2024, 13, 60–71. [Google Scholar] [CrossRef]
  30. Jones-Baumgardt, C.; Llewellyn, D.; Ying, Q.; Zheng, Y. Intensity of sole-source light-emitting diodes affects growth, yield, and quality of Brassicaceae microgreens. HortScience 2019, 54, 1168–1174. [Google Scholar] [CrossRef]
  31. Li, T.; Lalk, G.T.; Bi, G. Fertilization and pre-sowing seed soaking affect yield and mineral nutrients of ten microgreen species. Horticulturae 2021, 7, 14. [Google Scholar] [CrossRef]
  32. Priti; Sangwan, S.; Kukreja, B.; Mishra, G.P.; Dikshit, H.K.; Singh, A.; Aski, M.; Kumar, A.; Taak, Y.; Stobdan, T.; et al. Yield optimization, microbial load analysis, and sensory evaluation of mungbean (Vigna radiata L.), lentil (Lens culinaris subsp. culinaris), and Indian mustard (Brassica juncea L.) microgreens grown under greenhouse conditions. PLoS ONE 2022, 17, e0268085. [Google Scholar] [CrossRef] [PubMed]
  33. Thuong, V.T.; Minh, H.G. Effects of growing substrates and seed density on yield and quality of radish (Raphanus sativus) microgreens. Res. Crops 2020, 21, 579–586. [Google Scholar] [CrossRef]
  34. Lerner, B.L.; Strassburger, A.S.; Schäfer, G. Cultivation of arugula microgreens: Seed densities and electrical conductivity of nutrient solution in two growing seasons. Bragantia 2024, 83, e20230183. [Google Scholar] [CrossRef]
  35. Ntsoane, M.L.L.; Manhivi, V.E.; Shoko, T.; Seke, F.; Maboko, M.M.; Sivakumar, D. The phytonutrient content and yield of Brassica microgreens grown in soilless media with different seed densities. Horticulturae 2023, 9, 1218. [Google Scholar] [CrossRef]
  36. Cecílio Filho, A.B.; Pindobeira, W.M.; Alves, T.N.; Ribera, L.M.; Medelo, M.J.Y. How does sowing density affect physiology, yield, and quality of red cabbage microgreens? Bragantia 2025, 84, e20240232. [Google Scholar] [CrossRef]
  37. Cowden, R.J.; Markussen, B.; Ghaley, B.B.; Henriksen, C.B. The effects of light spectrum and intensity, seeding density, and fertilization on biomass, morphology, and resource use efficiency in three species of Brassicaceae microgreens. Plants 2024, 13, 124. [Google Scholar] [CrossRef] [PubMed]
  38. Wieth, A.R.; Pinheiro, W.D.; Duarte, T.S. Purple cabbage microgreens grown in different substrates and nutritive solution concentrations. Rev. Caatinga 2019, 32, 976–985. [Google Scholar] [CrossRef]
  39. Santos, O.S. Elaboração de Solução Hidropônica Para Rúculas; Editora UFSM: Santa Maria, Brazil, 2010. [Google Scholar]
  40. Weber, C.F. Broccoli microgreens: A mineral-rich crop that can diversify food systems. Front. Nutr. 2017, 4, 7. [Google Scholar] [CrossRef] [PubMed]
  41. Tavan, M.; Wee, B.; Brodie, G.; Fuentes, S.; Pang, A.; Gupta, D. Optimizing sensor-based irrigation management in a soilless vertical farm for growing microgreens. Front. Sustain. Food Syst. 2021, 4, 622720. [Google Scholar] [CrossRef]
  42. ISLA Sementes LTDA. Amaranto Microverdes Asteca; Porto Alegre, Brazil. 2025. Available online: https://www.isla.com.br/amaranto-microverdes-asteca-microverdes-pct-longa-vid-500g-309-39 (accessed on 26 June 2025).
  43. Domínguez-Domínguez, A.; Herrera-Corredor, J.A.; Argumedo-Macias, A.; Ramírez-Rivera, E.J.; López-Aranda, E.; Romero-Cruz, A.; López-Espíndola, M. Amaranth microgreens as a potential ingredient for healthy salads: Sensory liking and purchase intent. Agroproductividad 2021, 14, 47–51. [Google Scholar] [CrossRef]
  44. Meas, S.; Luengwilai, K.; Thongket, T. Enhancing growth and phytochemicals of two amaranth microgreens by LEDs light irradiation. Sci. Hortic. 2020, 265, 109204. [Google Scholar] [CrossRef]
  45. Johnson, S.A.; Prenni, J.E.; Heuberger, A.L.; Isweiri, H.; Chaparro, J.M.; Newman, S.E.; Uchanski, M.E.; Omerigic, H.M.; Michell, K.A.; Bunning, M.; et al. Comprehensive evaluation of metabolites and minerals in 6 microgreen species and the influence of maturity. Curr. Dev. Nutr. 2021, 5, nzaa180. [Google Scholar] [CrossRef] [PubMed]
  46. Ampim, P.A.Y.; Obeng, E.; Gonzalez, E.O.; Weerasooriya, A.; Osuji, G.O.; Myers, D.J., Sr. The response of Egyptian spinach and vegetable amaranth microgreens to different light regimes. Sci. J. Biol. Life Sci. 2021, 1, 1–5. [Google Scholar] [CrossRef]
  47. Arya, K.S.; Kutty, M.S.; Pradeepkumar, T. Microgreens of tropical edible-seed species, an economical source of phytonutrients- insights into nutrient content, growth environment and shelf life. Future Foods 2023, 8, 100262. [Google Scholar] [CrossRef]
  48. Gunjal, M.; Singh, J.; Kaur, J.; Kaur, S.; Nanda, V.; Mehta, C.M.; Bhadariya, V.; Rasane, P. Comparative analysis of morphological, nutritional, and bioactive properties of selected microgreens in alternative growing medium. S. Afr. J. Bot. 2024, 165, 188–201. [Google Scholar] [CrossRef]
  49. Gudžinskaitė, I.; Laužikė, K.; Pukalskas, A.; Samuoliene, G. Light modulation of photosynthate accumulation in microgreens grown in a controlled environment during storage. Horticulturae 2025, 11, 176. [Google Scholar] [CrossRef]
  50. Gunjal, M.; Singh, J.; Kaur, S.; Nanda, V.; Ullah, R.; Iqbal, Z.; Ercisli, S.; Rasane, P. Assessment of bioactive compounds, antioxidant properties and morphological parameters in selected microgreens cultivated in soilless media. Sci. Rep. 2024, 14, 23605. [Google Scholar] [CrossRef] [PubMed]
  51. Furlani, P.R.; Silveira, L.C.P.; Bolonhezi, D.; Faquin, V. Cultivo Hidropônico de Plantas; Instituto Agronômico: Campinas, Brazil, 1999; 52p. [Google Scholar]
  52. Ferreira, D.F. Sisvar: A computer statistical analysis system. Ciênc. Agrotec. 2011, 35, 1039–1042. [Google Scholar] [CrossRef]
  53. Balik, S.; Daşgan, H.Y. The effect of seed sowing density on growth parameters in six different microgreen. KSU J. Agric. Nat. 2025, 28, 661–671. [Google Scholar] [CrossRef]
  54. Senevirathne, G.I.; Gama-Arachchige, N.S.; Karunaratne, A.M. Germination, harvesting stage, antioxidant activity and consumer acceptance of ten microgreens. Ceylon J. Sci. 2019, 48, 91–96. [Google Scholar] [CrossRef]
  55. Palmitessa, O.D.; Renna, M.; Crupi, P.; Lovece, A.; Corbo, F.; Santamaria, P. Yield and quality characteristics of Brassica microgreens as affected by the NH4:NO3 molar ratio and strength of the nutrient solution. Foods 2020, 9, 677. [Google Scholar] [CrossRef] [PubMed]
  56. Moraru, P.I.; Rusu, T.; Mintas, O.S. Trial protocol for evaluating platforms for growing microgreens in hydroponic conditions. Foods 2022, 11, 1327. [Google Scholar] [CrossRef] [PubMed]
Figure 1. Schematic representation of the experimental design illustrating the arrangement of the trays in cultivation nurseries: two substrate types—phenolic foam (PF) and coconut fiber (CF)—were tested at four seeding densities (SD1, SD2, SD3, and SD4: 25, 50, 75, and 100 g m−2, respectively). These were arranged within the main plots corresponding to three levels of electrical conductivity (EC): 0.3 dS m−1 (tap water), 1.0, and 2.0 dS m−1 (nutrient solutions). Nutrient solutions or tap water were applied at intervals of either 2 or 4 h.
Horticulturae 11 00870 g001
Figure 2. Visual aspects of amaranth microgreens grown under different seeding densities, substrate types (phenolic foam—PF, and coconut fiber—CF), and levels of electrical conductivity (EC) of nutrient solution or tap water applied at 2 h intervals (A) and at 4 h intervals (B).
Horticulturae 11 00870 g002
Figure 3. Isolated effects of electrical conductivity (EC) levels and substrate types (ST) on seedling height (SH) (A) and water content in seedling (WCS) (G); and effects of seeding density (SD) on WCS (F). Follow-up analyses are presented for the interaction between EC levels and SD on seedling dry matter (SDM) (B), SDM yield (SDMY) (D), and water productivity (WP) of SFM (H); between ST and SD on SDM (C) and SDMY (E); and between EC levels and ST on WP (I) in amaranth microgreens. Except for (A), all results are from the experiment in which nutrient solution or tap water was applied at 2 h intervals. In the (A,G), lowercase letters compare the means of EC levels, while uppercase letters compare the means of the ST. In (B,D,H), lowercase letters compare EC levels within each SD. In (C,E), lowercase letters compare ST within each SD. In (I), lowercase letters compare EC levels within each ST and uppercase letters compare ST within each EC level. Mean comparisons were performed using Tukey’s test (p ≤ 0.05). ** indicates significant at p ≤ 0.01 according to Student’s t-test. Vertical bars indicate the means ± standard deviation.
Horticulturae 11 00870 g003aHorticulturae 11 00870 g003b
Table 1. Summary of the F-test for seedling height (SH), seedling fresh matter (SFM), SFM yield (SFMY), seedling dry matter (SDM), SDM yield (SDMY), water content in seedling (WCS), and water productivity (WP) of SFM of amaranth microgreens grown under different seeding densities (SD), substrate types (ST), and electrical conductivity (EC) levels of nutrient solution or tap water applied at 2 and 4 h intervals.
Source of VariationSHSFMSFMYSDMSDMYWCSWP
At 2-h intervals
EC**************
ST**************
SDns************
EC × STns**nsnsns**
EC × SDns********ns**
ST × SDns********nsns
EC × ST × SDns**nsnsnsns
CVplot (%)28.1930.4630.3222.4222.562.5227.70
CVsubplot (%)9.5921.4721.5014.9414.941.6623.97
At 4-h intervals
EC**********ns**
ST**************
SDns************
EC × STns****nsns**ns
EC × SDns************
ST × SDns***********
EC × ST × SDns**********
CVplot (%)11.0612.6812.817.867.830.5625.33
CVsubplot (%)12.8720.6520.6617.2817.311.4620.00
CVplot and CVsubplot are coefficients of variation of the main plots and subplots, respectively; ns, *, ** not significant and significant at p ≤ 0.05 and at p ≤ 0.01, respectively, by F-test.
Table 2. Follow-up analyses of the interactions between electrical conductivity (EC) levels, substrate types (ST), and seeding densities (SD) on seedling fresh matter (SFM) and SFM yield (SFMY) of amaranth microgreens grown with nutrient solution or tap water applied at 2 h intervals.
EC
(dS m−1)
STSeeding Density (g m−2)Equation(R2) #
255075100or Mean
SFM (g tray−1)
0.3CF4.10 bA9.55 cA10.94 bA10.71 cASFM = −3.5751 + 0.3687**SD − 0.0023*SD299.05
PF2.57 aA4.50 bB4.33 bB4.92 bBSFM = mean = 4.08
1.0CF9.32 aA21.22 aA23.54 aA22.30 aASFM = −7.6423 + 0.8221**SD − 0.0052**SD298.60
PF6.42 aA11.18 aB15.36 aB9.88 aBSFM = −5.7216 + 0.5701**SD − 0.0041**SD289.96
2.0CF8.89 aA15.61 bA26.51 aA15.76 bASFM = −13.0251 + 0.9995**SD − 0.0070**SD279.10
PF5.94 aA14.55 aA15.05 aB9.65 aBSFM = −9.1315 + 0.7473**SD − 0.0056**SD299.56
SFMY (kg m−2)
0.3CF0.20 bA0.47 cA0.55 bA0.53 cASFMY = −0.1819 + 0.0186**SD − 0.0001*SD299.24
PF0.13 aA0.22 bB0.21 bB0.24 bBSFMY = mean = 0.200
1.0CF0.46 aA1.06 aA1.17 aA1.11 aASFMY = −0.3912 + 0.0413**SD − 0.0003**SD298.58
PF0.32 aA0.56 aB0.76 abB0.49 aBSFMY = −0.2912 + 0.0286**SD − 0.0002**SD290.27
2.0CF0.44 aA0.78 bA1.32 aA0.78 bASFMY = −0.6437 + 0.0497**SD − 0.0003**SD278.89
PF0.30 aA0.72 aA0.75 aB0.48 aBSFMY = −0.4500 + 0.0370**SD − 0.0003**SD299.64
CF—coconut fiber; PF—phenolic foam; within the same column, lowercase letters compare the means of the EC levels within each combination of SD and ST, while uppercase letters indicate comparisons of ST within each combination of EC level and SD by Tukey’s test, at p ≤ 0.05; **, * denote significance at p ≤ 0.01 and p ≤ 0.05, respectively, according to Student’s t-test; # mathematical models were selected based on an R2 value equal to or greater than 70%.
Table 3. Follow-up analyses of the interactions between electrical conductivity (EC) levels, substrate types (ST), and seeding densities (SD) for seedling fresh matter (SFM), SFM yield (SFMY), seedling dry matter (SDM), SDM yield (SDMY), water content in seedlings (WCS), and water productivity (WP) of SFM in amaranth microgreens grown with nutrient solution or tap water applied at 4 h intervals.
EC
(dS m−1)
STSeeding Density (g m−2)Equation(R2) #
255075100or Mean
SFM (g tray−1)
0.3CF3.41 bA10.52 bA13.62 bA11.84 cASFM = −8.3504 + 0.5577**SD − 0.0035**SD299.93
PF2.80 bA4.44 bB6.35 bB5.56 bBSFM = mean = 4.79
1.0CF9.28 aA20.94 aA17.73 aA25.63 aASFM = 6.9370 + 0.1833**SD73.78
PF7.09 aA6.69 bB10.06 abB8.15 bBSFM = mean = 8.00
2.0CF9.75 aA22.49 aA15.57 abA15.90 bASFM = mean = 15.93
PF3.90 abB12.55 aB12.01 aB16.19 aASFM = 2.0865 + 0.1452**SD81.82
SFMY (kg m−2)
0.3CF0.17 bA0.52 bA0.68 bA0.59 cASFMY = −0.4119 + 0.0277**SD − 0.0002**SD299.94
PF0.14 bA0.22 bB0.32 bB0.28 bBSFMY = mean = 0.240
1.0CF0.46 aA1.04 aA0.88 aA1.28 aASFMY = 0.3425 + 0.0092**SD73.87
PF0.35 aA0.33 bB0.50 abB0.41 bBSFMY = mean = 0.397
2.0CF0.48 aA1.12 aA0.78 abA0.79 bASFMY = mean = 0.792
PF0.20 abB0.62 aB0.60 aB0.81 aASFMY = 0.1037 + 0.0072**SD82.02
SDM (g tray−1)
0.3CF0.29 bA0.72 bA0.97 aA0.94 bASDM = −0.3862 + 0.0315**SD − 0.0002**SD299.73
PF0.22 bA0.39 bB0.51 bB0.41 cBSDM = mean = 0.38
1.0CF0.55 aA1.23 aA1.19 aA1.65 aASDM = 0.3425 + 0.0130**SD86.50
PF0.51 aA0.59 bB0.91 aB0.91 bBSDM = 0.3537 + 0.0061**SD86.37
2.0CF0.57 aA1.29 aA1.15 aA1.70 aASDM = 0.3625 + 0.0130**SD80.57
PF0.30 abB0.93 aB1.01 aA1.21 aBSDM = −0.3756 + 0.0328**SD − 0.0002**SD295.08
SDMY (g m−2)
0.3CF14.77 bA35.61 bA48.52 aA46.95 bASDMY = −18.9100 + 1.5581**SD − 0.0090**SD299.70
PF11.07 bA19.26 bB25.61 bB20.52 cBSDMY = mean = 19.11
1.0CF27.67 aA61.09 aA59.49 aA82.14 aASDMY = 17.1475 + 0.6472**SD86.49
PF25.69 aA29.35 bB45.48 aB45.40 bBSDMY = 17.6625 + 0.3011**SD86.39
2.0CF28.11 aA64.17 aA57.13 aA84.39 aASDMY = 18.0062 + 0.6471**SD80.40
PF15.01 abB46.53 aB50.30 aA60.07 aBSDMY = −18.9350 + 1.6430**SD − 0.0087**SD295.00
WCS (%)
0.3CF90.75 bA93.18 aA92.68 aA91.83 aAWCS = 87.3269 + 0.1749**SD − 0.0013**SD290.18
PF91.85 aA90.90 aB91.81 aA92.60 aAWCS = mean = 91.79
1.0CF93.99 aA94.10 aA93.16 aA93.55 aAWCS = mean = 93.70
PF92.66 aA91.21 aB90.85 aB88.62 bBWCS = 93.9600 − 0.0500**SD93.06
2.0CF94.19 aA94.26 aA92.46 aA89.27 bBWCS = 96.6825 − 0.0662**SD83.68
PF92.21 aB92.50 aA91.40 aA92.38 aAWCS = mean = 92.12
WP (L kg−1)
0.3CF209.17 aA60.83 aB48.21 aB52.17 aBWP = 403.8781 − 9.5410**SD + 0.0609**SD296.10
PF209.46 aA130.49 aA80.72 aA96.82 aAWP = 345.1275 − 6.3040**SD + 0.0380**SD299.32
1.0CF63.03 bA24.60 bB29.90 aB22.15 bBWP = 102.6031 − 2.0032*SD + 0.0123*SD285.15
PF75.26 cA83.63 bA71.07 abA75.11 aAWP = mean = 76.27
2.0CF60.36 bB26.34 bB41.72 aA37.22 abAWP = mean = 41.41
PF152.99 bA53.31 cA49.67 bA39.28 bAWP = 271.6037 − 5.8430**SD + 0.0357**SD293.76
CF—coconut fiber; PF—phenolic foam; within the same column, lowercase letters compare the means of the EC levels within each combination of SD and ST, while uppercase letters indicate comparisons of ST within each combination of EC level and SD by Tukey’s test, at p ≤ 0.05; **, * denote significance at p ≤ 0.01 and p ≤ 0.05, respectively, according to Student’s t-test; # mathematical models were selected based on an R2 value equal to or greater than 70%.
Disclaimer/Publisher’s Note: The statements, opinions and data contained in all publications are solely those of the individual author(s) and contributor(s) and not of MDPI and/or the editor(s). MDPI and/or the editor(s) disclaim responsibility for any injury to people or property resulting from any ideas, methods, instructions or products referred to in the content.

