Article

Effects of Crop Load Management on Berry and Wine Composition of Marselan Grapes

1
College of Enology, Northwest A&F University, Yangling 712100, China
2
Institute of Agricultural Product Quality Standards and Testing Technology, Ningxia Academy of Agriculture and Forestry Sciences, Yinchuan 750002, China
3
Institute of Horticulture, Ningxia Academy of Agricultural and Forestry Sciences, Yinchuan 750002, China
*
Authors to whom correspondence should be addressed.
Horticulturae 2025, 11(7), 851; https://doi.org/10.3390/horticulturae11070851
Submission received: 20 May 2025 / Revised: 14 July 2025 / Accepted: 16 July 2025 / Published: 18 July 2025
(This article belongs to the Section Viticulture)

Abstract

The aim of this study was to investigate the effects of the crop load on the berry and wine composition of Marselan grapes. Thus, the appropriate crop load for Marselan wine grapes in Ningxia was determined based on the shoot density and the number of clusters per shoot. Marselan grapes from the Gezi Mountain vineyard, located at the eastern foot of Helan Mountain in the Qingtongxia region of Ningxia, were selected as the research material to conduct a combination experiment with four levels of shoot density and three levels of cluster density. The analysis of the berry and wine chemical composition was combined with a wine sensory evaluation to determine the optimal crop load levels. Crop load regulation significantly affected both the grape berry composition and the basic physicochemical properties of the resulting wine. Low crop loads improved metrics such as the berry weight and soluble solids content. A low shoot density facilitated the accumulation of organic acids, flavonols, and hydroxybenzoic acids in wine. Moderate crop loads were conducive to anthocyanin synthesis—the total individual anthocyanins content in the 10–20 shoots per meter of the canopy treatment group ranged from 116% to 490% of the control group—whereas excessive crop loads hindered its accumulation. Crop load management significantly influenced the aroma composition of wine by regulating the content of sugars, nitrogen sources, and organic acids in grape berries, thereby promoting the synthesis of esters and the accumulation of key aromatic compounds, such as terpenes. This process optimized pleasant flavors, including fruity and floral aromas. In contrast, wines from the high crop load and control treatments contained lower levels of these aroma compounds. Compounds such as ethyl caprylate and β-damascenone were identified as potential quality markers. Overall, the wine produced from vines with a crop load of 30 clusters (15 shoots per meter of canopy, 2 clusters per shoot) received the highest sensory scores. Appropriate crop load management is therefore critical to improving the chemical composition of Marselan wine.

1. Introduction

Achieving an optimal balance between vegetative and reproductive growth is essential for producing high-quality grape berries and meeting yield targets in viticultural practices. Among the various cultivation strategies, regulating the crop load is commonly employed to manage this balance effectively [1,2,3]. This approach primarily involves adjusting the number of shoots per vine and the number of clusters per shoot [4]. Cluster thinning is one of the principal methods used to adjust the crop load. This approach modifies the plant’s source–sink relationship and impacts the accumulation of both primary and secondary metabolites in the berries [5,6,7]. By increasing the leaf-area-to-fruit ratio [8], cluster thinning not only ensures the effective production and accumulation of photosynthates but also balances fruit consumption, thereby maintaining vine health and improving berry quality [9]. In addition, this practice enhances the appearance attributes of the grapes, including the berry shape, size, and color uniformity [10,11].
In winemaking, the concentrations of sugars, acids, phenolic compounds, and volatile constituents in wine grapes directly impact the color, aroma, and overall complexity of the resulting wine [12,13]. Previous studies have shown that different levels of crop load regulation can significantly alter the composition and diversity of the aromatic compounds in wine [14,15]. However, due to the high labor costs associated with manual thinning, the application of cluster thinning in commercial vineyards remains limited. Furthermore, the existing research on the crop load in wine grapes has primarily focused on its impact on berry and wine qualities, whereas comprehensive evaluations that integrate the optimal crop load with economic returns are still lacking and remain a subject of ongoing debate.
This experiment aimed to achieve differences in the crop load of Marselan wine grapes by regulating the shoot density and number of clusters per shoot. It investigated the basic physicochemical properties of Marselan under varying crop load conditions during the ripening period. Particular attention was paid to the effects of different crop loads on the organic acids, phenolic compounds, and volatile aroma compounds in the resulting wines. Sensory evaluation was also employed to assess the influence of the crop load on the overall wine chemical composition. The objective was to optimize wine grapes through crop load regulation, providing a technical reference for winemaking practices.

2. Materials and Methods

2.1. Materials and Reagents

2.1.1. Experimental Design

This experiment was conducted in 2024 at the wine grape vineyard of Ningxia Zhongzexiban Modern Agriculture Technology Co., Ltd. (38°45′97″ N, 106°18′11″ E). The tested variety was Marselan, planted in 2017 at a spacing of 0.8 m × 3.5 m. The training system used was an inclined pruned cordon, and the soil type was sandy loam.
“Shoot density” refers to the number of grape shoots per meter of trellis, while “cluster density” indicates the number of fruit clusters per shoot. The experimental design included four levels of shoot density (10, 15, 20, and 25 shoots per meter of canopy) and three levels of number of clusters per shoot (1.0, 1.5, and 2.0 clusters per shoot), totaling 12 treatment combinations. Each treatment was replicated three times, and each replicate consisted of four consecutive vines, each of which was 6 m long. Meanwhile, a control experiment (CK) was set up without thinning the branches and fruit clusters. Except for the cluster thinning, all the other vineyard management practices followed standard viticultural protocols.

2.1.2. Reagent

The organic acid standards (purity > 98.6%), anthocyanin standards (purity > 97%), polyphenol standards (purity > 98%), and volatile compound standards (purity > 98%) were all purchased from Sigma-Aldrich (St. Louis, MI, USA).

2.2. Instruments and Equipment

The instruments and equipment included a PL202-L-type 1% analytical balance (Mettler Toledo, Zurich, Switzerland), a Thermo TSQ ALTIS ultra-high-performance liquid chromatography–tandem triple quadrupole mass spectrometer (LC/MS/MS) (Thermo Fisher Scientific, Waltham, MA, USA), an LC-15C high-performance liquid chromatograph (equipped with a diode array detector and SIL-10AF auto-sampler), a Waters 2699 high-performance liquid chromatography (HPLC) system equipped with a 2487 UV detector (Waters, Milford, MA, USA), a GC2030-TQ8050 NX triple quadrupole gas chromatograph–mass spectrometer (GC-MS), an InertCap WAX polar chromatographic column (60 m × 0.25 mm, 0.25 μm) (Shimadzu Corporation, Kyoto, Japan), and a PAL-1 digital Abbe refractometer (Horiba Scientific, Shanghai, China Division).

2.3. Methods

2.3.1. Grape Sampling

Grape berries were sampled at different phenological stages starting from veraison on seven dates: 26 July, 7 August, 16 August, 26 August, 2 September, 12 September, and 19 September. Indicators, such as the 100-berry weight, total soluble solids (TSSs), and titratable acidity (TA), were monitored throughout berry maturation.
Yield estimation methods: The vineyard row spacing was 3.5 m × 0.8 m, with approximately 2880 grapevines per hectare. The experimental plot for the yield measurement was 6 m, and the actual yield of the experimental plot could be used to estimate the yield per hectare.

2.3.2. Winemaking

Upon full ripeness (19 September), 30 kg of grapes were randomly harvested from each treatment group. After destemming and crushing, the must was divided into three replicates and transferred into 20 L fermentation tanks. Sulfur dioxide (60 mg/L) and pectinase (25 mg/L) were added. After 24 h, 200 mg/L of fully activated commercial yeast (Yeast CECA) was inoculated, which was produced by Angel Yeast Co., Ltd. (Yichang, China). During alcoholic fermentation, cap punch-down was performed three times daily, while the temperature and specific gravity were monitored regularly. The fermentation temperature was 20~28 °C, with a fermentation period of 21 days, and after the separation of pomace, the wine was aged for 45 days before bottling. After fermentation, the pomace was separated, and after standing for clarification for approximately 45 days, bottling was performed.

2.3.3. Basic Physicochemical Analyses of Grapes

According to Mengyuan Wei et al. [16], 100 berries were randomly selected and weighed (g), which was repeated three times, and the average was calculated. The pH value was measured using a PHS-3E pH meter. The TSS content was determined using the PAL-1 digital refractometer. The TA and reducing sugar content [17] was measured by acid–base titration.

2.3.4. Determination of Organic Acids

The organic acids were analyzed following the method of Caihong Li et al. [18]. A Waters 2699 high-performance liquid chromatography (HPLC) system equipped with a UV detector and a CAPCELL PAK C18 column (4.6 mm × 250 mm, 5 μm) was used for the detection. Here, 1 g of wine sample (precise to 0.01 g) was weighed accurately and placed in a 50 mL polytetrafluoroethylene centrifuge tube, diluted to 20 mL, vortexed for 1 min to mix thoroughly, centrifuged, the supernatant was aspirated, and filtered through a 0.45 μm aqueous phase filter membrane (polyethersulfone) into a sample vial for analysis. The liquid chromatography conditions were as follows. Column temperature: 30 °C. The detection wavelength was set at 214 nm. Mobile phase: A: 0.1% formic acid in water; B: acetonitrile. Gradient elution program: 0–14 min, 95–70% A, 14–15 min, 70% A, 15–16 min, 70–90% A, 16–18 min, 90% A, 18–19 min, 90–95% A, 19–20 min, 95% A. Injection volume: 2.0 μL.

2.3.5. Determination of Individual Phenolics

The determination of the hydroxycinnamic acids in the wine was conducted according to T/NAIA 084-2021 Method for Determination of Hydroxycinnamic Acids in Wine by HPLC (equipped with a UV detector, Waters, MA, USA) [18]. For hydroxybenzoic acids, 2 g of the wine samples was accurately weighed and mixed with 2 mL of ethyl acetate, followed by vortexing for 1 min and centrifugation. The supernatant was collected into a 50 mL test tube and extracted three times. The combined extract was evaporated to dryness using a rotary evaporator and re-dissolved in 2 mL of methanol. After filtration through a 0.45 µm organic phase membrane, the sample was ready for analysis. The flavanols were quantified based on T/NAIA 085-2021 Method for Determination of Flavanols in Wine by HPLC [19], and the flavonols were measured according to T/NAIA 082-2021 Method for Determination of Flavonols in Wine by HPLC [20]. For the flavonols and flavanols, 5 mL of wine sample was accurately pipetted into a 50 mL test tube, and to this was added 20 mL of 75% methanol solution. This was mixed for 1 min by vortex, then sonicated for 30 min at room temperature. The solution was filtered through a membrane filter, and the filtrate was then ready for instrumental analysis. The liquid chromatography conditions: column temperature: 40 °C, flow rate: 0.9 mL/min; mobile phase: A: 2% acetic acid aqueous solution; B: 0.5% acetic acid—50% acetonitrile aqueous solution. The detection wavelengths for hydroxycinnamic acid, hydroxybenzoic acid, flavonols, and flavanols were 320 nm, 280 nm, 280 nm, and 320 nm, respectively.

2.3.6. Determination of Anthocyanins

First, 5 mL of wine was accurately pipetted, 10 mL of 2% formic acid–methanol solution was added and ultrasonically extracted for 10 min, followed by vortex oscillation for 20 min. Then, centrifugation was performed at 4000 r/min for 15 min, and the supernatant was collected into a 250 mL round-bottom flask. The extraction was repeated 3 times according to the above steps, then the supernatants were combined and rotary evaporated to dryness (120 r/min, 25 °C). Mobile phase A: (V formic acid:V water = 0.1:100), mobile phase B: (V formic acid:V methanol:V acetonitrile = 0.1:50:50). The solution was reconstituted with solvent (phase A:phase B = 9:1) to 10 mL, filtered through a 0.22 μm membrane, and then analyzed. Liquid chromatography conditions: Agilent Poroshell 120 EC-C18 column (150 mm × 4.6 mm × 2.7 μm); column temperature: 40 °C; flow rate: 0.3 mL/min; mobile phase A: 0.1% formic acid in water, mobile phase B: 0.1% formic acid–methanol:acetonitrile (1:1) solution; gradient elution program: 0–17 min, 10–50% B; 17–18 min, 50–10% B; 18–20 min, 10% B. Injection volume: 2.0 μL. Mass spectrometry conditions: ion source type: ESI ion source; scan mode: positive ion mode, selected reaction monitoring (SRM), spray voltage 4000 V; sheath gas 35 Arb; auxiliary gas 10 Arb; ion transfer tube temperature: 300 °C; nebulizer temperature: 350 °C. The qualitative analysis was performed using a self-built mass spectral library optimized based on standard compounds, and the quantification was conducted using the external standard method.

2.3.7. Determination of Volatile Compounds

Based on the approach proposed by Yue Wang et al. [21], 8 mL of the wine sample and 10 μL of internal standard solution (4-methyl-1-pentanol, 394.08 μg/L) were placed in a headspace vial containing 2 g of NaCl. The mixture was equilibrated at 45 °C with shaking at 250 r/min for 30 min. The volatiles were then extracted for 30 min and thermally desorbed at 250 °C for 3 min.
Gas chromatography conditions: the initial temperature was held at 40 °C for 5 min, then it was increased to 120 °C at a rate of 3 °C/min. Carrier gas: helium at a flow rate of 0.8 mL/min. The mass spectrometry conditions included an ion source temperature of 230 °C, an electron impact ionization energy of 70 eV, and a scanning mass range of m/z 33–450. The retention indices of all the compounds were calculated using a standard mixture of n-alkanes (C6–C32) and determined using the Kovats method [22]. The compounds were first qualitatively identified by comparing the retention times and mass spectra with NIST 14 library data. Quantitative analysis was subsequently performed using a combination of internal and external standard methods. The odor activity values (OAVs) were calculated, and compounds with an OAV > 1 were identified as key aroma contributors [23].

2.3.8. Sensory Assessment

The sensory evaluation was conducted according to GB/T 15038-2006 [24] General Analytical Methods for Wine and Fruit Wine. The sensory panel consisted of 12 trained assessors (six males and six females, aged 30–40). A 70-point scoring system was used, covering four aspects: appearance (clarity and color, 10 points), aroma (intensity, complexity and variation, 20 points), taste (balance, body, tannin texture and degree, 30 points), and overall impression (style and typicality, 10 points). Each sample was evaluated at least twice by each panelist to ensure consistency.

2.4. Data Analysis

All the data were subjected to one-way analysis of variance (ANOVA) and Tukey’s test using SPSS 25.0 software. Orthogonal partial least squares discriminant analysis (OPLS-DA) was conducted using SIMCA-P 14.1 software. Each sample was measured in triplicate. The cluster heatmap was generated using TBtools-II, with hierarchical clustering as the algorithm and the Euclidean distance as the distance metric. The results were expressed as the mean ± standard deviation. Prior to the multivariate statistical analysis, all the chemical variables were normalized (Z-score normalization).

3. Results

3.1. Effect of the Crop Load on the Yield of Marselan

Table 1 presents the experimental design and yield statistics of Marselan under different crop load levels. Based on the actual yield from each experimental plot, the yield was estimated. This study found that under low loading conditions, the yield was relatively low, where the yield of treatment group F11 was only 67.7% of that of the control group. As the loading increased, the yield initially rose and then stabilized. Under the same crop load condition (e.g., F12 vs. F21, F13 vs. F31, F23 vs. F32), the grape yield in the treatment group with low shoot density was higher than that in the treatment group with high shoot density, indicating that the shoot treatment had a greater impact on the grape fruit yield.
Table 2, Table 3, Table 4, Table 5 and Table 6 present the variation of the berry weight, TSSs, reducing sugars, TA, and pH during grape ripening.
Table 2 displays the evident differences in the berry weight among the treatments at the same ripening stage. In the early stages of ripening, the treatments with lower shoot density generally showed higher berry weight compared to those with higher shoot density. However, in the late stages, no consistent pattern was observed. Within each treatment, the berry weight also varied significantly over time, showing a trend of increasing, then decreasing, and increasing again as the berries matured.
According to Table 3, in the low crop load treatments, the TSSs exhibited an initial increase followed by a decrease, peaking on 2 September and slightly declining in mid-September. In contrast, the TSSs in the high crop load treatments demonstrated a continuous upward trend. Under the same shoot density, the TSSs decreased with an increasing number of clusters per shoot.
Table 4 indicates that the reducing sugar content showed a fluctuating increase followed by a decrease during ripening, reaching its peak on 2 September. At the same time point, the treatments with lower shoot density exhibited relatively higher reducing sugar content.
As seen in Table 5, the TA differed notably among the treatments, though no clear pattern was associated with the crop load. As the grapes matured, the TA in all the treatments generally declined, especially during the early stages of maturation. However, a slight rebound in the TA was observed on 2 September.
According to Table 6, the pH of the grape berries in all the treatments increased during ripening, with a pronounced rise in early to mid-August. However, no significant differences in the pH were found among the treatments at the same sampling time.

3.2. Effects of Crop Load on Wine Chemical Composition

3.2.1. Basic Physicochemical Parameters

As shown in Table 7, the ethanol content of the wine samples ranged from 12.85% to 16.32%, showing significant differences only in the F11 and F43 treatment groups. The pH was between 3.54 and 3.81, with no significant differences among the treatments. The highest and lowest TA concentrations were observed in treatment groups F11 and F43, respectively. The highest and lowest residual sugar contents were found in the control and F43 groups, respectively.

3.2.2. Analysis of Organic Acids

Figure 1A depicts eight organic acids identified in the wine samples, with the total organic contents ranging from 9137.78 to 10,607.50 mg/L. No significant differences in the total organic acid contents were observed among the treatment groups (p > 0.05). Tartaric acid had the highest concentration, followed by malic acid and succinic acid.
Crop load regulation had diversified effects on various organic acids. At the same shoot density, the tartaric and malic acid contents initially elevated and then declined with the cluster density. Under the same number of clusters per shoot, as the density of shoots increased, the malic acid content first rose and then declined. The succinic acid content increased with an increasing number of clusters per shoot in the low shoot density treatments but lowered in the high shoot density treatments. Except for the 20 shoots/meter of canopy group, the other treatments showed a similar trend in the citric acid content. This pattern was also observed for the lactic acid content in all the treatments except the 25 shoots/meter of canopy group. Under the same crop load, the treatments with lower shoot density presented higher total organic acid contents, with the highest and lowest values being observed in groups F13 and F42, respectively.
As illustrated in Figure 1B, the lactic acid content in the control group (618.84 mg/L) was significantly higher than that in the treatment groups. The shikimic acid and malic acid contents were remarkably higher in the F32 group compared to the other treatments, while the F43 group had a relatively high citric acid content. Tartaric acid was most abundant in the F11 and F13 treatments, whereas succinic and pyruvic acids reached their highest concentrations in F13 and F22, respectively.
Hierarchical clustering analysis (heatmap) showed that all the wine samples could be grouped into three distinct clusters. One cluster contained the treatments with medium to high crop loads (F33, F43, F32, F31, and F41), while another included the medium to low crop load treatments (F12, F22, F23, F11, and F13).

3.2.3. Analysis of Phenolic Compounds

The 21 individual phenolics were categorized and analyzed according to four groups: hydroxybenzoic acids, hydroxycinnamic acids, flavanols, and flavonols, as shown in Figure 2.
Figure 2A illustrates that the polyphenols are primarily composed of flavanols, followed by hydroxybenzoic acids. Overall, the low crop load treatment groups had higher hydroxybenzoic acid contents, but the hydroxycinnamic acid content was relatively low, and it reached the highest value in the control group. The highest levels of flavanols and hydroxybenzoic acids appeared in the F22 treatment group. The flavonol content was generally higher in the low crop load groups than in the high crop load groups, with the highest value found in the F13 treatment group.
Figure 2B discloses that the clustering of the treatment groups does not follow a clear pattern based on the crop load. The F32, F11, and F13 treatment groups were clustered into one category due to the higher levels of flavonols and hydroxycinnamic acids in these wines. The F43, F31, F42, F12, and F23 treatment groups were clustered into another category, while the F21, F22, F33, F41 treatment groups and the control group formed a third category.

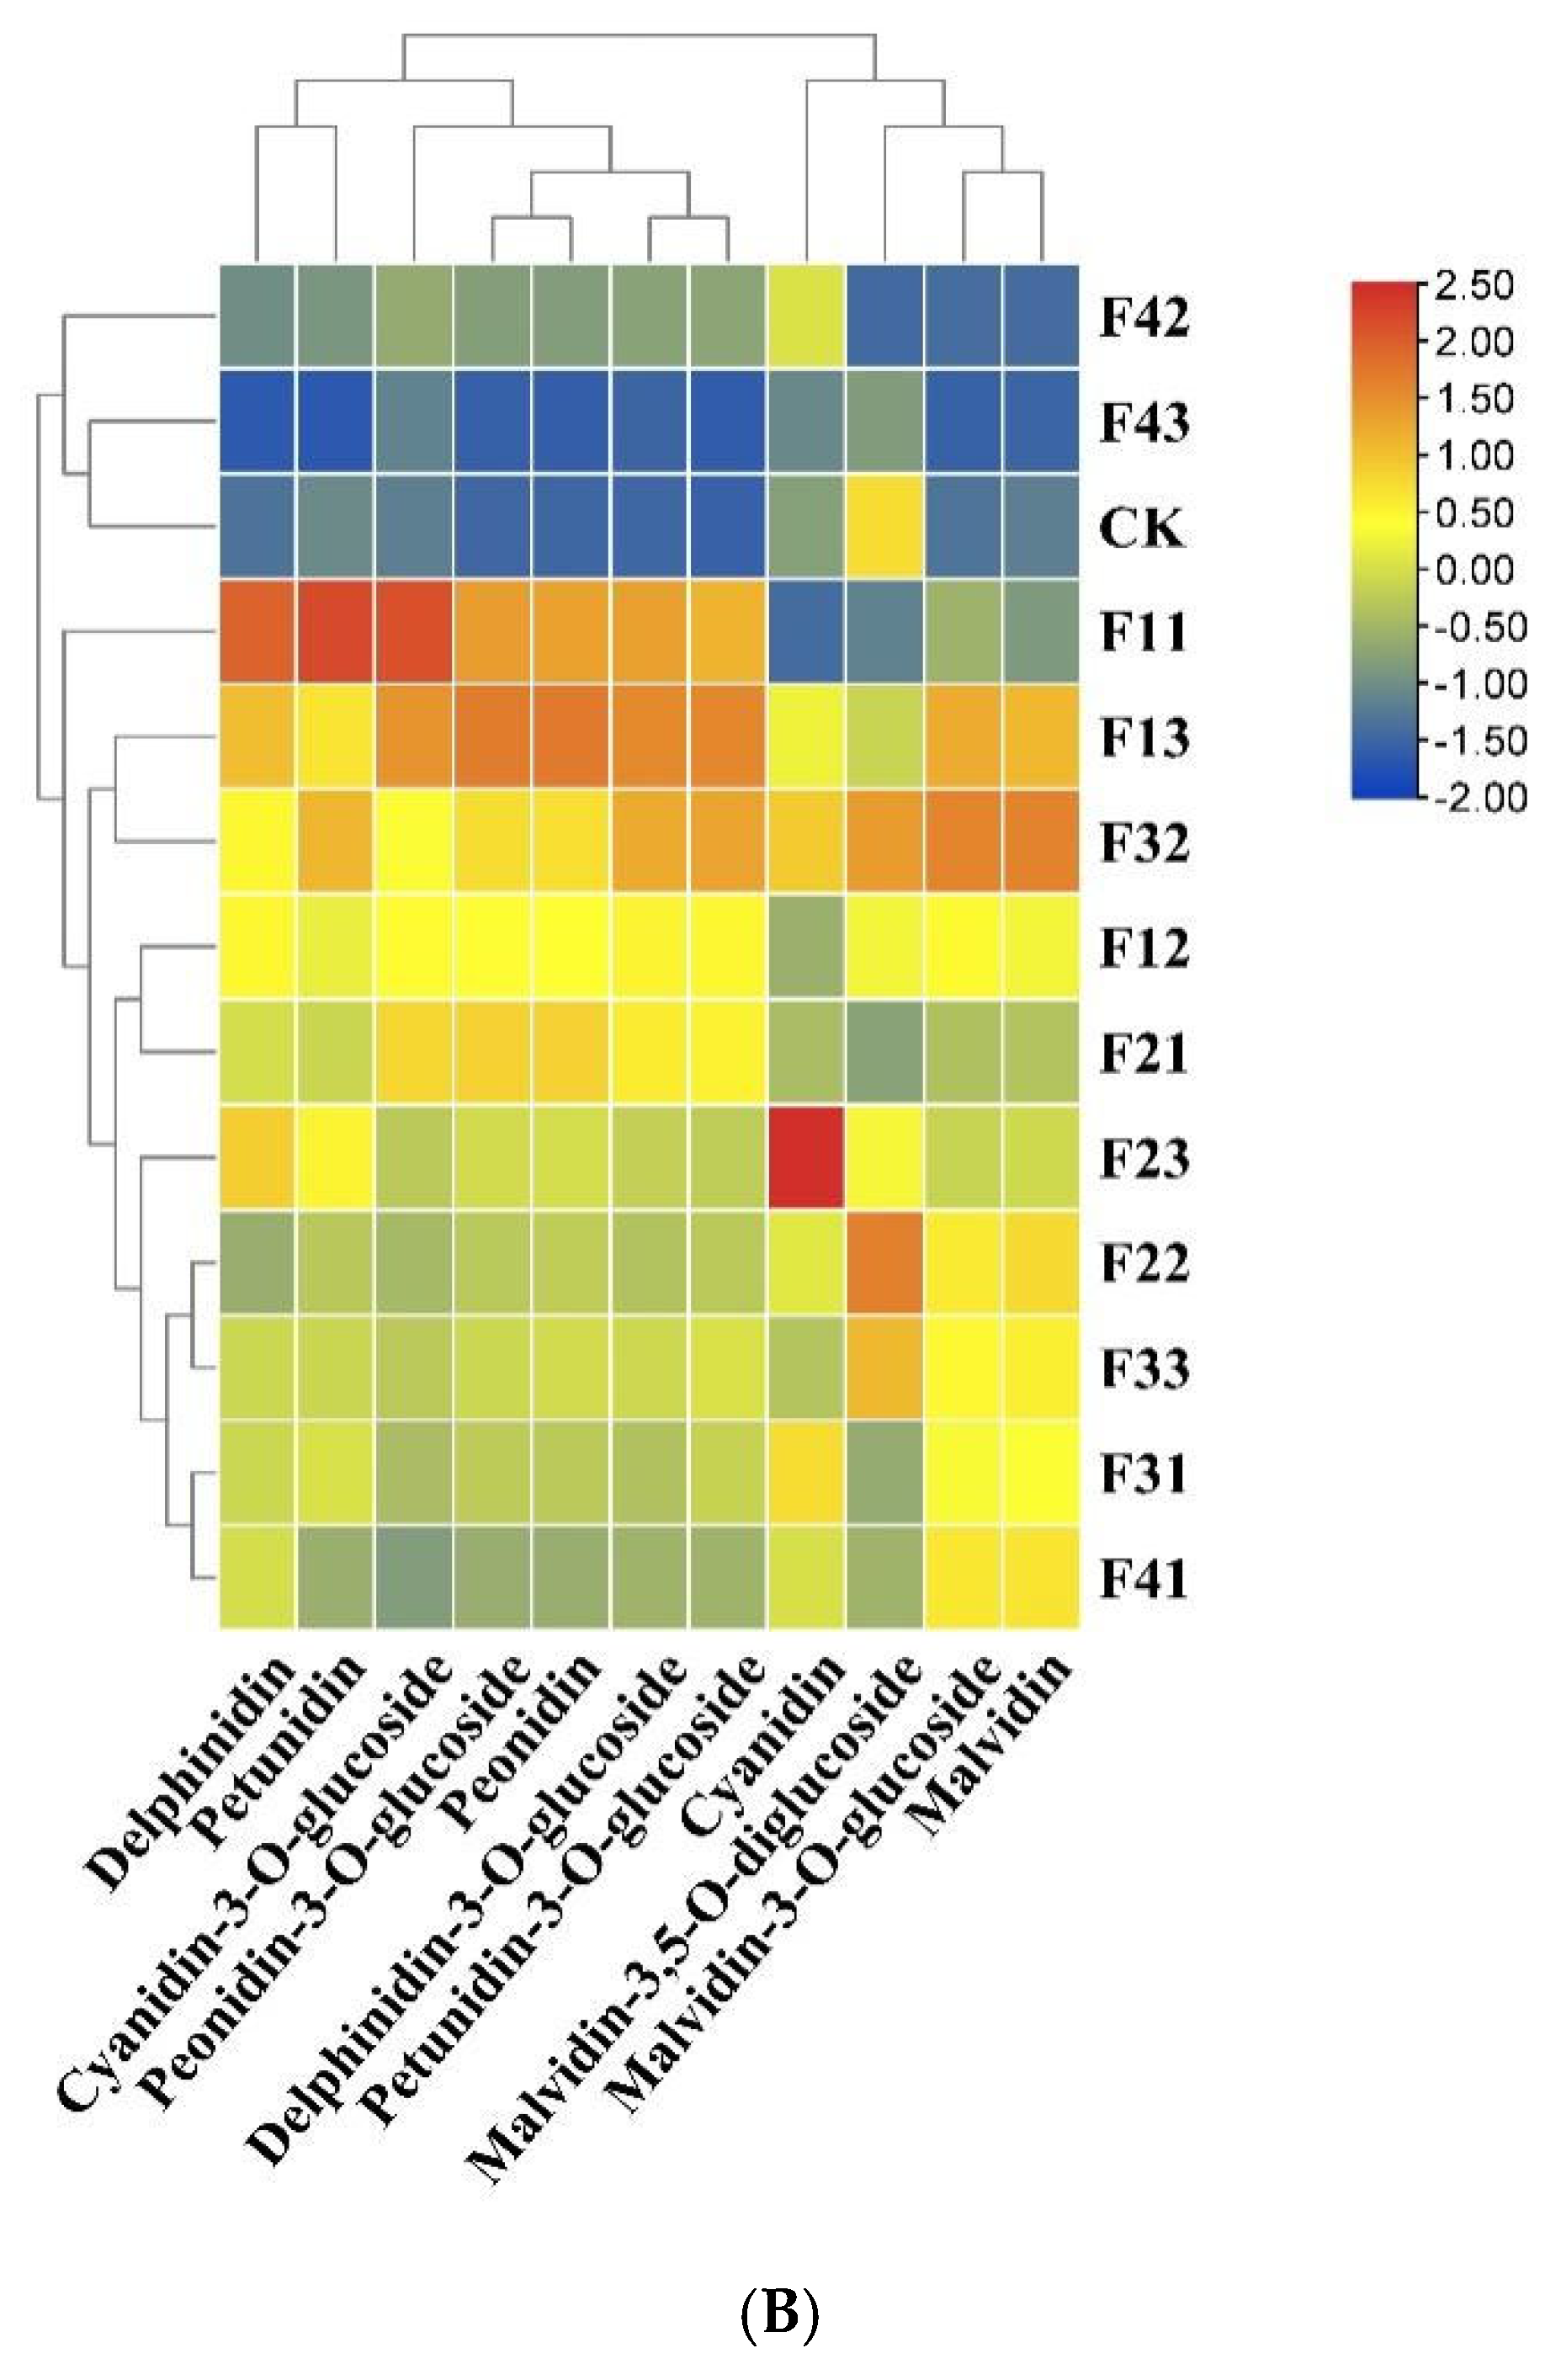
3.2.4. Anthocyanin Composition Analysis

A total of 11 anthocyanins were detected in the wine, with malvidin and malvidin-3-O-glucoside being the dominant compounds, accounting for 39.7–47.2% and 45.6–54.2% of the total anthocyanin content, respectively. Other significant anthocyanins included delphinidin-3-O-glucoside, peonidin-3-O-glucoside, peonidin, and petunidin-3-O-glucoside, with concentrations ranging from 2.8 to 25.7 mg/L. The contents of the other anthocyanins were close to or less than 1 mg/L.
Figure 3A shows the significant differences (p < 0.05) in the individual anthocyanin components and their total content among the treatment groups. Except for malvidin-3,5-O-diglucoside, the other anthocyanin components and the total content were lowest in the F43 treatment group and the control group. The total individual anthocyanins content in the 10–20 shoots per meter of canopy treatment group ranged from 116% to 490% of the control group, with cyanidin-3-O-glucoside in the F11 treatment group reaching 8.05 times that of the control group. The medium crop load treatment groups generally exhibited higher anthocyanin contents.
In Figure 3B, all the samples are divided into two major categories. The F42 and F43 treatment groups and the control group were clustered into one category, where the anthocyanin contents were lower. The other treatment groups were grouped into a second category, with the F13 and F32 treatment groups showing higher anthocyanin contents.

3.2.5. Analysis of Aroma Components

HS-SPME-GC×GC-TOFMS was used to analyze the volatile components in the wine under different crop load treatments, identifying 92 volatile aromatic compounds from 10 categories. Esters were the most abundant, with 32 compounds detected, followed by alcohols (24 compounds), acids (9 compounds), alkanes (9 compounds), terpenes (7 compounds), phenols (3 compounds), aldehydes (3 compounds), ketones (3 compounds), ethers (1 compound), and olefins (1 compound). Their mass concentrations ranged from 172,267.9 μg/L to 285,503.5 μg/L, with the maximum value in the F11 treatment group and the minimum in the control group.
Trans-3-hexen-1-ol was a unique aroma detected exclusively in the F11 treatment group, contributing significantly to the herbal aroma. 3-Furaldehyde was also specific to this group, playing a crucial role in the caramel aroma. 2-Propyl-1-heptanol was unique to the F12 group and positively contributed to the fruity aroma. Octanol was detected only in the F23 group, also playing a positive role in the formation of fruity notes. Nonanal, characteristic of the F32 group, imparted fatty and citrus-like aromas. Terpinolene was a unique aroma in the F41 group and contributed positively to the pine aroma. Phenylethanol, present only in the F43 group and the control group, played a positive role in the formation of floral notes. Gamma-nonanolactone was unique to the control group and contributed positively to the fruity aroma.
A total of 30 volatile compounds were detected in all the treatment groups, including 18 esters, eight alcohols, three acids, and one terpene. These 30 compounds could effectively distinguish between the control and high crop load treatment groups. Specifically, the F23 and F42 groups were clustered together, while the F43 and control groups formed another cluster, show as in Figure 4A.
A total of 11 key volatile compounds influencing aroma characteristics were identified based on an OAV > 1. These included six esters, three alcohols, one acid, and one terpene. β-damascenone and ethyl caprylate exhibited the highest OAVs (OAV > 1320.82) among all the treatment groups, indicating their critical role in shaping the aroma characteristics of Marselan wine. These findings are further validated in the clustering heatmap of the aroma compounds, show as in Figure 4B.

3.2.6. Sensory Evaluation

In order to evaluate the effect of the crop load on the chemical composition of Marselan wine, this study performed a sensory evaluation based on seven dimensions: balance, style and typicality, body, complexity and variation, tannin texture and degree, intensity, and clarity and color. As illustrated in Figure 5, the wine produced by the F23 treatment group scored the highest in multiple indicators, including style and typicality, tannin texture and degree, body, and intensity. However, the F41 treatment group performed the best in terms of clarity and color. Overall, the F23 treatment group achieved the optimal sensory quality, with a top score of 63.8 points, significantly higher than the treatment groups with shoot densities of 20 and 25 shoots per meter of trellis surface.

4. Discussion

The composition of grapes directly influences both the fermentation process of wine and the quality of the final product. The crop load affects not only fruit ripening and composition but also vine growth and resistance, thereby impacting the overall development of both the fruits and the plants [25,26]. Previous studies have shown that appropriate crop load control can enhance the composition of grapes and wine [27]. However, excessively low crop loads significantly reduce the grape yield [28]. This is consistent with the findings of the present study, where the yield of the lowest crop load treatment group (F11) was only 67.7% of the control group, possibly due to excessive vegetative growth leading to an imbalance in the nutrient distribution and, consequently, a reduced fruit yield. When the crop load is excessively high, the photosynthetic capacity of the leaves may be insufficient to support the full development of all fruits, resulting in limited actual yield growth. Additionally, a high crop load demands more water and fertilizer inputs. If resources are inadequate, the actual yield will be constrained. Therefore, in this experiment, even though the designed crop loads for wine grapes varied significantly, the differences in the actual yield were relatively small. Meanwhile, the Helan Mountain East Foothill region experienced substantial rainfall in 2024, leading to severe gray mold infections during the late fruit maturation stage. Diseased fruits rotted and dropped, causing a decline in the effective yield per vine.
Moreover, this study found that crop load regulation affected the physicochemical properties of grape berries and the basic physicochemical indices of wine. Lower crop loads were conducive to improving parameters such as the hundred-berry weight and soluble solids content, which favored early berry enlargement. For instance, in the early maturity period, the treatment groups with lower shoot density exhibited higher hundred-berry weights compared to the groups with higher shoot density. Appropriate shoot densities can establish a reasonable leaf area index, improving the light energy utilization of the leaves, enhancing the vine photosynthetic capacity, and increasing the accumulation of flavor compounds in the fruit [29]. As the berries matured, the hundred-berry weight initially increased, then decreased, and increased again, suggesting that excessively low shoot densities might promote overly vigorous vegetative growth, impeding the accumulation of photosynthates in the grapes.
Typically, the soluble solids content of wine grapes continues to rise during ripening [30]. However, in this study, the soluble solids content in the low crop load treatment groups initially increased and then declined, which may be attributed to rapid early sugar accumulation followed by decreased metabolic activity. The concentration of reducing sugars, a key indicator of fruit ripeness and winemaking potential, primarily originates from the translocation of photosynthates from the leaves to the berries. The treatment groups with low shoot density exhibited relatively higher reducing sugar content, which may be attributed to the shoot density regulation adjusting the canopy microclimate and the distribution of photosynthetic products, thereby influencing the accumulation of reducing sugars in the wine grapes [31]. The subsequent decline in the reducing sugar content in the late ripening stage may be caused by consecutive rainfall events reducing the photosynthetic efficiency.
The total acidity decreased sharply during the early stages of fruit maturation but rose slightly thereafter, which could also be attributed to prolonged rainfall reducing the sunlight exposure, delaying sugar accumulation and slowing acid degradation, thereby causing an increase in the total acidity content. However, the differences in the crop load had minimal effects on the pH of the grape berries.
A significant difference in the ethanol content among the treatments was observed only between the F11 and F43 groups, suggesting that crop load regulation concentrates sugars in grapes, leading to increased ethanol levels after fermentation [32,33]. Crop load control was found to enhance both the ethanol and total acid contents, thereby elevating the complexity of the wine body. Organic acids are critical for the chemical and microbial stability of wine, forming its structural backbone [34]. They are key determinants of wine acidity, pH, and mouthfeel. Tartaric and malic acids—primarily derived from grapes—primarily contribute to wine acidity and astringency. Other acids are generally produced by yeast metabolism during fermentation.
In this study, compared to cluster thinning, shoot management demonstrated a more pronounced impact on the wine composition improvement, a finding that contrasts with previous studies [35]. This may be due to differences in the grape variety and environmental conditions. Polyphenols, pivotal secondary metabolites produced during plant growth and development, constitute the structural basis of wine [36]. As a processed product, wine’s phenolic composition and concentration are influenced by multiple factors, including the grape variety, cultivation factors (climatic conditions, soil type, vineyard management), and winemaking techniques [37]. Previous studies have shown that the effects of cluster thinning on flavonoid accumulation in grapes and wine vary with the climatic conditions and experimental varieties. Generally, cluster thinning promotes flavonoid accumulation in berries, thus increasing the flavonoid content of wine [38,39]. However, the results of this study differ: the low crop load treatment groups exhibited higher levels of hydroxybenzoic acids, possibly due to the higher fruit maturity enhancing hydroxybenzoic acid synthesis. The hydroxycinnamic acid content was lower under low crop loads, with the highest value observed in the control group, potentially attributed to the vineyard management and vinification processes. Flavanols and flavonols impart bitterness and astringency to wine, constituting its structural framework [40]. Meanwhile, they also play a role in fortifying the wine color [41]. Existing research has reported inconsistent effects of cluster thinning on the flavanol and flavonol contents of wine. In this study, the shoot density treatments promoted the flavonol content but did not significantly alter the flavanol levels. Additionally, notable differences in the total polyphenol content were observed only between certain treatment groups, inconsistent with the findings of Guihua Zeng et al. [42]. These discrepancies may result from variations in the cultivation practices, climate, or grape cultivar. Anthocyanins, the principal contributors to wine color, have a profound impact on wine’s visual attributes and flavor [43]. It has been demonstrated that cluster thinning can affect both the content and the composition of anthocyanins in grapes and wine [44]. Malvidin, delphinidin, petunidin, cyanidin, and peonidin are the primary anthocyanins present in grapes and wines [45]. They usually exist in glycosylated forms but are also capable of acylation through esterification with various acids, forming acylated anthocyanins [46,47]. This study revealed that most individual anthocyanins and the total anthocyanin contents were lowest in the F43 treatment and control groups, with the intermediate crop load treatments exhibiting higher anthocyanin levels. These findings suggest that crop load control favors anthocyanin synthesis, aligning with previous research [48]. From the perspective of the plant source–sink relationship, an optimal crop load is essential for plant growth. Excessively high crop loads lead to nutrient diversion, impeding berry development, whereas overly low crop loads induce vigorous vegetative growth and suppress berry development, causing photosynthates to accumulate in vegetative organs and hindering source-to-sink nutrient transport or even reversing the flow from sink back to source [49]. High crop loads can weaken photosynthesis, thereby reducing the berry anthocyanin concentration and delaying grape maturation, whereas moderate crop loads balance yield and quality [50,51].
The complexity and diversity of volatile compounds in wine are influenced by the climate, grape variety, fermentation processes, and other factors. The F11 treatment group exhibited the highest concentration of volatile compounds, suggesting that crop load management can significantly enhance the richness of aromatic components in wine, supporting the findings of Bowen et al. [13,52]. The sensory evaluations of the wines from the moderate crop load treatments scored higher. This implies that when the crop load is in an optimal range, the grapes receive more photosynthetic energy, impelling flavor compounds to reach a balanced state [12]. The economic benefits of grape cultivation are primarily reflected in the unit price and total yield of fruits of different qualities, while the economic benefits of wine production are reflected in the unit price and total yield of wines made from fruits of varying qualities. Therefore, balancing the relationship between grape and wine quality and yield can effectively enhance the overall economic benefits.

5. Conclusions

This study explored the impact of crop load regulation on Marselan berry and wine qualities. A low crop load improves the sensory composition of grapes. Moderately reducing the crop load significantly enhances the sensory composition of wine. The response of phenolic compounds showed significant differences, with lower loading levels being more conducive to the accumulation of flavonols and hydroxybenzoic acids. Moderate crop load control can enhance anthocyanin synthesis by promoting photosynthesis and significantly increase the total aroma compounds in wine, whereas an excessive crop load (F43) inhibits secondary metabolism due to nutrient competition, leading to reduced anthocyanin and aroma components. The organic acid content showed significant differentiation between medium–high loading and low loading, with the latter exhibiting higher concentrations. The sensory evaluation results showed that the wine from the 30-cluster crop load (15 shoots per meter of canopy, 2 clusters per shoot) treatment achieved the best overall quality, which increased the composition of grape wine without reducing the yield, thereby enhancing the overall economic benefits of the wine. The findings underscore that crop load regulation reshapes metabolic pathways, influencing wine flavor characteristics. This provides a theoretical foundation for the cultivation of high-quality wine grapes.
Future research should verify the stability of crop load regulation in field production, analyze its interaction with environmental factors to elucidate its role in the wine style, and establish quantitative models linking key aromatic compounds (e.g., ethyl caprylate and β-damascenone) with the crop load, optimizing the collaborative strategy between cultivation and winemaking.

Author Contributions

Conceptualization, X.S. and T.M.; methodology, X.S.; software, Q.G.; validation, J.K., J.Z. and C.W.; formal analysis, F.W.; investigation, Q.G.; resources, Q.G.; data curation, Z.X.; writing—original draft preparation, J.K.; writing—review and editing, Q.G.; visualization, C.W.; supervision, T.M.; project administration, C.W.; funding acquisition, J.K. and Q.G. All authors have read and agreed to the published version of the manuscript.

Funding

This research was funded by the Major Research and Development Program of Ningxia Hui Autonomous Region, grant number 2024BF01003-04, and the Science and Technology Innovation Guidance Project of Ningxia Academy of Agricultural and Forestry Sciences, grant number NKYG-24-11.

Data Availability Statement

Data are contained within the article.

Conflicts of Interest

The authors declare no conflicts of interest.

References

  1. Sivilotti, P.; Falchi, R.; Vanderweide, J.; Sabbatini, P.; Bubola, M.; Vanzo, A.; Lisjak, K.; Peterlunger, E.; Herrera, J.C. Yield reduction through cluster or selective berry thinning similarly modulates anthocyanins and proanthocyanidins composition in Refosco dal peduncolo rosso (Vitis vinifera L.) grapes. Sci. Hortic. 2020, 264, 109166. [Google Scholar] [CrossRef]
  2. Wei, M.Y. Nutritional Analysis and Application of Thinned Unripe Table Grape. Master’s Thesis, Northwest A&F University, Yangling, China, 2022. [Google Scholar]
  3. Xi, X.; Zha, Q.; He, Y.; Tian, Y.; Jiang, A. Influence of cluster thinning and girdling on aroma composition in ‘Jumeigui’ table grape. Sci. Rep. 2020, 10, 6877. [Google Scholar] [CrossRef] [PubMed]
  4. Gil, M.; Esteruelas, M.; González, E.; Kontoudakis, N.; Jiménez, J.; Fort, F.; Canals, J.M.; Hermosín-Gutiérrez, I.; Zamora, F. Effect of two different treatments for reducing grape yield in Vitis vinifera cv Syrah on wine composition and quality: Berry thinning versus cluster thinning. J. Agric. Food Chem. 2013, 61, 4968–4978. [Google Scholar] [CrossRef] [PubMed]
  5. Wang, W.; Liang, Y.; Quan, G.; Wang, X.; Xi, Z. Thinning of cluster improves berry composition and sugar accumulation in Syrah grapes. Sci. Hortic. 2022, 297, 110966. [Google Scholar] [CrossRef]
  6. Wang, Y.; He, Y.-N.; He, L.; He, F.; Chen, W.; Duan, C.-Q.; Wang, J. Changes in global aroma profiles of Cabernet Sauvignon in response to cluster thinning. Food Res. Int. 2019, 122, 56–65. [Google Scholar] [CrossRef] [PubMed]
  7. VanderWeide, J.; Nasrollahiazar, E.; Schultze, S.; Sabbatini, P.; Castellarin, S.D.; Parker, A. Impact of Cluster Thinning on Wine Grape Yield and Fruit Composition: A Review and Meta-Analysis. Aust. J. Grape Wine Res. 2024, 2024, 20. [Google Scholar] [CrossRef]
  8. Matteo, M.; Zoffoli, J.P.; Ayala, M. Calcium sprays and crop load reduction increase fruit quality and postharvest storage in sweet cherry (Prunus avium L.). Agronomy 2022, 12, 829. [Google Scholar] [CrossRef]
  9. Musacchi, S.; Serra, S. Apple fruit quality: Overview on pre-harvest factors. Sci. Hortic. 2018, 234, 409–430. [Google Scholar] [CrossRef]
  10. Roberto, S.R.; Borges, W.F.S.; Colombo, R.C.; Koyama, R.; Hussain, I.; de Souza, R.T. Berry-cluster thinning to prevent bunch compactness of ‘BRS Vitoria’, a new black seedless grape. Sci. Hortic. 2015, 197, 297–303. [Google Scholar] [CrossRef]
  11. Xiao, L.Z.; Lu, H.L.; Jia, Y.; Yang, R.H.; Ye, W.J.; Zhu, L.; Wang, M.J. Effects of flower thinning on fruit qualities and yield of ‘Summer Black’ grape. Sino-Overseas Grapevine Wine 2021, 5, 45–48,54. [Google Scholar]
  12. Kovalenko, Y.; VanderWeide, J.; Tindjau, R.; Zandberg, W.F.; Castellarin, S.D. Timing and severity of crop load management influences technological maturity, terpene synthase expression and free terpene accumulation in Gewürztraminer grapes (Vitis vinifera L.). Aust. J. Grape Wine Res. 2022, 28, 638–650. [Google Scholar] [CrossRef]
  13. Bowen, A.J.; Reynolds, A.G. Aroma compounds in Ontario Vidal and Riesling icewines. II. Effects of crop level. Food Res. Int. 2015, 76, 550–560. [Google Scholar] [CrossRef] [PubMed]
  14. Ge, Q.; Zhang, Y.K.; Yan, Y.; Kai, J.R.; Zhou, X.M.; Jiang, W.G.; Li, X.H.; Chang, T.W.; Yi, Z.C.; Sun, X.Y.; et al. Effect of crop load on the quality of Cabernet Sauvignon grapes and wines at different harvest times. Food Sci. 2025, 46, 128–137. [Google Scholar]
  15. Glišić, M.; Matijašević, S.; Bešlić, Z.; Ranković-Vasić, Z.; Glišić, I.; Ćirković, D. Effect of early berry thinning and girdling on grape quality of cv.victoria. In Annals of the University of Craiova—Agriculture Montanology Cadastre Series; University of Craiova: Craiova, Romania, 2023. [Google Scholar]
  16. Wei, M.; Ma, T.; Cao, M.; Wei, B.; Li, C.; Li, C.; Zhang, K.; Fang, Y.; Sun, X. Biomass estimation and characterization of the nutrient components of thinned unripe grapes in China and the global grape industries. Food Chem. X 2022, 15, 100363. [Google Scholar] [CrossRef] [PubMed]
  17. GB 5009.7-2016; National Food Safety Standard—Determination of Reducing Sugar in Foods. National Health and Family Planning Commission of the People’s Republic of China: Beijing, China, 2016. (In Chinese)
  18. Li, C.H.; Wang, Y.; Lv, Y.; Qiu, X.Y.; Wu, B.L.; Ma, T.T.; Fang, Y.L.; Sun, X.Y. Physicochemical characterization and antioxidant capacity analysis of commercial Marselan wines from Ningxia and Hebei regions based on OPLS-DA. Food Ferment. Ind. 2023, 49, 283–292. (In Chinese) [Google Scholar]
  19. T/NAIA 084—2021; Determination of Hydroxycinnamic Acids in Wine—High Performance Liquid Chromatography. Ningxia Association for Chemical Analysis and Testing: Yinchuan, China, 2021. (In Chinese)
  20. T/NAIA 085—2021; Determination of Flavanols in Wine—High Performance Liquid Chromatography. Ningxia Association for Chemical Analysis and Testing: Yinchuan, China, 2021. (In Chinese)
  21. T/NAIA 082—2021; Determination of Water-Soluble Humic Acid Content in Organic Fertilizers—Volumetric Method. Ningxia Association for Chemical Analysis and Testing: Yinchuan, China, 2021. (In Chinese)
  22. Wang, Y.; Ge, Q.; Zhang, J.; Ma, T.T.; Fang, Y.L.; Li, C.H.; Sun, X.Y. Analysis of characteristics and differences between commercial Marselan wines from three Chinese origins based on of intelligent sensory and GC-MS. Food Ferment. Ind. 2024, 50, 253–264. [Google Scholar]
  23. Issa-Issa, H.; Guclu, G.; Noguera-Artiaga, L.; López-Lluch, D.; Poveda, R.; Kelebek, H.; Selli, S.; Carbonell-Barrachina, Á.A. Aromaactive compounds, sensory profile, and phenolic composition of Fondillón. Food Chem. 2020, 316, 126353. [Google Scholar] [CrossRef] [PubMed]
  24. GB/T 15038-2006; Analytical methods of wine and fruit wine. China National Standardization Administration Committee: Beijing, China, 2021. (In Chinese)
  25. Previtali, P.; Dokoozlian, N.K.; Pan, B.S.; Wilkinson, K.L.; Ford, C.M. Crop load and plant water status influence the ripening rate and aroma development in berries of grapevine (Vitis vinifera L.) cv. Cabernet Sauvignon. J. Agric. Food Chem. 2021, 69, 7709–7724. [Google Scholar] [CrossRef] [PubMed]
  26. Li, J.; Ma, T.; Bao, S.; Yin, D.; Ge, Q.; Li, C.; Fang, Y.; Sun, X. Suitable crop loading: An effective method to improve “Shine Muscat” grape quality. Food Chem. 2023, 424, 136451. [Google Scholar] [CrossRef] [PubMed]
  27. Feng, F.; Li, M.; Ma, F.; Cheng, L. The effects of bagging and debagging on external fruit quality, metabolites, and the expression of anthocyanin biosynthetic genes in ‘Jonagold’ apple (Malus domestica Borkh.). Sci. Hortic. 2014, 165, 123–131. [Google Scholar] [CrossRef]
  28. Yue, X.; Yu, Y.; Ju, Y.; Zhao, Y.; Xi, Z.; Zhang, Z. Effects of Different Capacity on Fruit Quality of ‘Red Globe’ Grape. North. Hortic. 2018, 8, 29–34. [Google Scholar]
  29. Wang, X.; De Bei, R.; Fuentes, S.; Collins, C. Influence of canopy management practices on canopy architecture and reproductive performance of semillon and shiraz grapevines in a hot climate. Am. J. Enol. Vitic. 2019, 70, 360–372. [Google Scholar] [CrossRef]
  30. Lan, T.; Wang, J.; Yuan, Q.; Lei, Y.; Peng, W.; Zhang, M.; Li, X.; Sun, X.; Ma, T. Evaluation of the color and aroma characteristics of commercially available Chinese kiwi wines via intelligent sensory technologies and gas chromatography-mass spectrometry. Food Chem. X 2022, 15, 100427. [Google Scholar] [CrossRef] [PubMed]
  31. Chang, Y. Study on Maturity Index System of Wine Grape in Tuha Region of Xinjiang. Master’s Thesis, Northwest A&F University, Yangling, China, 2019. [Google Scholar]
  32. Kliewer, M.W.; Dokoozlian, N.K. Leaf area/crop weight ratios of grapevines: Influence on fruit composition and wine quality. Am. J. Enol. Vitic. 2005, 56, 170–181. [Google Scholar] [CrossRef]
  33. Keller, M. Deficit Irrigation and Vine Mineral Nutrition. Am. J. Enol. Vitic. 2005, 56, 267–283. [Google Scholar] [CrossRef]
  34. Santesteban, L.G.; Miranda, C.; Royo, J.B. Regulated deficit irrigation effects on growth, yield, grape quality and individual anthocyanin composition in Vitis vinifera L. cv. ‘Tempranillo’. Agric. Water Manag. 2011, 98, 1171–1179. [Google Scholar] [CrossRef]
  35. Tian, M.B.; Hu, R.Q.; Liu, Z.L.; Shi, N.; Lu, H.C.; Duan, C.Q.; Wang, J.; Sun, Y.F.; Kong, Q.S.; He, F. The pH adjustment of Vitis amurensis dry red wine revealed the evolution of organic acids, volatomics, and sensory quality during winemaking. Food Chem. 2024, 436, 137730. [Google Scholar] [CrossRef] [PubMed]
  36. PPoni, S.; Gatti, M.; Palliotti, A.; Dai, Z.; Duchêne, E.; Truong, T.T.; Ferrara, G.; Matarrese, A.M.S.; Gallotta, A.; Bellincontro, A.; et al. Grapevine quality: A multiple choice issue. Sci. Hortic. 2017, 234, 445–462. [Google Scholar] [CrossRef]
  37. Cheynier, V.; Comte, G.; Davies, K.M.; Lattanzio, V.; Martens, S. Plant phenolics: Recent advances on their biosynthesis, genetics, and ecophysiology. Plant Physiol. Biochem. 2013, 72, 1–20. [Google Scholar] [CrossRef] [PubMed]
  38. Condurso, C.; Cincotta, F.; Tripodi, G.; Sparacio, A.; Giglio, D.M.L.; Sparla, S.; Verzera, A. Effects of Cluster thinning on wine quality of Syrah cultivar (Vitis vinifera L.). Eur. Food Res. Technol. 2016, 242, 1719–1726. [Google Scholar] [CrossRef]
  39. Prajitna, A.; Dami, I.E.; Steiner, T.E.; Ferree, D.C.; Scheerens, J.C.; Schwartz, S.J. Influence of cluster thinning onphenolic composition, resveratrol, and antioxidant capacity in Chambourcin wine. Am. J. Enol. Vitic. 2007, 58, 346–350. [Google Scholar] [CrossRef]
  40. Gómez-Míguez, M.; González-Manzano, S.; Escribano-Bailón, M.T.; Heredia, F.J.; Santos-Buelga, C. Influence of different phenolic copigments on the colorofmalvidin3-glucoside. J. Agric. Food Chem. 2006, 54, 5422–5429. [Google Scholar] [CrossRef] [PubMed]
  41. Zhao, T.; Zhao, Y.M.; Wang, Y.T.; Duan, B.B.; Zhang, Z.W. Effect of potassium dihydrogen phosphate onflavonoids of Vitisvinifera Cabernet sauvignon grape. J. North West For. Univ. 2020, 35, 118–123. (In Chinese) [Google Scholar]
  42. Zeng, G.H.; Gao, F.F.; Hui, Z.M.; Zhang, Z.W. Impact of Cluster Thinning on the Contents of Flavonoids in Cabernet Sauvignon Wine. J. North West For. Univ. 2021, 36, 112–117. (In Chinese) [Google Scholar]
  43. Šarac, D.P.; Torović, L.; Orčić, D.; Mimica-Dukić, N.; Đorđević, T.; Lesjak, M. Comprehensive study of phenolic profile and biochemical activity of monovarietal red and white wines from Fruška Gora region, Serbia. Food Chem. 2024, 448, 139099. [Google Scholar] [CrossRef] [PubMed]
  44. Song, C.Z.; Wang, C.; Xie, S.; Zhang, Z.W. Effects of leaf removal and cluster thinning on berry quality of Vitisvinifera cultivars In the region of Weibei Dryland in China. J. Integr. Agric. 2018, 17, 1620–1630. [Google Scholar] [CrossRef]
  45. Liu, Y.; Tang, A.X.; Peng, B.Z. Research progress on anthocyanins and their regulation of uric acid metabolism. J. Chin. Inst. Food Sci. Technol. 2023, 23, 365–375. [Google Scholar]
  46. Cheynier, V.; Dueñas-Paton, M.; Salas, E.; Maury, C.; Souquet, J.-M.; Sarni-Manchado, P.; Fulcrand, H. Structure and properties of wine pigments and tannins. Am. J. Enol. Vitic 2006, 57, 298–305. [Google Scholar] [CrossRef]
  47. Garrido-Bauelos, G.; Buica, A.; Toit, W.D. Relationship between anthocyanins, proanthocyanidins, and cell wall polysaccharides in grapes and red wines. A current state-of-art review. Crit. Rev. Food Sci. Nutr. 2022, 62, 7743–7759. [Google Scholar] [CrossRef] [PubMed]
  48. Yang, Z.; Cheng, G.; Gao, Y.; Wang, Y.; Dong, X.; Chen, W.; Duan, C.; Wang, J. Effects of Cluster Thinning on Berry Size and Anthocyanins of Cabernet Sauvignon. Acta Agric. Boreali-Occident. Sin. 2015, 24, 111–121. (In Chinese) [Google Scholar]
  49. Mota, R.V.D.; Souza, C.R.D.; Silva, C.P.C.; Freitas, G.D.F.; Shiga, T.M.; Purgatto, E.; Lajolo, F.M.; Regina, M.D.A. Biochemical and agronomical responses of grapevines to alteration of source—Sink ratio by cluster thinning and shoot trimming. Bragantia 2010, 69, 17–25. [Google Scholar] [CrossRef]
  50. Favre, G.; Hermosín-Gutiérrez, I.; Piccardo, D.; Gómez-Alonso, S.; González-Neves, G. Selectivity of pigments extraction from grapes and their partial retention in the pomace during red-winemaking. Food Chem. 2019, 277, 391–397. [Google Scholar] [CrossRef] [PubMed]
  51. Liu, J. Optimization of the Microdomain Environment of Wine Grapes and Its Effect on Wine Quality; Yanshan University: Qinghuangdao, China, 2024. [Google Scholar]
  52. Sun, Q.; Sacks, G.; Lerch, S.; Vanden Heuvel, J.E. Impact of shoot thinning and harvest date on yield components, fruit composition, and wine quality of marechal foch. Am. J. Enol. Vitic. 2011, 62, 32–41. [Google Scholar] [CrossRef]
Figure 1. One-way ANOVA of organic acid content in Marselan wine under different crop loads. (A) Organic acid content; and (B) clustering heatmap of organic acids. Note: The lowercase letters indicate significant differences in the compound components between treatment groups (p < 0.05), and the uppercase letters denote significant differences in the total organic acid content among treatment groups. The same notation applies to the following figures.
Horticulturae 11 00851 g001
Figure 2. One-way ANOVA of the polyphenol content in Marselan wine under different crop loads. (A) Polyphenol content; and (B) clustering heatmap of polyphenols. Note: At the p < 0.05 level, different lowercase letters indicate significant differences in the polyphenol components among different treatment groups, while different uppercase letters indicate significant differences in the total polyphenol content among different treatment groups.
Horticulturae 11 00851 g002
Figure 3. One-way ANOVA of the anthocyanin content in Marselan wine under different crop loads. (A) Anthocyanin content; and (B) clustering heatmap of anthocyanins. Note: At the p < 0.05 level, different lowercase letters indicate significant differences in the anthocyanin components among different treatment groups, while different uppercase letters indicate significant differences in the total anthocyanin content among different treatment groups.
Horticulturae 11 00851 g003aHorticulturae 11 00851 g003bHorticulturae 11 00851 g003c
Figure 4. One-way ANOVA of the volatile compound content in Marselan wine under different crop loads. (A) OPLS-DA plot of the volatile compounds based on the crop loads; and (B) clustering heatmap of the volatile compounds.
Horticulturae 11 00851 g004
Figure 5. Sensory evaluation of Marselan wine under different crop loads. Note: At the p < 0.05 level, different lowercase letters indicate significant differences in the sensory scores between treatment groups, while different uppercase letters denote significant differences in the total sensory evaluation scores among treatment groups.
Horticulturae 11 00851 g005
Table 1. Yield statistics of Marselan grapes under different crop loads.
GroupTargeted Shoot Density (Shoots/Meter of Canopy)Targeted Number of Clusters per Shoot (Number of Clusters/Shoot)Targeted Total Number of ClustersYield (t/ha)
F11101.0107.512
F12101.5158.328
F13102.0207.176
F21151.0158.940
F22151.522.510.488
F23152.03011.028
F31201.02010.980
F32201.53010.566
F33202.04011.928
F41251.0259.696
F42251.537.511.028
F43252.05011.130
CK282.05611.098
Table 2. Variation in berry weight during grape ripening.
26 July7 August16 August26 August2 September12 September19 September
CK0.693 ± 0.005 hE0.906 ± 0.003 deBC1.015 ± 0.023 bA0.937 ± 0.025 eB0.867 ± 0.054 cdC0.774 ± 0.054 gD0.864 ± 0.021 abC
F111.029 ± 0.019 bB1.116 ± 0.058 aAB1.149 ± 0.019 aAB1.055 ± 0.036 aB1.201 ± 0.144 aA1.036 ± 0.026 aB1.051 ± 0.016 abB
F121.109 ± 0.019 aA1.074 ± 0.067 abAB1.057 ± 0.033 bAB0.943 ± 0.029 deC0.964 ± 0.022 bcC0.974 ± 0.044 abcdC1.021 ± 0.013 bB
F130.898 ± 0.016 eC1.074 ± 0.038 abA1.024 ± 0.025 bB0.987 ± 0.035 bcdB0.891 ± 0.012 bcdC0.911 ± 0.063 deC0.999 ± 0.018 cdeB
F210.924 ± 0.008 dB1.026 ± 0.060 bcA1.051 ± 0.052 bA1.023 ± 0.013 abA1.001 ± 0.023 bA1.015 ± 0.032 abA0.987 ± 0.026 deA
F220.949 ± 0.022 cBC0.986 ± 0.043 cdB0.971 ± 0.015 cB0.998 ± 0.017 bcAB0.977 ± 0.053 bcB0.916 ± 0.003 cdeC1.037 ± 0.018 bA
F230.888 ± 0.016 eC0.950 ± 0.017 cdB1.025 ± 0.028 bA0.915 ± 0.056 eBC0.899 ± 0.024 bcdC0.956 ± 0.026 bcdB0.955 ± 0.027 efB
F310.960 ± 0.003 cA0.967 ± 0.048 dA0.822 ± 0.025 eBC0.803 ± 0.018 fC0.841 ± 0.017 dBC0.862 ± 0.033 eB0.764 ± 0.028 hD
F320.963 ± 0.014 cCD0.923 ± 0.052 deD1.138 ± 0.034 aA0.955 ± 0.019 cdeCD1.005 ± 0.061 bC0.988 ± 0.030 abcC1.086 ± 0.056 aB
F330.807 ± 0.009 fD0.972 ± 0.039 cdB1.037 ± 0.023 bA0.928 ± 0.017 eBC0.894 ± 0.026 bcdC1.043 ± 0.041 aA0.933 ± 0.026 fBC
F410.805 ± 0.005 fE0.868 ± 0.042 eD1.111 ± 0.042 aA1.021 ± 0.028 abB0.997 ± 0.031 bBC0.952 ± 0.053 bcdC1.019 ± 0.041 bB
F420.802 ± 0.005 fC0.991 ± 0.010 cdA0.953 ± 0.025 cdAB0.907 ± 0.060 eAB0.912 ± 0.102 bcdAB0.923 ± 0.020 cdeAB0.881 ± 0.021 gB
F430.702 ± 0.005 hD0.942 ± 0.030 cdC0.921 ± 0.020 dC0.933 ± 0.041 eC0.978 ± 0.068 bcB1.024 ± 0.032 abB0.983 ± 0.044 aB
Note: The unit of the berry weight is g. The lowercase letters indicate significant differences (p < 0.05) among the treatments at the same maturity stage, and the uppercase letters represent significant differences (p < 0.05) among the maturity stages within the same treatment. The same notation applies to the following tables.
Table 3. Variation in total soluble solids (TSSs) during grape ripening.
26 July7 August16 August26 August2 September12 September19 September
CK13.9 ± 1.1 cdE17.9 ± 0.6 cD19.8 ± 0.5 bcCD21.5 ± 1.1 bBC24.6 ± 2.1 abcA23.4 ± 1.0 abcAB23.7 ± 0.4 abA
F1120.3 ± 0.4 aD21.8 ± 1.4 aCD24.1 ± 2.0 aABC26.0 ± 1.4 aAB27.0 ± 2.6 aA23.7 ± 1.0 abcBC24.6 ± 1.5 abABC
F1217.8 ± 1.2 abD20.9 ± 0.8 abC22.3 ± 1.2 abBC24.1 ± 1.1 abAB26.2 ± 2.3 abA20.5 ± 0.8 cC24.3 ± 0.4 abAB
F1318.7 ± 1.8 abD21.2 ± 1.5 abCD22.2 ± 0.6 abC25.7 ± 2.3 aAB26.1 ± 1.0 abA23.0 ± 1.4 bcBC23.4 ± 1.7 abBC
F2118.6 ± 1.7 abC19.3 ± 1.4 abcBC22.1 ± 1.9 abAB24.5 ± 1.5 abA23.4 ± 2.0 abcA22.7 ± 2.0 bcA25.1 ± 1.3 abA
F2216.9 ± 1.5 bcC20.2 ± 0.4 abcB21.5 ± 0.6 abB25.5 ± 1.9 aA22.1 ± 1.1 abcB24.5 ± 1.3 abA24.6 ± 1.1 abA
F2318.0 ± 0.8 abD19.9 ± 0.5 abcCD22.9 ± 1.4 abB20.1 ± 2.0 bCD24.3 ± 0.0 abcB26.7 ± 2.0 aA22.2 ± 1.2 abBC
F3115.2 ± 1.6 bcdC18.8 ± 0.9 abcB20.7 ± 1.3 abcAB20.4 ± 1.7 bAB23.6 ± 1.2 abcA21.9 ± 1.5 bcAB23.5 ± 2.9 abA
F3215.8 ± 1.6 bcdC17.2 ± 1.8 cC21.7 ± 0.4 abAB20.4 ± 1.2 bB23.0 ± 1.8 abcA22.8 ± 0.3 bcA23.1 ± 0.4 abA
F3315.4 ± 0.8 bcdD19.4 ± 1.4 abcC22.1 ± 1.3 abAB20.4 ± 0.8 bBC22.6 ± 1.8 abcAB24.4 ± 2.1 abA22.6 ± 1.4 abAB
F4116.1 ± 1.3 bcdE18.6 ± 1.8 abcD20.9 ± 1.9 abcCD21.4 ± 1.0 bBC20.6 ± 1.1 cCD23.8 ± 0.9 abcB26.3 ± 1.6 aA
F4215.8 ± 0.8 bcdC18.3 ± 1.4 bcBC19.6 ± 1.6 bcB21.1 ± 1.4 bB24.1 ± 2.3 abcA24.7 ± 1.2 abA24.6 ± 2.0 abA
F4313.4 ± 1.0 dC17.2 ± 0.8 cB18.1 ± 0.5 cB21.5 ± 2.4 bA21.5 ± 1.0 bcA22.5 ± 0.4 bcA23.3 ± 0.6 abA
The lowercase letters indicate significant differences (p < 0.05) among the treatments at the same maturity stage, and the uppercase letters represent significant differences (p < 0.05) among the maturity stages within the same treatment.
Table 4. Variation in reducing sugar content during grape ripening.
26 July7 August16 August26 August2 September12 September19 September
CK120.3 ± 4.8 cD128.8 ± 11.2 bD162.6 ± 12.9 bcdeC175.1 ± 10.9 dC238.9 ± 8.6 aA180.8 ± 8.3 cdC206.9 ± 13.6 abB
F11169.2 ± 15.0 aD159.8 ± 11.1 aD183.1 ± 14.6 bcdCD219.7 ± 17.4 abB262.6 ± 14.6 aA205.8 ± 10.3 bcBC184.2 ± 16.9 bCD
F12159.4 ± 12.5 abC140.3 ± 10.9 abC137.8 ± 15.9 eC207.0 ± 10.9 bcB270.3 ± 8.1 aA250.8 ± 20.1 aA205.3 ± 18.8 abB
F13171.4 ± 15.7 aBC141.5 ± 7.5 abC178.1 ± 5.3 bcdB242.3 ± 19.8 aA260 ± 29.9 aA167.5 ± 13.1 dBC193.7 ± 10.2 bB
F21163.6 ± 8.5 abD136.2 ± 12.2 abE185.0 ± 5.5 bcCD207.4 ± 7.4 bcC270.1 ± 5.4 aA168.6 ± 10.5 dD246.5 ± 28.4 aB
F22153.1 ± 7.0 abD149.5 ± 10.8 abD161.2 ± 7.4 bcdeD186.6 ± 11.4 cdC250.8 ± 20.5 aA171.7 ± 10.7 dCD223.1 ± 9.7 abB
F23161.9 ± 15.4 abCD144.7 ± 5.8 abD178.4 ± 13.9 bcdBC147.1 ± 10.6 eD273.4 ± 7.2 aA190.6 ± 9.9 bcdB184.1 ± 14.6 bBC
F31141.3 ± 9.9 abcC123.0 ± 11.7 bC165.8 ± 7.6 bcdeB177.8 ± 7.1 dB230.9 ± 10.1 aA185.1 ± 14.8 cdB230.8 ± 20.1 abA
F32153.3 ± 11.1 abE136.5 ± 3.6 abF177.3 ± 12.4 bcdCD162.3 ± 1.6 deDE267.9 ± 9.7 aA192.7 ± 8.8 bcdC209.7 ± 12.7 abB
F33134.4 ± 4.6 bcEF120.8 ± 8.7 bF152.0 ± 4.0 deD145.7 ± 11.0 eDE243.4 ± 2.4 aA178.5 ± 7.8 cdC210.2 ± 11.7 abB
F41159.9 ± 8.5 abD139.4 ± 18.4 abD192.6 ± 14.5 abC242.3 ± 15.1 aAB257.1 ± 18.0 aA218.7 ± 20.9 bBC203.8 ± 19.4 abC
F42150.4 ± 13.8 abCD138.1 ± 6.3 abD210 ± 16.4 aB174.2 ± 4.6 dC251.4 ± 26.2 aA159.7 ± 5.7 dCD206.7 ± 2.1 abB
F43118.2 ± 7.7 cE100.2 ± 6.0 cE154.0 ± 9.2 cdeD190.7 ± 15.3 cdC244.5 ± 13.6 aA163.1 ± 13.0 dD218.8 ± 18.7 abB
Note: The unit of the reducing sugar content is g/L. The lowercase letters indicate significant differences (p < 0.05) among the treatments at the same maturity stage, and the uppercase letters represent significant differences (p < 0.05) among the maturity stages within the same treatment.
Table 5. Variation in titratable acidity (TA) during grape ripening.
26 July7 August16 August26 August2 September12 September19 September
CK0.91 ± 0.055 bcA0.97 ± 0.085 abA0.57 ± 0.049 cdefB0.44 ± 0.049 cCD0.53 ± 0.047 dBC0.46 ± 0.024 abCD0.39 ± 0.010 cD
F110.98 ± 0.090 abA0.98 ± 0.094 aA0.48 ± 0.024 efB0.45 ± 0.039 cB0.41 ± 0.0041 eB0.39 ± 0.020 cdB0.36 ± 0.012 cB
F120.93 ± 0.043 abcA0.93 ± 0.025 abA0.50 ± 0.015 defC0.46 ± 0.051 cC0.63 ± 0.060 abcdB0.52 ± 0.010 aC0.39 ± 0.014 cD
F130.95 ± 0.066 abcA0.79 ± 0.067 cB0.75 ± 0.061 aB0.67 ± 0.052 aB0.68 ± 0.031 abB0.49 ± 0.047 abC0.39 ± 0.018 cD
F210.97 ± 0.070 abA0.84 ± 0.015 bcB0.60 ± 0.024 bcdeC0.45 ± 0.016 cD0.58 ± 0.027 bcdC0.38 ± 0.027 cdeD0.45 ± 0.043 bcD
F220.90 ± 0.080 bcdA0.98 ± 0.052 aA0.68 ± 0.080 abcB0.49 ± 0.045 cC0.66 ± 0.060 abcB0.44 ± 0.038 bcC0.41 ± 0.015 cC
F230.80 ± 0.040 dA0.87 ± 0.046 abcA0.54 ± 0.056 defC0.51 ± 0.020 bcC0.69 ± 0.038 abB0.43 ± 0.057 bcD0.39 ± 0.028 cD
F310.84 ± 0.075 cdA0.89 ± 0.096 abcA0.53 ± 0.040 defBC0.42 ± 0.037 cC0.62 ± 0.022 abcdB0.44 ± 0.019 bcC0.50 ± 0.053 bC
F320.96 ± 0.029 abA0.88 ± 0.063 abcB0.69 ± 0.042 abC0.44 ± 0.012 cD0.72 ± 0.019 aC0.48 ± 0.013 abD0.49 ± 0.030 bD
F330.95 ± 0.041 abcA0.95 ± 0.057 abA0.47 ± 0.043 fC0.51 ± 0.018 bcC0.66 ± 0.046 abcB0.36 ± 0.031 deD0.37 ± 0.017 cD
F410.97 ± 0.044 abA0.91 ± 0.072 abcA0.61 ± 0.053 bcdB0.59 ± 0.045 abB0.64 ± 0.055 abcB0.47 ± 0.054 abD0.57 ± 0.060 aC
F420.93 ± 0.034 abcA0.97 ± 0.078 abA0.73 ± 0.032 aB0.45 ± 0.025 cD0.60 ± 0.043 bcdC0.43 ± 0.0074 bcD0.45 ± 0.043 bcD
F431.03 ± 0.047 aA0.95 ± 0.083 abA0.57 ± 0.057 cdefB0.66 ± 0.078 aB0.56 ± 0.037 cdB0.33 ± 0.023 eC0.40 ± 0.035 cC
Note: Titratable acid is expressed as a percentage content. The lowercase letters indicate significant differences (p < 0.05) among the treatments at the same maturity stage, and the uppercase letters represent significant differences (p < 0.05) among the maturity stages within the same treatment.
Table 6. Variation in pH during grape ripening.
26 July7 August16 August26 August2 September12 September19 September
CK2.95 ± 0.051 aB2.97 ± 0.22 aB3.40 ± 0.12 aA3.43 ± 0.29 aA3.66 ± 0.097 aA3.72 ± 0.26 aA3.66 ± 0.17 aA
F112.89 ± 0.15 aB2.92 ± 0.18 aB3.40 ± 0.32 aAB3.51 ± 0.25 aA3.66 ± 0.26 aA3.81 ± 0.20 aA3.73 ± 0.46 aA
F122.80 ± 0.24 aB2.87 ± 0.20 aB3.32 ± 0.20 aA3.44 ± 0.091 aA3.56 ± 0.28 aA3.60 ± 0.24 aA3.71 ± 0.23 aA
F132.89 ± 0.10 aC2.98 ± 0.26 aBC3.25 ± 0.26 aABC3.37 ± 0.38 aAB3.55 ± 0.16 aA3.55 ± 0.18 aA3.60 ± 0.095 aA
F212.91 ± 0.23 aB2.99 ± 0.23 aB3.39 ± 0.15 aA3.50 ± 0.093 aA3.62 ± 0.31 aA3.70 ± 0.29 aA3.77 ± 0.10 aA
F222.84 ± 0.18 aB2.87 ± 0.13 aB3.26 ± 0.29 aAB3.43 ± 0.12 aA3.55 ± 0.34 aA3.65 ± 0.33 aA3.64 ± 0.30 aA
F232.99 ± 0.11 aB3.05 ± 0.11 aB3.35 ± 0.10 aA3.43 ± 0.17 aA3.58 ± 0.036 aA3.62 ± 0.33 aA3.74 ± 0.099 aA
F312.92 ± 0.32 aB3.00 ± 0.15 aB3.43 ± 0.25 aAB3.52 ± 0.070 aAB3.63 ± 0.26 aA3.72 ± 0.44 aA3.79 ± 0.20 aA
F322.95 ± 0.21 aB2.99 ± 0.29 aB3.24 ± 0.43 aAB3.41 ± 0.15 aAB3.58 ± 0.072 aA3.61 ± 0.25 aA3.60 ± 0.32 aA
F332.84 ± 0.24 aB2.89 ± 0.058 aB3.36 ± 0.15 aA3.43 ± 0.30 aA3.56 ± 0.18 aA3.70 ± 0.23 aA3.56 ± 0.16 aA
F412.88 ± 0.14 aB2.95 ± 0.26 aB3.30 ± 0.25 aA3.47 ± 0.24 aA3.57 ± 0.20 aA3.67 ± 0.29 aA3.65 ± 0.36 aA
F422.85 ± 0.25 aB2.91 ± 0.058 aB3.27 ± 0.17 aAB3.43 ± 0.27 aA3.59 ± 0.44 aA3.54 ± 0.094 aA3.59 ± 0.095 aA
F432.83 ± 0.057 aB2.91 ± 0.20 aB3.30 ± 0.41 aA3.43 ± 0.12 aA3.52 ± 0.15 aA3.56 ± 0.16 aA3.63 ± 0.26 aA
The lowercase letters indicate significant differences (p < 0.05) among the treatments at the same maturity stage, and the uppercase letters represent significant differences (p < 0.05) among the maturity stages within the same treatment.
Table 7. Basic parameters of Marselan wine under different crop load treatments.
GroupEthanol Content/%pHTA Concentration/(g/L)Residual Sugar Content/(g/L)
F1116.32 ± 1.02 a3.58 ± 0.16 a7.54 ± 0.54 a2.30 ± 0.18 defg
F1214.75 ± 1.21 ab3.73 ± 0.33 a6.60 ± 0.17 ab2.60 ± 0.069 cde
F1315.48 ± 1.35 ab3.55 ± 0.25 a7.38 ± 0.45 a2.90 ± 0.34 bc
F2115.51 ± 1.50 ab3.66 ± 0.35 a6.74 ± 0.47 ab2.50 ± 0.17 cdef
F2215.14 ± 1.32 ab3.79 ± 0.29 a6.3 ± 0.39 ab2.40 ± 0.12 defg
F2314.60 ± 0.15 ab3.66 ± 0.30 a6.72 ± 0.59 ab2.71 ± 0.054 bcd
F3114.93 ± 1.05 ab3.70 ± 0.26 a6.38 ± 0.17 ab2.20 ± 0.079 efg
F3215.01 ± 1.20 ab3.70 ± 0.32 a6.76 ± 0.41 ab2.50 ± 0.11 cdef
F3314.62 ± 0.64 ab3.81 ± 0.29 a6.05 ± 0.22 b2.20 ± 0.20 efg
F4113.49 ± 1.46 ab3.68 ± 0.29 a6.49 ± 0.49 ab3.00 ± 0.26 b
F4215.15 ± 1.06 ab3.65 ± 0.32 a6.36 ± 0.57 ab2.10 ± 0.13 fg
F4312.85 ± 0.68 b3.78 ± 0.076 a5.81 ± 0.59 b2.00 ± 0.04 g
CK13.17 ± 0.60 ab3.54 ± 0.36 a6.51 ± 0.46 ab3.61 ± 0.22 a
The lowercase letters indicate significant differences (p < 0.05) among the treatments at the same maturity stage.
Disclaimer/Publisher’s Note: The statements, opinions and data contained in all publications are solely those of the individual author(s) and contributor(s) and not of MDPI and/or the editor(s). MDPI and/or the editor(s) disclaim responsibility for any injury to people or property resulting from any ideas, methods, instructions or products referred to in the content.

