Article

Copper Stress Levels Classification in Oilseed Rape Using Deep Residual Networks and Hyperspectral False-Color Images

by
Yifei Peng
1,
Jun Sun
1,*,
Zhentao Cai
1,
Lei Shi
1,
Xiaohong Wu
1,
Chunxia Dai
1 and
Yubin Xie
2
1
School of Electrical and Information Engineering, Jiangsu University, Zhenjiang 212013, China
2
FuFu Information Technology Co., Ltd., China Telecom Corporation Limited, Fuzhou 350001, China
*
Author to whom correspondence should be addressed.
Horticulturae 2025, 11(7), 840; https://doi.org/10.3390/horticulturae11070840
Submission received: 11 June 2025 / Revised: 7 July 2025 / Accepted: 15 July 2025 / Published: 16 July 2025

Abstract

In recent years, heavy metal contamination in agricultural products has become a growing concern in the field of food safety. Copper (Cu) stress in crops not only leads to significant reductions in both yield and quality but also poses potential health risks to humans. This study proposes an efficient and precise non-destructive detection method for Cu stress in oilseed rape, which is based on hyperspectral false-color image construction using principal component analysis (PCA). By comprehensively capturing the spectral representation of oilseed rape plants, both the one-dimensional (1D) spectral sequence and spatial image data were utilized for multi-class classification. The classification performance of models based on 1D spectral sequences was compared from two perspectives: first, between machine learning and deep learning methods (best accuracy: 93.49% vs. 96.69%); and second, between shallow and deep convolutional neural networks (CNNs) (best accuracy: 95.15% vs. 96.69%). For spatial image data, deep residual networks were employed to evaluate the effectiveness of visible-light and false-color images. The RegNet architecture was chosen for its flexible parameterization and proven effectiveness in extracting multi-scale features from hyperspectral false-color images. This flexibility enabled RegNetX-6.4GF to achieve optimal performance on the dataset constructed from three types of false-color images, with the model reaching a Macro-Precision, Macro-Recall, Macro-F1, and Accuracy of 98.17%, 98.15%, 98.15%, and 98.15%, respectively. Furthermore, Grad-CAM visualizations revealed that latent physiological changes in plants under heavy metal stress guided feature learning within CNNs, and demonstrated the effectiveness of false-color image construction in extracting discriminative features. Overall, the proposed technique can be integrated into portable hyperspectral imaging devices, enabling real-time and non-destructive detection of heavy metal stress in modern agricultural practices.

1. Introduction

Heavy metals represent one of the primary potential sources of contamination in agricultural crops, with a widespread presence in natural ecosystems, industrial production, and agricultural activities [1,2,3]. Studies have shown that concentrations of heavy metals exceeding threshold levels pose significant risks to food safety and human health [4,5]. Copper (Cu) is an essential micronutrient for plant growth, playing a crucial role in various cellular processes, including photosynthesis, respiration, cell wall metabolism, and hormone perception [6]. However, in soils contaminated by heavy metals, the phytotoxicity of excessive Cu concentrations can inhibit crop growth and disrupt fundamental cellular functions [7,8], leading to root damage, leaf chlorosis, reduced photosynthetic activity, and increased oxidative stress [9,10,11]. Oilseed rape is a globally cultivated and significant oilseed crop, primarily valued for its high oil content in the seeds. It serves as an important source of edible oil and biofuels, making a significant contribution to the agricultural economy [12,13]. During the growth process of oilseed rape, the root system absorbs Cu ions from the soil and sequesters them within cell walls or vacuoles. Excess Cu ions are subsequently transported to the aerial tissues or organs via copper transport proteins [14]. However, excessive Cu accumulation can lead to reductions in both crop yield and seed quality [8], which directly undermines oil extraction efficiency and the quality of the resulting vegetable oil. Consequently, such impacts may disrupt the supply chain of edible oils and diminish the economic viability of biofuel production from oilseed rape, thereby posing risks to food security and agricultural production. Accurately assessing the levels of Cu stress based on the accumulation of Cu in oilseed rape is essential for evaluating crop contamination, ensuring food safety, and formulating effective environmental remediation strategies. In recent years, growing concern over heavy metal contamination in food, such as lead (Pb) [15,16,17] and cadmium (Cd) [18,19,20], has driven continuous advancements in detection technologies and analytical methodologies [2]. Accordingly, research into the physiological and biochemical indicators of crops and their stress response mechanisms is also actively progressing [21].
Currently, hyperspectral imaging (HSI) technology has been widely applied for non-destructive detection [22,23,24]. By capturing continuous spectral information, HSI enables the detection and characterization of physiological changes in plants under stress. Typically, the high-dimensional spectral data undergoes a sequence of preprocessing and feature extraction, followed by classification or regression using machine learning algorithms [25]. In recent years, convolutional neural networks (CNNs) have been successfully employed for dimensionality reduction of high-dimensional spectral information. Feature extraction is commonly performed through flattening layers, which transform spatial dimensions into one-dimensional (1D) vectors [26], thereby enabling the application of one-dimensional convolutional neural networks (1D-CNNs) for learning and inferring nonlinear mapping relationships.
In the non-destructive detection of heavy metal stress in plants, previous studies have primarily focused on feature extraction and modeling based on 1D spectral sequences, rather than on the analysis and application of spectral image data. Although 1D spectral sequences inherently contain rich information, they exhibit limitations in structural representation, feature perception, and model adaptability. HSI not only provides high-dimensional spectral information but also captures abundant spatial image features, which serve to support efficient classification and improve the representational capacity of deep learning models [27]. Based on the trichromatic vision of the human eye, false-color images are constructed using at least two spectral bands, with the selection of bands being determined by the physical properties of the object under investigation [28]. Benefiting from the abundant spectral bands contained in hyperspectral images, false-color images exhibit a rich representation of color and feature information [29]. However, these bands often exhibit substantial redundancy and lack a clearly defined combination logic. To address this, principal component analysis (PCA) provides a rational foundation for false-color image construction by ranking the principal components (PCs) in descending order of their explained variance, thereby ensuring that the most informative spectral features are prioritized for visualization. While false-color images sacrifice natural color rendition, they highlight distinctive features that are not readily discernible in conventional visible-light images by introducing pronounced color contrasts [30]. The prominent representation of discriminative features provides a robust foundation for feature learning, thereby facilitating the effective integration of HSI with deep learning technologies. To date, few studies have explored the construction of PCA-based hyperspectral false-color images aimed at classifying heavy metal stress in crops. This method remains an underexplored application in HSI, with significant potential for advancing the non-destructive detection of crop contamination.
The study focuses on 1D spectral sequences, visible-light images, and false-color images constructed based on PCA. Considering that 1D spectral sequences contain rich band information and spectral features, a support vector machine (SVM) [31] and shallow and deep 1D-CNNs were employed to capture both local and global spectral patterns. In contrast, for the spatial image data, deep residual networks were chosen for their effectiveness in handling complex spatial structures and discriminative features. By comparing the performance of multiple models in classifying Cu stress levels in oilseed rape, this study aims to explore optimal strategies for feature extraction and classification modeling. These strategies contribute to improving the efficiency and accuracy of Cu stress detection, thereby laying a foundation for non-destructive, real-time, and portable monitoring in agricultural practices.

2. Materials and Methods

2.1. Experimental Design

The experiment was conducted in the Venlo-type greenhouse at the Provincial and Ministerial Joint Key Laboratory of Modern Agricultural Equipment and Technology, Jiangsu University. A controlled growth environment was established using soilless cultivation and quantitative irrigation technologies, minimizing the interference of external environmental factors on the Cu stress experiment of oilseed rape. Specifically, the relative humidity in the greenhouse was controlled within a range of 70 ± 5%. The photoperiod followed natural autumnal light conditions, consisting of 12 (+t) hours of light at 20 ± 2 °C and 12 (−t) hours of darkness at 16 ± 2 °C, where t [ 0 , 4 ] denotes the duration of artificial light supplementation as required [32]. The selected experimental variety was Sichuan Oil 45 (a hybrid cabbage-type oilseed rape, Brassica napus L.), chosen to ensure the stability of the experimental data. The criteria for seed selection were uniform size, plumpness, vigor, and freedom from diseases and pests. The seeds were subjected to surface sterilization by immersion in a 1% sodium hypochlorite (NaClO) solution for 15 min. Subsequently, the seeds were thoroughly rinsed with sterile distilled water to remove residual disinfectant. The treated seeds were then evenly sown in seedling trays and placed in a constant temperature and humidity environment to promote synchronized germination. When the seedlings reached the two-true-leaf stage, 180 vigorous and morphologically uniform seedlings were selected and transplanted into a soilless cultivation system filled with sterile perlite to provide a stable rhizosphere environment.
In the absence of a standardized grading system for Cu stress, the experimental design was informed by the results of preliminary experiments and the relevant literature [33,34,35]. These studies provided valuable references for the gradient settings and concentration thresholds of Cu stress in this experiment. When establishing the Cu stress treatment groups, extreme concentrations and excessively wide treatment intervals were deliberately avoided to prevent significant growth inhibition or plant mortality. This strategy was essential for ensuring the feasibility of the experiment.
The Cu stress treatments were conducted using copper sulfate pentahydrate (CuSO4·5H2O) as the Cu source and distilled water as the solvent to prepare Cu treatment solutions of different concentrations for plant cultivation. A total of 180 uniform seedlings were evenly divided into four treatment groups: the control group (CK, 0 mg·L−1 Cu), mild stress group (A, 100 mg·L−1 Cu), moderate stress group (B, 300 mg·L−1 Cu), and severe stress group (C, 500 mg·L−1 Cu). All seedlings were cultivated under uniform environmental conditions and irrigated daily at 9:00 a.m. with Hoagland nutrient solution at pH 6.0 to promote plant growth and ensure adequate infiltration of the nutrient solution into the substrate. Once the seedlings reached the five-leaf stage, Cu stress treatments were initiated and applied daily at 12:00 p.m. for 14 consecutive days. After the stress treatment period, standardized sample collection was conducted. First, both immature and senescent leaves, as well as those exhibiting poor physiological condition (e.g., pest damage or severe chlorosis), were removed, and leaves from identical positions on the plant were selected as research samples to ensure data consistency. Each treatment group collected 180 leaves, totaling 720 samples. Immediately after collection, both hyperspectral and visible-light images were acquired to minimize the influence of environmental factors on the leaves.

2.2. Hyperspectral Image Acquisition

This study employed a visible–near infrared hyperspectral imaging (VIS-NIR HSI) system (Figure 1) to collect spectral data from the samples.
The core components of the system included an imaging spectrometer (Specim, Spectral Imaging Ltd., Oulu, Finland), a linear halogen light source (21 V/150 W, USA), a CCD camera (SNR1600, Isuzu Optics Corp., Hsinchu, China), and a high-precision lens (Schneider, Bad Kreuznach, France). To ensure efficient scanning of samples, the system was equipped with a motorized translation stage driven by a stepper motor (MSI300, Isuzu Optics Corp., Hsinchu, China). Operation and data recording were performed using a computer pre-installed with spectrum acquisition and control software. Image acquisition was performed in a customized dark chamber (DC1300, Isuzu Optics Corp., Hsinchu, China). The exposure time for the samples was set to 28.1 ms, with a stage movement speed of 7.94 mm·s−1, ensuring both spatial continuity and spectral consistency of the collected images. The wavelength acquisition range of the imaging spectrometer was set from 397.91 nm to 986.02 nm, and the final hyperspectral image contained 334 continuous bands, which provided abundant information for subsequent spectral analysis and modeling.

2.3. Hyperspectral Data Preprocessing

2.3.1. Spatial Domain Preprocessing

The collected hyperspectral images contained both valid spectral information and background noise interference. Black-and-white correction is a crucial preprocessing step in hyperspectral data analysis [25]. This step effectively mitigated non-uniform illumination and sensor noise, establishing a stable background reference with approximately constant low reflectance. Subsequently, several pixels were randomly selected from the sample region to extract their average spectral curve. The monochromatic image corresponding to the wavelength of the peak value was selected as the basis for mask generation. Maximizing the contrast in reflectance between the target and the background facilitated the adjustment of segmentation thresholds and the extraction of regions of interest (ROIs). The selection of the threshold value was guided by the objective of ensuring that the sample regions exhibit sharp and complete edges. The preprocessing in the spatial domain serves as the foundation for all subsequent spectral data processing and construction.

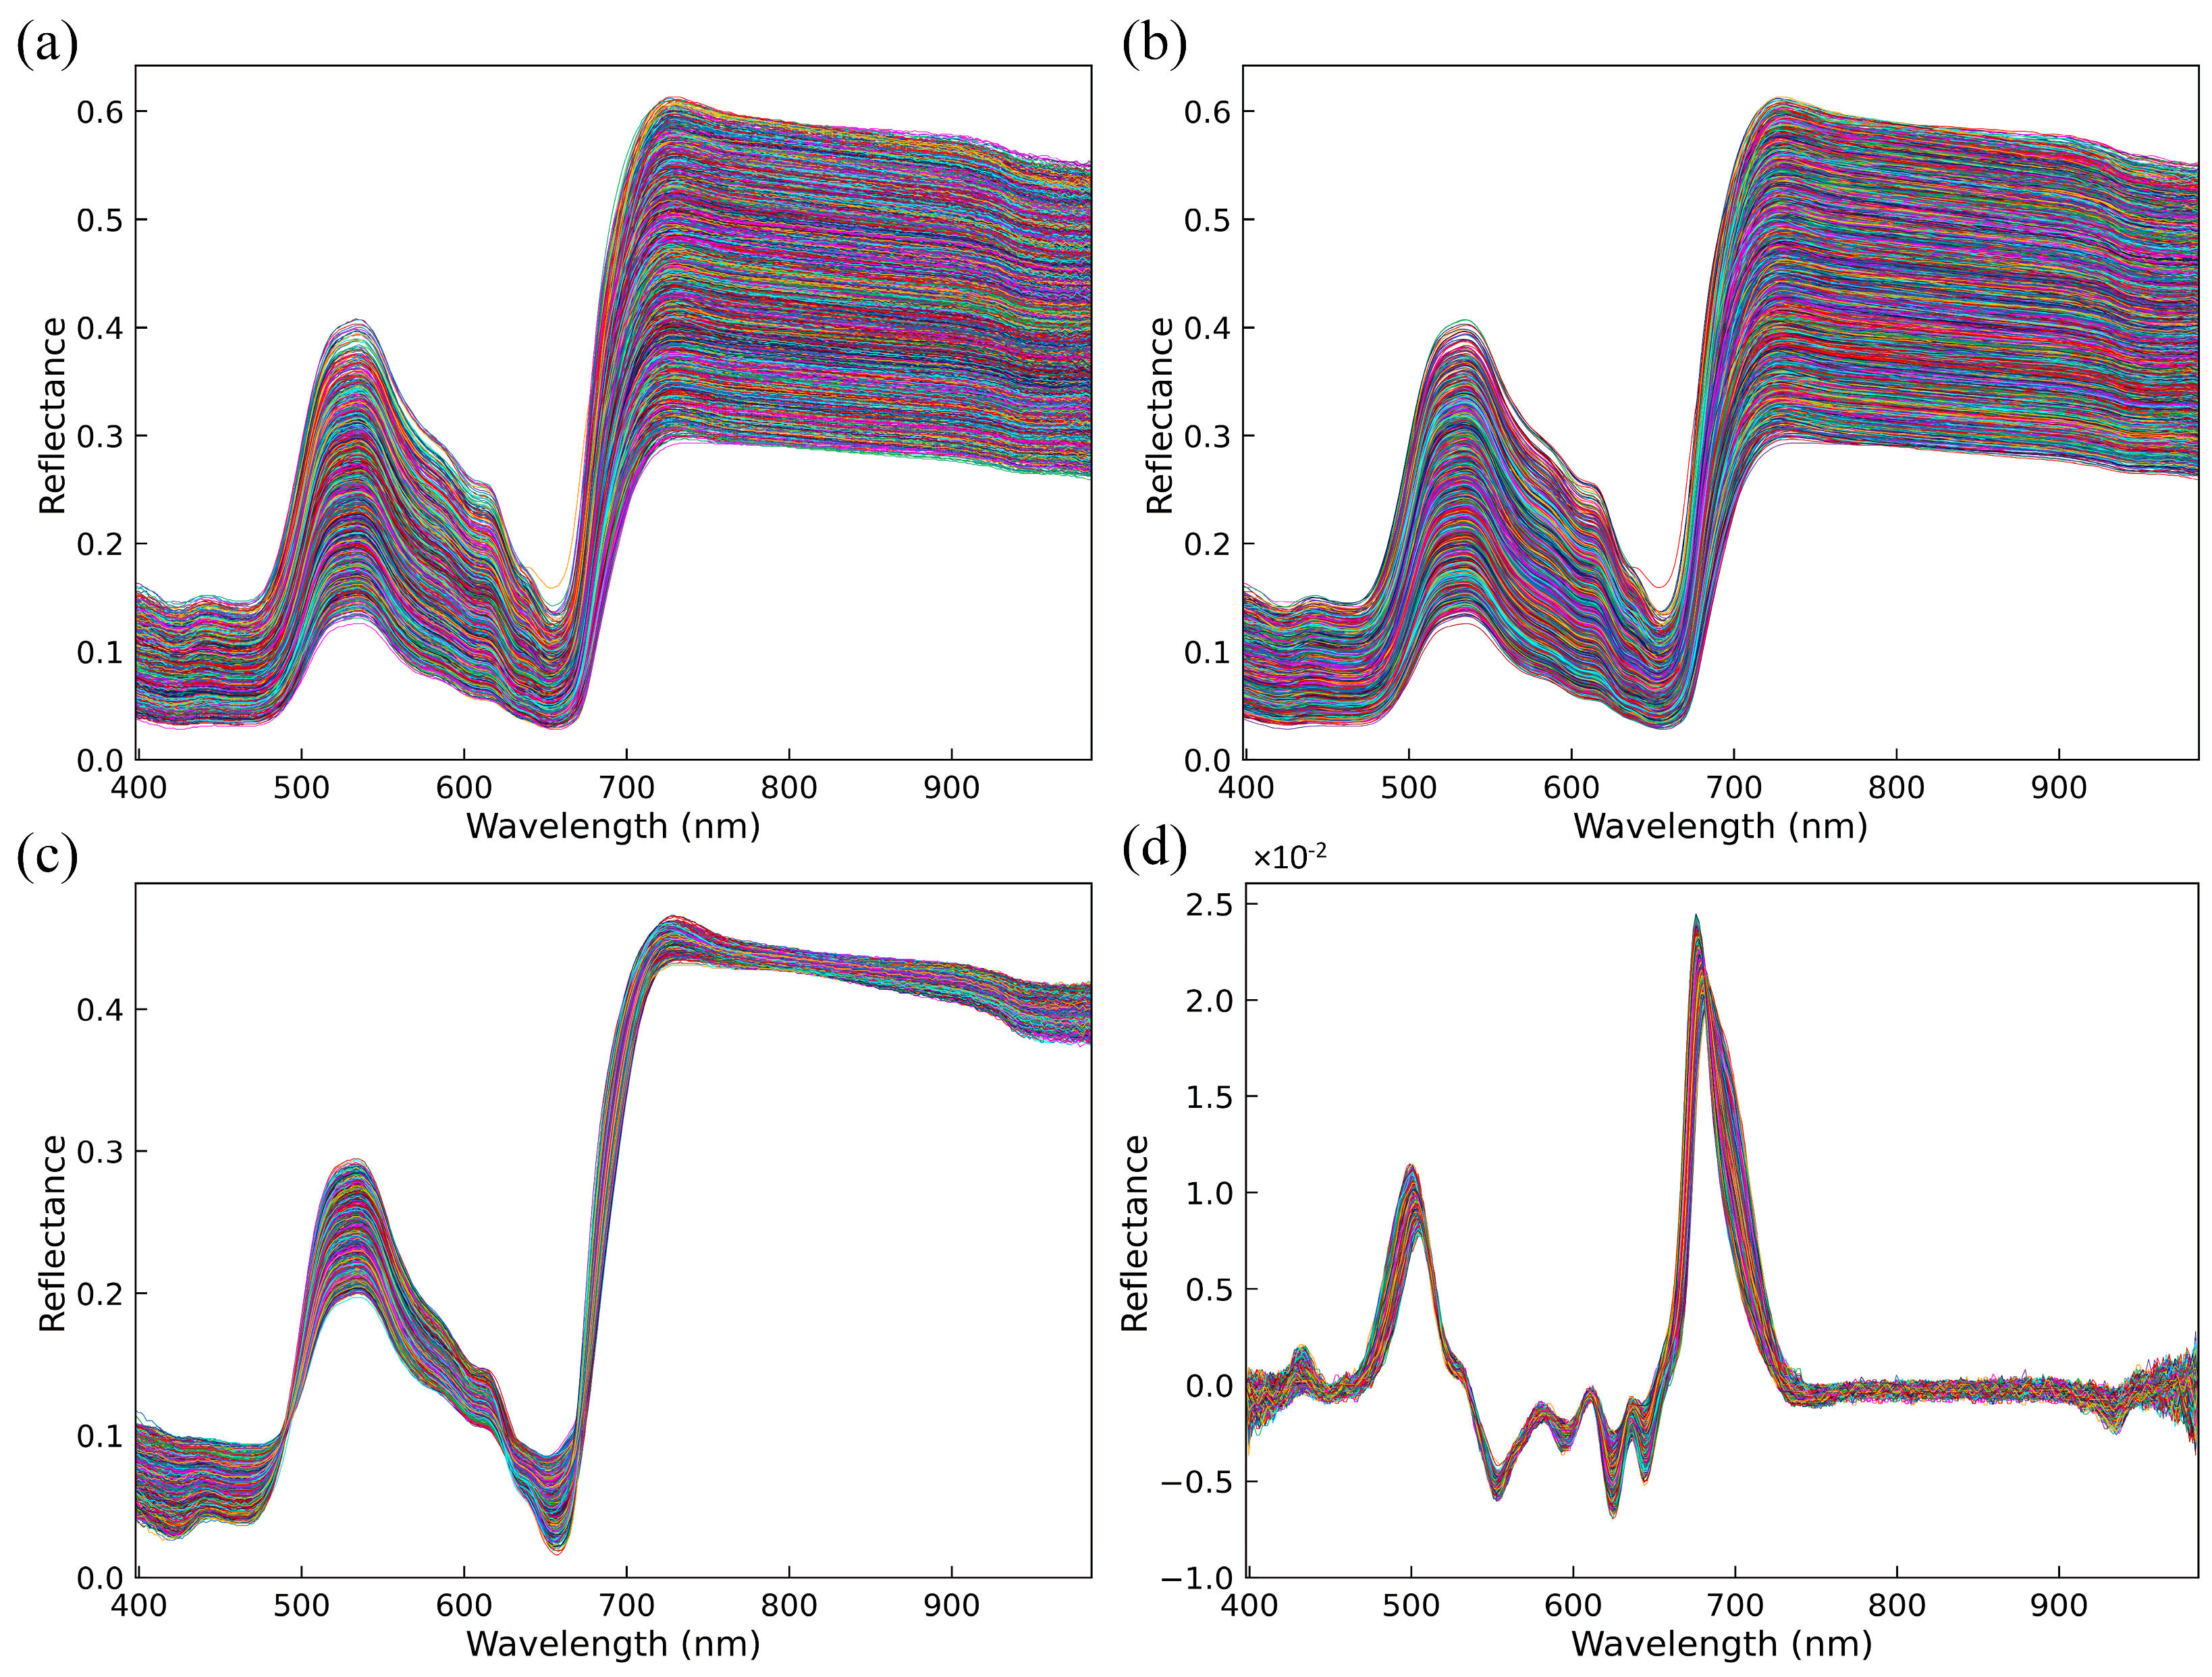
2.3.2. Spectral Domain Preprocessing

Spectral preprocessing is an indispensable step in spectral analysis, as it helps improve data quality, reduce noise, and enhance the interpretability of spectral signals [25]. In this study, three spectral preprocessing methods were employed. Savitzky–Golay smoothing (SG) [36] was applied to reduce random errors and smooth the spectral curves. A gap derivative (GD) was utilized to effectively eliminate baseline drift and enhance the extractability of spectral features [37]. Multiplicative scatter correction (MSC) [38] was used to correct the baseline of the spectrum and alleviate scattering caused by surface irregularities of the samples. This study modeled 1D spectra data and their preprocessing results, and analyzed the impact of various preprocessing methods on classification performance.

2.4. Classification Model

To evaluate the effectiveness of 1D spectral sequences and image data in classifying the Cu stress levels of oilseed rape, various classification models were employed, including not only conventional machine learning algorithms but also both basic and advanced CNNs.

2.4.1. SVM

The SVM is a machine learning algorithm based on statistical learning theory [31,39]. Due to its excellent generalization capability and robustness in handling high-dimensional data, it has been widely applied in spectral classification tasks. By employing kernel functions, the SVM can map nonlinearly separable data into a high-dimensional feature space where linear separation becomes feasible, which effectively addresses complex nonlinear spectral classification challenges [40].

2.4.2. Basic 1D-CNN

CNNs have demonstrated exceptional performance in feature extraction and classification tasks [41,42]. The basic layer structure in CNNs includes convolutional layers, pooling layers, fully connected layers, and others. 1D-CNNs are a class of deep learning models designed to extract local patterns from sequential data by applying convolutional operations along a single dimension. To validate the applicability of 1D-CNNs in spectral data processing, a basic 1D-CNN (B1DCNN) model was constructed for rapid experimentation and preliminary exploration of spectral features. The core architecture of the network consisted of two convolutional layers and two max-pooling layers, along with activation functions, normalization, and a classification module.

2.4.3. Residual Network

In this study, the residual network broadly refers to a series of models featuring residual structures. The residual block introduces shortcut connections with identity mapping, effectively mitigating the issues of gradient vanishing and degradation during the training of deep networks, significantly improving the training efficiency and the model’s generalization capability [43]. To evaluate the performance of deep CNNs in multi-class classification tasks, three representative deep residual networks were employed: ResNet [43], ResNeXt [44], and RegNet [45]. These models each demonstrate innovations in the structure of the residual blocks and parameter design strategies. ResNet introduces the standard residual block. Building on this foundation, ResNeXt incorporates the grouped convolution mechanism to enrich feature representations through multiple parallel paths [44]. RegNet employs a design space exploration strategy, achieving a better trade-off between performance and efficiency by setting rule-based parameters [45].
To validate the applicability of deep 1D-CNNs in multi-class classification tasks with complex 1D spectra, three deep residual networks were adapted into 1D architectures. The original two-dimensional convolution and pooling operations were replaced with their 1D counterparts, and the input tensor structure and convolutional configurations were adjusted accordingly. The adapted models, referred to as 1D-ResNet, 1D-ResNeXt, and 1D-RegNet, retain the residual block, enabling efficient deep information flow and high-level feature representation.

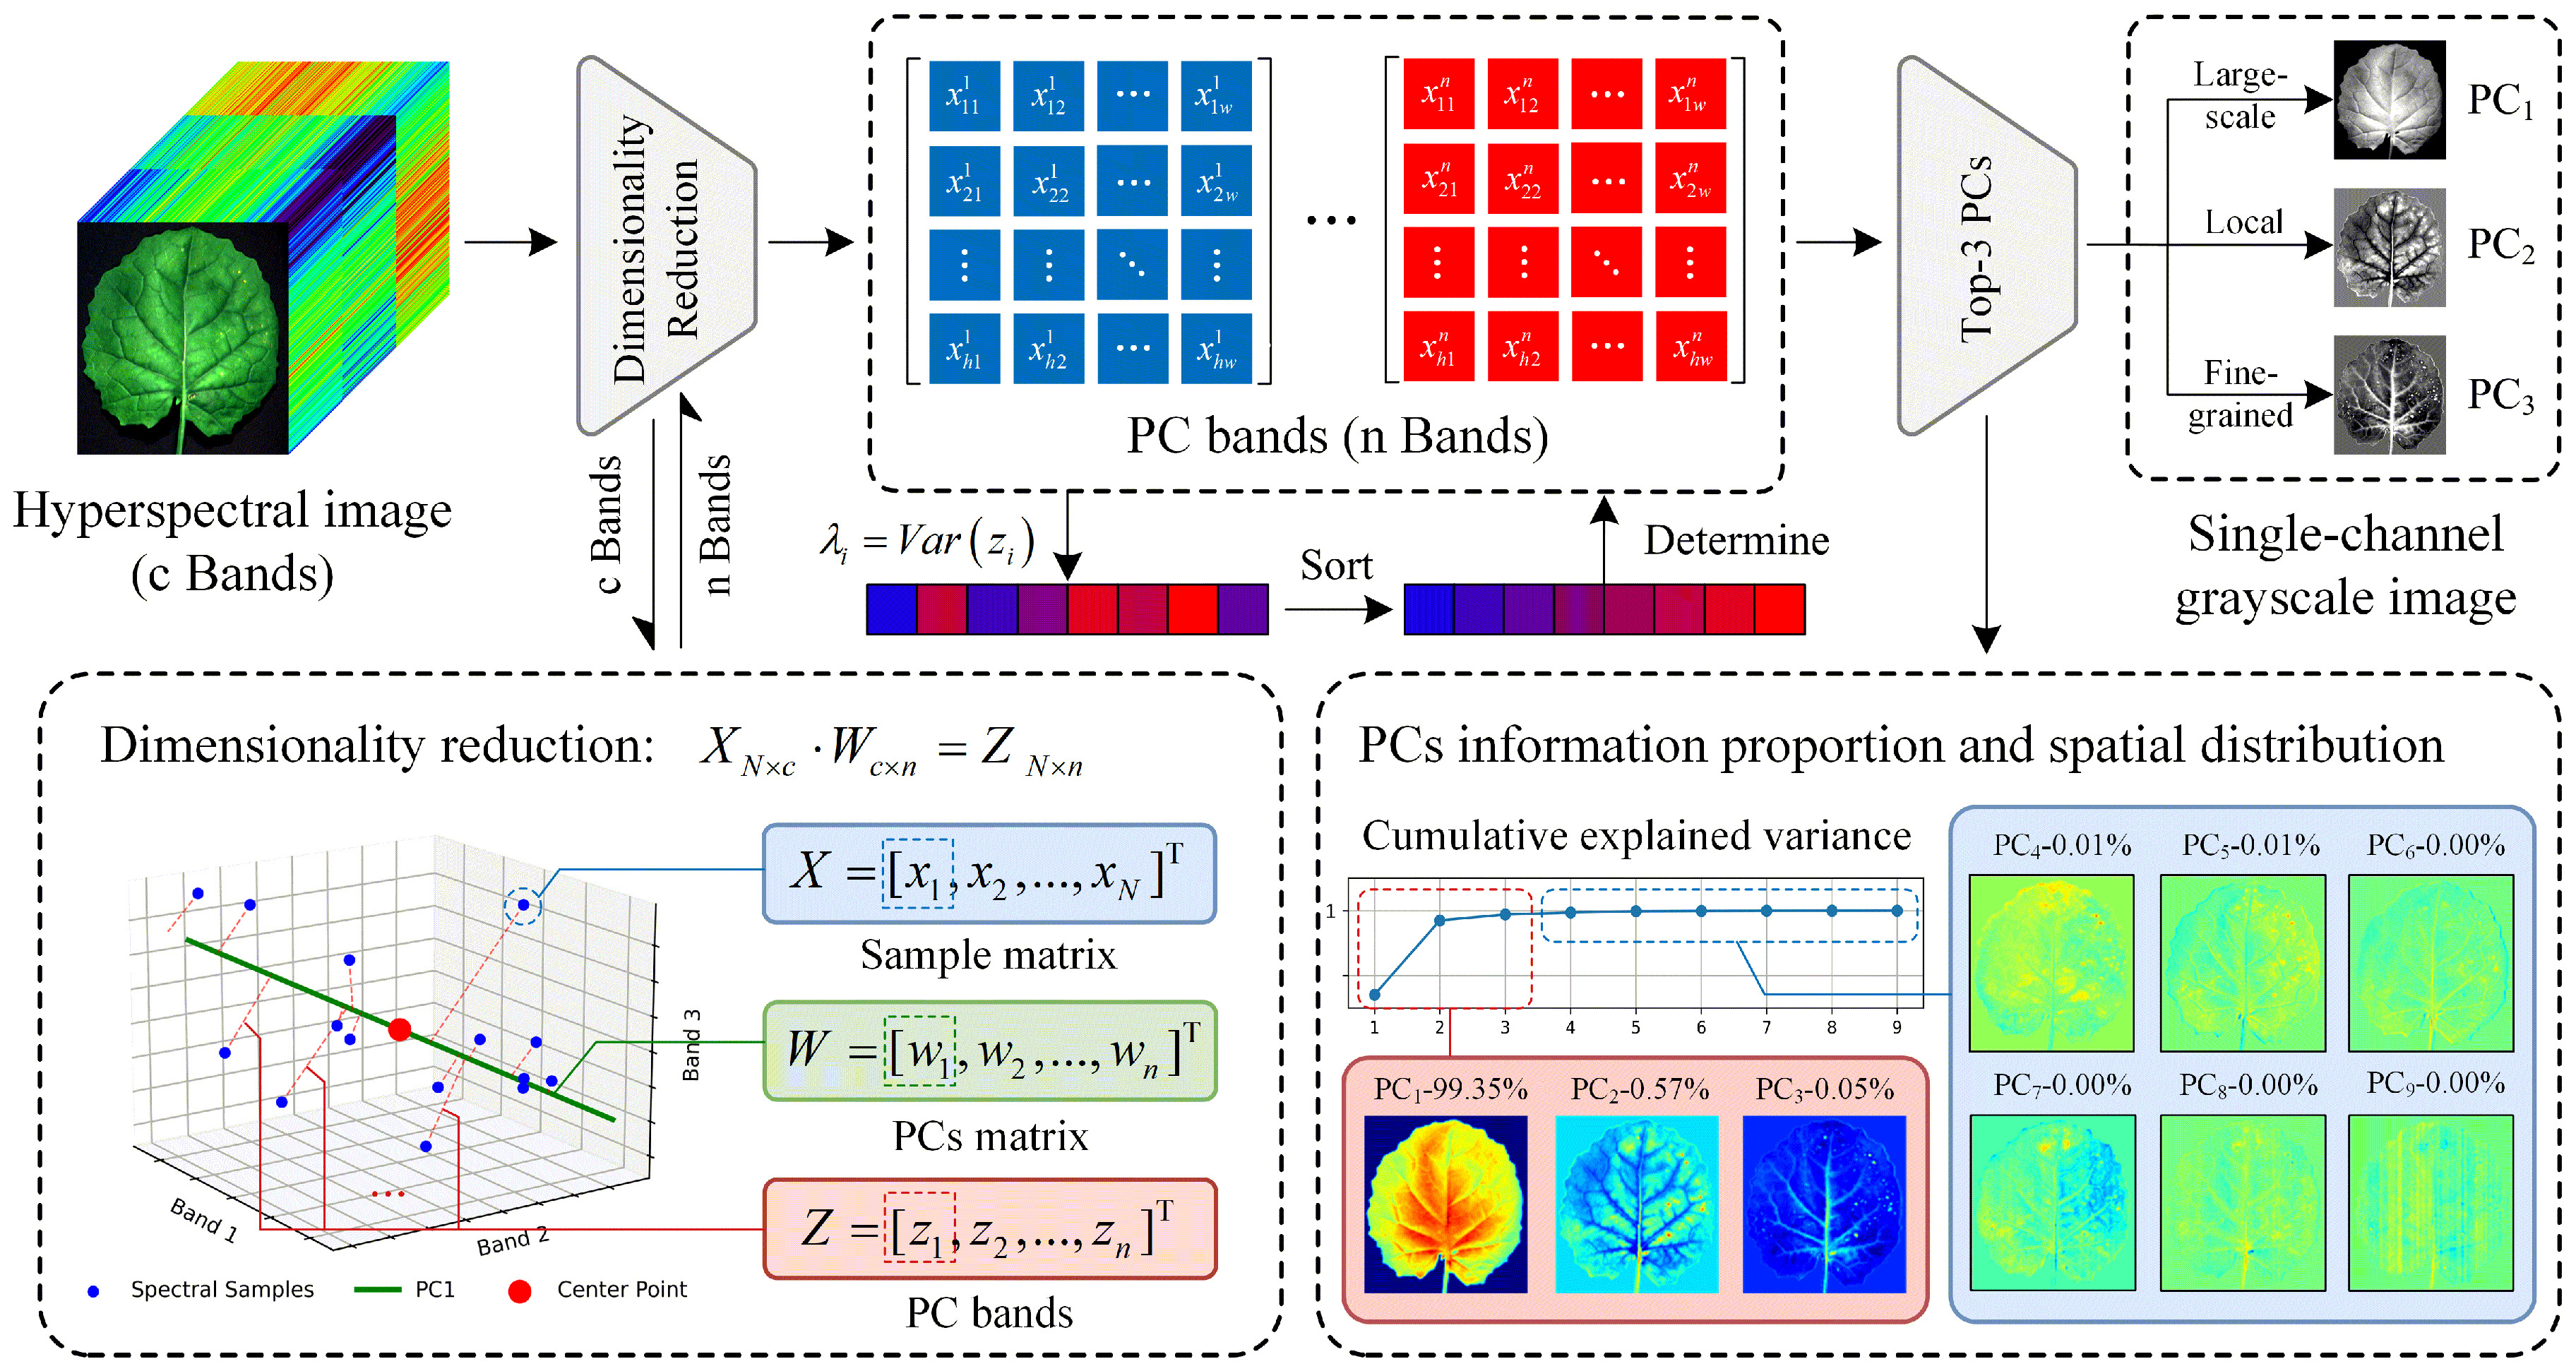
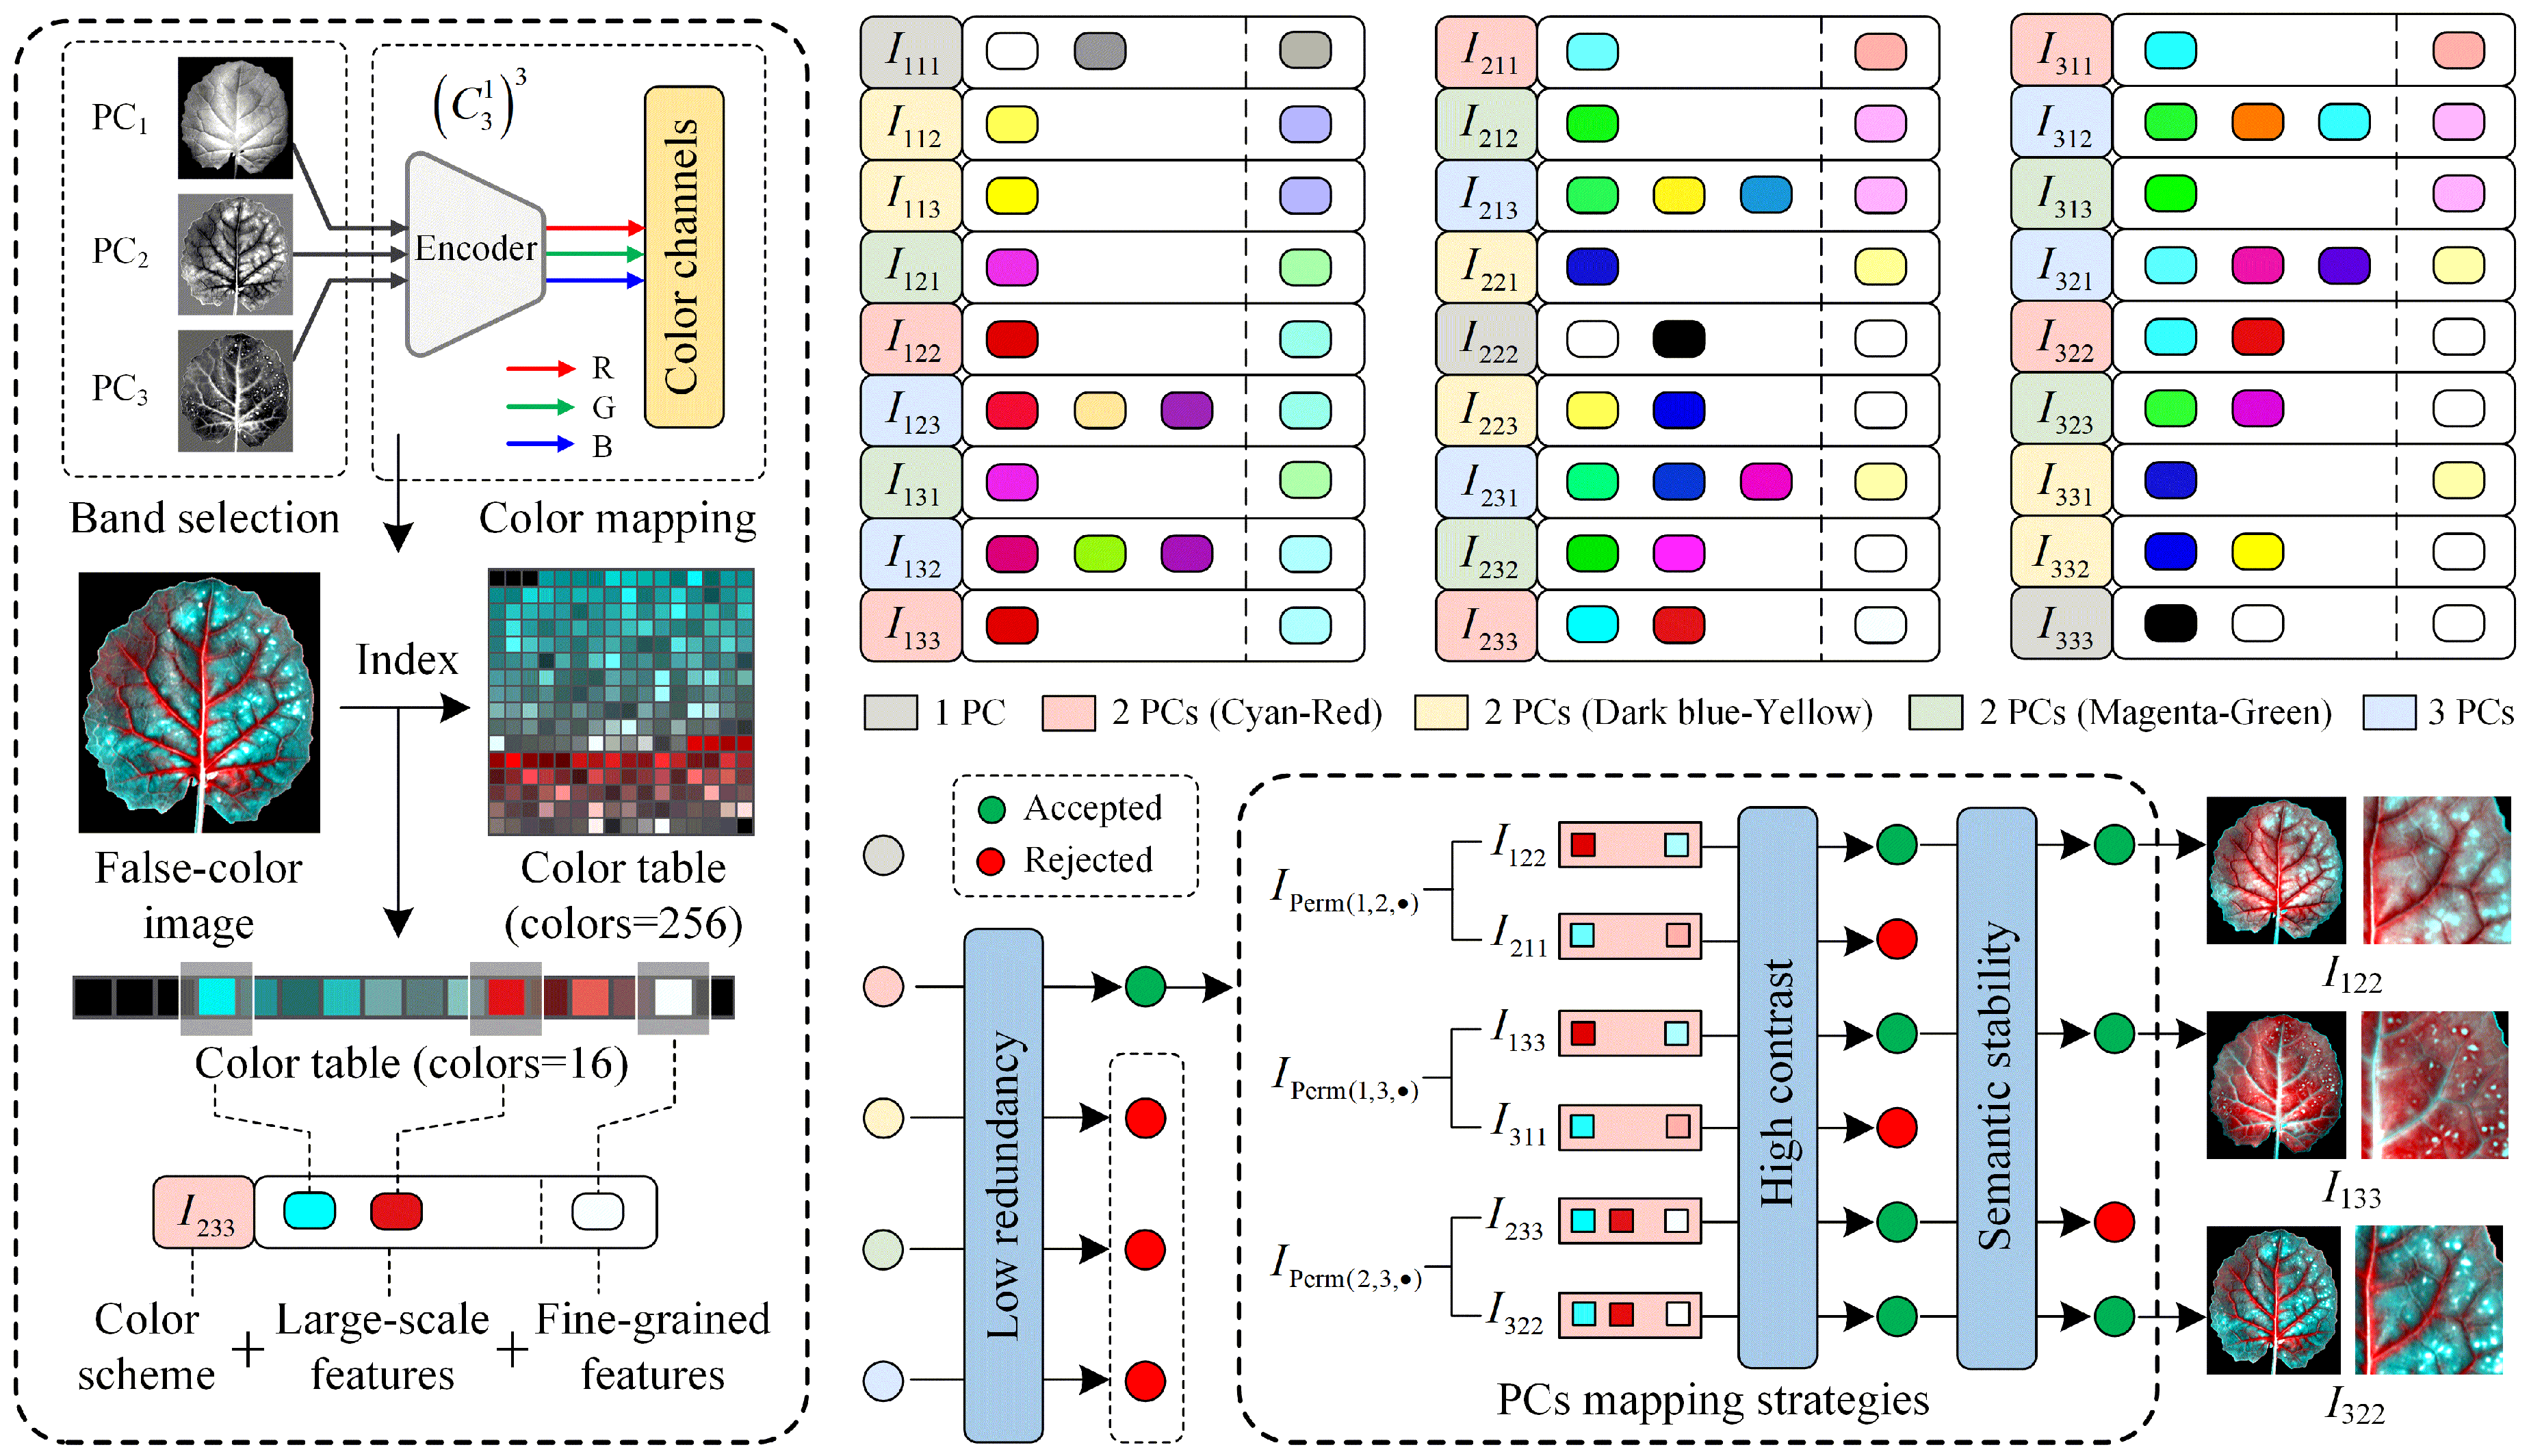
2.5. PCA-Based False-Color Image Construction

PCA is a widely used technique for dimensionality reduction [46]. Figure 1 illustrates the process of extracting PCs from hyperspectral images using PCA. First, the spectral data is organized into a sample matrix X N × c , where N denotes the number of pixels and c represents the number of spectral bands. Through PCA, the original data is projected onto a new orthogonal basis, represented by the PC matrix W c × n , producing a set of PC bands Z N × n , where n denotes the number of PCs. The explained variances λi are sorted in descending order to evaluate the proportion of original information preserved by each component. These PC bands can be effectively utilized for false-color image encoding. In contrast to the redundant spectral bands in hyperspectral images, which lack feature relevance to visual perception, PC bands provide logical support in terms of information content and discriminative features.
As shown in the visualization results of Figure 2, PC1 to PC3 capture prominent differences in the structural and morphological characteristics of the leaf, whereas the contribution of the subsequent PCs decreases markedly. Specifically, PC1 (99.35%) contains the majority of the information in the original image, reflecting large-scale structural differences in the target. PC2 (0.57%) is more sensitive to variations in texture features and captures local structural differences. PC3 (0.05%) emphasizes edge and detail features of the target and reflects fine-grained differences. The construction process of the false-color image based on PC1-PC3, as well as the PC-to-channel mapping strategy, is illustrated in Figure 3.
The false-color image Iijk represents the PCs [PCi, PCj, PCk] that are mapped to the red (R), green (G), and blue (B) channels, respectively. By applying different PC mapping strategies, multiple false-color images with diverse color schemes (e.g., Cyan—Red, Dark blue—Yellow, and Magenta—Green). The I Perm ( i , j , k ) , where Perm ( · ) represents all permutations of the indices i, j, k, essentially reflects different color representations of the same spectral features. To avoid feature redundancy, false-color images constructed from the three types of PC mapping were excluded. Meanwhile, a representative color scheme, Cyan—Red, was adopted in this study. Within this color scheme, the mapping strategies were further constrained to ensure high feature contrast and stable semantic mapping. As a result, three optimal PC mapping strategies were identified: I122, I133, and I322.

2.6. Dataset Construction

To support the training of the classification models, datasets of 1D spectral sequences, visible-light images, and false-color images were constructed separately. Each dataset was divided into training, validation, and test sets according to a specific ratio, ensuring data adequacy, training stability, and model generalization. Specifically, the spectral sequence datasets were divided in a ratio of 8:1:1, while the image datasets adopted a 7:2:1 ratio. Notably, random image augmentation was applied exclusively to the training sets of the image datasets. In this study, label encoding was employed for class annotation during dataset construction, ensuring consistent representation of class labels across all data types.

2.6.1. 1D Spectral Sequences

In the black-and-white corrected hyperspectral images, the oilseed rape leaves were designated the target regions and ROIs were randomly selected within these areas. The average reflectance across all 334 spectral bands was calculated for each ROI, resulting in a 1D spectral sequence of size 1 × 334. To enhance sample diversity, 12 ROIs were extracted from each leaf, yielding a total of 8640 1D spectral sequences. These sequences were structured in a tabular format, where each row represented a sample, each column denoted the reflectance at a specific wavelength, and the final column indicated the class label corresponding to the Cu stress treatment group.

2.6.2. Visible-Light Images

In this study, a total of 720 visible-light images of oilseed rape leaf samples were collected. During the image acquisition process, standardized lighting conditions and a fixed shooting angle were applied to ensure image consistency. The dataset was subsequently subjected to image augmentation and categorical labeling. The constructed visible-light image dataset was designated as Dv.

2.6.3. False-Color Images

The construction of the raw false-color image dataset D f l (where l = 1, 2, 3) was based on l types of false-color images. Here, the parameter l represents the richness of discriminative features contained in each dataset, with a total of 720 × l samples in each case. The dataset constructed from Iijk was denoted as Dijk, serving as an individual data source. Due to the diversity in dataset compositions and residual network variants, preliminary experiments were conducted to determine the optimal combination for Cu stress levels classification. Accordingly, seven preliminary false-color datasets (P1P7) were constructed to systematically investigate how both the type and richness of discriminative features influence the performance of classification tasks. Among them, P1, P2, and P3 were sourced solely from D122, D133, and D322, respectively. P4 (D122 and D133), P5 (D122 and D322), and P6 (D133 and D322) were constructed from two-source combinations. P7 (D122, D133, and D322) incorporated all three data sources. To ensure consistency in the sample size, each preliminary dataset was standardized to 720 samples, with each data source contributing an equal number of samples. Finally, all images were labeled based on corresponding Cu stress treatment group.

2.7. Evaluation Metrics

This study aims to address a multi-class classification problem. To comprehensively evaluate the classification performance of the models, four representative evaluation metrics were selected: accuracy, precision, recall, and F1, as shown in Equations (1)–(3), where TP represents true positive, FP represents false positive, and FN represents false negative.
P r e c i s i o n = T P T P + F P
R e c a l l = T P T P + F N
F 1 = 2 × P r e c i s i o n × R e c a l l P r e c i s i o n + R e c a l l
Considering the balanced distribution of samples in the multi-class classification task, macro-averaging (Macro) was employed to calculate the multi-class evaluation metrics, as shown in Equation (4), providing a more objective and comprehensive reflection of the overall performance.
Macro - M e t r i c = 1 N i N M e t r i c i
Here, N represents the number of classes, and Metrici refers to the metric corresponding to each class i, such as precision, recall, or F1.

2.8. Experimental Setup

2.8.1. Software Platforms

In this study, various stages of data processing and model training were conducted using different software platforms. The spatial domain preprocessing of the acquired hyperspectral data was performed using HSI Analyzer 1.0 software. PCA-related operations and the construction of false-color images were carried out with ENVI 4.5. The spectral domain preprocessing of the hyperspectral data, as well as the modeling of 1D spectral sequences using both the SVM and B1DCNN, were performed in MATLAB R2023b. The implementation of 1D residual networks, image processing tasks, and all deep learning-based classification tasks related to spatial image data were executed using the PyCharm 2023.2.1 (Community Edition) development environment.

2.8.2. Environment and Hardware

All experiments in this study were conducted on a 64-bit Ubuntu 18.04.6 LTS operating system. The system utilized the PyTorch 1.11.0 framework for the construction and training of deep learning models, with parallel computation accelerated by CUDA 11.4. The hardware configuration consisted of an Intel Core i7-10700K CPU @ 3.80 GHz × 16, 32 GB of RAM, and an NVIDIA GeForce RTX 3080 GPU with 10 GB of VRAM.

2.8.3. Hyperparameter Settings

In this study, the hyperparameter settings for the CNNs were carefully selected. For processing 1D spectral sequences, the batch size was set to 32, and the input size was defined as 335 × 1, where the first 334 values correspond to the wavelength sampling points, and the final value represents the class label, with 1 indicating the input channel. In contrast, for processing spatial image data, a batch size of 16 was employed, and the input size was configured to 224 × 224 × 3, where 224 represents both the height and width of the resized input images, and 3 denotes the three RGB color channels. Adaptive moment estimation (Adam) was utilized to optimize the network parameters, with a learning rate of 0.001, momentum set to 0.937, and the second moment coefficient set to 0.999 [47]. Furthermore, the number of training epochs was fine-tuned throughout the training process to ensure model convergence.

3. Experiment and Results

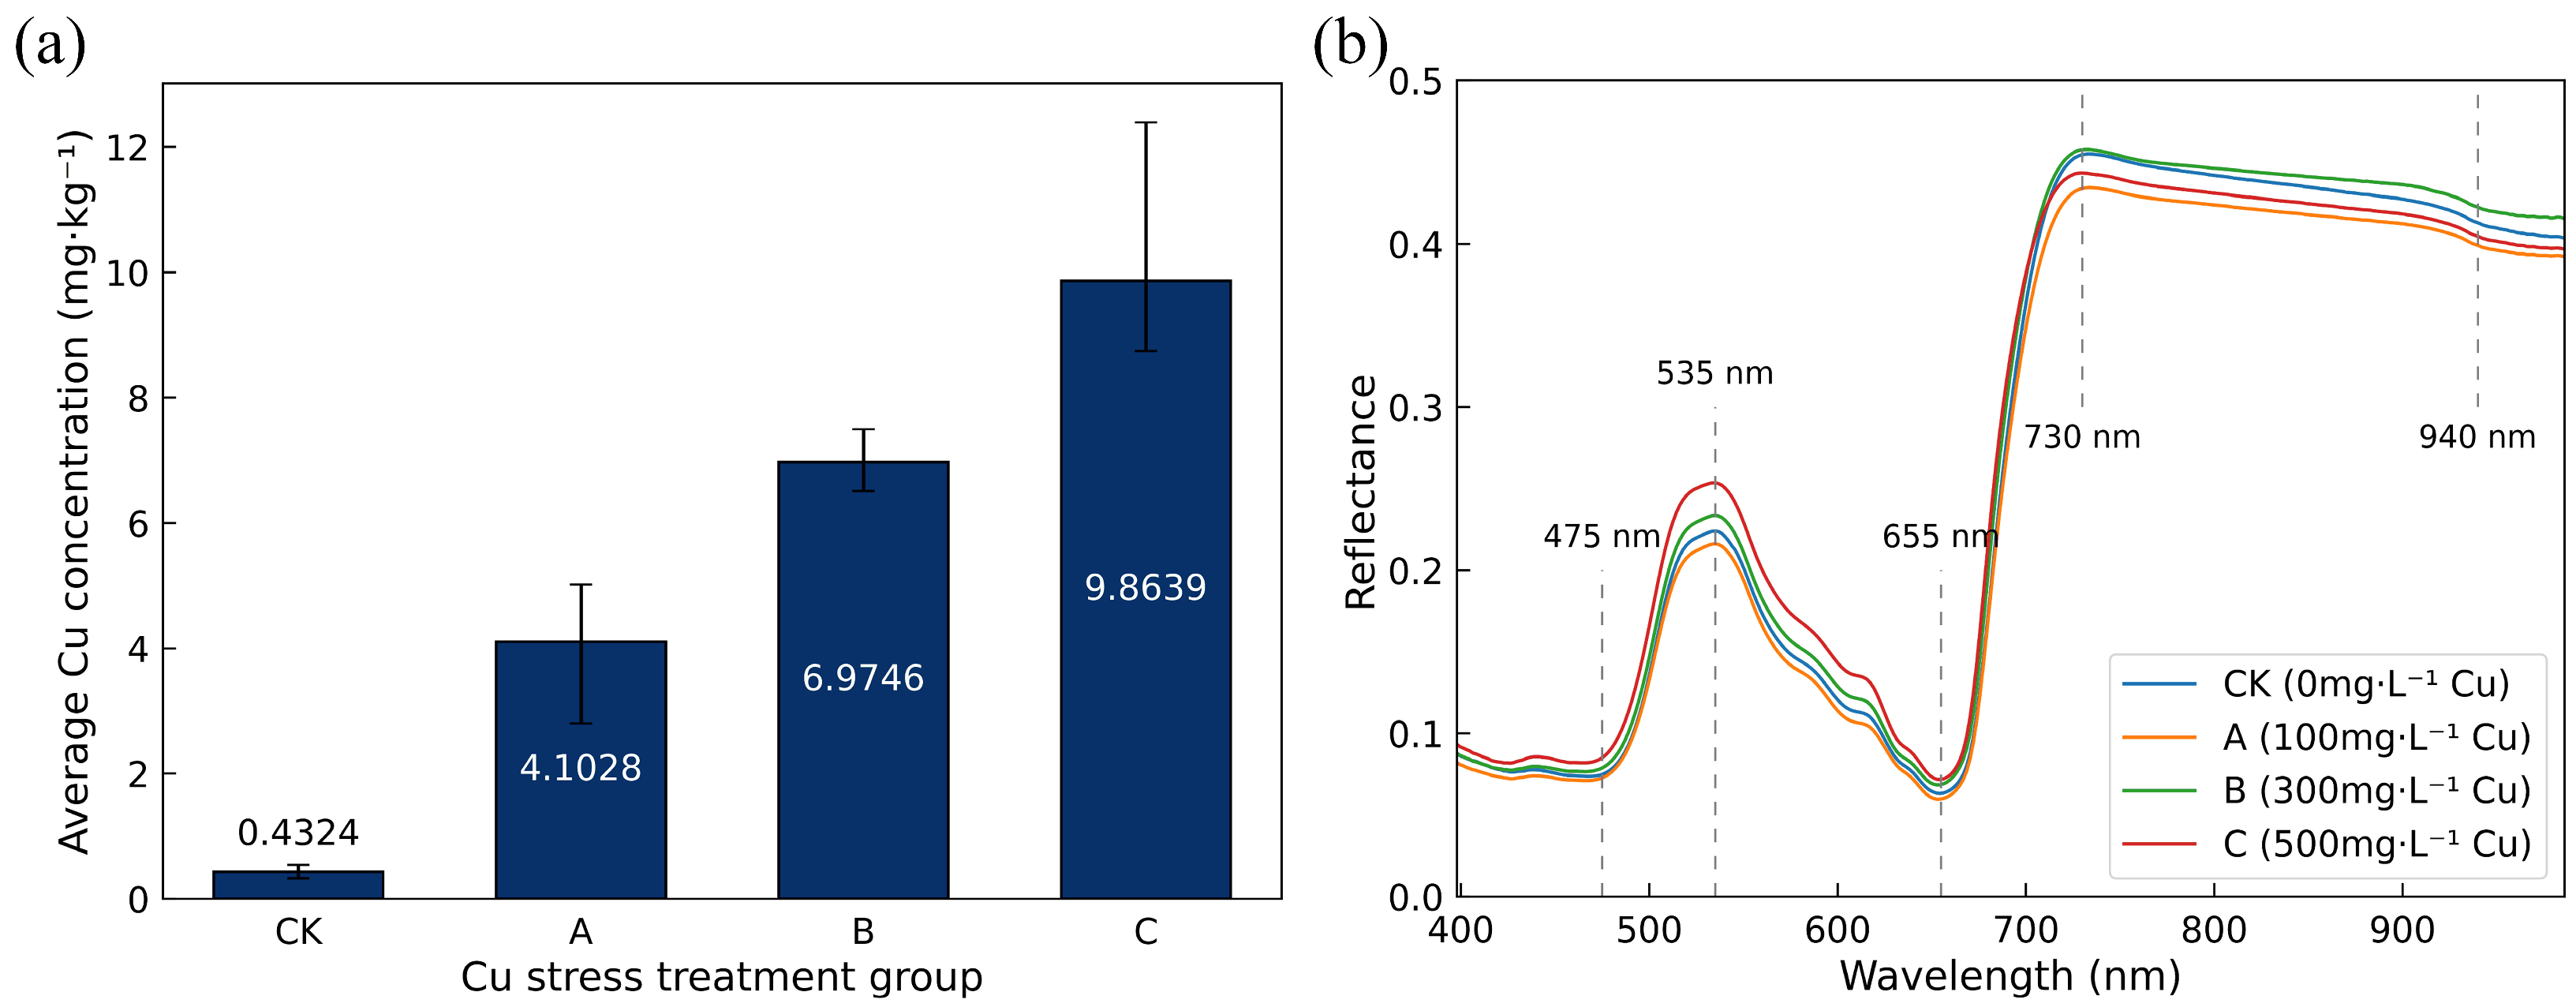
3.1. Chemical and Spectral Analysis

To validate the absorption of Cu by oilseed rape and confirm that the Cu content in the plant exhibits a clear and quantifiable gradient under different Cu stress levels, Figure 4a presents the chemical analysis results of Cu content in oilseed rape leaf samples subjected to different treatments. As shown in Figure 4a, the Cu content in oilseed rape leaves was significantly influenced by varying levels of Cu stress, exhibiting a clear gradient variation. In the CK, residual Cu originated from the irrigation with Hoagland solution, which supplies essential nutrients for plant growth, including Cu. The identical irrigation conditions were employed in the experiment to ensure consistent growth for the oilseed rape plants.
As shown in Figure 4b, the average reflectance curves of each treatment group exhibit a generally consistent trend across the wavelength range from 397.91 nm to 986.02 nm. The spectral curves show absorption troughs near the blue light (around 475 nm) and red light (around 655 nm) regions, which are attributed to the strong absorption of blue and red light by chlorophyll [48]. A prominent reflection peak is observed at the green light region (around 535 nm), primarily due to the relatively weak absorption of green light by chlorophyll and the reflection of green light by the leaf structure [25]. Additionally, the spectral curves form a high-reflection plateau in the near-infrared region (approximately 730 nm to 940 nm), reflecting the strong reflectance of near-infrared light by the cell structure [49]. Although the spectral curves under different treatment conditions exhibit a generally consistent trend, significant reflectance differences exist in several key regions, indicating the potential impact of Cu stress on the spectral response characteristics of oilseed rape plants. In particular, significant variations in the reflectance peak are observed between the treatment groups near the green light region (around 535 nm). Compared to the CK, treatment group A exhibits a lower peak value, which may be attributed to the enhancement of certain pigment synthesis and enzyme activity in chloroplasts under low-concentration Cu stress [8]. However, in treatment groups B and C, the reflectance peak increases progressively. This may indicate that the reduction in chlorophyll content led to a diminished capacity to absorb green light under moderate to severe Cu stress [8]. In addition, subtle differences in reflectance among the treatment groups are observed in the red light absorption trough and the near-infrared plateau regions, suggesting that Cu stress may alter spectral reflectance characteristics by disrupting leaf structure and affecting chloroplast function [25].

3.2. 1D Spectral Classification

3.2.1. Spectral Preprocessing

The raw reflectance spectra of oilseed rape leaves were preprocessed using SG and MSC. Considering the limitations of individual methods in addressing complex interferences, a combined preprocessing strategy, i.e., SG-GD-MSC, was further introduced to suppress multi-source errors.
As shown in Figure 5, the spectral curves processed with SG appear smoother, while those processed by MSC exhibit greater consistency. SG-GD-MSC combines the advantages of both methods in noise reduction and standardization. Additionally, the introduction of GD effectively highlights spectral features and trends, further enhancing the interpretability of the spectral data.

3.2.2. SVM vs. B1DCNN

To evaluate the performance differences between machine learning algorithms and the shallow 1D-CNN in multi-class classification tasks, this study employed the SVM and B1DCNN to model and analyze the spectral data of oilseed rape leaves under Cu stress (Table 1). Additionally, the potential of deep learning methods in modeling 1D spectral sequences was further explored.
As shown in Table 1, the SVM demonstrates relatively strong classification performance on the raw spectral data, while further preprocessing provides only limited improvements. In contrast, the B1DCNN exhibits a more substantial performance gain from preprocessing. For all forms of preprocessed spectral information, the B1DCNN outperforms the SVM and achieves optimal classification performance under the SG-GD-MSC preprocessing. These indicate that the SVM is more sensitive to raw spectral features but has limitations in extracting features from complex preprocessed data. Although the SVM is typically suitable for low-dimensional data with limited sample sizes, 1D-CNNs demonstrate superior robustness and generalization ability in feature extraction and nonlinear modeling.

3.2.3. 1D Residual Network

Although shallow 1D-CNNs (e.g., B1DCNN) outperform the SVM in spectral classification tasks, their relatively simple architectures constrain their capacity to extract complex spectral features. To further evaluate the effectiveness of deep 1D-CNNs in modeling complex spectral structures, three residual networks with similar parameters were selected: 1D-ResNet-50, 1D-ResNeXt-50 (32 × 4d), and 1D-RegNetX-6.4GF. Table 2 presents the classification performance of these models on 1D spectral data under various preprocessing strategies.
As shown in Table 2, various preprocessing methods contribute to improved performance in 1D residual networks. Furthermore, the application of SG-GD-MSC enables all three models to achieve their optimal performance across multiple evaluation metrics. These results indicate that preprocessing effectively enhances the quality of 1D spectral data by reducing redundant features and enhancing feature discriminability. Additionally, 1D-RegNetX-6.4GF achieves the best overall performance, indicating that its regularized design exhibits superior feature extraction capabilities. Compared to traditional residual structures, RegNetX exhibits superior adaptability in capturing long-range dependencies. This enables the model to integrate subtle correlations between distant spectral bands, which is essential for distinguishing weak correlations and highly coherent features in 1D spectral classification tasks.

3.3. Image Classification

3.3.1. Preliminary Experiments

In the classification task of Cu stress, 1D spectral data serves as a crucial basis for analyzing the physiological response of oilseed rape to Cu stress. However, image data also contains rich features of texture, structure, and color variations, which hold significant complementary and contrasting value. Preliminary experiments were conducted to evaluate the classification performance of residual networks and their variants. In addition, visible-light images (i.e., Dv) were introduced as a comparative reference to assess the effectiveness of PCA-based feature extraction and the construction of false-color images. Figure 6 presents the classification performance of each model on different datasets in the preliminary experiments.
As shown in Figure 6, increasing model parameters contributes to enhanced classification accuracy and improved performance stability across different classification models. Within the ResNet variants, ResNet-50 offers a favorable trade-off between accuracy and model complexity, achieving competitive performance with moderate parameters. In the ResNeXt series, although ResNeXt-101 slightly outperforms ResNeXt-50 in accuracy, the corresponding increase in parameters is substantial. Therefore, ResNeXt-50 is considered a more suitable choice for balancing performance. Regarding the RegNetX family, RegNetX-6.4GF outperforms both RegNetX-3.2GF and RegNetX-4.0GF in accuracy, while achieving performance comparable to the larger RegNetX-8.0GF, making it a more efficient and practical option.
In terms of dataset characteristics, the dataset containing I122 primarily emphasizes the representation of global features. In such tasks, shallow networks with larger receptive fields are more effective in acquiring global information, whereas deeper architectures contribute limited performance gains. In contrast, the dataset constructed with I133 emphasizes the representation of fine-grained features, in which deeper architectures demonstrate superior classification performance over shallower ones. Regarding visible-light images, the relatively poor classification performance indicates that the target objects lack sufficiently discriminative features, with limited structural and textural differences for distinguishing between categories. In contrast, the false-color images provide enhanced feature representations, resulting in progressive improvement in classification performance as the feature diversity increases. Notably, the models achieved optimal performance on P7, which contains the richest feature information.
The preliminary experiments validated that ResNet-50, ResNeXt-50 (32 × 4d), and RegNetX-6.4GF achieved an optimal balance between classification accuracy and model parameters. Furthermore, the results confirmed that false-color images provided more comprehensive and effective feature representations, thereby enhancing the classification performance of the models.

3.3.2. Model Evaluation

Based on the results of the preliminary experiments, this study employed ResNet-50, ResNeXt-50 (32 × 4d), and RegNetX-6.4GF as backbone networks to perform multi-class classification on the complete false-color dataset (i.e., D f 3 ). The comparison between the predicted results and the ground truth for each class is illustrated in Figure 7, while the overall classification performance is presented in Table 3. To enhance contrast for low-frequency misclassification cases, the confusion matrices were visualized using logarithmic normalization, in which color intensity was encoded according to the base-10 logarithm of the raw count values (ranging from 0.01 to 54, where 0.01 is a small constant added to substitute zero values to avoid numerical errors, and 54 corresponds to the number of samples per class in the test set).
As shown in Figure 7, all three models demonstrate high classification accuracy across the categories of D f 3 . However, sample misclassification is primarily attributed to ambiguous features caused by insufficient feature differentiation, which arise from two main factors. First, group A is positioned in a transitional phase between Cu promotion and stress effects. Second, the variations in Cu content (as shown in Figure 4a) could have caused heterogeneity in the physiological states of the samples within the same treatment group. These factors collectively pose challenges to the classification performance of the models and highlight the importance of fine-grained feature extraction and generalization capability. Overall, RegNetX-6.4GF demonstrated the best performance, particularly in the groups CK, A, and C.
A comparison of Table 2 and Table 3 indicates that all three models exhibit superior classification performance on false-color images compared to 1D spectral sequences, with RegNetX-6.4GF achieving the highest classification accuracy. Notably, this result represents the optimal performance across all evaluation experiments conducted in this study. These findings further confirm that false-color images facilitate the extraction of discriminative features and support more effective representation learning in CNNs, thereby significantly improving classification performance.

3.4. Feature Visualization

To further investigate how the latent physiological changes in plants under Cu stress manifest as differentiated features and guide the CNNs in targeted feature learning, we employed Grad-CAM [50] to visualize the intermediate feature maps. This approach enhances the interpretability of the model’s feature extraction and decision-making process by generating heatmaps of focused regions. The heatmap presented in Figure 8 illustrates the ROIs identified by the CNNs during the classification of both visible-light and false-color images.
Under severe Cu stress, the leaves of oilseed rape exhibit speckled and localized chlorosis. As shown in Figure 8, these morphological features are more effectively captured and emphasized in the false-color images, whereas they are less discernible in the corresponding visible-light images. In visible-light images, the classification of stress severity primarily depends on the coarse morphological characteristics, such as leaf contour, area, and color. Notably, the attention maps of the three models exhibit notable differences when applied to visible-light images, with attention distributions largely failing to coincide with regions of chlorosis. This indicates that the model lacks a clear learning target, and the limited classification performance can be largely attributed to the inadequate extraction of discriminative features. In contrast, the attention distributions in the false-color images show a high degree of overlap with the chlorosis regions and are consistently focused on areas characterized by fine-grained variations. This indicates that the network has successfully extracted and learned more discriminative local features. By enhancing the visual representation of key physiological changes induced by Cu stress, the false-color images guide CNNs to focus more precisely on regions closely related to the severity of stress, thereby improving classification performance.
Among the models, RegNetX-6.4GF demonstrates the most focused and precise attention distribution in the false-color images, indicating more targeted and discriminative feature learning, which contributes to its superior overall performance. The data construction and classification modeling methods presented in this study offer valuable applications in agricultural practices for assessing Cu stress in plants. These methods contribute to enhancing both the accuracy and interpretability of agricultural monitoring systems.

4. Discussion

HSI, image processing, and deep learning serve as foundational technologies that are widely applied in modern agricultural detection [51,52]. Numerous studies have employed spectral analysis techniques for the detection of heavy metal contaminants in agricultural products [17,48,53]. The typical workflow involves preprocessing high-dimensional spectral data, followed by feature extraction and modeling using machine learning approaches [25]. Although 1D spectral sequences contain inherent richness of information, they exhibit limitations in structural representation and feature perception. Research has demonstrated that the rich spatial information provided by spectral images significantly enhances the precision and efficiency of modeling, while also improving the adaptability of deep learning models [27,54,55]. This study extracts and reorganizes the abundant spatial data contained in hyperspectral images by employing PCA dimensionality reduction and PC mapping strategies. The resulting false-color images effectively capture latent physiological changes, which serve as discriminative features that guide CNNs in precise and efficient feature learning. This approach overcomes the limitations of 1D spectral sequences, which lack multi-scale information, as well as the absence of discriminative features in visible-light images and the constraints of traditional machine learning algorithms in modeling complex features. Compared to modeling based on 1D spectral sequences or visible-light images, this methodology demonstrates a superior performance and offers enhanced interpretability in the decision-making processes of the model.
Although this study has made significant advancements in the non-destructive detection of oilseed rape under Cu stress, there are still several limitations to consider. First, the dataset employed in this research was derived from samples cultivated under controlled experimental conditions, which may not fully reflect the complexity of real-world agricultural environments. Future research will focus on data collection and model training across a broader and more diverse range of actual agricultural conditions to enhance the model’s generalization capabilities. Second, the spectral data in this study were collected primarily in a controlled experimental environment, whereas the complex lighting conditions in real-world conditions may introduce noise and biases, potentially compromising the quality of the collected data. To address this, future research will explore the application of environmental light correction algorithms and investigate the integration of portable spectral acquisition devices. Moreover, although the current modeling algorithms have demonstrated promising results, there remains a potential for optimization, particularly in terms of automated hyperparameter tuning. These improvements will contribute to further enhancing the model’s performance.
Finally, considering the increasingly severe issue of heavy metal contamination, the proposed method will be further developed to detect stress in various crop species exposed to different types of heavy metal stress. Existing research has demonstrated that the addition of silicon (Si) can effectively inhibit the absorption of Pb by crops [25]. It is anticipated that similar approaches may be applicable to mitigating Cu stress. Future research will focus on providing practical and feasible solutions to reduce the adverse effects of Cu toxicity on crops.

5. Conclusions

This study proposes an innovative non-destructive method for detecting Cu stress in oilseed rape. The core of the approach lies in the construction of hyperspectral false-color images through PCA, which capture latent physiological changes as discriminative features that guide CNNs in efficient and precise feature learning.
This study systematically evaluated the modeling performance of various classification models in the multi-class classification of oilseed rape under different levels of Cu stress. The Top-1 accuracies achieved by SVM, B1DCNN, and 1D residual networks in classifying 1D spectral sequences were 93.49%, 95.15%, and 96.69%, respectively. The results validate the significant advantages of 1D-CNNs in complex modeling tasks and the performance improvements gained through deeper network architectures. In the preliminary experiments focusing on spatial image data, the deep residual network exhibited the optimal overall performance across datasets with similar feature richness on Dv, P1, P5, and P7, achieving Top-1 accuracies of 95.83%, 96.53%, 97.92%, and 98.61%, respectively. This comparative experiment demonstrates that false-color images outperform visible-light images and 1D spectral sequences in CNN modeling. Moreover, it highlights that the richness of discriminative features plays a positive role in enhancing classification performance. Among all the models evaluated, RegNetX-6.4GF achieved the optimal performance on dataset D f 3 due to its flexible parameterization and superior feature extraction capabilities, with a Macro-Precision, Macro-Recall, Macro-F1, and Accuracy of 98.17%, 98.15%, 98.15%, and 98.15%, respectively. Grad-CAM visualizations enhanced the transparency and interpretability of the model’s decision-making logic, demonstrating the effectiveness of false-color image construction in extracting discriminative features.
This approach significantly advances the application of HSI and deep learning technologies in non-destructive detection. By effectively identifying heavy metal stress levels in crops, the widespread application of this method offers a promising solution for real-time, high-precision monitoring of agricultural pollution, which is crucial for optimizing existing agricultural practices.

Author Contributions

Conceptualization, J.S.; methodology, Y.P. and Y.X.; software, Y.P.; data curation, Z.C.; writing—original draft preparation, Y.P.; writing—review and editing, L.S.; supervision, J.S., X.W. and C.D.; resources, J.S., X.W. and C.D. All authors have read and agreed to the published version of the manuscript.

Funding

This research was funded by the Project of Postgraduate Research & Practice Innovation Program of Jiangsu Province, grant number SJCX25_2450.

Data Availability Statement

The datasets presented in this article are not readily available as they form part of an ongoing study, and the size of the hyperspectral data prevents them from being uploaded in a minimal dataset format.

Conflicts of Interest

Author Yubin Xie was employed by the company FuFu Information Technology Co., Ltd. The remaining authors declare that the research was conducted in the absence of any commercial or financial relationships that could be construed as a potential conflict of interest.

Abbreviations

The following abbreviations are used in this manuscript:
HSIHyperspectral imaging
CNNConvolutional neural network
1DOne-dimensional
1D-CNNOne-dimensional convolutional neural network
PCAPrincipal component analysis
SVMSupport vector machine
CKControl group
ROIRegion of interest
SGSavitzky–Golay smoothing
GDGap derivative
MSCMultiplicative scatter correction
B1DCNNBasic 1D-CNN model
PCPrincipal component
IijkFalse-color image constructed based on specific PC mapping strategies
DvVisible-light image dataset
DfFalse-color image dataset
DijkDataset constructed from false-color images Iijk
SG-GD-MSCCombined preprocessing strategy using SG, GD, and MSC

References

  1. Jiang, H.; Wang, Z.; Deng, J.; Ding, Z.; Chen, Q. Quantitative detection of heavy metal Cd in vegetable oils: A nondestructive method based on Raman spectroscopy combined with chemometrics. J. Food Sci. 2024, 89, 8054–8065. [Google Scholar] [CrossRef]
  2. Guo, Z.; Chen, P.; Yosri, N.; Chen, Q.; Elseedi, H.R.; Zou, X.; Yang, H. Detection of heavy metals in food and agricultural products by surface-enhanced Raman spectroscopy. Food Rev. Int. 2023, 39, 1440–1461. [Google Scholar] [CrossRef]
  3. Hossain, M.M.; Tripty, S.J.; Shishir, M.Z.A.; Wang, S.; Hossain, I.; Geng, A.; Han, S.; Zhu, D. Malondialdehyde and heavy metal contents in Piper betel: Possible risks of heavy metals in human health. J. Food Compos. Anal. 2024, 134, 106540. [Google Scholar] [CrossRef]
  4. Zhang, W.; Liu, C.; Liu, F.; Zou, X.; Xu, Y.; Xu, X. A smart-phone-based electrochemical platform with programmable solid-state-microwave flow digestion for determination of heavy metals in liquid food. Food Chem. 2020, 303, 125378. [Google Scholar] [CrossRef] [PubMed]
  5. Azam, K.; Akhtar, S.; Gong, Y.Y.; Routledge, M.N.; Ismail, A.; Oliveira, C.A.; Iqbal, S.Z.; Ali, H. Evaluation of the impact of activated carbon-based filtration system on the concentration of aflatoxins and selected heavy metals in roasted coffee. Food Control 2021, 121, 107583. [Google Scholar] [CrossRef]
  6. Zaman, F.; Zhang, E.; Ihtisham, M.; Ilyas, M.; Khattak, W.A.; Guo, F.; Wang, P.; Wang, M.; Wang, Y.; Ni, D. Metabolic profiling, pigment component responses to foliar application of Fe, Zn, Cu, and Mn for tea plants (Camellia sinensis). Sci. Hortic. 2023, 319, 112149. [Google Scholar] [CrossRef]
  7. Cao, X.; Wang, X.; Tong, W.; Gurajala, H.K.; Lu, M.; Hamid, Y.; Feng, Y.; He, Z.; Yang, X. Distribution, availability and translocation of heavy metals in soil-oilseed rape (Brassica napus L.) system related to soil properties. Environ. Pollut. 2019, 252, 733–741. [Google Scholar] [CrossRef]
  8. Yruela, I. Copper in plants. Braz. J. Plant Physiol. 2005, 17, 145–156. [Google Scholar] [CrossRef]
  9. Van Assche, F.; Clijsters, H. Effects of metals on enzyme activity in plants. Plant Cell Environ. 1990, 13, 195–206. [Google Scholar] [CrossRef]
  10. Wang, C.; Wu, B.; Jiang, K.; Wei, M.; Wang, S. Effects of different concentrations and types of Cu and Pb on soil N-fixing bacterial communities in the wheat rhizosphere. Appl. Soil Ecol. 2019, 144, 51–59. [Google Scholar] [CrossRef]
  11. Lu, Y.; Wang, Y.; Wu, B.; Wang, S.; Wei, M.; Du, D.; Wang, C. Allelopathy of three Compositae invasive alien species on indigenous Lactuca sativa L. enhanced under Cu and Pb pollution. Sci. Hortic. 2020, 267, 109323. [Google Scholar] [CrossRef]
  12. Zhou, C.; Pan, W.; Peng, Q.; Chen, Y.; Zhou, T.; Wu, C.; Hartley, W.; Li, J.; Xu, M.; Liu, C. Characteristics of metabolites by seed-specific inhibition of FAD2 in Brassica napus L. J. Agric. Food. Chem. 2021, 69, 5452–5462. [Google Scholar] [CrossRef]
  13. Wang, A.; Gao, B.; Cao, H.; Wang, P.; Zhang, T.; Wei, X. Early detection of Sclerotinia sclerotiorum on oilseed rape leaves based on optical properties. Biosyst. Eng. 2022, 224, 80–91. [Google Scholar] [CrossRef]
  14. Migocka, M.; Malas, K. Plant responses to copper: Molecular and regulatory mechanisms of copper uptake, distribution and accumulation in plants. In Plant Micronutrient Use Efficiency; Elsevier: Amsterdam, The Netherlands, 2018; pp. 71–86. [Google Scholar]
  15. Xu, Y.; Kutsanedzie, F.Y.; Ali, S.; Wang, P.; Li, C.; Ouyang, Q.; Li, H.; Chen, Q. Cysteamine-mediated upconversion sensor for lead ion detection in food. J. Food Meas. Charact. 2021, 15, 4849–4857. [Google Scholar] [CrossRef]
  16. Guo, Z.; Chen, P.; Yin, L.; Zuo, M.; Chen, Q.; El-Seedi, H.R.; Zou, X. Determination of lead in food by surface-enhanced Raman spectroscopy with aptamer regulating gold nanoparticles reduction. Food Control 2022, 132, 108498. [Google Scholar] [CrossRef]
  17. Zhou, X.; Zhao, C.; Sun, J.; Cao, Y.; Yao, K.; Xu, M. A deep learning method for predicting lead content in oilseed rape leaves using fluorescence hyperspectral imaging. Food Chem. 2023, 409, 135251. [Google Scholar] [CrossRef]
  18. Wang, X.; Xu, Y.; Li, Y.; Li, Y.; Li, Z.; Zhang, W.; Zou, X.; Shi, J.; Huang, X.; Liu, C. Rapid detection of cadmium ions in meat by a multi-walled carbon nanotubes enhanced metal-organic framework modified electrochemical sensor. Food Chem. 2021, 357, 129762. [Google Scholar] [CrossRef] [PubMed]
  19. Zhang, W.; Xu, Y.; Zou, X. Rapid determination of cadmium in rice using an all-solid RGO-enhanced light addressable potentiometric sensor. Food Chem. 2018, 261, 1–7. [Google Scholar] [CrossRef] [PubMed]
  20. Liu, J.; Kang, L.; Du, L.; Liao, S.; Dong, W.; Ma, M.; Zou, G.; Li, S. Distribution, accumulation and translocation of the heavy metal Cd in various varieties of edible rapeseed under Cd stress. Sustainability 2024, 16, 2876. [Google Scholar] [CrossRef]
  21. Li, L.; Fan, Z.; Gan, Q.; Xiao, G.; Luan, M.; Zhu, R.; Zhang, Z. Conservative mechanism through various rapeseed (Brassica napus L.) varieties respond to heavy metal (Cadmium, Lead, Arsenic) stress. Front. Plant Sci. 2025, 15, 1521075. [Google Scholar] [CrossRef]
  22. Khulal, U.; Zhao, J.; Hu, W.; Chen, Q. Nondestructive quantifying total volatile basic nitrogen (TVB-N) content in chicken using hyperspectral imaging (HSI) technique combined with different data dimension reduction algorithms. Food Chem. 2016, 197, 1191–1199. [Google Scholar] [CrossRef]
  23. Bonah, E.; Huang, X.; Aheto, J.H.; Osae, R. Application of hyperspectral imaging as a nondestructive technique for foodborne pathogen detection and characterization. Foodborne Pathog. Dis. 2019, 16, 712–722. [Google Scholar] [CrossRef]
  24. Zhang, D.; Chen, X.; Lin, Z.; Lu, M.; Yang, W.; Sun, X.; Battino, M.; Shi, J.; Huang, X.; Shi, B. Nondestructive detection of pungent and numbing compounds in spicy hotpot seasoning with hyperspectral imaging and machine learning. Food Chem. 2025, 469, 142593. [Google Scholar] [CrossRef] [PubMed]
  25. Zhou, X.; Liu, Y.; Sun, J.; Li, B.; Xiao, G. Nondestructive detection of lead content in oilseed rape leaves under silicon action using hyperspectral image. Sci. Total Environ. 2024, 949, 175076. [Google Scholar] [CrossRef] [PubMed]
  26. Wambugu, N.; Chen, Y.; Xiao, Z.; Tan, K.; Wei, M.; Liu, X.; Li, J. Hyperspectral image classification on insufficient-sample and feature learning using deep neural networks: A review. Int. J. Appl. Earth Obs. Geoinf. 2021, 105, 102603. [Google Scholar] [CrossRef]
  27. Paoletti, M.E.; Haut, J.M.; Plaza, J.; Plaza, A. Deep learning classifiers for hyperspectral imaging: A review. ISPRS J. Photogramm. Remote Sens. 2019, 158, 279–317. [Google Scholar] [CrossRef]
  28. Su, H.; Du, Q.; Du, P. Hyperspectral image visualization using band selection. IEEE J. Sel. Top. Appl. Earth Obs. Remote Sens. 2013, 7, 2647–2658. [Google Scholar] [CrossRef]
  29. Li, C.; Zhang, B.; Hong, D.; Zhou, J.; Vivone, G.; Li, S.; Chanussot, J. CasFormer: Cascaded transformers for fusion-aware computational hyperspectral imaging. Inf. Fusion 2024, 108, 102408. [Google Scholar] [CrossRef]
  30. Shi, W.; Koo, D.E.; Kitano, M.; Chiang, H.J.; Trinh, L.A.; Turcatel, G.; Steventon, B.; Arnesano, C.; Warburton, D.; Fraser, S.E. Pre-processing visualization of hyperspectral fluorescent data with Spectrally Encoded Enhanced Representations. Nat. Commun. 2020, 11, 726. [Google Scholar] [CrossRef]
  31. Cortes, C.; Vapnik, V. Support-vector networks. Mach. Learn. 1995, 20, 273–297. [Google Scholar] [CrossRef]
  32. Jankovska-Bortkevič, E.; Gavelienė, V.; Koryznienė, D.; Jankauskienė, J.; Mockevičiūtė, R.; Jurkonienė, S. Response of winter oilseed rape to imitated temperature fluctuations in autumn-winter period. Environ. Exp. Bot. 2019, 166, 103801. [Google Scholar] [CrossRef]
  33. Aryani, R.D.; Nugroho, A.P.; Purwestri, Y.A. Effects of Copper on Accumulation, Plant Growth, Superoxide Dismutase Activity and Total Phenolic Compounds in Paddy (Oryza sativa L. ‘Cempo Merah’) Leaves. In Proceedings of the 2nd International Conference on Tropical Agriculture, Eastparc Hotel, Yogyakarta, Indonesia, 26–27 October 2017; Springer: Berlin/Heidelberg, Germany, 2018; pp. 195–203. [Google Scholar]
  34. Gong, Q.; Wang, L.; Dai, T.; Zhou, J.; Kang, Q.; Chen, H.; Li, K.; Li, Z. Effects of copper on the growth, antioxidant enzymes and photosynthesis of spinach seedlings. Ecotoxicol. Environ. Saf. 2019, 171, 771–780. [Google Scholar] [CrossRef]
  35. Wu, J.; Fu, X.; Yu, C.; Lv, S.; Lv, J.; Zhao, L.; Du, S.; Li, S.; Ma, F.; Guo, H. Combined physiological, metabolomic and response surface approaches to analyze copper stress resistance mechanisms and repair potential of Epipremnum aureum. Sci. Hortic. 2024, 338, 113642. [Google Scholar] [CrossRef]
  36. Savitzky, A.; Golay, M.J. Smoothing and differentiation of data by simplified least squares procedures. Anal. Chem. 1964, 36, 1627–1639. [Google Scholar] [CrossRef]
  37. Putri, I. The application of NIRS method for non-destructive measurement of fat and carbohydrates in pumpkin seeds. In IOP Conference Series: Earth and Environmental Science; IOP Publishing: Bristol, UK, 2021; Volume 922, p. 012024. [Google Scholar]
  38. Geladi, P.; MacDougall, D.; Martens, H. Linearization and scatter-correction for near-infrared reflectance spectra of meat. Appl. Spectrosc. 1985, 39, 491–500. [Google Scholar] [CrossRef]
  39. Ding, Y.; Yan, Y.; Li, J.; Chen, X.; Jiang, H. Classification of tea quality levels using near-infrared spectroscopy based on CLPSO-SVM. Foods 2022, 11, 1658. [Google Scholar] [CrossRef]
  40. Huang, H.; Huang, S.; Du, Q. Evaluation of soil heavy metal pollution based on K-means and SVM. Int. J. Environ. Sci. Technol. 2023, 20, 12015–12024. [Google Scholar] [CrossRef]
  41. Hong, S.; Xu, Y.; Khare, A.; Priambada, S.; Maher, K.; Aljiffry, A.; Sun, J.; Tumanov, A. Holmes: Health online model ensemble serving for deep learning models in intensive care units. In Proceedings of the 26th ACM SIGKDD International Conference on Knowledge Discovery & Data Mining, Virtual Event, 6–10 July 2020; ACM: San Francisco, CA, USA, 2020; pp. 1614–1624. [Google Scholar]
  42. Krizhevsky, A.; Sutskever, I.; Hinton, G.E. ImageNet classification with deep convolutional neural networks. Commun. ACM 2017, 60, 84–90. [Google Scholar] [CrossRef]
  43. He, K.; Zhang, X.; Ren, S.; Sun, J. Deep residual learning for image recognition. In Proceedings of the IEEE conference on computer vision and pattern recognition, Las Vegas, NV, USA, 27–30 June 2016; pp. 770–778. [Google Scholar]
  44. Xie, S.; Girshick, R.; Dollár, P.; Tu, Z.; He, K. Aggregated residual transformations for deep neural networks. In Proceedings of the IEEE conference on computer vision and pattern recognition, Honolulu, HI, USA, 21–26 July 2017; pp. 1492–1500. [Google Scholar]
  45. Radosavovic, I.; Kosaraju, R.P.; Girshick, R.; He, K.; Dollár, P. Designing network design spaces. In Proceedings of the IEEE/CVF conference on computer vision and pattern recognition, Seattle, WA, USA, 13–19 June 2020; pp. 10428–10436. [Google Scholar]
  46. Jolliffe, I. A 50-year personal journey through time with principal component analysis. J. Multivar. Anal. 2022, 188, 104820. [Google Scholar] [CrossRef]
  47. Kingma, D.P. Adam: A method for stochastic optimization. arXiv 2014, arXiv:1412.6980. [Google Scholar] [CrossRef]
  48. Cao, Y.; Sun, J.; Yao, K.; Xu, M.; Tang, N.; Zhou, X. Nondestructive detection of lead content in oilseed rape leaves based on MRF-HHO-SVR and hyperspectral technology. J. Food Process Eng. 2021, 44, e13793. [Google Scholar] [CrossRef]
  49. Fu, L.; Sun, J.; Wang, S.; Xu, M.; Yao, K.; Zhou, X. Nondestructive evaluation of Zn content in rape leaves using MSSAE and hyperspectral imaging. Spectrochim. Acta Part A Mol. Biomol. Spectrosc. 2022, 281, 121641. [Google Scholar] [CrossRef] [PubMed]
  50. Selvaraju, R.R.; Cogswell, M.; Das, A.; Vedantam, R.; Parikh, D.; Batra, D. Grad-CAM: Visual explanations from deep networks via gradient-based localization. Int. J. Comput. Vis. 2020, 128, 336–359. [Google Scholar] [CrossRef]
  51. Li, J.; Luo, W.; Han, L.; Cai, Z.; Guo, Z. Two-wavelength image detection of early decayed oranges by coupling spectral classification with image processing. J. Food Compos. Anal. 2022, 111, 104642. [Google Scholar] [CrossRef]
  52. Qiu, G.; Lu, H.; Wang, X.; Wang, C.; Xu, S.; Liang, X.; Fan, C. Nondestructive detecting maturity of pineapples based on visible and near-infrared transmittance spectroscopy coupled with machine learning methodologies. Horticulturae 2023, 9, 889. [Google Scholar] [CrossRef]
  53. Jun, S.; Xin, Z.; Xiaohong, W.; Bing, L.; Chunxia, D.; Jifeng, S. Research and analysis of cadmium residue in tomato leaves based on WT-LSSVR and Vis-NIR hyperspectral imaging. Spectrochim. Acta Part A 2019, 212, 215–221. [Google Scholar] [CrossRef]
  54. Zhou, X.; Sun, J.; Zhang, Y.; Tian, Y.; Yao, K.; Xu, M. Visualization of heavy metal cadmium in lettuce leaves based on wavelet support vector machine regression model and visible-near infrared hyperspectral imaging. J. Food Process Eng. 2021, 44, e13897. [Google Scholar] [CrossRef]
  55. Ding, Y.; Zeng, R.; Jiang, H.; Guan, X.; Jiang, Q.; Song, Z. Classification of tea quality grades based on hyperspectral imaging spatial information and optimization models. J. Food Meas. Charact. 2024, 18, 9098–9112. [Google Scholar] [CrossRef]
Figure 1. Structure of the VIS-NIR HSI system.
Horticulturae 11 00840 g001
Figure 2. Dimensionality reduction and feature extraction of hyperspectral images based on PCA.
Horticulturae 11 00840 g002
Figure 3. Construction of false-color images and exploration of PC mapping strategies. Here, n PCs refers to the number of PCs employed for color mapping.
Horticulturae 11 00840 g003
Figure 4. Analysis results of oilseed rape leaves under different levels of Cu stress. (a) Average Cu content. (b) Average reflectance curve.
Horticulturae 11 00840 g004
Figure 5. (a) Raw reflectance spectra of Cu-stressed oilseed rape, and preprocessing results with (b) SG, (c) MSC, and (d) SG-GD-MSC.
Horticulturae 11 00840 g005
Figure 6. Comparison of image classification performance of residual networks on the preliminary datasets.
Horticulturae 11 00840 g006
Figure 7. Confusion matrices of the D f 3 test set. (a) ResNet-50. (b) ResNeXt-50 (32 × 4d). (c) RegNetX-6.4GF.
Horticulturae 11 00840 g007
Figure 8. Feature visualization of visible-light and false-color images across three types of residual networks. Here, vis denotes visible-light images, and the selected sample corresponds to an oilseed rape leaf under severe Cu stress.
Horticulturae 11 00840 g008
Table 1. Comparison of classification performance between SVM and B1DCNN on 1D spectral sequences.
Preprocessing MethodMacro-Precision (%)Macro-Recall (%)Macro-F1 (%)Accuracy (%)
SVMB1DCNNSVMB1DCNNSVMB1DCNNSVMB1DCNN
Raw93.2792.9993.3693.0793.2893.0293.3793.14
SG92.1394.2092.1794.2192.1094.2092.1994.32
MSC93.1394.4393.2994.3493.2094.3893.2594.44
SG-GD-MSC93.3595.2293.4995.0893.4195.1393.4995.15
Table 2. Comparison of the classification performance of residual networks on 1D spectral sequences.
1D ModelPreprocessingMacro-Precision (%)Macro-Recall (%)Macro-F1 (%)Accuracy (%)
ResNet-50Raw95.5095.4995.4995.51
SG95.7095.6895.6595.63
MSC95.7695.8695.7895.74
SG-GD-MSC96.1396.1296.1296.10
ResNeXt-50 (32 × 4d)Raw95.9196.0095.9395.98
SG96.1496.1096.1096.10
MSC96.1296.1896.1496.22
SG-GD-MSC96.3696.3396.3496.34
RegNetX-6.4GFRaw96.4596.5196.4796.45
SG96.5996.6496.6096.57
MSC96.4796.5396.4996.57
SG-GD-MSC96.6996.7396.7096.69
Table 3. Comparison of classification performance of residual networks on the D f 3 .
ModelMacro-Precision (%)Macro-Recall (%)Macro-F1 (%)Accuracy (%)
ResNet-5096.8396.7696.7796.76
ResNeXt-50 (32 × 4d)97.2697.2297.2397.22
RegNetX-6.4GF98.1798.1598.1598.15
Disclaimer/Publisher’s Note: The statements, opinions and data contained in all publications are solely those of the individual author(s) and contributor(s) and not of MDPI and/or the editor(s). MDPI and/or the editor(s) disclaim responsibility for any injury to people or property resulting from any ideas, methods, instructions or products referred to in the content.

