Article

Principal Component Analysis and Cluster Analysis of Hydroponic Adaptation Potential in Different Pakchoi (Brassica campestris ssp. Chinensis) Parent Materials

1
Shanghai Key Laboratory of Protected Horticultural Technology, Horticulture Research Institute, Shanghai Academy of Agricultural Sciences, Shanghai 201403, China
2
Shanghai Agricultural Technology Extension Service Center, Shanghai 201103, China
3
School of Agriculture and Biology, Shanghai Jiao Tong University, Shanghai 200240, China
*
Authors to whom correspondence should be addressed.
These authors contributed equally to this work.
Horticulturae 2025, 11(7), 822; https://doi.org/10.3390/horticulturae11070822
Submission received: 27 May 2025 / Revised: 2 July 2025 / Accepted: 8 July 2025 / Published: 10 July 2025

Abstract

Hydroponics is currently one of the primary methods for soilless cultivation. Although the phenotype and quality of vegetables differ between hydroponic and soil-based systems, limited research has been conducted on the selection and breeding of pakchoi cultivars specifically suited for hydroponics. In this study, principal component analysis (PCA) and cluster analysis were performed on the commercial traits, agronomic characteristics, and nutritional quality of 20 pakchoi parental lines grown under hydroponic conditions to classify and screen suitable germplasm for breeding. PCA reduced the 11 agronomic traits into two independent principal components, accounting for a cumulative contribution of 79.22%. Cluster analysis grouped the 20 parental lines into four categories based on the composite scores of agronomic traits and nutritional quality. Group 3 was selected for breeding programs aiming to develop high-yielding cultivars with a desirable morphology. For breeding targets emphasizing darker leaves and petiole coloration, Group 4 presented the most suitable germplasm. Group 1 was ideal for enhancing nutritional quality by offering parent lines rich in calcium, magnesium, vitamin C, and amino acids. Alternatively, Group 2 contained lines with high levels of soluble proteins, amino acids, and soluble sugars.

1. Introduction

Pakchoi (Brassica campestris ssp. chinensis Makino var. communis Tsen et Lee) is a non-heading cultivar of Chinese cabbage, native to China [1]. Rich in minerals, vitamins, and other health-promoting components, pakchoi is an important vegetable widely consumed in China [2,3]. Traditionally, cultivation and cultivar development have been performed under soil-based conditions. However, with the increasing adoption of hydroponic systems for pakchoi production, it is essential to identify cultivars suitable for hydroponic cultivation. This is due to the significant differences in sensory quality and bioactive compounds between soil-grown and hydroponically grown crops [4]. Additionally, the limited buffering capacity of hydroponic root zones compared to soil may render soil-optimized cultivars unsuitable for hydroponics [5]. Therefore, selection and breeding of pakchoi cultivars specifically adapted to hydroponic systems is necessary.
Yield is typically the primary concern for horticultural crop producers, whereas appearance is the main attribute considered by consumers when purchasing these crops [6]. Pakchoi cultivars exhibit considerable variation in horticultural traits such as leaf shape, size, intensity of green coloration, petiole color, shape and length, upright growth, and degree of girdling, which can reflect regional market demands and consumer preferences [7]. Both yield and morphology in pakchoi are quantitative traits influenced by environmental factors, leading to variability among different cultivars [8]. A certain degree of correlation exists between morphological traits and yield in leafy vegetables [9]. Correlation analysis identified plant height, crown width, leaf length, and leaf width as the key morphological indicators associated with yield in pakchoi [10].
New consumer demands have emerged alongside the growing pursuit of healthier diets [11,12]. Currently, investigations of pakchoi quality primarily focus on parameters such as soluble sugars, soluble proteins, vitamin C, amino acids, nitrate content, and other related indicators [13,14]. Zhu [15] reported that six hydroponic pakchoi germplasm resources were rich in mineral elements and amino acids, with considerable variation among cultivars, suggesting their potential for development and utilization based on nutrient content. Forty-six non-heading Chinese cabbage cultivars were evaluated across four seasons and then compared and screened for nitrate content; we discovered that nitrate levels were not only influenced by environmental factors but were also stably inherited through genotype [16]. Therefore, the hydroponic cultivation of nutritionally enhanced pakchoi is achievable by selecting superior parental lines [17].
As a multivariate statistical method, principal component analysis (PCA) reduces dimensionality by converting correlated variables into orthogonal principal components, facilitating comprehensive assessment of germplasm resources through simplified data representation [18]. Cluster analysis is a mathematical method that applies multivariate statistical analysis principles to study classification problems, with few subjective factors and objective and scientific classification results [19]. PCA and cluster analysis are commonly used methods for screening superior pakchoi germplasms. Zhao et al. [10] applied PCA to 25 agronomic and nutritional traits of pakchoi and extracted eight principal components that accounted for 87.45% of the total variation. Based on cluster analysis, twenty cultivars were classified into five categories, and two cultivars suitable for large-scale cultivation were identified using a comprehensive membership function. Yin et al. [20] conducted the PCA and cluster analysis on 13 agronomic traits of pakchoi, classifying 25 cultivars from Zhejiang, China, and identifying those with high yield and vigorous growth in autumn and winter. Li et al. [9] adopted PCA and cluster analysis to assess and rank the drought resistance of 50 pakchoi cultivars, selecting 5 cultivars with strong drought tolerance. In addition to pakchoi, PCA and cluster analysis are also widely utilized for elite germplasm screening in various other crops, such as pepper [21], tomato [22], pea [23], blueberry [24], and strawberry [6], etc.
In this study, twenty parent materials were selected for the hydroponic adaptability evaluation. PCA and cluster analysis were employed to classify these materials, aiming to identify those suitable for hydroponic cultivation and support subsequent seed production. This study also provides a methodological reference for selecting leafy vegetable cultivars adapted to hydroponic systems.

2. Materials and Methods

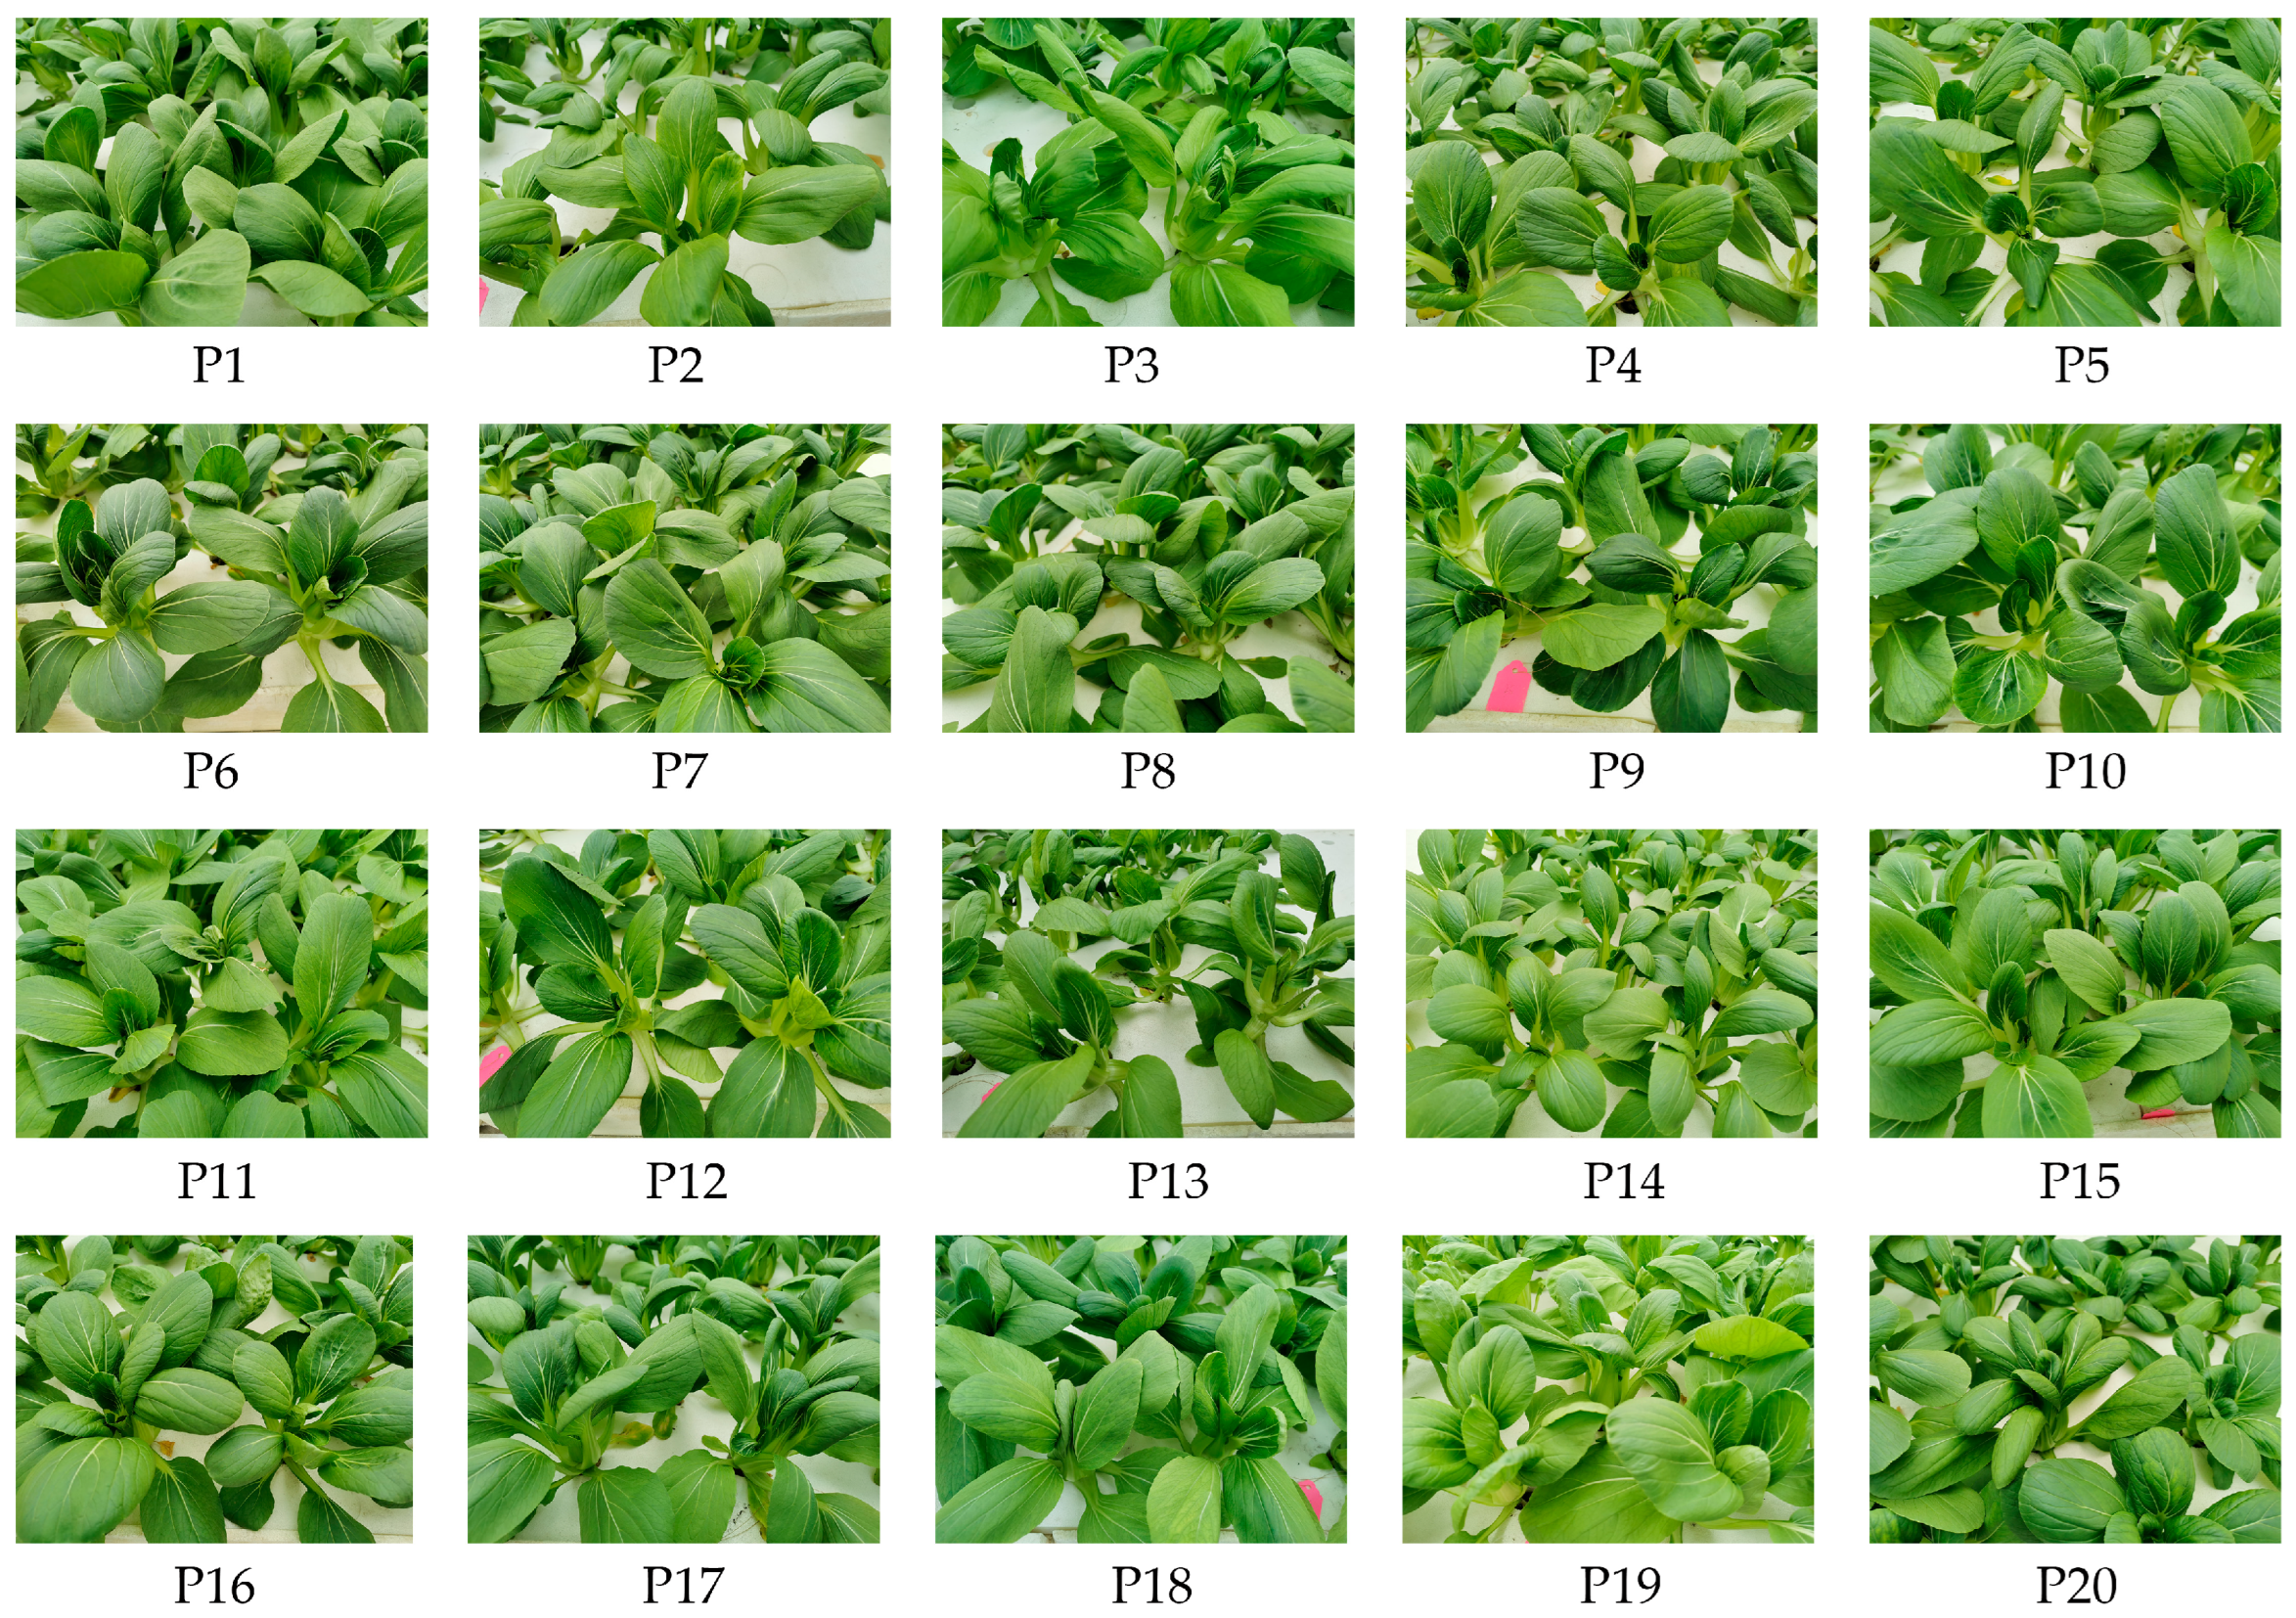
2.1. Plant Materials and Growth Environment

Twenty pakchoi parent materials were provided by the Horticulture Research Institute, Shanghai Academy of Agricultural Sciences, which are represented as P1, P2, …, P20. Cultivation was conducted in a plastic film greenhouse located at the Zhuanghang Experimental Station, Fengxian District, Shanghai (120°23′5.19′′ S; 30°53′21.03′′ W). The seeds were sown into moistened nursery sponges (Beijing Zhongxin Zhiyun Technology Co., Ltd., Beijing, China, 25 mm × 25 mm) and placed under a shade net, which were removed once the cotyledons had fully expanded. Forty-two seedlings (with two fully expanded true leaves) from each cultivar were randomly selected and evenly divided into three groups, each planted on a separate nutrient film technique (NFT) culture bed (Figure 1). The three cultivation beds were constructed with identical structural specifications and maintained under consistent cultivation management protocols. During the experiment, the average greenhouse temperature and relative humidity were 25.1 °C and 77.5%, respectively. The plants were grown under natural sunlight filtered through plastic film with a daily photoperiod of approximately 12 h. The nutrient solution irrigation and pause intervals were set at 10 and 20 min, respectively. The electrical conductivity (EC) and pH of the nutrient solution were maintained at approximately 2 mS·cm−1 and pH 6. The nutrient solution composition is shown in Table 1. All fertilizers used in the experiment were provided by Shanghai Yongtong Ecological Engineering Co., Ltd., Shanghai, China.

2.2. Agronomic Characteristic Measurement

The morphological and growth parameters of pakchoi were measured on the 30th day after transplanting. Three phenotypically uniform plants were randomly sampled from each cultivation bed (biological replicate), totaling nine plants per parental line for measurement. The following traits were recorded: plant height, crown diameter, length and width of the largest leaf (excluding the petiole), petiole length and weight, upper and lower petiole width, shoot fresh mass, shoot dry mass, root fresh mass, and root dry mass. The following indices were also calculated: petiole-to-shoot weight ratio = (petiole weight/shoot fresh mass) × 100%; root-to-shoot ratio = (root dry mass/shoot dry mass) × 100%; shoot dry matter rate = (shoot dry mass/shoot fresh mass) × 100%; projected petiole area = (upper width of petiole + lower width of petiole) × petiole length/2; and product of maximum leaf length and width.
Visual assessment was used to assign scores to the non-quantifiable commercial traits. The scoring criteria for interveinal chlorosis, internode compactness, leaf shape, leaf color, blade flatness, petiole shape, petiole color, girdling, and overall impression are presented in Table 2.

2.3. Nutrition Content

From each cultivation bed, six median leaves were randomly collected, pooled, homogenized using a liquid nitrogen grinder, and stored at −80 °C for subsequent nutritional quality analysis, with three independent replicates processed per cultivar. All chemical reagents used in the experiment were supplied by Sinopharm Chemical Reagent Co., Ltd., Shanghai, China.
The soluble protein, amino acid, and soluble sugar contents were determined by measuring the absorbance of the sample extracts using a UV spectrophotometer (Shimadzu Corporation, Kyoto, Japan) after reactions with Coomassie Brilliant Blue, ninhydrin, and anthrone at wavelengths of 595, 570, and 630 nm [25].
The total ascorbic acid content was determined using the method described by Pelletier [26], which involves the oxidation of ascorbic acid by 2,6-dichlorophenolindophenol (DCPIP), followed by the reaction of 2,4-dinitrophenylhydrazine (DNPH) with the ketonic groups of dehydroascorbic acid. The resulting yellow or orange coloration under acidic conditions served as the basis for quantification.
The cellulose content was determined using the anthrone colorimetric method [27]. Briefly, the cell wall was extracted using ethanol and acetone, followed by drying, dissolution, and homogenization. The samples were then reacted with concentrated sulfuric acid and anthrone to produce color. The absorbance was measured at 620 nm using a UV spectrophotometer, and the cellulose content was calculated accordingly.
Titratable acidity was determined using the official AOAC method (1984) [28]. In brief, 10 mL of juice was titrated with 0.1 mol·L−1 sodium hydroxide to a pH endpoint of 8.1, while the pH was monitored using a calibrated pH meter. The volume of sodium hydroxide consumed was recorded for calculation.
The sugar–acid ratio is the ratio of soluble sugar content to titratable acid content.
The contents of phosphorus (P), potassium (K), calcium (Ca), magnesium (Mg), and sodium (Na) were determined by dry ashing followed by acid digestion and analysis using atomic absorption spectroscopy. The ashing was conducted in a muffle furnace (Taisite Instrument Co., Ltd., Tianjin, China), and elemental detection was performed using an ICP-OES 5110 spectrometer (Agilent Technologies Co., Ltd, Santa Clara, CA, USA).

2.4. Statistical Analysis

Excel 2013 (Microsoft, Redmond, WA, USA) and IBM SPSS Statistics 22 (IBM Corporation, New York, NY, USA) were used to calculate the coefficient of variation and genetic diversity index and perform PCA and cluster analysis. Clustering was conducted with Ward’s method. Correlation analysis charts and heat maps were generated using Origin 2024 (OriginLab Corporation, Northampton, MA, USA).
Genetic diversity index = −∑ Pi × ln Pi
where Pi is the relative abundance of level i in the characteristic. The grading standards were based on Hong’s method [21].
Coefficient of variation = (standard deviation/mean value) × 100%

3. Results

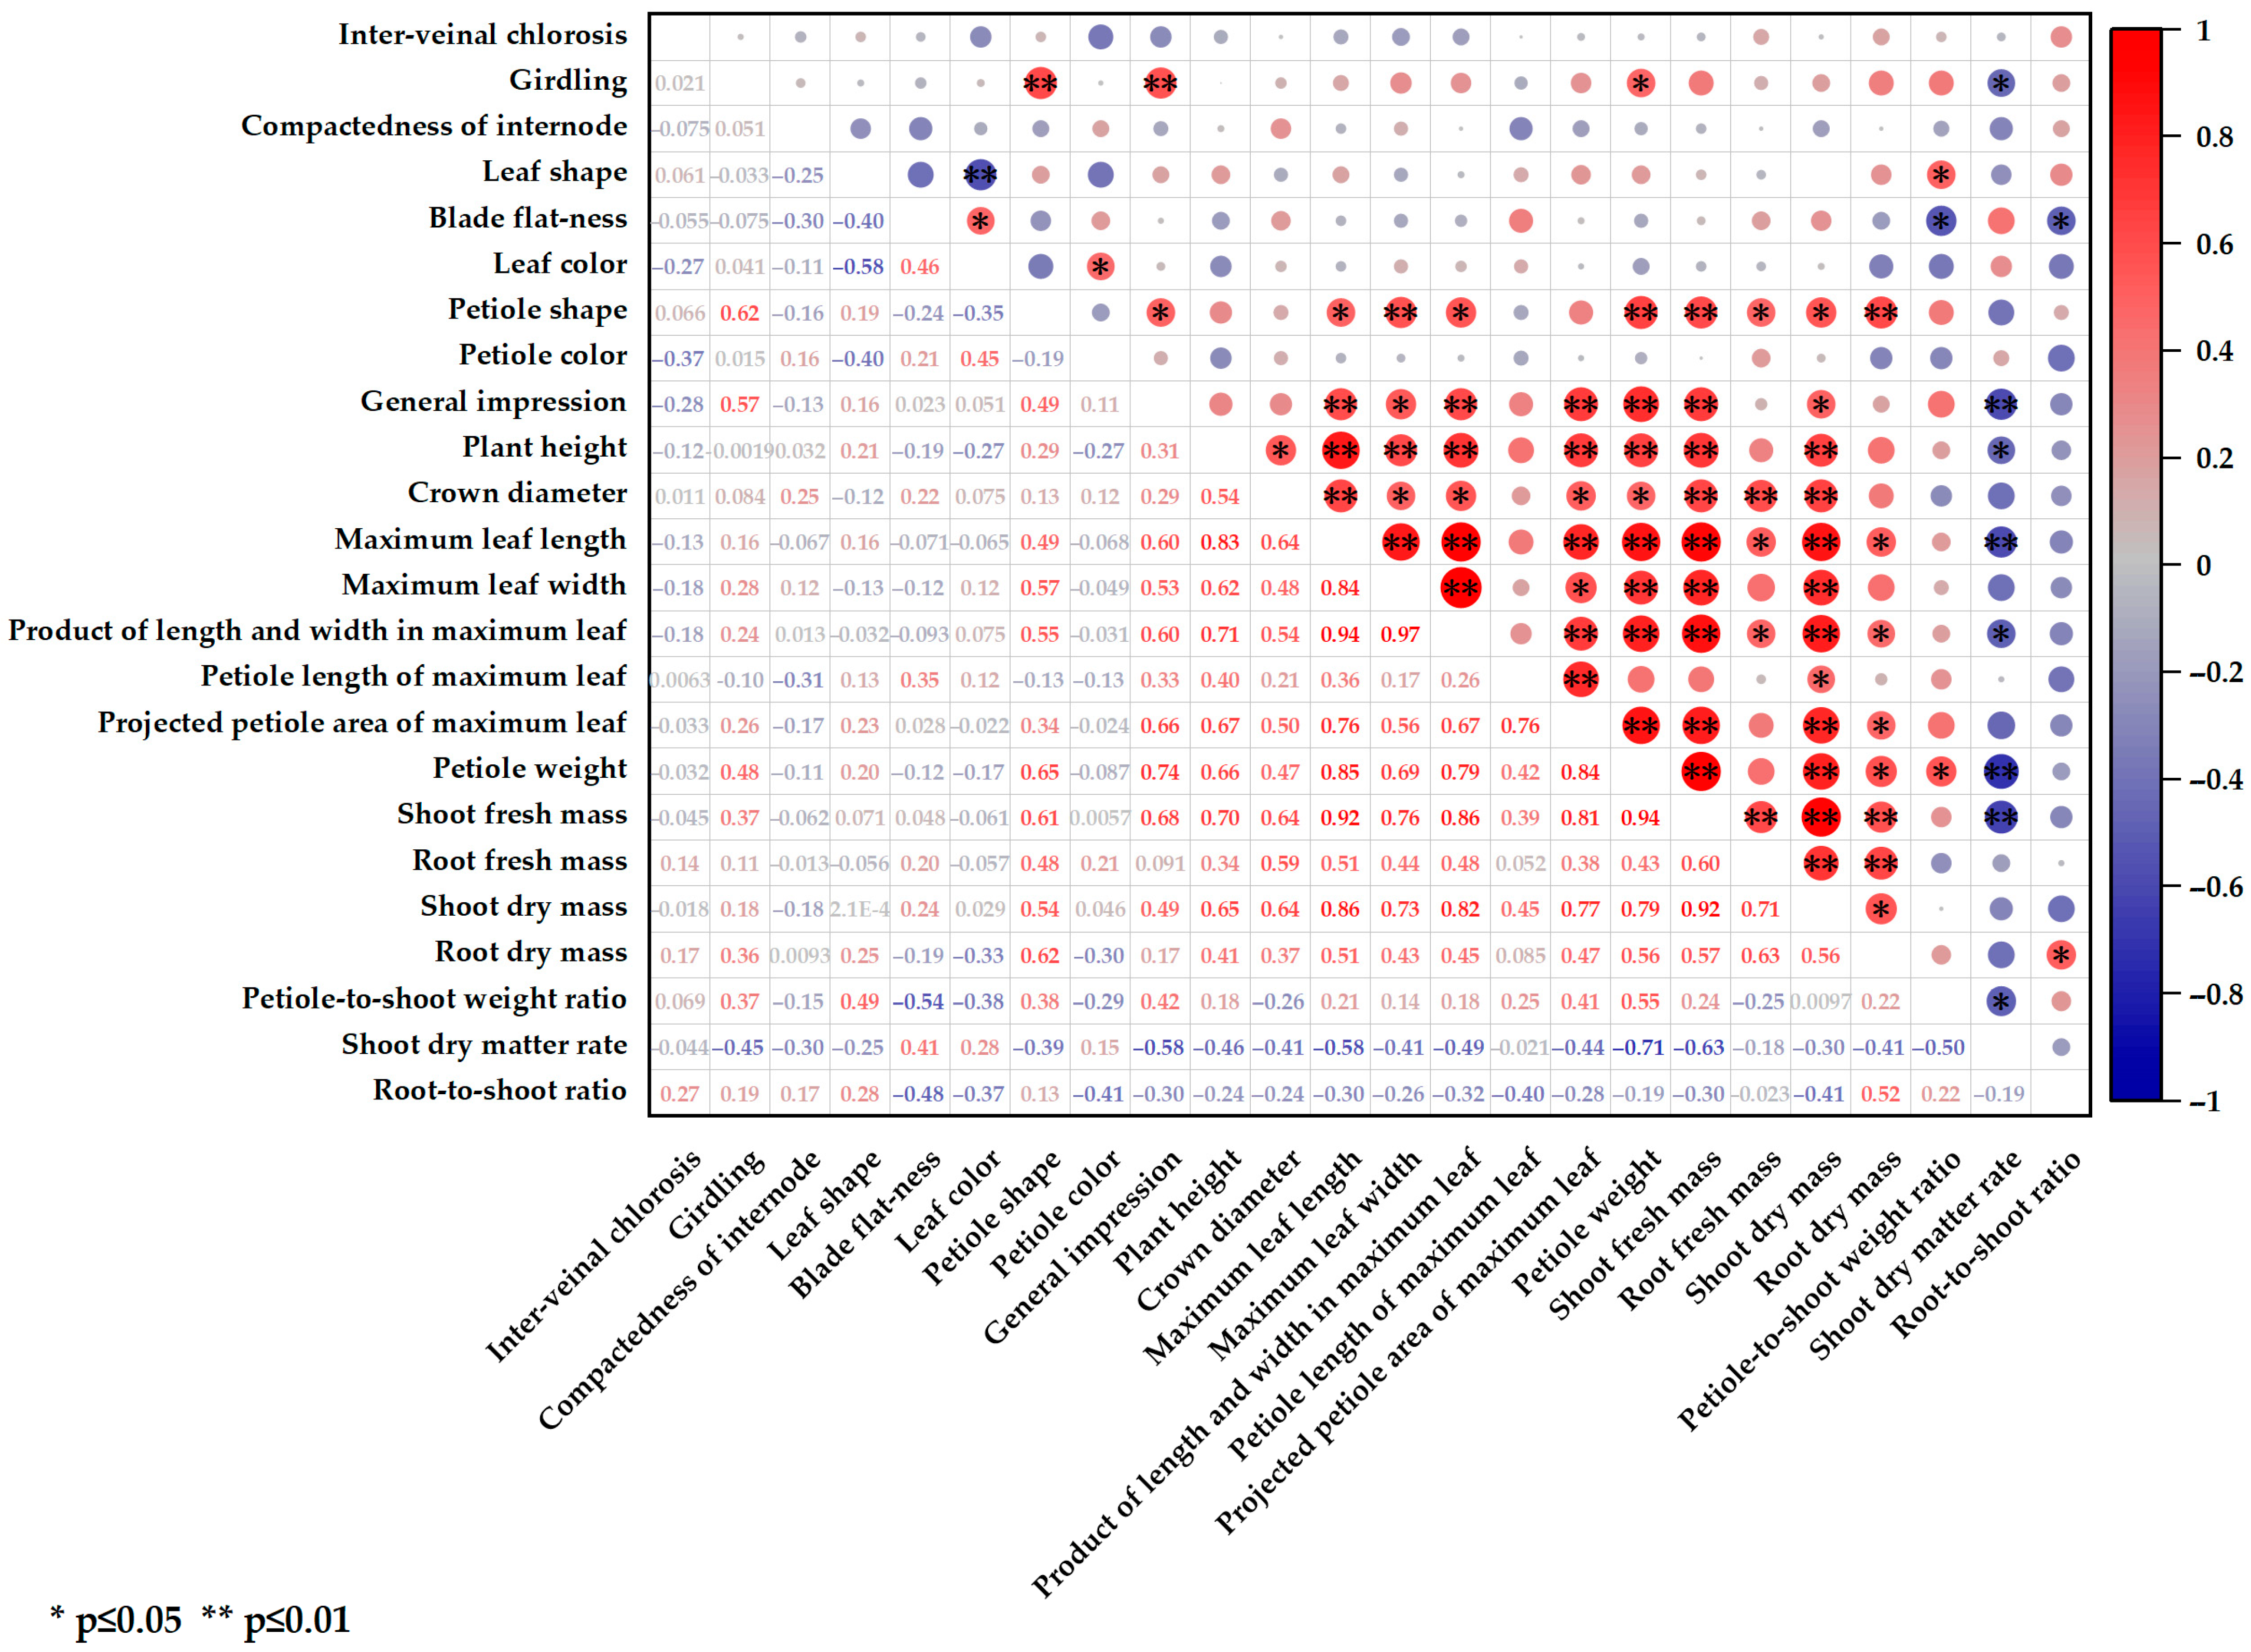
3.1. Agronomic Characteristics

The measurable agronomic characteristics of the 20 pakchoi parent materials are presented in Table 3. The coefficient of variation for the 15 agronomic traits ranged from 8.27% to 31.84%, with root fresh weight exhibiting the highest variability, indicating substantial differences among the materials in root development. P10 and P17 had the largest (2.34 g) and smallest (0.69 g) root fresh weights, respectively. The petiole-to-shoot weight ratio had the lowest coefficient of variation, at 8.27%. The genetic diversity index ranged from 1.54 to 1.89. The leaf and petiole areas, both representing the total leaf surface, had the highest genetic diversity indices. P19 had the largest values for both leaf and petiole areas, as well as the highest shoot fresh mass. Additionally, P1, P6, P8, P10, P11, P15, and P18 exhibited high biomass, with shoot fresh mass exceeding 40 g. Plant width had the lowest genetic diversity index, although it was still above 1.5. These results indicated notable differences in agronomic traits and high genetic diversity among parent materials, providing valuable resources for breeding pakchoi cultivars suitable for hydroponic cultivation.
The unmeasurable commodity characteristics of the 20 pakchoi parent materials are listed in Figure 2 and Table 4. None of the materials exhibited severe interveinal chlorosis, and 11 showed no signs of chlorosis. Superior waist girdling and internode compactness were observed in P6, P18, and P19 and in P5 and P13, respectively. The leaf shapes included six ovate, nine oval, and five long elliptical types. Most materials had relatively flat leaves with a green or dark green coloration. The petiole shapes of six materials (P3, P6, P10, P11, P18, and P19) were classified as scoop-shaped, whereas the others were flat-shaped. The petiole color was green for six materials (P6, P7, P8, P9, P12, and P16), with the remainder showing a light green. Among the evaluated materials, P6, P7, P8, P11, P14, P18, and P19 exhibited the favorable overall performance, with P19 exhibiting the most outstanding traits.
A correlation analysis of 15 measurable agronomic traits across 20 pakchoi parent materials was conducted (Figure 3). Eleven traits showed significant or highly significant correlations with the maximum leaf length, product of leaf length and width, petiole weight, and shoot dry mass. The shoot fresh weight as a key trait of interest to growers was significantly positively correlated with several parameters, including plant height, crown diameter, maximum leaf length and width, leaf length–width product, projected petiole area, petiole weight, shoot fresh and dry mass, root dry mass, and shoot dry matter rate. Notably, the correlation coefficients for leaf length, petiole weight, and shoot dry mass exceeded 0.9. In contrast, traits such as petiole length, petiole-to-shoot weight ratio, and root-to-shoot ratio showed weaker correlations with shoot fresh mass and most other agronomic traits.
The correlation analysis between unmeasurable commodity traits and measurable agronomic traits (Figure 3) showed no significant associations between interveinal chlorosis and internode compactness with any other parameter. As a key commercial trait in pakchoi, girdling was more pronounced in parent materials with scoop-shaped petioles, heavier petiole masses, and higher water contents. The leaf shape and blade flatness were correlated with the leaf color and petiole-to-shoot weight ratio. Materials with darker leaves were more likely to exhibit oval-shaped, flatter leaves, whereas those with higher petiole-to-shoot weight ratios tended to have long-elliptical, more wrinkled leaves. Among unmeasurable commercial traits, petiole shape had the strongest correlation with growth indicators, while materials with scoop-shaped petioles generally had higher yields. These findings suggest that selecting materials with scoop-shaped petioles may enhance screening efficiency.

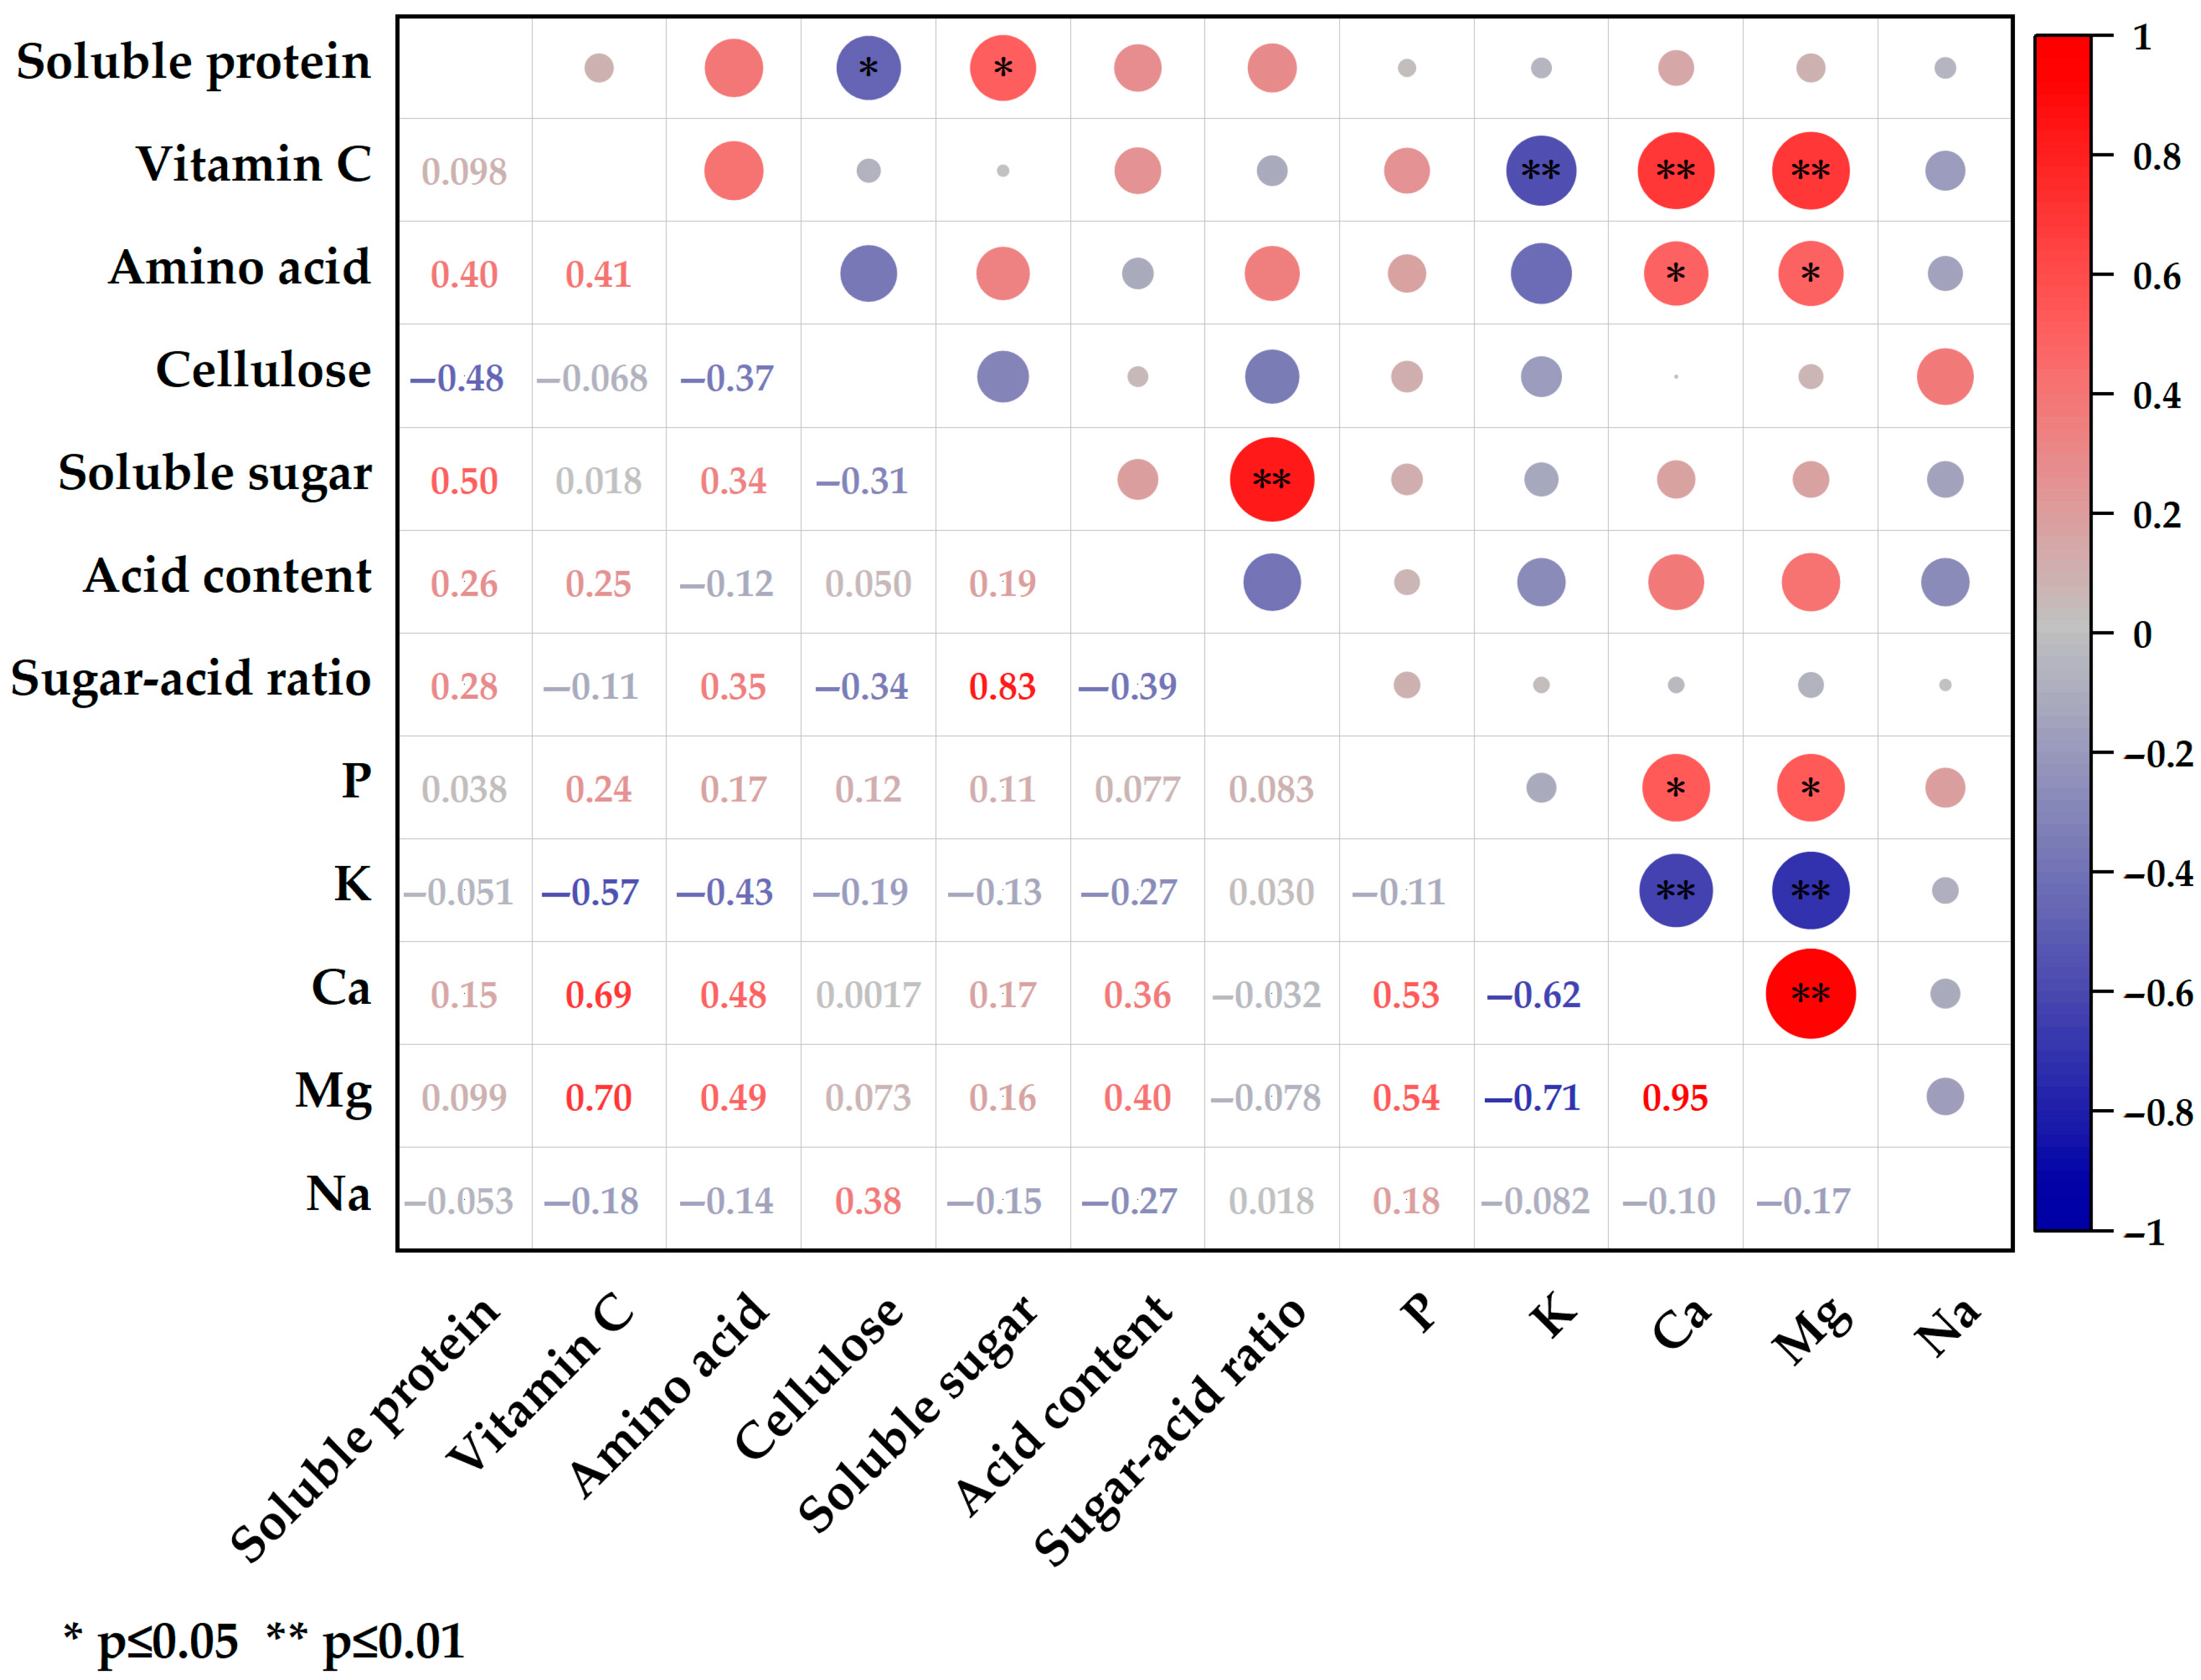
3.2. Nutritional Quality

The content, mean, variation, and genetic diversity of the 12 nutritional quality traits are summarized in Table 5. One-way ANOVA revealed significant differences among parent materials for all nutritional parameters. The highest levels of soluble protein, vitamin C, amino acids, cellulose, soluble sugar, titratable acid, and the sugar–acid ratio were observed in P7, P1, P1, P18, P5, P14, and P5, respectively. Regarding mineral elements, P17 exhibited the highest contents of P, Ca, and Mg, whereas P6 and P11 showed the highest K and Na contents, respectively. The coefficients of variation for the 12 nutritional traits ranged from 8.42% to 24.80%, with amino acids showing the greatest variation, indicating considerable differences among parental materials. Except for Na, the mineral element levels showed a relatively low variation. The genetic diversity index ranged from 1.73 to 2.01, suggesting that the 20 parent materials possessed substantial genetic diversity in terms of nutritional quality. Cellulose had the highest genetic diversity index, whereas soluble sugars had the lowest. The average concentrations of the five mineral elements in pakchoi were ranked as follows: K (67.27 mg·kg−1) > Ca (27.22 mg·kg−1) > Na (6.96 mg·kg−1) > P (6.94 mg·kg−1) > Mg (5.00 mg·kg−1).
The correlation matrix of nutritional quality traits (Figure 4) revealed that soluble protein was negatively correlated with cellulose and positively correlated with soluble sugar. Vitamin C exhibited significant correlations with three mineral elements: a negative correlation with K (r = −0.57, p < 0.01) and positive correlations with Ca (r = 0.69, p < 0.01) and Mg (r = 0.70, p < 0.01). Additionally, the accumulation of Ca and Mg in leaves was positively associated with amino acid content. The sugar–acid ratio was primarily influenced by the soluble sugar content. Among the mineral elements, Ca, Mg, and K were all positively correlated, with an exceptionally high correlation coefficient of 0.949 between Ca and Mg. However, both Ca and Mg were negatively correlated with K content.

3.3. Principal Component Analysis (PCA)

Based on the results of the correlation analysis, 11 agronomic traits with strong interrelationships were selected for PCA. The Kaiser–Meyer–Olkin (KMO) coefficient was 0.751, and Bartlett’s sphericity test yielded a p-value of 0.000, indicating that the correlation matrix was appropriate for PCA. The cumulative variance contribution rate of the first two principal components was 79.22%, capturing the majority of variability among the traits (Table 6). Therefore, these two components were used as comprehensive indices for the evaluation and selection of pakchoi morphology and biomass.
The component matrices for factor analysis are listed in Table 6. The first factor (F1) accounted for 55.775% of the total variance and was associated with all 11 agronomic traits listed in decreasing order of influence. The second factor (F2) was primarily related to shoot dry mass and root dry mass.
The standardized values of the 11 agronomic traits were used to compute the scores of the two principal components. The proportion of each component’s eigenvalue relative to the total was adopted as the weight to calculate the comprehensive evaluation scores for the 20 pakchoi parent materials (Table 7). A higher principal component score indicated a stronger growth potential and higher yield. The top five materials based on comprehensive scores were P19, P1, P18, P6, and P10, suggesting that these genotypes possess superior growth potential and yield performance.

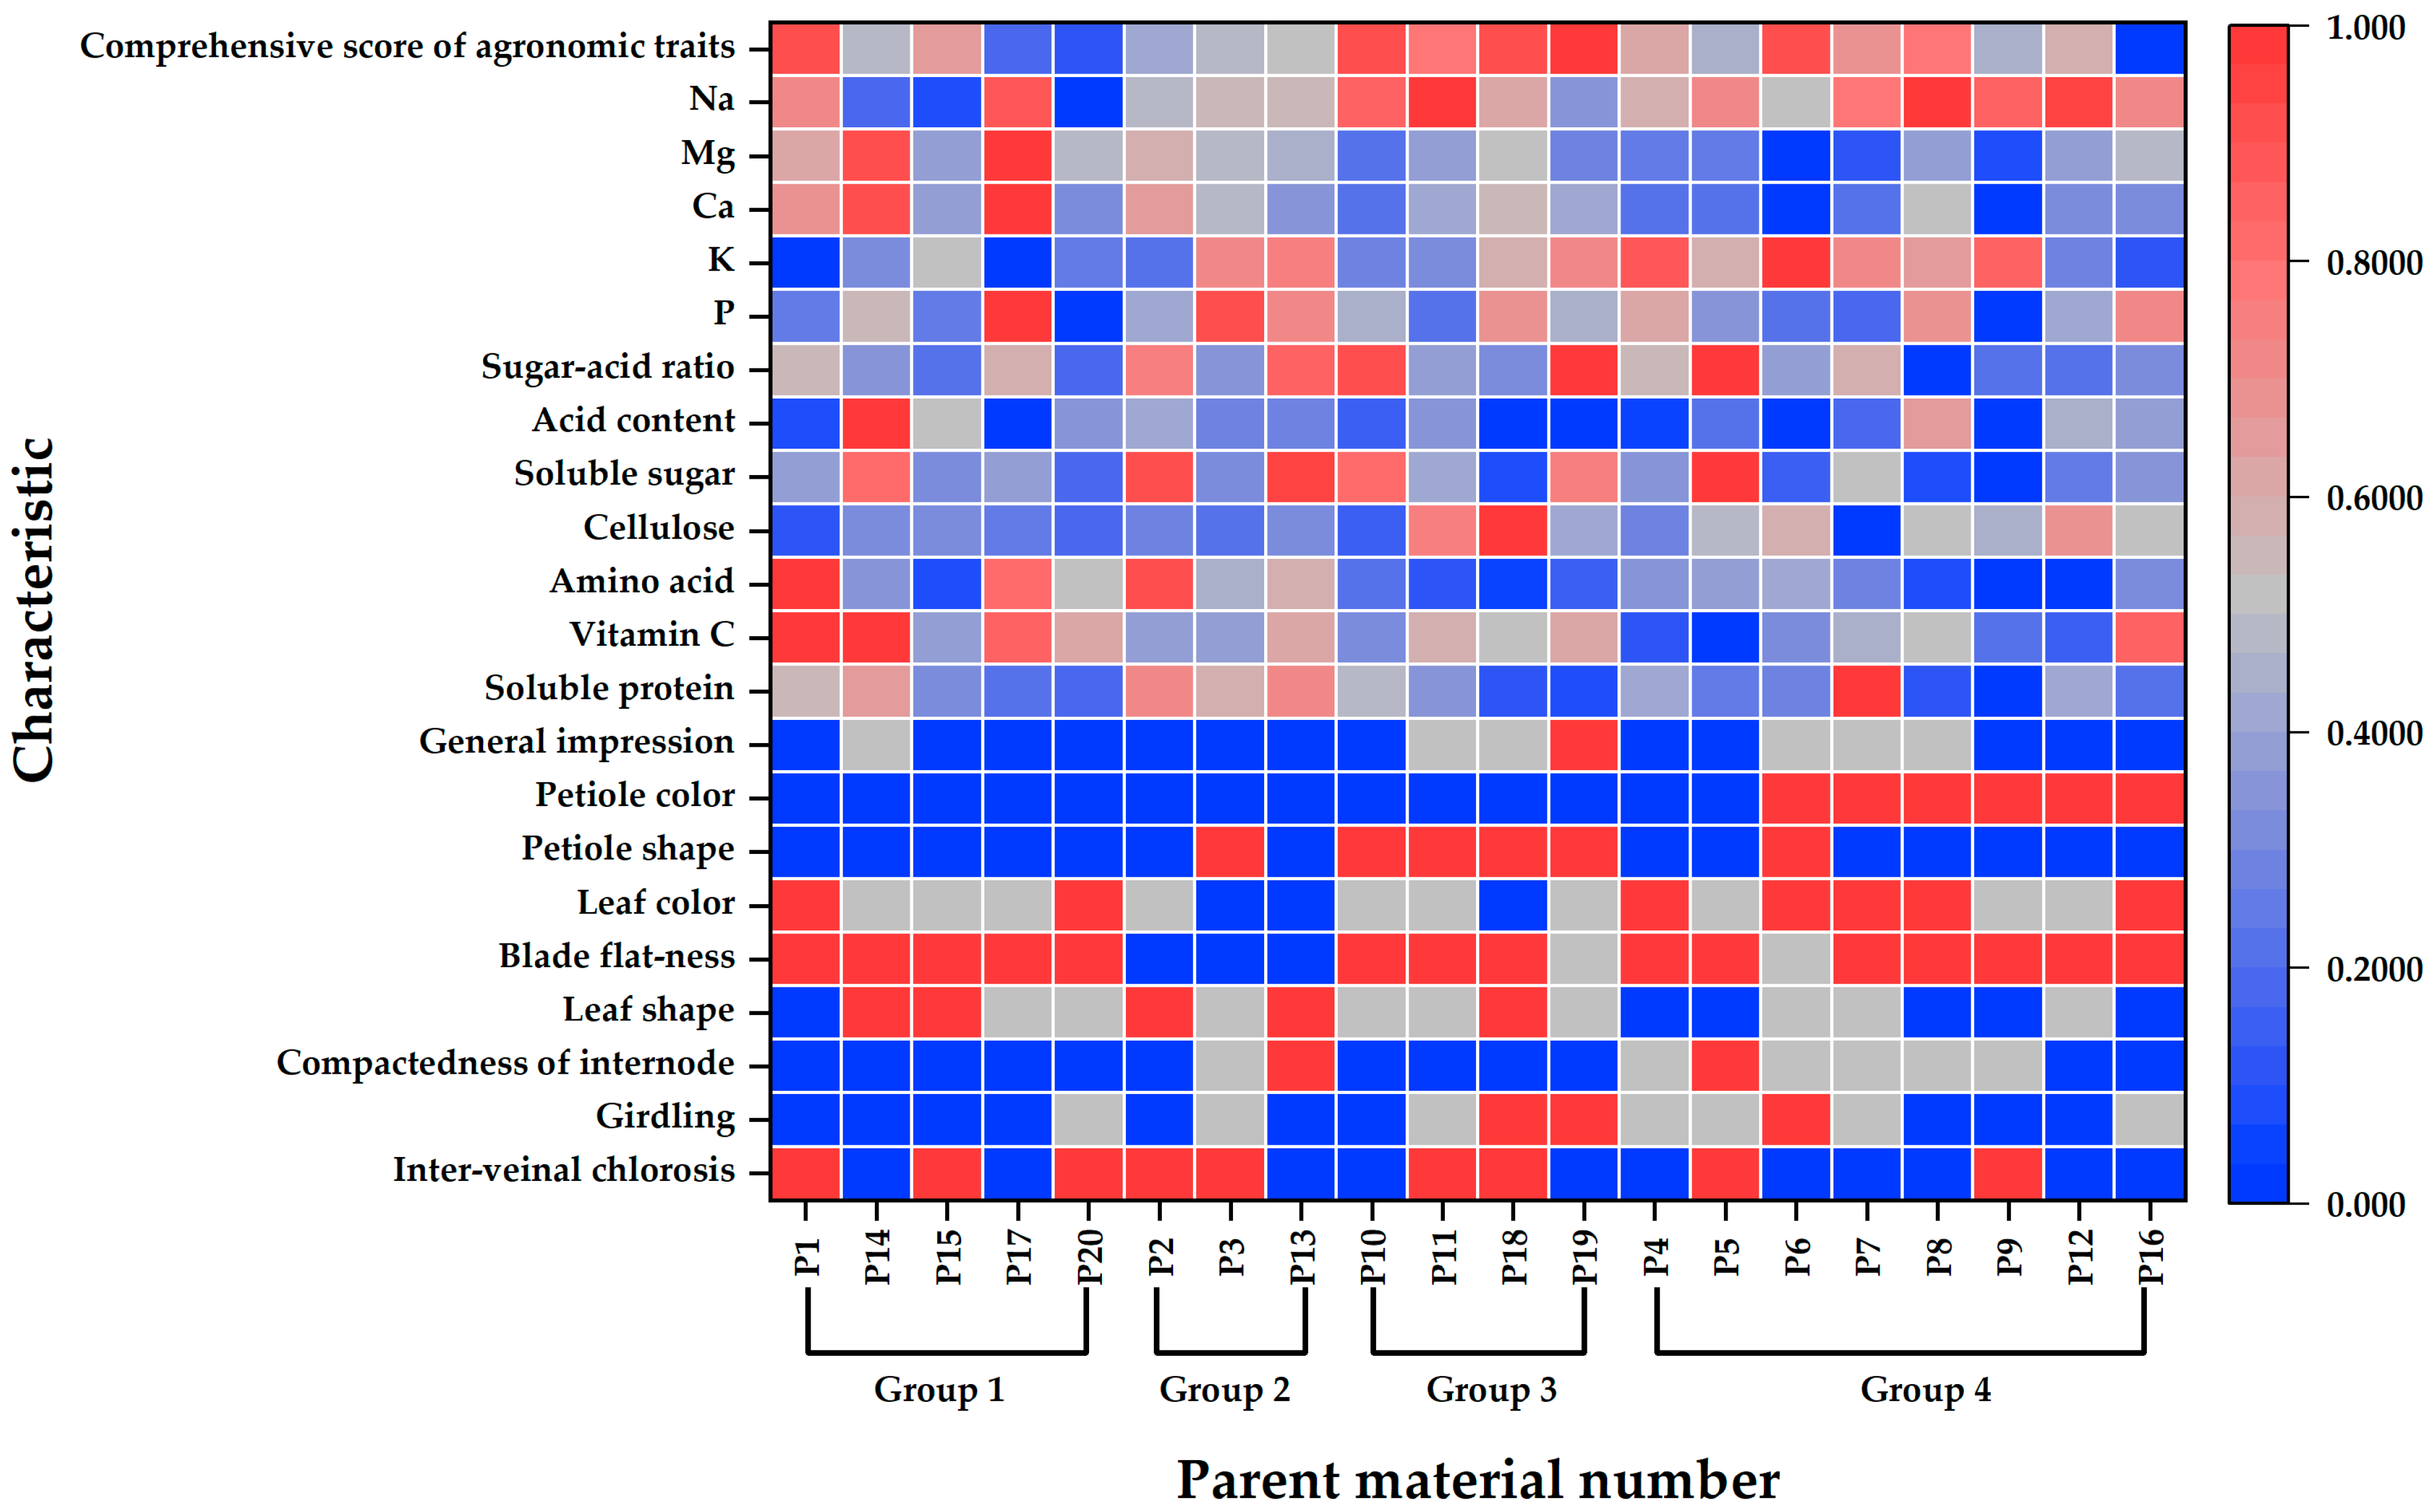
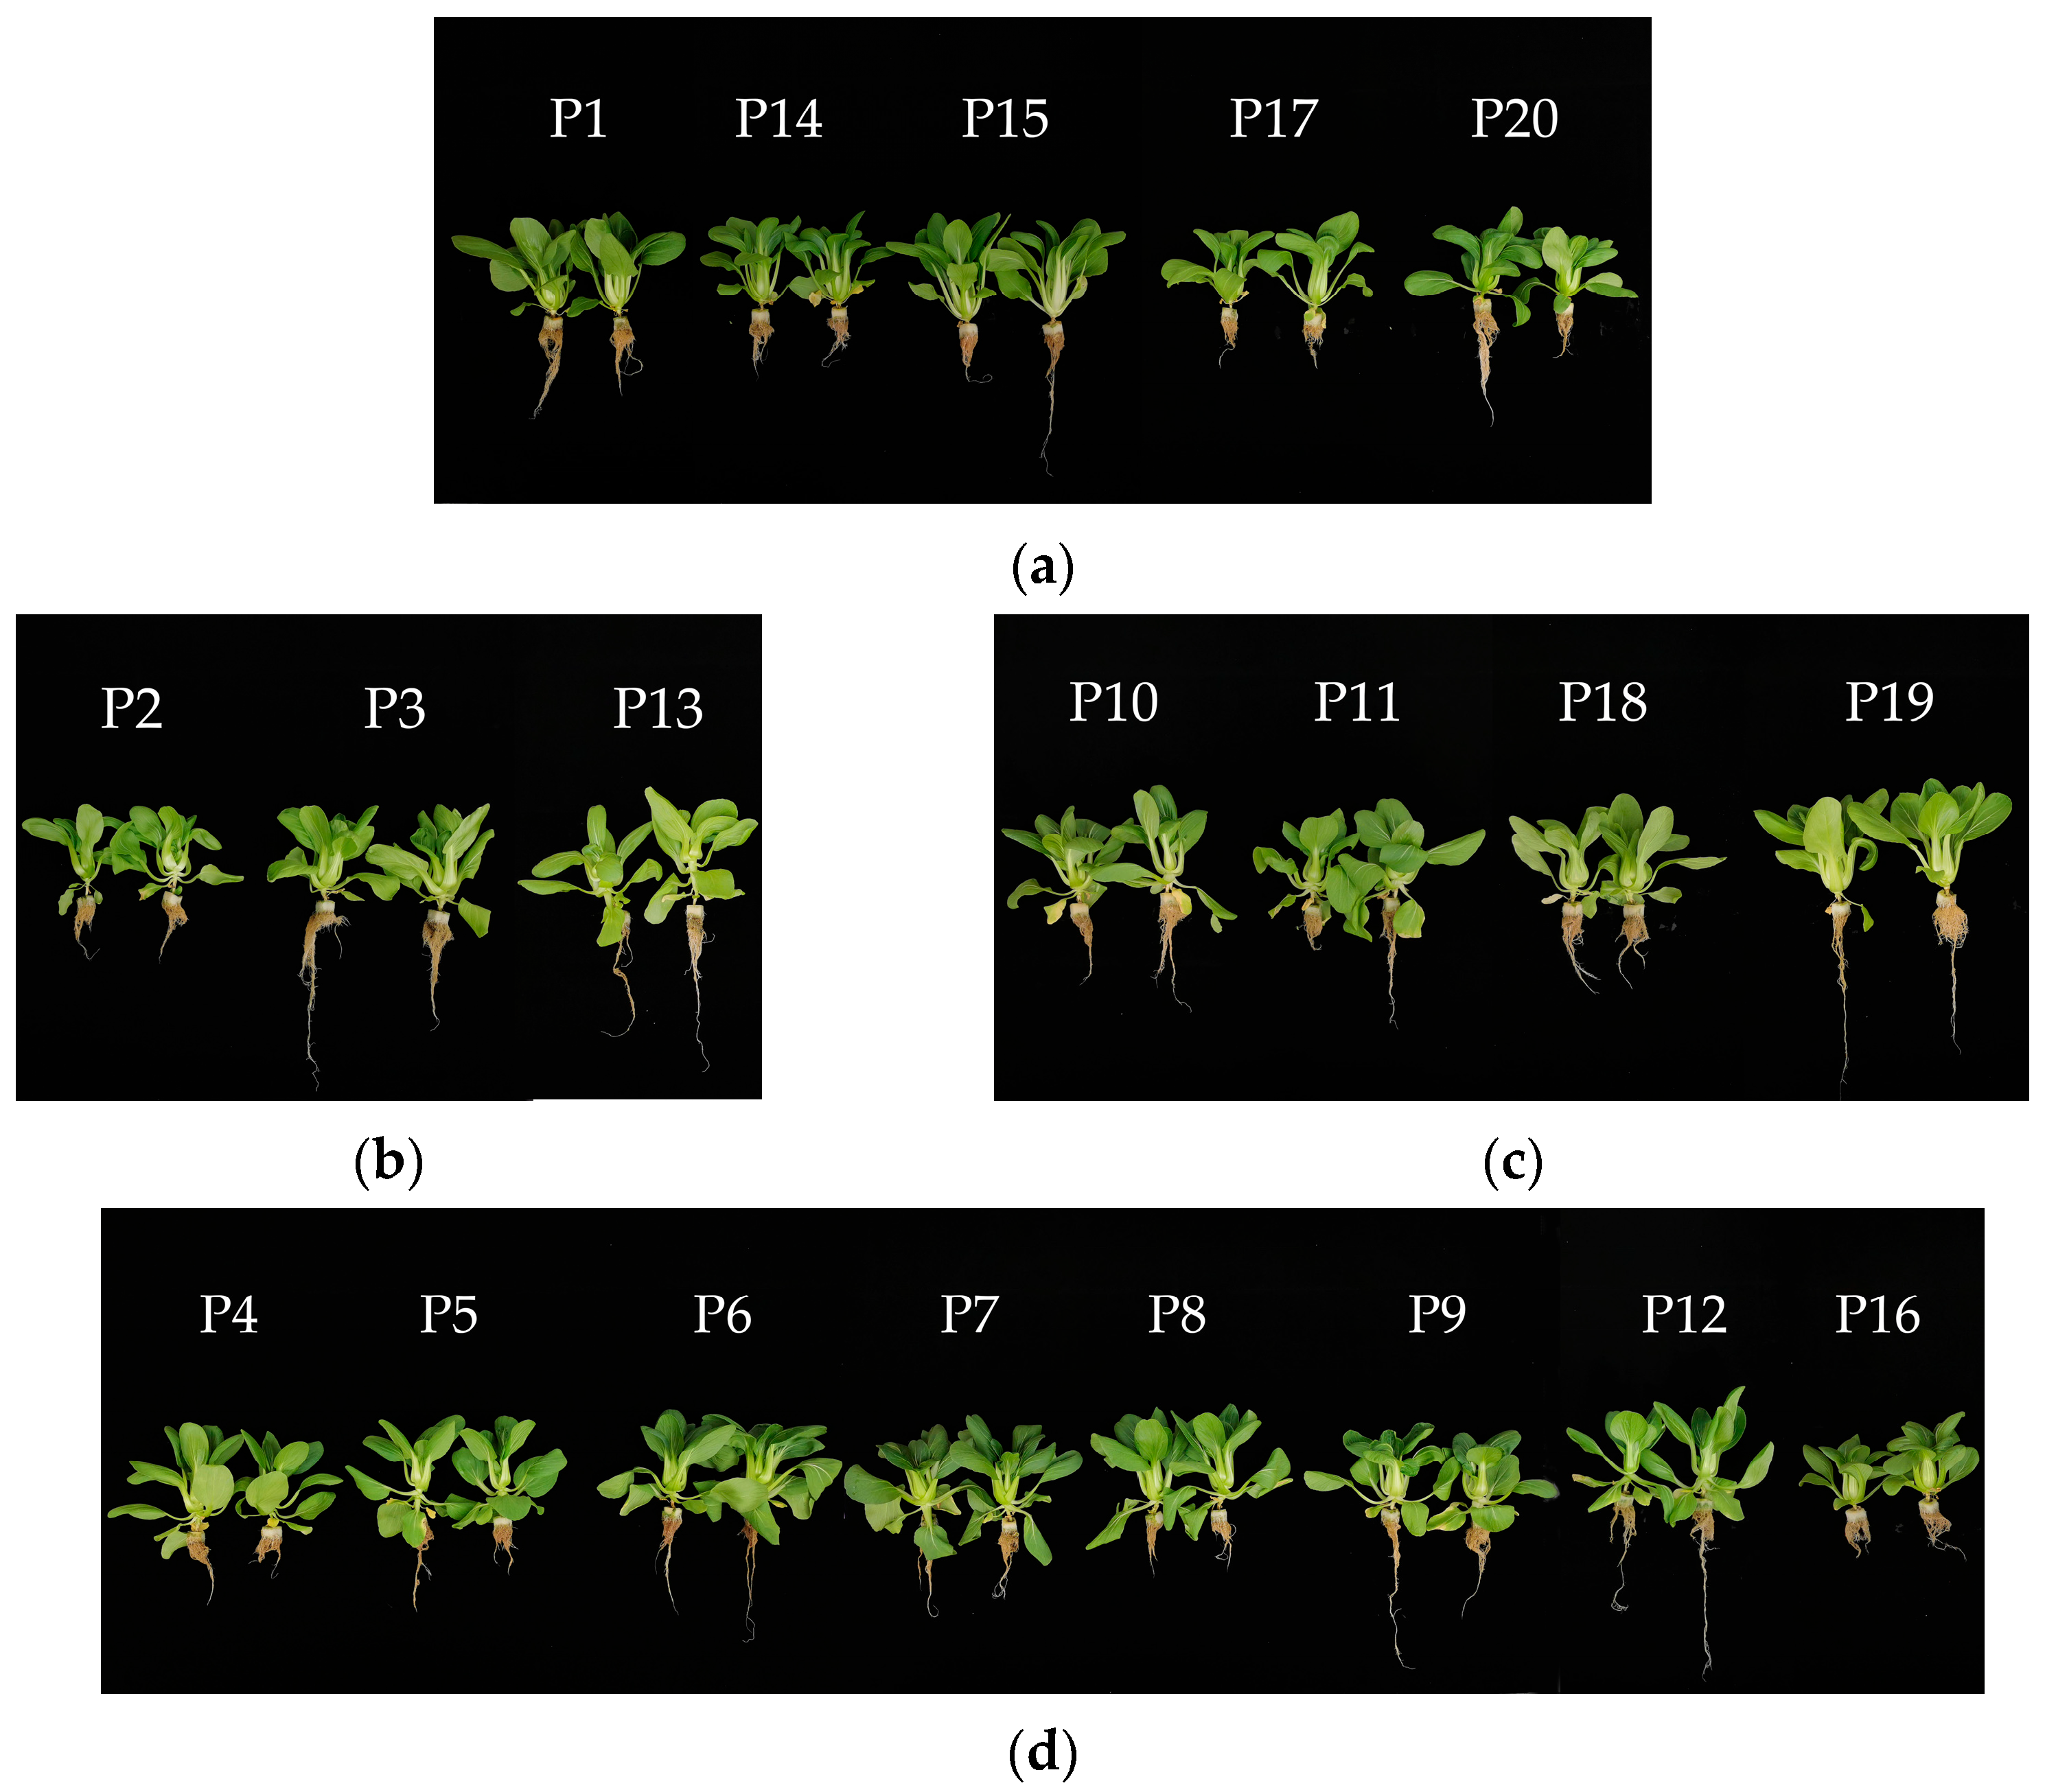
3.4. Cluster Analysis

Standardized data and hierarchical cluster analysis based on unmeasurable commodity traits, nutritional quality, and comprehensive agronomic scores revealed that the 20 pakchoi parent materials could be grouped into four distinct categories at a Euclidean distance of 10 (Figure 5). A heatmap illustrating the key agronomic traits and nutritional quality across the four groups is presented in Figure 6, and representative photographs of each group are shown in Figure 7.
Group 1 comprised five parent materials (P1, P14, P15, P17, and P20), characterized by a high vitamin C content, with an average of 123.86 μg·g−1. These materials exhibited a green or dark green leaf color, white-green petioles, flat leaves, compact internodes, absence of pronounced waist girdling, and flat petioles. Their commercial appearance was generally rated as average. In terms of mineral composition, most materials in this group had relatively high Ca and Mg contents but lower K and Na levels. They also reported elevated levels of vitamin C, amino acids, and titratable acids. Except for P1, the other four materials in this group had relatively low agronomic trait scores.
Group 2 included three parent materials (P2, P3, and P13), characterized by low yield and poor commercial traits but high nutritional quality. The leaves were crumpled, with oval or long oval shapes, green or light green coloration, and light-green petioles. Nutritionally, these materials exhibited high levels of soluble proteins, free amino acids, soluble sugars, and a high sugar–acid ratio.
Group 3 comprised four materials (P10, P11, P18, and P19), characterized by high yield and good commercial quality. These materials exhibited compact internodes, flat leaves, elliptic or long-elliptic leaf shapes, light green or green leaf color, light-green spoon-shaped petioles, and favorable waist girdling, except for P10. In terms of nutritional quality, these materials had moderate levels of mineral elements, low levels of soluble protein and free amino acids, high cellulose content, low acidity, and a relatively high sugar–acid ratio.
Group 4 included eight materials (P4, P5, P6, P7, P8, P9, P12, and P16), characterized by darker leaves and petiole coloration. All materials with green petioles were grouped. Most exhibited jointing with ovate or oval leaves. Nutritionally, this group was defined by high K content and relatively low Ca and Mg levels. In addition, most materials had a high cellulose content but low vitamin C and soluble sugar levels. The yield-related traits within this group exhibit considerable variation.

4. Discussion

4.1. Genetic Diversity and Breeding Potential of Pakchoi Germplasm Resources

With the ongoing development and dissemination of new cultivars, increasing attention has been paid to the conservation and utilization of germplasm resources. Analyzing the genetic diversity of crop germplasms provides a foundation for breeding programs [29]. Commonly used indicators, such as the coefficient of variation and genetic diversity index, are effective for assessing population-level trait diversity [22]. In this study, significant variations were observed in both agronomic traits and nutritional quality among the different pakchoi materials. The coefficients of variation for 13 major agronomic traits and 11 nutritional quality indices exceeded 10%, and the genetic diversity indices for all traits were above 1.5. These findings indicate considerable potential for genetic improvement and suggest that the 20 parental materials offer a rich pool of genetic resources for cross-breeding programs [20].

4.2. Evaluation and Analysis of Agronomic Traits in Pakchoi Germplasm

The evaluation and analysis of agronomic traits are crucial for cultivar identification and effective utilization of germplasm resources [20]. In non-heading Chinese cabbage, different agronomic traits are often interrelated and mutually influential [29]. As the most common cultivation type of non-heading Chinese cabbage, pakchoi also exhibited significant or highly significant correlations among most agronomic traits in this study. Prior to reproductive growth, the primary structural component of pakchoi is the leaf, and leaf-related parameters largely determine overall plant morphology. The results indicated that materials with longer leaves generally presented greater plant height and crown diameter, which was consistent with the findings of Hu et al. [29] and Xie et al. [30]. Many agronomic traits, including plant height, crown diameter, maximum leaf length and width, product of leaf length and width, projected petiole area, petiole weight, shoot fresh mass, shoot dry mass, root dry mass, and shoot dry matter rate, were positively correlated with the shoot fresh weight. Notably, leaf length and petiole weight showed correlation coefficients above 0.9 with shoot fresh weight. Previous studies have also reported strong correlations between these two traits and yield performance [20,31,32]. Therefore, leaf length and petiole weight may serve as effective reference indicators for yield improvement in pakchoi breeding.
Numerous correlations among agronomic traits can provide essential conditions for conducting PCA. Currently, PCA is widely employed as a key method for evaluating product quality and authenticity, while also offering valuable theoretical support for plant breeding programs [24]. In a previous study, PCA was applied to 19 traits of 48 non-heading Chinese cabbage germplasm resources, and the first five principal components accounted for 76.587% of the total variance, capturing most of the trait information [29]. Similarly, Hong et al. [21] simplified 13 primary agronomic traits into four principal components through PCA and ranked 273 capsicum germplasm resources using comprehensive scores derived from these components, thereby successfully identifying elite accessions. In this study, the first two principal components explained 79.219% of the variance in the 12 agronomic traits, indicating that they captured most of the trait-related information and could serve as a comprehensive index for evaluating the agronomic performance of pakchoi parental lines. The total PCA scores of the 20 parental materials ranged from −5.08 to 3.48, with five germplasms of P19, P1, P18, P6, and P10 achieving the highest scores. These accessions may serve as promising high-yield parent materials for breeding.
The evaluation and analysis of morphology and marketability serve as the foundation for cultivar selection and breeding and are also key factors influencing consumer preferences [33]. Breeding objectives for pakchoi commonly emphasize traits such as strong market appeal, bright green petioles, green leaf color, well-defined waist girdling, and glossy appearance [34]. We evaluated the attractiveness of 20 materials to consumers by assigning quantifiable values to unmeasurable commodity characteristics such as color and morphology (Table 4). Given that hydroponically grown plants exhibit reduced root buffering capacity relative to soil-based cultivation, nutrient imbalances can sometimes lead to interveinal chlorosis in leaves [35], with some sensitive varieties being more susceptible. Therefore, selecting cultivars with better resistance is crucial. Fortunately, none of the 20 parent lines exhibited significant interveinal chlorosis. Compact internodes are also a trait favored by consumers. Among the 20 materials, 8 exhibited relatively compact internodes, but no clear correlation was found between this trait and other agronomic characteristics. In recent years, consumer preference for pakchoi cultivars with darker green leaves has increased. In this study, a positive correlation was observed between leaf color and petiole color. Among the 20 materials, P6, P7, P8, P9, P12, and P16 exhibited darker coloration in both leaf blades and petioles. These materials were all clustered into Group 4, suggesting that the materials classified in Group 4 of the cluster analysis may be suitable parent lines for developing dark green leaf pakchoi cultivars. Hou [36] reported that pakchoi with dark green petioles could exhibit a distinct aroma and high nutritional value, whereas those with lighter petioles were sweeter in taste. Although odor was not assessed in this study, materials with lighter color petioles exhibited higher soluble sugar content and sugar–acid ratios (Table S1). Waist girdling is a notable commercial trait in pakchoi breeding and is considered a quantitative characteristic that develops gradually during plant growth [8]. Based on our preliminary observations, pakchoi exhibited a reduced tendency to form the desirable waist girdling phenotype under hydroponic cultivation conditions. Unlike previous findings in soil-based conditions where waist girdling was positively associated with plant height and petiole length [8], this study indicated that it was more closely related to petiole shape, petiole weight, and shoot dry matter content. Specifically, materials with spoon-shaped petioles, heavier petioles, and higher shoot water content are more likely to develop pronounced waist girdling. In this study, a total of six materials had spoon-shaped petioles, generally exhibiting pronounced waist girdling. Among them, P6, P18, and P19 were the only three materials with a waist girdling score of 3, and their comprehensive agronomic trait rankings were 4th, 3rd, and 1st, respectively. Consequently, these characteristics were also associated with greater yield, demonstrating that spoon-shaped petiole morphology could serve as a primary criterion for selecting elite commercial pakchoi cultivars under hydroponic cultivation conditions.

4.3. Evaluation and Analysis of Nutritional Quality in Pakchoi Germplasm

Breeding superior parental lines for hybridization is an effective strategy to enhance the nutritional quality of vegetables [7,37]. Zeng et al. [38] suggested that increasing the contents of VC, soluble protein, and soluble sugar, while moderately reducing crude fiber content, should be primary objectives in the quality improvement of non-heading Chinese cabbage. In this study, materials with higher soluble protein levels also exhibited higher soluble sugar contents and lower cellulose levels. Previous studies have similarly reported a positive correlation between soluble proteins and soluble sugars [33,39]. However, other studies have reported a positive correlation between soluble proteins and cellulose, which is in contrast with our findings and may be attributed to differences in the plant materials used [33]. The VC content in vegetables has been identified to be positively associated with the titratable acidity [33]. Although a positive relationship was observed in this study, it was not statistically significant. Our analysis revealed that VC content was more strongly associated with the three mineral elements: it was negatively correlated with K and positively correlated with Ca and Mg. Furthermore, materials with higher Ca and Mg content also tended to show elevated free amino acid levels. This suggests the feasibility of selecting parent lines that simultaneously exhibit high VC, free amino acid, Ca, and Mg content. For example, among the materials with VC content ranking in the top three—P1, P14, and P17—the potassium content is only around 60 mg·kg−1, while the calcium and magnesium content exceeds 30 mg·kg−1 and 5.5 mg·kg−1, respectively. Additionally, their amino acid levels are relatively high compared to all the other materials.
In terms of macronutrient composition, the concentration of mineral elements in pakchoi in this study followed the order K > Ca > Na > P > Mg. In contrast, Zhu et al. [15] reported the order K > Ca > Mg > P > Na, likely because of the differences in nutrient solution formulations or plant materials.

4.4. Comprehensive Application of Multivariate Statistical Tools in Germplasm Resource Assessment

Evaluating the diversity of crop germplasm resources using phenotypic or genotypic data through PCA, correlation analysis, and cluster analysis has become standard practice. These methods are widely applied in studies on genetic diversity, classification, and crop cultivar improvement [23,40]. In this study, the results of correlation analysis, factor analysis, and cluster analysis were mutually corroborative [24]. The correlation analysis revealed that Ca, Mg, VC, and amino acids were positively correlated, while all four were negatively correlated with K. Consistent with this, the cluster analysis grouped the materials with high Ca, Mg, VC, and amino acid contents and low K content into Group 1, whereas the materials with the opposite characteristics were clustered into Group 4. Representative accessions for Groups 1 and 4 were P14 and P9, respectively. Soluble sugar showed significant correlations with soluble protein and the sugar–acid ratio and contributed to the differentiation of the remaining groups when considered alongside the comprehensive agronomic trait scores. Group 2 was characterized by high protein, high sugar, and high amino acid content but low yield, with P2 as its representative material. Represented by P18, Group 3 exhibited a favorable morphology, high yield, and high fiber content but relatively low protein and amino acid levels.

4.5. Future Work

Based on the groupings and trait profiles identified, three strategic crosses are proposed to develop hybrids with superior agronomic and quality traits: the P18 × P19 combination is expected to yield progeny with high productivity, optimal plant architecture, and enhanced vitamin C content; the P6 × P8 cross is anticipated to produce high-yielding hybrids with improved plant structure and desirable dark-green foliage; while the P14 × P2 pairing is projected to generate compact, high-quality cultivars suitable for intensive cultivation systems. However, due to factors such as non-linear genetic interactions [41,42], linkage drag [43], environmental dependencies [44], and epigenetic regulation [45], breeding programs require systematic evaluation of genotype–phenotype–environment relationships rather than simply relying on parental performance. Further hybridization validation and the application of modern breeding technologies—such as heterosis prediction models [46]—are needed to lay the foundation for developing hydroponically adapted pakchoi cultivars.

5. Conclusions

In conclusion, the pakchoi parental resources cultivated under hydroponic conditions exhibited substantial diversity in both agronomic traits and nutritional quality. Multivariate analyses revealed significant correlations among traits and enabled the identification of parent materials with desirable agronomic and nutritional characteristics, thereby providing a solid foundation for future hybridization efforts. Among the 20 parent materials, those in Group 3 were recommended for breeding high-yielding cultivars with a favorable morphology. Group 4 was suitable for selecting parents with darker leaves and petiole coloration. Group 1 was recommended for breeding objectives focused on high Ca, Mg, vitamin C, and amino acid content, while Group 2 offered parent materials with high levels of soluble protein, amino acids, and soluble sugars. Based on the plant morphology, yield, and nutritional quality, we recommend crossing P18 and P19 to develop a hybrid with high yield, optimal plant structure, and elevated vitamin C content. Additionally, P6 and P8 were proposed as parents for creating a high-yielding hybrid with enhanced plant architecture and dark-green foliage. Furthermore, a cross between P14 and P2 was suggested to produce a high-quality, compact hybrid cultivar.

Supplementary Materials

The following supporting information can be downloaded at: https://www.mdpi.com/article/10.3390/horticulturae11070822/s1, Table S1: Correlation analysis between commodity characters and partial nutrient quality characteristics.

Author Contributions

Proposed and designed the research, J.L. and X.D.; investigation, J.C. and D.L.; performed the statistical analyses, Q.W. and L.C.; writing—original draft preparation, J.C. and D.Z.; writing—review and editing, X.Z. and X.D.; provision of test materials, X.L. and L.G.; financial management, H.Z. All authors have read and agreed to the published version of the manuscript.

Funding

This research was funded by the Shanghai Agricultural Science and Technology Innovation Project (grant No. 2024-02-08-00-12-F00042) and the Excellent Team Program of the Shanghai Academy of Agricultural Sciences (grant No. [2022]007).

Data Availability Statement

The data presented in this study are available upon request from the corresponding author.

Conflicts of Interest

The authors declare no conflicts of interest. The funders had no role in the design of the study; in the collection, analyses, or interpretation of data; in the writing of the manuscript; or in the decision to publish the results.

References

  1. Hou, X.; Li, Y.; Liu, T. Advances in genetic breeding and molecular biology of non-heading Chinese cabbage. J. Nanjing Agric. Univ. 2022, 45, 864–873. [Google Scholar]
  2. Ding, X.; Jiang, Y.; Zhao, H.; Guo, D.; He, L.; Liu, F.; Zhou, Q.; Nandwani, D.; Hui, D.; Yu, J. Electrical conductivity of nutrient solution influenced photosynthesis, quality, and antioxidant enzyme activity of pakchoi (Brassica campestris L. ssp. Chinensis) in a hydroponic system. PLoS ONE 2018, 13, e0202090. [Google Scholar] [CrossRef] [PubMed]
  3. Zhou, F.; Zuo, J.; Xu, D.; Gao, L.; Wang, Q.; Jiang, A. Low intensity white light-emitting diodes (LED) application to delay senescence and maintain quality of postharvest pakchoi (Brassica campestris L. ssp. chinensis (L.) Makino var. communis Tsen et Lee). Sci. Hortic. 2020, 262, 109060. [Google Scholar] [CrossRef]
  4. Selma, M.V.; Luna, M.C.; Martínez-Sánchez, A.; Tudela, J.A.; Beltrán, D.; Baixauli, C.; Gil, M.I. Sensory quality, bioactive constituents and microbiological quality of green and red fresh-cut lettuces (Lactuca sativa L.) are influenced by soil and soilless agricultural production systems. Postharvest Biol. Technol. 2012, 63, 16–24. [Google Scholar] [CrossRef]
  5. Fussy, A.; Papenbrock, J. An overview of soil and soilless cultivation techniques—Chances, challenges and the neglected question of sustainability. Plants 2022, 11, 1153. [Google Scholar] [CrossRef]
  6. Chiomento, J.L.T.; Lima Júnior, E.P.; D’Agostini, M.; De Nardi, F.S.; Trentin, T.d.S.; Dornelles, A.G.; Huzar-Novakowiski, J.; Calvete, E.O. Horticultural potential of nine strawberry cultivars by greenhouse production in Brazil: A view through multivariate analysis. Sci. Hortic. 2021, 279, 109738. [Google Scholar] [CrossRef]
  7. Hanson, P.; Yang, R.Y.; Chang, L.C.; Ledesma, L.; Ledesma, D. Contents of carotenoids, ascorbic acid, minerals and total glucosinolates in leafy brassica pakchoi (Brassica rapa L. chinensis) as affected by season and variety. J. Sci. Food Agric. 2009, 89, 906–914. [Google Scholar] [CrossRef]
  8. Huang, Z. Detection and Analyses of Plant Type Related Genes in Non-Heading Chinese Cabbage; Nanjing Agricultutal University: Nanjing, China, 2013. [Google Scholar]
  9. Li, J.; Abbas, K.; Wang, W.; Gong, B.; Wang, L.; Hou, S.; Xia, H.; Wu, X.; Chen, L.; Gao, H. Drought tolerance evaluation and verification of fifty pakchoi (Brassica rapa ssp. chinensis) varieties under water deficit condition. Agronomy 2023, 13, 2087. [Google Scholar] [CrossRef]
  10. Zhao, M.; Han, R.; Wang, Z.; Ren, Y. Diversity of agronomic characters of 20 pakchoi varieties in introduction experiment. J. South. Agric. 2020, 51, 1960–1969. [Google Scholar] [CrossRef]
  11. Chen, X.; Zhu, Z.; Gerendás, J.; Zimmermann, N. Glucosinolates in Chinese Brassica campestris vegetables: Chinese cabbage, purple cai-tai, choysum, pakchoi, and turnip. HortScience 2008, 43, 571–574. [Google Scholar] [CrossRef]
  12. Ariza, M.; Reboredo-Rodríguez, P.; Mazzoni, L.; Forbes-Hernández, T.; Giampieri, F.; Afrin, S.; Gasparrini, M.; Soria, C.; Martínez-Ferri, E.; Battino, M.; et al. Strawberry achenes are an important source of bioactive compounds for human health. Int. J. Mol. Sci. 2016, 17, 1103. [Google Scholar] [CrossRef] [PubMed]
  13. Li, H.; Tang, C.; Xu, Z.; Liu, X.; Han, X. Effects of different light sources on the growth of non-heading Chinese cabbage (Brassica campestris L.). J. Agric. Sci. 2012, 4, 262–273. [Google Scholar] [CrossRef]
  14. Qi, Y.; Jiang, F.; Zhou, R.; Wu, Y.; Hou, X.; Li, J.; Lin, W.; Wu, Z. Effects of reduced nitrogen with bio-organic fertilizer on soil properties, yield and quality of non-heading Chinese cabbage. Agronomy 2021, 11, 2196. [Google Scholar] [CrossRef]
  15. Zhu, Y.; Jiang, X.; Jiang, T.; Cai, S.; Han, Y. Analysis of mineral elements and amino acids in 6 lines of hydroponic green cabbages. J. Beijing Univ. Agric. 2023, 37, 37–42. [Google Scholar] [CrossRef]
  16. Wang, L.P.; Xiang, C.P.; Wang, Y.H. Studies on the nitrate content of different pak-choi genotypes. Acta Hortic. Sin. 2004, 31, 43–46. [Google Scholar]
  17. Li, G.; Tan, J.; Chen, H.; Lu, M.; Zhang, Y.; Li, T.; Ye, Y.; Zhang, H. Comparison of nutrional quality of different varieties of Chinese cabbage. Guangdong Agric. Sci. 2016, 43, 26–32. [Google Scholar] [CrossRef]
  18. Donde, R.; Kumar, J.; Gouda, G.; Gupta, M.K.; Mukherjee, M.; Baksh, S.Y.; Mahadani, P.; Sahoo, K.K.; Behera, L.; Dash, S.K. Assessment of genetic diversity of drought tolerant and susceptible rice genotypes using microsatellite markers. Rice Sci. 2019, 26, 239–247. [Google Scholar] [CrossRef]
  19. Jaeger, A.; Banks, D. Cluster analysis: A modern statistical review. WIREs Comput. Stat. 2022, 15, e1597. [Google Scholar] [CrossRef]
  20. Yin, L.; Zhao, J. Resources evaluation of transplanted non-heading Chinese cabbage varieties for autumn-winter cultivation in Jiangsu. Acta Agric. Shanghai 2023, 39, 21–27. [Google Scholar] [CrossRef]
  21. Hong, C.; Zhao, J.; Cheng, C.; Zheng, W.; Geng, S.; Du, H.; Zhang, X. Comprehensive evaluation of agronomic traits of pepper germplasm resources. China Veg. 2024, 33–41. [Google Scholar] [CrossRef]
  22. Han, Z.; Jiang, B. A study on comprehensive evaluation of the processing tomato varieties multiple traits. Sci. Agric. Sin. 2014, 47, 357–365. [Google Scholar] [CrossRef]
  23. Wan, S.; Song, F.; Hao, J.; Zhang, X.; Li, H.; Shao, Y.; Zhao, A. Genetic diversity of agronomic traits in 271 pea germplasm resources. J. Plant Genet. Resour. 2017, 18, 10–18. [Google Scholar]
  24. Kuang, L.; Wang, Z.; Zhang, J.; Li, H.; Xu, G.; Li, J. Factor analysis and cluster analysis of mineral elements contents in different blueberry cultivars. J. Food Compos. Anal. 2022, 109, 104507. [Google Scholar] [CrossRef]
  25. Li, H. Principles and Techniques of Plant Physiological and Biochemical Experiments; Higher Education Press: Beijing, China, 2000. [Google Scholar]
  26. Pelletier, O. Vitamin C, (L-ascorbic and dehydro-L-ascorbic acids). In Methods of Vitamin Assay; Augustin, J., Klein, B.P., Becker, D.A., Venugopa, l.P.B., Eds.; Wiley: New York, NY, USA, 1985; pp. 303–347. [Google Scholar]
  27. Dreywood, R. Qualitative test for carbohydrate material. Ind. Eng. Chem. Anal. Ed. 1946, 18, 499–500. [Google Scholar] [CrossRef]
  28. AOAC International. Official Method 942.15: Acidity (Titratable) of Fruit Products. In Official Methods of Analysis of AOAC International; AOAC International: Washington, DC, USA, 2005. [Google Scholar]
  29. Hu, H.; Wang, J.; Hu, T.; Wang, W.; Wei, Q.; Bao, C. Phenotypic diversity of non-heading Chinese cabbage germplasm resources in Zhejiang province. Int. J. Hortic. 2020, 10, 19–27. [Google Scholar] [CrossRef]
  30. Xie, X.; Zheng, X.; Lin, F.; Shao, G. Evaluation of 46 non-heading Chinese cabbage germplasm resources. Acta Agric. Jiangxi 2018, 30, 16–20. [Google Scholar] [CrossRef]
  31. Lai, J.; Huang, L.; Wei, S.; Dai, S.; Zhang, Q.; Li, Q.; Liu, J.; Ye, P. Yield per plant and main agronomic traits of non-heading Chinese cabbage: Grey relational degree analysis. Chin. Agric. Sci. Bull. 2019, 35, 36–41. [Google Scholar]
  32. Sun, L.; Zhao, F.; Li, Z.; Wang, G.; Wu, S. Genetic analysis and correlation analysis on agronomic traits of twenty-two Chinese cabbage. North. Hortic. 2014, 1–4. [Google Scholar]
  33. Zhang, C. Studies on Identification and Evaluation of Characteristic of some Regional Headless Chinese Cabbage Germplasm; Zhejiang University: Hangzhou, China, 2018. [Google Scholar]
  34. Xu, J.; Zhao, X. The changing trend of Chinese cabbage variety market demand. China Veg. 2005, 39–40. [Google Scholar]
  35. Zhang, X. Diagnosis Model of Hydroponic Lettuce Deficiency based on Machine Learning; Northwest A&F University: Yangling, China, 2022. [Google Scholar]
  36. Hou, X. Advances in breeding of non-heading Chinese cabbage. J. Nanjing Agric. Univ. 2003, 26, 111–115. [Google Scholar]
  37. Xie, F.; Zha, J.; Tang, H.; Xu, Y.; Liu, X.; Wan, Z. Combining ability and heterosis analysis for mineral elements by using cytoplasmic male-sterile systems in non-heading Chinese cabbage (Brassica rapa). Crop Pasture Sci. 2018, 69, 296. [Google Scholar] [CrossRef]
  38. Zeng, G.; Cao, S. Analysis of genetic effects of some nutrient quality characters in non-heading Chinese cabbage. Acta Agric. 1997, 24, 43–47. [Google Scholar]
  39. Yu, J.; Li, P.; Tu, S.; Feng, N.; Chang, L.; Niu, Q. Identification of heat-resistant varieties of non-headed Chinese cabbage and discovery of heat-resistant physiological mechanisms. Horticulturae 2023, 9, 619. [Google Scholar] [CrossRef]
  40. Nie, S.; Peng, L.; Wang, X.; Ji, L. Genetic diversity of agronomic traits in chickpea (Cicer arietinum L.) germplasm resources. J. Plant Genet. Resour. 2015, 16, 64–70. [Google Scholar]
  41. Yang, R. Analysis of linear and non-linear genotype × environment interaction. Front. Genet. 2014, 5, 227. [Google Scholar] [CrossRef]
  42. Kozlov, K.; Singh, A.; Berger, J.; Bishop-von Wettberg, E.; Kahraman, A.; Aydogan, A.; Cook, D.; Nuzhdin, S.; Samsonova, M. Non-linear regression models for time to flowering in wild chickpea combine genetic and climatic factors. BMC Plant Biol. 2019, 19, 94. [Google Scholar] [CrossRef]
  43. Huang, K.; Jahani, M.; Gouzy, J.; Legendre, A.; Carrere, S.; Lázaro-Guevara, J.M.; Segovia, E.G.G.; Todesco, M.; Mayjonade, B.; Rodde, N.; et al. The genomics of linkage drag in inbred lines of sunflower. Proc. Natl. Acad. Sci. USA 2023, 120, e2205783119. [Google Scholar] [CrossRef]
  44. Cooper, M.; Eeuwijk, F.A.v.; Hammer, G.L.; Podlich, D.W.; Messina, C. Modeling QTL for complex traits: Detection and context for plant breeding. Curr. Opin. Plant Biol. 2009, 12, 231–240. [Google Scholar] [CrossRef]
  45. Pikaard, C.S.; Mittelsten Scheid, O. Epigenetic Regulation in Plants. Cold Spring Harb. Perspect. Biol. 2014, 6, a019315. [Google Scholar] [CrossRef]
  46. Wang, Q. Research on Prediction Modol of Heterosis of Brassica napus L.; Southwest University: Chongqing, China, 2024. [Google Scholar]
Figure 1. Nutrient film technique (NFT) culture bed.
Horticulturae 11 00822 g001
Figure 2. Images of unmeasurable commodity characteristics in 20 pakchoi parental materials.
Horticulturae 11 00822 g002
Figure 3. Correlation analysis between commodity characteristics and agronomic traits. The upper right circle represents the correlation between different parameters, and the lower left numbers represent the correlation coefficients, with red being a positive correlation and blue being a negative correlation. “*” indicates a significant correlation at p ≤ 0.05, and “**” indicates a significant correlation at p ≤ 0.01.
Horticulturae 11 00822 g003
Figure 4. Correlation analysis between nutritional quality traits. The upper right circle represents the correlation between different parameters, and the lower left numbers represent the correlation coefficients, with red being a positive correlation and blue being a negative correlation. “*” indicates a significant correlation at p ≤ 0.05, and “**” indicates a significant correlation at p ≤ 0.01.
Horticulturae 11 00822 g004
Figure 5. Results of cluster analysis on main agronomic characteristics and nutritional quality of 20 pakchoi parental materials. Classification was performed at a Euclidean distance of 10, as marked by the red line.
Horticulturae 11 00822 g005
Figure 6. Heatmap of main agronomic characteristics and nutritional quality of 20 pakchoi parental materials.
Horticulturae 11 00822 g006
Figure 7. Grouping of 20 pakchoi parental materials according to cluster analysis results: (a), (b), (c), and (d) represent groups 1, 2, 3, and 4, respectively.
Horticulturae 11 00822 g007
Table 1. Nutrient solution formulation.
Mineral ElementLarge Element (mmol·L−1)Trace Element (μmol·L−1)
NO3-NNH4+-NPKCaMgSFeBMnZnCuMo
Concentration15.82.31.25.05.51.01.795.011.69.50.80.30.1
Table 2. Criteria for assigning values to unmeasurable morphological indicators.
Assign ValuesInterveinal ChlorosisGirdlingCompactness of InternodeLeaf ShapeLeaf ColorBlade FlatnessPetiole ShapePetiole ColorGeneral Impression
1nonenoneincompactovatelight greenwrinkledflatlight greenordinary
2slightslightcompactovalgreenmoderatespoon shapegreengood
3seriousgoodvery compactlong ellipticaldark greenopen and flatexcellent
Table 3. Measurable agronomic characteristics of 20 pakchoi parent materials *.
No.Plant Height (cm)Crown Diameter (cm)Maximum Leaf Length (cm)Maximum Leaf Width (cm)Product of Length and Width in Maximum Leaf (cm2)Petiole Length of Maximum Leaf (cm)Projected Petiole Area of Maximum Leaf (cm2)
P120.23 ab24.73 a12.97 ab8.93 ab116.69 ab7.33 a11.39 ab
P217.87 bcde21.73 abc11.10 cde6.87 defg76.56 defg5.13 bcde8.85 bcde
P316.50 def18.83 cd10.83 cdef7.50 bcde81.38 def4.10 de7.15 def
P419.40 abc25.00 a11.57 bcde7.27 cdef82.09 def5.33 bcde8.14 cdef
P516.07 ef25.13 a9.93 efg7.33 cde72.78 defgh5.20 bcde7.80 cdef
P616.73 cde25.13 a12.63 abc9.23 a116.01 ab5.13 bcde10.46 abc
P718.17 abcde24.83 a12.10 abcd8.03 abcd96.90 bcd6.10 abc9.94 abcd
P817.60 bcde23.47 ab13.10 ab8.97 ab118.65 ab5.27 bcde9.35 abcd
P916.10 ef25.03 a10.53 def6.03 efg64.12 fgh5.57 bcd8.63 bcdef
P1019.10 abcd24.00 ab12.53 abc8.90 ab110.83 abc5.13 bcde9.04 bcde
P1118.77 abcde24.70 a12.67 abc8.57 abc108.55 abc4.80 cde8.63 bcdef
P1217.77 bcde25.67 a11.50 bcde6.30 efg73.72 defgh4.57 cde7.91 cdef
P1320.10 ab22.43 abc11.67 bcde7.33 cde85.50 cdef4.37 de8.03 cdef
P1416.17 ef22.00 abc10.83 cdef6.37 efg69.12 efgh7.44 a10.65 abc
P1519.00 abcd21.77 abc11.90 abcd6.70 defg79.89 def7.22 a10.25 abc
P1614.03 fg15.97 d8.40 g5.67 g47.57 h5.04 bcde6.96 def
P1716.03 ef19.23 cd10.40 def6.93 defg72.31 defgh5.37 bcde6.17 ef
P1819.20 abcd24.03 ab12.67 abc7.37 cde93.19 bcde6.07 abc11.49 ab
P1920.83 a23.77 ab13.67 a9.10 a124.84 a6.39 ab12.25 a
P2012.17 g20.30 bc9.30 fg5.73 fg53.28 gh3.89 e5.67 f
CV (%)13.7513.2713.4417.8228.6421.7824.28
Genetic diversity index (H’)1.801.541.831.661.891.721.89
No.Petiole Weight (g)Shoot Fresh Mass (g)Root Fresh Mass (g)Shoot Dry Mass (g)Root Dry Mass (mg)Petiole-to-Shoot Weight Ratio (%)Shoot Dry Matter Rate (%)Root-to-Shoot Ratio (%)
P125.15 bcde42.24 abc1.70 bcde2.35 a186.67 bcde59.50 defg5.57 bcd7.94 efghi
P217.60 fgh27.58 efgh1.11 efgh1.47 c151.00 def63.75 bc5.35 bcdef10.31 bcd
P321.78 defg33.52 cdefg1.75 bcd1.61 bc206.33 abc64.98 b4.80 f12.81 a
P419.86 defg36.46 bcde1.34 cdefg1.83 abc177.33 bcdef54.08 hi5.02 def9.71 cde
P516.80 gh30.42 defgh1.55 bcdef1.62 bc156.00 def55.18 hi5.33 bcdef9.62 cdef
P629.49 bc46.68 ab1.87 abcd2.33 a193.67 bcd63.31 bcd4.98 ef8.30 defghi
P721.74 defg36.59 bcde1.78 abcd1.82 abc144.00 efg59.54 defg4.99 ef7.97 efghi
P824.29 bcde43.89 abc1.59 bcdef2.18 ab149.33 defg55.70 ghi4.97 ef6.87 hi
P921.24 defg35.36 cdef1.59 bcdef1.85 abc134.00 fg60.04 cdef5.23 cdef7.23 ghi
P1023.81 cdef41.60 bc2.34 a2.36 a211.00 ab57.21 fgh5.67 bc9.10 cdefg
P1123.82 cdef43.74 abc1.70 bcde2.27 a141.00 efg54.46 hi5.20 cdef6.20 i
P1218.88 efgh35.55 cdef2.07 ab1.90 abc161.00 cdef53.03 i5.37 bcde8.56 cdefgh
P1320.75 defg33.01 cdefg1.01 fgh1.60 bc156.67 def62.78 bcd4.85 ef9.77 bcde
P1420.78 defg33.73 cdefg1.13 efgh1.83 abc165.00 cdef61.48 bcde5.40 bcde9.24 cdefg
P1525.58 bcd41.01 bcd1.74 bcd2.13 ab151.33 def62.59 bcd5.12 cdef7.28 ghi
P1612.75 h21.92 h0.96 gh1.38 c105.00 g58.02 efgh6.32 a7.62 fghi
P1715.24 gh24.43 gh0.69 h1.42 c104.67 g62.34 bcd5.83 b7.35 ghi
P1830.42 b46.72 ab1.89 abc2.31 a238.67 a65.08 b4.93 ef10.45 bc
P1937.97 a52.24 a1.29 defg2.17 ab167.00 bcdef72.75 a4.14 g7.78 efghi
P2015.24 gh25.23 fgh1.15 efgh1.30 c152.33 def60.37 cdef5.20 cdef11.66 ab
CV (%)29.0125.3831.8423.2223.408.279.5621.26
Genetic diversity index (H’)1.781.831.871.671.721.691.691.80
* Presented values are means (n = 9). Different lowercase letters indicate statistical differences among treatments (p < 0.05).
Table 4. Unmeasurable commodity characteristics of 20 pakchoi parent materials.
NO.Interveinal ChlorosisGirdlingCompactness of InternodeLeaf ShapeBlade FlatnessLeaf ColorPetiole ShapePetiole ColorGeneral Impression
P1211133111
P2211312111
P3222211211
P4122133111
P5223132111
P6132223222
P7122233122
P8112133122
P9212132121
P10111232211
P11221232212
P12111232121
P13113311111
P14111332112
P15211332111
P16121133121
P17111232111
P18231331212
P19131222213
P20221233111
Table 5. Nutrient quality characteristics of 20 pakchoi parent materials *.
No.Soluble Protein
(mg·g−1)
Vitamin C
(μg·g−1)
Amino Acid
(mg·g−1)
Cellulose
(mg·g−1)
Soluble Sugar
(mg·g−1)
Acid Content
(mg·g−1)
Sugar–Acid Ratio
P116.94 cde143.94 a2.52 a8.44 kl7.49 fg2.28 gh3.30 d
P219.24 b88.81 fg2.42 a9.32 ghi10.83 b2.81 d3.85 c
P317.65 cd90.57 f1.71 de7.87 l7.15 gh2.62 e2.73 ef
P415.57 ef67.99 ij1.53 fg8.80 ijk7.45 g2.26 h3.30 d
P513.51 ghi56.44 j1.59 efg10.85 d11.29 a2.48 f4.55 a
P614.05 gh83.61 g1.63 ef10.68 de6.13 ij2.16 h2.83 ef
P722.39 a96.94 e1.47 gh6.64 m8.41 e2.44 f3.45 d
P812.07 ij100.91 de1.16 jkl10.17 ef5.78 j3.17 b1.82 h
P910.60 k74.03 h1.03 l10.21 ef5.28 k2.16 h2.44 g
P1016.34 de84.42 g1.38 hi8.63 jk10.24 c2.39 fg4.28 b
P1114.87 fg106.20 cd1.20 jk12.48 bc7.82 f2.73 de2.87 e
P1215.68 ef68.52 hi1.05 l12.28 c6.83 h2.86 cd2.39 g
P1319.09 b109.43 c1.88 c8.52 jk10.90 b2.62 e4.17 b
P1418.30 bc142.54 a1.53 fg9.52 gh10.22 c3.73 a2.74 ef
P1514.15 gh91.03 f1.15 jkl9.10 hij7.23 g2.97 c2.44 g
P1613.27 hi130.51 b1.49 gh12.90 b7.31 g2.74 de2.67 f
P1713.04 hij130.86 b2.25 b9.88 fg7.49 fg2.19 h3.43 d
P1812.15 ij101.45 de1.11 kl13.53 a5.87 j2.16 h2.72 ef
P1911.76 jk109.30 c1.28 ij7.88 l9.82 d2.16 h4.54 a
P2012.76 hij110.91 c1.79 cd8.21 kl6.43 i2.73 de2.36 g
CV (%)20.1524.3427.9418.8423.2715.6624.80
Genetic diversity index(H’)1.861.811.842.011.731.791.83
No.P (mg·kg−1)K (mg·kg−1)Ca (mg·kg−1)Mg (mg·kg−1)Na (mg·kg−1)
P16.39 g58.40 j31.68 c5.58 c7.41 g
P26.79 ef62.20 h30.99 d5.52 c6.36 j
P38.18 b71.52 c28.46 f5.21 e6.59 ij
P47.37 d75.07 b24.22 k4.48 ij6.80 hi
P56.68 f69.07 de23.92 k4.51 i7.46 fg
P66.33 g77.15 a21.12 l3.75 m6.54 ij
P76.17 h71.47 c23.89 k4.14 k7.71 ef
P87.56 c70.09 d28.73 f4.92 g8.63 ab
P95.79 i73.99 b20.60 m3.99 l7.93 de
P106.90 e63.44 fgh23.82 k4.42 j8.02 d
P116.30 h64.00 f27.46 fg4.87 g8.68 a
P126.80 ef63.56 fg25.84 j4.93 g8.39 bc
P137.63 c72.63 c26.48 i5.11 f6.59 ij
P147.24 d63.75 fg35.25 b6.46 b5.00 l
P156.42 g68.07 e26.83 hi4.87 g4.56 m
P167.61 c60.04 i25.77 j5.23 e7.44 fg
P178.40 a57.77 j36.71 a6.76 a8.17 cd
P187.53 c68.84 de29.71 e5.34 d7.02 h
P196.93 e71.78 c27.18 gh4.64 h5.80 k
P205.72 i62.57 gh25.84 j5.23 e4.18 n
CV (%)10.568.4215.0414.6118.46
Genetic diversity index(H’)1.841.771.951.821.80
* Presented values are means (n = 3). Different lowercase letters indicate statistical differences among treatments (p < 0.05).
Table 6. Component matrix of PCA.
ElementF1F2
Plant height0.9660
Crown diameter0.958−0.173
Maximum leaf length0.9310.119
Maximum leaf width0.917−0.233
Product of length and width in maximum leaf0.892−0.164
Projected petiole area of maximum leaf0.836−0.221
Petiole weight0.825−0.164
Shoot fresh mass0.786−0.253
Root fresh mass0.6920.282
Shoot dry mass0.6340.501
Root dry mass0.6490.682
Eigenvalue7.6531.061
Variance (%)52.775%26.444%
Cumulative variance (%)52.775%79.219%
Table 7. Scores of principal factors and synthetic ranks of the 20 pakchoi parent materials.
No.F1 ScoreF2 ScoreComprehensive ScoreRank
P13.210.212.842
P2−1.68−0.43−1.5217
P3−1.121.20−0.8413
P40.170.200.1810
P5−1.45−0.16−1.2916
P63.040.172.694
P70.93−0.650.748
P81.92−0.561.626
P9−1.25−0.25−1.1315
P102.801.512.645
P111.83−0.401.567
P12−0.160.73−0.0511
P13−0.55−0.50−0.5412
P14−1.22−0.01−1.0714
P150.620.180.569
P16−5.72−0.46−5.0820
P17−3.81−1.10−3.4818
P182.991.512.813
P194.15−1.423.481
P20−4.700.23−4.1019
Disclaimer/Publisher’s Note: The statements, opinions and data contained in all publications are solely those of the individual author(s) and contributor(s) and not of MDPI and/or the editor(s). MDPI and/or the editor(s) disclaim responsibility for any injury to people or property resulting from any ideas, methods, instructions or products referred to in the content.

