Article

Joint Transcriptomic and Metabolomic Analysis of Molecular Physiological Mechanisms of Tea Tree Roots in Response to pH Regulation

1
College of Tea and Food Science, Wuyi University, Wuyishan 354300, China
2
College of Life Science, Longyan University, Longyan 364012, China
3
College of JunCao Science and Ecology, Fujian Agriculture and Forestry University, Fuzhou 350002, China
*
Authors to whom correspondence should be addressed.
These authors contributed equally to this work.
Horticulturae 2025, 11(7), 821; https://doi.org/10.3390/horticulturae11070821
Submission received: 18 June 2025 / Revised: 8 July 2025 / Accepted: 9 July 2025 / Published: 10 July 2025
(This article belongs to the Special Issue Abiotic Stress Tolerance and Breeding Strategies in Tea Plants)

Abstract

The tea tree root system is an important tissue for nutrient uptake, accumulation, and transport, and pH is an important environmental factor regulating the growth of tea tree (Camellia sinensis). However, the physiological and molecular mechanisms of how the tea tree root system responds to pH are unclear. In this study, Tieguanyin tea tree was used as the research object, and treated with different pH values to determine the morphological indexes of the tea plant root system and systematically study the physiological and molecular mechanisms of the effect of pH on the growth of the tea plant root system using transcriptomics in combination with metabolomics. The results showed that total root length, root surface area, root volume, total root tips, root fork number, and root crossing number of root crosses of the tea plant root system increased significantly (p < 0.05) with increasing pH. Transcriptome analysis showed that a total of 2654 characteristic genes were obtained in response to pH regulation in the root system of the tea plant, which were mainly enriched in six metabolic pathways. Metabolomics analysis showed that the metabolites with the highest contribution in differentiating tea plant responses to different pH regulations were mainly heterocyclic compounds, amino acids and derivatives, alkaloids, and flavonoids. Interaction network analysis showed that pH positively regulated the metabolic intensity of the MAPK signaling pathway (plant, plant hormone signal transduction, and RNA degradation pathway), positively regulated the content of the heterocyclic compound, amino acids and derivatives, and alkaloids, and positively regulated tea plant root growth. However, it negatively regulated ribosome, protein processing in the endoplasmic reticulum, and phenylpropanoid biosynthesis pathway intensity, and negatively regulated the flavonoid content. This study reveals the physiological and molecular mechanisms of the tea plant root system in response to pH changes and provides an important theoretical basis for the cultivation and management of tea plants in acidified tea plantations.

1. Introduction

Soil pH is one of the key environmental factors affecting plant growth and development, which directly or indirectly influences plant growth and development by regulating many aspects such as soil nutrient effectiveness, microbial community structure, and root physiological metabolism [1,2]. China is one of the origins of tea plant (Camellia sinensis) and the largest tea consumer, and tea is an important pillar industry for rural revitalization in China. Tea plant is acidophilic; when the soil pH value is 4.5–5.5, it is suitable for growth. When the soil is too acidic or too alkaline, this seriously affects the growth of tea plant [3]. Due to previous large-scale applications of chemical fertilizers, resulting in serious acidification of the tea plantation soil, tea growth is hindered, and tea yield and quality are seriously reduced [4]. However, the molecular mechanism of how pH affects the growth of tea plant by regulating the gene expression and metabolic network in the root system is still unclear, and it is of great significance to reveal this phenomenon in depth for the restoration of acidified soils in tea plantations as well as for the cultivation and management of tea plants.
The root system is the main organ of plants to perceive and respond to changes in the soil environment, and changes in its morphology and physiological properties directly reflect the plant’s adaptation strategy to the environment [5]. It has been reported that, within the appropriate pH range, it is conducive to plant root growth and promote plant nutrient uptake, but too acidic is prone to destroy the root apical meristematic tissue, affecting the development of lateral roots, and thus hindering the uptake of nutrients and inhibiting the growth of the plant [6]. Zou et al. [7] found that increasing soil pH is conducive to promoting the growth of the root system of the tea plant, enhancing the nutrient absorption capacity of the tea plant, and then improving the productivity of tea plants. Secondly, the use of organic fertilizers to regulate the acidified soil in tea plantations also found that organic fertilizers can alleviate soil acidification, enhance the ability of the tea plant root system to absorb soil macronutrients, improve the growth conditions of the tea plant, and promote the tea yield and quality enhancement [8]. It can be seen that changes in pH did have a significant impact on the growth of the tea plant root system, which in turn affected the yield and quality of tea. However, the molecular physiological mechanisms of how the tea plant root system responds to pH regulation are still unclear.
In recent years, the rapid development of transcriptomics and metabolomics technologies has provided a powerful tool for revealing plant environmental adaptations and has been widely applied to the study of abiotic stress response in tea plant, which has achieved remarkable results [9,10,11]. For example, Xu et al. [12] used transcriptomics and metabolomics to analyze the effects of nitrogen stress on the growth of tea plant, and found that nitrogen deprivation led to an increase in the content of most amino acids, and a decrease in the content of the remaining amino acids, polyphenols, and caffeine in tea plant. Upon restoration of nitrogen supply, the reduced amino acid and polyphenol contents were restored to varying degrees, but not caffeine. The reason for this phenomenon is that nitrogen stress in tea plant activates the gene expression of flavonoid-related pathways, which in turn affects the metabolic intensity of the relevant pathways. Zuo et al. [13] investigated the effects of drought stress on gene expression and metabolite synthesis in tea plant roots and found that the intensity of sphingolipid metabolism, arginine metabolism and glutathione metabolism was significantly reduced in the roots under drought stress, and the intensity of flavonoids metabolic flow in the roots was significantly altered, and the content decreased significantly. It can be seen that under the stress of environmental factors, the tea plant root system used different strategies to adapt to the environment. However, the wholeness effect of pH, a fundamental environmental factor, on gene expression and metabolic networks in the tea plant root system has not been reported. Metabolites are the ultimate expression of gene function and the material basis for plant adaptation to environmental changes. The tea plant root system contains abundant secondary metabolites (e.g., flavonoids, alkaloids), which are not only involved in stress defense but also may affect the flavor quality of tea [14]. A large number of scholars have found that increasing soil pH can effectively promote the accumulation of tea polyphenols, theanine, caffeine, and other substances in tea plant leaves [15,16], but the pattern of metabolite changes in the root system of tea plant in response to the effects of pH is not clear. The dynamic changes in root metabolites may have a synergistic or feedback relationship with the regulation of gene expression; therefore, correlation analysis from a multi-omics perspective is of great significance in revealing the pH response mechanism of the tea plant root system in depth.
Accordingly, in this study, Tieguanyin tea plant seedlings were cultivated by hydroponics, and three different pH treatments were set to determine the morphological indexes of the tea plant root system. At the same time, transcriptomics and metabolomics techniques were used to analyze the changes in gene expression and metabolite contents of the tea plant root system after different pH treatments, and to screen for characteristic genes and signature metabolites of the tea plant in response to the regulation of pH. Based on this, the effects of pH on tea root growth were clarified, the core genes and their regulatory networks in response to pH were obtained, and the correlation between tea root growth, metabolite dynamics and gene expression was revealed, with a view to providing a theoretical basis for the ecological restoration of acidified soil in tea plantations and the cultivation and management of tea plants.

2. Materials and Methods

2.1. Experimental Design and Sample Sampling

The research object selected in this study was Tieguanyin tea plant (Camellia sinensis), which was planted by hydroponics, and then the pH value of the culture solution was adjusted to carry out the experimental study of pH-regulated tea plant growth. Specifically, asexually propagated Tieguanyin tea plant cuttings that had been cultured in a greenhouse for 1 year were selected, and the tea plant seedlings were about 35 cm in height and 0.3 cm in diameter. Tea plant asexually propagated cuttings were obtained from the Tea Germplasm Resource Nursery of the Tea Research Institute, Fujian Academy of Agricultural Sciences, China. The root system of the tea plant seedlings was cleaned with deionized water, and then transplanted to the completed nutrient solution for 45 d, so as to make the tea plant return to normal growth. The nutrient solution formula was configured by referring to the method of Sun et al. [17].
After the tea plant seedlings resumed growth, the seedlings were taken out, and the root system of the seedlings was rinsed using deionized water. And then they were transplanted to the nutrient solution with different pH values for treatment, which was adjusted using HCl or NaOH, with three independent replicates for each treatment. Three pH treatments were set up in this study: pH 3.5 (LR), pH 4.5 (MR), and pH 5.5 (HR). The transplanted tea plant seedlings were placed in a greenhouse for cultivation with a light intensity of 1500 lux, a light duration of 12 h (8:00~20:00), a temperature setting of 25 °C, and a humidity of 75%. Tea plant seedlings were treated for 21 d under different pH values. The culture solution was continuously aerated for 24 h, and the same nutrient solution was replaced and pH adjusted every 7 d. At the end of the treatment, the tea plant root system was collected for root scanning to analyze the effect of pH on the morphological indexes of the tea plant root system. At the same time, tea plant roots were collected and immediately stored in liquid nitrogen for transcriptome sequencing and metabolomics analysis.

2.2. Determination of Tea Plant Root Indexes

Tea plant root indexes were determined using a root scanner (Expression 1200XL, Epson, Suwa, Japan) [18]. Briefly, the tea plant root system was cleaned with distilled water and then arranged in transparent root trays with minimal overlap, and scanned by the root scanner (optical resolution set at 2400 × 4800 dpi); Total root length, root surface area, root volume, total root tips, root forks number, and root crossings number were analyzed using WinRHIZO Pro 2019a software (Regent Instrumengts Inc., Québec City, QC, Canada).

2.3. Transcriptome Sequencing Analysis of the Tea Plant Root System

After different pH treatments, the root system of tea plant at the root tip and 5 cm above was collected for total RNA extraction, with three replicates for each sample. Tea plant roots collected after different pH treatments were used for total RNA extraction with three replicates per sample. RNA integrity was analyzed by agarose gel electrophoresis, RNA purity was detected by NanoPhotometer spectrophotometer (IMPLEN, Westlake Village, CA, USA), and RNA concentration was quantified by Qubit2.0 Fluorometer (Life Technologies, Inc., Foster City, CA, USA).
The total amount of RNA obtained was greater than 1 μg, and the library was constructed using Illumina’s NEBNext® UltraTM RNA Library Construction Kit (produced by NEB, Ipswich, MA, USA), and the steps in the instructions were strictly followed. After the cDNA library was constructed and quantified, the library was diluted to a concentration of 1.5 ng/μL, and an Agilent 2100 Bioanalyzer was used to determine the insert size of the library, and the effective concentration of the library was precisely determined by qRT-PCR. If the library met the requirements, it could be sequenced on the Illumina sequencing platform to obtain the relevant information. The raw data were filtered by the fastp v 0.19.3 software to obtain clean reads for subsequent analysis [19]. The reference genome (GCF_004153795.1_AHAU_CSS_1_genomic.fna, the download link is https://ftp.ncbi.nlm.nih.gov/genomes/all/GCF/004/153/795/GCF_004153795.1_AHAU_CSS_1/, accessed on 23 February 2024) and its annotation file were downloaded. After the download was completed, the index was constructed using HISAT v2.1.0, after which the previously obtained clean reads were compared to the reference genome with the aim of analyzing the comparison efficiency [20]. After the comparison was completed, the featureCounts tool was applied to analyze the gene comparison. In this process, the number of reads segments and the length of the gene were calculated for each gene, which resulted in the expression FPKM for each gene [21,22].

2.4. Determination of Metabolites in Tea Plant Roots

The method of extracting and determining the metabolites of tea plant roots was referred to the study of Zhou et al. [23], which was performed as follows: firstly, the collected tea plant root samples were placed in a vacuum freeze dryer (Scientz-100F, Zhejiang, China) for freeze drying treatment. After completion of drying, the samples were ground into powder. Subsequently, 50 mg of the powder was accurately weighed into a container, and 1.2 mL of 70% methanol solution was added, followed by vortex shaking for 30 s. The vortex shaking was repeated at 30 min intervals for 30 s for a total of six times over the next 3 h. After completion of the shaking, the mixture was centrifuged at 12,000 rpm. After centrifugation, the resulting liquid was filtered through a 0.22 μm filter membrane. Finally, the filtered liquid was analyzed by ultra performance liquid chromatography tandem mass spectrometry (UPLC-MS/MS).
The extracts were analyzed by the UPLC-MS/MS method. The instrumentation used was as follows: UPLC equipment was Shimadzu Nexera X2 (Kyoto, Japan), and MS/MS equipment was Applied Biosystems 4500 QTRAP (Framingham, MA, USA). The column used for UPLC analysis was Agilent SB-C18 (1.8 µm, 2.1 mm × 100 mm, Santa Clara, CA, USA). For the mobile phases, mobile phase A was ultrapure water containing 0.1% formic acid, and mobile phase B was acetonitrile containing 0.1% formic acid. The elution pattern was as follows: at 0.00 min, the B phase was 5%; over the next 9.00 min, the B phase was gradually increased to 95% and held for 1 min; then between 10.00 and 11.10 min, the B phase was reduced to 5% and held for 3 min. The flow rate was set at 0.35 mL/min, the column temperature was maintained at 40 °C, and the injection volume was 2 μL. For MS/MS, the ionization temperature of electrospray was 500 °C, the positive ion mode voltage of the ion spray was set at 5500 V, and the negative ion mode voltage was set at −4500 V, the pressures of the ion source gases I and II were set at 50 and 60 pounds-force (lbf), respectively, and the gas curtain pressure was set at 25 lbf, the collision activated cracking setting was set to high, and the triple tandem quadrupole mass spectrometry (TTQMS) was scanned in multi-reaction monitoring (MRM) mode. The triple tandem quadrupole mass spectrometer was scanned in multiple reaction monitoring modes with the collision gas (nitrogen) set to medium. During the analysis, a specific set of multiple reaction monitoring ion pairs was monitored for the metabolite effluent during each time period. The mass spectrometry data were processed using Analyst (1.6.3) software as a means of obtaining metabolite retention times and ion current intensities [24]. Afterwards, these data were compared with the NIST20 mass spectrometry database to enable the identification of the metabolites. A triple quadrupole mass spectrometer was used to screen the characteristic ions of each substance, obtain the signal intensity of the characteristic ions, and integrate and correct the peaks with the help of the MultiQuant (3.0) software, and the area of each peak represented the relative content of the corresponding substance [25].

2.5. Statistical Analysis

Excel 2020 was used to perform preliminary statistical analysis and conventional bar graph production of the raw data, and the differences in different indexes were obtained by ANOVA and were considered statistically significant at p < 0.05. Rstudio software (v4.2.3) was used for in-depth analysis of post-statistical data, including graphing and model construction [26]. In particular, box plots were produced with the R package as gghalves 0.1.4, Wayne plots as ggVennDiagram 1.5.2, principal component plots as ggbiplot 0.55, bubble heat maps as ggplot2 3.5.1, Mulberry plots as networkD3. PLS-SEM equations were constructed as plpm 0.4.9, and volcano plots as ggplot2 3.5.0, bubble feature maps for ggplot2 3.4.0, TOPSIS analysis as dplyr 1.1.4, OPLS-DA model construction as ropls and mixOmics, KEGG function enrichment as clusterProfiler 4.10.0, redundancy analysis as vegan 2.6.4, and correlation interactions network diagram as linkET 0.0.7.1.

3. Results

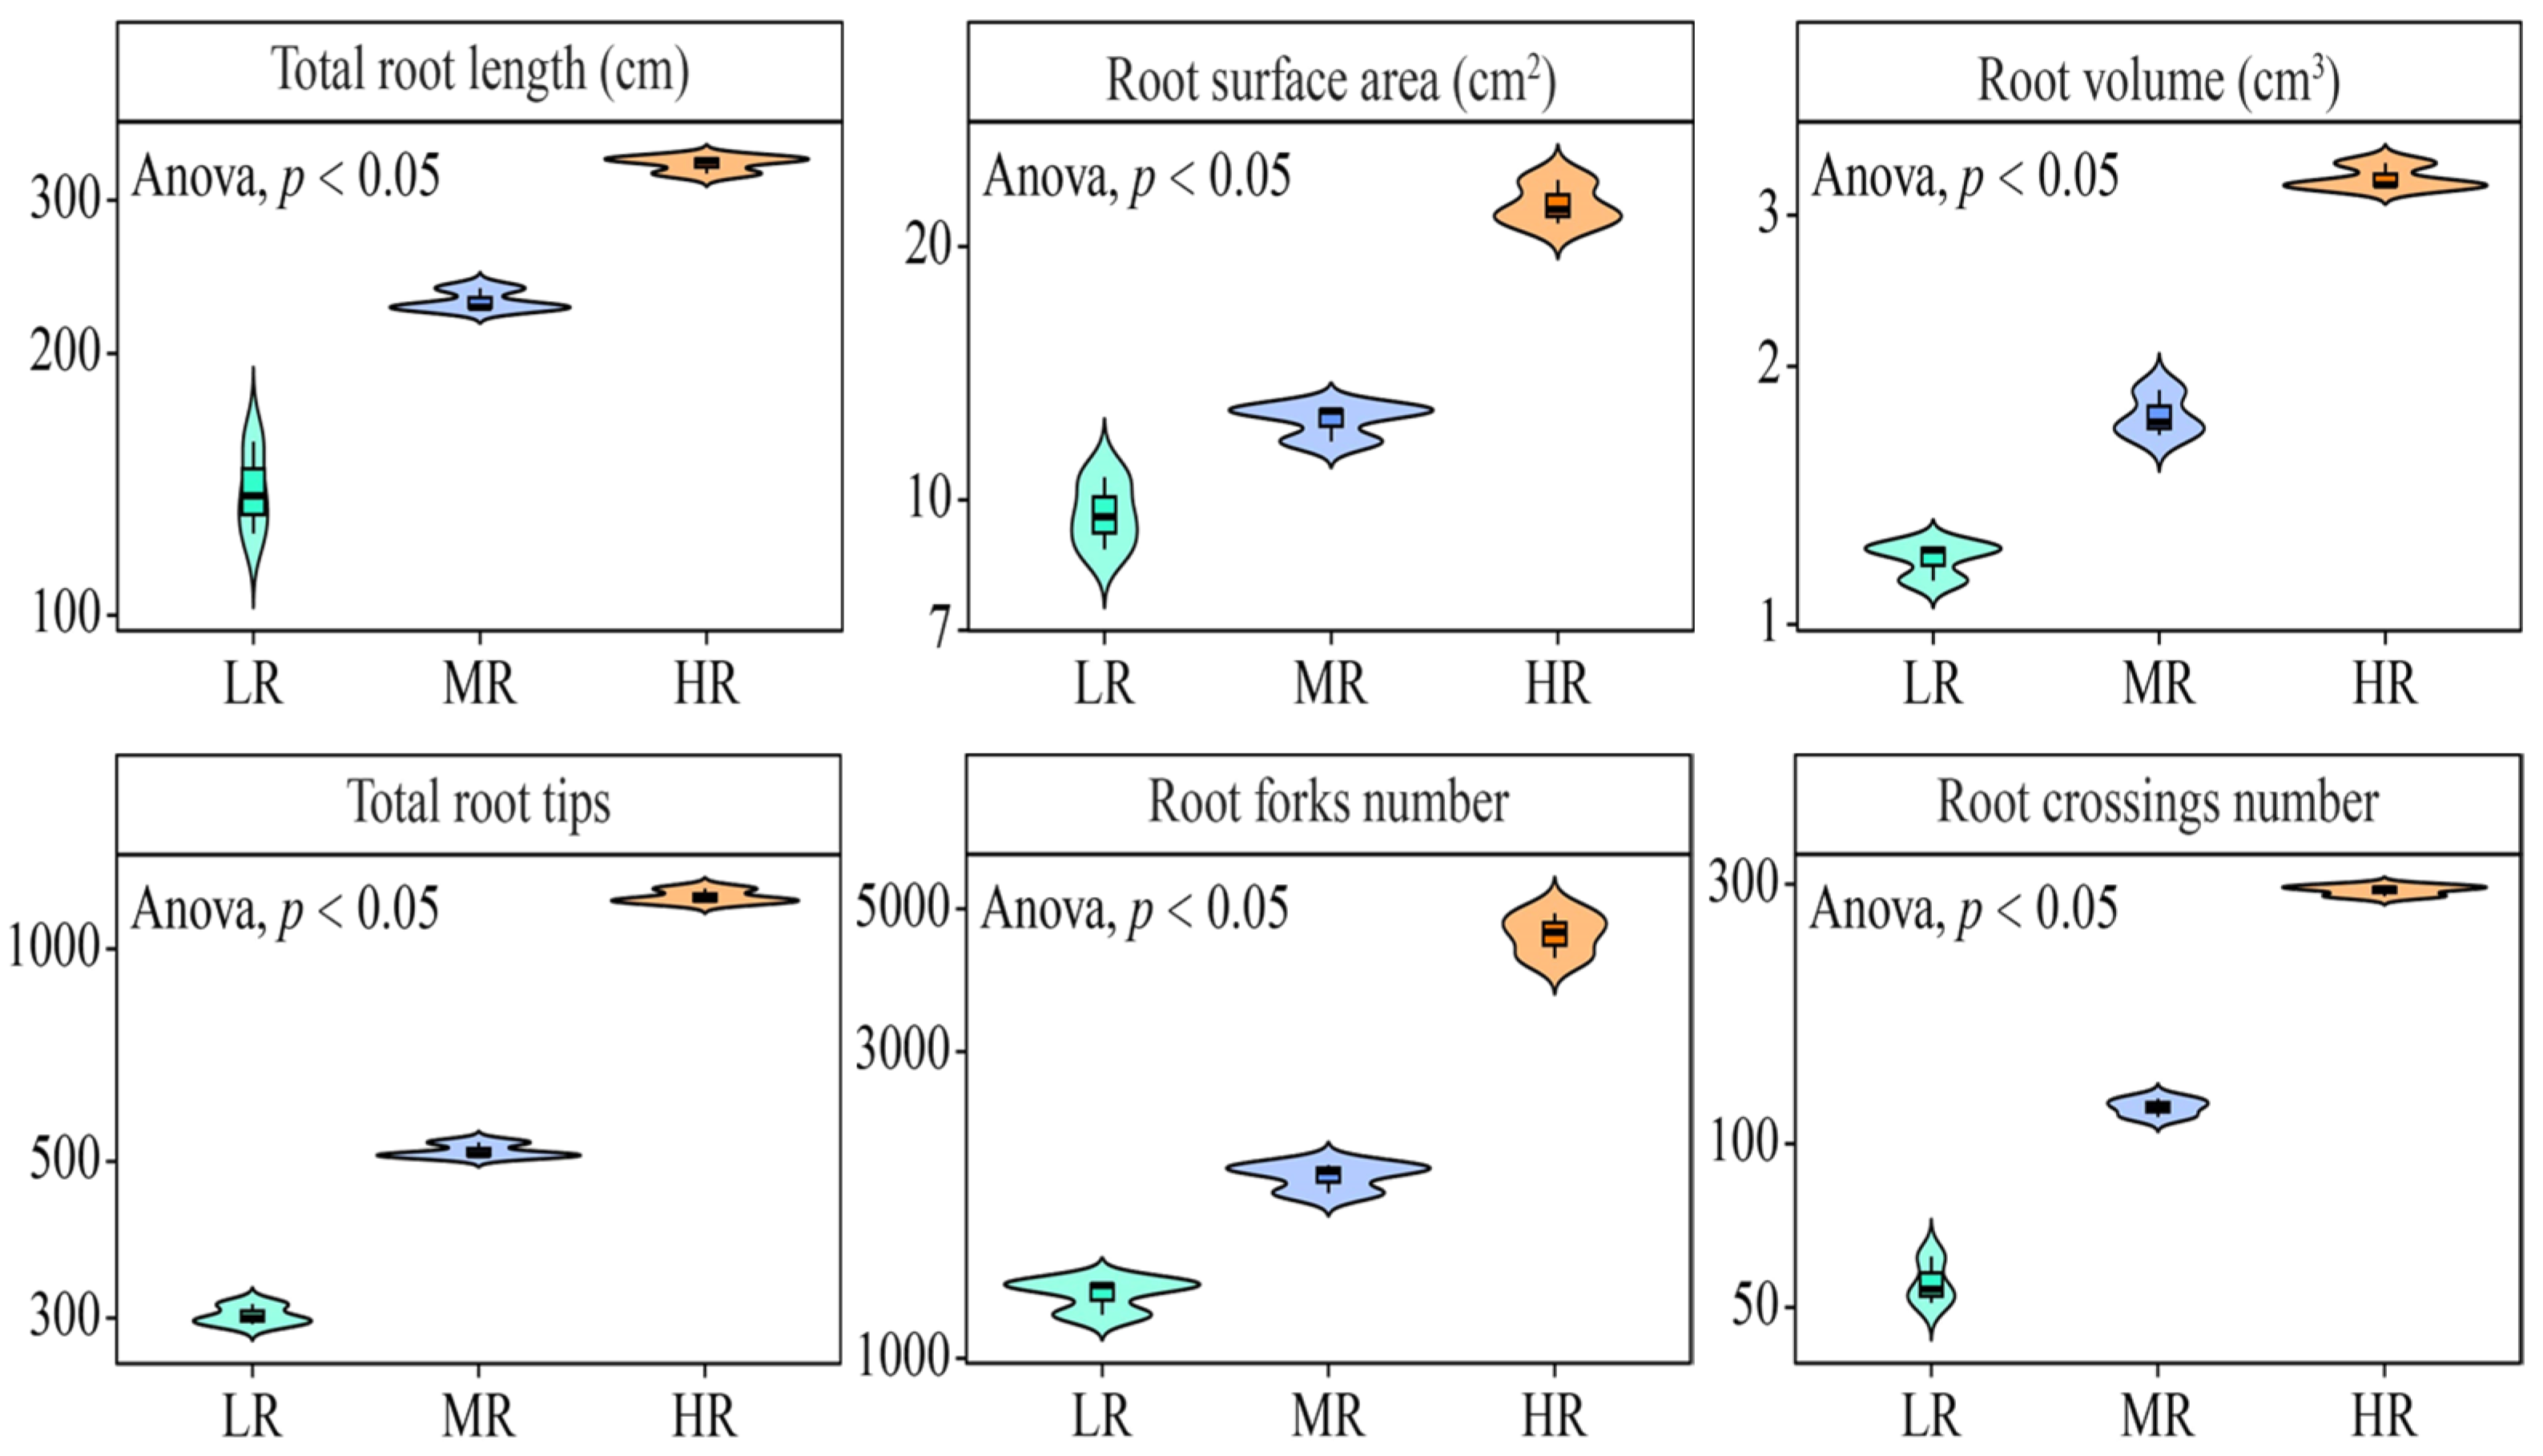
3.1. Effect of pH on the Growth of Tea Plant Roots

In this study, different pH treatments were carried out to analyze the effect of pH on the root growth of tea plant. The results showed (Figure 1) that with the increase in treatment pH, total root length, root surface area, root volume, total root tips, root forks number, and root crossings number of tea plant showed a significant increasing trend, i.e., from 139.93 to 330.45 cm, 9.64 to 22.48 cm2, 1.19 to 3.32 cm3, 302.67 to 1185.67, 1258.33 to 4573.67, 55.67 to 292.33. It can be seen that the increase in pH is favorable for promoting the root growth of tea plant.

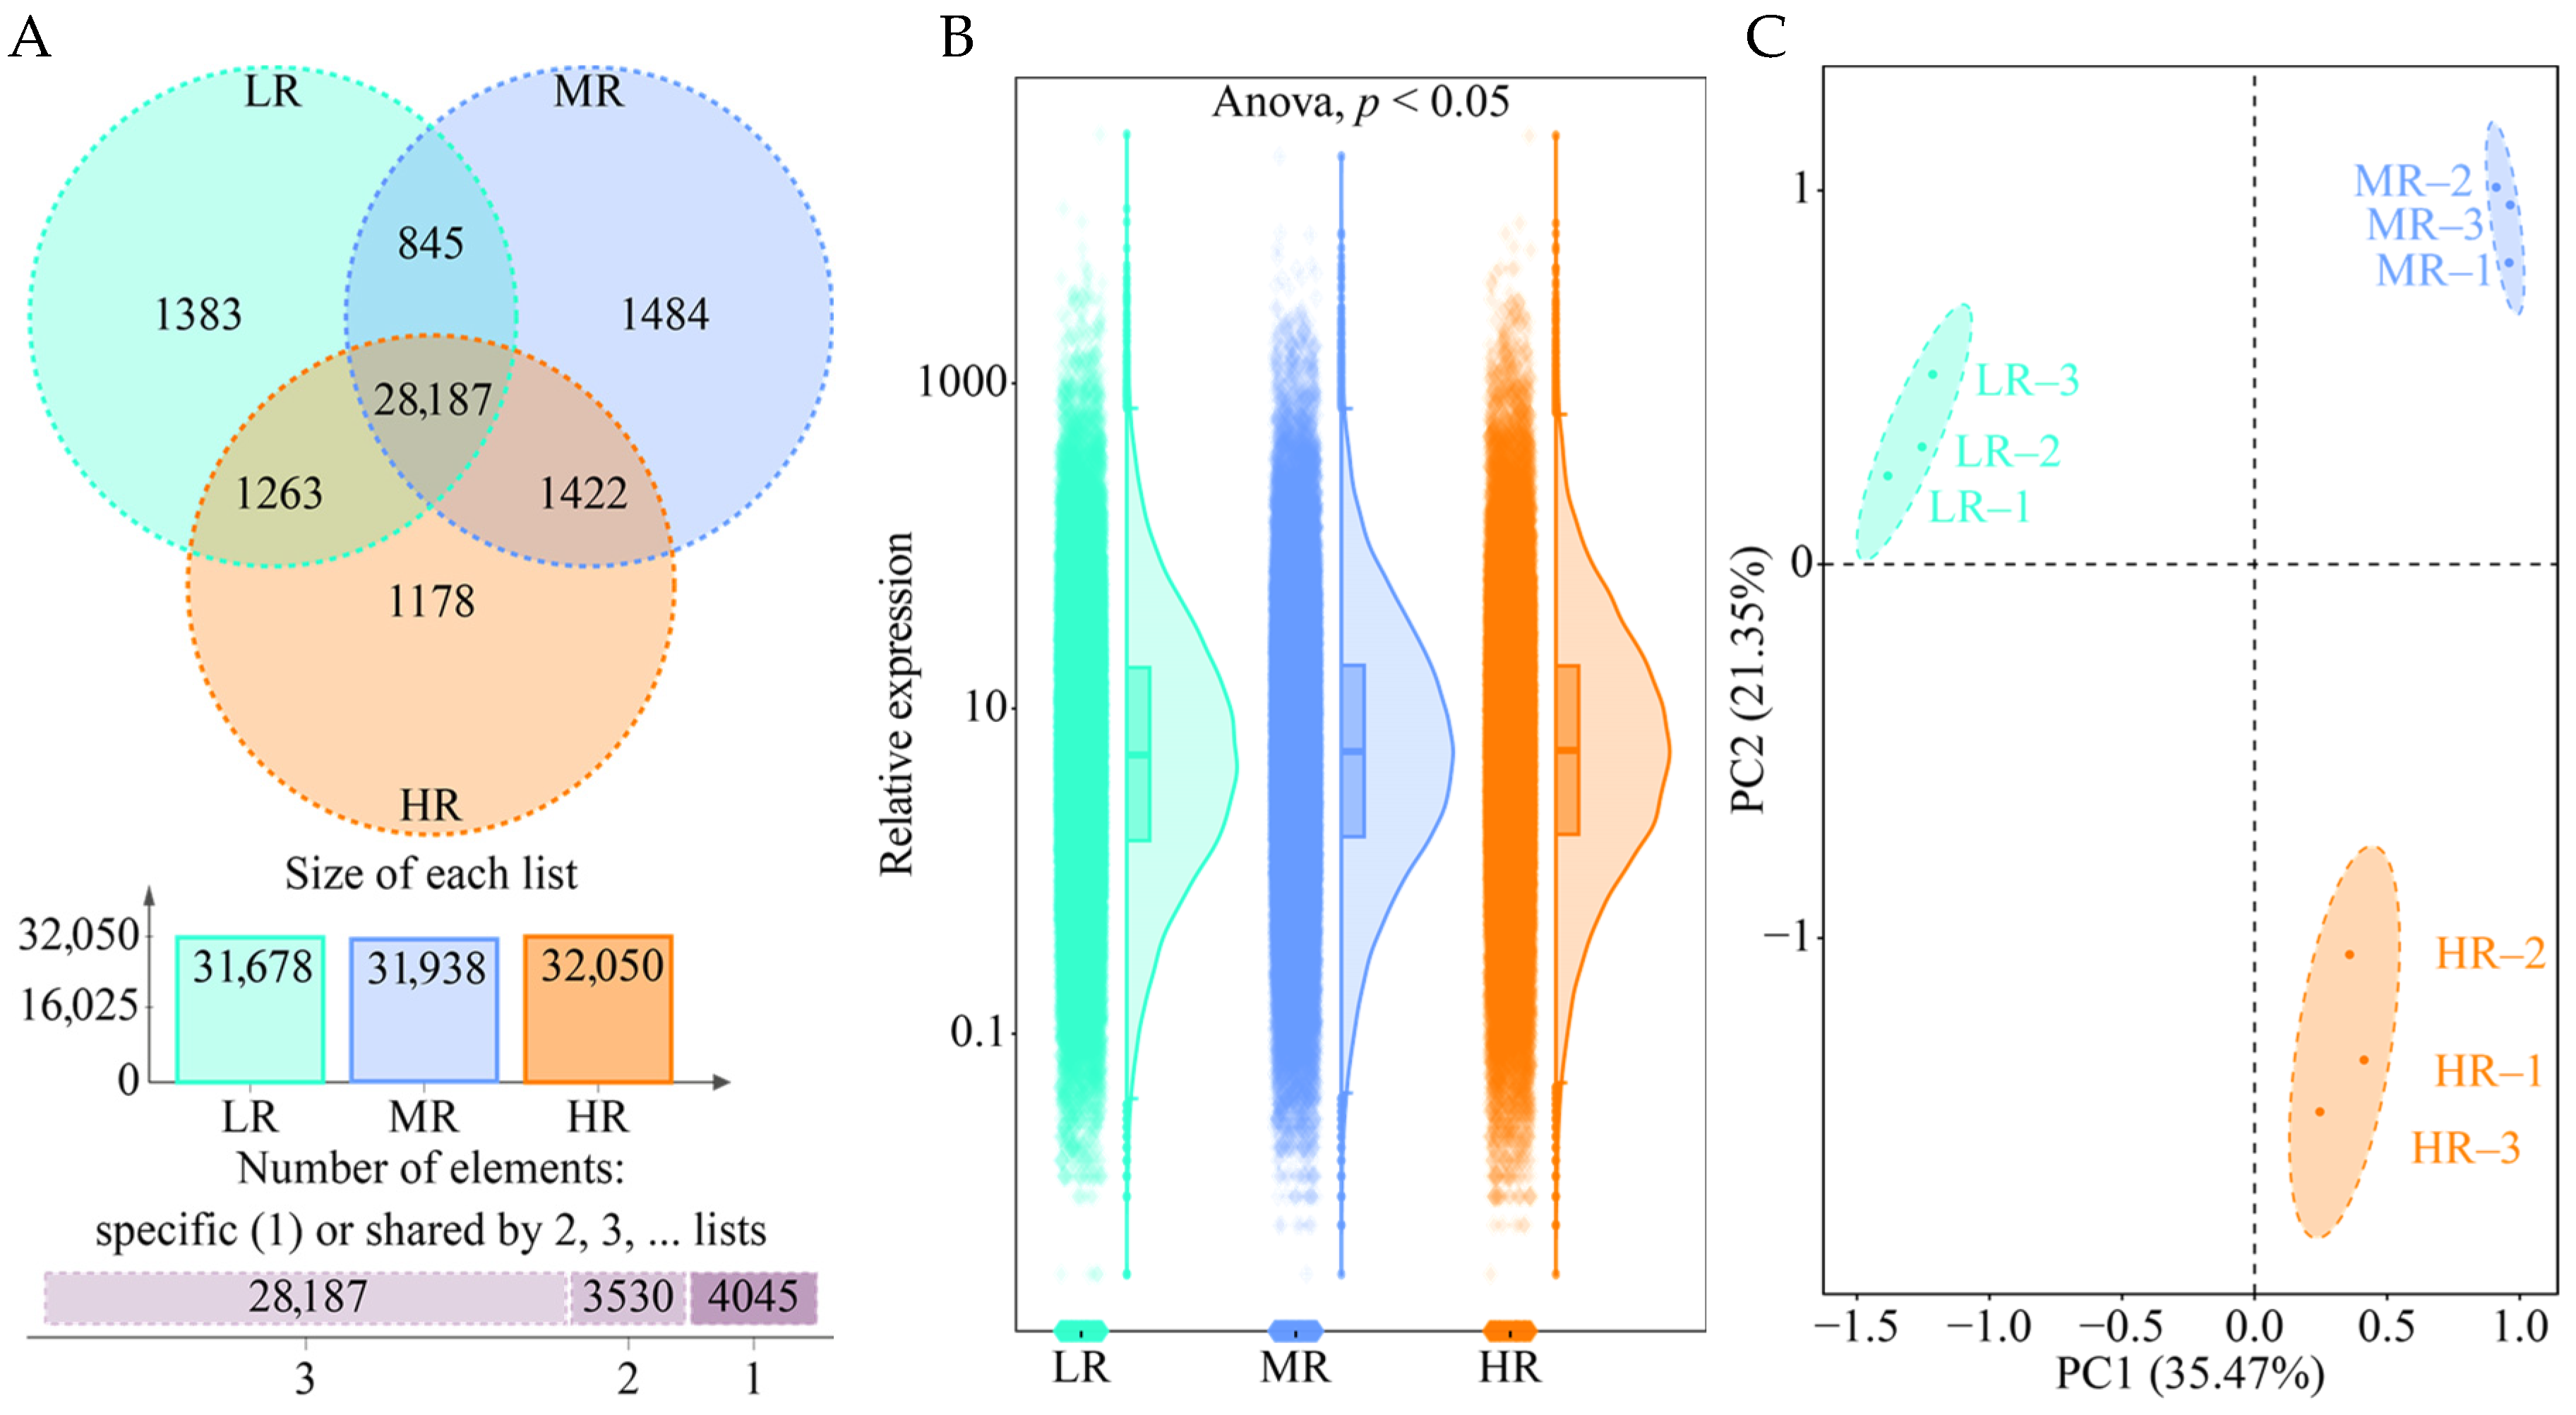
3.2. Effect of pH on Gene Expression in Tea Plant Roots

In this study, the effects of different pH treatments on gene expression in the root system of tea plant were analyzed using transcriptomics techniques, and the results showed (Figure 2A) that a total of 39,488 genes were detected in the root system of tea plant, of which 28,187 genes were common to LR, MR and HR, 1383 genes were specific to LR, 1484 genes were specific to MR, and 1178 genes were specific to HR. The gene expression analysis in the tea plant root system (Figure 2B) showed that there was a significant difference (p < 0.05) in the overall expression of genes in the LR, MR, and HR root systems. Principal component analysis based on the expression of 39,488 genes revealed (Figure 2C) that there was a significant difference in gene expression among LR, MR, and HR, and the two principal components could effectively differentiate between LR, MR, and HR with an overall contribution of 56.82%. It can be seen that there were significant differences in the expression of tea plant root genes under different pH treatments.

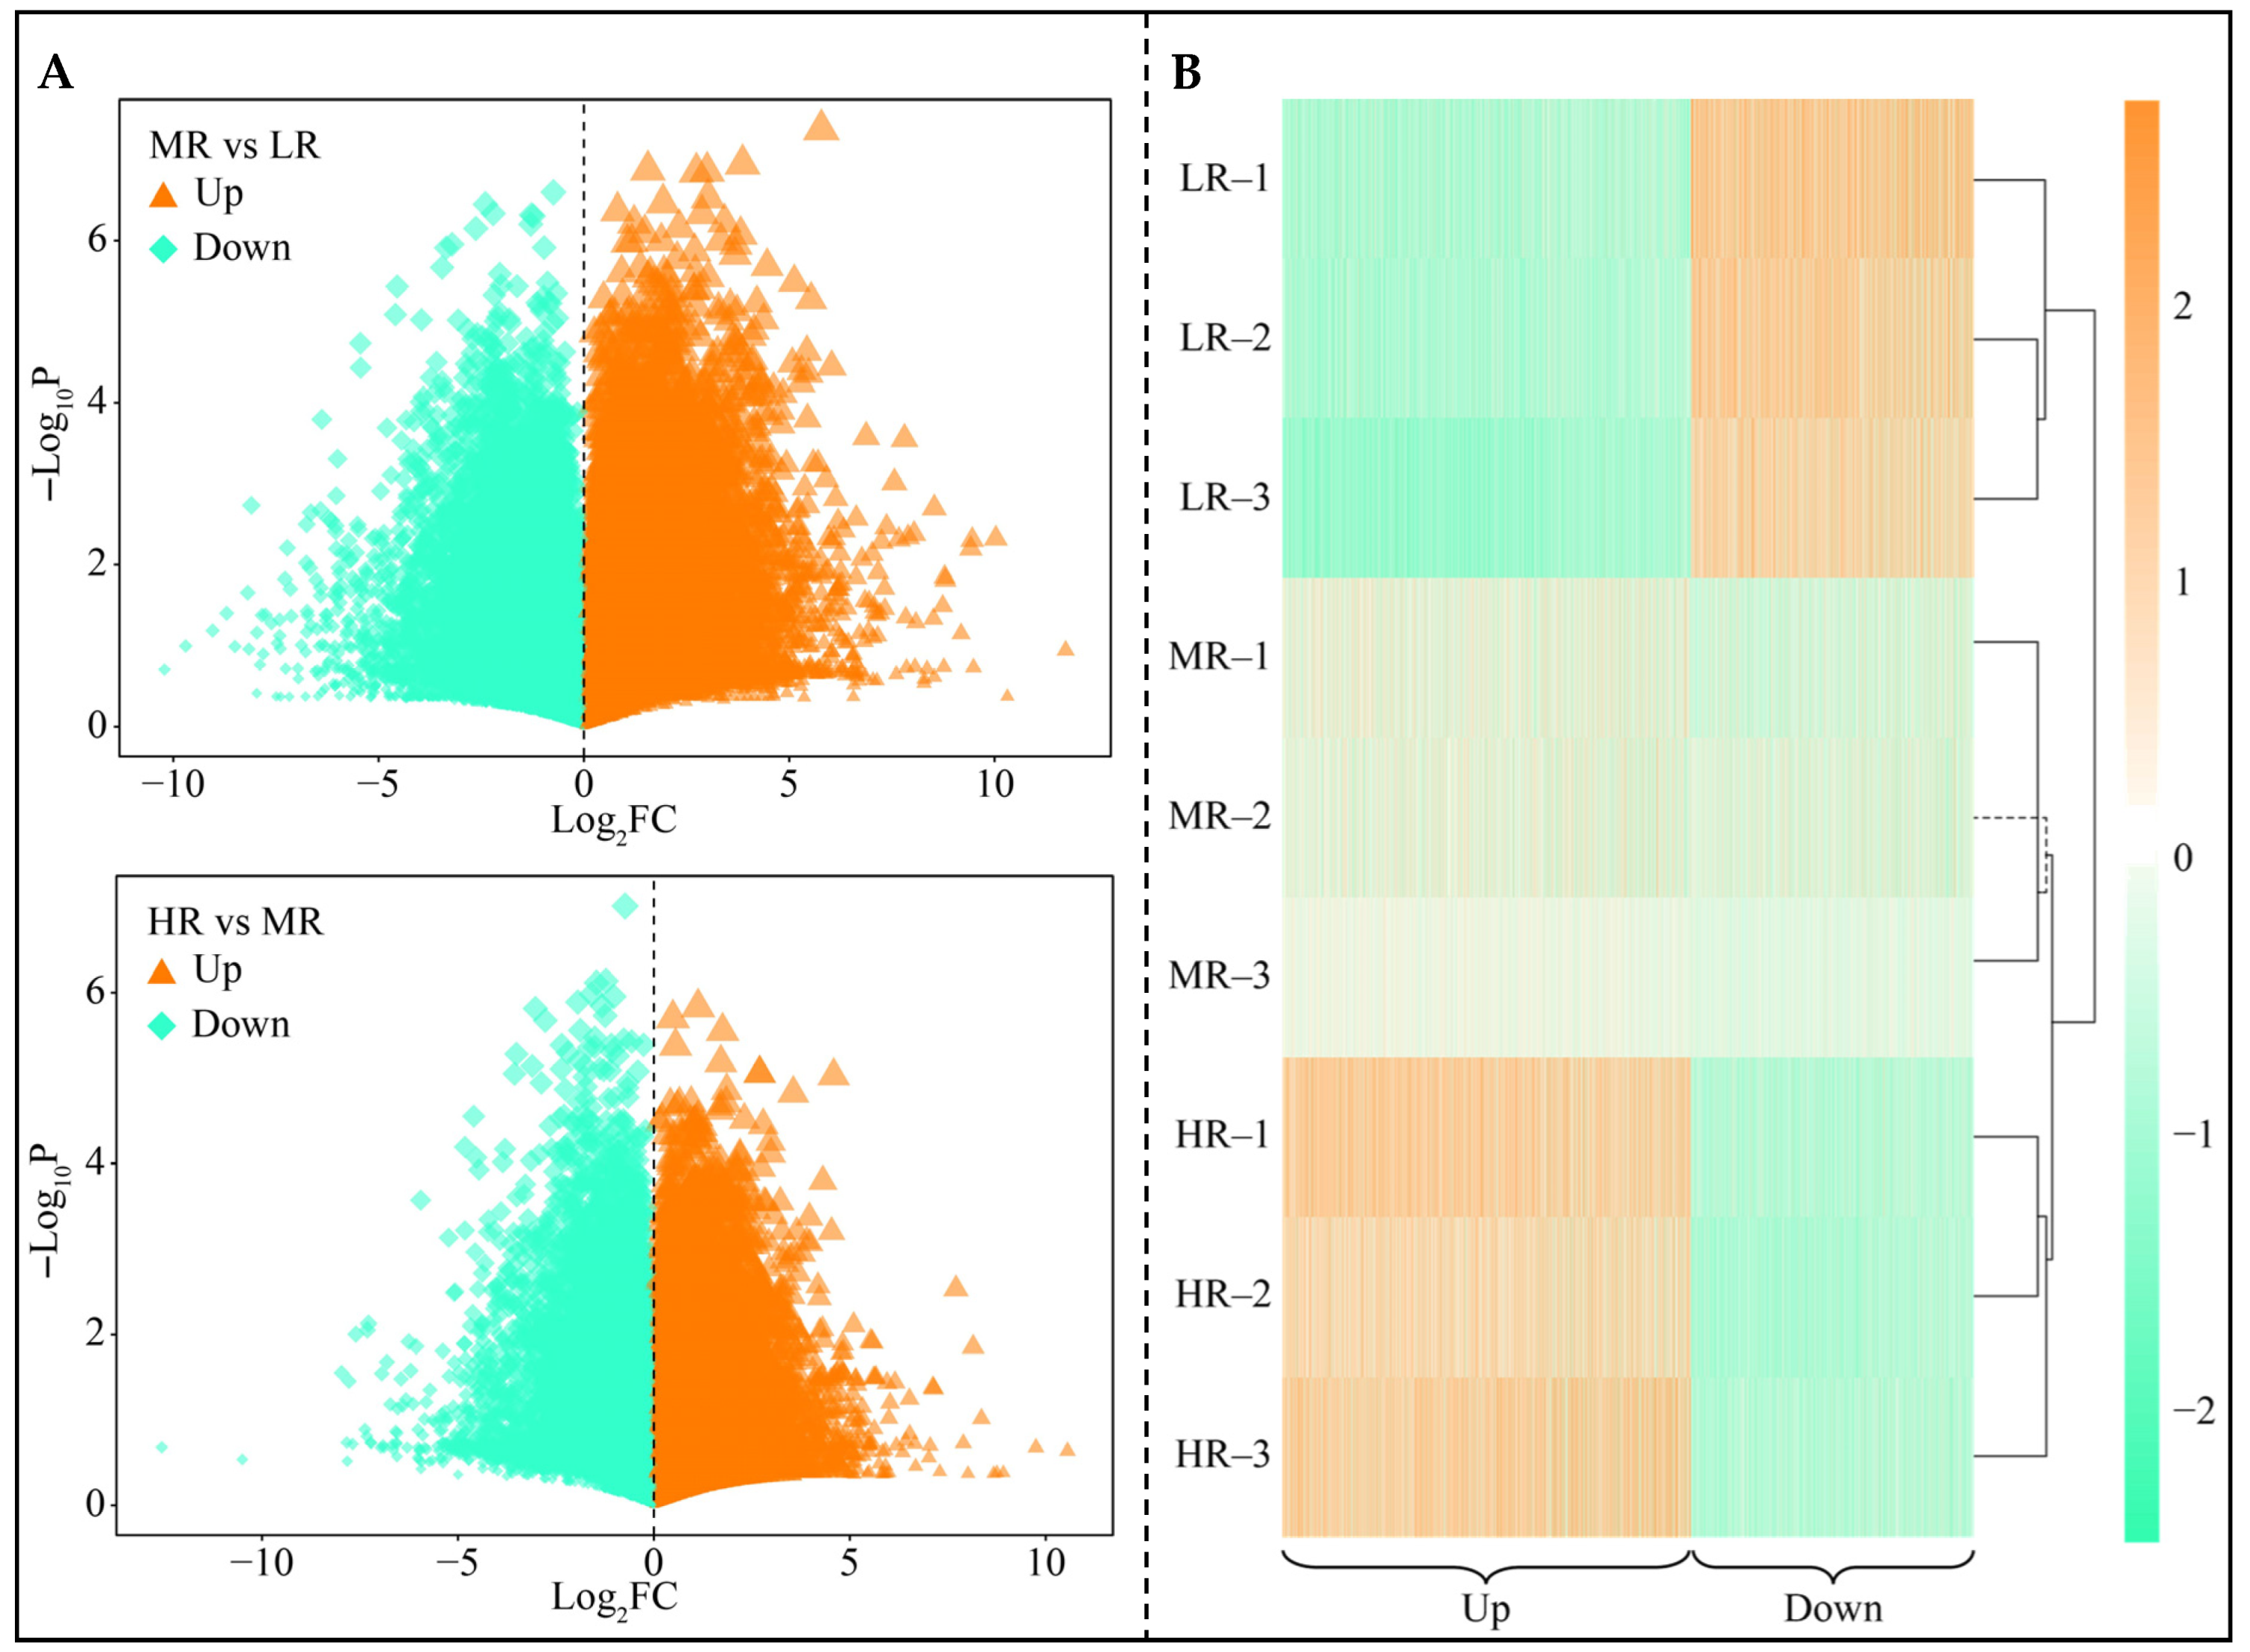
3.3. Screening for Differential Genes in the Root System of Tea Plant in Response to pH Regulation

In this study, volcano plots were used to further screen for genes with differential expression in LR, MR and HR, and the results showed (Figure 3A) that 19,705 genes with an increasing trend and 19,709 genes with a decreasing trend were obtained in MR compared to LR, and 21,942 genes with an increasing trend and 17,417 genes with a decreasing trend were found in HR compared to MR. Further analysis revealed (Figure 3B) that a total of 12,267 differential genes existed in LR, MR, and HR with increasing pH, of which 7250 showed an increasing trend and 5017 showed a decreasing trend in gene expression.

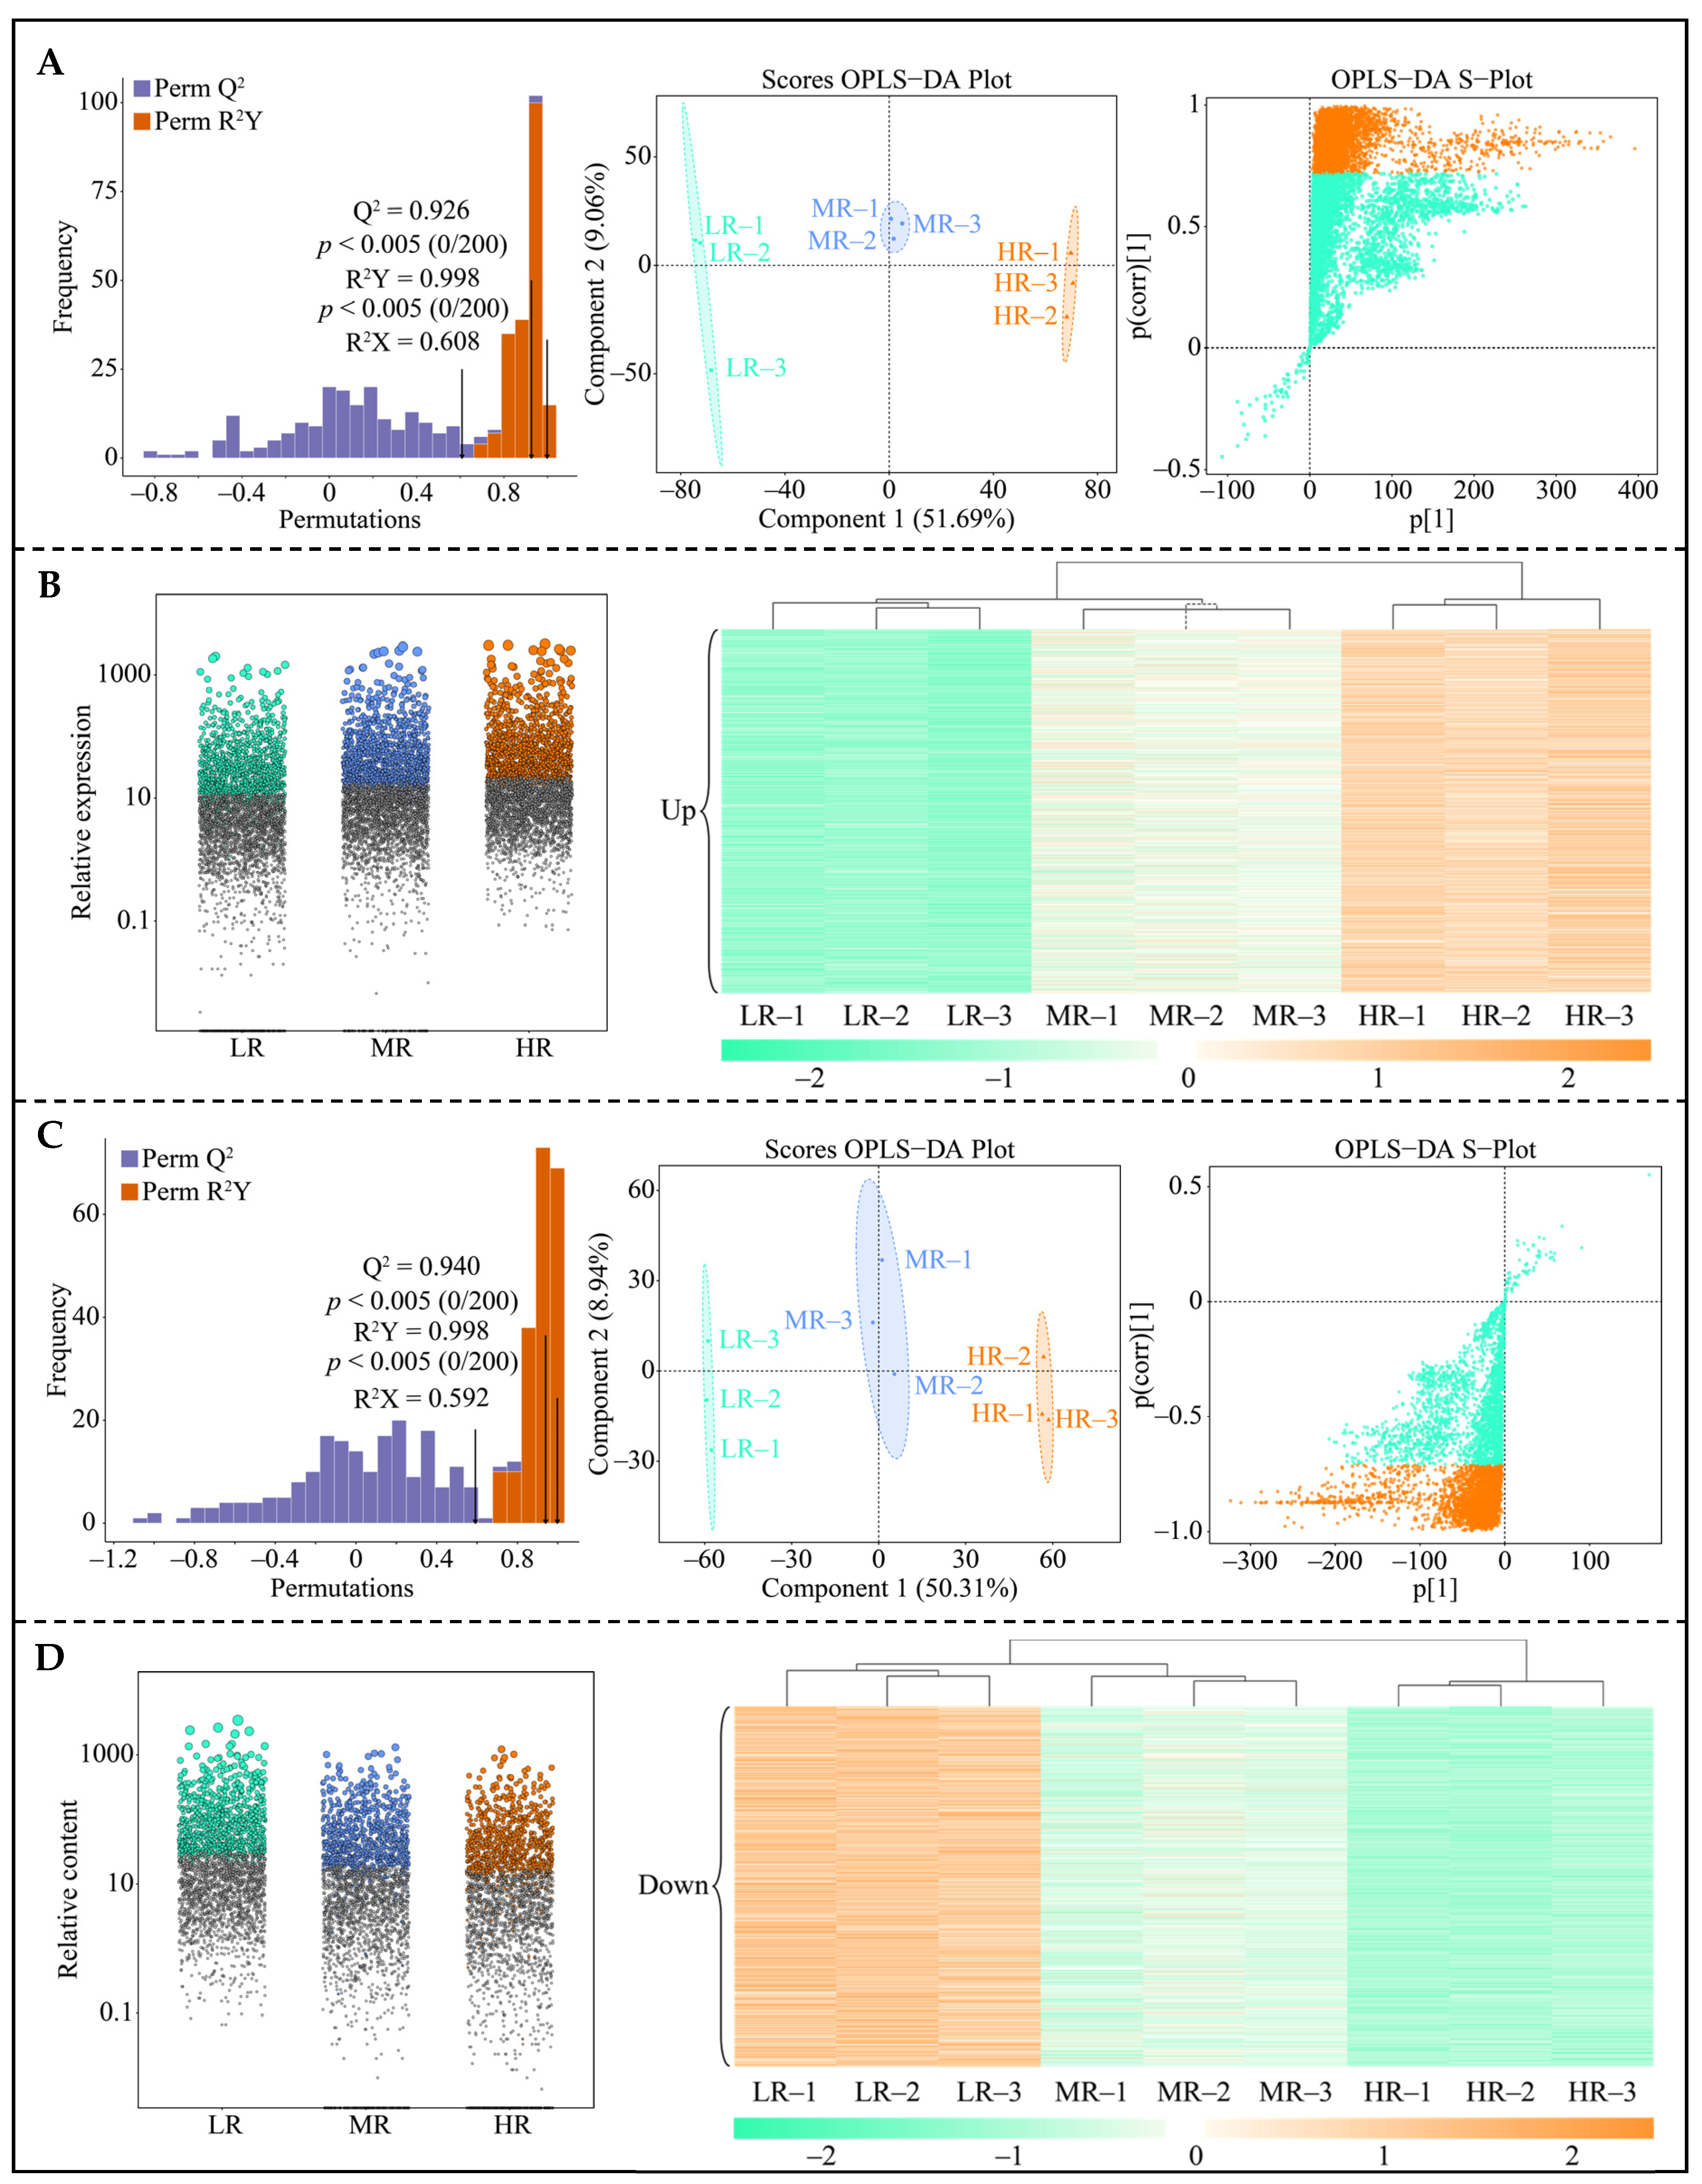
3.4. Screening for Characteristic Genes in the Root System of Tea Plant in Response to pH Regulation

After the above analysis, this study further constructed OPLS-DA models of LR, MR, and HR based on upward-trending differential genes and screened for key differential genes among the three treatments. The fit and predictability of the constructed OPLS-DA models of LR, MR, and HR reached significant levels (R2Y = 0.998, p < 0.005; Q2 = 0.926, p < 0.005), which could effectively distinguish LR, MR, and HR into different regions (Figure 4A). Based on this, the VIP values of different genes were derived from the S-plot plots of the OPLS-DA model, and a total of 3863 key genes with VIP values greater than 1 that could effectively distinguish LR, MR, and HR were obtained. Analysis of the 3863 key genes using the bubble feature map revealed (Figure 4B, Table S1) that there were only 1576 characteristic genes distinguishing between LR, MR, and HR, and all of them showed a significant increase in expression with the increase in pH.
In addition, this study constructed OPLS-DA models of LR, MR, and HR based on downward-trending differential genes and screened for key differential genes among the three treatments. Both the goodness-of-fit and predictability of the model also reached a significant level (R2Y = 0.998, p < 0.005; Q2 = 0.940, p < 0.005), and the model was able to effectively differentiate LR, MR, and HR in different regions (Figure 4C). Further, 2645 key genes with VIP values greater than 1, which could significantly distinguish LR, MR, and HR, were derived from the S-plot plots of the model. Bubble feature map analysis of key genes revealed (Figure 4D, Table S2) that a total of 1078 characteristic genes were obtained, and their expression tended to decrease with the increase in pH.

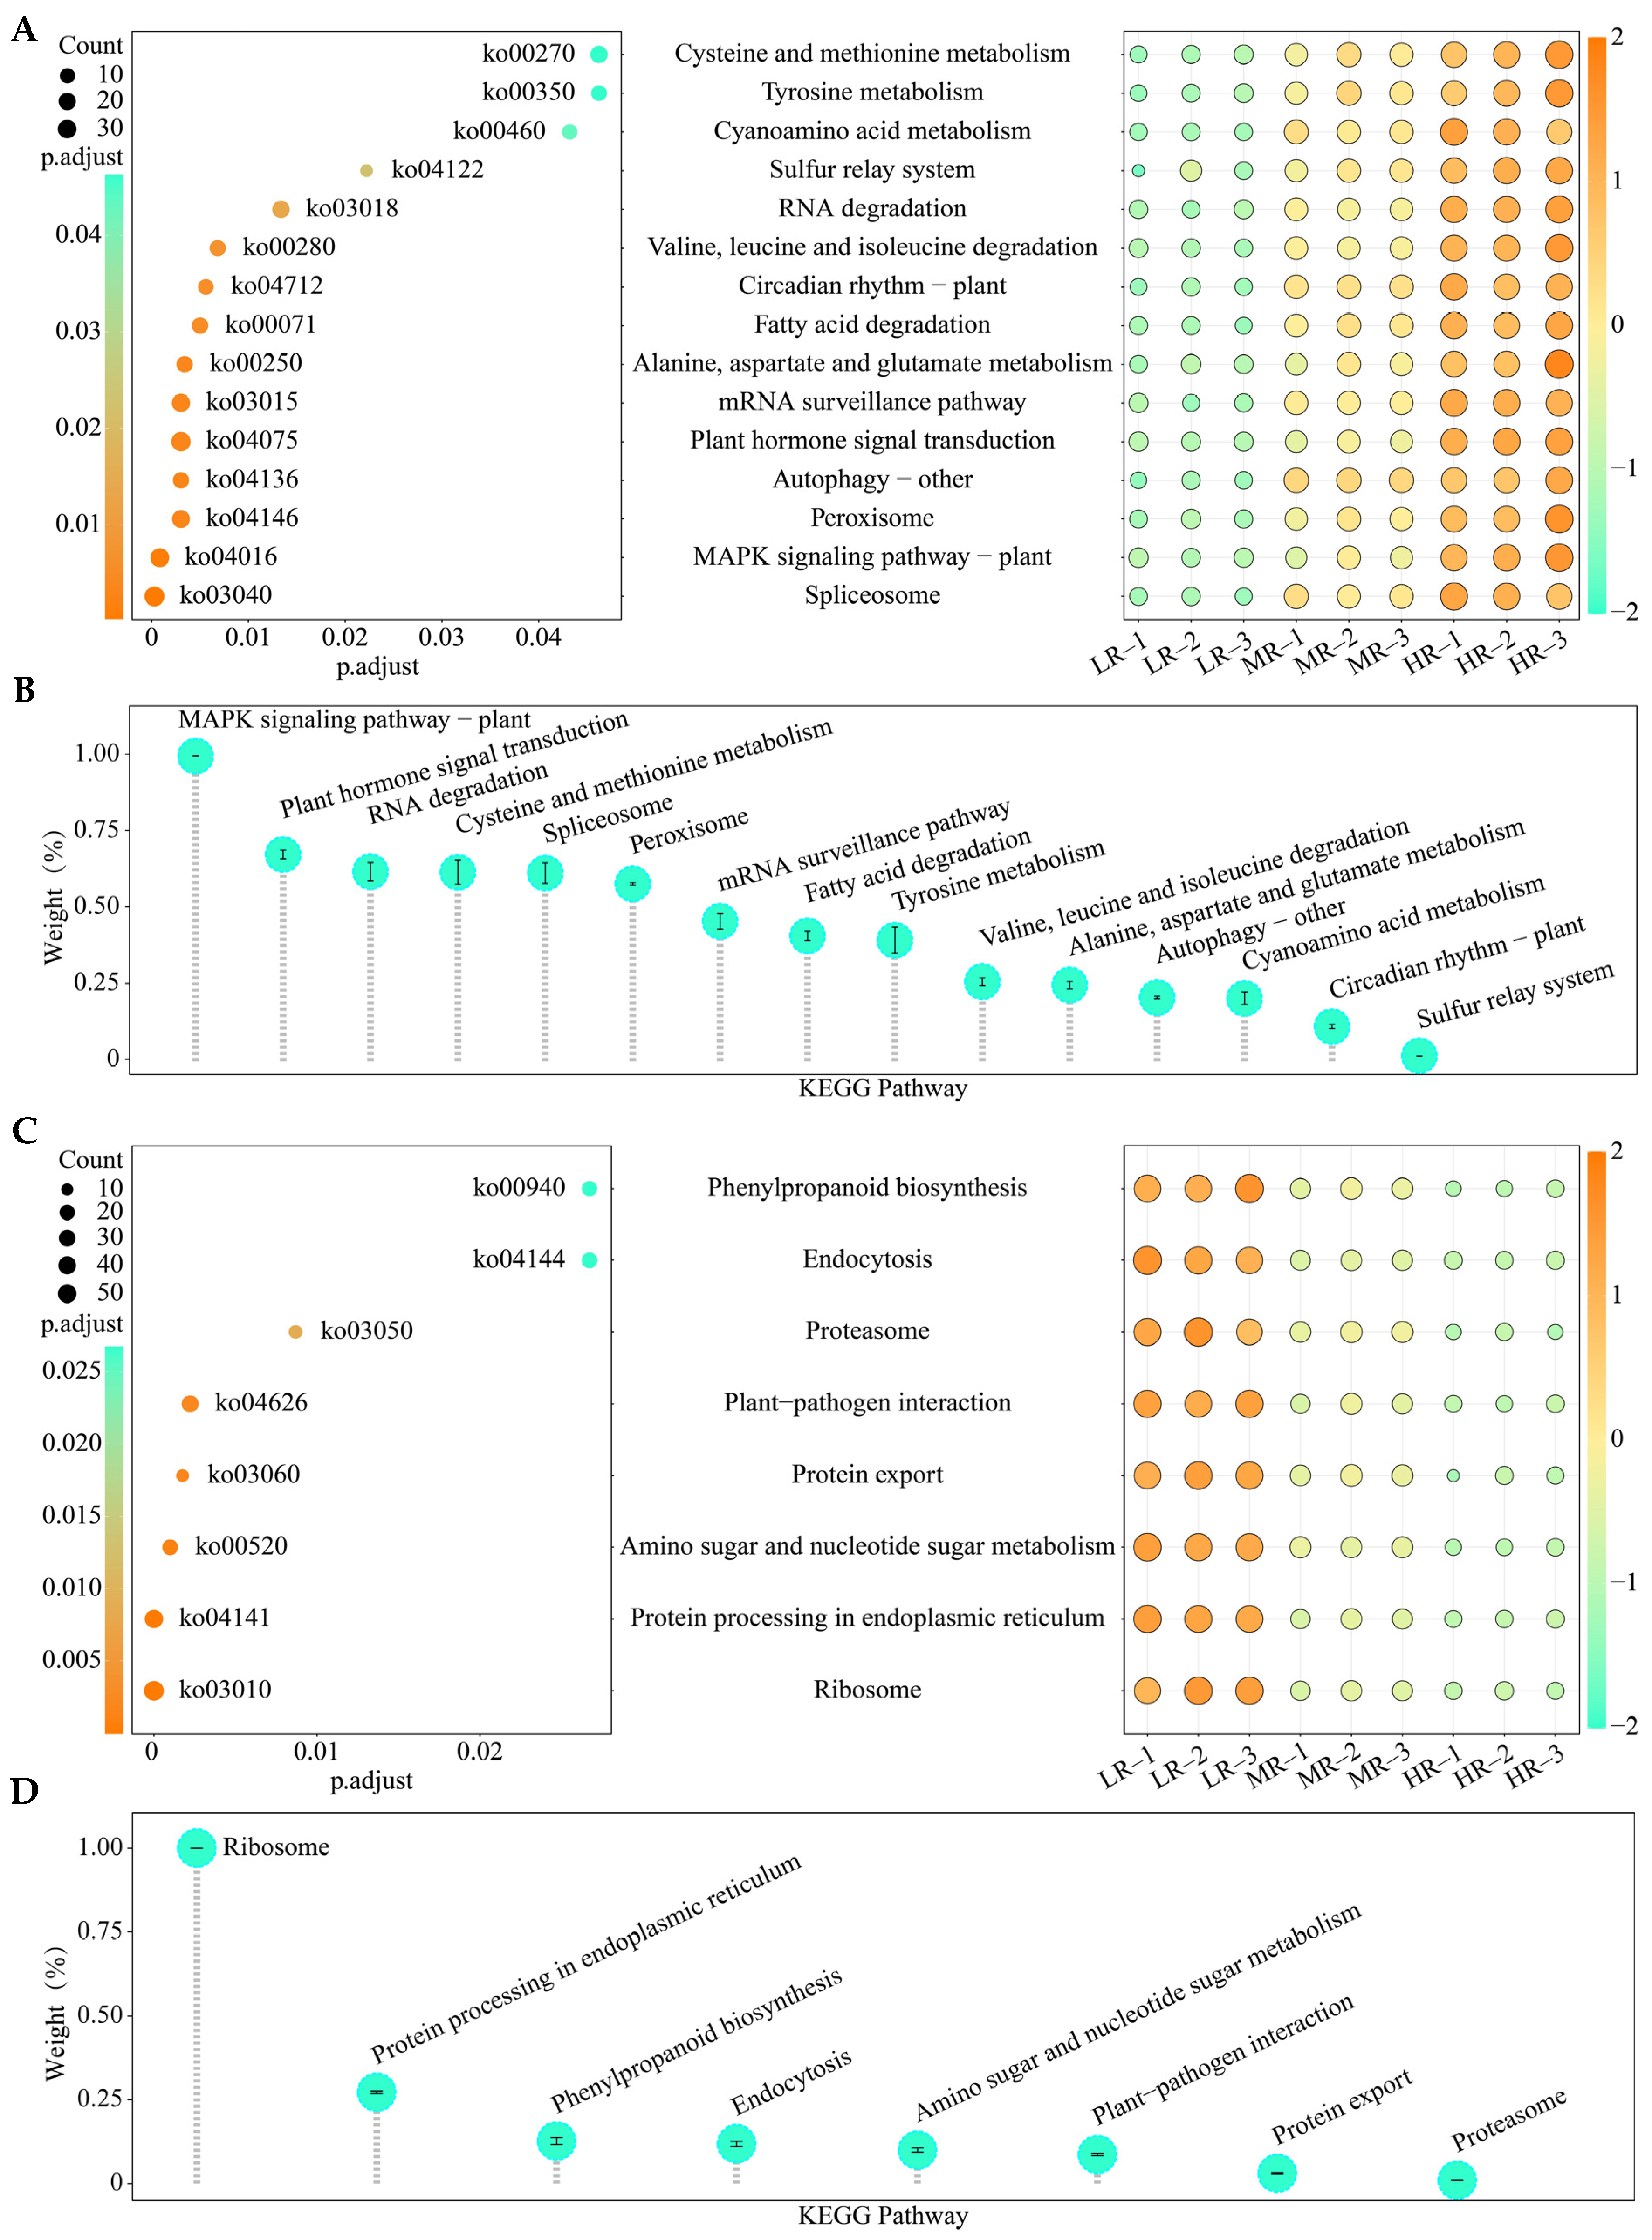
3.5. KEGG Pathway Enrichment Analysis of Characteristic Genes

On the basis of the above analysis, KEGG pathway enrichment with significantly increasing characteristic genes (SICG) showed (Figure 5A) that 1576 SICG were enriched to a total of 109 KEGG pathways, of which only 15 pathways were enriched to a significant level (p.adjust < 0.05). TOPSIS analysis of the weights of the 15 significantly enriched pathways in distinguishing LR, MR and HR revealed (Figure 5B) that there were 14 key pathways that contributed more than 10% in distinguishing LR, MR and HR, especially the top three ranked as MAPK signaling pathway—plant (ko04016), plant hormone signal transduction (ko04075) and RNA degradation (ko03018). Secondly, this study performed KEGG pathway enrichment with significantly decreased characteristic genes (SDCG), and the results showed (Figure 5C) that 1078 SDCG were enriched in 97 KEGG pathways, of which only 8 pathways were enriched to a significant level (p.adjust < 0.05). TOPSIS analysis of the weights of the 8 significantly enriched pathways in distinguishing LR, MR and HR revealed (Figure 5D) that only 4 key pathways contributed more than 10% when distinguishing LR, MR and HR, and, in particular,, the top three were ribosome (ko03010), protein processing in the endoplasmic reticulum (ko04141) and phenylpropanoid biosynthesis (ko00940). It can be seen that changes in gene expression in the tea plant root system under the influence of pH significantly affected the intensity of different metabolic pathways in the tea plant root system, which in turn may affect the amount of metabolites and their contents in the tea plant root system.

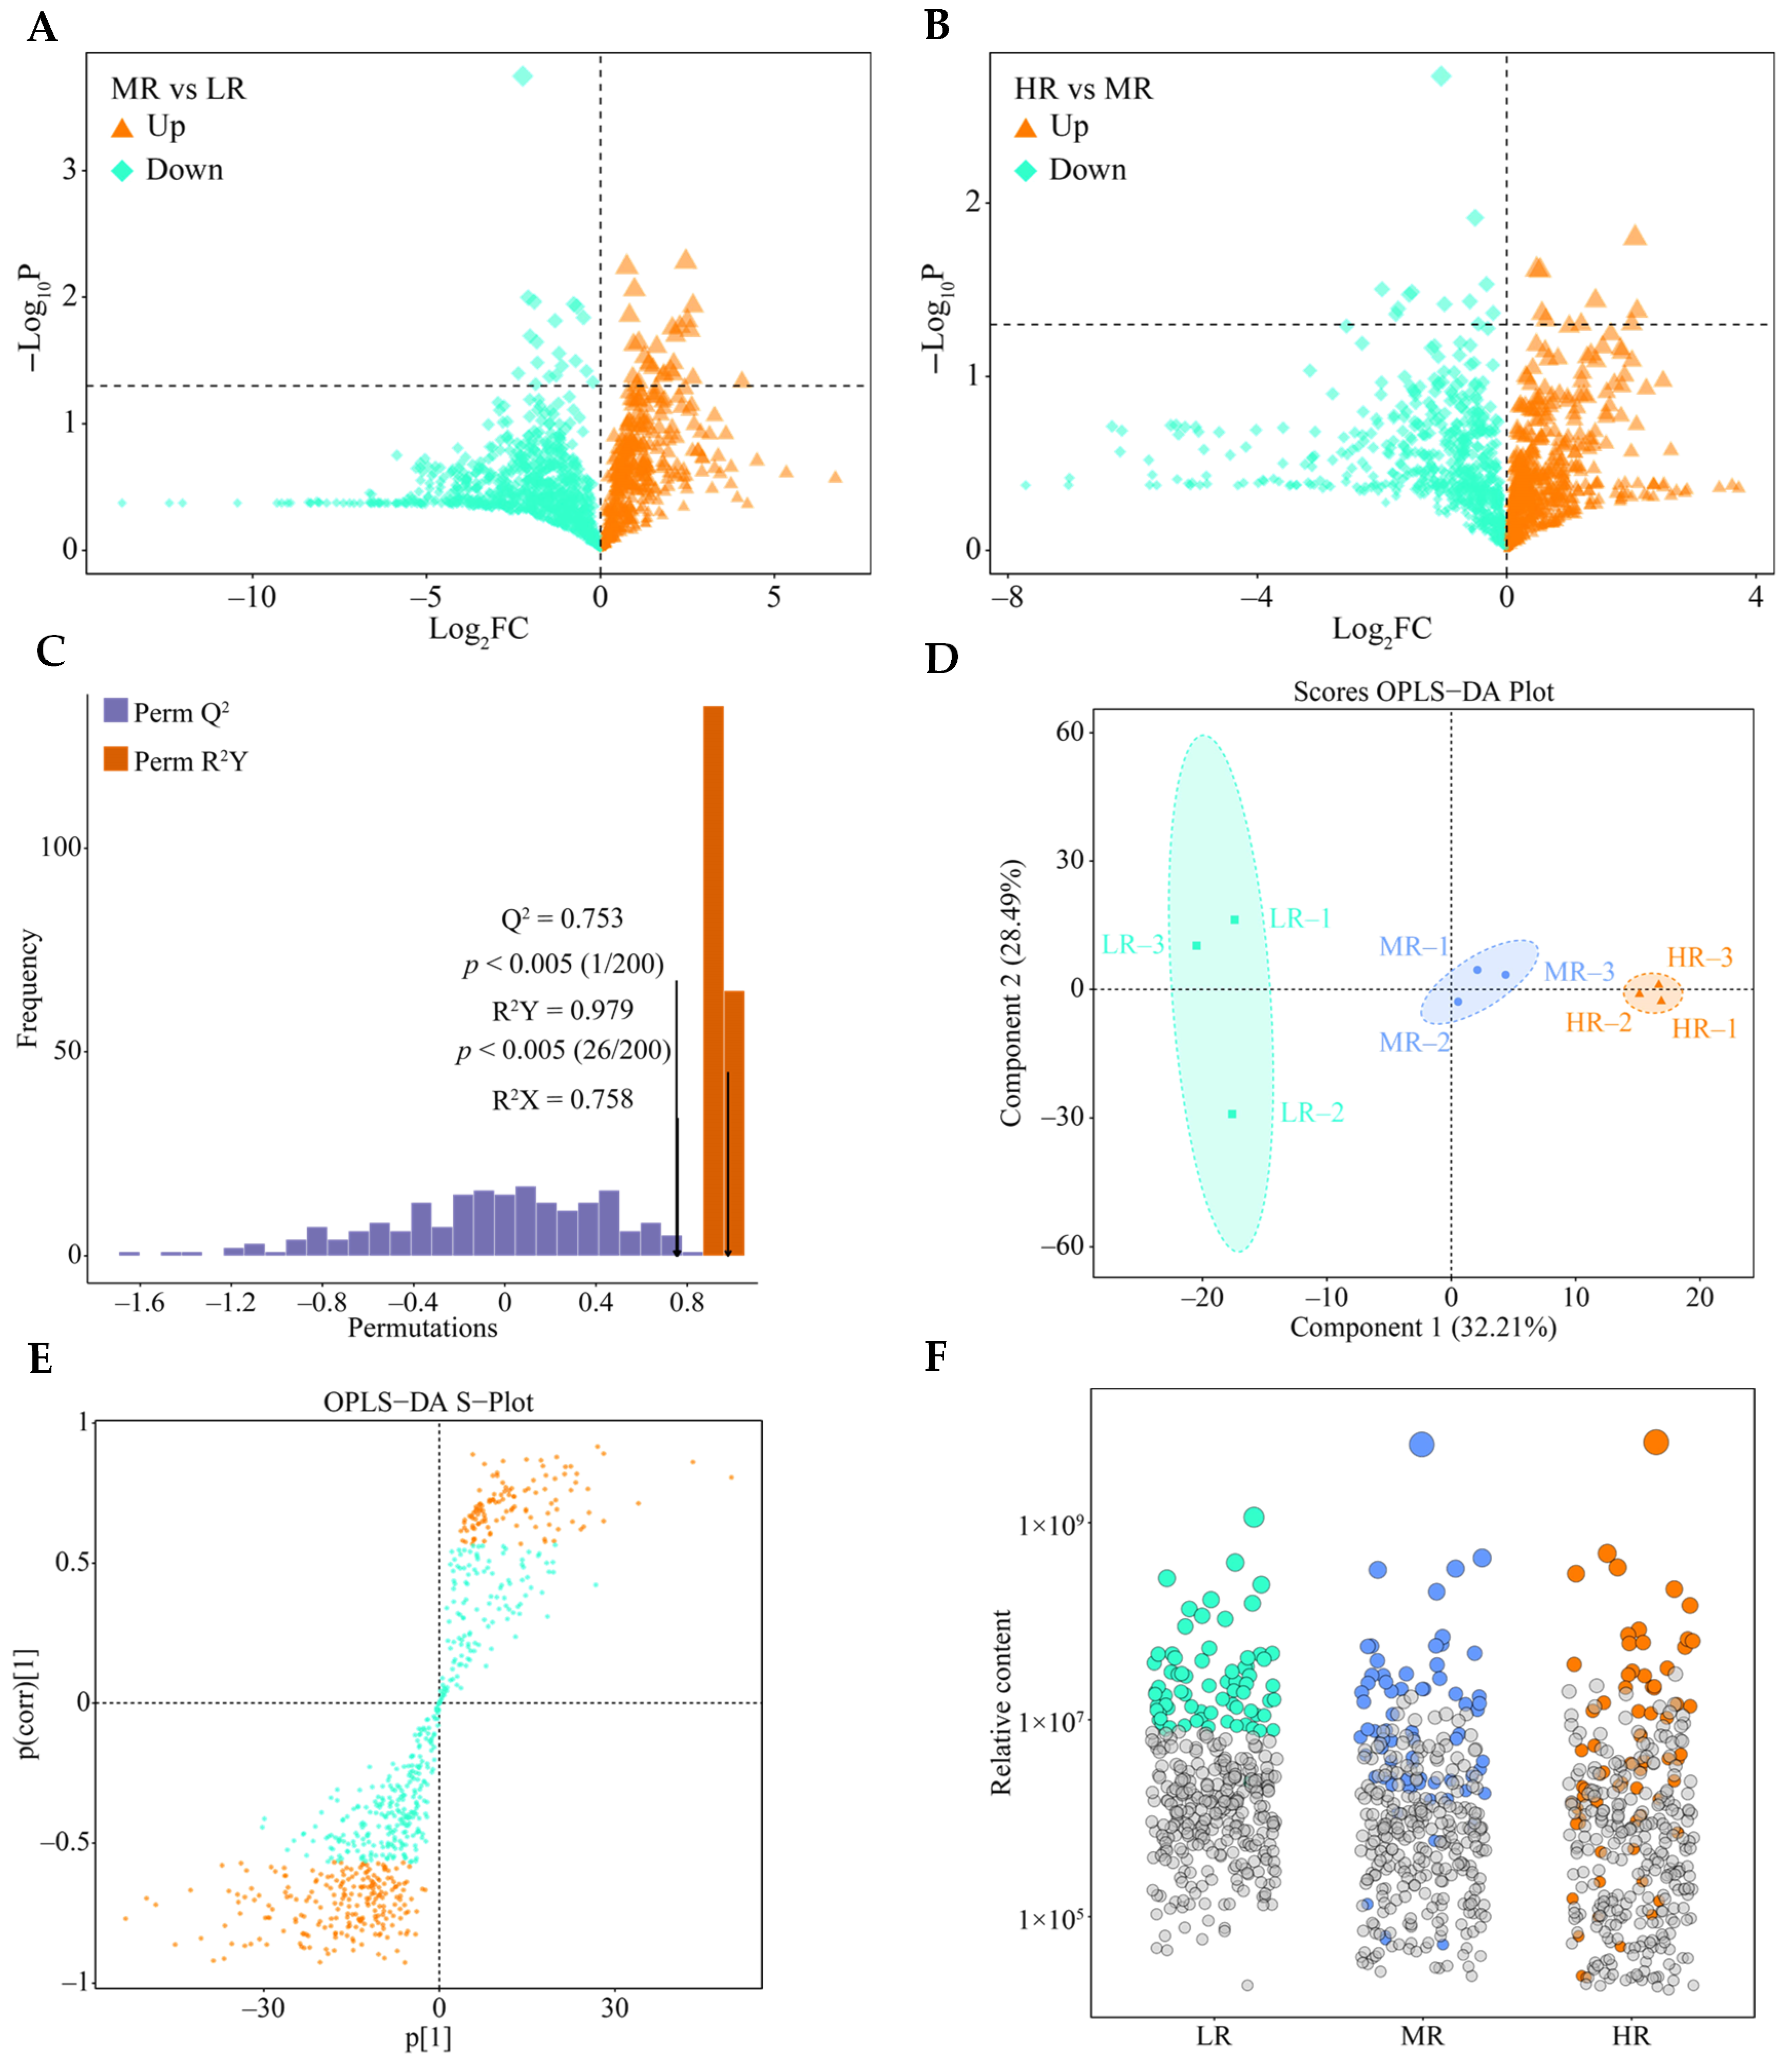
3.6. Effect of pH on Metabolites of Tea Plant Roots

In this study, metabolomics were used to analyze the metabolite types of in the tea plant root system under different pH using (Figure 6A), and it was found that a total of 1433 metabolites were detected in the root system of tea plant, which could be classified into 28 categories according to the first level of classification. Among them, the top 10 categories in terms of the number of types were flavonoids (15.14%), alkaloids (8.37%), heterocyclic compound (8.37%), terpenoids (8.37%), amino acids and derivatives (8.16%), nitrogen compounds (6.14%), organic acids (5.09%), phenolic acids (4.61%), carbohydrates (4.54%) and quinones (4.12%). Further analysis of the metabolite content of tea plant roots under different pH revealed (Figure 6B) that LR, MR, and HR did not differ significantly (p = 0.61) in terms of total metabolite content. Principal component analysis with the contents of 1433 metabolites found (Figure 6C) that LR, MR, and HR were more similar in metabolite contents, with some differences. This result suggests that there may be some effects of pH on the metabolites of tea plant roots.

3.7. Screening for Characteristic Metabolites in the Root System of Tea Plant in Response to pH Regulation

On the basis of the above analysis, the present study used volcano plots to further screen for metabolites with significant differences between LR and MR, and between MR and HR found that 424 metabolites showed an increasing trend and 1009 showed a decreasing trend in MR compared with LR (Figure 7A), and 680 metabolites showed an increasing trend and 753 showed a decreasing trend in HR compared with MR (Figure 7B). Among them, 721 metabolites showed significant changes with increasing pH, of which 196 showed a significant upward trend, and 525 showed a significant downward trend. The significantly changed differential metabolites were further used to construct OPLS-DA models for LR, MR and HR to screen for key differential metabolites, and the results showed (Figure 7C) that the goodness-of-fit values and predictability of the models reached a significant level (R2Y = 0.979, p < 0.005; Q2 = 0.753, p < 0.005), and the models could effectively distinguish LR, MR and HR in different regions (Figure 7D). A total of 338 key metabolites (VIP > 1) that distinguish LR, MR, and HR were obtained from the model’s S-plot diagram (Figure 7E). The 338 key metabolites were analyzed using the bubble feature map, and a total of 73 characteristic metabolites that significantly distinguished LR, MR, and HR were obtained (Figure 7F).

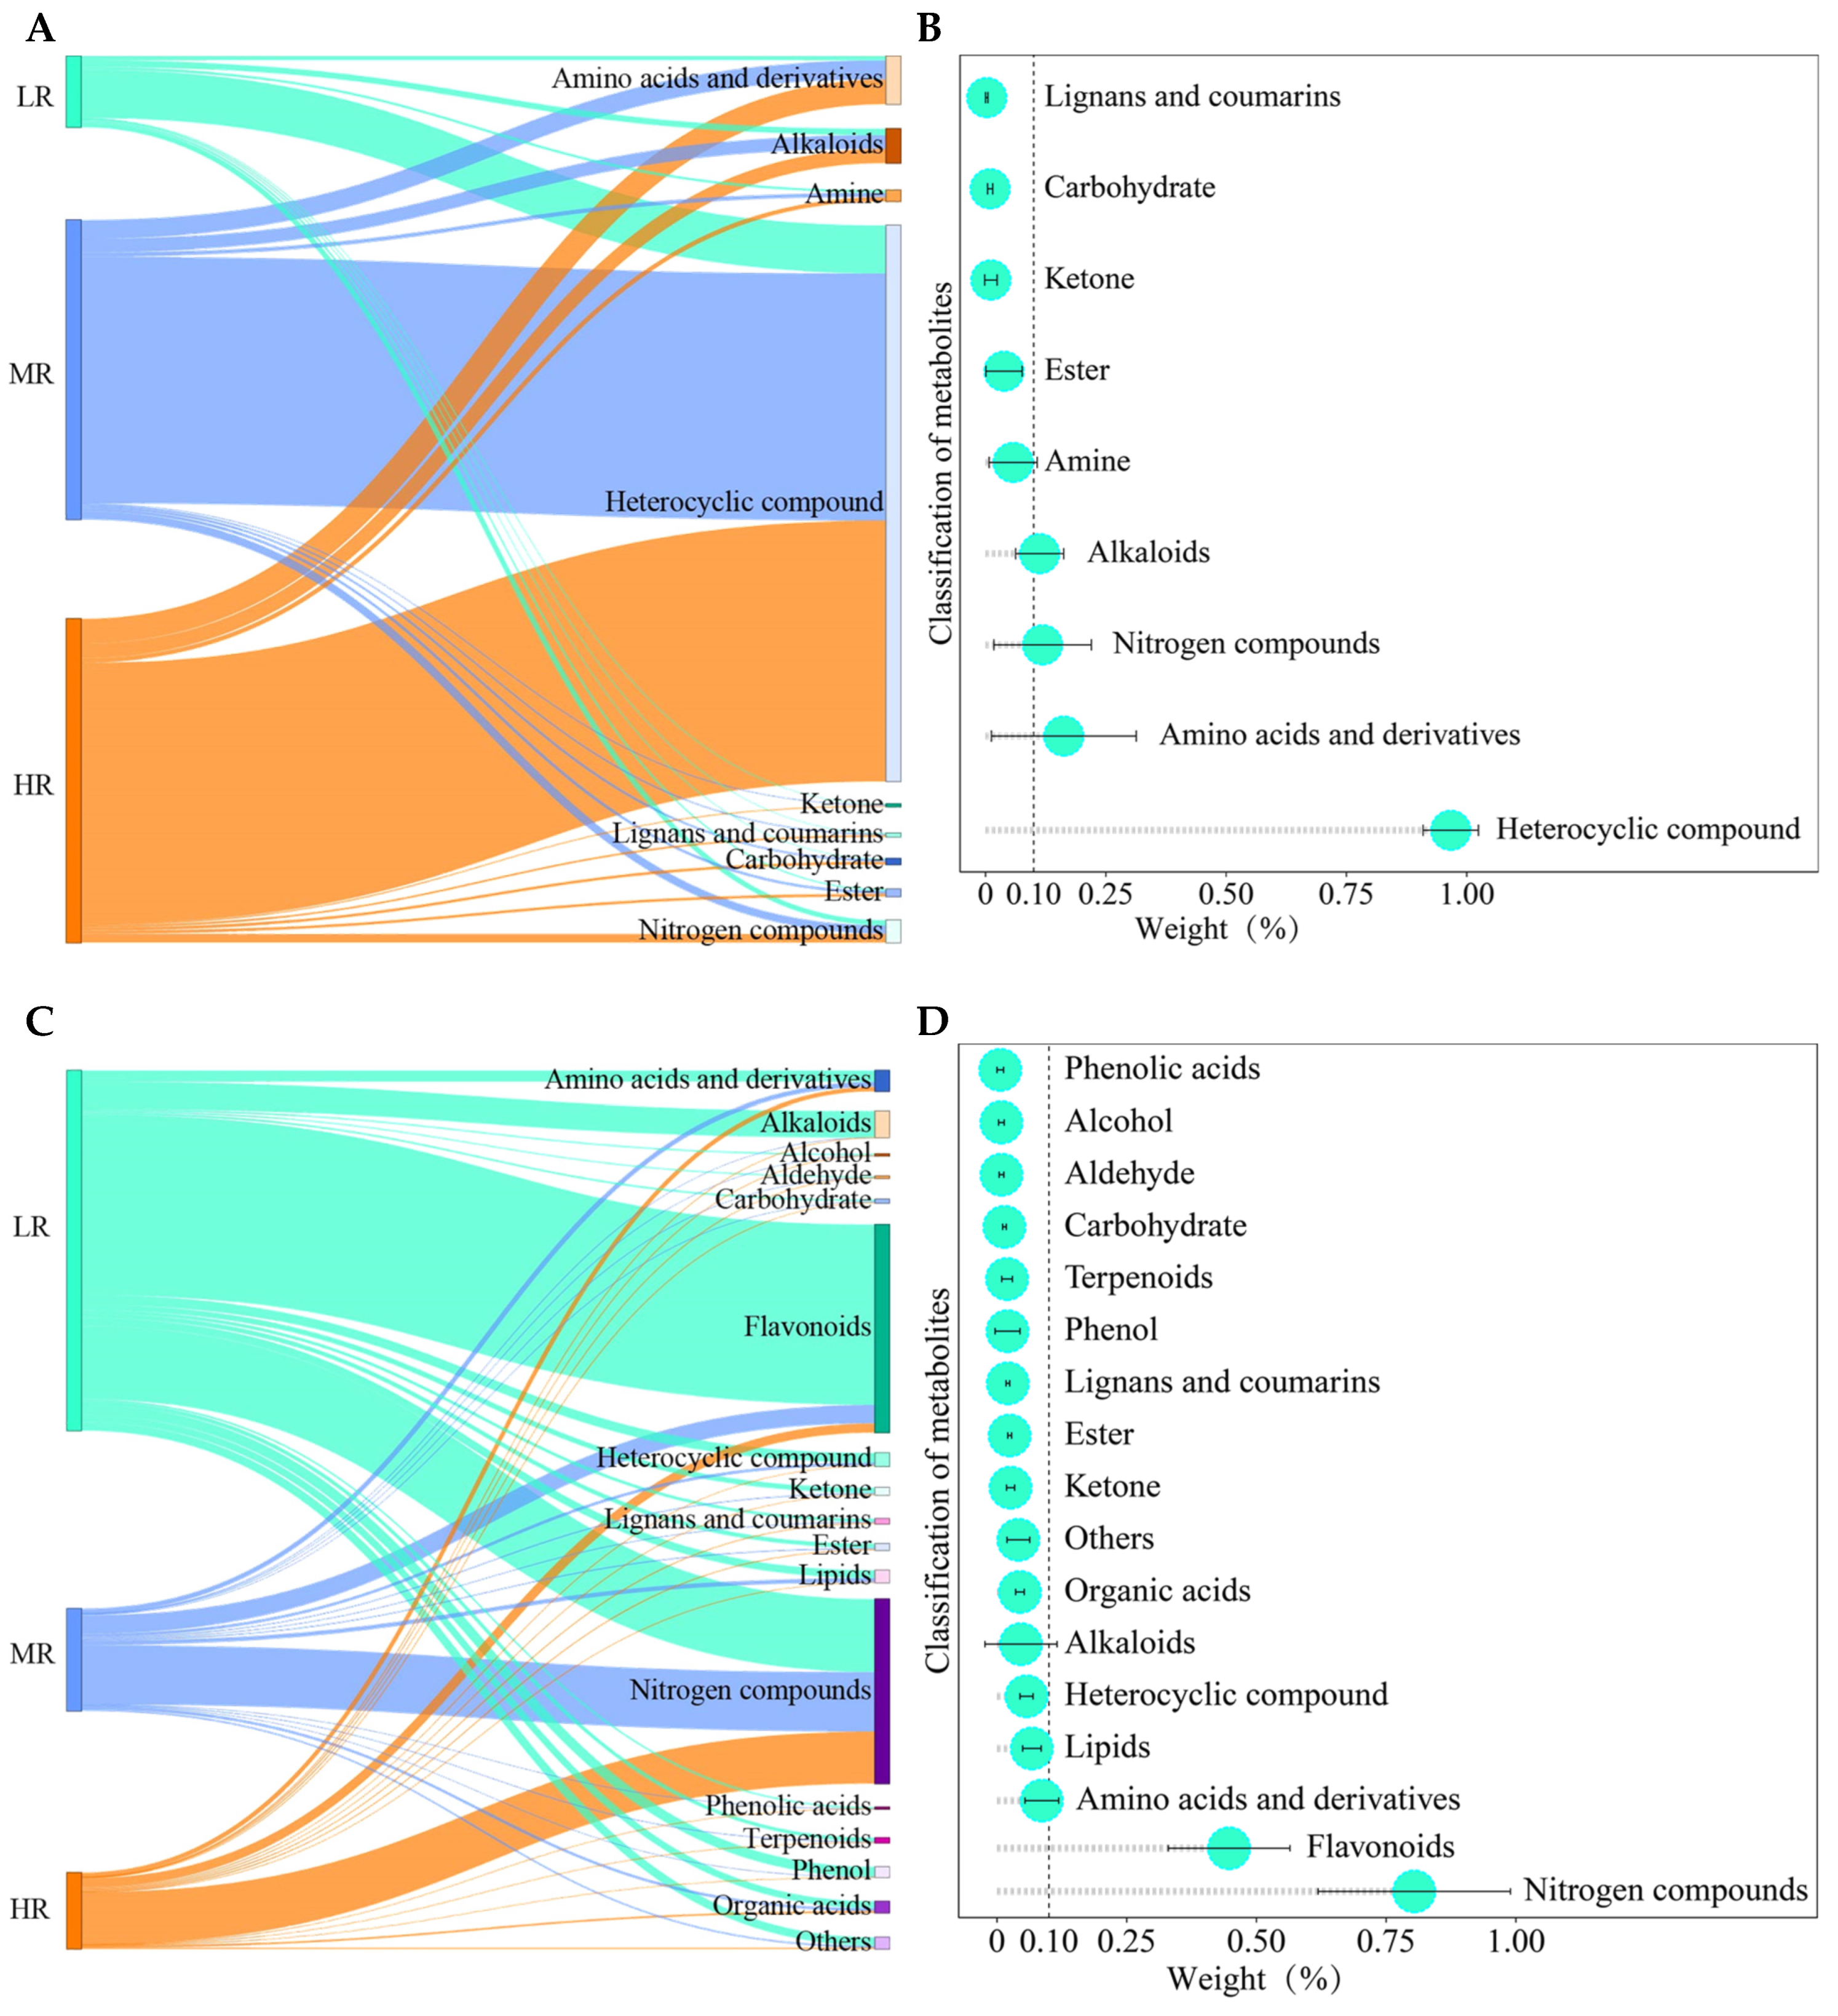
3.8. Classification Analysis of Characteristic Metabolites in the Root System of Tea Plant in Response to pH Regulation

Further analysis of the 73 characteristic metabolites obtained revealed (Tables S3 and S4) that 22 characteristic metabolites showed a significant increasing trend and 51 showed a significant decreasing trend with increasing pH. The classification analysis of characteristic metabolites showed (Figure 8A) that 22 characteristic metabolites showing a significant increasing trend could be classified into 9 categories. TOPSIS analysis of the 9 categories of metabolites revealed (Figure 8B) that only 4 categories of metabolites contributed more than 10% in distinguishing LR, MR, and HR, namely heterocyclic compounds, amino acids and derivatives, nitrogen compounds, and alkaloids. Secondly, it was found in this study (Figure 8C) that the 51 metabolites showing a significant decreasing trend could be classified into 17 categories. TOPSIS analysis of the 17 categories of metabolites revealed (Figure 8D) that only 2 categories of metabolites contributed more than 10% in distinguishing between LR, MR, and HR, namely nitrogen compounds and flavonoids. It can be seen that the content of the different categories of metabolites in the root system of tea plant underwent a significant change after the change in pH value, especially with the increase in pH, the contents of heterocyclic compound, amino acids and derivatives and alkaloids in the root system of tea plant showed an increasing trend, while the content of flavonoids showed a decreasing trend.

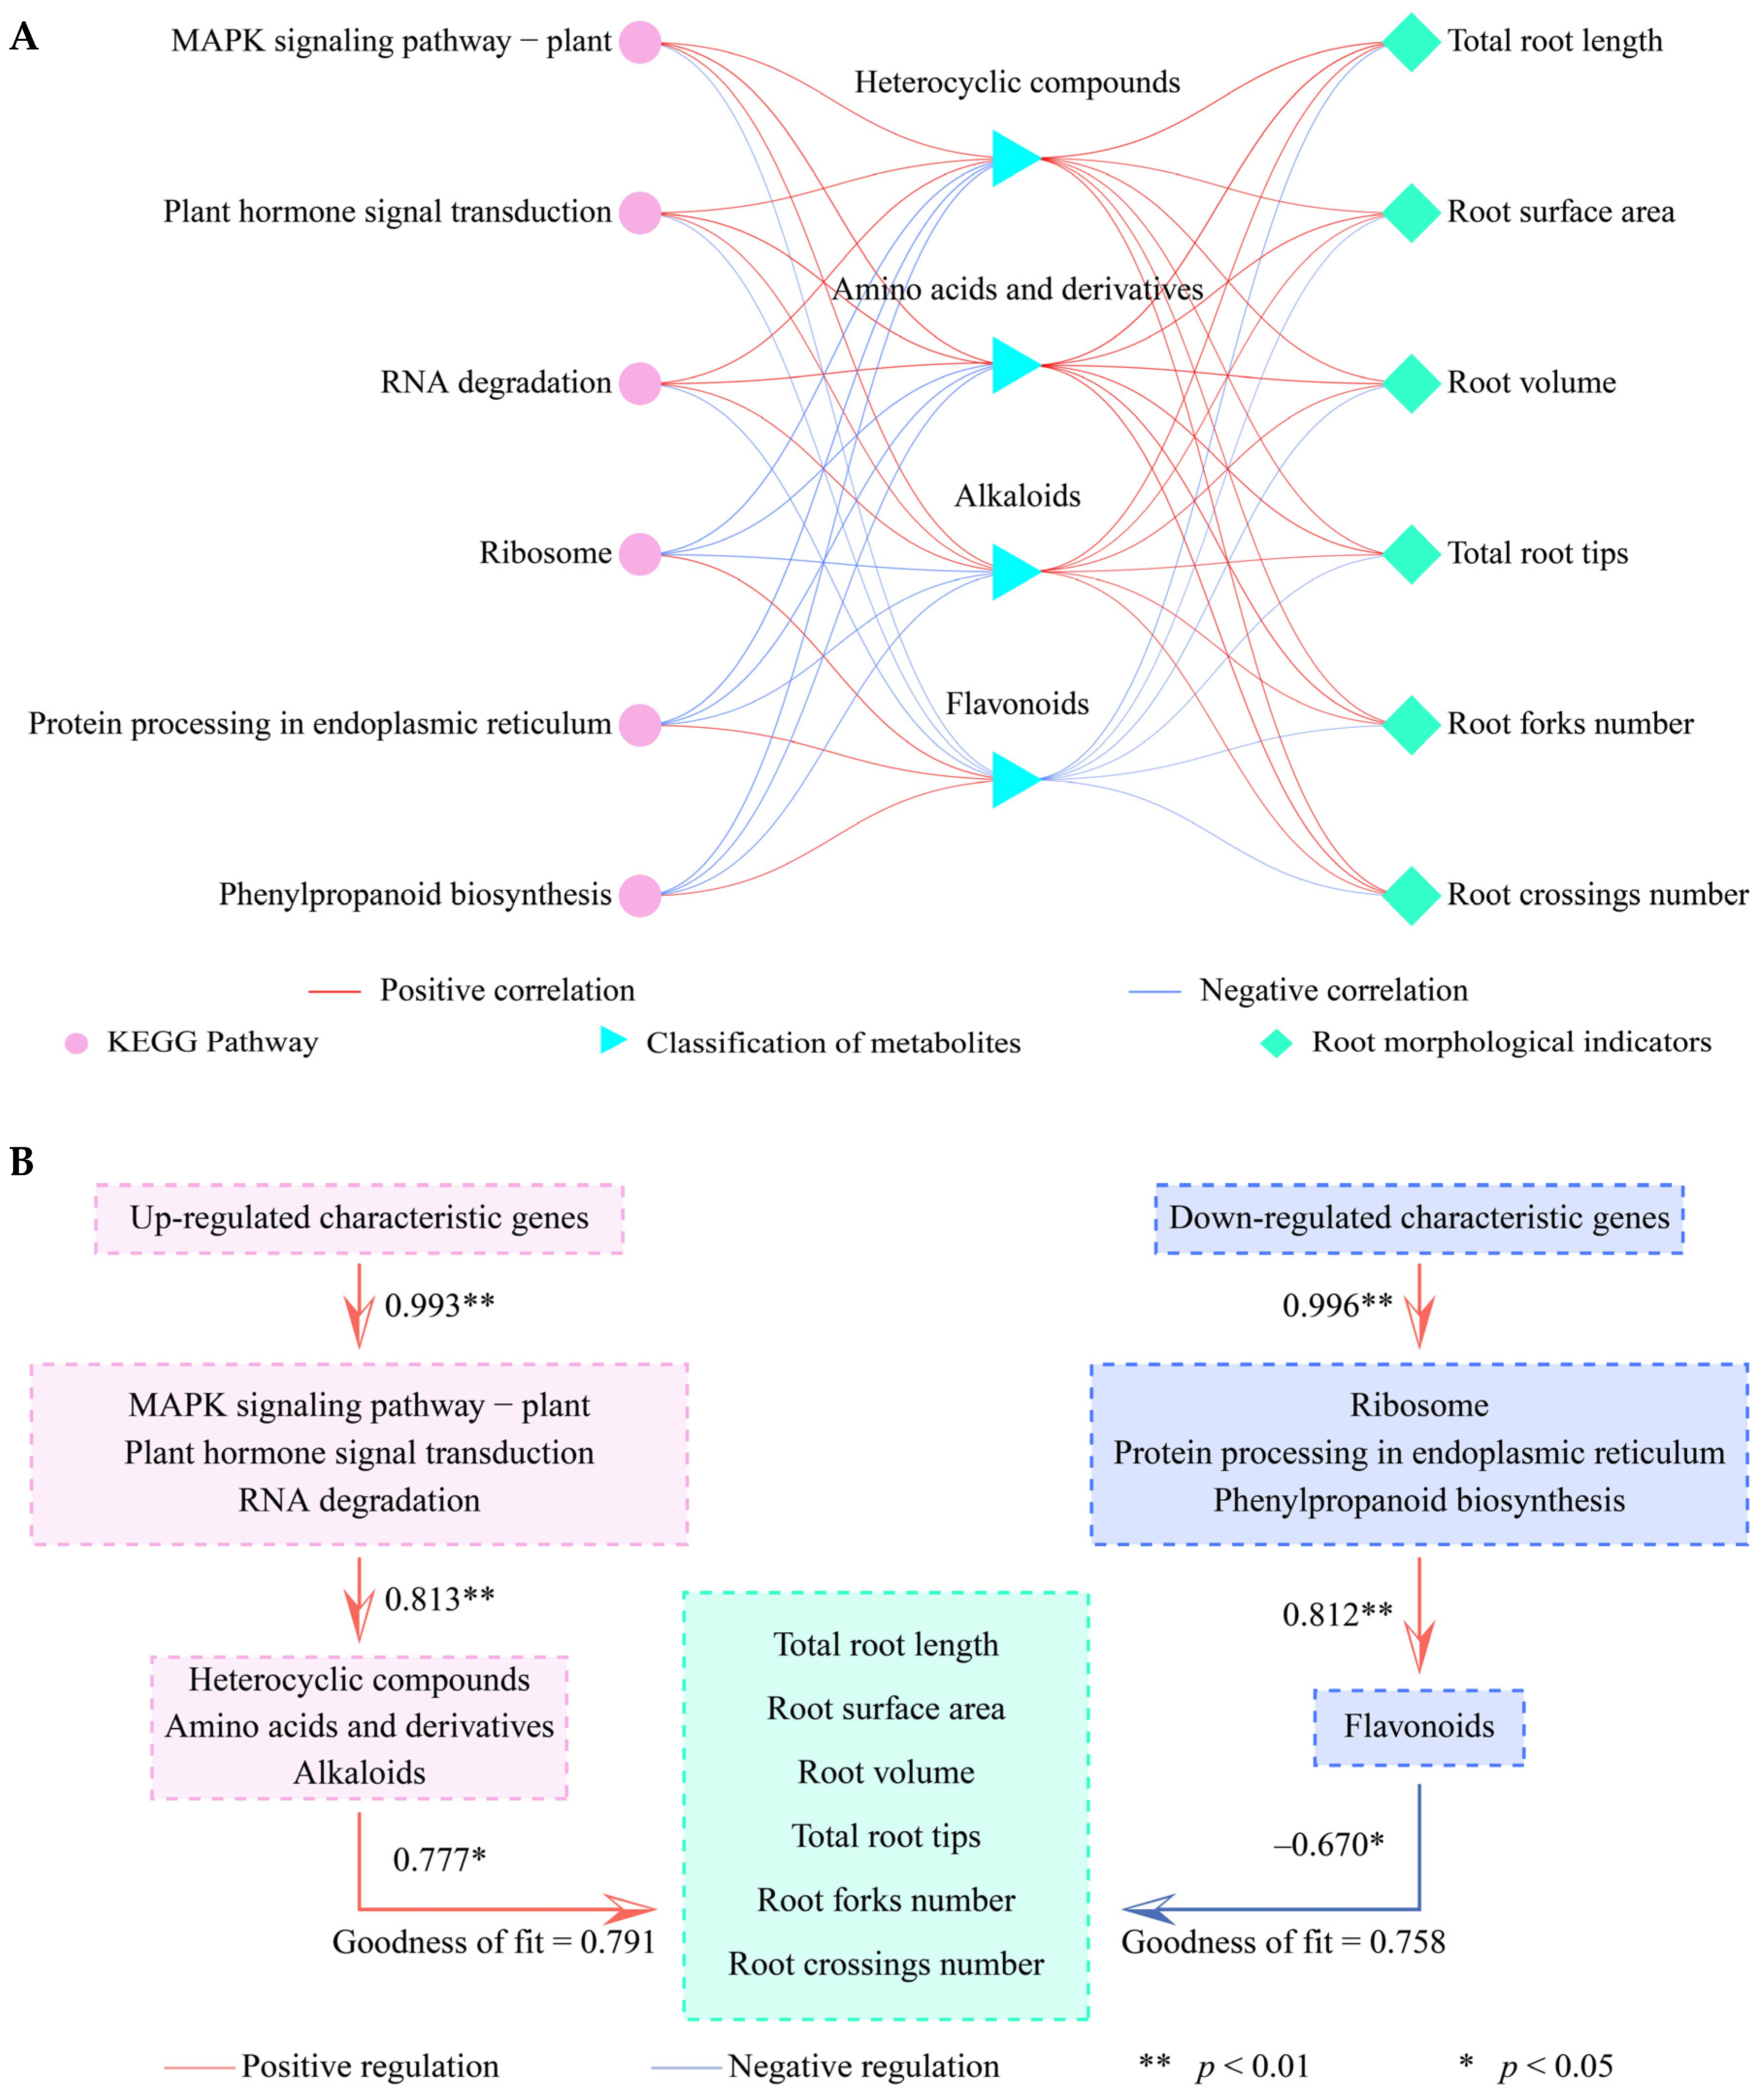
3.9. Analysis of the Interactions of Different Indexes

This study further analyzed the interactions between the key metabolic pathways, characteristic metabolites, and morphological indexes of the tea plant root system. Correlation network analysis showed (Figure 9A) that the intensity of key metabolic pathways such as MAPK signaling pathway—plant, plant hormone signal transduction, RNA degradation showed significant positive correlation with the content of heterocyclic compounds, amino acids and derivatives, alkaloids, and has significant positive correlation with different indexes in the root system of tea plant. However, the intensity of key metabolic pathways such as ribosome, protein processing in endoplasmic reticulum, and phenylpropanoid biosynthesis showed significant positive correlation with flavonoid content, but significant negative correlation with different indexes of the tea plant root system. PLS-SEM equations for different indexes were further constructed (Figure 9B) and the results showed that with the increase in pH, characteristic genes with significant increase positively regulated the intensity of MAPK signaling pathway—plant, plant hormone signal transduction, RNA degradation pathways in the root system of tea plant (0.993 **), positively regulated the content of heterocyclic compounds, amino acids and derivatives and alkaloids (0.813 *), and positively regulated the growth of the tea plant root system (0.777 *). However, characteristic genes with significant decreases in tea plant root positively regulated the intensity of ribosome, protein processing in endoplasmic reticulum, and phenylpropanoid biosynthesis pathways (0.996 **) and positively regulated the flavonoids content (0.812 **), and negatively regulated tea plant root growth (−0.670 *). It can be seen that the gene expression of the tea plant root system under pH regulation changed significantly, which in turn affected the intensity of related metabolic pathways and regulated the synthesis of root metabolites, which in turn affected the growth of the tea plant root system.

4. Discussion

pH is a crucial environmental factor that significantly impacts plant growth and development. It exerts influence on various aspects of plant physiology and metabolism, thereby regulating the overall growth and development of plants [27]. The tea plant is known to be acidophilic, with an optimal pH range falling between 4.5 and 5.5. Excessive acidification is highly likely to have a detrimental effect on the growth of tea plants. This, in turn, can lead to a reduction in the yield and quality of tea leaves [28]. Furthermore, acidification tends to damage the cell division of tea plant root tips. This disruption hinders root growth and inhibits the tea plant root system from effectively absorbing, accumulating, and translocating nutrients [29]. In this study, it was observed that as the pH increased, the total root length, root surface area, root volume, total root tips, root forks number, and root crossings number of the tea plant root system all showed a significant upward trend. Evidently, it is a common occurrence that acidification inhibits the growth of the tea plant root system. Nevertheless, the question remains: how does the tea plant root system respond to pH regulation?
In this research, transcriptomics technology was employed to analyze the differential gene expression of genes in the tea root system in response to pH regulation. When the pH increased, 1576 characteristic genes in the tea root system were up-regulated in response to this change. These up-regulated genes were mainly concentrated in the MAPK signaling pathway, plant hormone signal transduction, and RNA degradation pathways. Conversely, a total of 1078 characteristic genes were down-regulated. These genes were predominantly enriched in pathways such as ribosome, protein processing in the endoplasmic reticulum, and phenylpropanoid biosynthesis.
In addition, with the increase in pH, the contents of characteristic metabolites in tea plant roots, including heterocyclic compounds, amino acids and derivatives, and alkaloids, showed a significant upward trend. However, the content of flavonoids exhibited a decreasing trend. Through interaction analysis, it was found that the 3 significantly enhanced metabolic pathways had a positive regulatory effect on the contents of heterocyclic compounds, amino acids and derivatives, and alkaloids, and also positively regulated the growth of the tea root system. On the other hand, the 3 significantly decreased metabolic pathways positively regulated flavonoid content but had a reverse regulatory effect on tea plant root growth. The MAPK signaling pathway has been reported to play a central role in regulating plant growth and development, responding to adversity, and hormone signaling [30]. Specifically, this pathway can activate and accelerate the synthesis of heterocyclic compounds, alkaloids, and hormones, and also can improve the antioxidant capacity of plants, enhance plant resistance, and promote plant growth [31].
Plant hormone signal transduction plays a crucial role in influencing plant growth and development by modulating the synthesis of plant hormones [32]. For instance, numerous plant growth and development-related hormones are amino acids and derivatives, and their increased contents are beneficial to plant growth [33,34]. On the other hand, RNA degradation is a key link in the regulation of plant gene expression. It impacts plant growth and development, stress response, and hormone signal transduction through the precise control of RNA stability and turnover rate [35]. It can be seen that the increase in pH value is favorable to enhance the up-regulated expression of characteristic genes in the root system of tea plant, which in turn enhances the intensity of MAPK signaling pathway, Plant hormone signal transduction and RNA degradation, and promotes the synthesis heterocyclic compound, alkaloids and amino acids and derivatives in the root system of tea plant, thus promote the growth of tea root system.
In addition, this study found that the intensity of the 3 metabolic pathways, such as ribosome, protein processing in the endoplasmic reticulum, and phenylpropanoid biosynthesis, showed a significant decreasing trend with the increase in pH. Ribosome and protein processing in endoplasmic reticulum pathways in plants are mainly responsible for protein biosynthesis, which influences plant cell growth, development, and environmental adaptation, especially under adversity stress, and can regulate stress protein synthesis to enhance plant resistance [36,37]. Meanwhile, the phenylpropanoid biosynthesis pathway is one of the major secondary metabolic pathways in plants, and its main function is to synthesize secondary metabolites such as polyphenols and flavonoids, which are aimed at resisting the effects of environmental stresses on them [38]. When plants are under suitable environmental conditions, they reduce the synthesis intensity of the phenylpropane metabolic pathway and decrease the amount of secondary metabolite synthesis, while prioritizing the allocation of energy to basal metabolism to safeguard plant growth [39,40]. It can be seen that tea plant grows in a suitable pH environment with little influence of external environmental stress, and tea plant does not need to activate the synthesis of stress proteins or flavonoids in large quantities, but rather prioritizes the allocation of energy to promote the growth of tea plant.

5. Conclusions

In this study, the physiological and molecular mechanisms of the response of the tea plant root system to pH regulation were analyzed by using the transcriptome and metabolome jointly with the Tieguanyin tea plant seedlings as the research object. The results showed that increased pH was favorable to promote the growth of the tea plant root system, and the tea plant root system showed significant changes in gene expression and metabolite contents under the pH regulation. With the increase in pH, the gene expression of MAPK signaling pathway, Plant hormone signal transduction and RNA degradation pathway were significantly up-regulated in the tea plant root system, which was conducive to the synthesis of heterocyclic compound, alkaloids and amino acids and derivatives, which in turn promoted the growth of the root system. At the same time, with the increase in pH value, the growth of tea plant in a suitable pH environment would reduce the gene expression of its ribosome, protein processing in endoplasmic reticulum, phenylpropanoid biosynthesis pathway, and the synthesis of flavonoids, which in turn reduced energy consumption and transferred it to basal energy metabolism, prioritizing plant growth requirements. In this study, the mechanism of tea plant response to pH regulation was analyzed from molecular, physiological, and metabolite perspectives, which provided an important theoretical basis for the cultivation and management of tea plant in acidified tea plantations.

Supplementary Materials

The following supporting information can be downloaded at: https://www.mdpi.com/article/10.3390/horticulturae11070821/s1. Table S1. Characteristic genes with significantly up-regulated expression as pH increased; Table S2. Characteristic genes with significant down-regulated expression as pH increased; Table S3. Characteristic metabolites with significantly increased content as pH increased; Table S4. Characteristic metabolites with significantly decreased content as pH increased.

Author Contributions

Q.Z. and M.L.: Conceptualization, methodology, formal analysis, writing—original draft preparation; M.J., Z.Z. and Y.W.: Methodology, validation, formal analysis, writing—original draft preparation; Y.L., X.J. and T.W.: Data curation, formal analysis, writing—review and editing; H.W. and J.Y.: Conceptualization, project administration, supervision, resources, funding acquisition, writing—review and editing. All authors have read and agreed to the published version of the manuscript.

Funding

This work was supported by Natural Science Foundation of Fujian Province (2024N0009, 2024J01861, 2024J01866); Construction of first-class undergraduate specialty (tea science) in Fujian Province (SJZY2019004); Nanping City Science and Technology Plan Project (NP2024Z010); Innovation and Entrepreneurship Training Program for College Students (S202511312018, 202411312002); Wuyi University Horizontal Research Program (2023-WHFW-017).

Data Availability Statement

The original contributions of transcriptome data presented in the study were publicly available. This date can be found here: PRJNA1274613 (http://www.ncbi.nlm.nih.gov/bioproject/1274613, accessed on 10 June 2025).

Conflicts of Interest

The authors declare no conflicts of interest.

References

  1. Naz, M.; Dai, Z.; Hussain, S.; Tariq, M.; Danish, S.; Khan, I.U.; Qi, S.S.; Du, D. The soil pH and heavy metals revealed their impact on soil microbial community. J. Environ. Manag. 2022, 321, 115770. [Google Scholar] [CrossRef] [PubMed]
  2. Hartemink, A.E.; Barrow, N.J. Soil pH-nutrient relationships: The diagram. Plant Soil 2023, 486, 209–215. [Google Scholar] [CrossRef]
  3. Jia, M.; Wang, Y.; Zhang, Q.; Lin, S.; Zhang, Q.; Chen, Y.; Hong, L.; Jia, X.; Ye, J.; Wang, H. Effect of soil pH on the uptake of essential elements by tea plant and subsequent impact on growth and leaf quality. Agronomy 2024, 14, 1338. [Google Scholar] [CrossRef]
  4. Liu, Y.; Zhang, M.; Li, Y.; Zhang, Y.; Huang, X.; Yang, Y.; Zhu, Y.; Xiong, H.; Jiang, T. Influence of nitrogen fertilizer application on soil acidification characteristics of tea plantations in karst areas of southwest China. Agriculture 2023, 13, 849. [Google Scholar] [CrossRef]
  5. Ramachandran, P.; Ramirez, A.; Dinneny, J.R. Rooting for survival: How plants tackle a challenging environment through a diversity of root forms and functions. Plant Physiol. 2025, 197, kiae586. [Google Scholar] [CrossRef]
  6. Zhu, X.F.; Shen, R.F. Towards sustainable use of acidic soils: Deciphering aluminum-resistant mechanisms in plants. Fundamental Res. 2024, 4, 1533–1541. [Google Scholar] [CrossRef]
  7. Zou, Z.; Mi, W.; Li, X.; Hu, Q.; Zhang, L.; Zhang, L.; Fu, J.; Li, Z.; Han, W.; Yan, P. Biochar application method influences root growth of tea (Camellia sinensis L.) by altering soil biochemical properties. Sci. Hortic. 2023, 315, 111960. [Google Scholar] [CrossRef]
  8. Manzoor; Ma, L.; Ni, K.; Ruan, J. Influence of organic and inorganic fertilizers on tea growth and quality and soil properties of tea qrchards’ top rhizosphere soil. Plants 2024, 13, 207. [Google Scholar] [CrossRef]
  9. Huang, F.; Lei, Y.; Duan, J.; Kang, Y.; Luo, Y.; Ding, D.; Chen, Y.; Li, S. Investigation of heat stress responses and adaptation mechanisms by integrative metabolome and transcriptome analysis in tea plants (Camellia sinensis). Sci. Rep. 2024, 14, 10023. [Google Scholar] [CrossRef]
  10. Ye, J.; Zhang, Q.; Shi, L.; Wang, Y.; Li, M.; Chen, Y.; Zhang, M.; Chen, J.; Chen, M.; Jia, X.; et al. Joint analysis of transcriptome and hormone metabolome on the mechanism of pruning effect on tea tree (Camellia sinensis) growth. Ind. Crops Prod. 2024, 218, 118929. [Google Scholar] [CrossRef]
  11. Gao, C.; Wang, Z.; Wu, W.; Zhou, Z.; Deng, X.; Chen, Z.; Sun, W. Transcriptome and metabolome reveal the effects of ABA promotion and inhibition on flavonoid and amino acid metabolism in tea plant. Tree Physiol. 2024, 44, tpae065. [Google Scholar] [CrossRef] [PubMed]
  12. Xu, W.; Li, J.; Zhang, L.; Zhang, X.; Zhao, H.; Guo, F.; Wang, Y.; Wang, P.; Chen, Y.; Ni, D.; et al. Metabolome and RNA-seq analysis of responses to nitrogen deprivation and resupply in tea plant (Camellia sinensis) roots. Front. Plant Sci. 2022, 13, 932720. [Google Scholar] [CrossRef]
  13. Zuo, H.; Chen, J.; Lv, Z.; Shao, C.; Chen, Z.; Zhou, Y.; Shen, C. Tea-derived polyphenols enhance drought resistance of tea plants (Camellia sinensis) by alleviating jasmonate–isoleucine pathway and flavonoid metabolism flow. Int. J. Mol. Sci. 2024, 25, 3817. [Google Scholar] [CrossRef] [PubMed]
  14. Zhang, Z.; Song, C.; Zhao, J.; Xia, E.; Wen, W.; Zeng, L.; Benedito, V.A. Secondary metabolites and metabolism in tea plants. Front. Plant Sci. 2023, 14, 1143022. [Google Scholar] [CrossRef]
  15. Huang, W.; Lin, M.; Liao, J.; Li, A.; Tsewang, W.; Chen, X.; Sun, B.; Liu, S.; Zheng, P. Effects of potassium deficiency on the growth of tea (Camelia sinensis) and strategies for optimizing potassium levels in soil: A critical review. Horticulturae 2022, 8, 660. [Google Scholar] [CrossRef]
  16. Liu, Z.; Yang, D.; Zhang, G.; Zheng, L.; Chen, C.; Sun, X.; Yu, F. Effects of soil physical and chemical properties on the quality of Nanjing ‘Yuhua’ Tea, a type of famous green tea. Horticulturae 2023, 9, 189. [Google Scholar] [CrossRef]
  17. Sun, L.; Zhang, M.; Liu, X.; Mao, Q.; Shi, C.; Kochian, L.V.; Liao, H. Aluminium is essential for root growth and development of tea plants (Camellia sinensis). J. Integr. Plant Biol. 2020, 62, 984–997. [Google Scholar] [CrossRef]
  18. Zhu, L.; Sun, J.; Yao, X.; Wang, X.; Huang, J.; Xiong, D.; Chen, G. Fine root nutrient foraging ability in relation to carbon availability along a chronosequence of Chinese fir plantations. Forest Ecol. Manag. 2022, 507, 120003. [Google Scholar] [CrossRef]
  19. Cheng, Y.; Mao, J.; Cao, L.; Wang, H.; Li, S.; Jin, X.; Zhang, X.; Li, Y. Molecular basis of flavonoid accumulation in tea leaves grafted with Camellia sinensis var. assamica cv.“Yinghong9” as rootstock based on multi-omics analysis. Sci. Hortic. 2023, 321, 112290. [Google Scholar] [CrossRef]
  20. Robinson, J.; Thorvaldsdóttir, H.; Winckler, W.; Guttman, M.; Lander, E.; Getz, G.; Mesirov, J. Integrative genomics viewer. Nat. biotechnol. 2011, 29, 24–26. [Google Scholar] [CrossRef]
  21. Liao, Y.; Smyth, G.; Shi, W. featureCounts: An efficient general purpose program for assigning sequence reads to genomic features. Bioinformatics 2014, 30, 923–930. [Google Scholar] [CrossRef] [PubMed]
  22. Love, M.; Huber, W.; Anders, S. Moderated estimation of fold change and dispersion for rna-seq data with deseq2. Genome Biol. 2014, 15, 550. [Google Scholar] [CrossRef]
  23. Zhou, X.; Hu, L.; Hoang, N.H.; Thanh, T.L.; Zhou, C.; Mei, X.; Buensanteai, K. The changes in metabolites, quality components, and antioxidant activity of tea (Camellia sinensis) infected with exobasidium vexans by applying UPLC-MS/MS-based widely targeted metabolome and biochemical analysis. Phytopathology 2024, 114, 164–176. [Google Scholar] [CrossRef]
  24. Li, X.; Jia, J.; Li, T.; Zhao, Z.; Liu, H.; Song, N.; Pei, J. Metabolomics analysis of Ligustri Lucidi Fructus at different harvest times during the whole growing period based on ultra-high-performance liquid chromatography with mass spectrometry. J. Sep. Sci. 2023, 46, 2300196. [Google Scholar] [CrossRef] [PubMed]
  25. Wen, O.; Ning, J.; Zhu, X.; Jiang, Y.; Wang, J.; Yuan, H.; Hua, J. UPLC-ESI-MS/MS analysis revealed the dynamic changes and conversion mechanism of non-volatile metabolites during green tea fixation. LWT 2024, 198, 116010. [Google Scholar] [CrossRef]
  26. Wickham, H. Advanced R, 2nd ed.; Chapman and Hall/CRC The R Series; Taylor and Francis: Milton Park, UK, 2019. [Google Scholar]
  27. Wang, Y.; Wang, J.; Guo, D.; Zhang, H.; Che, Y.; Li, Y.; Tian, B.; Wang, Z.; Sun, G.; Zhang, H. Physiological and comparative transcriptome analysis of leaf response and physiological adaption to saline alkali stress across pH values in alfalfa (Medicago sativa). Plant Physiol. Bioch. 2021, 167, 140–152. [Google Scholar] [CrossRef]
  28. Le, V.S.; Herrmann, L.; Hudek, L.; Nguyen, T.B.; Bräu, L.; Lesueur, D. How application of agricultural waste can enhance soil health in soils acidified by tea cultivation: A review. Environ. Chem. Lett. 2022, 20, 813–839. [Google Scholar] [CrossRef]
  29. Ding, Z.J.; Shi, Y.Z.; Li, G.X.; Harberd, N.P.; Zheng, S.J. Tease out the future: How tea research might enable crop breeding for acid soil tolerance. Plant Commun. 2021, 2, 100182. [Google Scholar] [CrossRef]
  30. Meng, X.; Zhang, S. MAPK cascades in plant disease resistance signaling. Annual Rev. Phytopathol. 2013, 51, 245–266. [Google Scholar] [CrossRef]
  31. Yu, M.; Liu, H.; Guo, L.; Zhou, T.; Shan, Y.; Xia, Z.; Li, X.; An, M.; Wu, Y. Antiviral modes of action of the novel compound GLY-15 containing pyrimidine heterocycle and moroxydine skeleton against tobacco mosaic virus. Pest Manag. Sci. 2022, 78, 5259–5270. [Google Scholar] [CrossRef]
  32. Waadt, R.; Seller, C.A.; Hsu, P.K.; Takahashi, Y.; Munemasa, S.; Schroeder, J.I. Plant hormone regulation of abiotic stress responses. Nat. Rev. Mol. Cell Biol. 2022, 23, 680–694. [Google Scholar] [CrossRef] [PubMed]
  33. Yan, X.; Liu, J.; Wu, K.X.; Yang, N.; Pan, L.B.; Song, Y.; Liu, Y.; Tang, Z.H. Comparative analysis of endogenous hormones and metabolite profiles in early-spring flowering plants and unflowered plants revealing the strategy of blossom. J. Plant Growth Regul. 2022, 41, 2421–2434. [Google Scholar] [CrossRef]
  34. Carlos, E.; Lerma, T.A.; Martínez, J.M. Phytohormones and plant growth regulators—A review. J. Sci. Technol. Appl. 2021, 10, 27–65. [Google Scholar] [CrossRef]
  35. Rani, V.; Sengar, R.S. Biogenesis and mechanisms of microRNA-mediated gene regulation. Biotechnol. Bioeng. 2022, 119, 685–692. [Google Scholar] [CrossRef]
  36. Robles, P.; Quesada, V. Unveiling the functions of plastid ribosomal proteins in plant development and abiotic stress tolerance. Plant Physiol. Biochem. 2022, 189, 35–45. [Google Scholar] [CrossRef]
  37. Liu, J.X.; Howell, S.H. Endoplasmic reticulum protein quality control and its relationship to environmental stress responses in plants. Plant Cell 2010, 22, 2930–2942. [Google Scholar] [CrossRef]
  38. Sharma, A.; Shahzad, B.; Rehman, A.; Bhardwaj, R.; Landi, M.; Zheng, B. Response of phenylpropanoid pathway and the role of polyphenols in plants under abiotic stress. Molecules 2019, 24, 2452. [Google Scholar] [CrossRef] [PubMed]
  39. Vogt, T. Phenylpropanoid biosynthesis. Mol. Plant 2010, 3, 2–20. [Google Scholar] [CrossRef]
  40. Dong, N.Q.; Lin, H.X. Contribution of phenylpropanoid metabolism to plant development and plant–environment interactions. J. Integr. Plant Boil. 2021, 63, 180–209. [Google Scholar] [CrossRef]
Figure 1. Effect of pH on the root growth of tea plants. Note: LR: pH 3.5; MR: pH 4.5; HR: pH 5.5.
Horticulturae 11 00821 g001
Figure 2. Gene expression analysis of the tea plant root system under different pH treatments. Note: LR: pH 3.5; MR: pH 4.5; HR: pH 5.5; (A) Venn’s diagram analysis of the number of genes and similarity in the tea plant root system; (B) analysis of the overall gene expression of the tea plant root system; (C) principal component analysis of the gene expression of the tea plant root system under different pH treatments.
Horticulturae 11 00821 g002
Figure 3. Screening for differentially expressed genes in the tea plant root system under different pH treatments. Note: LR: pH 3.5; MR: pH 4.5; HR: pH 5.5; (A) screening for differentially expressed genes in the tea plant root system using volcano map; (B) heat map analysis of the expression of differentially expressed genes.
Horticulturae 11 00821 g003
Figure 4. Screening for characteristic genes based on differential expression of tea plant root genes. Note: LR: pH 3.5; MR: pH 4.5; HR: pH 5.5; (A) Constructing OPLS-DA model of LR, MR and HR to screen for key genes based on genes whose expression tended to increase with the increase in pH; (B) Bubble feature map to screen for characteristic genes based on key genes whose expression tended to increase; (C) Constructing OPLS-DA models of LR, MR and HR to screen for key genes based on genes whose expression tended to decrease with the increase in pH; (D) Bubble feature map to screen for characteristic genes based on key genes whose expression tended to decrease.
Horticulturae 11 00821 g004
Figure 5. KEGG pathway enrichment and key pathway screening of characteristic genes in the root system of tea plant. Note: LR: pH 3.5; MR: pH 4.5; HR: pH 5.5; (A) KEGG pathway enrichment of characteristic genes with an increasing trend of expression; (B) TOPSIS screening of key KEGG pathways for characteristic genes with an increasing trend of expression; (C) KEGG pathway enrichment of characteristic genes with a decreasing trend of expression; (D) TOPSIS screening of KEGG pathways for characteristic genes with a decreasing trend of expression.
Horticulturae 11 00821 g005
Figure 6. Effect of pH on metabolites of the tea plant root system. Note: LR: pH 3.5; MR: pH 4.5; HR: pH 5.5; (A) analysis of metabolite contents of different categories of the tea plant root system (only the top ten categories of metabolites with the highest contents were shown in the figure); (B) analysis of the total amount of metabolites of the tea plant root system; (C) PCA analysis of metabolite contents of the tea plant root system under different pH treatments.
Horticulturae 11 00821 g006
Figure 7. Characteristic metabolite screening of the tea plant root system in response to pH. Note: LR: pH 3.5; MR: pH 4.5; HR: pH 5.5; (A) volcano plot analysis of the differential metabolites in the tea plant root system between MR and LR; (B) volcano plot analysis of the differential metabolites in the tea plant root system between HR and MR; (C) OPLS-DA model test plots of LR, MR and HR; (D) Score plots of OPLS-DA model; (E) S-Plot plots of OPLS-DA model; (F) Bubble feature plot to screen for characteristic metabolites distinguish LR, MR and HR.
Horticulturae 11 00821 g007
Figure 8. Classification of characteristic metabolites of the tea plant root system and their contribution rate analysis. Note: LR: pH 3.5; MR: pH 4.5; HR: pH 5.5; (A) classification analysis of characteristic metabolites that showed an upward trend with increasing pH; (B) contribution rate of characteristic metabolites that showed an upward trend in distinguishing between LR, MR, and HR analyzed by TOPSIS; (C) classification analysis of characteristic metabolites that showed a downward trend with increasing pH; (D) classification analysis of characteristic metabolites that showed a downward trend in distinguishing between LR, MR, and HR analyzed by TOPSIS.
Horticulturae 11 00821 g008
Figure 9. Correlation network and PLS-SEM equation construction between different indexes of the tea plant root system. Note: (A) correlation network analysis of different indexes; (B) PLS-SEM equation construction of different indexes.
Horticulturae 11 00821 g009
Disclaimer/Publisher’s Note: The statements, opinions and data contained in all publications are solely those of the individual author(s) and contributor(s) and not of MDPI and/or the editor(s). MDPI and/or the editor(s) disclaim responsibility for any injury to people or property resulting from any ideas, methods, instructions or products referred to in the content.

