Article

Recommendations for Planting Sites and Cultivation Modes Suitable for High-Quality ‘Cuiguan’ Pear in Jiangxi Province

1
Institute of Horticulture, Jiangxi Academy of Agricultural Sciences, Nanchang 330200, China
2
Jiangxi Key Laboratory of Horticultural Crops (Fruit, Vegetable & Tea) Breeding, Nanchang 330200, China
3
Nanchang Key Laboratory of Germplasm Innovation and Utilization of Fruit and Tea, Nanchang 330200, China
*
Authors to whom correspondence should be addressed.
Horticulturae 2025, 11(7), 771; https://doi.org/10.3390/horticulturae11070771
Submission received: 27 May 2025 / Revised: 27 June 2025 / Accepted: 1 July 2025 / Published: 2 July 2025

Abstract

The ecological region and training system are critical in determining an orchard’s microclimate and, ultimately, the quality and yield of the fruit produced. However, few studies have addressed the effects of their interactions on the commodity properties preferred by consumers, including appearance, flavor, and nutritional components. This study was conducted in distinct ecological regions at the county scale, with two classic cultivation modes (a traditional freestanding system with natural grassing and fruit without bagging and a flat-type trellis system with floor covering and fruit bagging) used for investigation and testing in 2020 and 2024, respectively. Significant differences in internal and external quality attributes were observed between the two groups. A sensory analysis showed that an increase in the soluble solid content and a better fruit appearance were strongly associated with higher purchase intentions. By integrating meteorological parameters, it was also found that temperature and air humidity during the month before harvest were associated with the pear phytochemical and metabolomic profiles. Planting site had a particularly notable effect on quality attributes and sensory experience, with low-latitude-harvested samples under cultivation mode 1 clustering together and showing higher overall scores, while cultivation mode 2 may be more suitable for high-latitude areas. Our results pave the way for making precise recommendations for the selection of suitable planting sites and optimum cultivation modes in Jiangxi Province to achieve high-quality ‘Cuiguan’ pears and fully exploit their planting potential.

1. Introduction

Pear (Pyrus communis L.) is a perennial and deciduous fruit tree, being cultivated in more than 80 countries and diverse regions [1]. The middle and lower Yangtze River Basin, characterized by high temperatures and humidity, was identified as the main producing area of early-ripening pear (the main variety is ‘Cuiguan’) through China’s national pear variety validation test. However, large differences exist in the meteorological environment in the Yangtze River ecological region [2]. With consumer demand for higher fruit quality and the intensification of market competition, new requirements are proposed to achieve more precise recommendations for planting areas suitable for pear varieties. Simultaneously, the cultivation system is also critical in determining an orchard’s microclimate, ultimately altering the quality and yield performance of the fruit produced [3]. Therefore, conducting in-depth research on suitable growing areas at the county scale and exploring the optimal cultivation system are crucial to produce high-quality ‘Cuiguan’ pear.
Factors such as meteorological parameters, soil conditions, and cultivation mode are the main indicators of a crop suitability analysis [4]. Previous research methods for the fine zoning of pear varieties include the use of a correlation analysis, a principal component analysis, and other statistical analysis methods to determine the indicators. Solar radiation and accumulated temperature were identified as important meteorological factors affecting the flowering time of ‘Cuiguan’ pear, thereby influencing its maturity period and the areas suitable for its widespread cultivation [5]. In recent years, the rapid advancement of satellite images has opened up new avenues, enabling us to observe and identify crop suitability in different regions. For instance, Balasundaram et al. [6] employed green area detection, satellite image analysis, weather data, and GPT to identify regions capable of growing crops based on live data. Nikolaos et al. [7] delineated natural terroir units in wine regions using geoinformatics, including climate, soil, and topography features, so as to fully exploit their planting potential for high-quality grape and wine production. Zou et al. [8] proposed a new method for making accurate recommendations based on a meteorology knowledge graph so that planting areas suitable for maize varieties could be precisely located from the Huang-Huai-Hai ecological region to the county growing area. However, prevailing models for crop environmental suitability evaluation research suffer from certain limitations. Many of these recommendations cover a relatively large ecological area, and limited information is available for early-ripening pear plants in the Yangtze River Basin.
The different cultivation systems of economic crops are critical for photosynthetic carbon assimilation rates and fruit development, which, in turn, affect yield and fruit quality [9,10,11]. Significant differences in fruit size, soluble solid content, and organic acids have been observed between the traditional freestanding system (SP) and the flat-type trellis system (DP) [3]. Simultaneously, the fruit-zone microenvironment can influence the primary metabolites (such as total sugars and organic acids) and secondary metabolites (such as polyphenols, vitamins, and flavonoids) [12,13]. Both primary and secondary metabolites are important components of the nutritional and organoleptic characteristics preferred by consumers [14]. For example, bagging treatment helps to modify the peel color, improve the fruit’s smoothness, and increase the vitamin C content [15]. Compared with non-grass orchards, planting grasses significantly maintain soil basic fertility, improve the soil ecological environment and the soil microbial community structure, and promote the sustainable growth of fruit [16]. Additionally, Wang et al. [17,18] proposed the use of gene editing to improve fruit quality, and they demonstrated that the dynamic balance between sugars, organic acids, and other major metabolites was regulated by novel transcription factors (TFs), PpbZIP44 and PbrtMT1, via the manipulation of carbohydrate metabolism and the enhancement of fructose accumulation. However, the use of plant breeding to improve fruit quality or gene editing in fruit crops is time-consuming. Therefore, the aims of this study were to (i) determine the phytochemical profile, polyphenol compounds, and organoleptic characteristics in ‘Cuiguan’ pear harvested from different planting sites; (ii) investigate the influence of meteorological parameters on fruit quality attributes; and (iii) explore suitable planting sites at the county scale with optimal cultivation systems for high-quality ‘Cuiguan’ pear so as to fully exploit their planting potential.

2. Materials and Methods

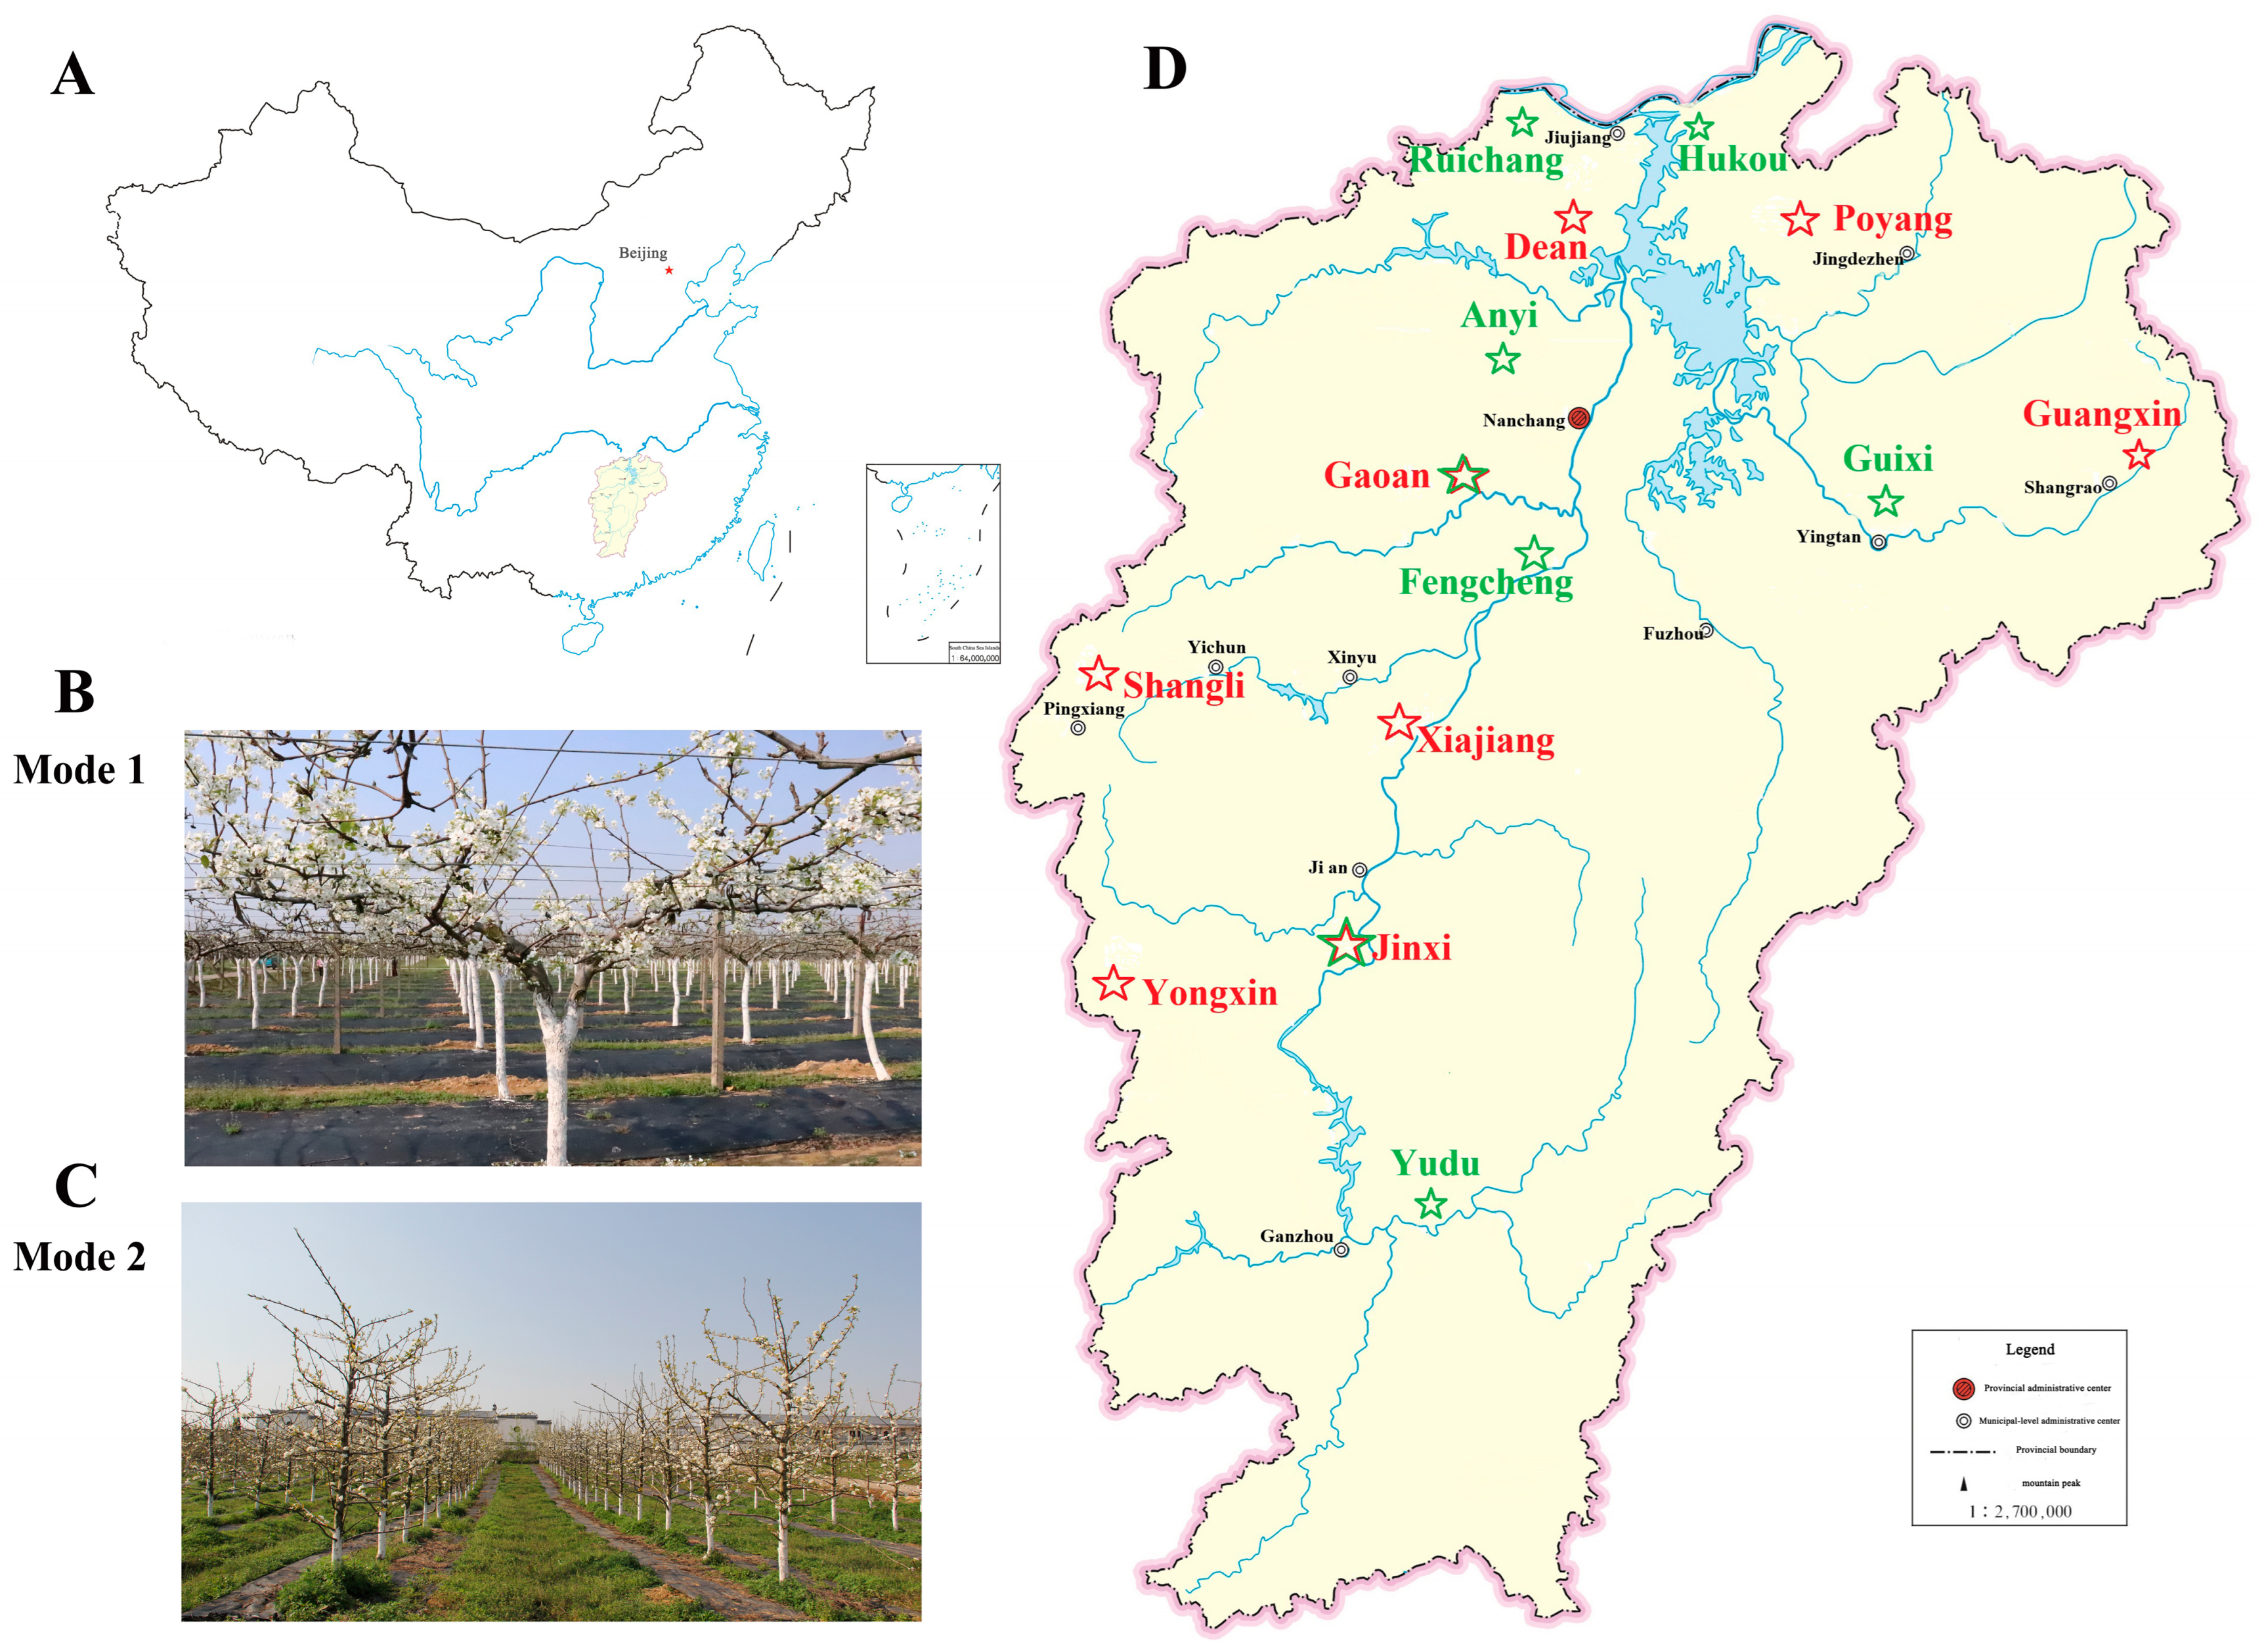
2.1. Plant Materials

The lower Yangtze River Basin is the main producing area of early-maturing pear (Pyrus pyrifolia) in southern China, which covers five provinces, namely, Hubei, Jiangxi, Jiangsu, Fujian, and Zhejiang (Figure 1A). Among them, ten-year-old ‘Cuiguan’ (Pyrus Pyrifolia Nakai) pears collected from 14 counties in the Poyang Lake ecological region of Jiangxi Province (24°29′ N to 30°04′ N and 113°34′ E to 118°28′ E) were used for analysis. Large differences exist in the meteorological environment in this region, and some key meteorological parameters, such as temperature (mean, maximum, and minimum), sunshine duration, air humidity, and precipitation, were recorded daily and are summarized (from flowering to fruit harvest) in Figure S1.
The orchard was managed under an agricultural practice similar to that defined by a pre-agreed protocol for fruit production (pruning, spraying, irrigation, etc.), and more specific details on routine orchard management are summarized in Table S1. On this basis, the trees were trained on cultivation mode 1 (Figure 1B) or 2 (Figure 1C), represented by the red and green asterisks in Figure 1D, respectively. Specifically, cultivation mode 1 refers to a flat-type trellis system with floor covering and fruit bagging (DP), whereas cultivation mode 2 refers to a traditional freestanding system with natural grassing and fruit without bagging (SP). In the DP system, the two permanent primary branches of the trees are trained upwards into a Y shape along the row, which promotes leaf and fruit development at the same level. In the SP system, the trees have a classically central vertical leader and 10–15 primary branches, and mechanized operations can be conveniently carried out. Details on the distinct planting sites with different cultivation modes are summarized in Table 1.
Fruits were harvested at full maturity, which was determined by performing the soluble solid content test with a handheld sugar meter, combined with sensory tasting. For greater precision, three biological replicates of each sample and three technical replicates (three fruits) of each biological replicate were analyzed. Fruits collected from three individual trees were defined as three biological replicates and were used to calculate the standard deviation. The experiment was first laid out in 2020, and significant differences were observed in the pesticide residue, heavy metal, and primary and secondary metabolite contents (which are closely related to the commodity attributes) of pear fruits harvested from five different planting sites with two different cultivation modes. Then, we expanded the scope of the experiment to 14 distinct sites in 10 cities in 2024, and chemical compound determination and a sensory analysis were carried out to determine the effect of the agricultural practice on environment interaction, which influences pear fruit quality.

2.2. Methods

2.2.1. Quantification of Pesticide Residues and Heavy Metals

The heavy metals were unambiguously identified and quantified using an inductively coupled plasma–(tandem) mass spectrometer (ICP-MS), and the pesticide residues were determined with a high-performance liquid chromatography–tandem mass spectrometer (UHPLC-MS/MS), according to Kovač et al. [19] method.

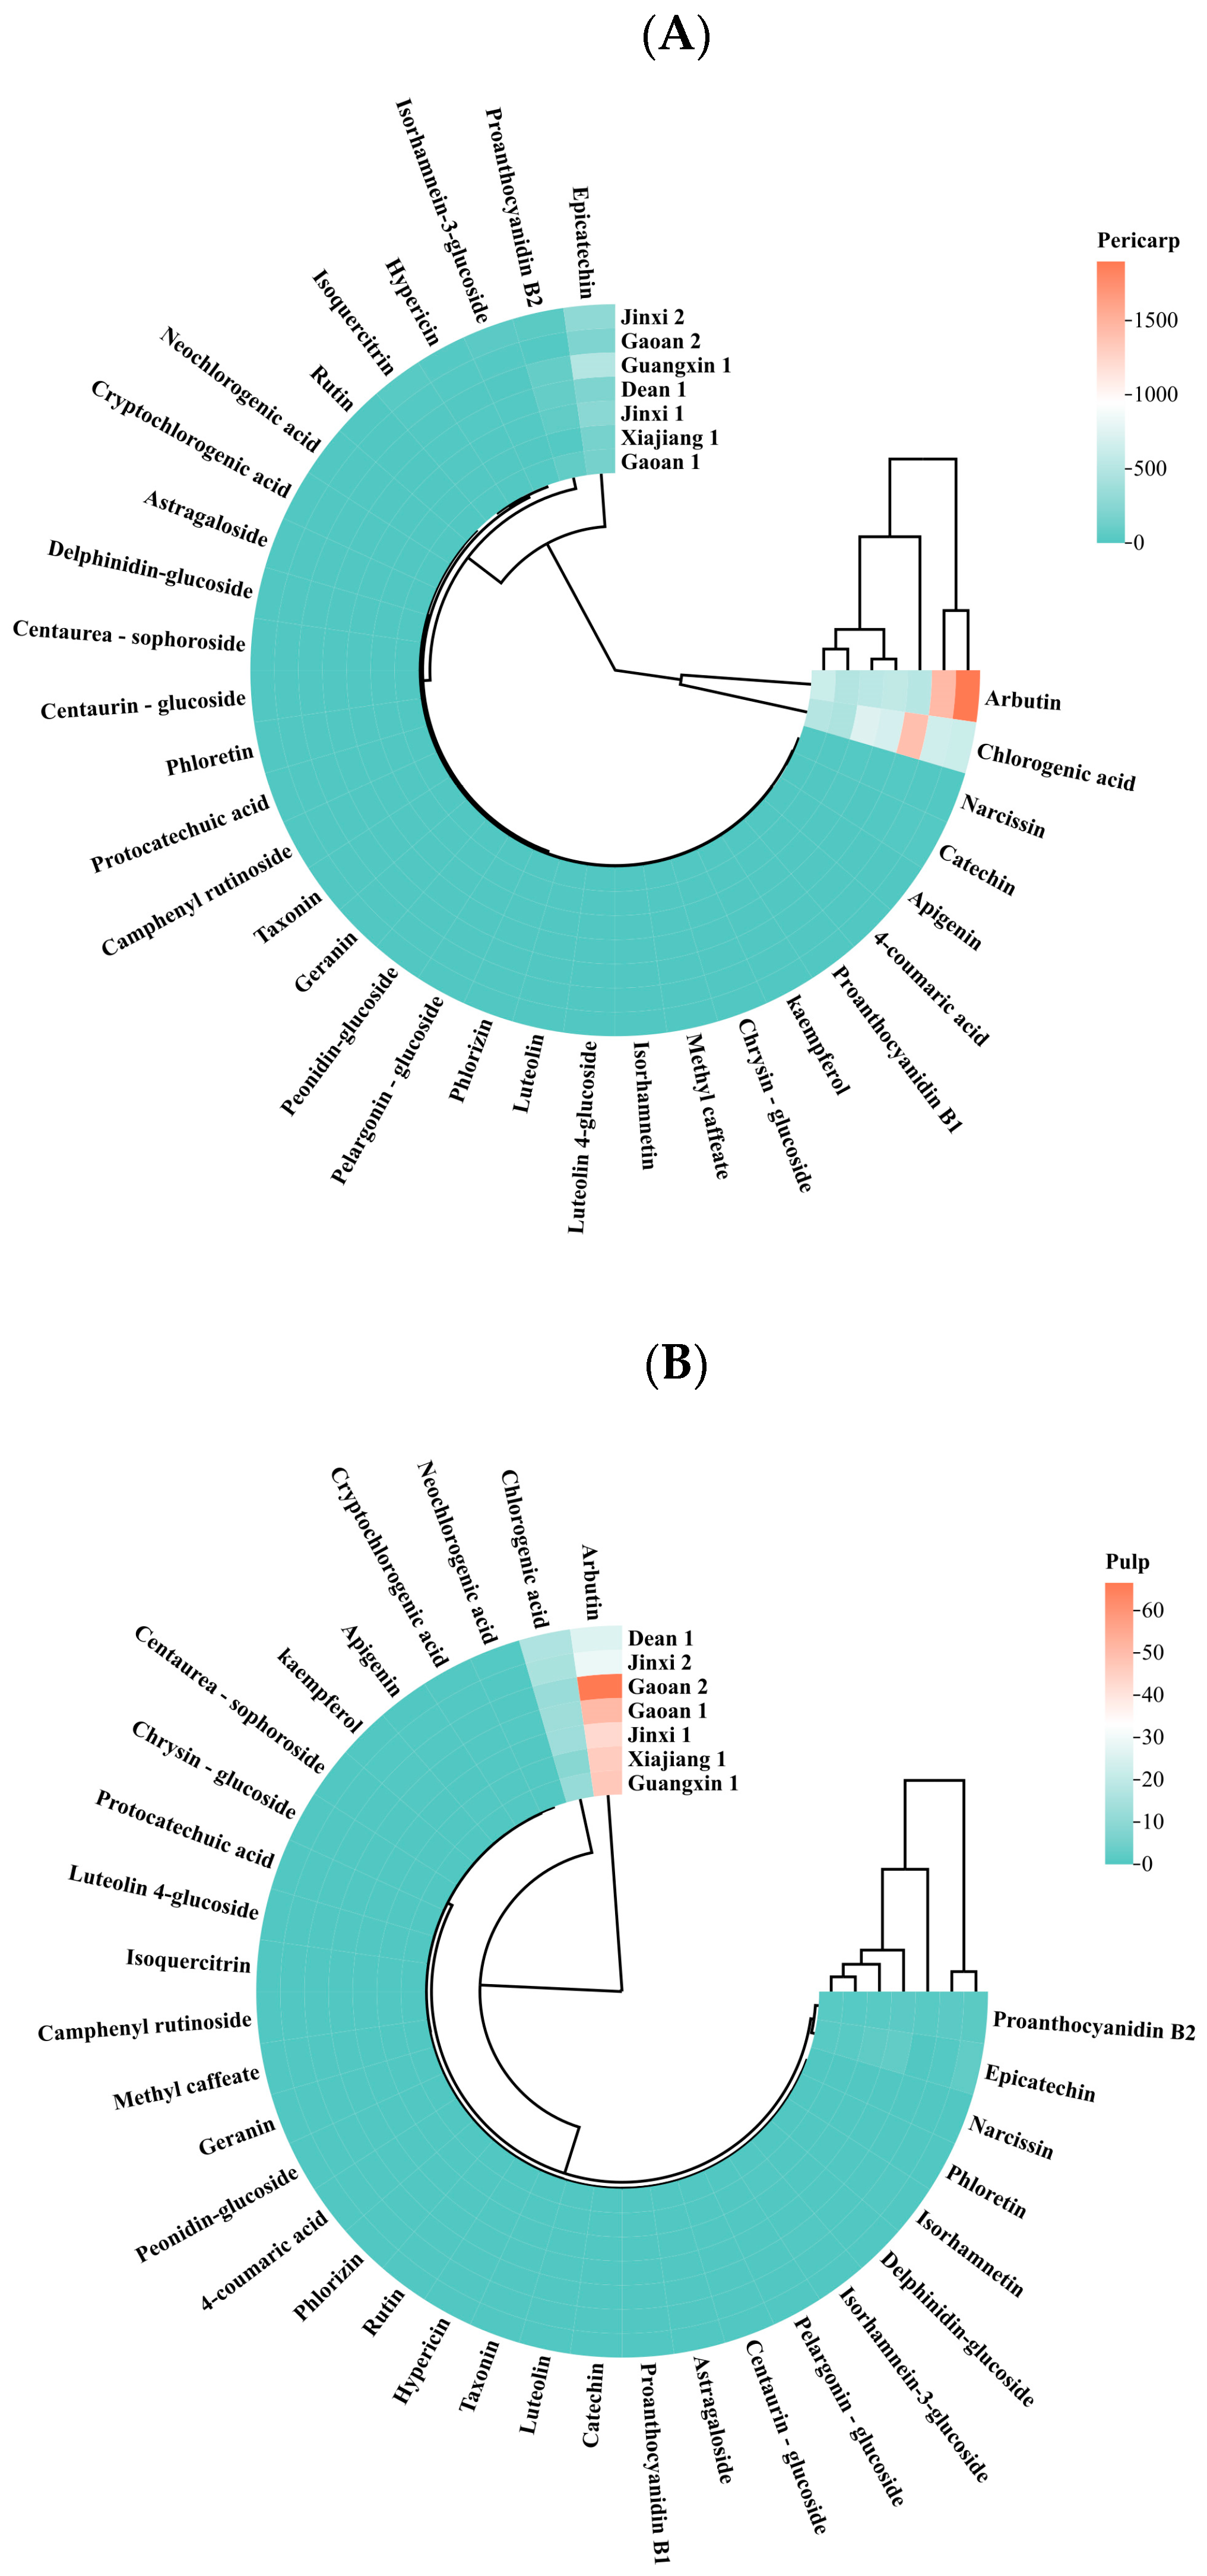
2.2.2. Determination of Chemical Components and Metabolites

To determine the average size of the fruits, two linear dimensions, fruit length and equatorial fruit diameter, were measured using a digital caliper with a sensitivity of 0.01 mm, according to Zhang et al. [20]. Fruit firmness was measured on two opposite sides of each fruit with a penetrometer. The soluble solid content (SSC) and titratable acidity (TA) were measured from the pressed juice of each fruit sample using a pocket Brix-acidity meter, according to the manufacturer’s instructions [21]. Phenolic compounds were determined using a modified Folin–Ciocalteu assay, as described by McDougall et al. [22]. The organic acids (lactic, tartaric, malic, citric, succinic, fumaric, and shikimic acids) in the pear fruits were measured using high-performance liquid chromatography (HPLC), as described by Vallarino et al. [23]. Soluble proteins were measured using the Coomassie brilliant blue colorimetric method, as described by Wang et al. [24]. The crude fat in the plants was determined using the Soxhlet extraction method, in accordance with the national standards of the People’s Republic of China [25]. Starch was measured using acid hydrolysis and the DNS colorimetric method, as described by Dai et al. [26]. Soluble sugar was measured using the acanthone–sulfuric acid colorimetric method, as described by Wang et al. [24]. The soluble carbohydrates in the plants were measured using the anthrone–sulfuric acid colorimetric method, as described by Ma et al. [27]. Crude fiber was measured using the acid detergent method, as described by Wang et al. [28]. Multiple elements (N, P, K, Ca, Mg, Na, Se, etc.) in the samples were unambiguously identified and quantified using an inductively coupled plasma–(tandem) mass spectrometer (ICP-MS), according to Kovač et al. [19] method. Vitamins (vitamins A, B, C, and E) were measured in accordance with the national food safety standards [29].

2.2.3. Sensory Analysis

A sensory analysis was carried out on the fresh ‘Cuiguan’ pear fruits harvested in summer 2024. After the fruit was peeled, it was cut into uniformly sized pieces, and, in a quiet room, these pieces were given to tasters in a random order to carry out a flavor assessment. The evaluators were aged between 20 and 60, comprising 100 females and 130 males. The evaluation involved eight aspects of fruit flavor, and the evaluators were asked to choose the most appropriate description among the following based on their subjective feelings:
  • Fruit size (Too small; Middling; Large; Too large);
  • Smoothness of fruit surface (Rough; Middling; Smooth);
  • Pulp texture (Coarse; Middling; Appropriate; Delicate);
  • Pulp type (Soft; Sandy; Loose; Crispy; Hard);
  • Fruit juice (Not much; Middling; Much; Too much).
  • Flavor (Slight acid; Tasteless; Appropriate; Sweet; Quite sweet);
  • Retronasal aroma (Hardly; Perfumed; Fragrant);
  • Purchase intention (No purchase intention; Possible purchase; Willing to buy; Buy at a high price).
To conduct a correlation analysis, a numerical index was calculated for each sensory attribute as the sum of the percentages of the comments weighted by continuous integers: Fruit size index = 4 × Too large% + 3 × Large% + 2 × Middling% + 1 × Too small%; Smoothness of fruit surface index = 3 × Smooth% + 2 × Middling% + 1 × Rough%; Pulp texture index = 4 × Delicate% + 3 × Appropriate% + 2 × Middling% + 1 × Coarse%; Pulp type index = 5 × Hard% + 4 × Crispy% + 3 × Loose% + 2 × Sandy% + 1 × Soft%; Fruit juice index = 4 × Much more% + 3 × Much% + 2 × Middle% + 1 × Few%; Flavor index = 5 × Quite sweet% + 4 × Sweet% + 3 × Appropriate % + 2 × Tasteless% + 1 × Slight acid%; Aroma index = 3 × Fragrant% + 2 × Perfumed% + 1 × Hardly%; Purchase intention index = 4 × Buy at a high price% + 3 × Willing to buy% + 2 × Possible purchase% + 1 × No purchase intention%.

2.2.4. Multivariate Statistical Analyses

It was necessary to reasonably process and transform the original data because the establishment of evaluation indices is greatly influenced by the dimension of each quality index. In this study, the Z score method was used to standardize the data, and each data point was converted to a dimensionless value with a mean of 0 and a standard deviation of 1. The standardized formula is as follows:
y = (xj − x)/sj
In Formula (1), xj is the observed value of the jth trait; x is the average of the observed values for trait j; and sj is the standard deviation of the observed values for the jth trait. The standardized data of fruit quality in 2020 and 2024 are shown in Table S2.
All statistical analyses were performed using IBM SPSS Statistics 20 software, Microsoft Office Excel, and online tools (https://www.chiplot.online/#). A one-way analysis of variance (ANOVA) and Tukey’s post hoc tests (p < 0.05) were performed to determine the significant parameters among the two cultivation modes assessed for each individual location. Principal component analysis (PCA) was applied, using unit variance scaling. A hierarchical cluster analysis (HCA) was performed on the mean metabolic values of the three replicates, which were median-centered and log10-transformed. A pretty heatmap (pheatmap) was used for HCA visualization. Pearson’s pairwise correlations between secondary metabolites and meteorological parameters were performed using multi-level correction.

3. Results

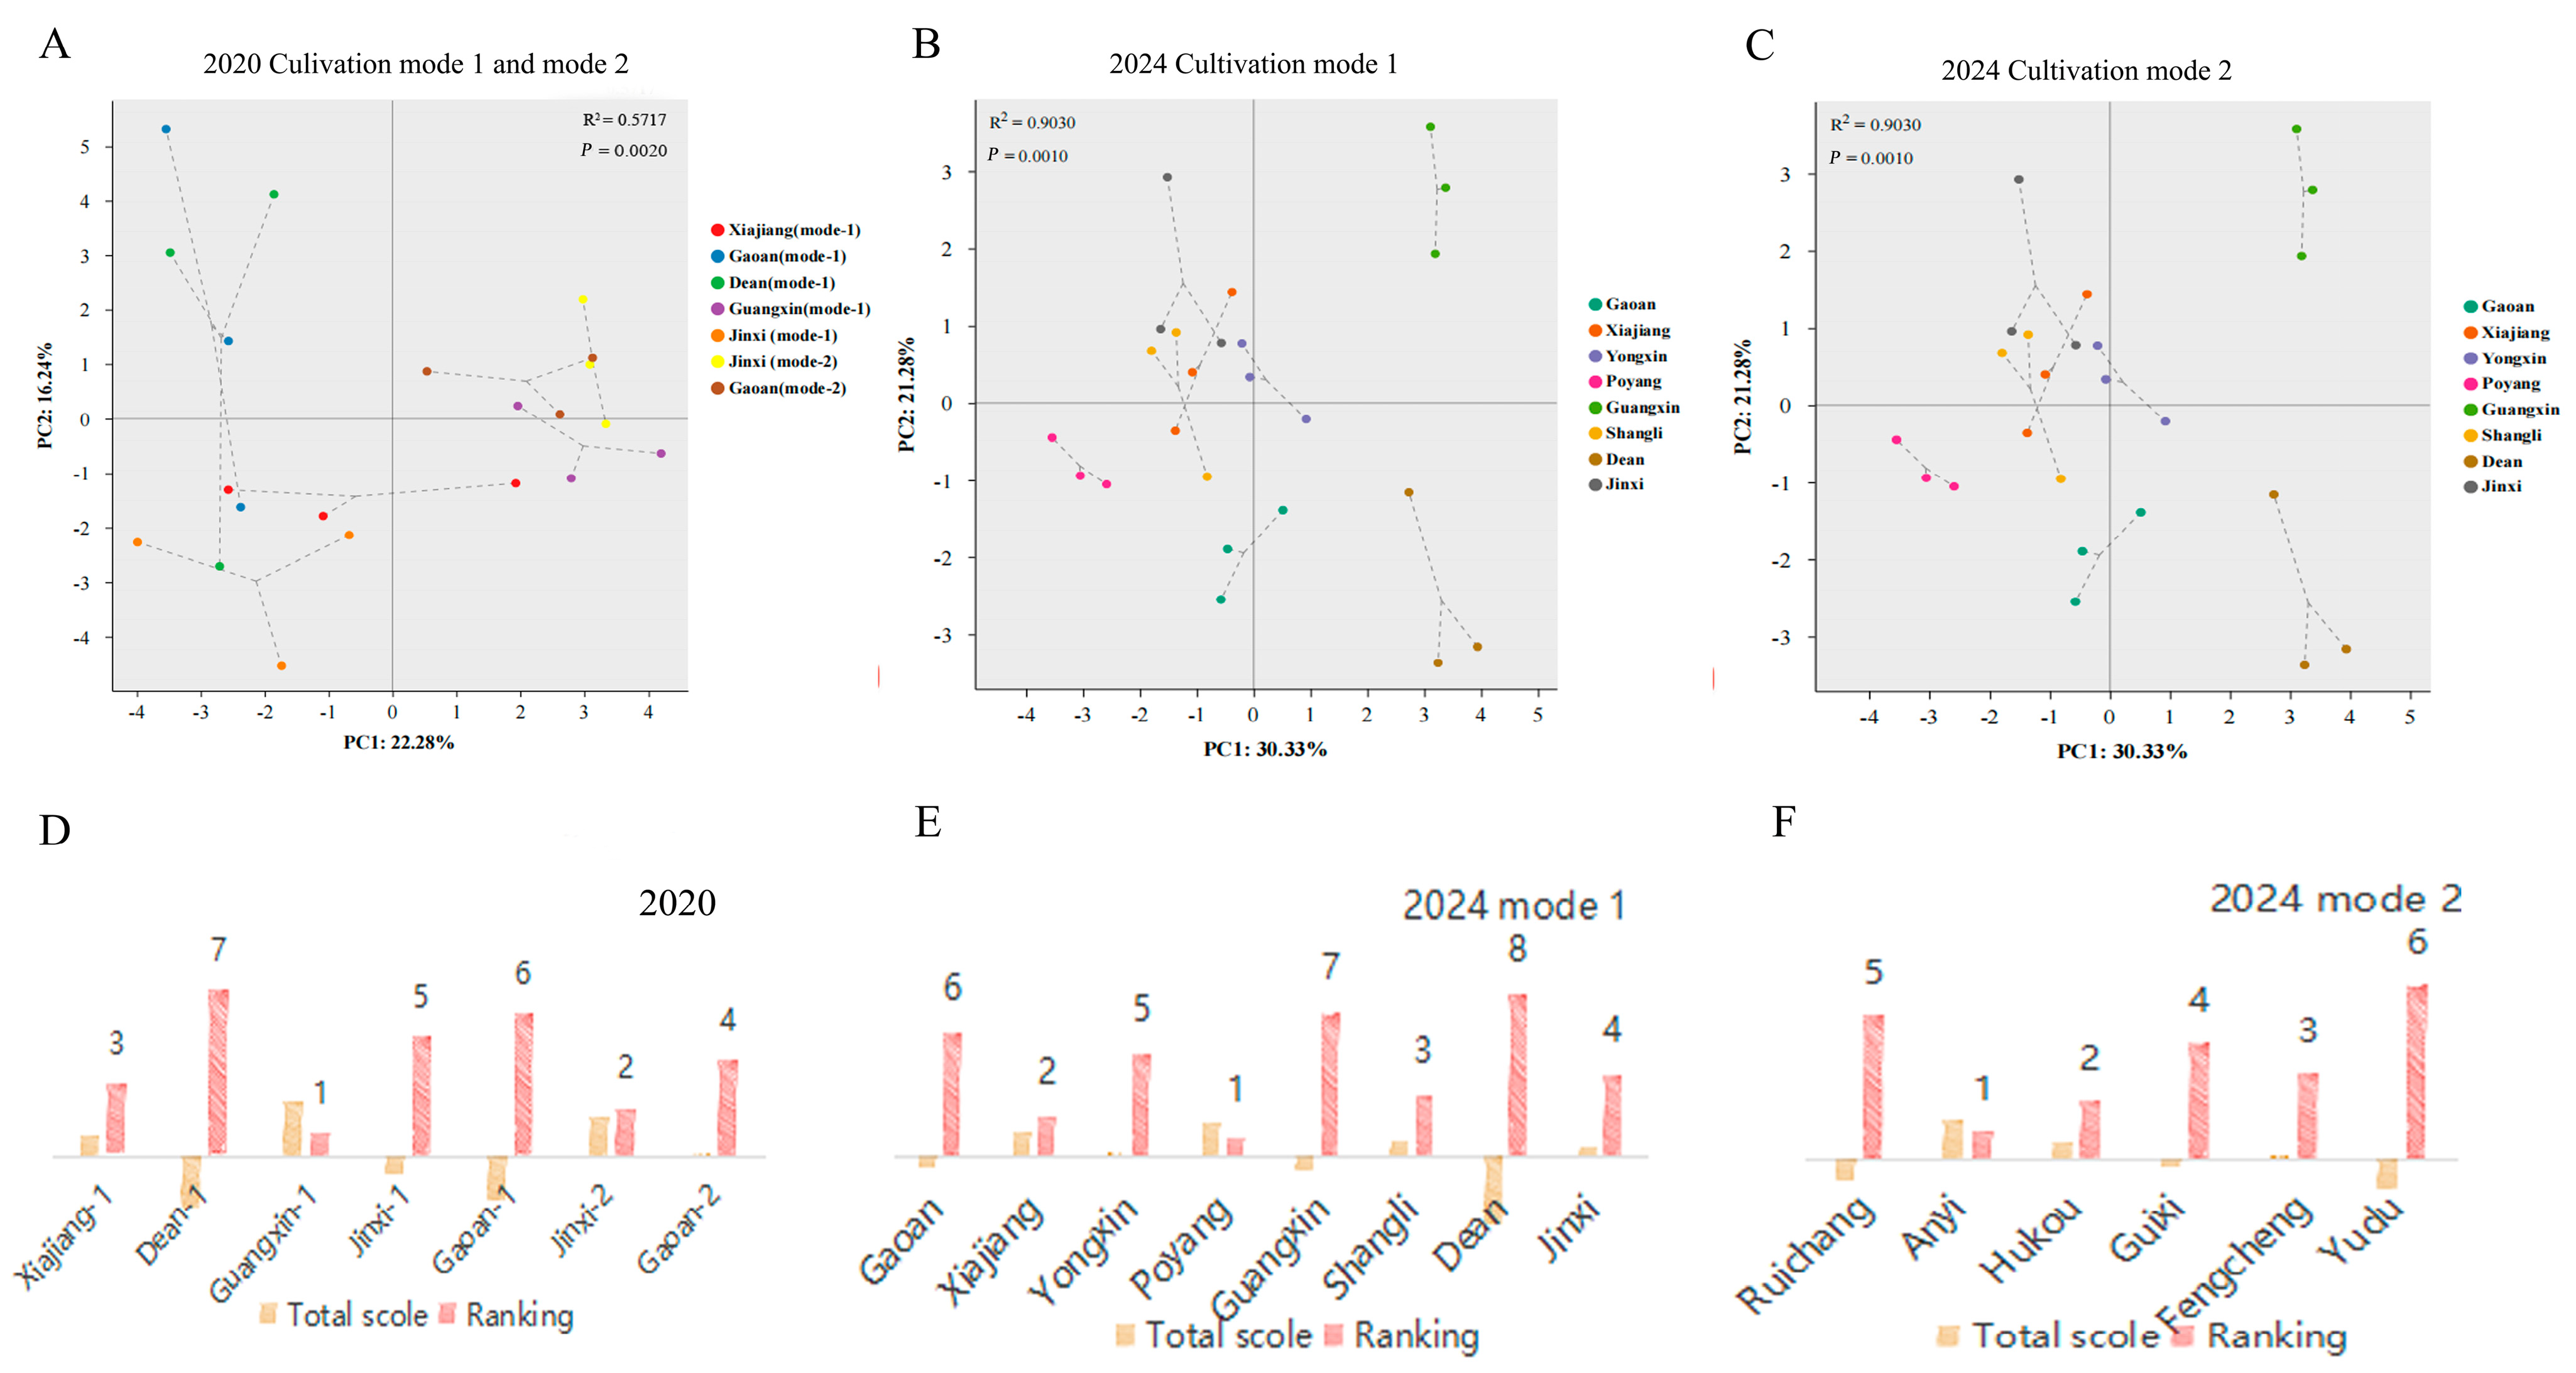
3.1. Quality Attributes Are Strongly Influenced by the Location and Cultivation Mode

The fully ripe ‘Cuiguan’ pear fruits obtained in 2020 were first assessed for important agronomical and quality traits, including flesh hardness; SSC; TA; and the contents of organic acids, total phenols, vitamins, etc. (Table 2). Significant differences among five planting sites with two cultivation modes were observed, and the coefficient of variation was 7–63%. The DP system led to a considerable increase in the SSC, SSC/TA, vitamin, and malic and citric acid contents, but the formation of crude fibers in the pulp was inhibited. However, an open-canopy architecture with no bagging treatment contributes to the synthesis and accumulation of secondary metabolites, especially to the polyphenols and β-carotene in peel and pulp. Although the impact of the different training systems on the flavor and nutritional properties of the pear fruits was noted, it was not stable across locations. For example, Guangxin-harvested samples showed the highest levels of hardness (6.40 kg·cm−2) and TA (0.90 g·kg−1), as well as malic (1320.64 mg·kg−1) and citric acids (742.50 mg·kg−1), the two most abundant organic acids associated with flavor establishment and consumer acceptance, while fruits harvested from higher-latitude areas such as ‘Gaoan’ and ‘Dean’ under the same cultivation mode 1 showed a decrease in the contents of SSC (11.10% and 10.53%) and other chemical components, possibly as a consequence of variable meteorological conditions.
Metal-based plant protective agents are frequently used in agricultural practices to protect plants from pests and pathogens [30]. As a result, it is possible that pesticide residues and heavy metals accumulated in food crops exert serious health/toxic effects [31]. Therefore, 14 heavy metals and 136 pesticide residues detected in the studied samples harvested in 2020 were quantified using ICP-MS and GC analyses. The results showed that the detected heavy metals included iron (Fe), manganese (Mn), copper (Cu), zinc (Zn), chromium (Cr), nickel (Ni), lead (Pb), and cadmium (Cd), whereas the pesticide residues included clorfenapir, procymidone, acetamiprid, spirodiclofen, chlorpyrifos, imidacloprid, pyraclostrobin, spirotetramat, bifenthrin, prochloraz, and myclobutanil (Table S3). Notably, significantly higher contents and more types of heavy metals and pesticide residues were detected in unbagged fruits under cultivation mode 2 than in bagged fruits, with some exceptions (Fe and Cr), but they all fell below the established maximum permissible limits. Our results suggest that bagging treatment is a strong driver of fruit safety properties, whereas the planting sites and cultivation modes of the pear orchard both contribute significantly to quality attributes.

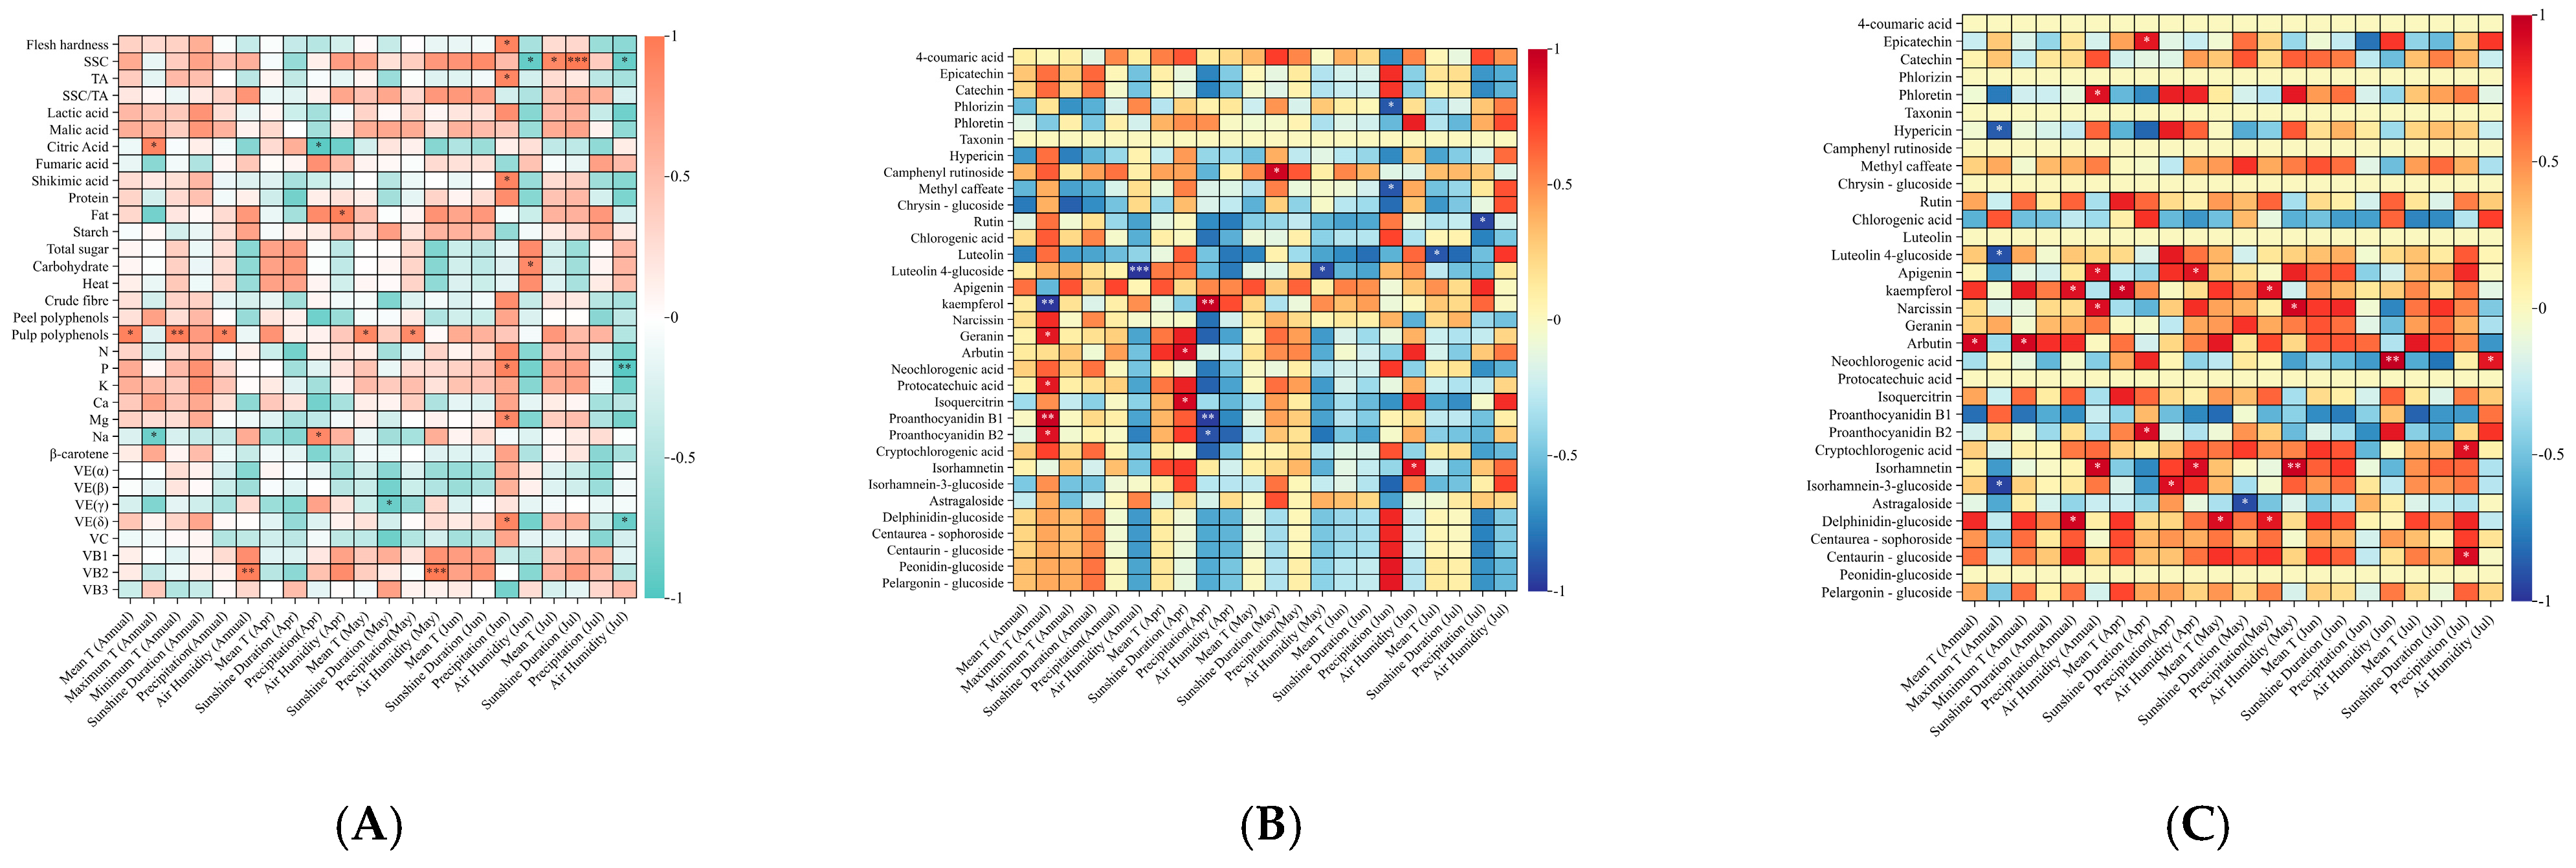
3.2. Analysis of Quality Attributes, Polyphenols, and Meteorological Parameters

Polyphenols, which are natural bioactive compounds found in pears, have been studied in young and mature pear fruits, as well as in different pear varieties, due to their nutritional and health-promoting benefits [32]. Hence, metabolite profiling of the pear fruits harvested in 2020 was performed to identify and quantify the 34 phenol components found in the peel and pulp, respectively (Table S4). Compared with the samples under cultivation mode 1, the bioactive compound content and antioxidant capacity of those under cultivation mode 2 were considerably higher, and the levels in the pericarp were higher than those in the pulp and were mainly characterized by epicatechin, chlorogenic acid, arbutin, proanthocyanidin B2, and isorhamnein-3-glucoside. Furthermore, Pearson’s correlation revealed that, while 57 and 19 positive significant correlations were found between the pulp phenols and quality attributes (p < 0.05), only 29 positive and 26 negative correlations were found in the peel phenols (Figure S2). Interestingly, the SSC/TA and citric acid levels, which may be decisive for fruit taste, maintained a decreasing trend with the accumulation of pulp and peel phenols. We speculate that the possible reason for this phenomenon is that the pulp, as the main edible part of pears, has a dynamic equilibrium relationship with the transformation between secondary and primary metabolites to ensure the nutritional and flavor value of the commodity.
A hierarchical cluster analysis (HCA) was first performed on the normalized mean value of the replicates to investigate the influence of the interaction between different planting locations and cultivation modes on secondary metabolites. The tree delineated all samples into two distinct groups, and the clustering of the peel and flesh slightly differed (Figure 2). Specifically, samples harvested from ‘Gaoan’ and ‘Xiajiang’ clustered together with ‘Jinxi’ and ‘Dean’ under cultivation mode 1, while ‘Jinxi’ clustered with ‘Gaoan’ under cultivation mode 2 in another group. Notably, Guangxin-harvested samples under cultivation mode 1 were closest to fruits under cultivation mode 2, showing the highest phenol levels in the pericarp. In addition, with the exception of ‘Dean’ located in the northern area in Jiangxi Province, midland-harvested samples under cultivation mode 1, such as those from ‘Guangxin’, ‘Xiajiang’, and ‘Jinxi’, clustered together, showing a higher level of pulp phenols. Our results suggest that, while secondary metabolites allowed for sample clustering based on the cultivation mode, the effect of the environment was also particularly notable for phenol components.
Agronomic traits, particularly primary metabolites, have been found to be highly influenced by the growing conditions and may be important for a plant’s interaction with its environment [33]. Thus, we aimed to identify associations between the measured environmental parameters, such as temperature (mean, maximum, and minimum), air humidity, sunshine duration, rainfall, and some important quality attributes (Figure 3A). The result showed that the mean temperature and sunshine duration during the harvesting season were strongly associated with the accumulation of SSC, which can be decisive for fruit taste; meanwhile, air humidity was negatively associated with most quality indicators, except for total sugars, carbohydrates, and calories. Notably, significant positive correlations were observed between climate parameters and total phenols of fruit pulp, especially annually and in May, but not with total phenols of fruit peel.
Next, based on the cluster analysis of polyphenol components, we further explored the influence of climatic parameters on secondary metabolites. Significant associations were observed between 18 peel phenols, 27 pulp phenols, and the meteorological parameters annually or during the flowering to harvest (April to July) season in 2020 (Figure 3B,C). The meteorological parameters were mainly positively correlated with the accumulation of pulp phenols and negatively associated with peel phenols, maintaining a stable trend with the previous results. Among them, annual temperatures (mean and mini) were determined to be crucial factors significantly associated with the accumulation of arbutin, a major pear phenol that aids in reducing the risk of cardiovascular diseases, diabetes, and various forms of diseases, while air humidity in the month before harvest negatively affected its content. These findings suggest that the phytochemical and metabolic profiles of ‘Cuiguan’ pear are mainly influenced by meteorological parameters, especially the precipitation and air humidity during the key growth period of the fruit.

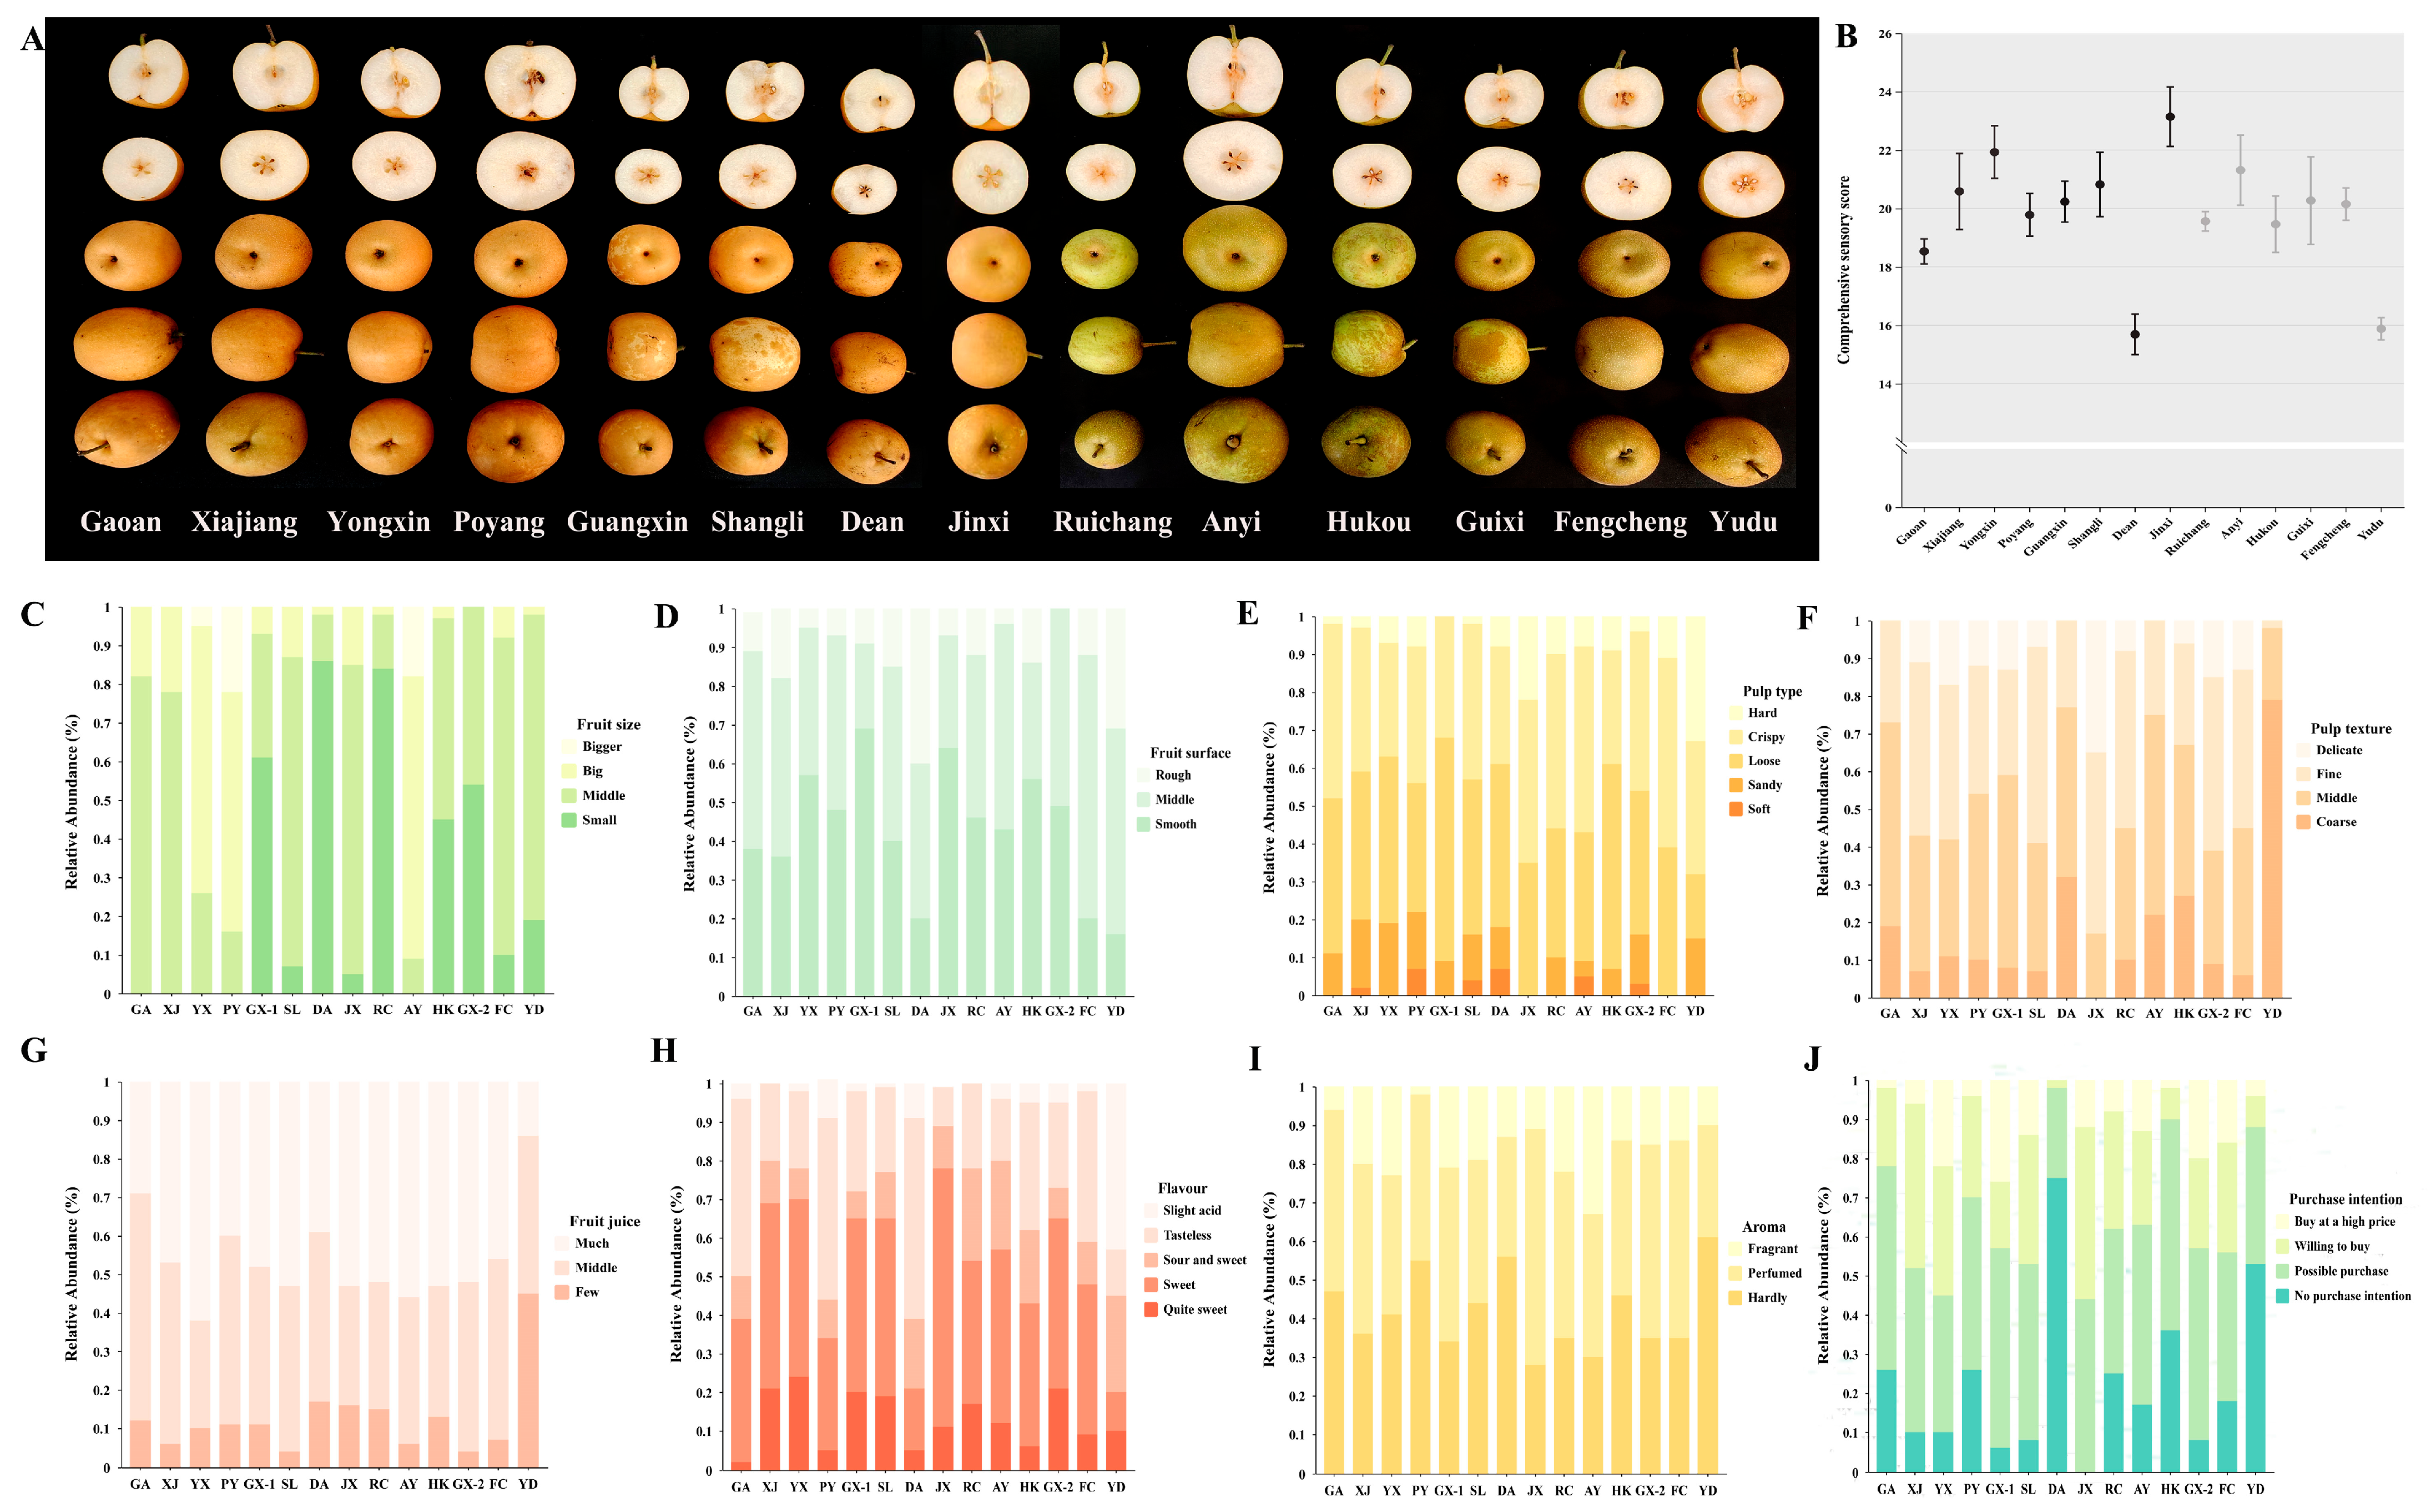
3.3. Sensory Analysis

Pears with better sensory attributes and nutrient components are often purchased at a premium price by consumers [34]. Sweetness and sourness, determined especially by the total sugar and organic acid contents, were identified as the two major indices in flavor establishment and consumer acceptance. To link quality attributes with consumer liking, a subset of samples harvested in the 14 locations during the summer of 2024 under two distinct cultivation modes were tested by a trained panel for sensory attributes, and 31 traits related to fruit size, pulp type, pulp texture, fruit juice, appearance, sweetness, aroma, and purchase intention were evaluated and scored from 1 to 5 (Table S5). The overall appreciation score was higher for samples from ‘Yongxin’ and ‘Jinxi’ located in south-central regions in Jiangxi Province under cultivation mode 1, and these samples were favored more by consumers than those from higher-latitude areas, such as ‘Dean’ (Figure 4B). However, samples from ‘Anyi’ and ‘Guixi’ located in north-central areas under cultivation mode 2 scored higher in terms of appearance, juiciness, and sweet flavor than those from lower-latitude areas, such as ‘Yudu’.
Strikingly, samples under cultivation mode 1 exhibited peel yellowing and a smoother surface, while the pericarp of samples without bagging treatment remained predominantly green and rougher (Figure 4A). To validate these observations, we measured the L/a/b values and the content of other components. Consistently, the ‘a’ value maintained a relatively stable trend and was substantially higher in plants under cultivation mode 1 than in those under cultivation mode 2. However, although under the same cultivation mode, the fruit size, SSC, SSC/TA, and stone cell levels significantly differed between planting sites, consistent with the results obtained in 2020 (Table 3). By integrating a sensory analysis, we also defined specific quality attributes associated with consumer acceptance. The results showed that increases in the ‘L’, ‘b’, core size, and total soluble solid (TSS) values were strongly associated with higher purchase intentions (Figure S3). Additionally, TSSs also showed a positive association with the pulp type, overall sweetness, and aroma of the fruits, while consumer acceptance was affected by the stone cell levels, which negatively regulated pulp texture, juiciness, and sweetness. These findings suggest that fruit appearance and internal flavor quality are critical in determining the sensory experience of consumers and, ultimately, purchase intentions.

3.4. Recommendations for Suitable Planting Sites and Cultivation Modes for ‘Cuiguan’ Pear

Conducting in-depth research on precise recommendations for economic crops at the county scale is crucial to fully exploit the planting potential [8]. The importance of optimal planting sites combined with appropriate cultivation modes on quality attributes was also highlighted by a principal component analysis (PCA) (Table S6). Principal component (PC) 1 explained 16.24% of the variation in 2020 and allowed for separation by cultivation mode. PC2 (22.28%) separated Guangxin-harvested samples under cultivation mode 1 from the samples harvested in the remaining locations, and they were clustered with ‘Jinxi’ and ‘Gaoan’ under cultivation mode 2 (Figure 5A), which is consistent with the HCA results and the heatmap visualization of peel polyphenols (Figure 2A). In 2024, the two first PCs (21.28% and 30.33% under cultivation mode 1 and 22.67% and 43.74% under cultivation mode 2) suggested a more obvious, though partial, separation of the samples based on their geographic locations (Figure 5B,C). It is worth noting that higher-latitude areas, such as ‘Gaoan’ and ‘Dean’ under cultivation mode 1, were clearly separated from the remaining locations by PC2 in 2020 and 2024. However, the same higher-latitude areas such as ‘Hukou’ under cultivation mode 2 were clustered together with lower-latitude areas such as ‘Guixi’ and ‘Fengcheng’ in 2024.
Next, a comprehensive evaluation model for fruit quality was established based on the variance contribution rates of each principal component. Importantly, the overall scores were higher for the samples obtained under cultivation mode 1 in mid-latitude regions, such as ‘Guangxin’, ‘Xiajiang’, and ‘Poyang’, while the samples obtained from ‘Dean’ and ‘Gaoan’, located in higher-latitude areas, scored the lowest values in 2020 and 2024 (Figure 5D,E). Consistent with this observed change in consumer acceptance of the overall flavor quality, except for the samples harvested from ‘Ruichang’, most overall scores were enhanced in those harvested from higher-latitude areas, such as ‘Anyi’ and ‘Hukou’. Curiously, although samples from ‘Anyi’ showed the highest overall appreciation under cultivation mode 2, samples from ‘Hukou’ and ‘Guixi’, which are located at higher latitudes, also scored relatively high (Figure 5F). Together, these results suggest that, to produce high-quality ‘Cuiguan’ pear, cultivation mode 1 is suitable for application in the south-central areas in Jiangxi Province, while cultivation mode 2 is more suitable for application in north-central areas characterized by low temperatures and little precipitation.

4. Discussion

4.1. Pear Phytochemical Profile and Secondary Metabolites Are Influenced by Cultivation Mode and Most Prominently by Climate

Fruit quality is defined by the properties that assign value to the commodity [35]. Apart from having a pleasant flavor, the ‘Cuiguan’ pear contains certain bioactive compounds that help to reduce the risk of cardiovascular diseases, diabetes, metabolic syndrome, and various forms of cancer [36]. As the buying habits of environmentally conscious consumers have progressively changed, there is an increased demand for healthy and nutrient-rich food. Significantly higher contents and more types of heavy metals and pesticide residues were detected in unbagged fruits under cultivation mode 2 than in bagged fruits, suggesting that bagging treatment may be a strong driver of fruit safety properties [37]. Fruit size and single fruit weight have been identified as key indicators of fruit quality and orchard yield [38]. Liu et al. [39] found that an open-canopy architecture promoted the accumulation of carbohydrates, thereby improving fruit size and quality attributes. Consistently, the most striking differences between the two assessed cultivation modes in this study were the lower TA and coarse fiber content, higher soluble solid content and larger size of fruits under an open-canopy architecture, which maintained a stable trend in 2020 and 2024 (Table 2 and Table 3). We speculate that the flat-type trellis architecture allowed for a higher net photosynthetic rate, along with a greater allocation of photosynthetic products to ripening fruit. Notably, soluble sugar and organic acids are responsible for overall liking, and our observation confirmed previous studies in which the temperature and air humidity in the month before harvest were found to strongly affect the contents of these important taste-related compounds [40]. Our results suggest that air humidity in the orchard during the harvest season had a negative impact on pear flavor value by decreasing the levels of SSC/TA and the main organic acids, such as malic and citric acids. Minerals are widely involved in the metabolic process of sugars, proteins, amino acids, vitamins, and other phytochemical compositions of crops [41,42]. However, to a lesser extent, the accumulation of minerals maintained relatively stable fluctuations, except for P and Cu, which may be associated with the influence of soil microbial activity, texture, and pH on absorption and conversion efficiency based on different ground management [43]. However, soil analysis is missing as one of the important conditions that affect quality. In future work, we will conduct more comprehensive research of various factors.
Secondary metabolites, particularly phenolic compounds, have been described as being important for a plant’s interaction with its environment, playing a role in defense mechanisms against abiotic or biotic stresses [33]. In addition, the health and antioxidant properties of pears can be attributed to enhanced phenols, especially the relatively high amounts of epicatechin, chlorogenic acid, arbutin, proanthocyanidin B2, and isorhamnein-3-glucoside [44]. There are large differences in the polyphenol components and concentrations among various cultivated varieties of pears [45,46]. Based on HCA analyses, our results revealed significant differences in the peel and pulp phenolic profiles of the fruit harvested from different planting sites, which were mainly influenced by agroecological conditions [Figure 3]. Allwood et al. [47] described a negative effect of high temperatures on the accumulation of delphinidin- and cyanidin-3-O-rutinoside, while at higher latitudes (and thus lower temperatures and solar radiation), cold climates were associated with a higher anthocyanin content. In addition, temperature and drought stress significantly affected fruit quality, such as the total sugar content, sugar–acid ratio, anthocyanin content, flavonoid and carotenoid levels, and anthocyanin-related enzyme activity in jujube [48]. In particular, solar radiation levels appeared to be a determining driving factor of pigment synthesis, as the values of the peel color indices ‘L’ and ‘a’ were much higher for bagged fruits characterized by smooth surfaces [15], which is consistent with our results; additionally, the phenol content in the pericarp and pulp of unbagged fruits was higher than in those of bagged fruit (see Figure 2). Increases in precipitation and air humidity may decrease the photosynthetic rate of leaves, ultimately affecting the metabolic components and taste perception of the fruit by changing the temperature and natural day length [49,50], and this could partially explain the clustering result of the total phenols and the difference in the quality attributes of the samples obtained in summer 2020. Furthermore, the contents of the main phenolic and nutrient components showed a positive association with the precipitation in the season before fruit harvesting, which may mean that cool summer conditions with abundant rainfall are favorable for obtaining high-quality pear fruits enriched in phenolic compounds, minerals, and vitamins [51,52].

4.2. Sensory Analysis

The sensory experience of fruits is undoubtedly of great significance to consumers’ purchasing intentions. Juiciness, sweetness, acidity, aroma, astringency, aftertaste, flesh texture, and firmness are regarded as the most important sensory traits in pear fruit quality [53,54]. Usually, attributes such as juiciness and crisp flesh are considered important for high-quality Asian pear, such as the early-maturing ‘Cuiguan’ pear independently selected and bred by the Zhejiang Academy of Agricultural Sciences. As consumers’ willingness to pay premiums for higher-quality products rises, demand for better visual appearance and organic characteristics is also increasing [55]. However, it is generally believed that many commercial fruit varieties have become progressively less flavorful over time [56]. Therefore, it is urgent to improve the quality of pear fruits from the perspective of sensory attributes.
The cultivation mode is highly associated with the internal and external qualities of fruit. Bagging treatment can enhance the visual appearance of fruit by impacting its firmness, carbohydrates, and polyphenol contents to varying degrees [57]. Our results showed that the external quality of two-layer bagged fruits was generally better than that of unbagged fruits. The bagged fruits exhibited cleaner and smoother surfaces, with higher purchase intentions by consumers (Figure 4A,B). It is worth noting that samples under cultivation mode 1 from ‘Dean’ and ‘Gaoan’, which are located at the highest latitude in Jiangxi Province, showed the lowest appreciation score, with characteristics of a small size, poor appearance, hard texture, and low juice output, while fruits harvested from lower latitudes (and thus higher temperatures and radiation) were associated with higher consumer acceptance. Thus, it could be hypothesized that the geographical location and ecological environment of the planting site may influence the appreciation score in sensory evaluation, and this trend remained stable in 2020 and 2024. Furthermore, the composition and concentration of the phytochemical profile strongly influence taste and aroma, ultimately affecting the sensory experience [58]. Accordingly, fruit chemical and consumer sensory panel data were combined to identify the major compounds associated with consumer acceptance, with increases in the TSS, ‘L’, and ‘b’ values being strongly associated with a higher appreciation score and tare/weight and LD/TD values being significantly negatively correlated with consumers’ purchasing intentions. Additionally, as an excellent source of dietary fiber, changes in the fruit texture and the softening of pear fruits are believed to be indicators of deteriorating quality [59]. In this study, a good relationship was observed between firmness and crispness, which was strongly correlated with the stone cell, TA, and TSS levels (Figure 4C), and this result is in line with a previous study conducted by Chauvin et al. [60] in apple and pear.

4.3. Discussion of Suitable Planting Sites and Cultivation Modes for High-Quality ‘Cuiguan’ Pear

Factors such as meteorological parameters, soil conditions, and cultivation mode are the main indicators used for fine zoning of crops in environmental suitability evaluation research [4]. Therefore, making precise recommendations at the county scale and exploring the optimal planting areas together with the most suitable cultivation modes for ‘Cuiguan’ pear are of great importance.
PCA can be used to calculate the overall score of samples while reducing information loss, and it has been widely used in the quality assessment of various fruits [61]. In our study, based on PCA analyses in 2020 and 2024, significant differences in quality attributes and nutritional components were outlined, allowing for sample separation on a geographical basis. Interestingly, an HCA and a heatmap visualization of the phenolic compound profiles showed a good clustering of samples under cultivation mode 1, with remarkably low levels of epicatechin, chlorogenic acid, arbutin, proanthocyanidin B2, isorhamnein-3-glucoside, and other bioactive compounds in both the fruit peel and pulp in comparison with samples under cultivation mode 2 (Figure 2). These observations confirm those in previous studies, where the training system and environmental factors acted synergistically on the levels of primary and secondary metabolites [9]. Furthermore, the influence was further quantified by the overall score and ranking of the sensorial evaluation and PCA in both 2020 and 2024. In particular, samples harvested from higher-latitude areas under cultivation mode 1, such as ‘Dean’ and ‘Gaoan’, were characterized by a low SSC and vitamin C content and poor purchase intentions in the two assessed harvests, and the overall ranking was relatively low, while the pear fruits harvested from lower-latitude areas (and thus higher temperatures and radiation) were associated with a higher nutrient component content and a better sensory experience, ultimately showing a relatively high overall ranking [62]. Curiously, no stable trend was maintained between the PCA and appreciation scores in Guangxin-harvested samples in 2020 and 2024 (Figure 4B and Figure 5D,E); thus, it could perhaps be hypothesized that the variation in the annual climatic parameters has a significant impact on the internal and external qualities of fruits. In addition, a clear effect of the growing location on quality attributes was found in the samples under cultivation mode 2, and this was more obvious in 2024. For example, samples from ‘Yudu’, the warmest area at a lower latitude in Jiangxi Province, showed particularly poor purchase intentions with higher TA and stone cell levels, while samples from the north-central region, such as ‘Anyi’, ‘Hukou’, and ‘Guixi’, scored higher with a good appearance, juiciness, and flavor.

5. Conclusions

In this study, we explored how ecological regions together with cultivation practices affect ‘Cuiguan’ pear quality in order to determine the best planting locations and cultivation techniques in Jiangxi Province. We evaluated two cultivation methods in different county-scale ecological zones over two periods (2020 and 2024) through the analyses of physicochemical attributes and phytochemical profiles, as well as sensory properties. The results indicate major differences between the two cultivation methods and their effects on different planting locations, with cultivation mode 1 achieving better overall scores in low-latitude areas and cultivation mode 2 appearing to be more appropriate for high-latitude sites. This research offers guidance for selecting specific cultivation areas and methods to enhance the cultivation potential of ‘Cuiguan’ pears, and it may be helpful in the design of guidelines for agricultural practices.

Supplementary Materials

The following supporting information can be downloaded at: https://www.mdpi.com/article/10.3390/horticulturae11070771/s1, Figure S1: Climate data of five planting sites in 2020; Figure S2: Heatmap visualization of pairwise Pearson’s correlations between polyphenol and quality parameters in fruit peel and pulp; Figure S3: Pairwise Pearson’s correlations between quality and sensorial parameters of samples in 2024; Table S1: Agricultural management defined by a pre-agreed protocol; Table S2: Standardized data of principal component analysis of quality attributes; Table S3: Data of pesticide residues and heavy metals; Table S4: Raw data of 34 polyphenol components; Table S5: Raw data of sensory evaluation; Table S6: PCA results (e.g., score plots, loading plots, and explained variance).

Author Contributions

Y.L., methodology, investigation, data analysis, images, writing—original draft; S.Y., investigation, attached images; L.X., resources, editing, funding acquisition; Y.W., data analysis, editing; C.Z., conceptualization, supervision, funding acquisition; C.X., validation, writing—editing; X.H., study design, writing—review and editing. All authors have read and agreed to the published version of the manuscript.

Funding

This research was supported by the earmarked fund for the Collaborative Innovation of Modern Agricultural Scientific Research of Jiangxi Province (The funder: lei Xu, The funding number: JXXTCXQN202002); the Jiangxi Academy of Agricultural Sciences Basic Research and Talent Training Special Projects (The funder: Yanting Li, The funding number: JXSNKYTCRC202504); and the Special Fund for the Key Research and Development Program Project of Jiangxi Province (The funder: lei Xu, The funding number: 20243BBH81010).

Informed Consent Statement

Not applicable.

Data Availability Statement

Data are contained within the article.

Acknowledgments

The authors acknowledge all the volunteers who participated in the fruit sensory evaluation.

Conflicts of Interest

The authors declare no conflicts of interest.

References

  1. Li, X.G.; Zh, S.L. Pears in China; China Agriculture Press: Beijing, China, 2020. [Google Scholar]
  2. Liu, J.X.; Fu, J.; Qin, J.X.; Su, B.L.; Hong, Y. Effects of climate variability and urbanization on spatiotemporal patterns of vegetation in the middle and lower Yangtze River Basin, China. Front. Plant Sci. 2024, 15, 1459058. [Google Scholar] [CrossRef] [PubMed]
  3. Liu, Z.; Li, X.Y.; Yang, L.; Cheng, Y.S.; Nie, X.S.; Wu, T. Comparative physiological, metabolomic and transcriptomic analyses reveal the mechanisms of differences in pear fruit quality between distinct training systems. BMC Plant Biol. 2024, 24, 28. [Google Scholar] [CrossRef]
  4. Liu, Z.; Tang, R.; Zhao, Z.; Li, S.; Zhu, D.; Zhang, X. Study on Fine Zoning of Maize Variety Suitability in Huang-Huai-Hai Area. J. Agric. 2015, 46, 281–288. [Google Scholar]
  5. Lu, X.; Han, F.R.; Shu, S.F. Meteorological condition analysis for growth of pear variety Cuiguan and its blossoming prediction. Zhejiang Agric. Sci. 2022, 63, 1279–1284. [Google Scholar]
  6. Balasundaram, A.; Aziz, B.A.; Gupta, A.; Shaik, A.; Kavitha, M.S. A fusion approach using GIS, green area detection, weather API and GPT for satellite image based fertile land discovery and crop suitability. Sci. Rep. 2024, 14, 16241. [Google Scholar] [CrossRef]
  7. Nikolaos, K.; Thomas, K.A.; George, B.; Serafeim, T.; Stefanos, K. Delineating Natural Terroir Units in Wine Regions Using Geoinformatics. Agriculture 2023, 13, 629. [Google Scholar] [CrossRef]
  8. Zou, Y.D.; Pan, S.H.; Yang, F.; Zhang, D.F.; Han, Y.Y.; Zhao, X.Y.; Wang, K.Y.; Zhao, C.J. Precise Recommendation Method of Suitable Planting Areas of Maize Varieties Based on Knowledge Graph. Agriculture 2023, 13, 526. [Google Scholar] [CrossRef]
  9. Wen, Y.; Zhang, Y.; Su, S.; Yang, S.; Ma, L.; Zhang, L. Effects of tree shape on the microclimate and fruit quality parameters of Camellia Oleifera Abel. Forests 2019, 10, 563. [Google Scholar] [CrossRef]
  10. Ngao, J.; Martinez, S.; Marquier, A.; Bluy, S.; Saint-Joanis, B.; Costes, E. Spatial variability in carbon- and nitrogen-related traits in apple trees: The effects of the light environment and crop load. J. Exp. Bot. 2021, 72, 1933–1945. [Google Scholar] [CrossRef]
  11. Zahnd, C.; Arend, M.; Kahmen, A.; Hoch, G. Microclimatic gradients cause phenological variations within temperate tree canopies in autumn but not in spring. Agric. For. Meteorol. 2023, 331, 109340. [Google Scholar] [CrossRef]
  12. Garrido, A.; De Vos, R.C.H.; Conde, A.; Cunha, A. Light microclimate-driven changes at transcriptional level in photosynthetic grape berry tissues. Plants 2021, 10, 1769. [Google Scholar] [CrossRef]
  13. Anthony, B.M.; Minas, I.S. Redefining the impact of preharvest factors on peach fruit quality development and metabolism: A review. Sci. Hortic. 2022, 297, 110919. [Google Scholar] [CrossRef]
  14. Dou, J.; Wang, J.; Tang, Z.; Yu, J.; Wu, Y.; Liu, Z. Application of exogenous melatonin improves tomato fruit quality by promoting the accumulation of primary and secondary metabolites. Foods 2022, 11, 4097. [Google Scholar] [CrossRef] [PubMed]
  15. Guan, Y.Q.; Qin, X.L.; Wei, C.Q.; Feng, Y.X.; Cheng, Y.D.; Zhang, Y.; Guan, J.F. Influence of Bagging on Fruit Quality, Incidence of Peel Browning Spots, and Lignin Content o ‘Huangguan’Pears. Plants 2024, 13, 516. [Google Scholar] [CrossRef]
  16. Wu, Y.; Wang, X.; Hu, R.; Zhao, J.; Jiang, Y. Responses of Soil Microbial Traits to Ground Cover in Citrus Orchards in Central China. Microorganisms 2021, 9, 2507. [Google Scholar] [CrossRef] [PubMed]
  17. Wang, H.; Xu, K.; Li, X.G.; Blanco-Ulate, B.; Yang, Q.S.; Yao, G.F.; Wei, Y.D.; Wu, J.; Sheng, B.L.; Chang, Y.H.; et al. A pear S1-bZIP transcription factor PpbZIP44 modulates carbohydrate metabolism, amino acid, and flavonoid accumulation in fruits. Hortic. Res. 2023, 10, 1093. [Google Scholar] [CrossRef] [PubMed]
  18. Qin, M.F.; Li, L.T.; Jugpreet, S.; Sun, M.Y.; Bai, B.; Li, S.W.; Ni, J.P.; Zhang, J.Y.; Zhang, X.; Wei, W.L.; et al. Construction of a high-density bin-map and identification of fruit quality-related quantitative trait loci and functional genes in pear. Hortic. Res. 2022, 9, 141. [Google Scholar] [CrossRef]
  19. Marija, K.; Mateja, B.; Jasna, J.; Ante, N.; Tomislav, R.; Tihomir, K.; Ivana, D.Š.; Šarkanj, B. Mycotoxins, Pesticide Residues, and Heavy Metals Analysis of Croatian Cereals. Microorganisms 2021, 9, 216. [Google Scholar] [CrossRef]
  20. Zhang, L.; Kamitakahara, H.; Sasaki, R.; Oikawa, A.; Saito, K.; Murayama, H. Effect of exogenous GA4+7 and BA+CPPU treatments on fruit lignin and primary metabolites in Japanese pear gold Nijisseiki. Sci. Hortic. 2020, 272, 109593. [Google Scholar] [CrossRef]
  21. Yun, Z.; Gao, H.; Chen, X.; Chen, Z.; Zhang, Z.; Li, T. Effects of hydrogen water treatment on antioxidant system of litchi fruit during the pericarp browning. Food Chem. 2021, 336, 127618. [Google Scholar] [CrossRef]
  22. McDougall, G.J.; Dobson, P.; Smith, P.; Blake, A.; Stewart, D. Assessing potential bioavailability of raspberry anthocyanins using an in vitro digestion system. J. Agric. Food Chem. 2005, 53, 5896–5904. [Google Scholar] [CrossRef] [PubMed]
  23. Vallarino, J.G.; Abreu, L.F.; Soria, C.; Tong, H.; Pott, D.M.; Willmitzer, L.; Fernie, A.R.; Nikoloski, Z.; Osorio, S. Genetic diversity of strawberry germplasm using metabolomic biomarkers. Sci. Rep. 2018, 8, 14386. [Google Scholar] [CrossRef]
  24. Wang, X.K. Principles and Techniques of Plant Physiology and Biochemistry Experiments; Higher Education Press: Beijing, China, 2006; pp. 190–192. [Google Scholar]
  25. GB 5009.6-2016; Food Safety National Standard—Determination of Fat in Food. The National Health and Family Planning Commission of the People’s Republic of China; The State Food and Drug Administration: Beijing, China, 2017.
  26. Dai, L.G.; He, Y.; Wang, H.; Li, H.; Liu, J.S. Method for Determining Total Starch Content in Grains. Chin. Food Nutr. 2013, 19, 38–42. [Google Scholar]
  27. Ma, J.M.; Wang, J.Q.; Xiao, X.H. Comparison of Three Extraction Methods for Soluble Carbohydrates in Forage Grasses. Heilongjiang Anim. Sci. Vet. Med. 2018, 19, 206–207. [Google Scholar]
  28. Wang, K.K.; Zheng, D.F. Improvement of the Method for Measuring Vegetable Crude Fiber—The Enhancement of the Acid-Soaping Method. Shandong Agric. Sci. 1990, 6, 45–46. [Google Scholar]
  29. GB 5009.82-2016; Food Safety National Standard—Determination of Vitamins A, D and E in Food. The National Health and Family Planning Commission of the People’s Republic of China; The State Food and Drug Administration: Beijing, China, 2017.
  30. Reinholds, I.; Pugajeva, I.; Bavrins, K.; Kuckovska, G.; Bartkevics, V. Mycotoxins, pesticides and toxic metals in commercial spices and herbs. Food Addit. 2017, 10, 5–14. [Google Scholar] [CrossRef] [PubMed]
  31. Jaishankar, M.; Tseten, T.; Anbalagan, N.; Mathew, B.B.; Beeregowda, K.N. Toxicity, mechanism and health effects of some heavy metals. Toxicol. 2014, 7, 60–72. [Google Scholar] [CrossRef]
  32. Sun, L.S.; Tao, S.T.; Zhang, S.L. Characterization and Quantification of Polyphenols and Triterpenoids in Thinned Young Fruits of Ten Pear Varieties by UPLC-Q TRAP-MS/MS. Molecules 2019, 24, 159. [Google Scholar] [CrossRef] [PubMed]
  33. Pott, D.M.; Osorio, S.; Vallarino, J.G. From central to specialized metabolism: An overview of some secondary compounds derived from the primary metabolism for their role in conferring nutritional and organoleptic characteristics to fruit. Front. Plant Sci. 2019, 10, 835. [Google Scholar] [CrossRef]
  34. Crisosto, C.H.; Mitchell, F.G.; Johnson, R.S. Factors in fresh market stone fruit quality. Post Harvest. News Infor. 1995, 6, 17–21. [Google Scholar]
  35. Wu, B.H.; Quilot, B.; Kervella, J.; Genard, M.; Li, S.H. Analysis of genotypic variation of sugar and acid contents in peaches and nectarines through the principle component analysis. Euphytica 2003, 32, 375–384. [Google Scholar] [CrossRef]
  36. Liaudanskas, M.; Zymonė, K.; Viškelis, J.; Klevinskas, A.; Janulis, V. Determination of the phenolic composition and antioxidant activity of pear extracts. J. Chem. 2017, 1–9. [Google Scholar] [CrossRef]
  37. Sharma, R.R.; Reddy, S.V.R.; Jhalegar, M.J. Pre-harvest fruit bagging: A useful approach for plant protection and improved post-harvest fruit quality-a review. J. Hortic. Sci. Biotech. 2014, 89, 101–113. [Google Scholar] [CrossRef]
  38. Li, X.L.; Liu, L.; Ming, M.L.; Hu, H.J.; Zhang, M.Y.; Fan, J. Comparative transcriptomic analysis provides insight into the domestication and improvement of pear (P. pyrifolia) fruit. Plant Physiol. 2019, 180, 435–452. [Google Scholar] [CrossRef]
  39. Liu, Z.; An, L.Y.; Lin, S.H.; Wu, T.; Li, X.M.; Tu, J.F. Comparative physiological and transcriptomic analysis of pear leaves under distinct training systems. Sci. Rep. 2020, 10, 18892. [Google Scholar] [CrossRef] [PubMed]
  40. Pott, D.M.; Durán-Soria, S.; Allwood, J.W.; Pont, S.; Gordon, S.L.; Jennings, N.; Austin, C.; Stewart, D.; Brennan, R.M.; Masny, A.; et al. Dissecting the impact of environment, season and genotype on blackcurrant fruit quality traits. Food Chem. 2023, 402, 134360. [Google Scholar] [CrossRef]
  41. Liao, L.; Dong, T.; Qiu, X.; Rong, Y.; Wang, Z.; Zhu, J. Nitrogen nutrition is a key modulator of the sugar and organic acid content in citrus fruit. PLoS ONE 2019, 14, e0223356. [Google Scholar] [CrossRef] [PubMed]
  42. Wang, G.; Wang, J.; Han, X.; Chen, R.; Xue, X. Effects of Spraying Calcium Fertilizer on Photosynthesis, Mineral Content, Sugar–Acid Metabolism and Fruit Quality of Fuji Apples. Agronomy 2022, 12, 2563. [Google Scholar] [CrossRef]
  43. Chen, Y.H.; Guo, N.; He, W.T.; Naeem, A.; Abbasi, Y.R.; Qu, X.L.; Zhang, S.X. Transformation of Soil Accumulated Phosphorus and Its Driving Factors across Chinese Cropping Systems. Agronomy 2023, 13, 949. [Google Scholar] [CrossRef]
  44. Cui, T.; Nakamura, K.; Ma, L.; Li, J.Z.; Kayahara, H. Analyses of arbutin and chlorogenic acid, the major phenolic constituents in Oriental pear. Food Chem. 2005, 53, 3882–3887. [Google Scholar] [CrossRef]
  45. Li, X.; Wang, T.; Zhou, B.; Gao, W.; Cao, J.; Huang, L. Chemical composition and antioxidant and anti-inflammatory potential of peels and flesh from 10 different pear varieties (Pyrus spp.). Food Chem. 2014, 152, 531–538. [Google Scholar] [CrossRef] [PubMed]
  46. Asima, A.; Amila, O.; Fuad, G.; Mekjell, M.; Pakeza, D.; Senad, M.; Nermina, S.; Oručević, Ž.S.; Igor, J.; Osman, M.; et al. A Comparative, Study of Ten Pear (Pyrus communis L.) Cultivars in Relation to the Content of Sugars, Organic Acids, and Polyphenol Compounds. Foods 2022, 11, 3031. [Google Scholar] [CrossRef] [PubMed]
  47. Allwood, J.W.; Woznicki, T.L.; Xu, Y.; Foito, A.; Aaby, K.; Sungurtas, J.; Sønsteby, A. Application of HPLC–PDA–MS metabolite profiling to investigate the effect of growth temperature and day length on blackcurrant fruit. Metabolomics 2019, 15, 1–17. [Google Scholar] [CrossRef]
  48. Jiang, W.Q.; Li, N.; Zhang, D.P.; Meinhardt, L.; Cao, B.; Li, Y.J.; Song, L.H. Elevated temperature and drought stress significantly affect fruit quality and activity of anthocyanin-related enzymes in jujube (Ziziphus jujuba Mill. cv. ‘Lingwuchangzao’). PLoS ONE 2020, 15, e0241491. [Google Scholar] [CrossRef]
  49. Samykanno, K.; Pang, E.; Marriott, P.J. Genotypic and environmental effects on flavor attributes of ‘Albion’and ‘Juliette’strawberry fruits. Sci. Hortic. 2013, 164, 633–642. [Google Scholar] [CrossRef]
  50. Liu, C.S.; Pu, Y.Y. Study on the relationship between apple quality and meteorological conditions. Acta Hortic. Sin. 1987, 02, 73–80. [Google Scholar]
  51. Liu, J.; Du, H.B.; Wu, Z.F.; He, H.S.; Wang, L.; Zong, S.W. Recent and future changes in the combination of annual temperature and precipitation throughout China. Climate 2017, 37, 821–833. [Google Scholar] [CrossRef]
  52. Tang, Z.X.; Chen, L.L.; Chen, Z.B. Climatic factors determine the yield and quality of Honghe fue-cured tobacco. Sci. Rep. 2020, 10, 19868. [Google Scholar] [CrossRef]
  53. Kappel, F.; Fisherfleming, R.; Hogue, E.J. Ideal pear sensory attributes and fruit characteristics. HortScience. 1995, 30, 988–993. [Google Scholar] [CrossRef]
  54. Predieri, S.; Missere, D.; Gatti, E. Studies on sensory evaluation and quality of pear fruits in Emilia-Romagna. Acta Hortic. 2002, 596, 817–820. [Google Scholar] [CrossRef]
  55. Klee, H.J.; Tieman, D.M. The genetics of fruit flavour preferences. Nat. Rev. Genet. 2018, 19, 347–356. [Google Scholar] [CrossRef] [PubMed]
  56. Colantonioa, V.; Ferrao, L.F.V.; Tieman, D.M.; Bliznyuk, N.; Sims, C.; Klee, H.J.; Munoz, P.; Resende, M.F.R. Metabolomic selection for enhanced fruit flavor. Proc. Natl. Acad. Sci. USA 2022, 119, e2115865119. [Google Scholar] [CrossRef]
  57. Hudina, M.; Stampar, F.; Orazem, P.; Petkovsek, M.M.; Veberic, R. Phenolic compounds profile, carbohydrates and external fruit quality of the ‘Concorde’ pear (Pyrus communis L.) after bagging. Plant Sci. 2012, 92, 67–75. [Google Scholar]
  58. Tieman, D.; Zhu, G.; Resende, M.F., Jr.; Lin, T.; Nguyen, C.; Bies, D.; Rambla, J.L.; Beltran, K.S.O.; Taylor, M.; Zhang, B.; et al. A chemical genetic roadmap to improved tomato flavor. Science 2017, 355, 391–394. [Google Scholar] [CrossRef] [PubMed]
  59. Hiwasa, K.; Rose, J.K.C.; Nakano, R.; Inaba, A.; Kubo, Y. Differential expression of seven α-expansin genes during growth and ripening of pear fruit. Physiol. Plant. 2003, 117, 564–572. [Google Scholar] [CrossRef]
  60. Chauvin, M.A.; Ross, C.F.; Pitts, M.; Kupferman, E.; Swanson, B. Relationship between instrumental and sensory determination of apple and pear texture. J. Food Qual. 2010, 33, 181–198. [Google Scholar] [CrossRef]
  61. Tian, Y.H.; Zhang, L.W.; Tian, Y.; Yang, Z.Y.; Wang, Y.G. Amino acid composition and principal component analysis of 11 kinds of jujube. Mol. Plant Breed. 2018, 16, 1300–1306. [Google Scholar]
  62. Vagiri, M.; Ekholm, A.; Oberg, E.; Johansson, E.; Andersson, S.C.; Rumpunen, K. Phenols and ascorbic acid in black currants (Ribes nigrum L.): Variation due to genotype, location, and year. J. Agric. Food Chem. 2013, 61, 9298–9306. [Google Scholar] [CrossRef]
Figure 1. Distribution of different planting sites and cultivation modes in Jiangxi Province, China. (A) Location of Jiangxi Province on the map of China. (B,C) Real photos of spring pear orchards in cultivation modes 1 and 2. (D) County locations of cultivation mode 1 in Jiangxi Province marked with red asterisks and those of cultivation mode 2 marked with green asterisks, with cities marked in black.
Horticulturae 11 00771 g001
Figure 2. Hierarchical cluster analysis (HCA) and heatmap visualization of polyphenol components in pericarp (A) and pulp (B) identified in 2020. Each value represents the normalized mean of three biological replicates, with red and green colors denoting relatively high and low contents.
Horticulturae 11 00771 g002
Figure 3. Heatmap visualization of pairwise Pearson’s correlations between climate parameters and quality attributes (A) and the polyphenol components in the pericarp (B) and pulp (C). Each square represents a given r value in a false color scale (with red and blue or green colors indicating positive and negative correlations, respectively). Significant correlations (p ≤ 0.05, p ≤ 0.01, p ≤ 0.001) are indicated with *, **, ***, respectively.
Horticulturae 11 00771 g003
Figure 4. Sensory evaluation of ‘Cuiguan’ pear in 2024. (A,B) Photos and overall appreciation scores of samples harvested from different planting sites. Black represents cultivation mode 1, while grey represents cultivation mode 2. (CJ) Evaluators’ comments on fruit size, fruit surface, pulp type, pulp texture, fruit juice, flavor (sweetness), retronasal aroma, and purchase intentions. The horizontal coordinate represents the initials of the counties where each planting site was located. Among them, GX-1 stands for Guangxin, and GX-2 stands for Guixi.
Horticulturae 11 00771 g004
Figure 5. Principal component analysis (PCA) of basic quality attributes of pear fruits in 2020 and 2024. (AC) Plot showing the PCA distribution. Each dot represents the mean value of the biological replicates, with colors indicating the different locations where the pears were grown. PC1 and PC2 represent the first and second principal components, respectively. (DF) Total score and ranking of samples. ‘X-Y’ denotes the fruits harvested in X county under cultivation mode Y.
Horticulturae 11 00771 g005
Table 1. Details on the cultivation modes of different planting sites where the fruits were harvested in 2020 and 2024.
YearCultivation ModePlanting Sites: City (County)
2020Mode 15 (5): Jinan (Xiajiang), Fuzhou (Jinxi), Yichun (Gaoan), Shangrao (Guangxin), Jiujiang (Dean)
Mode 22 (2): Fuzhou (Jinxi), Yichun (Gaoan)
2024Mode 16 (8): Yichun (Gaoan), Jian (Xiajiang, Yongxin), Shangrao (Poyang, Guangxin), Pingxiang (Shangli), Jiujiang (Dean), Fuzhou (Jinxi)
Mode 25 (6): Jiujiang (Ruichang, Hukou), Nanchang (Anyi), Yingtan (Guixi), Yichun (Fhengcheng), Ganzhou (Yudu)
Table 2. Different quality compounds identified in ‘Cuiguan’ pear from five planting sites under two different cultivation modes in 2020. Data are expressed as means ± standard error of three replications. Different letters indicate significant differences among groups according to Tukey’s HSD test (p < 0.05).
LocationsXiajiang-1Jinxi-1Gaoan-1Dean-1Guangxin-1Jinxi-2Gaoan-2MeanCV
Flesh hardness (kg/cm2)5.07 ± 0.21 bc4.93 ± 0.12 abc4.53 ± 0.06 d4.63 ± 0.21 cd6.40 ± 0.26 a5.30 ± 0.46 b4.77 ± 0.21 cd5.0912%
SSC (%)11.83 ± 0.23 ab12.10 ± 0.26 a11.10 ± 0.75 bcd10.53 ± 0.76 cd11.57 ± 0.32 abc10.92 ± 0.77 bcd10.33 ± 0.35 d11.27%
TA (g/kg)0.86 ± 0.03 bc0.79 ± 0.02 c0.83 ± 0.03 bc0.80 ± 0.10 c0.91 ± 0.05 bc1.05 ± 0.12 a0.94 ± 0.08 ab0.8812%
SSC/TA13.84 ± 0.76 ab15.28 ± 0.77 a13.36 ± 0.72 b13.27 ± 0.86 b12.84 ± 0.94 b10.4 ± 0.47 c11.04 ± 0.82 c12.8613%
Lactic acid (mg/kg)273.16 ± 70.45 bc324.29 ± 46.16 abc247.73 ± 21.63 c237.92 ± 40.26 c376.03 ± 24.12 ab409.38 ± 110.05 a430.32 ± 9.65 a328.427%
Tartaric acid (mg/kg)<50<50<50<50<50<50<5000
Malic acid (mg/kg)1187.65 ± 27.00 ab1400.18 ± 112.62 a1229.00 ± 26.36 ab1168.85 ± 198.65 ab1320.64 ± 125.69 b1264.68 ± 203.91 ab1265.01 ± 79.88 ab1262.2910%
Citric acid (mg/kg)450.27 ± 65.46 bc634.59 ± 137.48 ab608.36 ± 131.8 ab704.68 ± 278.03 ab742.5 ± 89.79 a299.59 ± 11.36 c334.19 ± 45.78 c539.1738%
Succinic acid (mg/kg)<250<250<250<250<250<250<25000
Fumaric acid (mg/kg)8.36 ± 2.50 ab5.68 ± 2.65 abc8.83 ± 4.37 a6.74 ± 1.84 abc2.47 ± 0.44 c3.39 ± 2.62 bc1.86 ± 0.18 c5.3363%
Shikimic acid (mg/kg)103.63 ± 17.52 bcd88.94 ± 20.5 cd66.38 ± 18.58 d77.57 ± 44.71 cd143.68 ± 18.97 ab117.1 ± 15.90 abc161.17 ± 13.34 a108.3535%
Protein (g/kg)4.40 ± 0.26 ab3.90 ± 0.36 ab3.70 ± 0.61 ab3.67 ± 0.64 b4.43 ± 0.55 ab4.47 ± 0.12 a3.77 ± 0.25 ab4.0513%
Fat (g/kg)3.00 ± 0 a2.67 ± 0.58 ab2.67 ± 0.58 ab2.33 ± 0.58 ab2.33 ± 0.58 ab2.33 ± 0.58 ab2.00 ± 0 b2.4821%
Starch (g/kg)1.99 ± 0.83 a2.59 ± 0.40 a2.05 ± 0.79 a2.06 ± 1.37 a1.48 ± 0.97 a1.85 ± 0.24 a1.86 ± 0.74 a1.9839%
Total sugar (g/kg)64.80 ± 3.86 b62.80 ± 1.56 b78.43 ± 10.08 a70.9 ± 2.52 ab69.27 ± 4.59 ab76.53 ± 4.39 a64.87 ± 2.65 b69.6610%
Carbohydrate (g/kg)66.77 ± 4.45 c65.40 ± 1.84 c80.50 ± 9.35 a72.93 ± 1.57 bc70.80 ± 4.65 bc78.40 ± 4.31 ab66.73 ± 2.99 c71.6510%
Heat (kcal/kg)311.77 ± 17.57 c301.17 ± 11.96 c360.7 ± 34.15 a327.5 ± 8.13 bc321.73 ± 17.01 bc352.4 ± 19.86 ab299.97 ± 11.28 c325.038%
Crude fiber (%)1.63 ± 0.15 ab1.30 ± 0.17 b1.40 ± 0.17 ab1.37 ± 0.46 b1.73 ± 0.15 a1.77 ± 0.06 a1.50 ± 0 ab1.5316%
Peel phenols (mg/kg)1139.04 ± 128.58 c1645.78 ± 130.26 bc1382.73 ± 509.72 bc1581.91 ± 282.01 bc2546.68 ± 1450.82 ab2972.08 ± 834.12 a2404.01 ± 267.55 ab1953.1744%
Pulp phenols (mg/kg)57.89 ± 18.75 ab59.9 ± 14.32 ab68.84 ± 13.92 ab46.61 ± 12.37 b61.14 ± 8.92 ab48.16 ± 0.96 b80.89 ± 18.69 a60.4927%
N (mg/kg)704.00 ± 42.33 ab624.00 ± 57.69 ab592.00 ± 97.32 ab586.67 ± 102.87 b709.33 ± 88.12 ab714.67 ± 18.48 a602.67 ± 40.27 ab647.6213%
P (mg/kg)158.00 ± 14.18 ab157.67 ± 16.04 ab136.97 ± 34.17 b123.00 ± 19.47 b179.00 ± 11 a133.67 ± 22.01 b134.00 ± 4.36 b146.0417%
K (mg/kg)862.16 ± 291.68 a1061.36 ± 273.55 a850.32 ± 104.55 a802.35 ± 471.59 a1049.65 ± 296.10 a1095.98 ± 273.09 a810.75 ± 470.69 a933.2233%
Ca (mg/kg)22.09 ± 3.18 b27.92 ± 9.83 ab27.08 ± 7.76 ab25.79 ± 5.04 ab36.06 ± 14.38 ab34.88 ± 2.95 ab39.62 ± 13.09 a30.4932%
Mg (mg/kg)62.48 ± 12.53 a62.37 ± 6.98 a50.86 ± 19.89 a53.91 ± 16.28 a75.55 ± 13.25 a65.68 ± 4.29 a61.57 ± 19.67 a61.7723%
Na (mg/kg)10.10 ± 1.83 a5.03 ± 0.62 b5.25 ± 1.77 b5.95 ± 2.05 b4.57 ± 0.82 b6.24 ± 1.15 b5.81 ± 0.79 b6.1334%
Se (mg/kg)<0.01<0.01<0.01<0.01<0.01<0.01<0.0100%
β-carotenoid (mg/kg)0.03 ± 0.02 b0.05 ± 0.02 ab0.02 ± 0.01 b0.04 ± 0.01 ab0.08 ± 0.04 a0.08 ± 0.03 a0.03 ± 0.01 b0.0558%
VA (µg/kg)<0.01<0.01<0.01<0.01<0.01<0.01<0.0100
VE (α) (mg/kg)12.06 ± 2.81 ab8.84 ± 2.76 bc12 ± 3.12 ab12.12 ± 4.51 ab14.93 ± 0.61 a8.14 ± 2.71 bc6.56 ± 3.96 c10.6736%
VE (β) (mg/kg)0.53 ± 0.22 ab0.23 ± 0.14 bc0.46 ± 0.17 abc0.48 ± 0.21 abc0.67 ± 0.04 a0.28 ± 0.07 c0.22 ± 0.07 c0.4150%
VE (γ) (mg/kg)0.06 ± 0.03 a0.01 ± 0 b0.02 ± 0.02 ab0.03 ± 0.02 ab0.03 ± 0.01 ab0.06 ± 0.04 a0.06 ± 0.05 a0.0475%
VE (δ) (mg/kg)0.22 ± 0.08 a0.21 ± 0.13 a0.16 ± 0.02 a0.16 ± 0.02 a0.26 ± 0.05 a0.17 ± 0.02 a0.18 ± 0.08 a0.1935%
VC (mg/kg)83.57 ± 32.5 a72.9 ± 13.16 a75.83 ± 20.93 a80.6 ± 35.49 a88.80 ± 1.30 a89.73 ± 28.44 a72.83 ± 10.25 a80.6126%
VB1 (mg/kg)0.09 ± 0.02 ab0.13 ± 0.04 a0.07 ± 0.02 bc0.07 ± 0.02 bc0.05 ± 0.01 c0.07 ± 0.02 bc0.07 ± 0.02 bc0.0838%
VB2 (mg/kg)0.05 ± 0.01 a0.05 ± 0.01 a0.04 ± 0.01 a0.04 ± 0.01 a0.04 ± 0.01 a0.05 ± 0.01 a0.05 ± 0.02 a0.0520%
VB3 (mg/kg)0.20 ± 0.05 b0.49 ± 0.17 a0.33 ± 0.09 ab0.44 ± 0.17 a0.14 ± 0.04 b0.17 ± 0.04 b0.18 ± 0.03 b0.2857%
Table 3. Different quality attributes identified in ‘Cuiguan’ pear obtained from 14 planting sites under two different cultivation modes in 2024. Data are expressed as means ± standard error of three replications. Different letters indicate significant differences among groups according to Tukey’s HSD test (p < 0.05).
LocationLabWeight
(g)
Tare/WeightLD
(cm)
TD
(cm)
LD/TDCore Size
(cm)
Core Size/TDTSS (%)TA (mol/L)TSS/TAHardness (kg/cm2)Stone Cell (g/200 g)
Mode-1Gaoan59.00 ± 1.17 bc13.03 ± 1.10 a39.85 ± 0.63 a266.44 ± 41.86 cb0.11 ± 1.48 a77.35 ± 5.45 a78.83 ± 2.78 c0.98 ± 0.04 a28.95 ± 1.33 bc0.37 ± 0.03 c10.73 ± 0.15 c18.93 ± 0.40 cd0.57 ± 0.02 de4.08 ± 0.33 c1.03 ± 0.03 c
Xiajiang61.29 ± 0.79 bc12.15 ± 1.20 a41.65 ± 0.90 a307.53 ± 15.29 b0.11 ± 0.21 a75.96 ± 5.82 abc84.28 ± 4.48 ab0.9 ± 0.09 a31.63 ± 0.84 ab0.38 ± 0.03 abc12.23 ± 0.85 ab17.73 ± 0.70 de0.69 ± 0.04 bc4.99 ± 0.57 b1.06 ± 0.16 c
Yongxin62.28 ± 0.83 abc11.78 ± 0.84 a39.20 ± 0.14 a270.56 ± 7.50 bc0.09 ± 0.78 b76.06 ± 2.92 ab77.61 ± 0.97 c0.98 ± 0.05 a30.7 ± 2.47 ab0.4 ± 0.03 ab11.8 ± 0.00 b16.6 ± 0.30 ef0.71 ± 0.01 b4.34 ± 0.41 bc1.81 ± 0.2 a
Poyang63.52 ± 5.43 ab11.34 ± 0.92 a39.69 ± 0.62 a383.03 ± 29.58 a0.10 ± 0.62 b81.29 ± 2.05 a89.32 ± 3.45 a0.91 ± 0.04 a32.5 ± 3.05 a0.36 ± 0.05 c10.73 ± 0.51 c20.53 ± 0.30 bc0.52 ± 0.04 ef4.94 ± 0.05 b0.98 ± 0.02 c
Guangxin66.68 ± 2.83 a8.20 ± 2.54 b41.40 ± 1.6 a172.06 ± 22.58 d0.12 ± 0.29 a60.93 ± 4.44 e69.14 ± 1.74 d0.88 ± 0.08 a27.03 ± 0.82 c0.39 ± 0.01 abc12.17 ± 0.15 ab15.73 ± 0.13 f0.78 ± 0.01 a4.36 ± 0.42 bc1.79 ± 0.01 a
Shangli62.71 ± 3.09 ab11.76 ± 1.98 a39.15 ± 2.44 a243.96 ± 22.65 c0.10 ± 0.48 b68.49 ± 2.93 cd75.65 ± 0.70 c0.91 ± 0.05 a31.79 ± 1.57 ab0.42 ± 0.02 a10.73 ± 0.67 c22.73 ± 2.00 a0.47 ± 0.03 f4.67 ± 0.75 bc1.3 ± 0.15 b
D an57.06 ± 3.11 c12.18 ± 1.57 a36.25 ± 1.78 b164.35 ± 22.24 d0.12 ± 0 a65.39 ± 2.25 de68.97 ± 5.45 d0.96 ± 0.07 a23.80 ± 1.74 d0.34 ± 0.02 c10.2 ± 0.26 c15.93 ± 0.40 ef0.64 ± 0.01 c4.19 ± 0.26 c1.14 ± 0.04 bc
Jinxi60.62 ± 3.73 bc9.96 ± 2.53 b41.34 ± 2.03 a230.58 ± 7.01 c0.1 ± 0.36 b68.6 ± 1.55 cd74.41 ± 0.18 cd0.92 ± 0.03 a29.67 ± 1.13 abc0.40 ± 0.02 ab12.73 ± 0.15 a21.98 ± 1.63 ab0.58 ± 0.04 d5.77 ± 0.40 a0.59 ± 0.11 d
Mean61.6511.339.82254.810.1171.7677.280.9329.510.3811.4218.770.624.671.21
CV6.10%18.05%5.25%27.75%11.38%10.21%9.25%6.45%10.68%7.84%8.41%14.56%16.28%13.88%33.57%
Mode-2Ruichang59.24 ± 2.52 a−11.99 ± 1.03 d43.61 ± 2.57 a135.04 ± 3.85 d0.13 ± 0.74 a58.14 ± 1.69 d61.39 ± 1.89 d0.95 ± 0.05 ab29.65 ± 1.00 ab0.48 ± 0.03 a12.23 ± 0.06 a16.93 ± 0.5 d0.72 ± 0.02 a4.07 ± 0.12 b0.83 ± 0.05 e
Anyi51.46 ± 4.02 bc−2.74 ± 2.80 c37.37 ± 2.16 bc374.37 ± 7.86 a0.09 ± 0.30 e80.5 ± 4.45 a90.52 ± 2.13 a0.89 ± 0.06 b30.25 ± 0.93 ab0.33 ± 0.01 e12.37 ± 0.12 a24.73 ± 1 b0.5 ± 0.02 b3.8 ± 0.35 b1.23 ± 0.03 cd
Hukou55.00 ± 0.56 b−9.12 ± 2.09 d39.55 ± 1.30 b207.58 ± 28.07 b0.12 ± 0.81 ab68.98 ± 3.88 b73.51 ± 3.17 b0.94 ± 0.04 ab24.65 ± 0.16 c0.34 ± 0.02 de11.67 ± 1.12 a17.00 ± 0.3 d0.69 ± 0.07 a4.5 ± 0.65 b1.94 ± 0.24 b
Guixi52.46 ± 1.28 bc−2.23 ± 2.88 bc37.57 ± 2.09 bc170.45 ± 5.44 c0.10 ± 0.65 cd60.98 ± 2.42 cd68.21 ± 1.06 c0.89 ± 0.05 b27.99 ± 1.89 b0.41 ± 0.02 bc12.60 ± 0.72 a17.62 ± 0.57 cd0.72 ± 0.06 a4.56 ± 0.15 b1.07 ± 0.05 de
Fengcheng51.29 ± 1.45 bc1.27 ± 1.00 ab35.55 ± 1.43 c220.04 ± 15.57 b0.10 ± 0 d67.93 ± 2.40 bc73.93 ± 1.31 b0.92 ± 0.03 ab27.83 ± 1.47 b0.38 ± 0.03 cd12.20 ± 0.26 a18.65 ± 0.57 c0.66 ± 0.02 a4.83 ± 1.18 b1.46 ± 0.03 c
Yudu49.99 ± 1.07 c4.00 ± 0.12 a33.92 ± 0.99 c212.31 ± 23.27 b0.11 ± 0.33 bc71.77 ± 5.08 b73.02 ± 0.88 b0.98 ± 0.06 a31.36 ± 2.11 a0.43 ± 0.03 b12.57 ± 0.4 a29.60 ± 1.04 a0.43 ± 0.01 b6.2 ± 0.60 a2.6 ± 0.3 a
Mean53.24−3.4737.93219.960.1168.0573.430.9328.620.3912.2720.760.624.661.52
CV6.87%171.30%9.31%35.64%12.51%11.84%12.53%5.76%8.81%14.51%4.76%23.86%19.70%20.32%41.09%
Disclaimer/Publisher’s Note: The statements, opinions and data contained in all publications are solely those of the individual author(s) and contributor(s) and not of MDPI and/or the editor(s). MDPI and/or the editor(s) disclaim responsibility for any injury to people or property resulting from any ideas, methods, instructions or products referred to in the content.

