Article

Comparative Analysis of Rhizosphere Microbiomes in Different Blueberry Cultivars

1
Provincial Famous Teacher Yang Qin Studio, Key Laboratory of Molecular Breeding and Variety Creation of Horticultural Plants for Mountain Features in Guizhou Province, School of Life and Health Science, Kaili University, Kaili 556011, China
2
Key Laboratory of Oasis Agricultural Pest Management and Plant Protection Resources Utilization, Shihezi University, Shihezi 832003, China
*
Authors to whom correspondence should be addressed.
Horticulturae 2025, 11(6), 696; https://doi.org/10.3390/horticulturae11060696
Submission received: 22 April 2025 / Revised: 30 May 2025 / Accepted: 13 June 2025 / Published: 17 June 2025
(This article belongs to the Section Fruit Production Systems)

Abstract

:
Blueberry growth is closely tied to its rhizosphere’s microbial communities. Recent advancements in high-throughput sequencing and multi-omics technologies have enhanced the investigation of variations in rhizosphere microbial communities and their functional roles across different plant cultivars. In this study, high-throughput sequencing was utilized to assess the rhizosphere microbial diversity in highbush and rabbiteye blueberry groups, encompassing a total of eight cultivars. Notable variations were observed in both bacterial and fungal community diversity. Ten bacterial phyla, each with a relative abundance greater than 1%, constituted 92.32–97.08% of the total abundance across the eight cultivars, with Acidobacteriota, Actinobacteriota, and Pseudomonadota being predominant. Similarly, five major fungal phyla, each exceeding 1% in relative abundance, accounted for 88.18–97.20% of the total abundance, with Ascomycota and Basidiomycota being the most dominant. The results showed that the rhizospheres of blueberries host a variety of plant growth-promoting rhizobacteria (PGPR), including genera such as Burkholderia, Enterobacter, Streptomyces, Arthrobacter, and Pseudomonas. Rabbiteye blueberry cultivars exhibit a greater propensity for accumulating beneficial symbiotic microorganisms compared to highbush cultivars. Notably, the relative abundance of ericoid mycorrhizal fungi, specifically Oidiodendron, is significantly elevated in the cultivars Emerald, Premier, O’Neal, and Brightwell, with the most pronounced increase observed in Emerald. Furthermore, rabbiteye blueberries support a more diverse and abundant array of cultivar-specific fungal communities than their highbush counterparts. Understanding the interaction networks between blueberries and their associated microbes can provide a theoretical foundation for the targeted regulation of rhizosphere microbiomes and offer valuable insights for the management of rhizospheres in other acidophilic crops.

1. Introduction

The blueberry (Vaccinium spp.), a perennial shrub belonging to the Ericaceae family, yields fruits that are abundant in anthocyanins, polyphenols, and various other bioactive compounds. Acknowledged by the United Nations Food and Agriculture Organization as one of the “five healthiest foods,” it is often referred to as the “king of berries” [1]. Cultivated blueberries are categorized into four principal groups: lowbush (Vaccinium angustifolium), half-high (V. corymbosum × V. angustifolium), highbush (V. corymbosum) (encompassing both southern and northern highbush), and rabbiteye (V. virgatum) [2]. The roots of the blueberry plant are characteristically shallow and underdeveloped, which restricts their access to deep soil water and heightens their vulnerability to environmental stress, thereby impeding growth.
The rhizosphere microbiota are integral to enhancing crop yield, bolstering disease resistance, and addressing challenges associated with replanting [3,4]. Often referred to as the plant’s “second genome” [5], the rhizosphere microbiome significantly influences nutrient uptake, stress adaptation, and disease resistance, with its structure emerging from intricate plant–microbe–soil interactions [6,7]. Plants allocate up to 20% of their photosynthetic products to the roots, facilitating complex chemical exchanges with microbial communities [8]. Key microbial functions include nutrient acquisition, where phosphate-solubilizing bacteria secrete acid phosphatases to convert organic phosphorus into plant-available forms, thereby enhancing phosphorus uptake by 20–30%. Nitrogen-fixing bacteria reduce dependence on nitrogen fertilizers. In terms of disease suppression, antagonistic bacteria inhibit pathogens through the production of antibiotics, competition for niches, or the induction of systemic resistance, while fungi such as Trichoderma spp. parasitize pathogenic hyphae [9,10]. For stress tolerance, halotolerant microbes synthesize compatible solutes to alleviate salinity stress, and drought-resistant Streptomyces species enhance soil water retention via exopolysaccharides [5,8,11].
The rhizosphere microbiome serves as a crucial intermediary between plants and soil, playing a vital role in overcoming agricultural challenges [12]. There are notable differences in rhizosphere microbial communities among various plant cultivars, which are likely influenced by genetic traits, the composition of root exudates, and strategies for environmental adaptation. Research suggests that fruit tree cultivars possess distinct rhizosphere microbial communities in terms of both structure and function, which significantly affect plant growth, health, disease resistance, and environmental resilience. For instance, a study examining eight common deciduous fruit trees in northern China identified significant variations in rhizosphere microbial diversity and enzyme activity among species [13]. Furthermore, the rhizosphere microbial communities in fruit trees are influenced by preceding crops, which modify soil nutrient profiles and microbial richness and diversity [14]. The selection of cultivars is crucial in influencing plant-associated microbial communities. Research on willow genotypes has identified distinct beneficial microbes in the rhizospheres of various genotypes, which are associated with the uptake and accumulation of heavy metals [15]. Similarly, studies on tea plant cultivars have demonstrated significant structural and functional variations in rhizosphere microbiota, which may be linked to enhanced disease resistance [16]. Therefore, optimizing rhizosphere microbial communities through the strategic selection of preceding crops and cultivars can improve the yield and quality of fruit trees [13,16]. Extensive investigations into the rhizosphere microbiome reveal that, despite the dynamic nature of microbial community structures, the core microbiome consistently maintains a relatively high abundance throughout plant growth and development. This core microbiome typically exhibits strong root colonization, stress tolerance, and beneficial effects on the host plant [17,18,19,20].
The composition of rhizosphere microbial communities is shaped by several factors, including host genotype, plant growth stage, climate, the pool of microbial species, soil type, and agricultural management practices [21,22]. In natural ecosystems, where roots and rhizosphere microbiota have coevolved over extended periods, the host genotype plays a pivotal role in determining the structure of microbial communities [14]. Differences in rhizosphere communities among cultivars are associated with genetic traits, root exudates, and environmental adaptation. For example, northern highbush blueberries are characterized by a higher abundance of Pseudomonadota, whereas rabbiteye blueberries are enriched with Actinobacteria [23], a phenomenon potentially attributable to variations in the composition of root exudates, such as the citrate-to-malate ratios.
Nonetheless, the rhizosphere microbiome associated with commercial blueberry plants has been investigated in only a limited number of studies and remains poorly understood. The distribution patterns of taxonomic, functional, and phenotypic compositions of the rhizosphere microbiome exhibit variation across different blueberry varieties [17,23]. The microbial communities within the blueberry rhizosphere demonstrate temporal variation with respect to planting year during extended cultivation periods, with community structure composition differing according to plant age and influencing factors [24]. Current research on blueberry rhizosphere microbiomes is still in its early stages, with limited understanding of the functional differences across various cultivars. Elucidating these differences has the potential to enhance our knowledge of plant–microbe interaction mechanisms and inform microbiome-driven cultivation strategies for precision agriculture.
This study employed 16S rRNA and ITS high-throughput sequencing to analyze the rhizosphere microbiota of two groups of blueberry cultivars, encompassing eight cultivars in total. The objectives were to (i) characterize the composition, diversity, and functional correlations of bacterial and fungal communities, and (ii) identify cultivar-specific core microbiomes and differential microbial taxa. The findings provide insights into how cultivar type influences rhizosphere microbial structure and diversity, highlighting cultivar-specific functional microbes that could guide the future development of plant growth-promoting and soil-modulating inoculants.

2. Materials and Methods

2.1. Experimental Design and Sample Preparation

The study utilized two distinct Vaccinium species, namely V. virgatum (VV) (2n = 6 = 72) and V. corymbosum (VC) (2n = 4 = 48) (refer to Table 1). The V. virgatum species included the breeding selections ‘Premier’ (Pr), ‘Baldwin’ (Ba), ‘Climax’ (Cl), and ‘Brightwell’ (Br), while V. corymbosum comprised ‘Legacy’ (Le), ‘Liberty’ (Li), ‘Emerald’ (Em), and ‘O’Neal’ (O’N). All genotypes were cultivated in a substrate composed of pine bark mulch and matrix at the planting base of the Key Laboratory of Molecular Breeding and Variety Creation of Mountain Specialty Horticultural Crops, affiliated with the Guizhou Provincial Department of Education, since their introduction. The plants were 5 years old, and uniform fertilizer and water management practices had been implemented.
In September 2024, healthy plants representing all genotypes were selected for study, and rhizosphere soil samples were collected. Initially, the topsoil was gently removed, and fine roots (located 5–20 cm below the surface) were excised using pruning shears. The collected root samples were placed into sterile sampling bags and immediately stored in a cryogenic biological sample box. Subsequently, soil clumps were carefully shaken off the roots within a laminar flow cabinet, leaving only the rhizosphere soil adhering to the roots (approximately 1–2 mm). The root samples were then transferred to 50 mL sterile centrifuge tubes containing 20 mL of sterile phosphate-buffered saline (PBS) at a concentration of 10 mM. These tubes were placed on a constant temperature shaker operating at 120 rpm for 20 min at room temperature. The roots were then removed from the centrifuge tubes using sterile forceps, and the remaining suspension was centrifuged at 6000× g and 4 °C for 20 min to collect the rhizosphere soil. The rhizosphere soil samples (n = 3 per Vaccinium genotype) were rapidly frozen in liquid nitrogen and stored at −80 °C.

2.2. Extraction of Rhizosphere Soil DNA and Sequencing of 16S rRNA, ITS

The genomic DNA from 24 rhizosphere soil samples was extracted using the DNeasy PowerSoil Kit (QIAGEN, Hilden, Germany), following the protocol provided by the manufacturer. The V3-V4 region of the 16S rRNA gene for bacteria and the internal transcribed spacer (ITS) 1 region for fungi were amplified through polymerase chain reaction (PCR). This was accomplished using the bacteria-specific primer pair 338F (5′-ACTCCTACGGGAGGCAGCA-3′)/806R (5′-GGACTACHVGGGTWTCTAAT-3′) as described by Zhang et al. [25], and the fungi-specific primer pair F (5′-CTTGGTCATTTAGAGGAAGTAA-3′)/R (5′-GCTGCGTTCTTCATCGATGC-3′) as outlined by Orgiazzi et al. [26]. Subsequently, the full-length sequences of the 16S rRNA gene and ITS regions of the microbial community were obtained using the Miseq platform at Biomarker Technologies, Inc. (Beijing, China).

2.3. Bioinformatics Analyses

The raw sequencing reads underwent quality filtering using Trimmomatic v0.33. Primer sequences were identified and excised with Cutadapt 1.9.1 to produce clean reads. The Dada2 plugin within the Quantitative Insights Into Microbial Ecology 2 (QIIME2 2020.6) software [27,28] was utilized for sequence denoising, merging of paired-end sequences, and removal of chimeric sequences, thereby generating high-quality, non-chimeric reads. These reads were then clustered into amplicon sequence variants (ASVs) as described by Callahan et al. [29]. Subsequently, the reads were mapped back to operational taxonomic units (OTUs) to ascertain the OTU abundance for each sample, and variations in community composition and structure across samples were analyzed.
The samples were subjected to statistical evaluation across multiple taxonomic levels and visualized through community structure maps, species clustering heat maps, phylogenetic trees, and taxonomic trees at the phylum, class, order, family, genus, and species levels, based on feature (OTUs/ASVs) analysis. Alpha diversity metrics, including Ace, Chao1, Shannon, and Simpson indices, were calculated [28]. Beta diversity was evaluated using distance matrices, with clustering heat maps, principal coordinate analysis (PCoA) maps, and boxplots generated from various distance measures for diversity analysis. For two-group comparison analyses, a two-sided analysis of variance with a t-test was conducted using STAMP (v.2.0.0). Co-occurrence network analyses and the identification of differentially enriched microbial taxa were performed at the genus level using the LEfSe method, based on Spearman correlation with a threshold of |r| > 0.6 (p < 0.05). Significant differences in the relative abundance of taxa and diversity indices between groups were assessed using one-way ANOVA, with significance determined at p < 0.05.

3. Results

3.1. Diversity and Structure of the Rhizosphere Microbiome in Different Blueberry

The rhizosphere communities were characterized via high throughput sequencing of 16S and ITS1 amplicons generated using DNA extracted from the rhizosphere of two genotypes each of V. virgatum (VV) and V. corymbosum (VC) species of blueberry (Table 1). A total of 1,136,697 high-quality bacterial 16S rRNA reads and 1,470,712 fungal ITS reads were obtained from 24 samples via the PacBio Sequel platform. These reads were clustered into 35,197 bacterial OTUs and 6680 fungal ITS OTUs (Supplementary Table S1).
Venn diagrams illustrating the unique and shared ASVs among the different samples are presented in Figure 1. A total of 31,646 bacterial ASVs (89.91.2% of the total ASV) and 5919 fungal ASVs (88.61% of the total ASV) were used to calculate the distribution of soil bacterial and fungal ASVs in the cropping. The rhizospheres of eight genotypes shared 23 ASVs (0.8%) and 10 ASVs (4.9%) of the bacterial and fungal ASVs, respectively. The bacterial and fungal ASVs in the rhizosphere soil of ‘Emerald’, ‘Brightwell’, and ‘Legacy’ were higher than those of other genotypes [bacterial: Em (5021), Br (4902), Le (4753); fungal: Em (1045), Br (1090), Le (715) (Figure 1A,B)]. A total of 2709 bacterial ASVs and 531 fungal ASVs were common to both VV and VC (Figure 1C,D). The numbers of unique bacterial (Figure 1C) and fungal (Figure 1D) ASVs of the rhizosphere of highbush blueberry are similar to those of the rabbiteye blueberry.

3.2. Bacterial and Fungal Community Diversity in Rhizosphere Soil of Different Blueberry Varieties

Significant variations in alpha diversity were identified in the rhizospheres of different blueberry varieties, encompassing both bacterial and fungal community richness (as measured by ACE and Chao1 indices) and community diversity (as assessed by Shannon and Simpson indices) (Figure 2). Specifically, the rhizosphere microbiome of the O’Neal variety demonstrated the lowest bacterial community richness, while the Baldwin variety exhibited the lowest bacterial community diversity. In contrast, the Brightwell variety’s rhizosphere microbiome displayed the highest fungal community richness, whereas the Legacy variety showed the lowest fungal community diversity. Notably, no significant differences in bacterial and fungal richness and diversity were observed between samples of V. virgatum (VV) and V. corymbosum (VC) (Supplementary Figure S1).
Principal coordinate analysis (PCoA) utilizing Bray–Curtis dissimilarity was performed to assess the variations in bacterial and fungal communities across the groups. As illustrated in Figure 3, both bacterial (Figure 3A) and fungal (Figure 3B) communities demonstrated significant differences among the various rhizospheres, which revealed that the cultivar was the principal factor in shaping the composition of the microbial communities. Notably, the communities in V. virgatum samples (VV group) were more closely clustered, indicating greater similarity to each other compared to those in V. corymbosum samples (VC group) (Figure 3C,D). It is important to note that fungal communities did not exhibit significant differences between the Premier and Liberty rhizospheres. Furthermore, the results from the unweighted pair-group analysis, as presented in Supplementary Figure S2, corroborated the findings obtained from the PCoA.

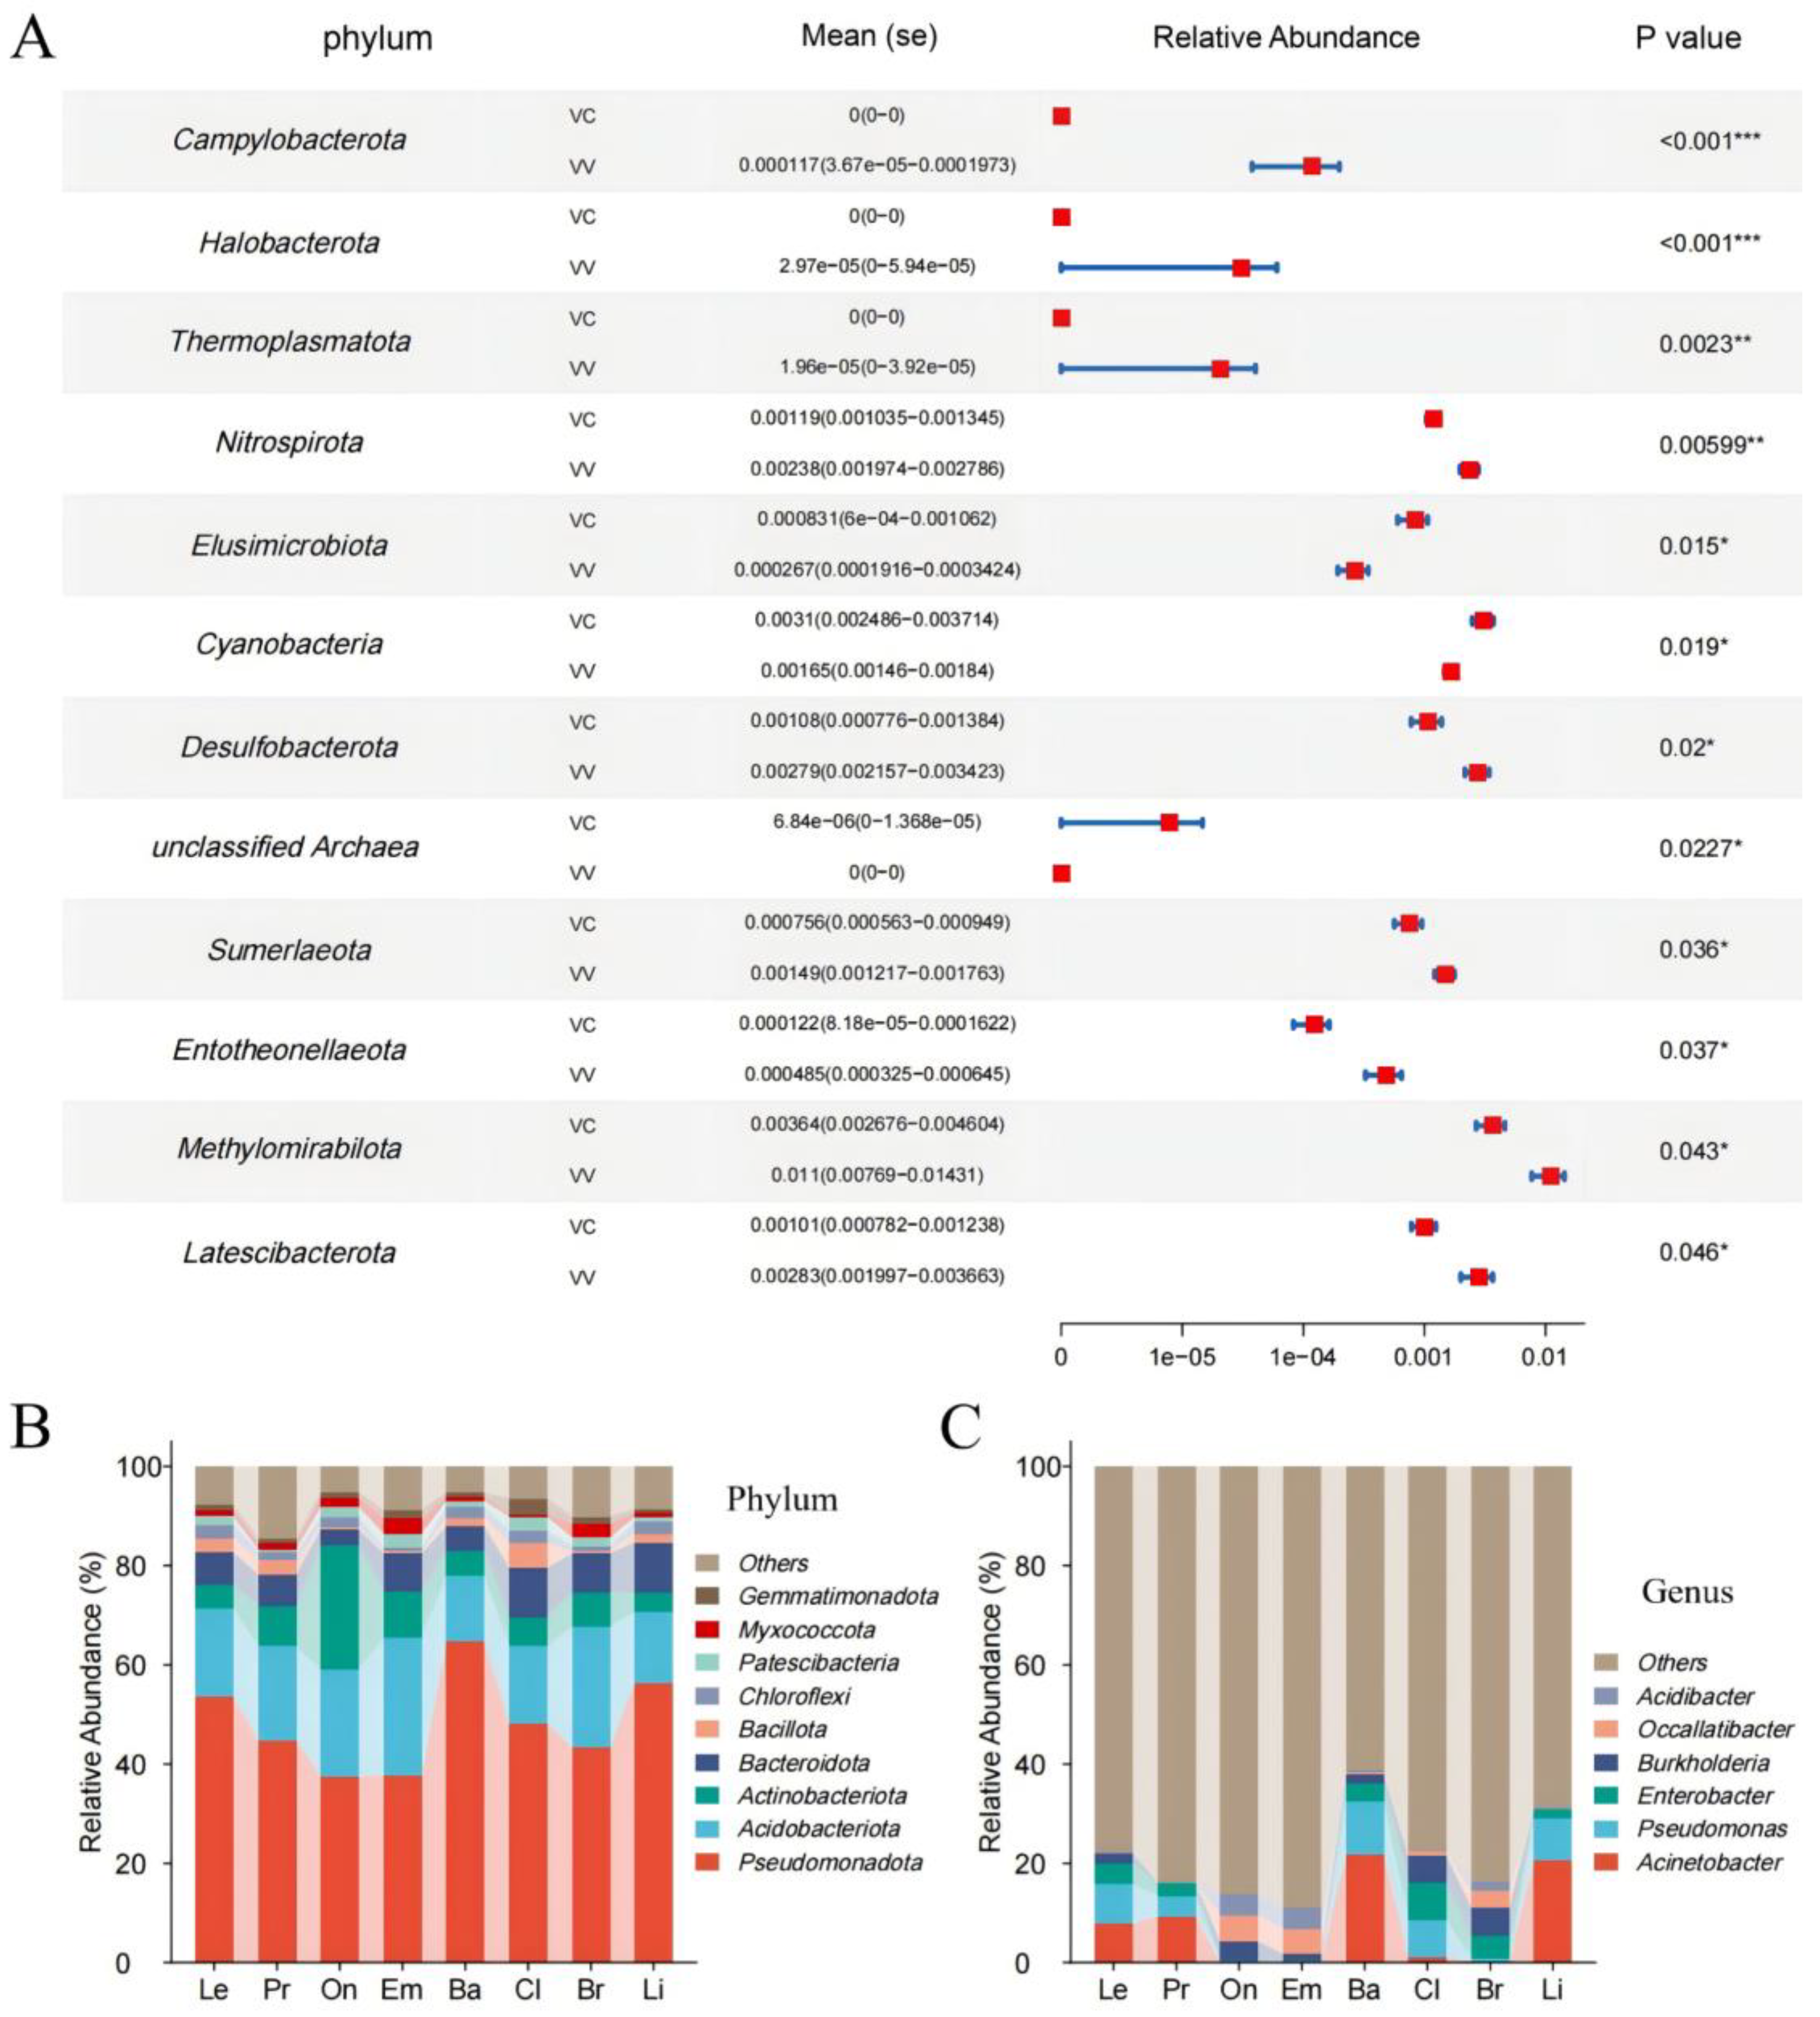
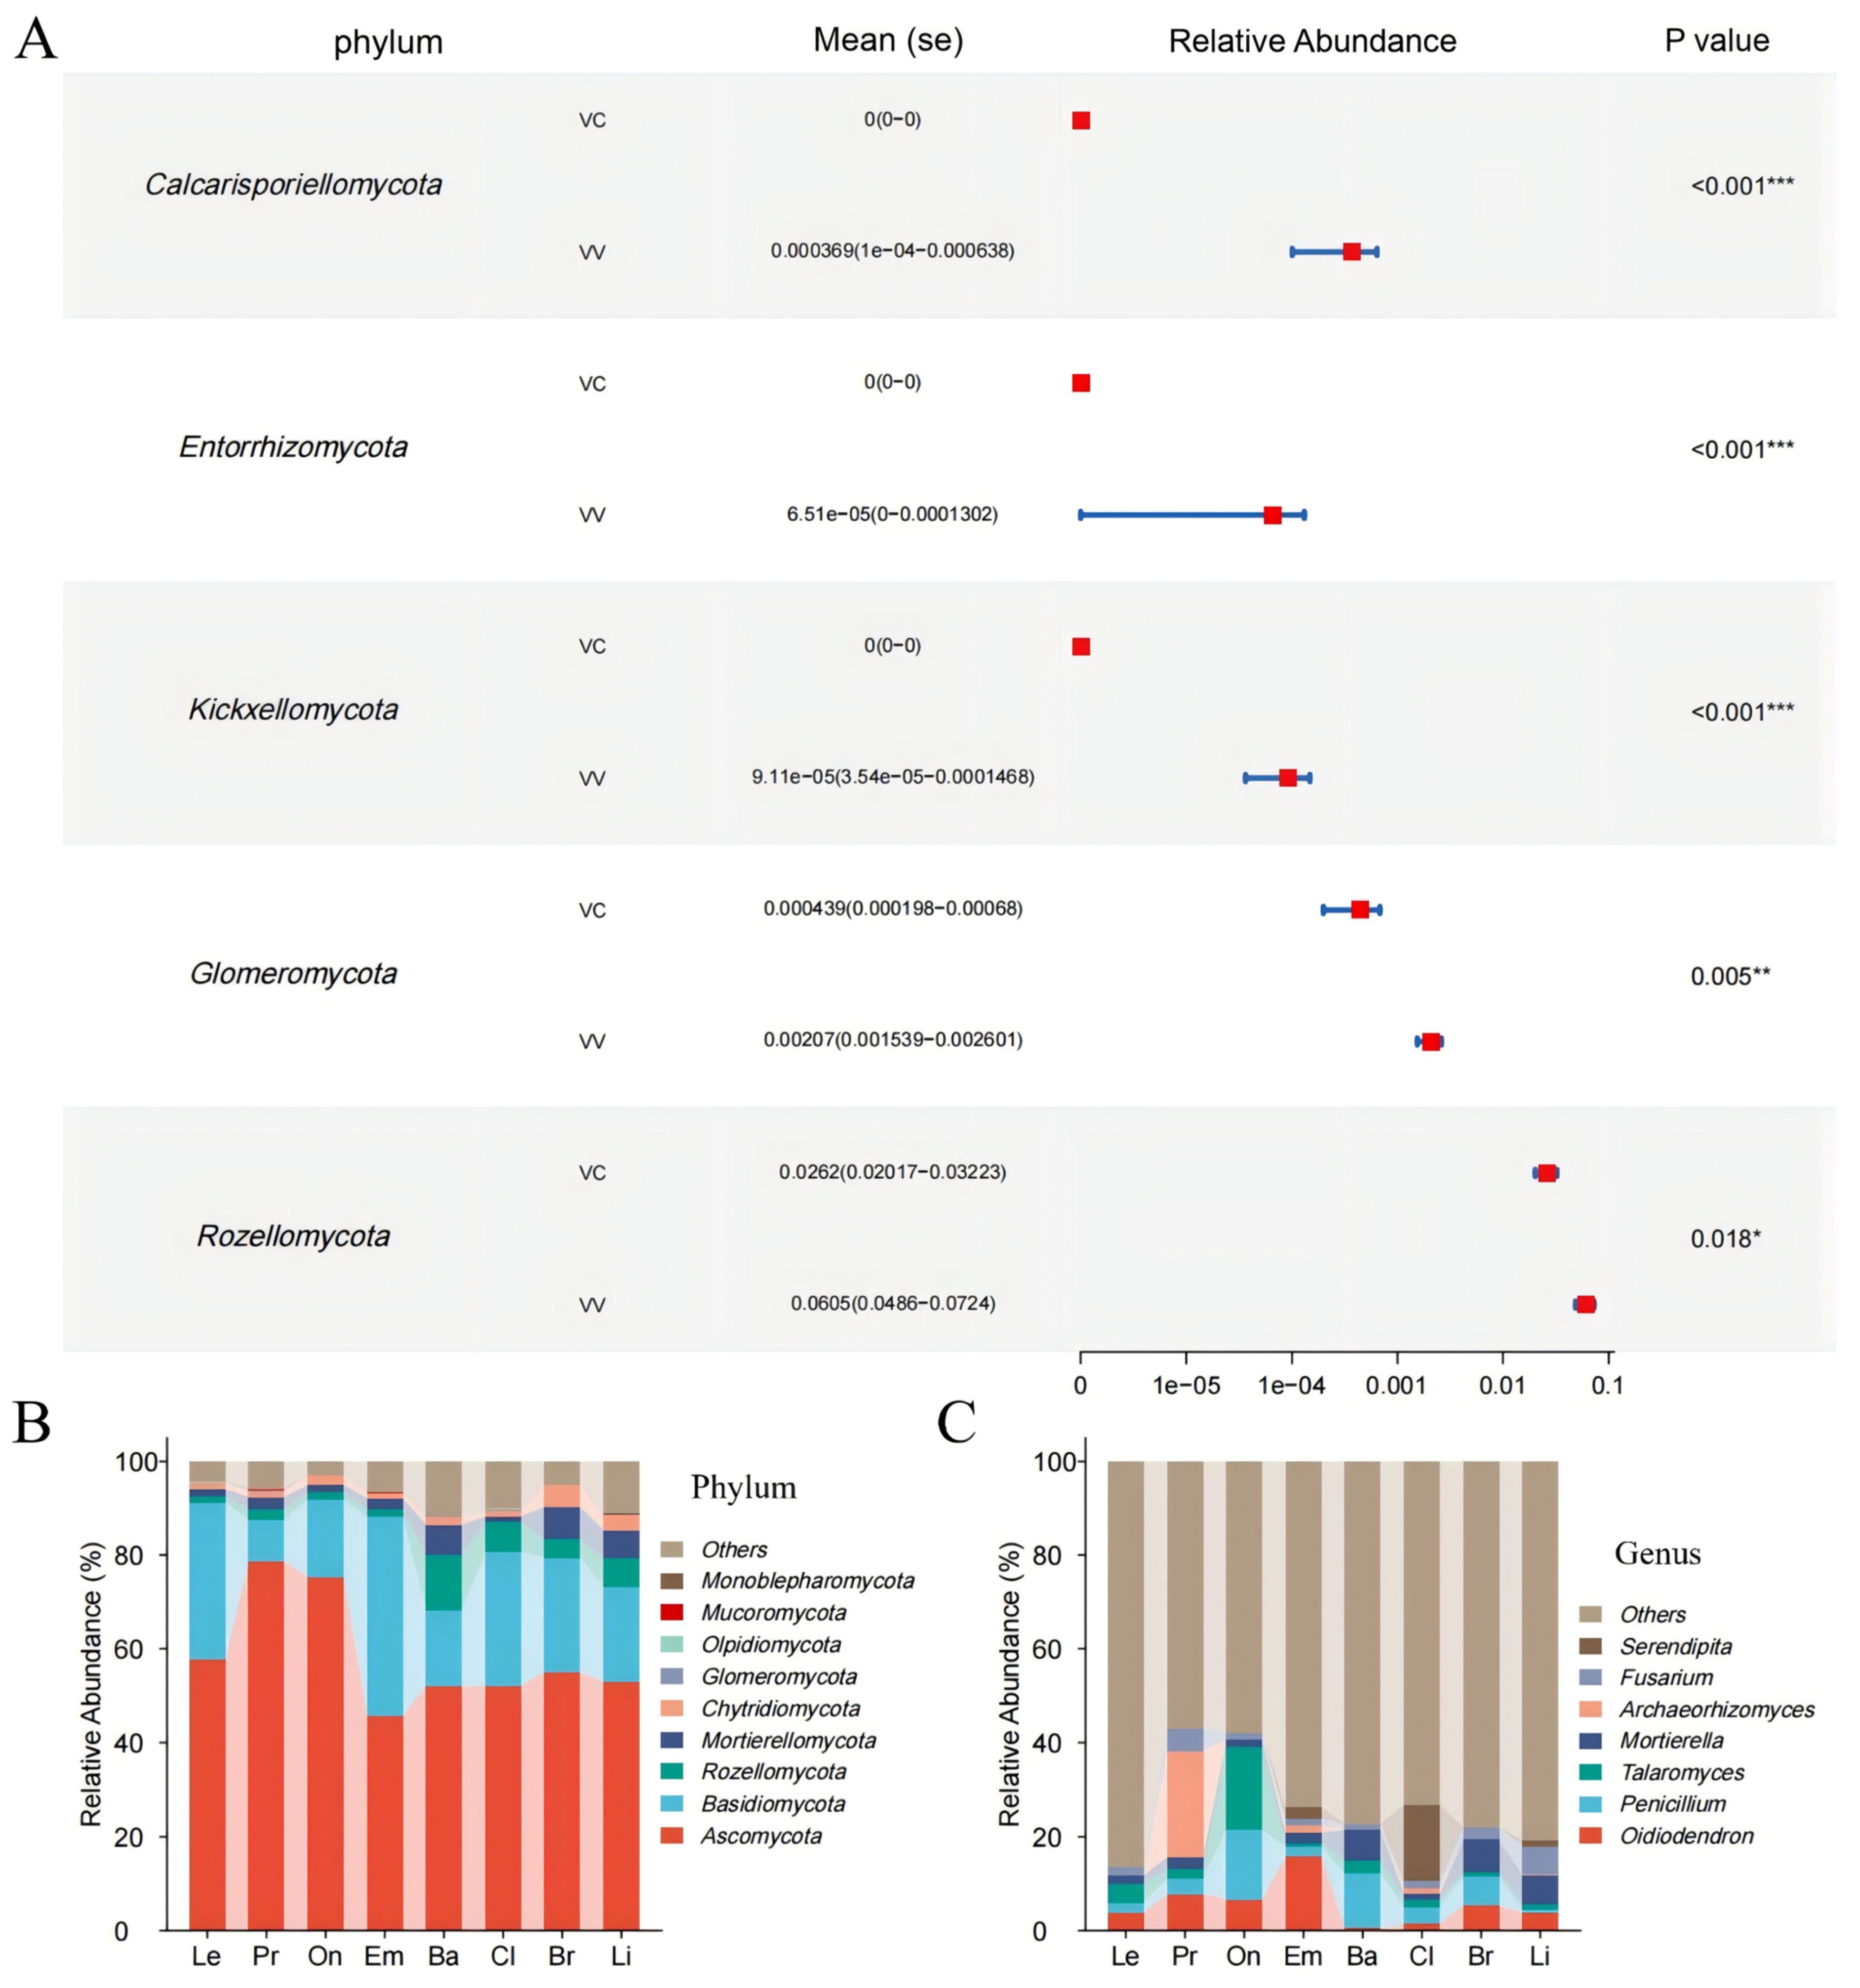
3.3. Bacterial and Fungal Composition Diversity in Different Blueberry Rhizospheres

A total of 40 phyla, 108 classes, 312 orders, 671 families, and 1413 genera were identified within the bacterial communities (Supplementary Table S1). We identified the changes between V. virgatum (VV) and V. corymbosum (VC) samples in the taxonomic composition of the rhizosphere microbiomes. Specifically, the relative abundance of more than 10 bacterial phyla differed significantly between VV and VC (Figure 4A). The relative abundances of Campylobacterota, Halobacterota, and Thermoplasmatota significantly increased in VV, while the relative abundance of unclassified Archaea was significantly reduced.
The predominant bacterial phyla included Pseudomonadota, Acidobacteriota, Actinobacteriota, Bacteroidota, and unclassified bacteria, with a collective relative abundance ≥ 80% in each group (Figure 4B). At the genus level, the bacterial ASVs in the blueberry rhizospheres were primarily classified into Acinetobacter, Pseudomonas, Enterobacter, Burkholderia, Caballeronia, Paraburkholderia, Occallatibacter and Acidibacter (Figure 4B).
A total of 16 phyla, 52 classes, 128 orders, 283 families, and 582 genera were identified in the fungal community (Supplementary Table S1). The relative abundance of five fungal phyla differed significantly between VV and VC rhizospheres (Figure 5A). The relative abundance of Calcarisporiellomycota, Entorrhizomycota, and Kickxellomycota were significantly increased in VV.
The dominant fungal phyla were Ascomycota and Basidiomycota, with a collective relative abundance ≥ 79% in each group (Figure 5B). At the genus level, most of the fungal ASVs were assigned to Oidiodendron, Penicillium, Talaromyces, Mortierella, Archaeorhizomyces, Fusarium, and Serendipita (Figure 5B). Based on the heatmaps of the genera, the differences among the rhizosphere microbiomes of eight blueberry cultivars were compared (Supplementary Figure S3). According to the relative abundances of these genera, samples were almost clustered together separately in the bacterial community, but not in the fungal community.

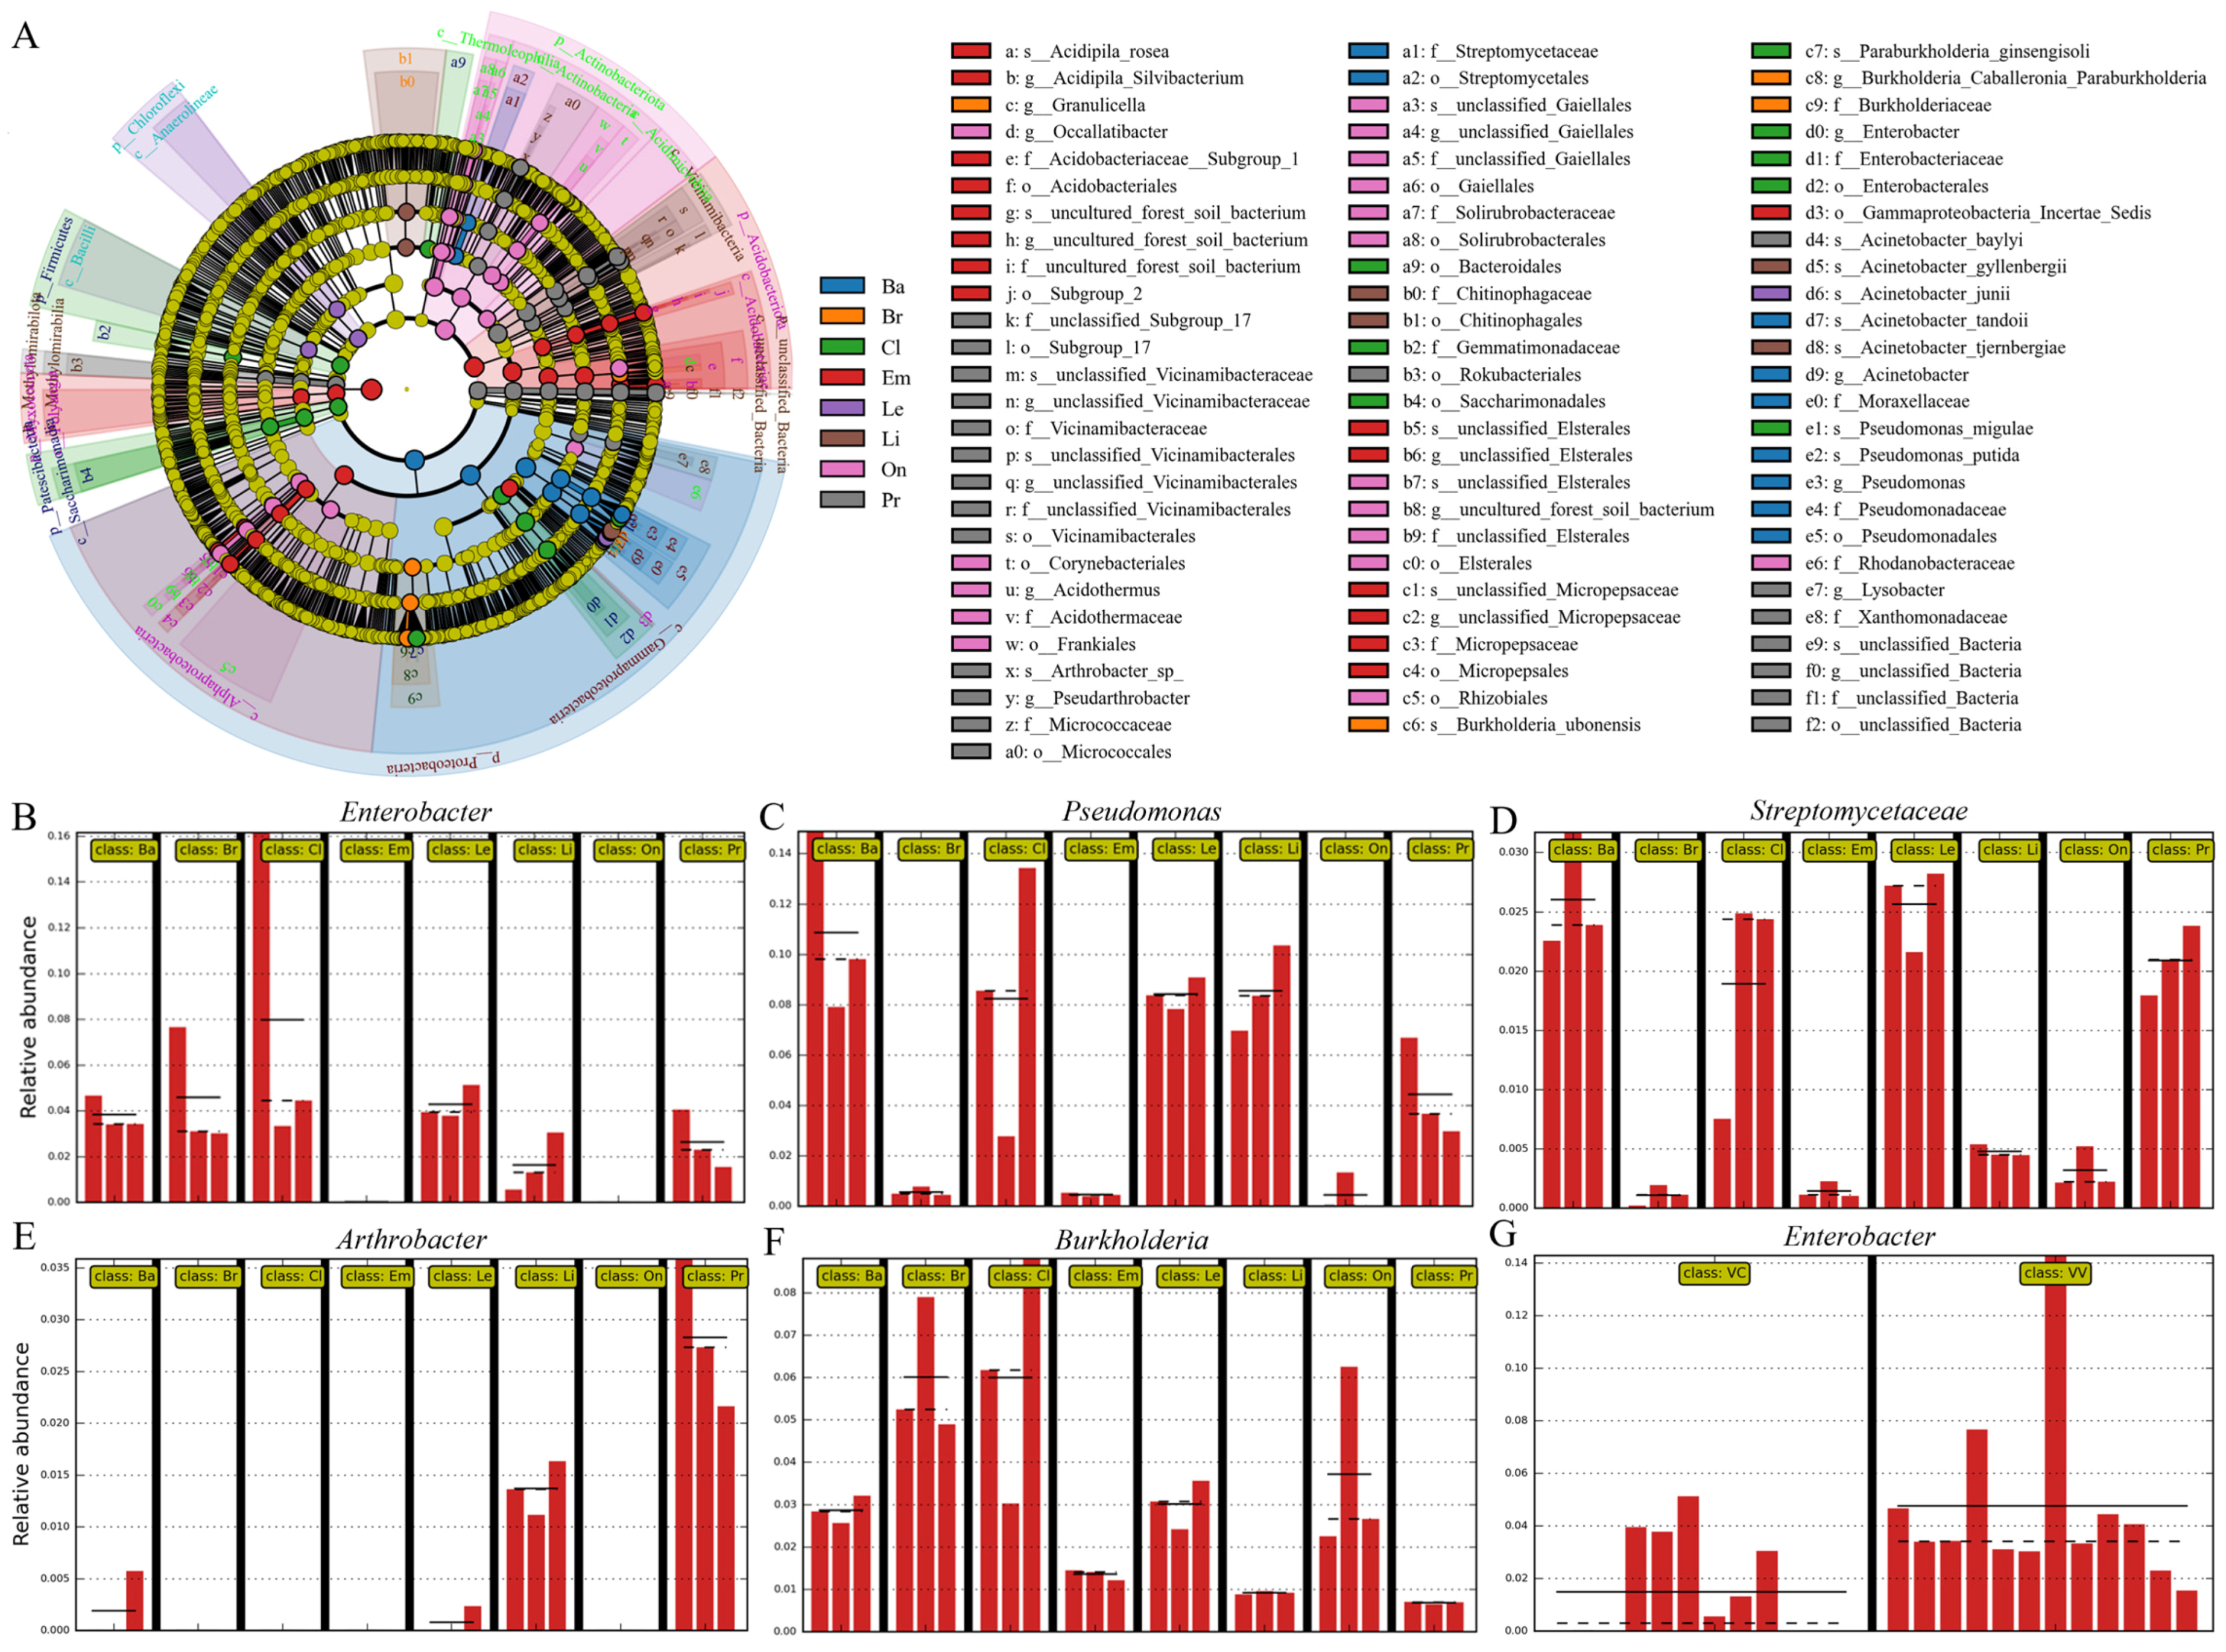
3.4. Differences Between Rhizobiomes of Blueberry Cultivars

We conducted a detailed analysis to compare taxonomic composition differences in rhizosphere microbiomes across blueberry cultivars. The findings revealed significant variations in the relative abundances of bacteria at the genus level. Compared to Pr, Em exhibited significantly higher relative abundances of Acidipila Silvibacterium and Occallatibacter, whereas Pr showed significant increases in unclassified Vicinamibacterales and Lysobacter (Figure 6A). When comparing Em to Le, Acidipila Silvibacterium, Granulicella, and Candidatus Solibacter were significantly more abundant in Em (Figure 6B). In Em vs. On comparisons, Candidatus Solibacter showed a significant increase in Em (Figure 6C). Pseudomonas was significantly enriched in Le relative to On (Figure 6D). For Pr vs. On, unclassified Burkholderiales, unclassified Latescibacteraceae, Pedomicrobium, and Acidovorax exhibited significant increases in Pr (Figure 6E). No significant changes were observed in fungal genera across all comparisons.
LEFSe analysis identified 79 significantly different bacterial OTUs across the eight groups (Figure 7A). Microbial communities with uniquely high relative abundance were significantly more prevalent in Pr, On, and Em. In contrast, such communities were rarely observed in Li, Le, and Br. Figure 7B–F displays the relative abundances of core rhizosphere microbiomes linked to plant growth-promoting rhizobacteria (PGPR), based on putative functional predictions of bacterial communities. The relative abundance of Enterobacter significantly decreased in Em and On. Pseudomonas showed significant decreases in Br, Em, and On. Streptomycetaceae abundance was significantly reduced in Br, Em, On, and Li. Conversely, Arthrobacter abundance increased significantly in Li and Pr, while Burkholderia abundance decreased significantly in the same groups (Li and Pr). Notably, only Enterobacter exhibited a significant increase in VV (Figure 7G).
A total of 70 significantly different fungal OTUs were found between the eight groups by LEFSe analysis (Figure 8A). Notably, unlike bacterial communities, Pr exhibits minimal unique microbial communities with markedly elevated relative abundance. Additionally, the relative abundance of ericoid mycorrhizal fungi (Oidiodendron) increased significantly in Em, Pr, and On (Figure 8B). In the VV group, seven taxa were enriched, including Dothideomycetes, Archaeorhizomycetes, Rozellomycota, Archaeorhizom cetaceae, Archaeorhizomyces, and Pleosporales. Conversely, the VC group exhibited enrichment of three taxa, including Talaromyces calidicanius, Sebacinales, and Serendipitaceae (Figure 8C).

4. Discussion

Soil microbial diversity is indicative of ecosystem stability and functions as a marker of soil health [11,30]. Prolonged cultivation influences the composition of rhizosphere microorganisms, frequently resulting in greater fungal diversity compared to bacterial diversity [31]. Blueberry plants, characterized by their substantial nutrient requirements and shallow root systems, are particularly dependent on rhizosphere microbiota for optimal growth. The research systematically examined the compositional characteristics and cultivar-specific microbial communities.
This study utilized high-throughput sequencing technology to investigate the microbial diversity and functional characteristics within the rhizosphere soil of highbush and rabbiteye blueberry cultivar groups, encompassing a total of eight cultivars. Ten bacterial phyla with a relative abundance exceeding 1% were identified, collectively representing 92.32% to 97.08% of the total microbial abundance across the eight cultivars. The predominant phyla identified were Acidobacteriota, Actinobacteriota, and Pseudomonadota, aligning with findings from previous studies; northern highbush blueberries are characterized by a higher abundance of Pseudomonadota, whereas rabbiteye blueberries are enriched with Actinobacteria [23,32]. Notably, these results exhibited significant divergence from the rhizosphere microbial community structures reported in other cash crops [33,34,35,36], which is likely attributable to the distinct soil environment characteristic of blueberry rhizospheres [37]. Among these phyla, Pseudomonadota demonstrated the highest relative abundance, ranging from 37.53% to 64.86%. Pseudomonadota, a pivotal component of the rhizosphere microenvironment across various plant species, plays a crucial role in shaping microbial community structures. This phylum encompasses numerous Plant Growth-Promoting Rhizobacteria (PGPR), including genera such as Pseudomonas and Burkholderia, which are instrumental in processes like nitrogen fixation, phosphate solubilization, and siderophore production [38]. The Actinobacteriota phylum, particularly represented by antibiotic-producing genera such as Streptomyces, contributes to the suppression of soil-borne pathogens. Meanwhile, Acidobacteriota, which is well-adapted to acidic conditions, is likely involved in the degradation of organic matter and carbon cycling within blueberry soils. In terms of fungal communities, five major phyla, each with a relative abundance exceeding 1%, were identified in the rhizosphere soil of eight blueberry cultivars, with total abundance ranging from 88.18% to 97.20%. Among these, Ascomycota and Basidiomycota were the predominant fungal phyla, with Ascomycota exhibiting the highest relative abundance, ranging from 45.75% to 78.63%.
The analysis of the rhizosphere microbiome across various blueberry cultivars revealed significant differences in the alpha diversity and beta diversity of both bacterial and fungal communities, with bacterial taxa demonstrating greater variability. This finding suggests that blueberry roots may exert weaker supportive or inhibitory effects on fungal communities compared to bacterial ones. The minimal intergroup differences observed in unweighted beta diversity could be attributed to the influence of alpha diversity on beta diversity metrics.
The results indicate that genetic variations among blueberry cultivars drive the differentiation of rhizosphere bacterial and fungal communities. At the genus level, dominant bacterial and fungal taxa varied among the blueberry cultivars. Key bacterial genera identified as PGPR included Burkholderia, Enterobacter (predominantly in rabbiteye cultivars), Streptomyces, Arthrobacter, and Pseudomonas, which are known to enhance plant growth and suppress pathogens [39,40]. The significant presence of Enterobacter in the rhizospheres of rabbiteye blueberries underscores the potential for developing PGPR-based inoculants. There is a strong correlation between the microbial diversity of rhizosphere soils and the growth and physiological performance of blueberries [23]. From an agronomic perspective, rabbiteye blueberries, although possessing inferior fruit quality, exhibit robust root systems, environmental adaptability, and high yield—characteristics that are reflected in the microbial activity of their rhizospheres [41]. The cultivars Premier, Baldwin, Climax, and Brightwell demonstrated a more pronounced modulation of rhizosphere soil microbial environments through root exudates compared to highbush varieties, with rabbiteye cultivars accumulating a greater abundance of beneficial symbiotic bacteria.
Prolonged cultivation of blueberries fosters a distinctive rhizosphere microenvironment. The exudates from blueberry roots selectively promote or suppress specific microbial taxa. The fungal communities sustained by these exudates are essential for promoting blueberry growth [38,42,43]. Notably, the relative abundance of ericoid mycorrhizal (ERM) fungi, particularly Oidiodendron, has shown a significant increase in the cultivars Emerald, Premier, O’Neal, and Brightwell, with the most pronounced effect observed in Emerald, and this is consistent with the findings of previous studies, which revealed that the Vaccinium species exhibit significant variation in the abundance of beneficial rhizobacteria and ericoid mycorrhizal fungi. These microorganisms are crucial for the species’ adaptation to acidic soils and environments characterized by slow organic matter turnover [23]. These symbiotic fungi constitute a critical area for future research. Furthermore, rabbiteye blueberries were found to host more unique and abundant fungal communities compared to highbush cultivars.
Current research on blueberry rhizosphere microbiota is limited; further investigation is required to elucidate the functional mechanisms of the microbiome and cultivar-specific regulatory networks. Future research should integrate multi-omics and synthetic biology approaches to uncover the molecular mechanisms underlying blueberry–microbe interactions, and elucidate microbiome functional mechanisms and cultivar-specific regulatory networks. Such advancements will lay a theoretical foundation for designing microbiome-driven cultivation systems and offer innovative solutions for the sustainable development of the blueberry industry.

5. Conclusions

This study used high-throughput sequencing to examine the rhizosphere microbial diversity in eight blueberry cultivars, revealing significant bacterial and fungal diversity differences. Ten major bacterial phyla, including dominant Acidobacteriota, Actinobacteriota, and Pseudomonadota, made up 92.32–97.08% of bacterial abundance. Five key fungal phyla, led by Ascomycota and Basidiomycota, accounted for 88.18–97.20% of fungal abundance. PGPR genera like Burkholderia and Pseudomonas were identified, with rabbiteye cultivars showing higher symbiotic microbe accumulation. Ericoid mycorrhizal fungi, especially Oidiodendron, were more abundant in Emerald, Premier, O’Neal, and Brightwell cultivars, with Emerald having the highest levels. Rabbiteye cultivars supported more unique and abundant fungal communities. These findings highlight the intricate interplay of genetic factors, root exudates, and environmental conditions in shaping the rhizosphere microbiomes of blueberry plants. Given the current paucity of research on blueberry rhizosphere microbiota, this study provides essential foundational insights.

Supplementary Materials

The following supporting information can be downloaded at: https://www.mdpi.com/article/10.3390/horticulturae11060696/s1, Figure S1: Alpha diversity (ACE, Chao1, Shannon, and Simpson index) of bacterial and fungal in rhizosphere microbiome of V. virgatum (VV) and V. corymbosum (VC); Figure S2: Unweighted pair-group analysis (UPGMA) based on UniFrac distance for bacterial and fungal communities; Figure S3: Heatmap analysis of rhizosphere bacterial and fungal communities at the genus level; Figure S4: The comparison of bacterial compositions between the V. virgatum (VV) and V. corymbosum (VC) rhizosphere microbiomes at the genus level; Table S1: Reads and OTUs for sequencing of the samples, and phyla, classes, orders, families, and genera identified within the communities.

Author Contributions

Conceptualization, L.X. and Q.Z.; methodology, S.Z. and L.X.; software, L.X.; validation, L.C. and J.D.; investigation, T.Z.; data curation, L.X. and S.Z.; writing—original draft preparation, L.X.; writing—review and editing, Q.Y. All authors have read and agreed to the published version of the manuscript.

Funding

This research was funded by the Specialized Fund for the Doctoral of Kaili University (grant No. BS20240216), the provincial famous teacher Yang Qin studio (MSGZS SJ-2024002), the Key Laboratory of the Department of Education of Guizhou Province (No. Qianjiaoji [2022] 053), and the Guizhou Key Laboratory of Molecular Breeding for Characteristic Horticultural Crops [2025] 027.

Data Availability Statement

The data presented in the study are deposited in the NCBI repository under accession number PRJNA1253324.

Conflicts of Interest

The authors declare no conflicts of interest.

Abbreviations

The following abbreviations are used in this manuscript:
PGPRplant growth-promoting rhizobacteria
OTUsoperational taxonomic units
ASVsamplicon sequence variants
ITSinternal transcribed spacer
ERMericoid mycorrhizal

References

  1. Miller, K.; Feucht, W.; Schmid, M. Bioactive Compounds of Strawberry and Blueberry and Their Potential Health Effects Based on Human Intervention Studies: A Brief Overview. Nutrients 2019, 11, 1510. [Google Scholar] [CrossRef] [PubMed]
  2. Conner, C.J.; Bocsanczy, A.M.; Spakes-Richter, B.; Norman, D.J. Bacterial Wilt Resistance in Blueberry Species. Int. J. Fruit Sci. 2022, 22, 852–859. [Google Scholar] [CrossRef]
  3. Singh, U.B.; Malviya, D.; Wasiullah, H.; Singh, S.; Pradhan, J.K.; Singh, B.P.; Roy, M.; Imram, M.; Pathak, N.; Baisyal, B.M.; et al. Bio-protective microbial agents from rhizosphere eco-systems trigger plant defense responses provide protection against sheath blight disease in rice (Oryza sativa L.). Microbiol. Res. 2016, 192, 300–312. [Google Scholar] [CrossRef] [PubMed]
  4. Luo, C.; He, Y.; Chen, Y. Rhizosphere microbiome regulation: Unlocking the potential for plant growth. Curr. Res. Microbiol. Sci. 2025, 8, 100322. [Google Scholar] [CrossRef] [PubMed]
  5. Mendes, R.; Kruijt, M.; Bruijn, I.D.; Dekkers, E.; van der Voort, M.; Schneider, J.H.M.; Piceno, Y.M.; DeSantis, T.Z.; Andersen, G.L.; Bakker, P.A.H.M.; et al. Deciphering the rhizosphere microbiome for disease-suppressive bacteria. Science 2011, 332, 1097–1100. [Google Scholar] [CrossRef]
  6. Petersen, C.; Hamerich, I.K.; Adair, K.L.; Griem-Krey, H.; Oliva, M.T.; Hoeppner, M.P.; Bohannan, B.J.M.; Schulenburg, H. Host and microbiome jointly contribute to environmental adaptation. ISME J. 2023, 17, 1953–1965. [Google Scholar] [CrossRef]
  7. Philippot, L.; Chenu, C.; Kappler, A.; Rillig, M.C.; Fierer, N. The interplay between microbial communities and soil properties. Nat. Rev. Microbiol. 2024, 22, 226–239. [Google Scholar] [CrossRef]
  8. Fan, X.; Ge, A.H.; Qi, S.; Guan, Y.; Wang, R.; Yu, N.; Wang, E. Root exudates and microbial metabolites: Signals and nutrients in plant-microbe interactions. Sci. China Life Sci. 2025. [Google Scholar] [CrossRef]
  9. Thepbandit, W.; Athinuwat, D. Rhizosphere Microorganisms Supply Availability of Soil Nutrients and Induce Plant Defense. Microorganisms 2024, 12, 558. [Google Scholar] [CrossRef]
  10. Al-qaysi, S.A.A.S.; Alwan, A.H. Molecular Identification of Rhizosphere Trichoderma spp. and Their Antagonistic Impact Against Some Plant Pathogenic Fungi. Baghdad Sci. J. 2016, 13, 53–65. [Google Scholar] [CrossRef]
  11. Chepsergon, J.; Moleleki, L.N. Rhizosphere bacterial interactions and impact on plant health. Curr. Opin. Microbiol. 2023, 73, 102297. [Google Scholar] [CrossRef] [PubMed]
  12. Ge, A.H.; Wang, E. Exploring the plant microbiome: A pathway to climate-smart crops. Cell 2025, 188, 1469–1485. [Google Scholar] [CrossRef] [PubMed]
  13. Si, P.; Shao, W.; Yu, H.; Yang, X.; Gao, D.; Qiao, X.; Wang, Z.; Wu, G. Rhizosphere Microenvironments of Eight Common Deciduous Fruit Trees Were Shaped by Microbes in Northern China. Front. Microbiol. 2018, 9, 3147. [Google Scholar] [CrossRef] [PubMed]
  14. Liu, M.; Xue, R.; Wang, D.; Hu, Y.; Gu, K.; Yang, L.; Zhao, J.; Guan, S.; Su, J.; Jiang, Y. Variations in different preceding crops on the soil environment, bacterial community richness and diversity of tobacco-planting soil. Front. Microbiol. 2024, 15, 1389751. [Google Scholar] [CrossRef]
  15. Wang, G.; Zhang, Q.; Du, W.; Ai, F.; Yin, Y.; Ji, R.; Guo, H. Microbial communities in the rhizosphere of different willow genotypes affect phytoremediation potential in Cd contaminated soil. Sci. Total Environ. 2021, 769, 145224. [Google Scholar] [CrossRef]
  16. Zhang, Z.; Ge, S.; Fan, L.C.; Guo, S.; Hu, Q.; Ahammed, G.J.; Yan, P.; Zhang, L.P.; Li, Z.Z.; Zhang, J.Y.; et al. Diversity in rhizospheric microbial communities in tea varieties at different locations and tapping potential beneficial microorganisms. Front. Microbiol. 2022, 13, 1027444. [Google Scholar] [CrossRef]
  17. Zhang, Y.; Wang, W.; Shen, Z.; Wang, J.; Chen, Y.; Wang, D.; Liu, G.; Han, M. Comparison and interpretation of characteristics of Rhizosphere microbiomes of three blueberry varieties. BMC Microbiol. 2021, 21, 30. [Google Scholar] [CrossRef]
  18. Xun, W.; Ren, Y.; Yan, H.; Ma, A.; Liu, Z.; Wang, L.; Zhang, N.; Xu, Z.; Miao, Y.; Feng, H.; et al. Sustained Inhibition of Maize Seed-Borne Fusarium Using a Bacillus-Dominated Rhizospheric Stable Core Microbiota with Unique Cooperative Patterns. Adv. Sci. 2023, 10, 2205215. [Google Scholar] [CrossRef]
  19. Hong, S.; Yuan, X.; Yang, J.; Yang, Y.; Jv, H.; Li, R.; Jia, Z.; Ruan, Y. Selection of rhizosphere communities of diverse rotation crops reveals unique core microbiome associated with reduced banana Fusarium wilt disease. New Phytol. 2023, 238, 2194–2209. [Google Scholar] [CrossRef]
  20. Qiao, Y.; Wang, T.; Huang, Q.; Guo, H.; Zhang, H.; Xu, Q.; Shen, Q.; Ling, N. Core species impact plant health by enhancing soil microbial cooperation and network complexity during community coalescence. Soil Biol. Biochem. 2024, 188, 109231. [Google Scholar] [CrossRef]
  21. Gao, M.; Xiong, C.; Gao, C.; Tsui, C.K.M.; Wang, M.M.; Zhou, X.; Zhang, A.M.; Cai, L. Disease-induced changes in plant microbiome assembly and functional adaptation. Microbiome 2021, 9, 187. [Google Scholar] [CrossRef] [PubMed]
  22. Li, J.; Yang, Z.D.; Wang, E.T.; Sun, L.Q.; Li, Y. The Effect of Climate Variables, Soil Characteristics, and Peanut Cultivars on the Rhizobial Bacteria Community. Microorganisms 2025, 13, 926. [Google Scholar] [CrossRef] [PubMed]
  23. Li, J.; Mavrodi, O.V.; Hou, J.; Blackmon, C.; Babiker, E.M.; Mavrodi, D.V. Comparative Analysis of Rhizosphere Microbiomes of Southern Highbush Blueberry (Vaccinium corymbosum L.), Darrow’s Blueberry (V. darrowii Camp), and Rabbiteye Blueberry (V. virgatum Aiton). Front. Microbiol. 2020, 11, 370. [Google Scholar] [CrossRef] [PubMed]
  24. Che, J.; Wu, Y.; Yang, H.; Wang, S.; Wu, W.; Lyu, L.; Li, W. Long-term cultivation drives dynamic changes in the rhizosphere microbial community of blueberry. Front. Plant Sci. 2022, 13, 96275. [Google Scholar] [CrossRef]
  25. Zhang, W.B.; Luo, Q.Q.; Zhu, Y.; Ma, J.; Cao, L.; Yang, M.; He, X.L. Microbial diversity in two traditional bacterial douchi from Gansu province in northwest China using illumina sequencing. PLoS ONE 2018, 13, e0197527. [Google Scholar] [CrossRef]
  26. Orgiazzi, A.; Lumini, E.; Nilsson, R.H.; Girlanda, M.; Vizzini, A.; Bonfante, P.; Bianciotto, V. Unravelling Soil Fungal Communities from Different Mediterranean Land-Use Backgrounds. PLoS ONE 2012, 7, e34847. [Google Scholar] [CrossRef]
  27. Caporaso, J.G.; Kuczynski, J.; Stombaugh, J.; Bittinger, K.; Bushman, F.D.; Costello, E.K.; Fierer, N.; Peña, A.G.; Goodrich, J.K.; Gordon, J.I.; et al. QIIME allows analysis of high-throughput comm unity sequencing data. Nat. Methods 2010, 7, 335–336. [Google Scholar] [CrossRef]
  28. Bolyen, E.; Rideout, J.R.; Dillon, M.R.; Bokulich, N.A.; Abnet, C.C.; Al-Ghalith, G.A.; Alexander, H.; Alm, E.J.; Arumugam, M.; Asnicar, F.; et al. Reproducible, interactive, scalable and extensible microbiome data science using QIIME 2. Nat. Biotechnol. 2019, 37, 852–857. [Google Scholar] [CrossRef]
  29. Callahan, B.; McMurdie, P.; Rosen, M.A.W.; Johnson, A.A.; Holmes, S.P. DADA2: High-resolution sample inference from Illumina amplicon data. Nat. Methods 2016, 13, 581–583. [Google Scholar] [CrossRef]
  30. Dong, L.; Xu, J.; Feng, G.; Li, X.; Chen, S. Soil bacterial and fungal community dynamics in relation to Panax notoginseng death rate in a continuous cropping system. Sci. Rep. 2016, 6, 31802. [Google Scholar] [CrossRef]
  31. Gao, Z.; Han, M.; Hu, Y.; Li, Z.; Liu, C.; Wang, X.; Tian, Q.; Jiao, W.; Hu, J.; Liu, L.; et al. Effects of Continuous Cropping of Sweet Potato on the Fungal Community Structure in Rhizospheric Soil. Front. Microbiol. 2019, 10, 2269. [Google Scholar] [CrossRef] [PubMed]
  32. Yurgel, S.N.; Douglas, G.M.; Comeau, A.M.; Mammoliti, M.; Dusault, A.; Percival, D.; Langille, M.G.I. Variation in bacterial and eukaryotic communities associated with natural and managed wild blueberry habitats. Phytobiomes 2017, 1, 102–113. [Google Scholar] [CrossRef]
  33. Gu, Y.; Wang, Y.; Wang, P.; Wang, C.; Ma, J.; Yang, X.; Ma, D.; Li, M. Study on the diversity of fungal and bacterial communities in continuous cropping fields of Chinese chives (Allium tuberosum). BioMed Res. Int. 2020, 2020, e3589758. [Google Scholar] [CrossRef] [PubMed]
  34. Zhang, S.; Wang, Y.; Sun, L.; Qiu, C.; Ding, Y.; Gu, H.; Wang, L.; Wang, Z.; Ding, Z. Organic mulching positively regulates the soil microbial communities and ecosystem functions in tea plantation. BMC Microbiol. 2020, 20, 103–112. [Google Scholar] [CrossRef]
  35. Do, T.; Huynh, V.; Le, L.; Nguyen, T.; Nguyen-Pham, A.; Bui-Thi, M.; Chau-Thi, A.; Tran, S.; Nguyen, V.; Ho-Huynh, T. Microbial diversity analysis using 16S rRNA gene amplicon sequencing of rhizosphere soils from double-cropping rice and rice-shrimp farming systems in Soc Trang, Vietnam. Microbiol. Resour. Announc. 2021, 10, e0059521. [Google Scholar] [CrossRef]
  36. Zhao, Y.; Fu, W.; Hu, C.; Chen, G.; Xiao, Z.; Chen, Y.; Wang, Z.; Cheng, H. Variation of rhizosphere micro bial community in continuous mono-maize seed production. Sci. Rep. 2021, 11, e1544. [Google Scholar] [CrossRef]
  37. Saad, N.; Alcala-briseno, R.I.; Polston, J.E.; Olmstead, J.W.; Varsani, A.; Harmon, P.F. Blueberry red ringspot virus genomes from Florida inferred through analysis of blueberry root transcriptomes. Sci. Rep. 2020, 10, e12043. [Google Scholar] [CrossRef]
  38. Wang, M.; Sun, D.; Xu, Z. Effects of Spent Mushroom Substrate Treated with Plant Growth-Promoting Rhizobacteria on Blueberry Growth and Soil Quality. Microorganisms 2025, 13, 932. [Google Scholar] [CrossRef]
  39. Wang, X.; Wang, C.; Sui, J.; Liu, Z.; Li, Q.; Ji, C.; Song, X.; Hu, Y.; Wang, C.; Sa, R.; et al. Isolation and characterization of phosphofungi, and screening of their plant growth-promoting activities. AMB Express 2018, 8, 63–71. [Google Scholar] [CrossRef]
  40. Gómez-Godínez, L.J.; Cisneros-Saguilán, P.; Toscano-Santiago, D.D.; Santiago-López, Y.E.; Fonseca-Pérez, S.N.; Ruiz-Rivas, M.; Aguirre-Noyola, J.L.; García, G. Cultivable and Non-Cultivable Approach to Bacteria from Undisturbed Soil with Plant Growth-Promoting Capacity. Microorganisms 2025, 13, 909. [Google Scholar] [CrossRef]
  41. Negrușier, C.; Colișar, A.; Rózsa, S.; Chiș, M.S.; Sîngeorzan, S.-M.; Borsai, O.; Negrean, O.-R. Bilberries vs. Blueberries: A Comprehensive Review. Horticulturae 2024, 10, 1343. [Google Scholar] [CrossRef]
  42. Van Deynze, A.; Zamora, P.; Delaux, P.M.; Heitmann, C.; Jayaraman, D.; Rajasekar, S.; Graham, D.; Maeda, J.; Gibson, D.; Schwartz, K.D.; et al. Nitrogen fixation in a landrace of maize is supported by a mucilage-associated diazotrophic microbiota. PLoS Biol. 2018, 16, e2006352. [Google Scholar] [CrossRef] [PubMed]
  43. Koyama, R.; Aparecido Ribeiro Júnior, W.; Mariani Zeffa, D.; Tadeu Faria, R.; Mitsuharu Saito, H.; Simões Azeredo Gonçalves, L.; Ruffo Roberto, S. Association of Indolebutyric Acid with Azospirillum brasilense in the Rooting of Herbaceous Blueberry Cuttings. Horticulturae 2019, 5, 68. [Google Scholar] [CrossRef]
Figure 1. Venn diagram showing the bacterial (A) and fungal (B) unique and shared ASVs among the rhizospheres of different blueberry cultivars, and the bacterial (C) and fungal (D) unique and shared ASVs between the treatment groups based on Bray–Curtis distances at the ASV level. Pr: Premier, Ba: Baldwin, Cl: Climax, Br: Brightwell, Le: Legacy, Li: Liberty, Em: Emerald, On: O’Neal, VV: Vaccinium virgatum, VC: Vaccinium corymbosum.
Horticulturae 11 00696 g001
Figure 2. Alpha diversity (ACE index, Chao1 index, Shannon index, and Simpson index) of bacterial (AD) and fungal (EH) in rhizosphere microbiome of blueberry. Chao1 and Ace indices assess species richness, while Shannon and Simpson indices evaluate species diversity; higher Shannon and Simpson values indicate greater diversity. Significant differences between Vaccinium species are indicated in each figure panel (p < 0.05). These letters are the result of an ANOVA, showing the significance of the differences between the different samples.
Horticulturae 11 00696 g002
Figure 3. Principal coordinate analysis (PCoA) based on Bray–Curtis distance showing the bacterial (A) and fungal (B) community structure among the eight groups, and the bacterial (C) and fungal (D) community structure between V. virgatum (VV) and V. corymbosum (VC) samples.
Horticulturae 11 00696 g003
Figure 4. Metastats statistical analysis of phyla of bacterial communities (A), and the comparison of bacterial compositions among the rhizosphere microbiomes of the blueberry at the phylum (B) and genus (C) levels. ***: p < 0.001, **: p < 0.01, *: p < 0.05.
Horticulturae 11 00696 g004
Figure 5. Metastats statistical analysis of phyla of fungal communities (A), and the comparison of fungal compositions among the rhizosphere microbiomes of the blueberry at the phylum (B) and genus levels (C). ***: p < 0.001, **: p < 0.01, *: p < 0.05.
Horticulturae 11 00696 g005
Figure 6. Quantification of the abundance of differential bacterial taxonomic composition between the rhizosphere microbiomes of blueberry at the genus level; a two-sided t test was used to quantify the abundance. The proportions of abundance of genera in two groups are shown on the left; the proportions of differences in function abundance within the 95% confidence interval are shown in the center; the corrected p values (≤0.05) are shown on the right. (A) Difference between ‘Premier’ and ‘Emerald’; (B) difference between ‘Legacy’ and ‘Emerald’; (C) difference between ‘O’Neal’ and ‘Emerald’; (D) difference between ‘Legacy’ and ‘O’Neal’; (E) difference between ‘Premier’ and ‘O’Neal’.
Horticulturae 11 00696 g006
Figure 7. Cladogram indicating the phylogenetic distribution of bacterial taxa associated with the blueberry rhizosphere samples (logarithmic LDA score ≥ 4.0 and p ≤ 0.05) (A). Concentric circles extending outward from the center of the evolutionary branching diagram denote taxonomic levels. Each individual circle at a specific taxonomic level signifies a taxon at that level, with the diameter of the circle being proportional to the relative abundance of the taxon it represents. Relative abundances of core rhizosphere microbiomes involved in plant growth-promoting rhizobacteria (PGPR) ((B) Enterobacter; (C) Pseudomonas; (D) Streptomycetaceae; (E) Arthrobacter; (F) Burkholderia; (G) Enterobacter) in different sample groups (identified by “class”); the solid and dashed lines identify the mean and median relative abundance values of the taxon in each group.
Horticulturae 11 00696 g007
Figure 8. Cladogram indicating the phylogenetic distribution of fungal taxa associated with the blueberry rhizosphere samples (logarithmic LDA score ≥ 4.0 and p ≤ 0.05) (A). In the evolutionary branching diagram, concentric circles emanating from the center represent various taxonomic levels. Each circle corresponding to a particular taxonomic level indicates a taxon at that level, with the circle’s diameter being proportional to the relative abundance of the represented taxon. Relative abundances of core ericoid mycorrhizal fungi (Oidiodendron) (B) in different samples (identified by “class”); the solid and dashed lines identify the mean and median relative abundance values of the taxon in each group. LEfSe analysis of differentially abundant (LDA threshold score 3.0) taxa of fungi between Vaccinium species (C).
Horticulturae 11 00696 g008
Table 1. Description of species and varieties of Vaccinium used in the study.
TreatmentVaccinium SpeciesCultivarsVaccinium Genotypes
(Breeding Selections)
PedigreeBlueberry Type
VVV. virgatum
(2n = 6× = 72)
PrPremierTifblue/WoodardRabbiteye
BaBaldwinCallaway/Tifblue
ClClimaxBlack Giant/Myers
BrBrightwellTifblue/Menditoo
VCV. corymbosum
(2n = 4× = 48)
LeLegacyElizabeth/US 75Highbush
LiLibertyElliott/Duke
EmEmeraldFlorida 4B/Avonblue
OnO’NealUS 11/G-144
Disclaimer/Publisher’s Note: The statements, opinions and data contained in all publications are solely those of the individual author(s) and contributor(s) and not of MDPI and/or the editor(s). MDPI and/or the editor(s) disclaim responsibility for any injury to people or property resulting from any ideas, methods, instructions or products referred to in the content.

