Article

Genome-Wide Identification and Characterization of Trehalose-6-Phosphate Synthase/Phosphatases Gene Family in Petunia and Their Expression Profiling Under Abiotic Stresses

1
Sichuan Provincial Key Laboratory for Development and Utilization of Characteristic Horticultural Biological Resources, College of Chemistry and Life Sciences, Chengdu Normal University, Chengdu 611130, China
2
Key Laboratory of Agricultural Biosafety and Green Production of Upper Yangtze River (Ministry of Education), Chongqing Engineering Research Center for Floriculture, College of Horticulture and Landscape Architecture, Southwest University, Chongqing 400715, China
3
School of Integrative Plant Science, Cornell University, Ithaca, NY 14853, USA
*
Author to whom correspondence should be addressed.
Horticulturae 2025, 11(6), 695; https://doi.org/10.3390/horticulturae11060695
Submission received: 20 April 2025 / Revised: 12 June 2025 / Accepted: 15 June 2025 / Published: 16 June 2025
(This article belongs to the Special Issue Biotic and Abiotic Stress Responses of Horticultural Plants)

Abstract

Trehalose is a nonreducing disaccharide critical for cellular integrity and stress adaptation in plants, and its synthesis relies on trehalose-6-phosphate synthase (TPS) and trehalose-6-phosphate phosphatase (TPP). Despite their established roles in abiotic stress responses across model plants, these gene families remain underexplored in ornamental species like Petunia hybrida. Here, TPS and TPP genes in two wild petunia progenitors, P. axillaris and P. inflata, underwent a genome-wide analysis, with 10 TPS and 8–9 TPP genes being identified in each species. According to phylogenetic analysis, petunia TPS proteins cluster into two clades, while TPP proteins were classified into three clades, showing closer evolutionary ties to tomato homologs. Cis-acting elements profiling identified hormone- and stress-responsive regulatory elements (e.g., ABRE, TC-rich repeats). Expression analysis under drought, heat, and salt stress revealed dynamic temporal regulation. For instance, PaTPS4/PaTPS9 were early responders (peak at 6 h) under drought and salt stress, while PaTPS8 exhibited sustained upregulation during salt treatment. Heat stress uniquely suppressed PaTPS1,2 and PaTPP1, contrasting with broad upregulation of other members. Notably, PaTPP3 displayed delayed induction under heat. These findings underscore the functional diversity within TPS/TPP families, with specific members governing stress-specific responses. This study provides a foundational resource for leveraging these genes to enhance stress resilience and ornamental value in petunia.

1. Introduction

Trehalose is a nonreducing disaccharide encompassing two glucose units linked by α,α-1,1-glycosidic bonds [1], and exists in bacteria, yeast, fungi, insects, invertebrates, and both lower and higher plants [2]. Trehalose excels in maintaining cellular integrity in a variety of organisms, especially in plant growth and development [3]. Trehalose is linked to plant stress tolerance and helps protect cellular integrity under abiotic stresses (heat, cold, salinity, and drought) [2,4,5,6,7]. However, research shall be conducted in the future to examine the role of trehalose (or trehalose-6-phosphate (Tre6P), the precursor of trehalose) in stress regulation, especially in temperature stress.
Trehalose synthesis primarily relies on two essential enzymes: trehalose-6-phosphate synthase (TPS) and trehalose-6-phosphate phosphatase (TPP) [8], typically proceeding in two steps in plants: Firstly, Tre6P, an intermediate product, is formed by TPS. Subsequently, TPP induces Tre6P to be dephosphorylated, generating trehalose [9]. Large gene families take charge of encoding TPS and TPP in most sequenced higher plants. Specifically, Arabidopsis possesses 11 TPS genes (AtTPS1AtTPS11) [10] and 10 TPP genes (AtTPPAAtTPPJ) [11]; in comparison, rice possesses 11 TPS genes (OsTPS1OsTPS11) and 11 TPP genes (OsTPP1OsTPP11) [12,13]. The TPS family genes fall into two clades with different structures and biochemical activities. Class I and Class II members contain both TPS and TPP domains; however, Class I TPSs encode catalytically active TPS enzymes, Class II TPSs have no TPS or TPP enzymatic activity, most of which harbor conserved phosphatase domains [10,13,14]. The TPP family genes harbor a specific TPP domain with conserved phosphatase domains, all exhibiting TPP activities [15].
According to previous research, specific groups of TPS and TPP genes undergo differential regulation under varying abiotic stresses [16]. In detail, their overexpression or mutation can remarkably affect the tolerance to abiotic stress, e.g., OsTPS1 overexpression makes transgenic rice seedlings more tolerant to low temperature, high salinity, and drought [17], OsTPP1 overexpression makes transgenic rice more tolerant to salt and low-temperature stresses, while also promoting multiple stress-responsive genes to be expressed [12], and OsTPP3 overexpression makes plants more sensitive to abscisic acid with corresponding higher tolerance to drought stress [18]. In Arabidopsis, the Attppi mutant is sensitive to low-temperature stress, whereas overexpressing plants exhibit tolerance [19]. Moreover, AtTPPF and AtTPPI coordinate the response to drought, while the overexpression of AtTPPD enhances tolerance to salt [20]. Recently, research has elucidated that the Tre6P signaling pathway is of significant importance for regulating soluble sugar metabolism and coordinating plant stress responses. For example, OsTPP1 enhances sugar accumulation in panicles by inhibiting trehalose-6-phosphate (Tre6P) accumulation and promoting the expression of sugar transporter genes. Under low-temperature stress, these accumulated sugars ensure proper pollen development, ultimately improving cold tolerance in rice during the booting stage [21].
Petunia hybrid, a widely used ornamental plant in the Solanaceae family, is prized for its vibrant flowers, diverse colors, shapes, and ease of cultivation, making it a popular choice in gardens and landscaping [22,23]. P. hybrid also serves as an important model organism in scientific research, particularly in plant genetics, flower development, and pigment biosynthesis [24]. Significant progress has been made in the areas of flower organ development and color regulation in petunia [25,26]. In contrast, research on stress resistance genes in petunia has been less advanced. Identifying key genes responsible for stress resistance in petunia can crucially enhance their stress tolerance and ornamental value in landscaping [24]. Despite the effect of TPS and TPP genes on plant species’ growth, development, and stress responses as evidenced in existing studies, their function in petunia has not been comprehensively analyzed. Additionally, current studies have not well explored their participation in environmental stress responses. The commercial P. hybrida is derived from crossbreeding between P. axillaris and species within the P. integrifolia clade [24]. Researchers have sequenced the whole genome of P. axillaris and P. inflata [24], providing an opportunity to analyze the TPS and TPP gene families in petunia under stress conditions.
The TPS and TPP genes in two petunia genomes underwent a genome-wide investigation herein, with relevant phylogeny, gene structures, conserved motifs, and cis-acting elements being examined, and expression patterns in abiotic stress conditions being analyzed in detail. All these assist in deeply comprehending the critical roles of the two gene families in petunia growth, development, and stress responses, defining directions for future research.

2. Materials and Methods

2.1. TPS and TPP Gene Identification in Petunia

We downloaded the Arabidopsis TPS and TPP protein sequences from the Arabidopsis Information Resource (TAIR) database (http://www.rosaceae.org/, accessed on 9 June 2021). The genomic data regarding P. axillaris and P. inflata were publicly accessible at the Sol Genomics Network (SGN) (https://solgenomics.net/organism/Solanum_lycopersicum/genome, accessed on 27 July 2022). The Genome Database for P. axillaris and P. inflata was subjected to a BLASTP search using Arabidopsis TPS or TPP proteins as query sequences. The NCBI Conserved Domains (CD) search tools (http://www.ncbi.nlm.nih.gov/Structure/cdd/wrpsb.cgi, accessed on 5 May 2022) and the SMART program (http://smart.embl-heidelberg.de/, accessed on 20 January 2022) served to confirm each candidate TPS and TPS equence as a member of the TPS and TPP family [27]. Analysis was conducted on the physicochemical properties of TPS and TPP proteins, such as their physical locations, molecular weights (MW), and theoretical isoelectric points (pI) by virtue of the online ProtParam tool (http://web.expasy.org/protparam/, accessed on 11 August 2022). Subcellular localization prediction proceeded via the Plant-mPloc server (http://www.csbio.sjtu.edu.cn/bioinf/plant-multi/, accessed on 10 May 2022).

2.2. Phylogenetic Analysis of TPS and TPP Genes

We downloaded rice and tomato TPS and TPP protein sequences from NCBI (http://www.ncbi.nlm.nih.gov/, accessed on 10 May 2022) and the SGN (https://solgenomics.net/organism/Solanum_lycopersicum/genome, accessed on 31 May 2012), respectively, with relevant full-length amino acid (AA) sequences being compared via Clustal W with default parameters [28]. The neighbor-joining method assisted in phylogenetic analysis by virtue of MEGA version 11.0 (http://www.megasoftware.net/, accessed on 12 February 2023), followed by the calculation of the bootstrap value after 1000 iterations. The last step was the visualization of the ML tree under the aid of iTOL version 6.9 (https://itol.embl.de/, accessed on 5 July 2024) [29].

2.3. Gene Structure and Conserved Motif Analysis of TPS and TPP Genes

Utilizing the GFF file, we analyzed TPS and TPP genes’ exon-intron structure by virtue of the Gene Structure Display Server (GSDS) version 2.0 (https://gsds.cgrpoee.top/, accessed on 21 March 2022) [30]. Conserved motifs in TPS and TPP protein sequences were identified through MEME Suite version 5.5.0 (https://meme-suite.org/meme/index.html, accessed on 20 March 2022) [31], with a maximum of 10 motifs, motif widths of 6–200 AAs, and a screening threshold of E < 1 × 10⁻¹⁰. Visualization was conducted on their gene structure and conserved motifs using TBtools version 2.056 [32].

2.4. Cis-Element Analysis

The study extracted the 2000 bp region upstream of each TPS and TPP gene as the putative promoter sequence. PlantCARE (http://bioinformatics.psb.ugent.be/webtools/plantcare/html/, accessed on 2 April 2022) was adopted for the prediction of Cis-acting elements [33], which were visualized with TBtools.

2.5. Plant Materials, Growth Conditions, and Stress Treatment

Plants of petunia, ‘Mitchell Diploid’ (a doubled haploid from P. axillaris and P. hybrid cv. ‘Rose of Heaven’), were grown in pots (10 cm (diameter) × 9 cm (height)) with Cornell mix and sand mixed in a ratio of 3:1. The growing conditions included a day/night temperature of 25/15 °C, 14 h photoperiod, and the presence of supplemental lights (Cornell University in Ithaca, NY, USA). With plants growing to 15–20 cm tall, experimenters selected uniform plants to conduct various stress treatments. Plants in the heat stress treatment were exposed to 42 °C for 3 days. Plants in the drought stress treatment were deprived of water for 3 days. When conducting the salt stress treatment, experimenters watered each pot with 300 mM NaCl for 3 days. Each treatment was repeated five times (n = 5) in a completely randomized design. Experimenters collected leaf samples at 0, 3, 6, 12, 24, 48, and 72 h following stress treatment. All the samples, after being frozen in liquid nitrogen, were preserved at −80 °C for subsequent analysis.

2.6. Total RNA Extraction and qRT-PCR Analysis

Experimenters ground petunia leaves in liquid nitrogen to a fine powder and extracted total RNA with the RNeasy Plant Mini Kit (Qiagen, Hilden, Germany). After RQ1 DNase treatment (Promega, Madison, WI, USA), total RNA was measured in terms of the quality and quantity by virtue of an Agilent 2100 Bioanalyzer (Agilent, Santa Clara, CA, USA), followed by agarose gel electrophoresis to ascertain the RNA integrity. Subsequently, the High-Capacity cDNA Reverse Transcription Kit (Applied Biosystems, Foster, CA, USA) was employed for reverse-transcribing equal amounts of total RNA for each sample into cDNA. Table S1 lists the gene-specific primers for expression analysis. 15 µL reactions underwent three rounds of real-time PCR using 7.5 µL of SYBR Green Supermix (Bio-Rad, Hercules, CA, USA), 0.75 µL of each primer (500 nM), 5.4 µL water, and 0.6 µL cDNA template, together with the negative controls without templates. PCR was carried out using an Icycler iQ5 (BioRad, Hercules, CA, USA) real-time system machine, as per the manufacturer’s protocol. The ddCT method was used for data analysis by using the iQ5 2.0 software (Bio-Rad, Hercules, CA, USA) [34]. The Actin gene of petunia was used to calculate the relative transcript abundance. All quantitative PCRs specific to each gene adopted three biological replicates, and each experiment had three technical replicates.

2.7. Data Analysis

Data analysis relied on SPSS 20.0 (SPSS, Chicago, IL, USA), with data presented in the format of mean ± standard deviation (SD). Significant differences between treatments were assessed via one-way ANOVA coupled with Tukey’s test (p ≤ 0.05), which were illustrated by bar charts (Origin 2019, OriginLab Corporation, Northampton, MA, USA).

3. Results

3.1. Identification and Physicochemical Property Analysis of TPS and TPP Genes in Petunia

With the sequences of the Arabidopsis TPS and TPP proteins, we carried out local BLAST (version 2.12.0) analysis utilizing genome data of P. axillaris and P. inflata, and confirmed 10 TPS genes in both P. axillaris and P. inflata, designated as PaTPS1-10 and PiTPS1-10, respectively (Table 1). Among these TPS proteins, PiTPS1 and PiTPS9 were the shortest and longest proteins with 848 and 1028 AAs, respectively. The petunia TPS proteins had a pI of 5.58–7.19 and a MW of 96.23–116.45 kDa. According to the subcellular localization predictions, most TPS proteins were in the cytoplasm, while some were in the nucleus. Additionally, we identified 8 TPP genes in P. axillaris, named PaTPP1-8, and 9 TPP genes in P. inflata, named PiTPP1-9 (Table 2). Among these TPP proteins, PiTPP2 was the shortest with 276 AAs, while PiTPP5 was the longest with 414 AAs. The petunia TPP proteins had a pI of 6.04–9.65 and an MW of 31.47–46.45 kDa. According to subcellular localization predictions, most TPP proteins were found in the cytoplasm, while some were in the mitochondria, chloroplasts, or nucleus.

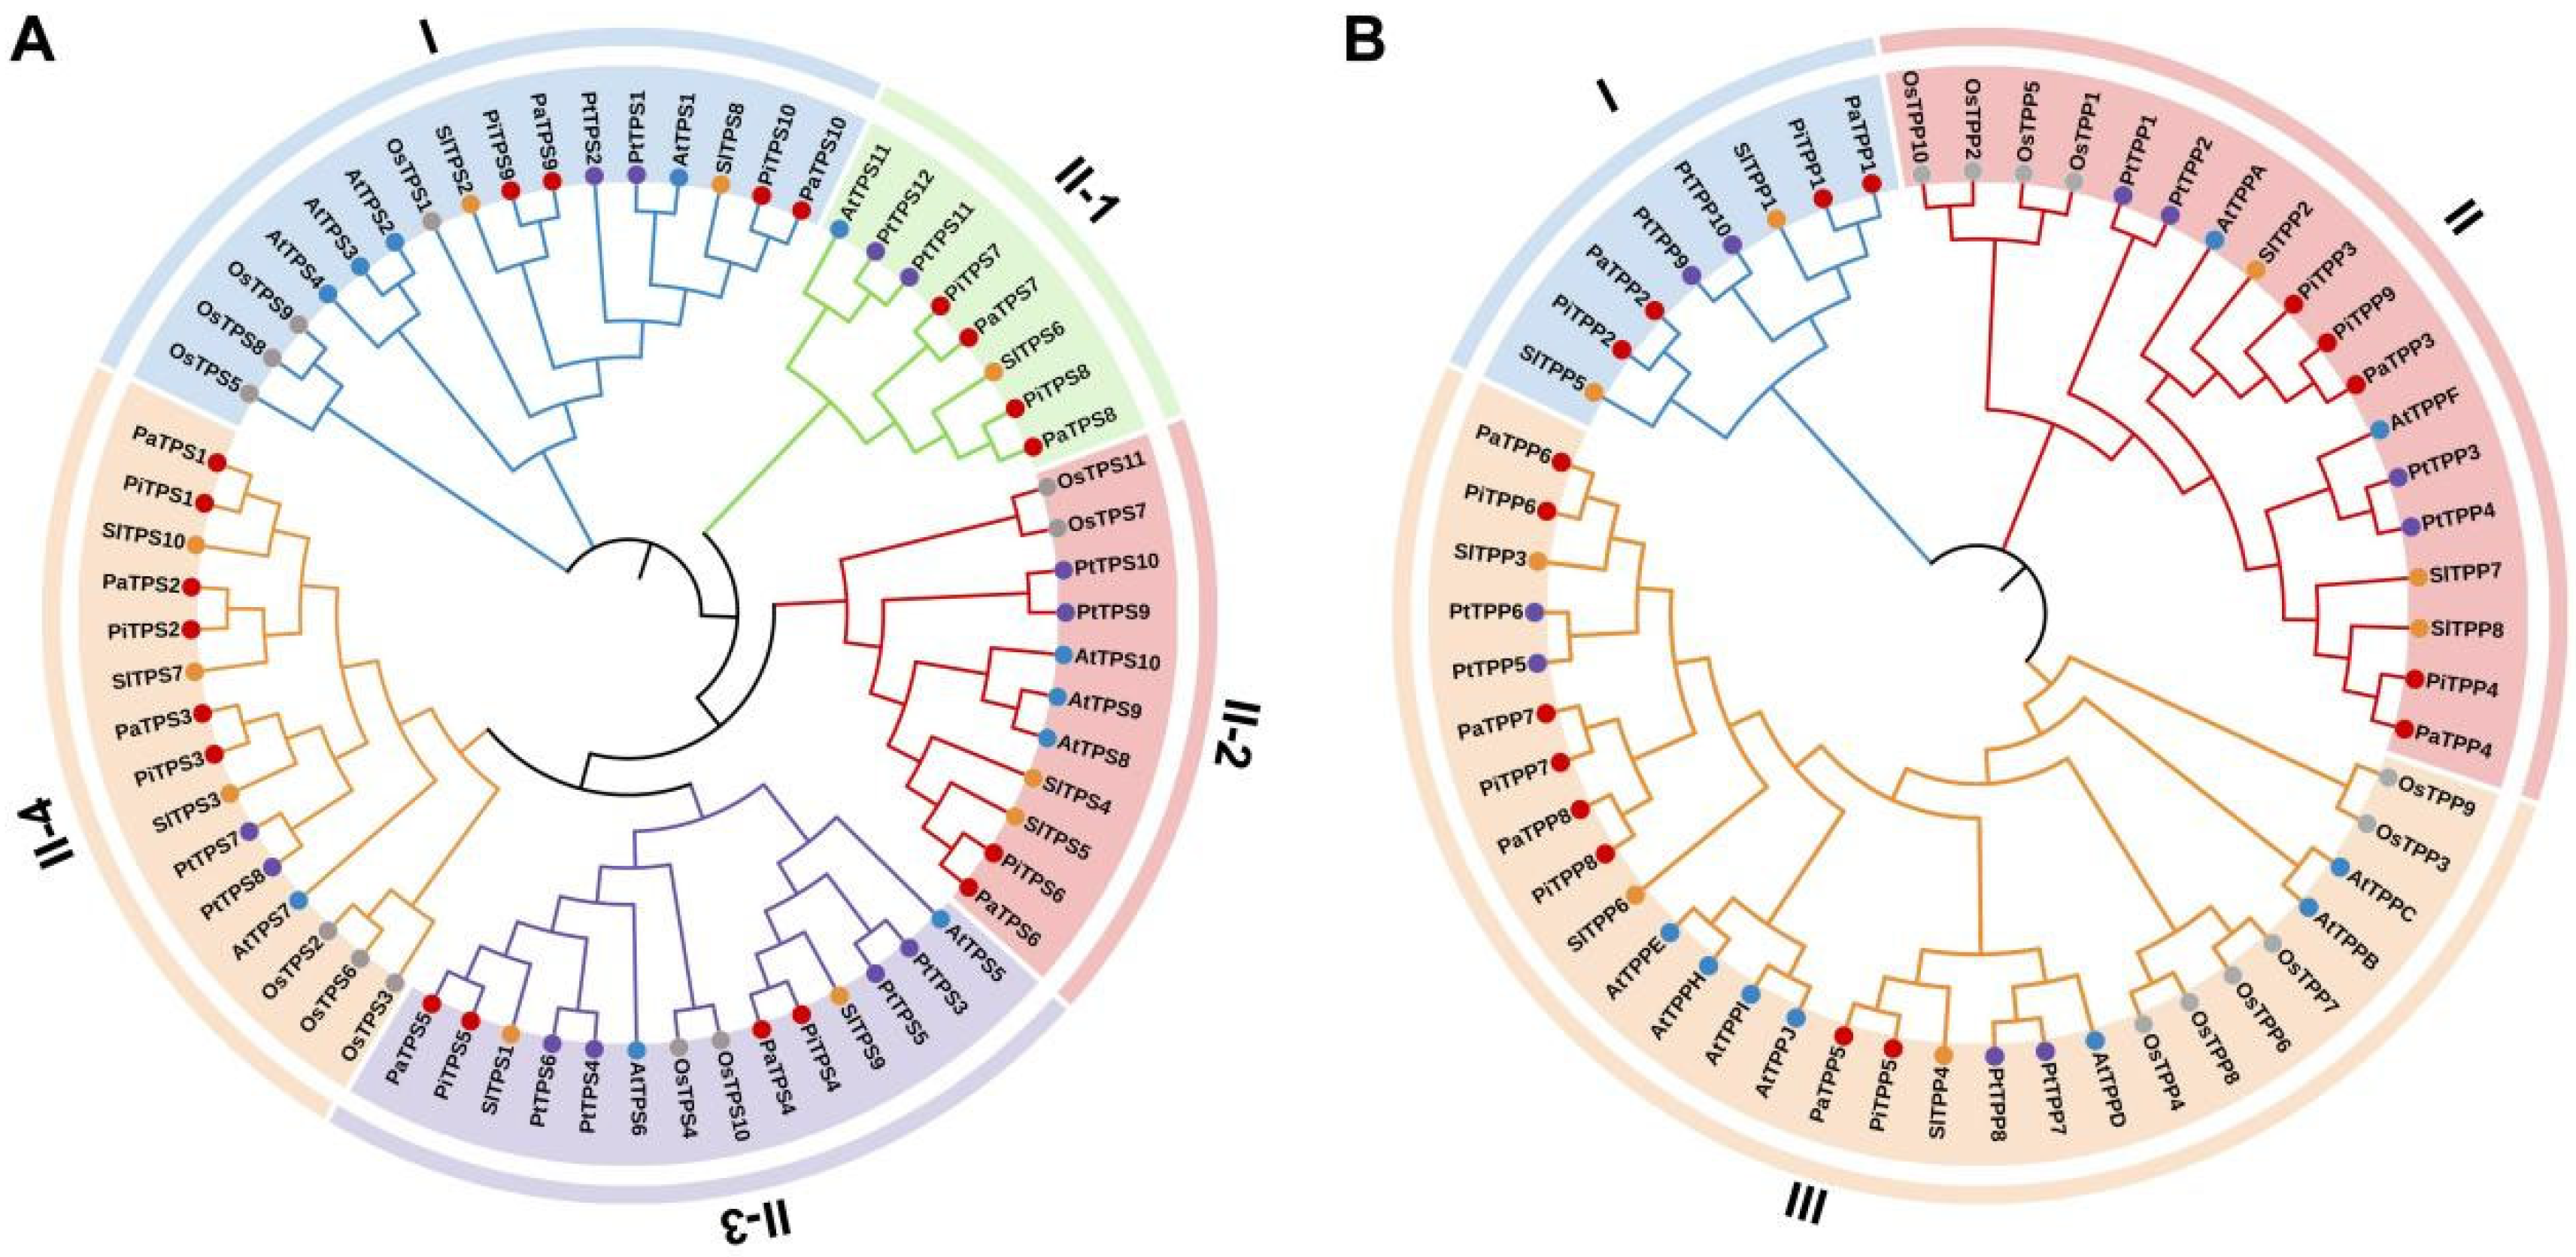
3.2. Phylogenetic Analysis of TPS and TPP Family Genes in Petunia

To reveal the evolutionary relationships between the petunia TPS and TPP families and those of other plant species, we built a phylogenetic tree by utilizing 64 TPS proteins and 56 TPP proteins from four model plants, including Arabidopsis, rice, tomato, and Populus (Figure 1).
Considering the phylogenetic relationship in Arabidopsis, researchers classify the petunia TPS family into Clade I and Clade II (Figure 1A). Among these TPS proteins, PaTPS1-8 and PiTPS1-8 belong to Clade II, while PaTPS9-10 and PiTPS9-10 are placed in Clade I. Clade II is subsequently divided into four subgroups: Clade II-1 (PaTPS7-8 and PiTPS7-8), Clade II-2 (PaTPS6 and PiTPS6), Clade II-3 (PaTPS4-5 and PiTPS4-5), and Clade II-4 (PaTPS1-3 and PiTPS1-3). Comparative analysis reveals that most petunia TPS proteins are intensely associated with those of tomato, another member of the Solanaceae family, indicating a closer evolutionary relationship. The petunia TPP family is divided into three clades: Clade Ι, Clade Ⅱ, and Clade Ш (Figure 1B). Among these TPP proteins, PaTPP1-2 and PiTPP1-2 are placed in Clade I, PaTPP3-4 and PiTPP3-4, 9 in Clade II, and PaTPP5-8 and PiTPP5-8 in Clade III. Similar to the TPS proteins, most petunia TPP proteins also show a closer genetic relationship to those of tomato.

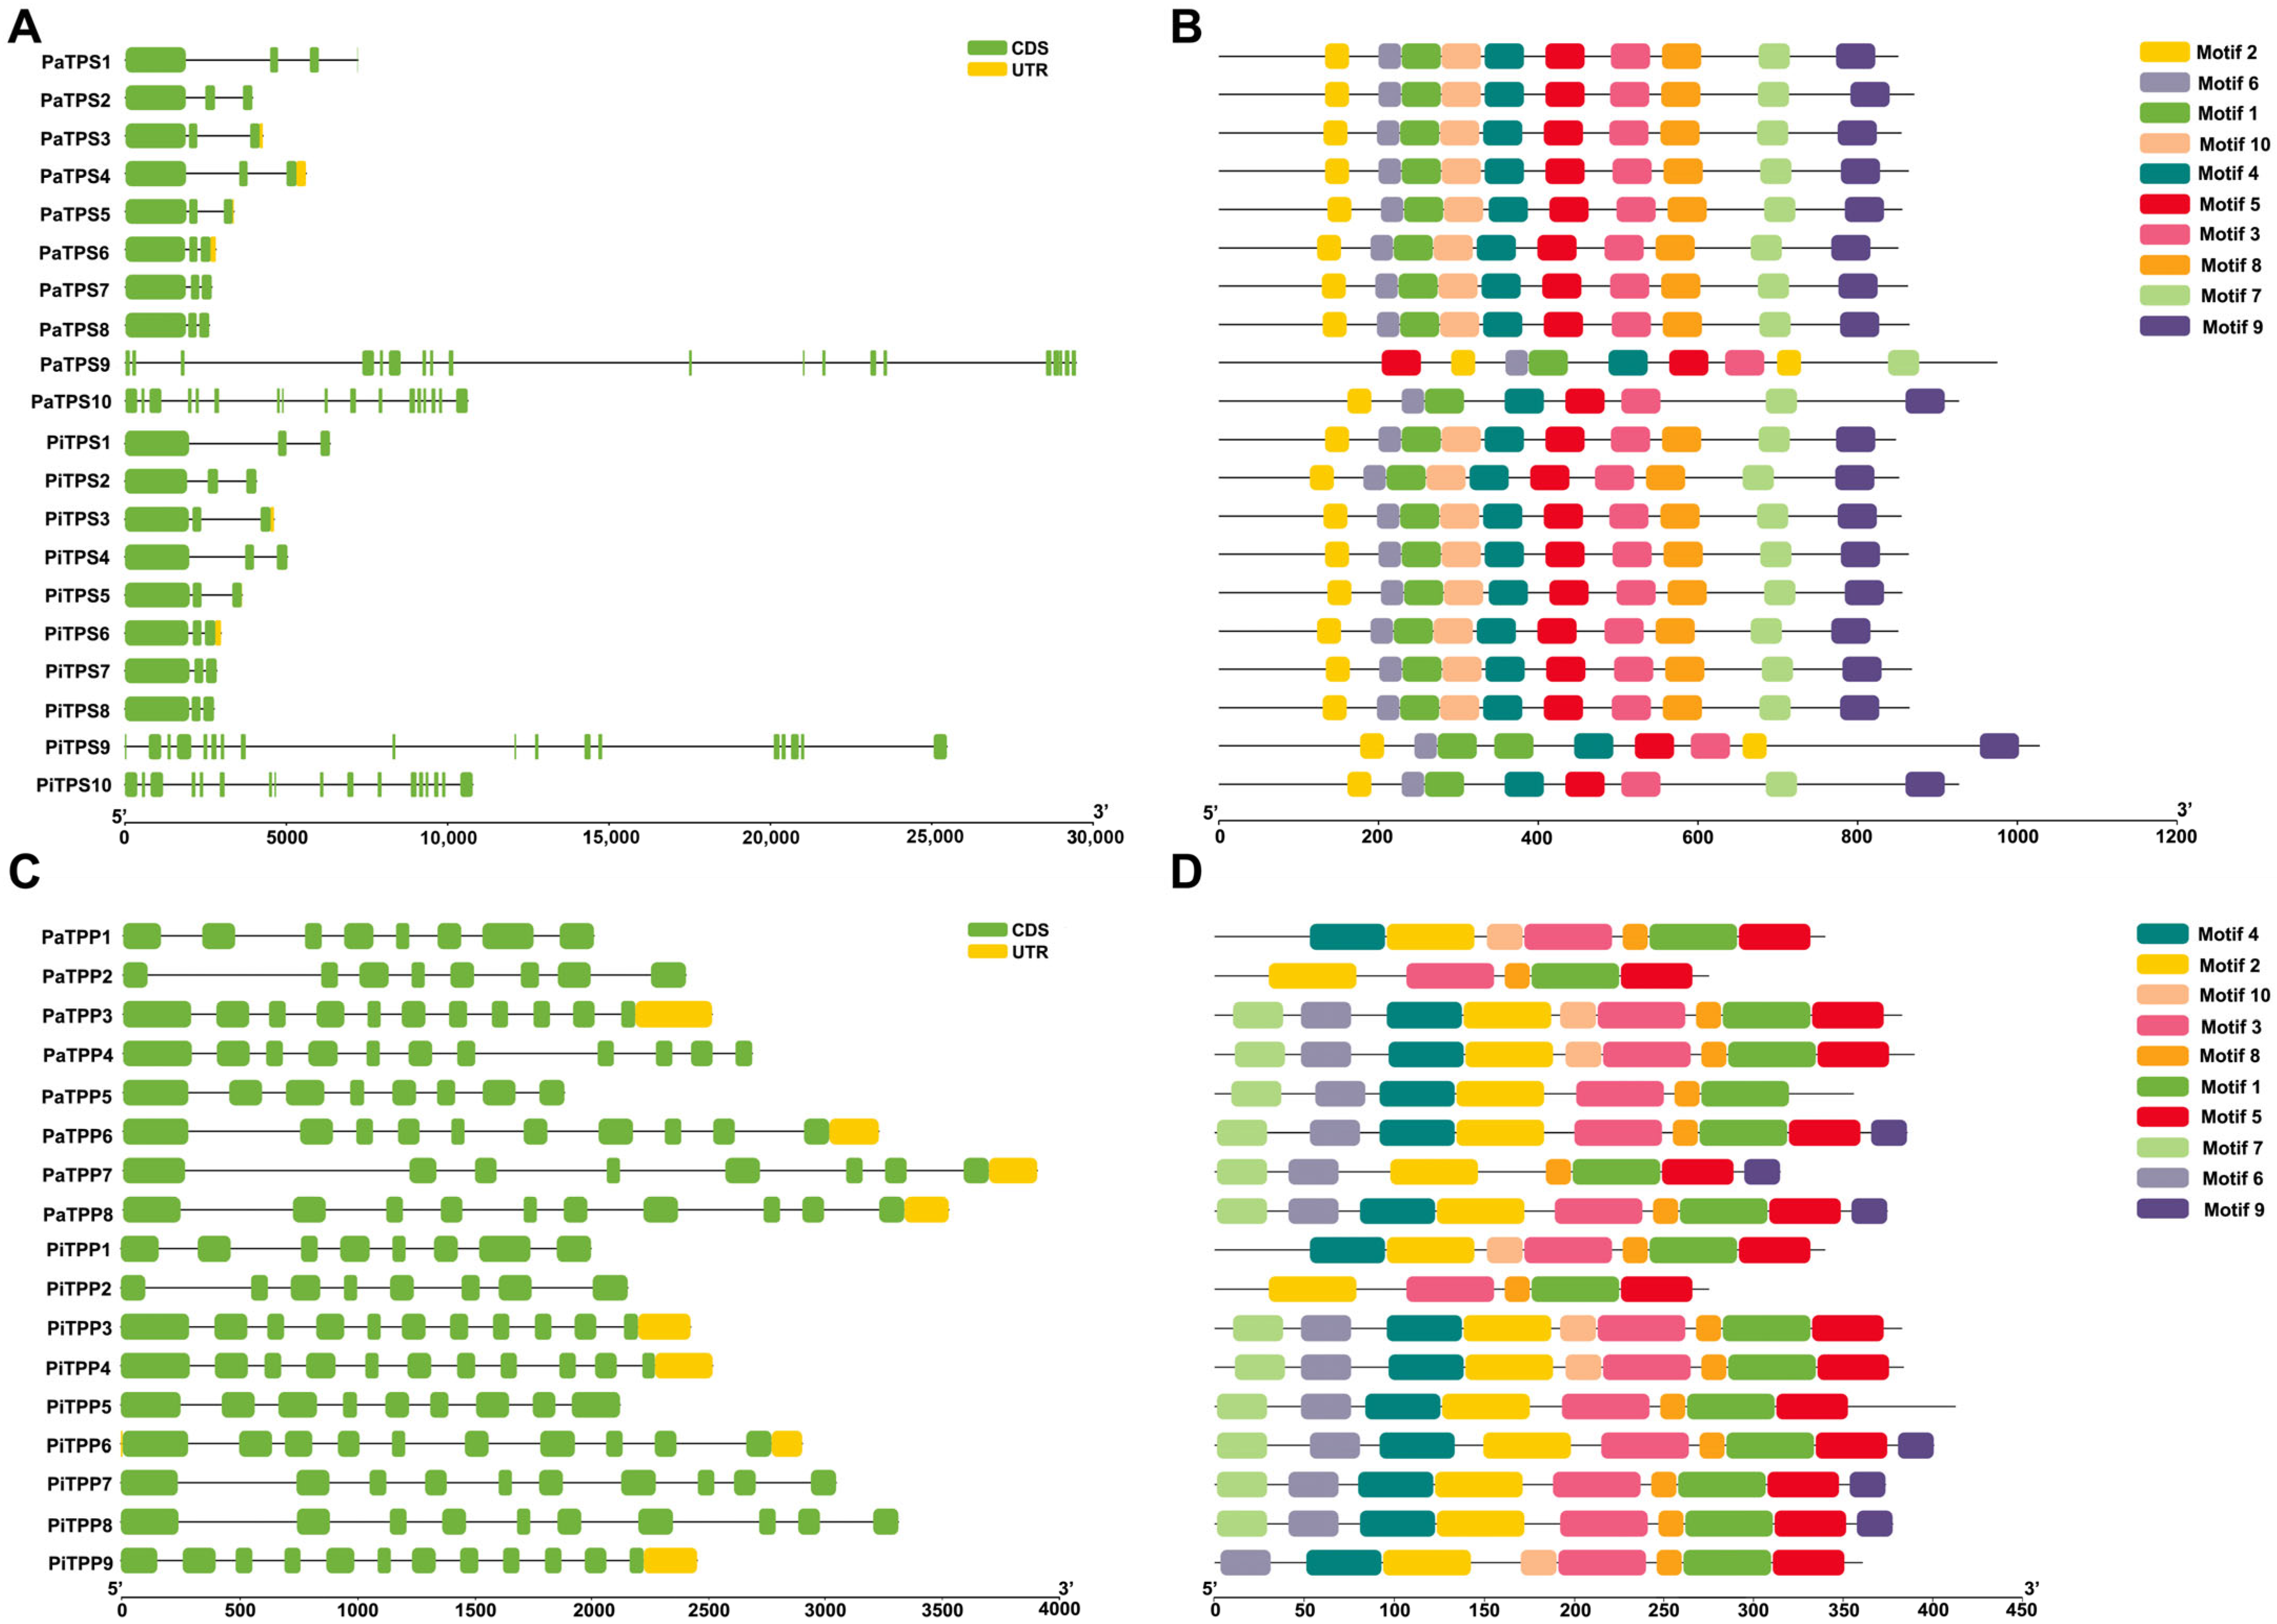
3.3. Gene Structure and Conserved Motif Analysis of TPSs and TPPs

The TPS and TPP families were deeply investigated in terms of their inherent structures (Figure 2). According to gene structure analysis, the two subgroups exhibited remarkably different genetic structure of TPS members, with Class I genes having more exons and more complex gene structures than Class II genes (Figure 2A). Among the Class I TPS genes, Pa/PiTPP9 has 19 exons, Pa/PiTPP10 has 17 exons, while all Class II TPS genes contain 3 exons. Comparatively, the TPP subgroups have a slightly varied number of exons (Figure 2B). Class I TPP genes consistently have 8 exons, while in Class II, all TPP genes except PiTPP9, which contains 12 exons, have 11 exons. Among Class III TPP genes, PaTPP5 and PaTPP7 contain 8 exons, PiTPP5 contains 9 exons, and the remaining genes consist of 8 exons.
To investigate the evolutionary conservation and diversification patterns among TPS and TPP proteins, we conducted systematic motif identification across all family members using the MEME Suite version 5.5.0. Conservative motif analysis confirmed 10 conserved motifs, Motif 1 to Motif 10 (Figure 2B and Table S2). All TPS proteins contain motifs 1 through 10, except for PaTPS9,10 and PiTPS9,10 (Figure 2B). Among them, PaTPS9 lacks motifs 8, 9, and 10, PiTPS9 lacks motifs 7, 8, and 10, and Pa/PiTPS10 lack motifs 8 and 10. Motifs 1, 2, 3, 4, 5, 6, 8, and 10 constitute the TPS domain (Glyco_transf_20). Motifs 7 and 9 compose the TPP domain (HAD-like domain). Compared to TPS proteins, TPP proteins exhibit fewer motifs, with Pa/PiTPP2 having the least number of motifs (5) (Figure 2B). All TPP proteins contain motifs 1, 2, 3, 5, and 8. Motif 4 is absent only in Pa/PiTPP2, motif 6 is absent only in PaTPS1,2 and PiTPS1,2, motif 7 is present only in PaTPP3-8 and PiTPP3-8, motif 9 is present only in PaTPP6-8 and PiTPP6-8, and motif 10 is present only in PaTPP1,3,4,9 and PiTPP1,3,4,9. Motifs 1, 2, 3, 4, 5, and 6 together constitute the Trehalose_PPase domain.

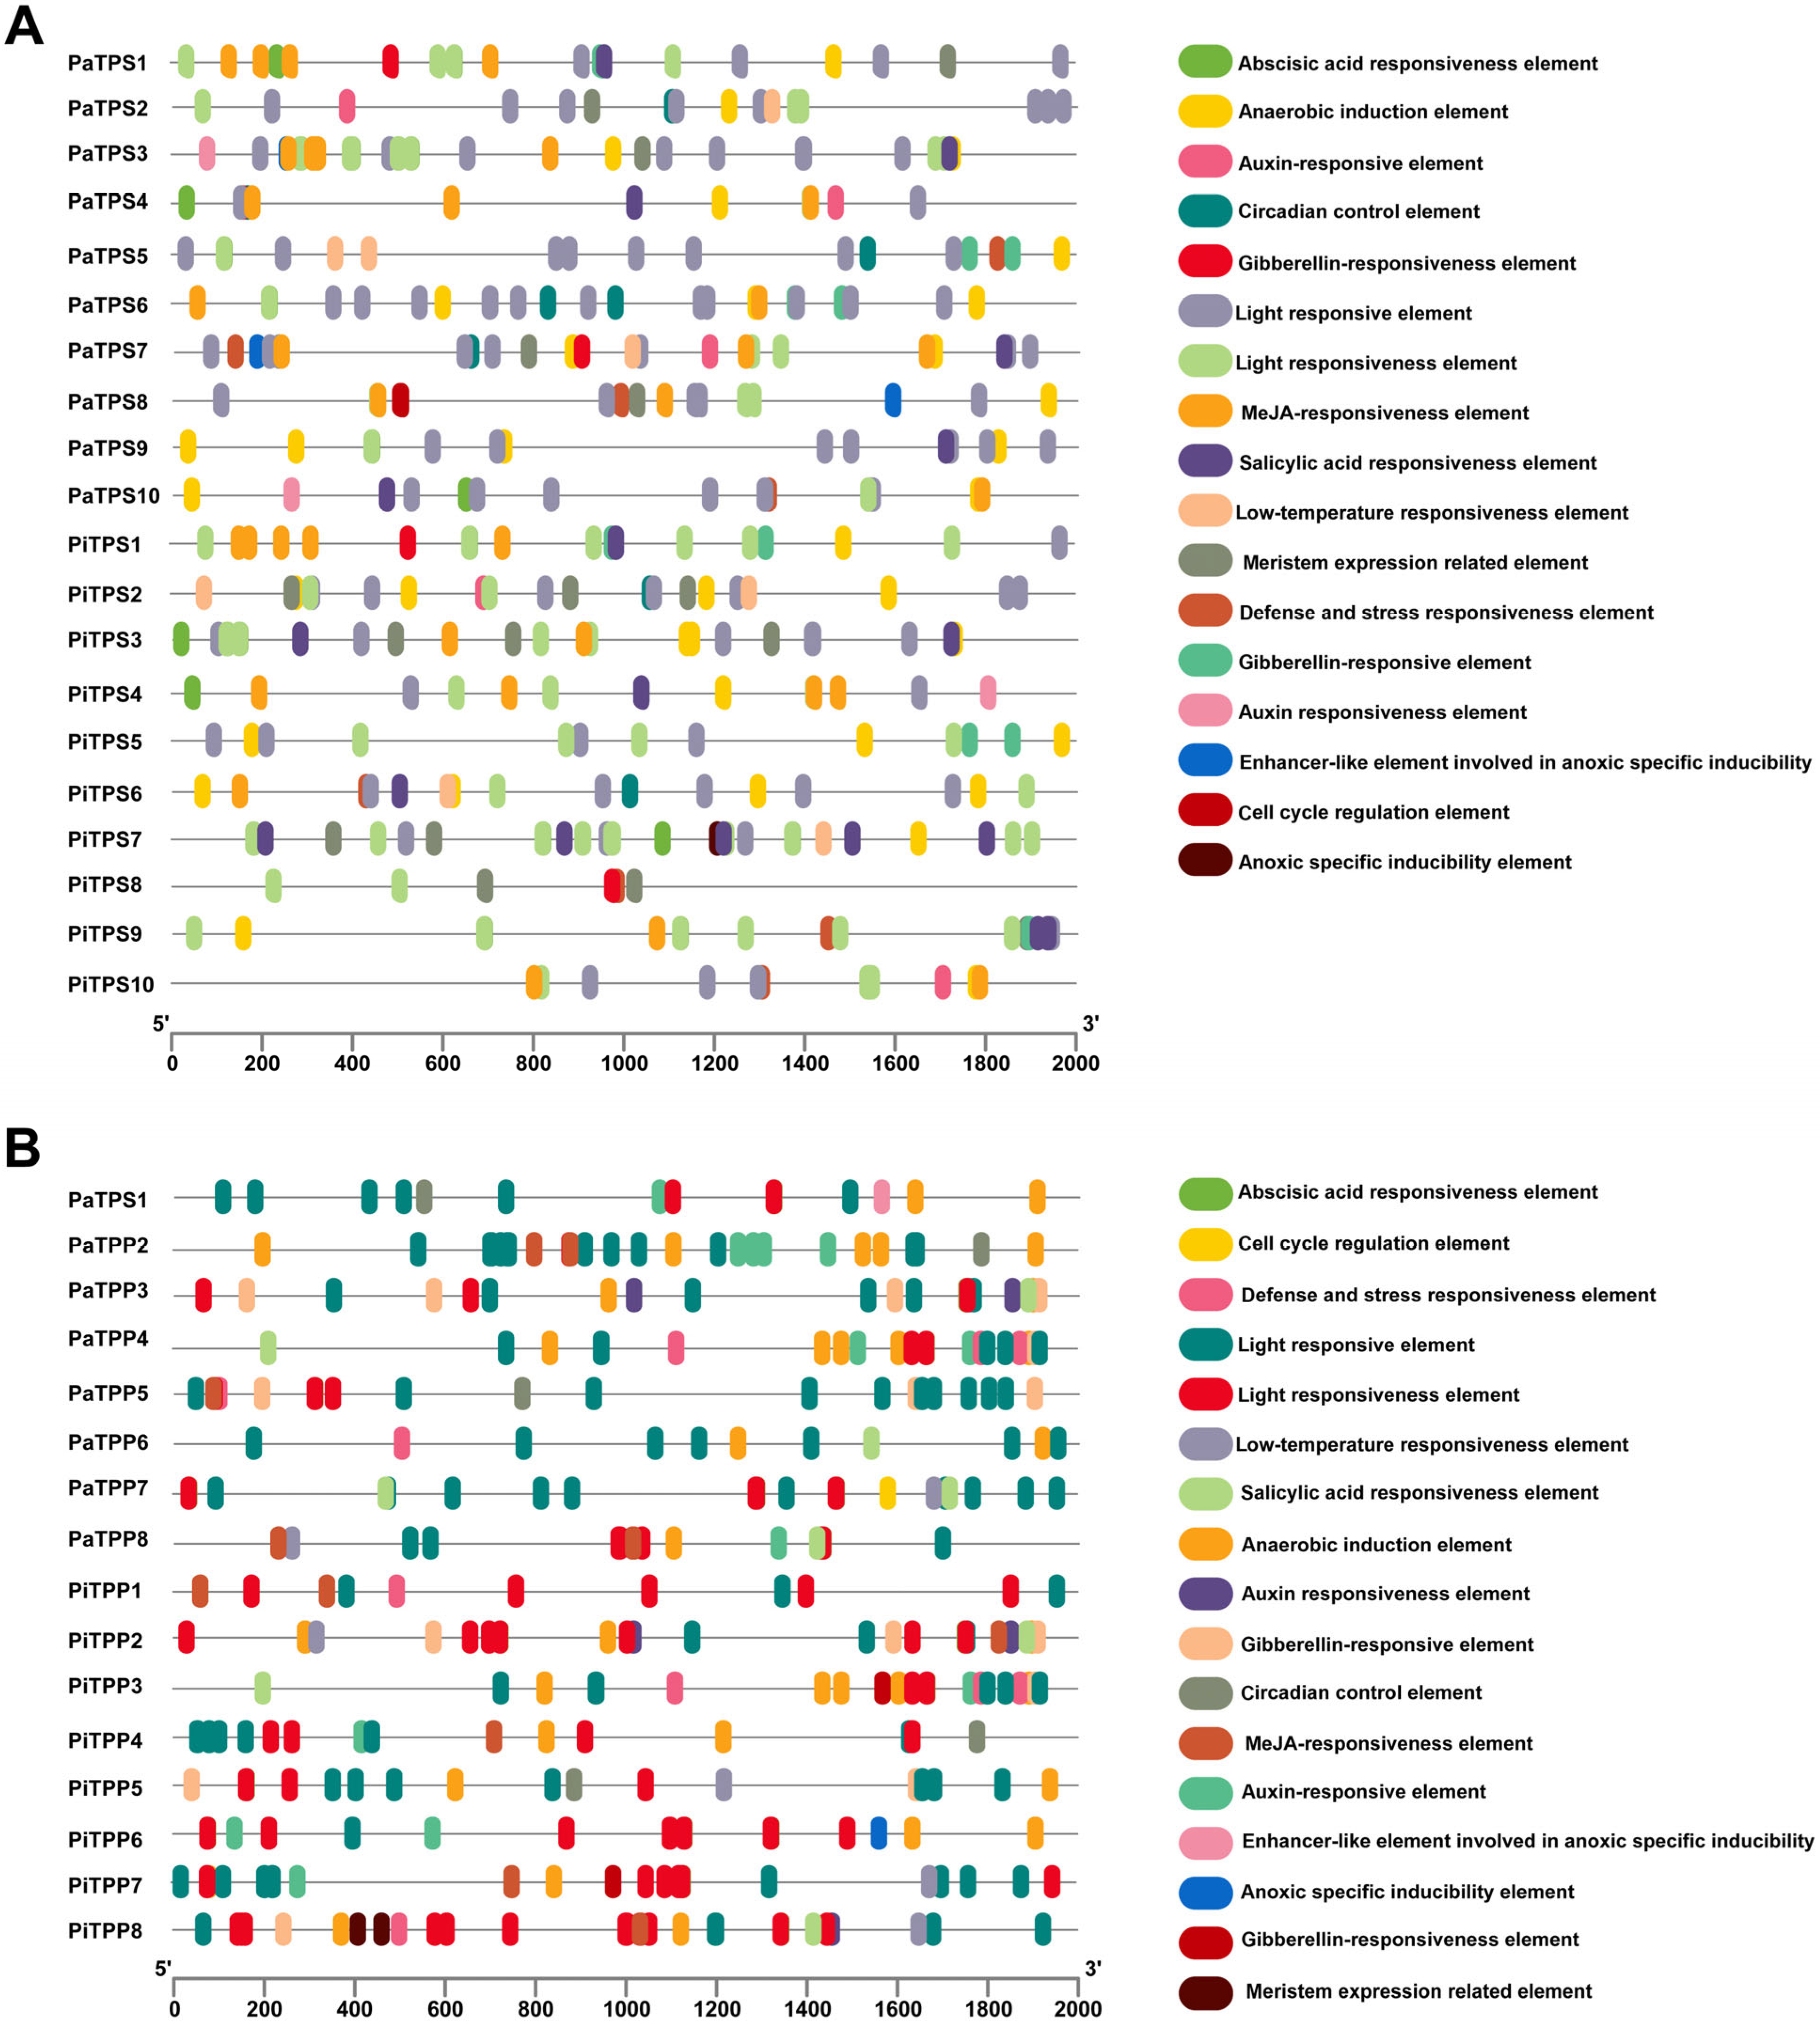
3.4. Cis-Acting Elements Analysis of TPSs and TPPs

Cis-acting elements were analyzed for a better understanding of their regulatory mechanisms against the TPS and TPP gene expression in petunia (Figure 3, Table S3). In the TPS genes, most of the cis-acting elements regulate plants’ hormone responses and stress responses, which include hormone-responsive elements of abscisic acid (ABRE), auxin (AuxRR-core and TGA-element), gibberellin (GARE-motif, P-box, and TATC-box), methyl jasmonate (CGTCA-motif and TGACG-motif), and salicylic acid (TCA-element), as well as stress-associated elements like anaerobic induction (ARE), defense and stress responsiveness (TC-rich repeats), light response (C-box, G-box, GT1-motif, ect), low-temperature responsiveness (LTR). In the TPP genes, the cis-acting elements also affect plants’ hormone responses and stress responses, with the most abundant category also related to light responses, similar to the TPS genes.

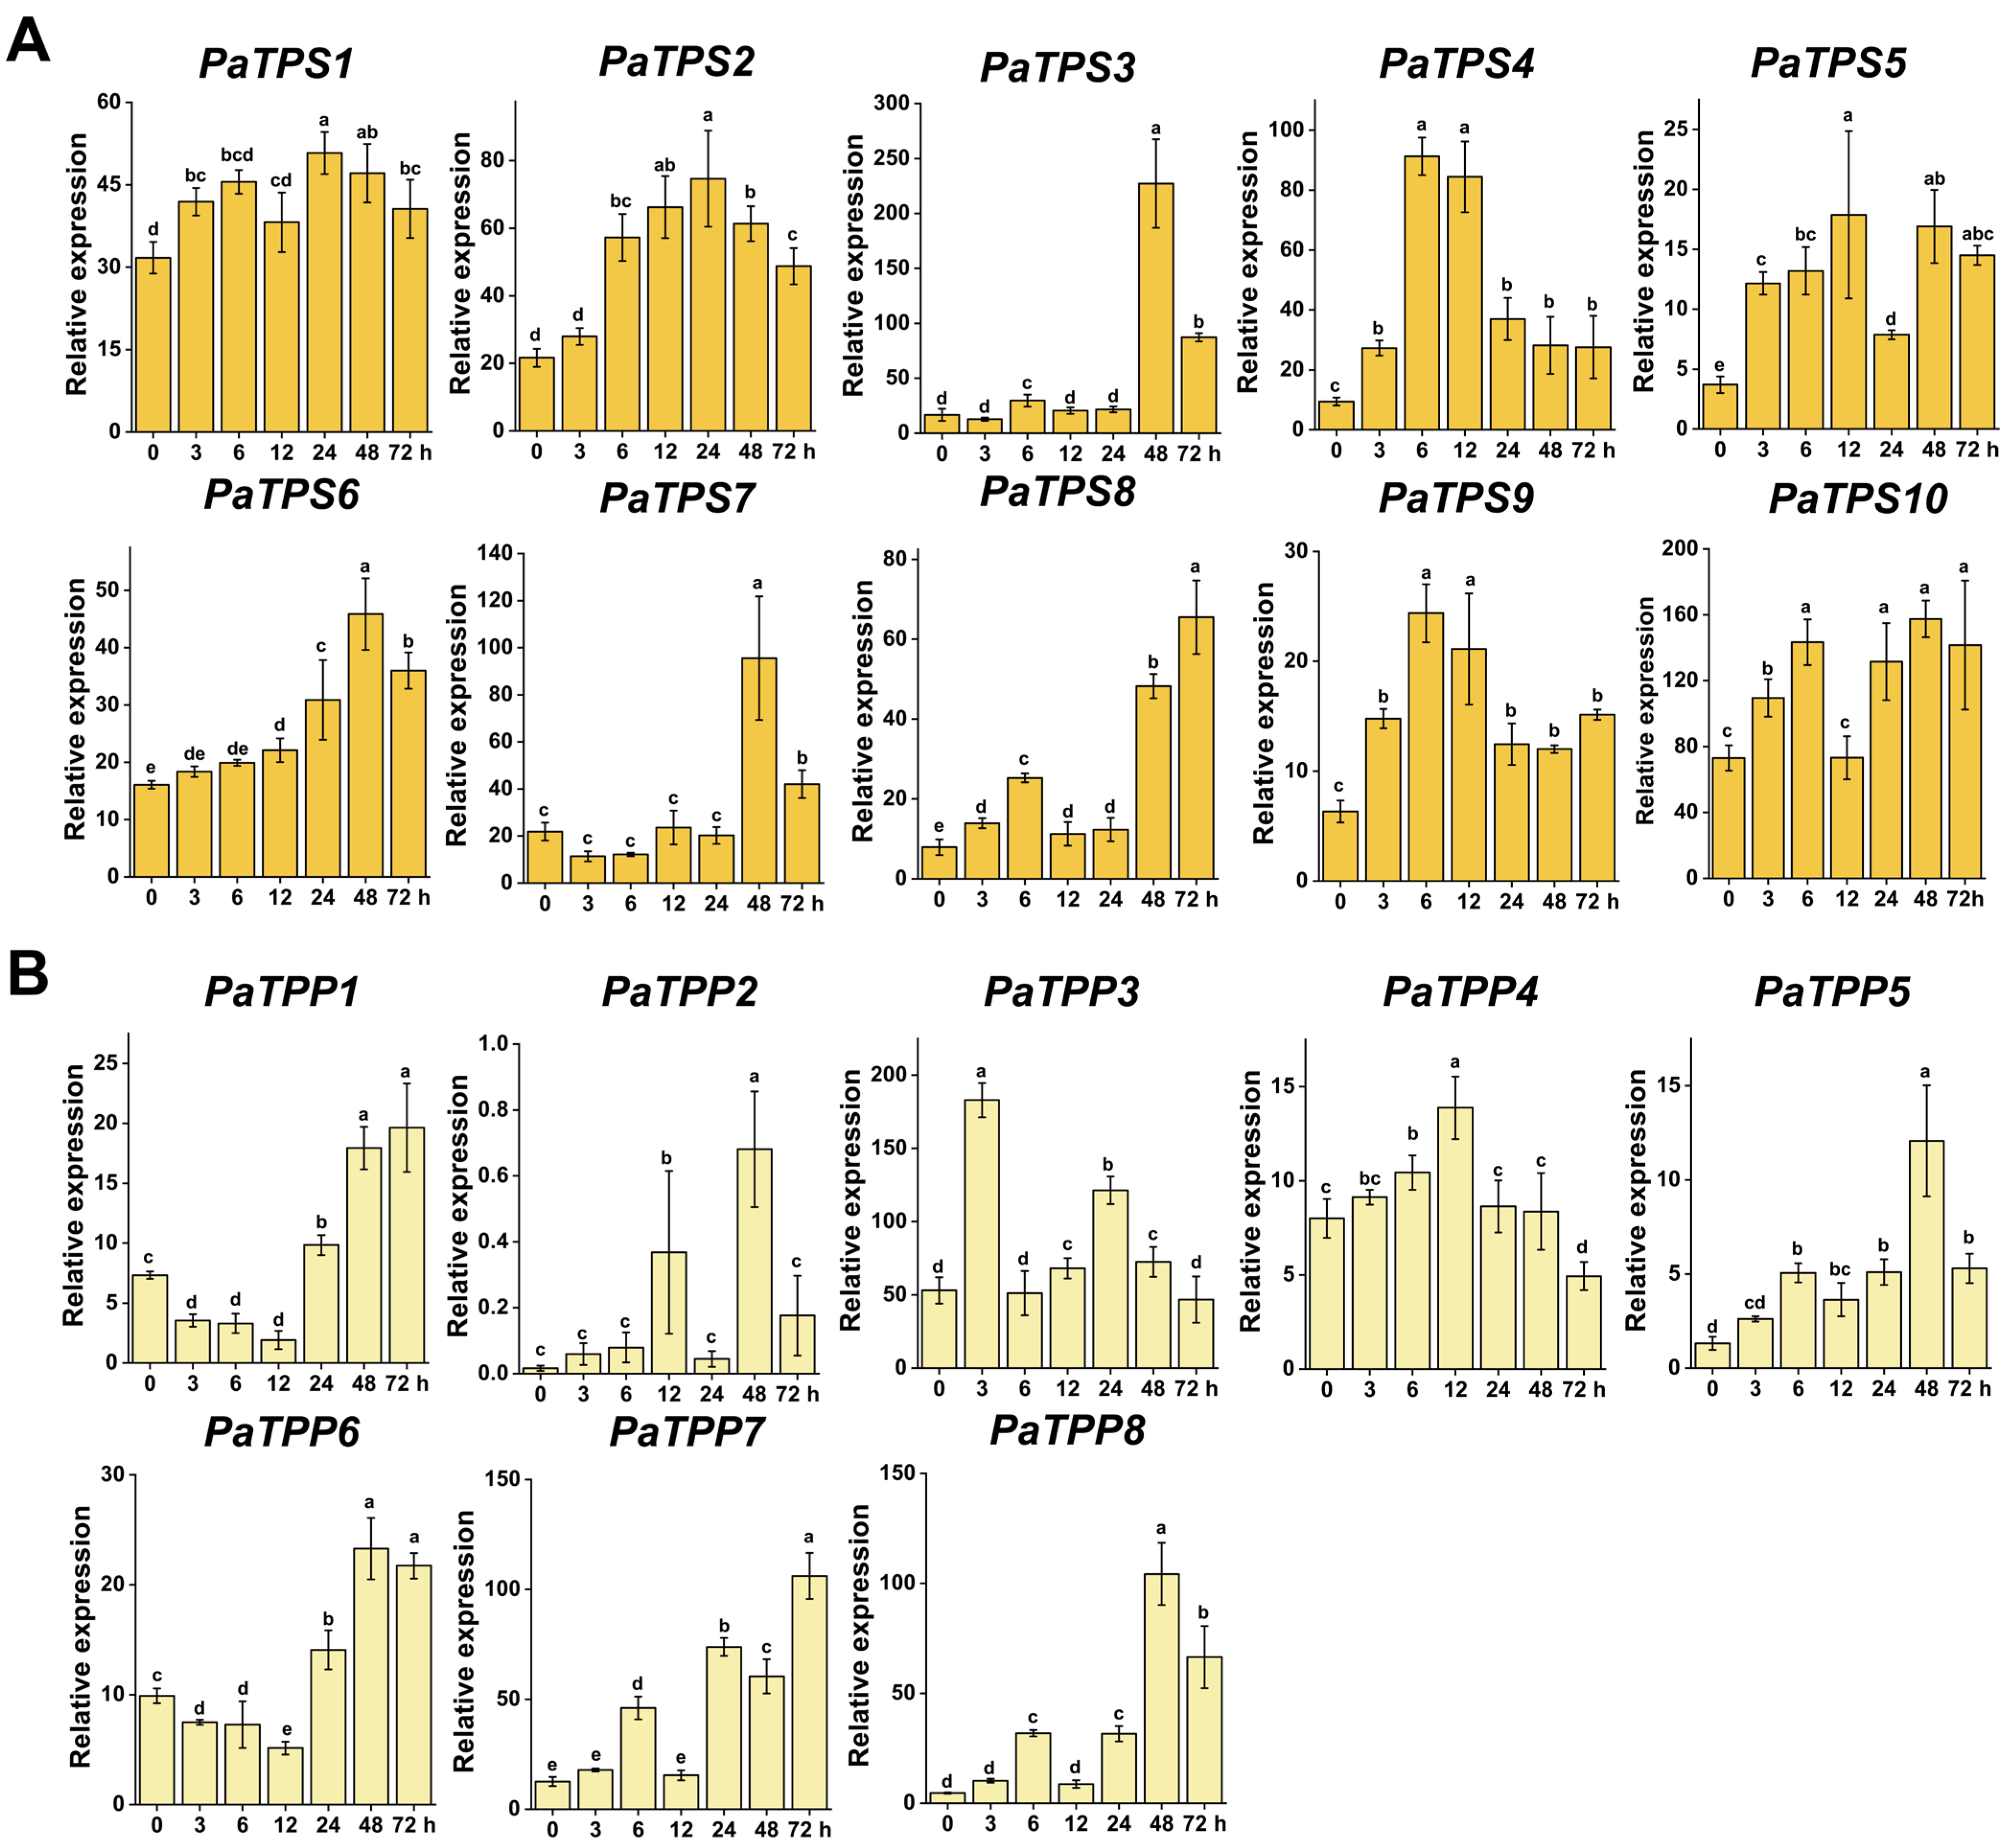
3.5. TPSs and TPPs Expression Pattern Analysis Under Different Stresses

The two genome sequences were compared with transcriptomics data from three unrelated P. hybrida lines—‘Mitchell Diploid’, ‘R27’, and ‘R143’, confirming the slim contribution of the P. inflata parent to the P. hybrida gene space [23]. With the objective of elucidating the expression patterns pertaining to petunia TPS and TPP family members during abiotic stress, including heat, salt, and drought stress in petunia ‘Mitchell Diploid’, we designed the primers according to the TPS and TPP genes in P. axillaris for real-time PCR analysis (Figure 4, Figure 5 and Figure 6). Given that primer design was exclusively based on P. axillaris TPS/TPP gene sequences, we retained the prefix ‘Pa’ for all expression analysis targets.

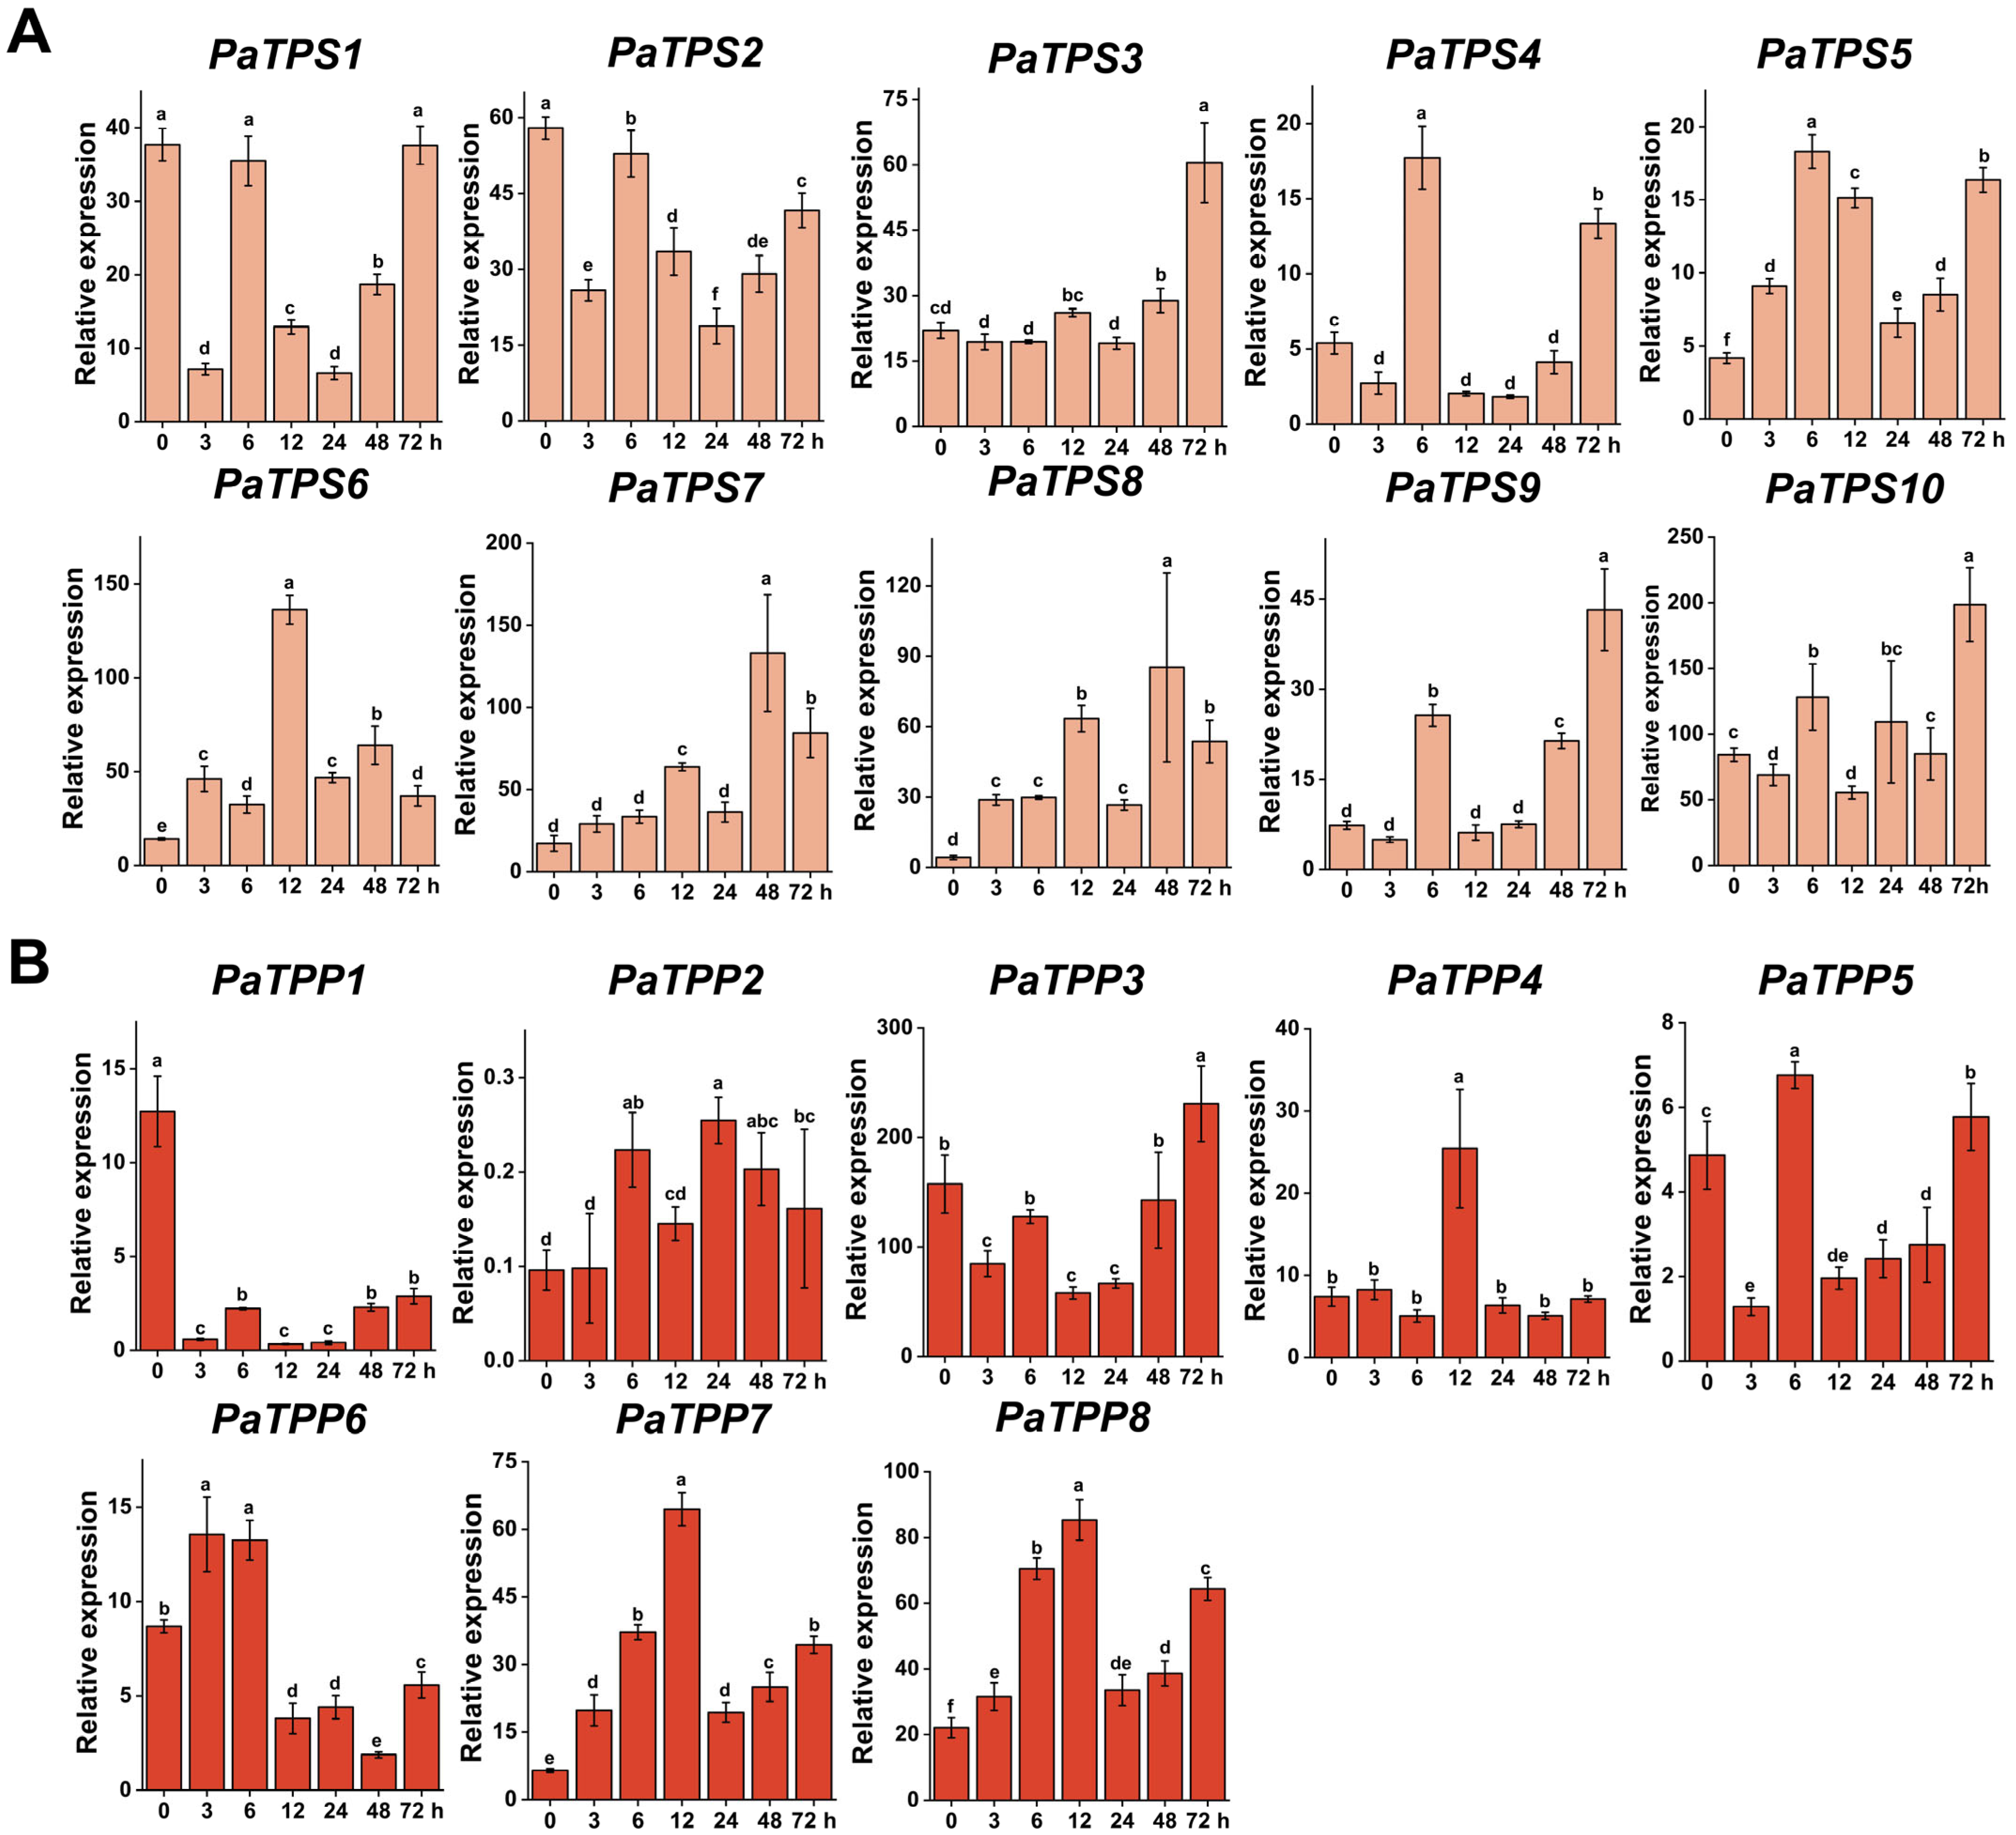
3.5.1. Drought Stress
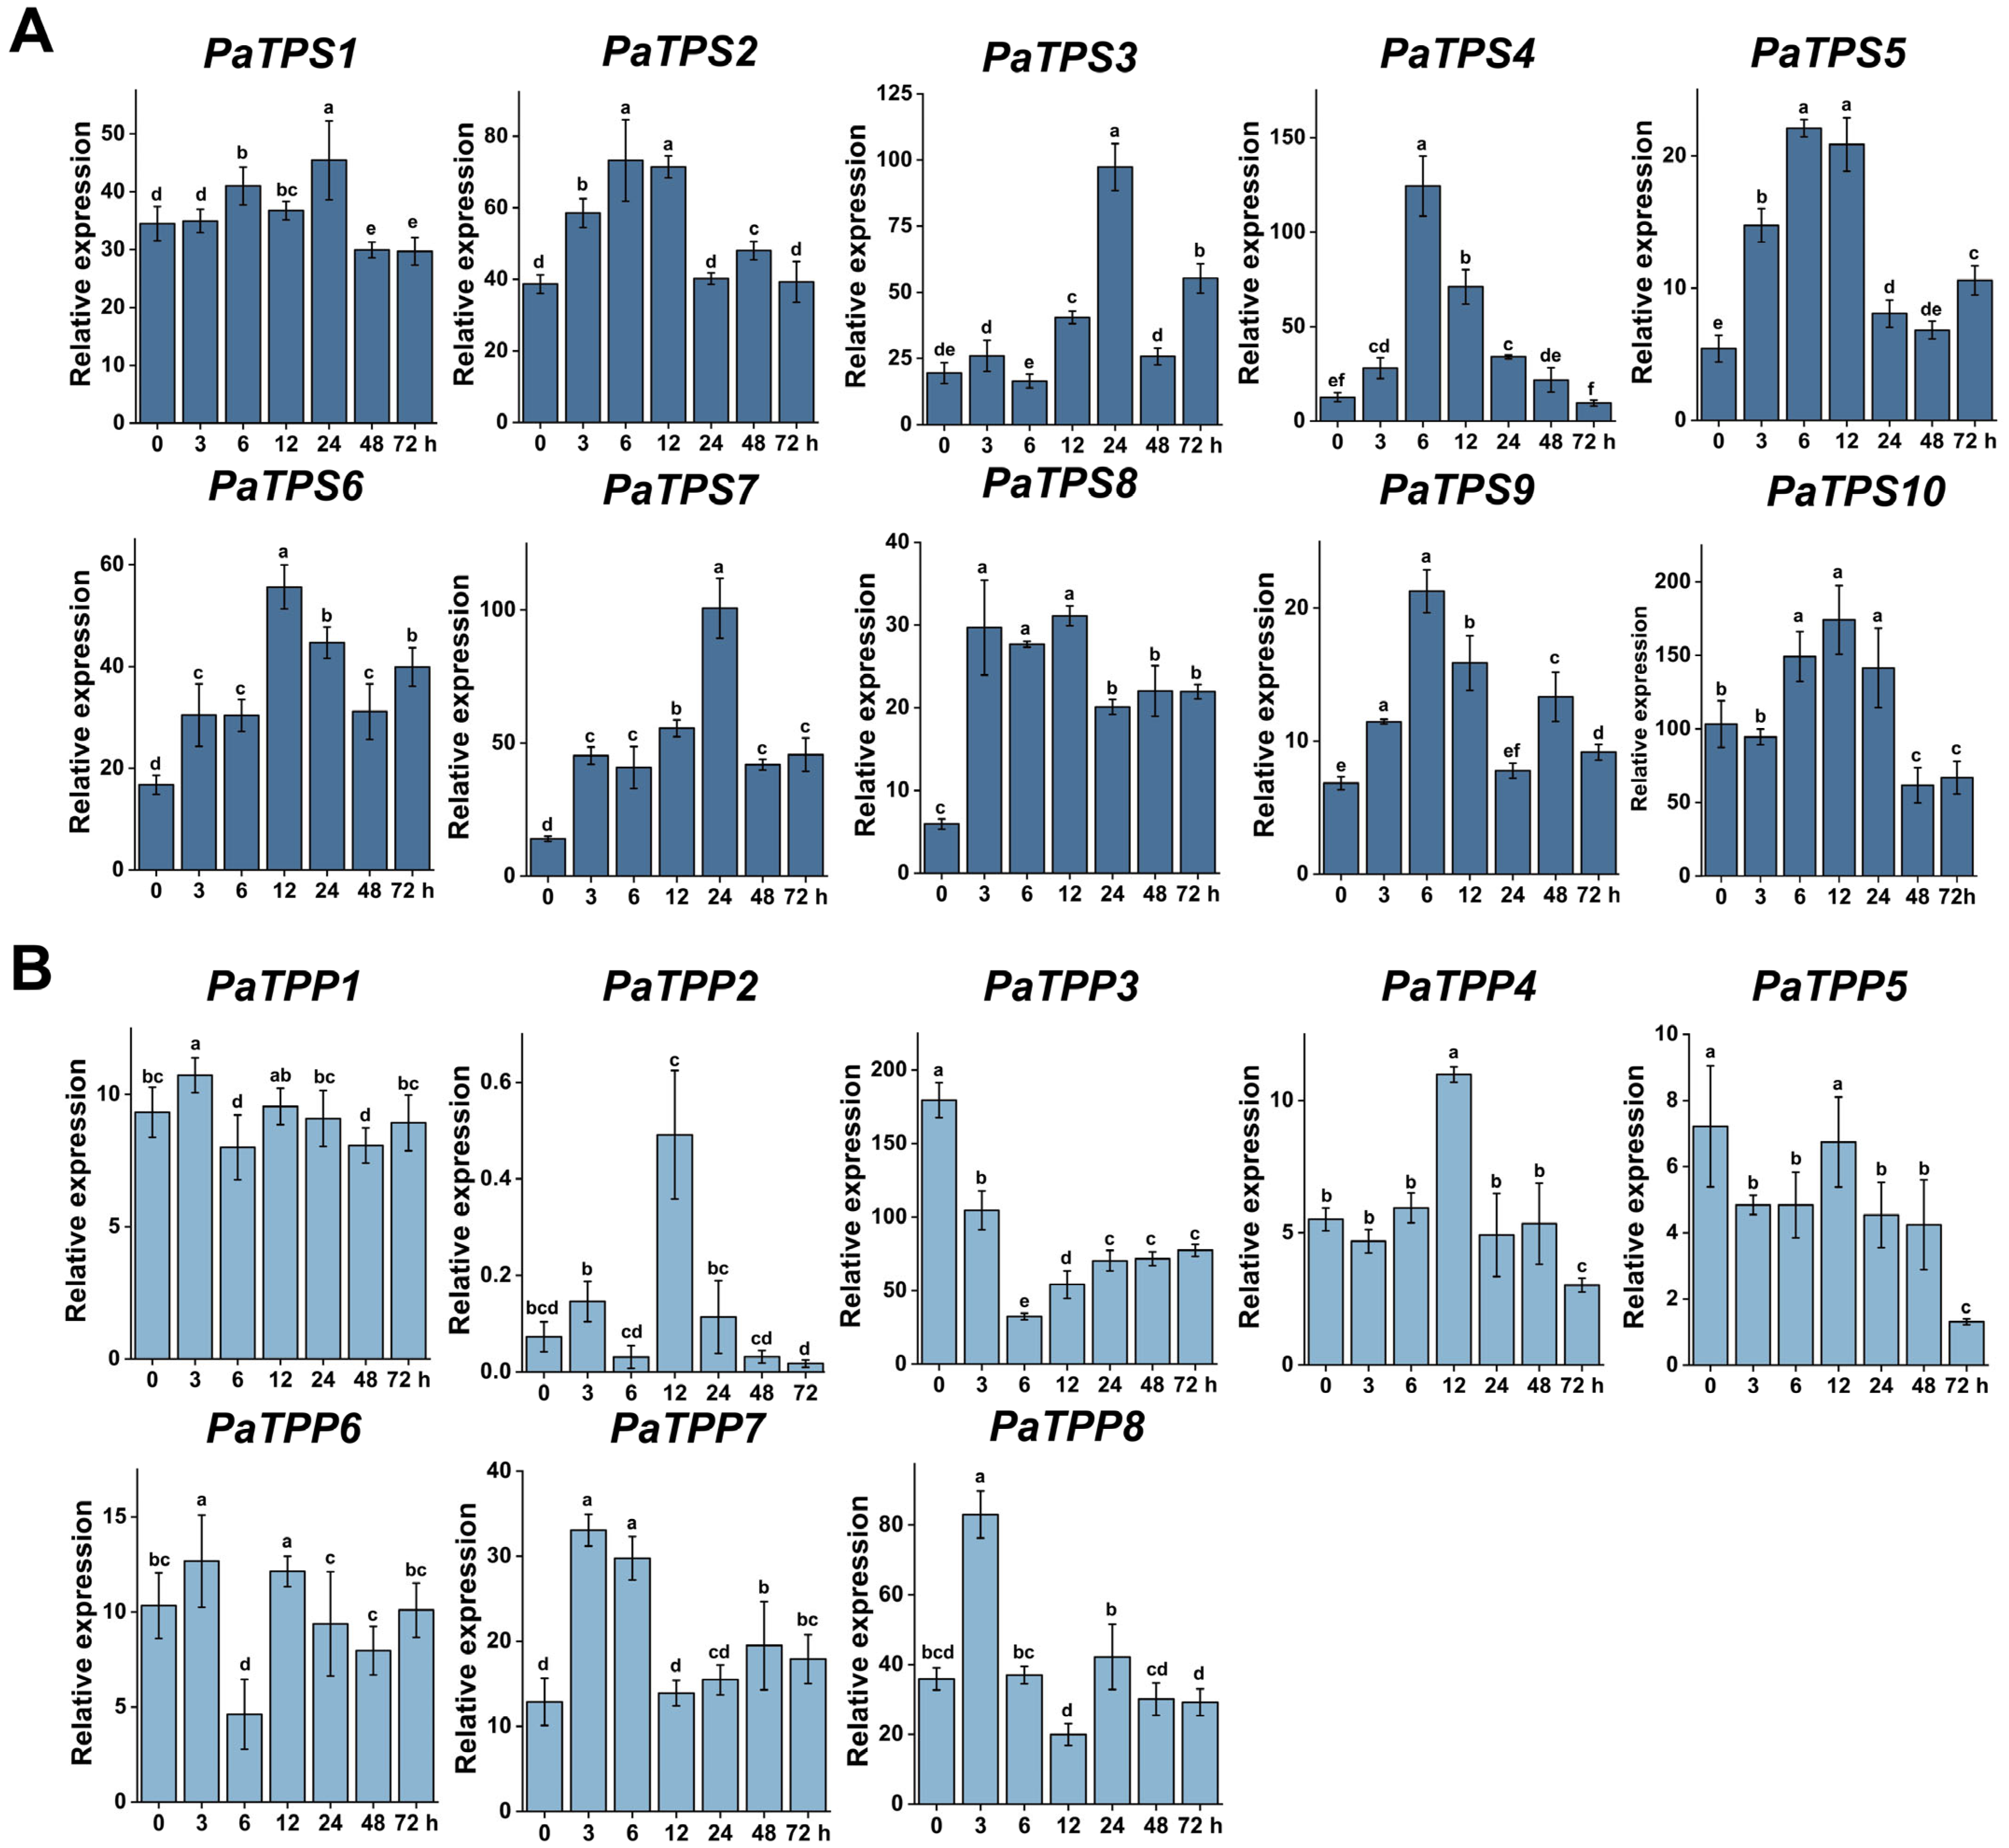
In the PaTPS genes, all genes except PaTPS1 showed upregulation in expression levels under drought treatment. Among them, PaTPS4 and PaTPS9 reached their peak expression at 6 h, PaTPS5 at 12 h, PaTPS2 at 24 h, and others at 48 or 72 h, indicative of their relatively similar expression pattern (Figure 4A). In the PaTPP genes, all genes showed upregulated expression. Among them, PaTPP3 reached its peak expression at 3 h, PaTPP4 at 12 h, and others at 48 or 72 h, displaying a similar expression pattern (Figure 4B).

3.5.2. Heat Stress

In the PaTPS genes, PaTPS1-2 showed downregulated expression under high-temperature treatment, while the other genes were also upregulated. Among the upregulated genes, PaTPS4 and PaTPS5 reached their peak expression at 6 h, PaTPS6 at 12 h, and PaTPS3, PaTPS7-10 at 48 or 72 h (Figure 5A). In the PaTPP genes, except for PaTPP1, which showed downregulation, all other PaTPP genes exhibited upregulation under high-temperature treatment. Among the upregulated genes, all except PaTPP3 reached their peak expression within 24 h, with PaTPP3 peaking at 72 h (Figure 5B).

3.5.3. Salt Stress

In the PaTPS genes, except for PaTPS1, all other PaTPS genes presented significantly upregulated expression under salt treatment. Among them, PaTPS2, PaTPS4-5, and PaTPS9 reached their peak expression at 6 h, PaTPS6 and PaTPS10 at 12 h, and PaTPS3 and PaTPS7 at 24 h. Notably, PaTPS8 reached its peak expression at 3 h and remained highly expressed throughout the treatment (Figure 6A). In the PaTPP genes, the expression of PaTPP1 and PaTPP5 showed no significant change, while PaTPP3 was significantly downregulated. The expression level of PaTPP6 was significantly downregulated at 6h, and then displayed transient upregulation at 12h, followed by a return to initial levels at 24 h, 48 h, and 72 h. The remaining genes exhibited significant upregulation, with PaTPP7-8 reaching their peak expression at 3 h, and PaTPP2 and PaTPP4 at 12 h (Figure 6B).

4. Discussion

Trehalose metabolism, mediated by TPS and TPP, pivotally affects plant growth, development, and stress responses [35,36]. TPS and TPP family genes can crucially regulate trehalose synthesis, and the relevant transcription and expression undergo differential regulation under varying abiotic stresses [16]. Extensive research has paid attention to the TPS and TPP gene family in Arabidopsis [10,11], rice [13,15], wheat [37,38], tomato [39], and peanut [40], etc., after the whole genome sequencing. However, these gene families remain underexplored in ornamental species, such as petunia. Therefore, the TPS and TPP genes in two petunia genomes are subjected to comprehensive genome-wide analysis in the study, shedding light on their evolutionary relationships, structural features, and stress-responsive expression patterns.
The study identified 10 PaTPS genes and 8 PaTPP genes in the P. axillaris genome, and 10 PiTPS genes and 9 PiTPP genes in the P. inflata genome. Phylogenetic analysis classified petunia TPS proteins into two clades and TPP proteins into three clades, consistent with patterns observed in Arabidopsis and rice, etc. [10,11,13,15]. The close evolutionary relationship between petunia and tomato TPS/TPP proteins suggests conserved functional mechanisms within the Solanaceae family [41]. The diversity of exons and introns greatly affects the way gene families evolve [42]. Analyzing the structure of genes can help elucidate their functions [43]. Notably, Class I TPS genes (e.g., Pa/PiTPS9-10) exhibited more complex gene structures (17–19 exons) compared to Class II genes (3 exons), reflecting potential functional specialization. Similarly, TPP genes displayed clade-specific structural variations, with Class III genes (e.g., Pa/PiTPP5) showing fewer exons, possibly linked to functional divergence. Conserved motif analysis further underscored functional diversification. While most TPS proteins retained all 10 motifs, Pa/PiTPS9-10 lacked two key motifs, suggesting potential functional redundancy or neofunctionalization. In contrast, TPP proteins exhibited fewer motifs, with Pa/PiTPP2 having the least, indicating lineage-specific evolutionary pressures. These structural variations likely trigger the functional specialization of TPS and TPP proteins in stress responses.
We analyzed the promoter cis-acting elements and expression patterns with regard to the TPS and TPP gene families under varying stress conditions, confirming their crucial function in petunia growth and development, hormone regulation, and stress responses. Cis-acting element analysis elucidates the regulation of TPS and TPP genes by hormone-responsive (e.g., ABRE, AuxRR-core) and stress-related elements (e.g., TC-rich repeats, LTR), implicating their roles in abiotic stress signaling. The abundance of light-responsive elements suggests additional roles in photomorphogenesis, consistent with trehalose’s involvement in carbon metabolism and energy homeostasis [44]. These regulatory features provide a molecular basis for the stress-responsive expression patterns observed in this study. Regulating TPS and TPP genes strengthens plants’ tolerance to abiotic stress [12,17,18,19,20]. Our expression analysis under drought, heat, and salt stresses revealed dynamic and stress-specific regulation of these gene families. In drought stress conditions, most TPS and TPP genes were upregulated, with PaTPS4/9 and PaTPP3 emerging as early responders. This rapid induction likely facilitates osmotic adjustment and cellular protection, consistent with trehalose’s role in stabilizing membranes and proteins under water deficit [45,46]. Heat stress uniquely suppressed PaTPS1-2 and PaTPP1, while upregulating other members, such as PaTPS4-5/9 and PaTPP3. The delayed induction of PaTPP3 (peak at 72 h) suggests a specialized role in long-term thermotolerance, possibly through trehalose-mediated protein stabilization or reactive oxygen species (ROS) scavenging [47,48]. Salt stress triggered significant upregulation of TPS genes, with PaTPS8 showing sustained high expression, indicating its potential role in ion homeostasis and Na+ compartmentalization. In contrast, the downregulation of PaTPP3/6 under salt stress may reflect a regulatory mechanism to maintain T6P levels for signaling while limiting trehalose accumulation, which could otherwise impose a metabolic burden [49,50]. While this study delineates the expression dynamics of TPS/TPP genes under controlled abiotic stresses, future studies are suggested to perform functional validation by virtue of CRISPR/Cas9-mediated gene editing or overexpression approaches, aiming at interpreting their exact mechanisms in stress adaptation.

Supplementary Materials

The following supporting information can be downloaded at: https://www.mdpi.com/article/10.3390/horticulturae11060695/s1, Table S1: Real-time PCR primers for TPS and TPS genes in petunia; Table S2: List of the conserved motifs of TPS and TPP proteins in petunia; Table S3: List of the cis-acting elements of TPS and TPP genes in petunia.

Author Contributions

Conceptualization, N.S.M. and D.L.; formal analysis, R.H. and D.L.; investigation, D.L.; writing-original draft preparation, D.L. and R.H.; writing-review and editing, R.H., G.H.V. and N.S.M.; visualization, R.H. and D.L.; supervision, project administration, and funding acquisition, N.S.M. All authors have read and agreed to the published version of the manuscript.

Funding

This work was supported under Accession Number 7005941 by the Cornell University Agricultural Experiment Station (Hatch/Multistate funds) received from the National Institute of Food and Agriculture (NIFA), U.S. Department of Agriculture (USDA). Any opinions, findings, conclusions, or suggestions in this publication are those of the authors and do not always represent the view of the USDA. The APC was funded by the High-Level Talent Introduction Program of Chengdu Normal University (YJRC2020-22) and the Sichuan Science and Technology Program (2023JDRC0114).

Data Availability Statement

All data that support this research result are available in the article and within its Supplementary Materials published online.

Conflicts of Interest

The authors declare no conflict of interest.

References

  1. Paul, M.; Pellny, T.; Goddijn, O. Enhancing photosynthesis with sugar signals. Trends Plant Sci. 2001, 6, 197–200. [Google Scholar] [CrossRef] [PubMed]
  2. Elbein, A.D.; Pan, Y.; Pastuszak, I.; Carroll, D. New insights on trehalose: A multifunctional molecule. Glycobiology 2003, 13, 17R–27R. [Google Scholar] [CrossRef] [PubMed]
  3. O’Hara, L.E.; Paul, M.J.; Wingler, A. How do sugars regulate plant growth and development? New insight into the role of trehalose-6-phosphate. Mol. Plant 2013, 6, 261–274. [Google Scholar] [CrossRef]
  4. Fernandez, O.; Bethencourt, L.; Quero, A.; Sangwan, R.S.; Clement, C. Trehalose and plant stress responses: Friend or foe? Trends Plant Sci. 2010, 15, 409–417. [Google Scholar] [CrossRef]
  5. Kosar, F.; Akram, N.A.; Sadiq, M.; Al-Qurainy, F.; Ashraf, M. Trehalose: A key organic osmolyte effectively involved in plant abiotic stress tolerance. J. Plant Growth Regul. 2019, 38, 606–618. [Google Scholar] [CrossRef]
  6. Villarino, G.H.; Bombarely, A.; Giovannoni, J.J.; Scanlon, M.J.; Mattson, N.S. Transcriptomic analysis of Petunia hybrida in response to salt stress using high throughput RNA sequencing. PLoS ONE 2014, 9, e94651. [Google Scholar] [CrossRef]
  7. Villarino, G.; Hu, Q.W.; Scanlon, M.; Mueller, L.A.; Bombarely, A.; Mattson, N.S. Dissecting tissue-specific transcriptomic responses from leaf and roots under salt stress in Petunia hybrida Mitchell. Genes 2017, 8, 195. [Google Scholar] [CrossRef]
  8. Smeekens, S. From leaf to kernel: Trehalose-6-phosphate signaling moves carbon in the field. Plant Physiol. 2015, 169, 912–913. [Google Scholar] [CrossRef]
  9. Avonce, N.; Mendoza-Vargas, A.; Morett, E.; Iturriaga, G. Insights on the evolution of trehalose biosynthesis. BMC Evol. Biol. 2006, 6, 109. [Google Scholar] [CrossRef]
  10. Vandesteene, L.; Ramon, M.; Roy, K.L.; Dijck, P.V.; Rolland, F. A single active trehalose-6-P synthase (TPS) and a family of putative regulatory TPS-like proteins in Arabidopsis. Mol. Plant 2010, 3, 406–419. [Google Scholar] [CrossRef]
  11. Vandesteene, L.; Lopez-Galvis, L.; Vanneste, K.; Feil, R.; Maere, S.; Lammens, W. Expansive evolution of the trehalose-6-phosphate phosphatase gene family in Arabidopsis. Plant Physiol. 2012, 160, 884–896. [Google Scholar] [CrossRef] [PubMed]
  12. Ge, L.F.; Chao, D.Y.; Shi, M.; Zhu, M.Z.; Gao, J.P.; Lin, H.X. Overexpression of the trehalose-6-phosphate phosphatase gene OsTPP1 confers stress tolerance in rice and results in the activation of stress responsive genes. Planta 2008, 228, 191–201. [Google Scholar] [CrossRef] [PubMed]
  13. Zang, B.; Li, H.; Li, W.; Deng, X.W.; Wang, X. Analysis of trehalose-6-phosphate synthase (TPS) gene family suggests the formation of TPS complexes in rice. Plant Mol. Biol. 2011, 76, 507–522. [Google Scholar] [CrossRef]
  14. Dijck, P.V. The cytophaga hutchinsonii chtpsp: First characterized bifunctional TPS-TPP protein as putative ancestor of all eukaryotic trehalose biosynthesis proteins. Mol. Biol. Evol. 2010, 27, 359–369. [Google Scholar]
  15. Shima, S.; Matsui, H.; Tahara, Y.; Imai, R. Biochemical characterization of rice trehalose-6-phosphate phosphatases supports distinctive functions of these plant enzymes. FEBS J. 2007, 274, 1192–1201. [Google Scholar] [CrossRef]
  16. Iordachescu, M.; Imai, R. Trehalose biosynthesis in response to abiotic stresses. J. Integr. Plant Biol. 2008, 50, 1223–1229. [Google Scholar] [CrossRef]
  17. Li, H.W.; Zang, B.S.; Deng, X.W.; Wang, X.P. Overexpression of the trehalose-6-phosphate synthase gene OsTPS1 enhances abiotic stress tolerance in rice. Planta 2011, 234, 1007–1018. [Google Scholar] [CrossRef]
  18. Jiang, D.; Chen, W.; Gao, J.; Yang, F.; Zhuang, C. Overexpression of the trehalose-6-phosphate phosphatase OsTPP3 increases drought tolerance in rice. Plant Biotechnol. Rep. 2019, 13, 285–292. [Google Scholar] [CrossRef]
  19. Lin, Q.; Wang, S.; Dao, Y.; Wang, J.; Wang, K. The Arabidopsis thaliana trehalose-6-phosphate phosphatase gene AtTPP1 enhances drought tolerance by regulating stomatal apertures. J. Exp. Bot. 2020, 71, 1795–1807. [Google Scholar] [CrossRef]
  20. Lin, Q.; Yang, J.; Wang, Q.; Zhu, H.; Chen, Z.; Dao, Y.; Wang, K. Overexpression of the trehalose-6-phosphate phosphatase family gene AtTPPF improves the drought tolerance of Arabidopsis thaliana. BMC Plant Biol. 2019, 19, 381. [Google Scholar] [CrossRef]
  21. Li, J.; Guo, H.F.; Lou, Q.J.; Zeng, Y.W.; Guo, Z.H.; Xu, P.H.; Gu, Y.; Gao, S.; Xu, B.; Han, S.; et al. Natural variation of indels in the CTB3 promoter confers cold tolerance in japonica rice. Nat. Commun. 2025, 16, 1613. [Google Scholar] [CrossRef] [PubMed]
  22. Cao, Z.; Guo, Y.F.; Yang, Q.; He, Y.H.; Fetouh, M.I.; Warner, R.M.; Deng, Z. Genome-wide identification of quantitative trait loci for important plant and flower traits in petunia using a high-density linkage map and an interspecific recombinant inbred population derived from Petunia integrifolia and P. axillaris. Hortic. Res. 2019, 6, 27. [Google Scholar] [CrossRef] [PubMed]
  23. Zentella, R.; Mascorro-Gallardo, J.O.; Van Dijck, P.; Folch-Mallol, J.; Bonini, B.; Van Vaeck, C.; Gaxiola, R.; Covarrubias, A.A.; Nieto-Sotelo, J.; Thevelein, J.M.; et al. A Selaginella lepidophylla trehalose-6-phosphate synthase complements growth and stress-tolerance defects in a yeast tps1 mutant. Plant Physiol. 1999, 119, 1473–1482. [Google Scholar] [CrossRef]
  24. Bombarely, A.; Moser, M.; Amrad, A.; Bao, M.; Bapaume, L.; Barry, C.S.; Bliek, M.; Boersma, M.R.; Borghi, L.; Bruggmann, R.; et al. Insight into the evolution of the Solanaceae from the parental genomes of Petunia hybrida. Nat. Plants 2016, 2, 16074. [Google Scholar] [CrossRef]
  25. Berardi, A.E.; Korinna, E.; Lea, J.; Therese, M.; Cannarozzi, G.M.; Cris, K. Complex evolution of novel red floral color in petunia. Plant Cell 2021, 33, 2273–2295. [Google Scholar] [CrossRef]
  26. Patrick, R.M.; Xing-Qi, H.; Natalia, D.; Ying, L. Dynamic histone acetylation in floral volatile synthesis and emission in petunia flowers. J. Exp. Bot. 2021, 72, 3704–3718. [Google Scholar] [CrossRef]
  27. Thompson, J.D.; Gibson, T.J.; Higgins, D.G. Multiple sequence alignment using ClustalW and ClustalX. Curr. Protoc. Bioinform. 2003, 2, 2–3. [Google Scholar] [CrossRef]
  28. Lu, S.; Wang, J.; Chitsaz, F.; Derbyshire, M.K.; Geer, R.C.; Gonzales, N.R.; Gwadz, M.; Hurwitz, D.I.; Marchler, G.H.; Song, J.S.; et al. CDD/SPARCLE: The conserved domain database in 2020. Nucleic Acids Res. 2020, 48, 265–268. [Google Scholar] [CrossRef]
  29. Ivica, L.; Peer, B. Interactive tree of life (iTOL) v6: Recent updates to the phylogenetic tree display and annotation tool. Nucleic Acids Res. 2024, 52, W78–W82. [Google Scholar]
  30. Hu, B.; Jin, J.; Guo, A.-Y.; Zhang, H.; Luo, J.; Gao, G. GSDS 2.0: An upgraded gene feature visualization server. Bioinformatics 2015, 31, 1296–1297. [Google Scholar]
  31. Bailey, T.L.; Boden, M.; Buske, F.A.; Frith, M.; Grant, C.E.; Clementi, L.; Ren, J.; Li, W.W.; Noble, W.S. MEME Suite: Tools for motif discovery and searching. Nucleic Acids Res. 2009, 37, W202–W208. [Google Scholar] [CrossRef] [PubMed]
  32. Chen, C.; Chen, H.; Zhang, Y.; Thomas, H.R.; Frank, M.H.; He, Y.; Xia, R. TBtools: An integrative toolkit developed for interactive analyses of big biological data. Mol. Plant 2020, 13, 1194–1202. [Google Scholar] [CrossRef] [PubMed]
  33. Lescot, M.; Déhais, P.; Thijs, G.; Marchal, K.; Moreau, Y.; Peer, Y.V.D.; Rouzé, P.; Rombauts, S. PlantCARE, a database of plant cis-acting regulatory elements and a portal to tools for in silico analysis of promoter sequences. Nucleic Acids Res. 2002, 30, 325–327. [Google Scholar] [CrossRef]
  34. Livak, K.L.; Schmittgen, T.D. Analysis of relative gene expression data using real-time quantitative PCR and the 2(-Delta Delta C(T)) Method. Methods 2001, 25, 402–408. [Google Scholar] [CrossRef]
  35. Sarkar, A.K.; Sadhukhan, S. Imperative role of trehalose metabolism and trehalose-6-phosphate signaling on salt stress responses in plants. Physiol. Plant. 2022, 174, e13647. [Google Scholar] [CrossRef]
  36. Fichtner, F.; Lunn, J.E. The role of trehalose 6-phosphate (tre6p) in plant metabolism and development. Annu. Rev. Plant Biol. 2021, 72, 737–760. [Google Scholar] [CrossRef]
  37. Zhao, L.; Zhao, X.; Francis, F.; Liu, Y. Genome-wide identification and characterization of the TPS gene family in wheat (Triticum aestivum L.) and expression analysis in response to aphid damage. Acta Physiol. Plant. 2021, 43, 64. [Google Scholar] [CrossRef]
  38. Du, L.; Li, S.; Ding, L.; Cheng, X.; Kang, Z.; Mao, H. Genome-wide analysis of trehalose-6-phosphate phosphatases (TPP) gene family in wheat indicates their roles in plant development and stress response. BMC Plant Biol. 2022, 22, 120. [Google Scholar] [CrossRef]
  39. Mollavali, M.; Börnke, F. Characterization of trehalose-6-phosphate synthase and trehalose-6-phosphate phosphatase genes of tomato (Solanum lycopersicum L.) and analysis of their differential expression in response to temperature. Int. J. Mol. Sci. 2022, 23, 11436. [Google Scholar] [CrossRef]
  40. Zhong, C.; He, Z.; Liu, Y.; Li, Z.; Wang, X.; Jiang, C.; Kang, S.; Liu, X.; Zhao, S.; Wang, J.; et al. Genome-wide identification of TPS and TPP genes in cultivated peanut (Arachis hypogaea) and functional characterization of AtTPS9 in response to cold stress. Front. Plant Sci. 2024, 14, 1343402. [Google Scholar] [CrossRef]
  41. Doganlar, S.; Frary, A.; Daunay, M.C.; Lester, R.N.; Tanksley, S.D. Conservation of gene function in the solanaceae as revealed by comparative mapping of domestication traits in eggplant. Genetics 2002, 161, 1713–1726. [Google Scholar] [CrossRef] [PubMed]
  42. Qi, L.; Chen, L.; Wang, C.; Zhang, S.; Yang, Y.; Liu, J.; Li, D.; Song, J.; Wang, R. Characterization of the auxin efflux transporter PIN proteins in pear. Plants 2020, 9, 349. [Google Scholar] [CrossRef] [PubMed]
  43. Li, Y.; Chen, D.; Luo, S.; Zhu, Y.; Jia, X.; Duan, Y.; Zhou, M. Intron-mediated regulation of β-tubulin genes expression affects the sensitivity to carbendazim in Fusarium graminearum. Curr. Genet. 2019, 65, 1057–1069. [Google Scholar] [CrossRef]
  44. Paul, M.J.; Primavesi, L.F.; Jhurreea, D.; Zhang, Y. Trehalose metabolism and signaling. Annu. Rev. Plant Biol. 2008, 59, 417–441. [Google Scholar] [CrossRef]
  45. Jain, N.K.; Roy, I. Effect of trehalose on protein structure. Protein Sci. 2010, 18, 24–36. [Google Scholar] [CrossRef]
  46. Sadak, M.S.; El-Bassiouny, H.M.S.; Dawood, M.G. Role of trehalose on antioxidant defense system and some osmolytes of quinoa plants under water deficit. Bull. Natl. Res. Cent. 2019, 43, 5. [Google Scholar] [CrossRef]
  47. Yang, Y.; Yao, Y.; Li, J.; Zhang, J.; Zhang, X.; Hu, L.; Ding, D.; Bakpa, E.P.; Xie, J. Trehalose alleviated salt stress in tomato by regulating ros metabolism, photosynthesis, osmolyte synthesis, and trehalose metabolic pathways. Front. Plant Sci. 2022, 13, 772948. [Google Scholar] [CrossRef]
  48. Nawaz, M.; Hassan, M.U.; Chattha, M.U.; Mahmood, A.; Shah, A.N.; Hashem, M.; Alamri, S.; Batool, M.; Rasheed, A.; Thabit, M.A.; et al. Trehalose: A promising osmo-protectant against salinity stress-physiological and molecular mechanisms and future prospective. Mol. Biol. Rep. 2022, 49, 11255–11271. [Google Scholar] [CrossRef]
  49. Schluepmann, H.; Berke, L.; Sanchez-Perez, G.F. Metabolism control over growth: A case for trehalose-6-phosphate in plants. J. Exp. Bot. 2012, 63, 3379–3390. [Google Scholar] [CrossRef]
  50. Paul, M. Trehalose 6-phosphate. Curr. Opin. Plant Biol. 2007, 3, 303–309. [Google Scholar] [CrossRef]
Figure 1. Phylogenetic analysis of TPS (A) and TPP (B) gene families in P. inflata, P. axillaris, Arabidopsis thaliana, Oryza sativa, Populus trichocarpa, and Solanum lycopersicum. Protein subfamilies are highlighted in distinct colors. The red, blue, orange, purple, and gray circles represent P. inflata (Pi) and P. axillaris (Pa), A. thaliana (At), S. lycopersicum (Sl), P. trichocarpa (Pt), and O. sativa (Os), respectively.
Horticulturae 11 00695 g001
Figure 2. Gene structure and protein motif of the TPS and TPP genes in petunia. Gene structure of (A) TPS genes and (C) TPP genes. Conserved motif of (B) TPS proteins and (D) TPP proteins.
Horticulturae 11 00695 g002
Figure 3. Cis-elements in the promoter regions of the TPS (A) and TPP (B) genes in petunia.
Horticulturae 11 00695 g003
Figure 4. Expression patterns of TPS (A) and TPP (B) genes under drought stress in petunia. Letters above the bars represent significant differences (p < 0.05).
Horticulturae 11 00695 g004
Figure 5. Expression patterns of TPS (A) and TPP (B) genes under heat stress in petunia. Letters above the bars represent significant differences (p < 0.05).
Horticulturae 11 00695 g005
Figure 6. Expression patterns of TPS (A) and TPP (B) genes under salt stress in petunia. Letters above the bars represent significant differences (p < 0.05).
Horticulturae 11 00695 g006
Table 1. Physicochemical properties of TPS proteins in the petunia genome.
Gene NameLocus_IDPositionLength
(AA)
MW
(Da)
pISubcellular Localization
Scaffold LocationStartEnd
PaTPS1Peaxi162Scf00229g00096.1Peaxi162Scf00229917,477925,13385196.935.58Cytoplasmic
PaTPS2Peaxi162Scf00469g00632.1Peaxi162Scf00469667,063671,24587198.925.72Nuclear
PaTPS3Peaxi162Scf00202g00187.1Peaxi162Scf002021,815,2191,819,74385596.395.70Cytoplasmic
PaTPS4Peaxi162Scf00170g01223.1Peaxi162Scf001701,214,4991,220,44886497.525.78Cytoplasmic
PaTPS5Peaxi162Scf00275g00085.1Peaxi162Scf00275813,026816,59285697.165.66Cytoplasmic
PaTPS6Peaxi162Scf00421g00116.1Peaxi162Scf00421104,373107,34985196.235.91Cytoplasmic
PaTPS7Peaxi162Scf00297g00098.1Peaxi162Scf00297982,826985,66686397.976.01Cytoplasmic
PaTPS8Peaxi162Scf00457g00215.1Peaxi162Scf00457252,951255,71186598.055.96Cytoplasmic
PaTPS9Peaxi162Scf00022g02413.1Peaxi162Scf000222,390,3462,421,693975110.656.03Cytoplasmic
PaTPS10Peaxi162Scf00111g01324.1Peaxi162Scf001111,308,9821,320,265927104.396.29Cytoplasmic
PiTPS1Peinf101Scf00275g03007.1Peinf101Scf00275406,279412,63184896.555.67Cytoplasmic
PiTPS2Peinf101Scf00442g03004.1Peinf101Scf00442320,610324,68185296.755.77Nuclear
PiTPS3Peinf101Scf00994g03007.1Peinf101Scf00994331,522336,13985596.375.65Cytoplasmic
PiTPS4Peinf101Scf01033g01017.1Peinf101Scf01033150,487155,51986497.515.78Cytoplasmic
PiTPS5Peinf101Scf01456g02005.1Peinf101Scf01456g225,034228,66085697.165.66Cytoplasmic
PiTPS6Peinf101Scf01436g11018.1Peinf101Scf014361,108,2491,111,22485196.255.91Cytoplasmic
PiTPS7Peinf101Scf00586g01015.1Peinf101Scf00586115,175118,01886898.676.01Cytoplasmic
PiTPS8Peinf101Scf01850g03027.1Peinf101Scf01850402,667405,42686597.925.99Cytoplasmic
PiTPS9Peinf101Scf00304g01004.1Peinf101Scf0030468,07393,5411028116.457.19Cytoplasmic
PiTPS10Peinf101Scf00665g07025.1Peinf101Scf00665722,849733,623927104.396.29Cytoplasmic
Table 2. Physicochemical properties of TPP proteins in the petunia genome.
Gene NameLocus_IDPositionLength
(AA)
MW
(Da)
pISubcellular Localization
Scaffold LocationStartEnd
PaTPP1Peaxi162Scf00904g00003.1Peaxi162Scf0090481,66883,67934138.066.04Cytoplasmic
PaTPP2Peaxi162Scf00711g00011.1Peaxi162Scf00711115,934118,33827631.566.62Cytoplasmic
PaTPP3Peaxi162Scf00241g00319.1Peaxi162Scf00241378,645381,16138442.766.72Chloroplast
PaTPP4Peaxi162Scf00002g00816.1Peaxi162Scf00002860,185862,87239144.187.66Mitochondrial
PaTPP5Peaxi162Scf00041g00810.1Peaxi162Scf00041797,885799,77035740.069.13Chloroplast
PaTPP6Peaxi162Scf00838g00003.1Peaxi162Scf0083886,47089,69838743.669.4Chloroplast
PaTPP7Peaxi162Scf00295g00075.1Peaxi162Scf00295757,573761,47831635.949.65Mitochondrial
PaTPP8Peaxi162Scf00295g00510.1Peaxi162Scf00295578,702582,22937642.299.22Chloroplast
PiTPP1Peinf101Scf01632g02002.1Peinf101Scf01632229,134231,13434138.036.04Cytoplasmic
PiTPP2Peinf101Scf03315g00014.1Peinf101Scf0331571,33773,49327631.476.41Cytoplasmic
PiTPP3Peinf101Scf03555g01022.1Peinf101Scf0355591,63994,06238442.736.72Chloroplast
PiTPP4Peinf101Scf00674g06014.1Peinf1011Scf00674660,658663,17538543.567.66Mitochondrial
PiTPP5Peinf101Scf00173g02008.1Peinf1011Scf00173222,878225,00141446.459.15Cytoplasmic
PiTPP6Peinf101Scf00966g00008.1Peinf101Scf0096673,26776,16540245.639.51Mitochondrial
PiTPP7Peinf101Scf01178g05006.1Peinf101Scf01178522,267525,30937542.509.18Nuclear
PiTPP8Peinf101Scf01178g06005.1Peinf101Scf01178666,203669,51037942.769.01Nuclear
PiTPP9Peinf101Scf07373g00001.1Peinf101Scf073733245436240.586.12Chloroplast
Disclaimer/Publisher’s Note: The statements, opinions and data contained in all publications are solely those of the individual author(s) and contributor(s) and not of MDPI and/or the editor(s). MDPI and/or the editor(s) disclaim responsibility for any injury to people or property resulting from any ideas, methods, instructions or products referred to in the content.

