Article

Identification and Characterization of bZIP Gene Family Combined Transcriptome Analysis Revealed Their Functional Roles on Abiotic Stress and Anthocyanin Biosynthesis in Mulberry (Morus alba)

State Key Laboratory of Resource Insects, College of Sericulture, Textile and Biomass Sciences, Southwest University, Tiansheng Road No. 2, Chongqing 400715, China
*
Authors to whom correspondence should be addressed.
Horticulturae 2025, 11(6), 694; https://doi.org/10.3390/horticulturae11060694
Submission received: 21 May 2025 / Revised: 9 June 2025 / Accepted: 12 June 2025 / Published: 16 June 2025
(This article belongs to the Section Genetics, Genomics, Breeding, and Biotechnology (G2B2))

Abstract

:
The basic leucine zipper (bZIP) gene family constitutes one of the most abundant and conserved transcription factor families in plants, which participates in diverse physiological processes including response to abiotic stress, anthocyanin accumulation, and the regulation of plant growth and development. Although bZIP genes play an important role in plants, comparable studies in mulberry are lacking, particularly regarding their response under abiotic stress conditions. In this study, we identified 56 mulberry bZIP transcription factors and divided these members into 12 groups by phylogenetic analysis. The coding genes of these bZIPs harbor a large number of segmental duplications and are unevenly distributed on 12 chromosomes. We further identified numerous stress responsive elements in the promoter regions of bZIP genes. Furthermore, by analysis of the expression profiles from RNA-seq data, we identified MabZIP43 and MabZIP24 that respond to heat, salt–alkaline, and high light stress. We also found that the gene expression of MabZIP16 was closely related to anthocyanin biosynthesis. As described, we systematically explored the structures and functions of the bZIP gene family in Morus alba. The results imply that the bZIP gene family plays significant roles in stress response and anthocyanin biosynthesis. Three bZIP candidate genes are suggested for genetic engineering to improve the resistance of mulberry to stress and for high-anthocyanin-producing lines.

1. Introduction

The basic region/leucine zipper (bZIP) transcription factors are characterized by two structural domains: a basic DNA-binding region and a leucine zipper motif located on a continuous α-helix [1,2,3]. The leucine zipper mediates the formation of homo- or heterodimers, which is typically the functional form of bZIP proteins. In plants, bZIP transcription factors preferentially bind to ACGT core DNA sequences. The Arabidopsis bZIP family comprises 78 members and was previously classified into 13 groups (designated A–M) [4]. In poplar, 86 bZIPs have been identified and grouped into 12 classes [5]. Notably, Group K, which is involved in the unfolded protein response (UPR) of the endoplasmic reticulum (ER) in Arabidopsis, is absent in poplar. Group B, which is closely related to Group K and also participates in UPR, may functionally compensate for the absence of Group K in poplar.
bZIP transcription factors are evolutionarily conserved in eukaryotes and play crucial roles in stress responses, development, and light signaling. Group H is the most conserved branch across plant species, including HY5 (HYPOCOTYL5), and its homologs. HY5 is a well-characterized light-responsive transcription factor that regulates various developmental processes, such as photomorphogenesis [6,7], chloroplast development [8,9], and photoprotection [10,11,12]. Group G comprises five members in Arabidopsis and seven members in poplar. Group G may function in stress response. One member of Group G, GBF1 (G-box-binding factor 1), acts as a negative regulator of CAT2 (CATALASE2), thereby promoting reactive oxygen species (ROS) accumulation, which can activate signaling pathway under stress conditions [13].
Groups D, A, and S have the largest number of members. Group D proteins can bind to the TGACG DNA-binding motif, interact with NPR1 (NONEXPRESSOR OF PATHOGENESIS-RELATED GENES1), and regulate responses to pathogens [14,15], abiotic stress [16,17], and detoxification [18,19]. They are also known to fine-tune responses to desiccation and salt stress. Group A members first emerged in spermatophytes and are implicated in seed development and germination [20,21,22]. Group S bZIPs encode small proteins of approximately 20 kDa. Members of Group S can form heterodimers with Group C bZIPs, facilitating metabolic reprogramming under nutrient starvation and contributing to stress responses [23,24,25].
bZIP proteins participate in anthocyanin biosynthesis. Some Group S proteins are directly involved in anthocyanin biosynthesis. For instance, PavbZIP6, a Group S member, promotes anthocyanin biosynthesis in sweet cherry by directly regulating structural genes in the pathway [26]. The bZIP gene SlAREB1, homologous to AtbZIP6, enhances anthocyanin biosynthesis in tomato seedlings via the ABA-dependent pathway under low temperature condition [27]. In apple, MdbZIP44, also a Group S member, promotes anthocyanin biosynthesis by enhancing the binding of MdMYB1 to anthocyanin biosynthesis genes [28]. HY5 also plays a central role in anthocyanin biosynthesis, particularly under temperature and high light stress. In tomato leaves, HY5 binds directly to the promoter regions of anthocyanin biosynthesis genes under blue light, promoting pigment accumulation [29]. In Arabidopsis leaves, HY5 activates the transcription of MYB75/PAP1 or MYB12/PFG1 and thereby enhances anthocyanin production under high light stress [30,31]. In strawberry fruits, HY5 forms a complex with bHLH9 to initiate anthocyanin biosynthesis inducing by light exposure [32]. Moreover, both HY5 and its homolog HYH are essential for cold-induced anthocyanin accumulation. In apple, HY5 directly binds to the promoters of abscisic acid (ABA) and indole-3-acetic acid (IAA) biosynthesis genes, reducing the IAA/ABA ratio and indirectly promoting anthocyanin accumulation under cold stress [33].
The mulberry tree (Morus alba) is a perennial woody plant whose leaves are the exclusive food source for silkworms, thus playing a critical role in sericulture. Today, mulberry is also valued for its medicinal properties and applications in rocky desertification control and horticulture [34,35,36,37]. The draft genome of Morus notabilis, a wild species with a relatively small genome, was the first to be released [38]. More recently, a high-quality, chromosome-level genome assembly of a major cultivated variety (Morus alba cv. Heyebai) has become available [39]. Based on these genomic resources, several gene families such as MYBs and cytochrome P450s have been identified in mulberry [40,41]. However, a comprehensive genome-wide identification and characterization of bZIP transcription factors in mulberry has not yet been reported.
Given the essential roles of bZIPs in stress responses, flavonoid biosynthesis, and plant development, it is crucial to identify the complete bZIP gene family in Morus alba. Such knowledge will enhance our understanding of mechanisms of stress resistance, fruit coloration, and yield control in mulberry, and thereby contribute to its genetic improvement.
In this study, we performed a stringent workflow to identify bZIP domain-containing and homologous proteins in Morus alba. Expression profiles of the identified bZIPs were analyzed under heat, salt–alkaline, and high light stress conditions using transcriptomic data. Additionally, since we observed that anthocyanin is remarkably accumulated in mulberry juvenile leaves under high light exposure, we also conducted analysis of expression patterns between bZIP genes and anthocyanin biosynthesis genes. Subsequently, candidate stress-responsive bZIP transcription factors were experimentally validated via quantitative real-time PCR (qRT-PCR) across the above three stress conditions, with similar validation of candidate anthocyanin-related bZIP genes under high light stress. This study aims to provide potential gene targets for future mulberry breeding and genetic improvement.

2. Material and Methods

2.1. Acquisition of Sequencing Data

Genome sequences were collected from different databases. The Arabidopsis genome sequences and annotation file were downloaded from The Arabidopsis Information Resource (TAIR, https://www.arabidopsis.org/). The genome sequences and annotation information of Populus Prichocarpa, Oryza sativa, Ananas comosus, and Zea mays were obtained from the Phytozome database (https://phytozome-next.jgi.doe.gov/) [42,43,44,45,46]. The genome sequences of Ficus hispida were obtained from the National Genomic Data Center (NGDC, https://ngdc.cncb.ac.cn) [47]. The genome information of Morus alba and Morus notabilis were obtained from the GenBank database [38,39]. The annotation information of Ficus hispida and Morus notabilis were predicted using Helixer v.0.3.3 [48].

2.2. Identification of Mulberry bZIP Transcription Factors and Anthocyanin Biosynthesis Genes

The bZIP genes in Arabidopsis and Populus were extracted based on the information provided in previous research [4,5] and that of bZIP_1 (PF00170), bZIP_Maf (PF03131), bZIP_C (PF12498), and bZIP_2 (PF07716) from the InterPro database [49]. First, we used hmmsearch (http://www.hmmer.org/) with bZIP_1, bZIP_Maf, bZIP_C, and bZIP2 to search the mulberry amino acid sequences with a threshold of E-value < 1 × 10⁻⁵. Next, all bZIP proteins in Arabidopsis and Populus were used to search possible MabZIP proteins using BLSATP with a threshold of E-value < 1 × 10⁻⁵. After obtaining the candidate proteins, we applied the InterPro database to further verify our results [49].
Genes related to anthocyanin biosynthesis pathway in Arabidopsis were downloaded from The Arabidopsis Information Resource (TAIR, https://www.arabidopsis.org/) and used as templates for identification of anthocyanin biosynthesis genes in mulberry genome. Then “Find best homology” in TBtools v2.310 was used to identified and the InterPro database was applied to verify our results [49,50,51].
All identified bZIP genes and anthocyanin biosynthesis genes in mulberry genome were named according to their chromosomal locations.

2.3. Classification, Chromosome Distribution, and Sequences Analysis on the bZIP Members

We used the MEGA 11 with Maximum Likelihood method to construct a phylogenetic tree. Classification of the mulberry bZIP protein family refers to previous studies in Arabidopsis and Populus [4,5,52].
Using the TBtools and the mulberry genome data, we visualized the chromosomal distribution of the bZIP genes in mulberry [39,51]. In addition, we identified conserved motifs contained in the bZIP gene family using MEME and visualized it using TBtools. Motif annotation information comes from the InterPro database [49,51,53].

2.4. Collinearity Analysis and Promoter Cis-Acting Elements Prediction

Using the TBtools with MCScanX v1.0, we analyzed the tandem duplication events of the bZIP gene family in mulberry [51,54]. Similarly, using the TBtools with MCScanX and BLASTP methods, we investigated segmental duplication events and the collinearity relationship for gene pairs from different species [51,54]. Ka and Ks substitutions between gene pairs were also calculated, by use of the TBtools [51]. Additionally, the promoter cis-acting elements were predicted by PlantCARE; we then classified them manually and visualized them using TBtools [51,55].

2.5. Gene Expression Analysis, PPI Network, GO Enrichment Analysis

Using the RNA-Seq data described in our previous study [56] and some unpublished data, we explored differential expression patterns of the bZIP genes under heat, salt–alkaline, and high light stress. Gene expression levels were calculated as fragments per kilobase of transcript per million mapped reads (FPKM). Differentially expressed genes (DEGs) were identified from FPKM using DESeq2. Genes with|log2 (fold change)| ≥ 1 and p < 0.05 were considered to be DEGs [57]. The PPI network was conducted by using the STRING database and K-means clustering algorithm was applied to the PPI network [58].

2.6. Plant Materials, Treatments, and Quantitative Real-Time PCR

Morus alba (Guiyou62) seedings were planted in the growth chamber with constant temperature at 25 °C for 8 h 50 μmol m−2 s−1 light and 16 h dark for three months. Plants were then either continuously grown in the chamber or subject to conduct stress treatment.
For heat stress: plants were transferred to a 38 °C chamber with 50 μmol m−2 s−1 light exposure for 8 h per day for 7 days. For salt–alkaline stress: Na2SO4 and NaHCO3 (mass ratio of 1:1) were added to the mixed soil at a concentration of 0.4% relative to dry soil weight and treated for 30 days. For high light stress: mulberry seedings were transferred to a 21 °C chamber with constant 1000 μmol m−2 s−1 light exposure for 3 days. The high light chamber was set to 21 °C to make sure the leaf temperatures were kept at 25 °C to match the control growth condition because of the cool air coming from the back of the chamber.
To verify the gene expression data from RNA-Seq, we used qRT-PCR to quantify the expression level of MabZIP43, 24 and 16 in response to stress treatment. qRT-PCR was performed as previously described [59,60]. Total RNA was extracted using RNAiso Plus (TaKaRa, Kusatsu, Japan), and the cDNA was synthesized using PrimeScript RT reagent Kit for qRT-PCR (TaKaRa, Dalian, China) following the manual. qRT-PCR was performed on StepOneTM Plus quantitative instrument (Life technologies holdings Pte Ltd., Singapore) using Realtime PCR Super mix SYBRgreen, with anti-Taq (Mei5bio, Beijing, China). The PCR cycling condition consisted of an initial 1 min at 95 °C for pre-denaturation followed by 40 cycles of 15 s at 95 °C for denaturation, 15 s at 60 °C for annealing and 20 s at 72 °C for extension. The results were analyzed using the 2−ΔΔCT method with ACTIN as the reference gene for relative quantification. The primers used for qRT-PCR were listed in Table S8.

3. Results

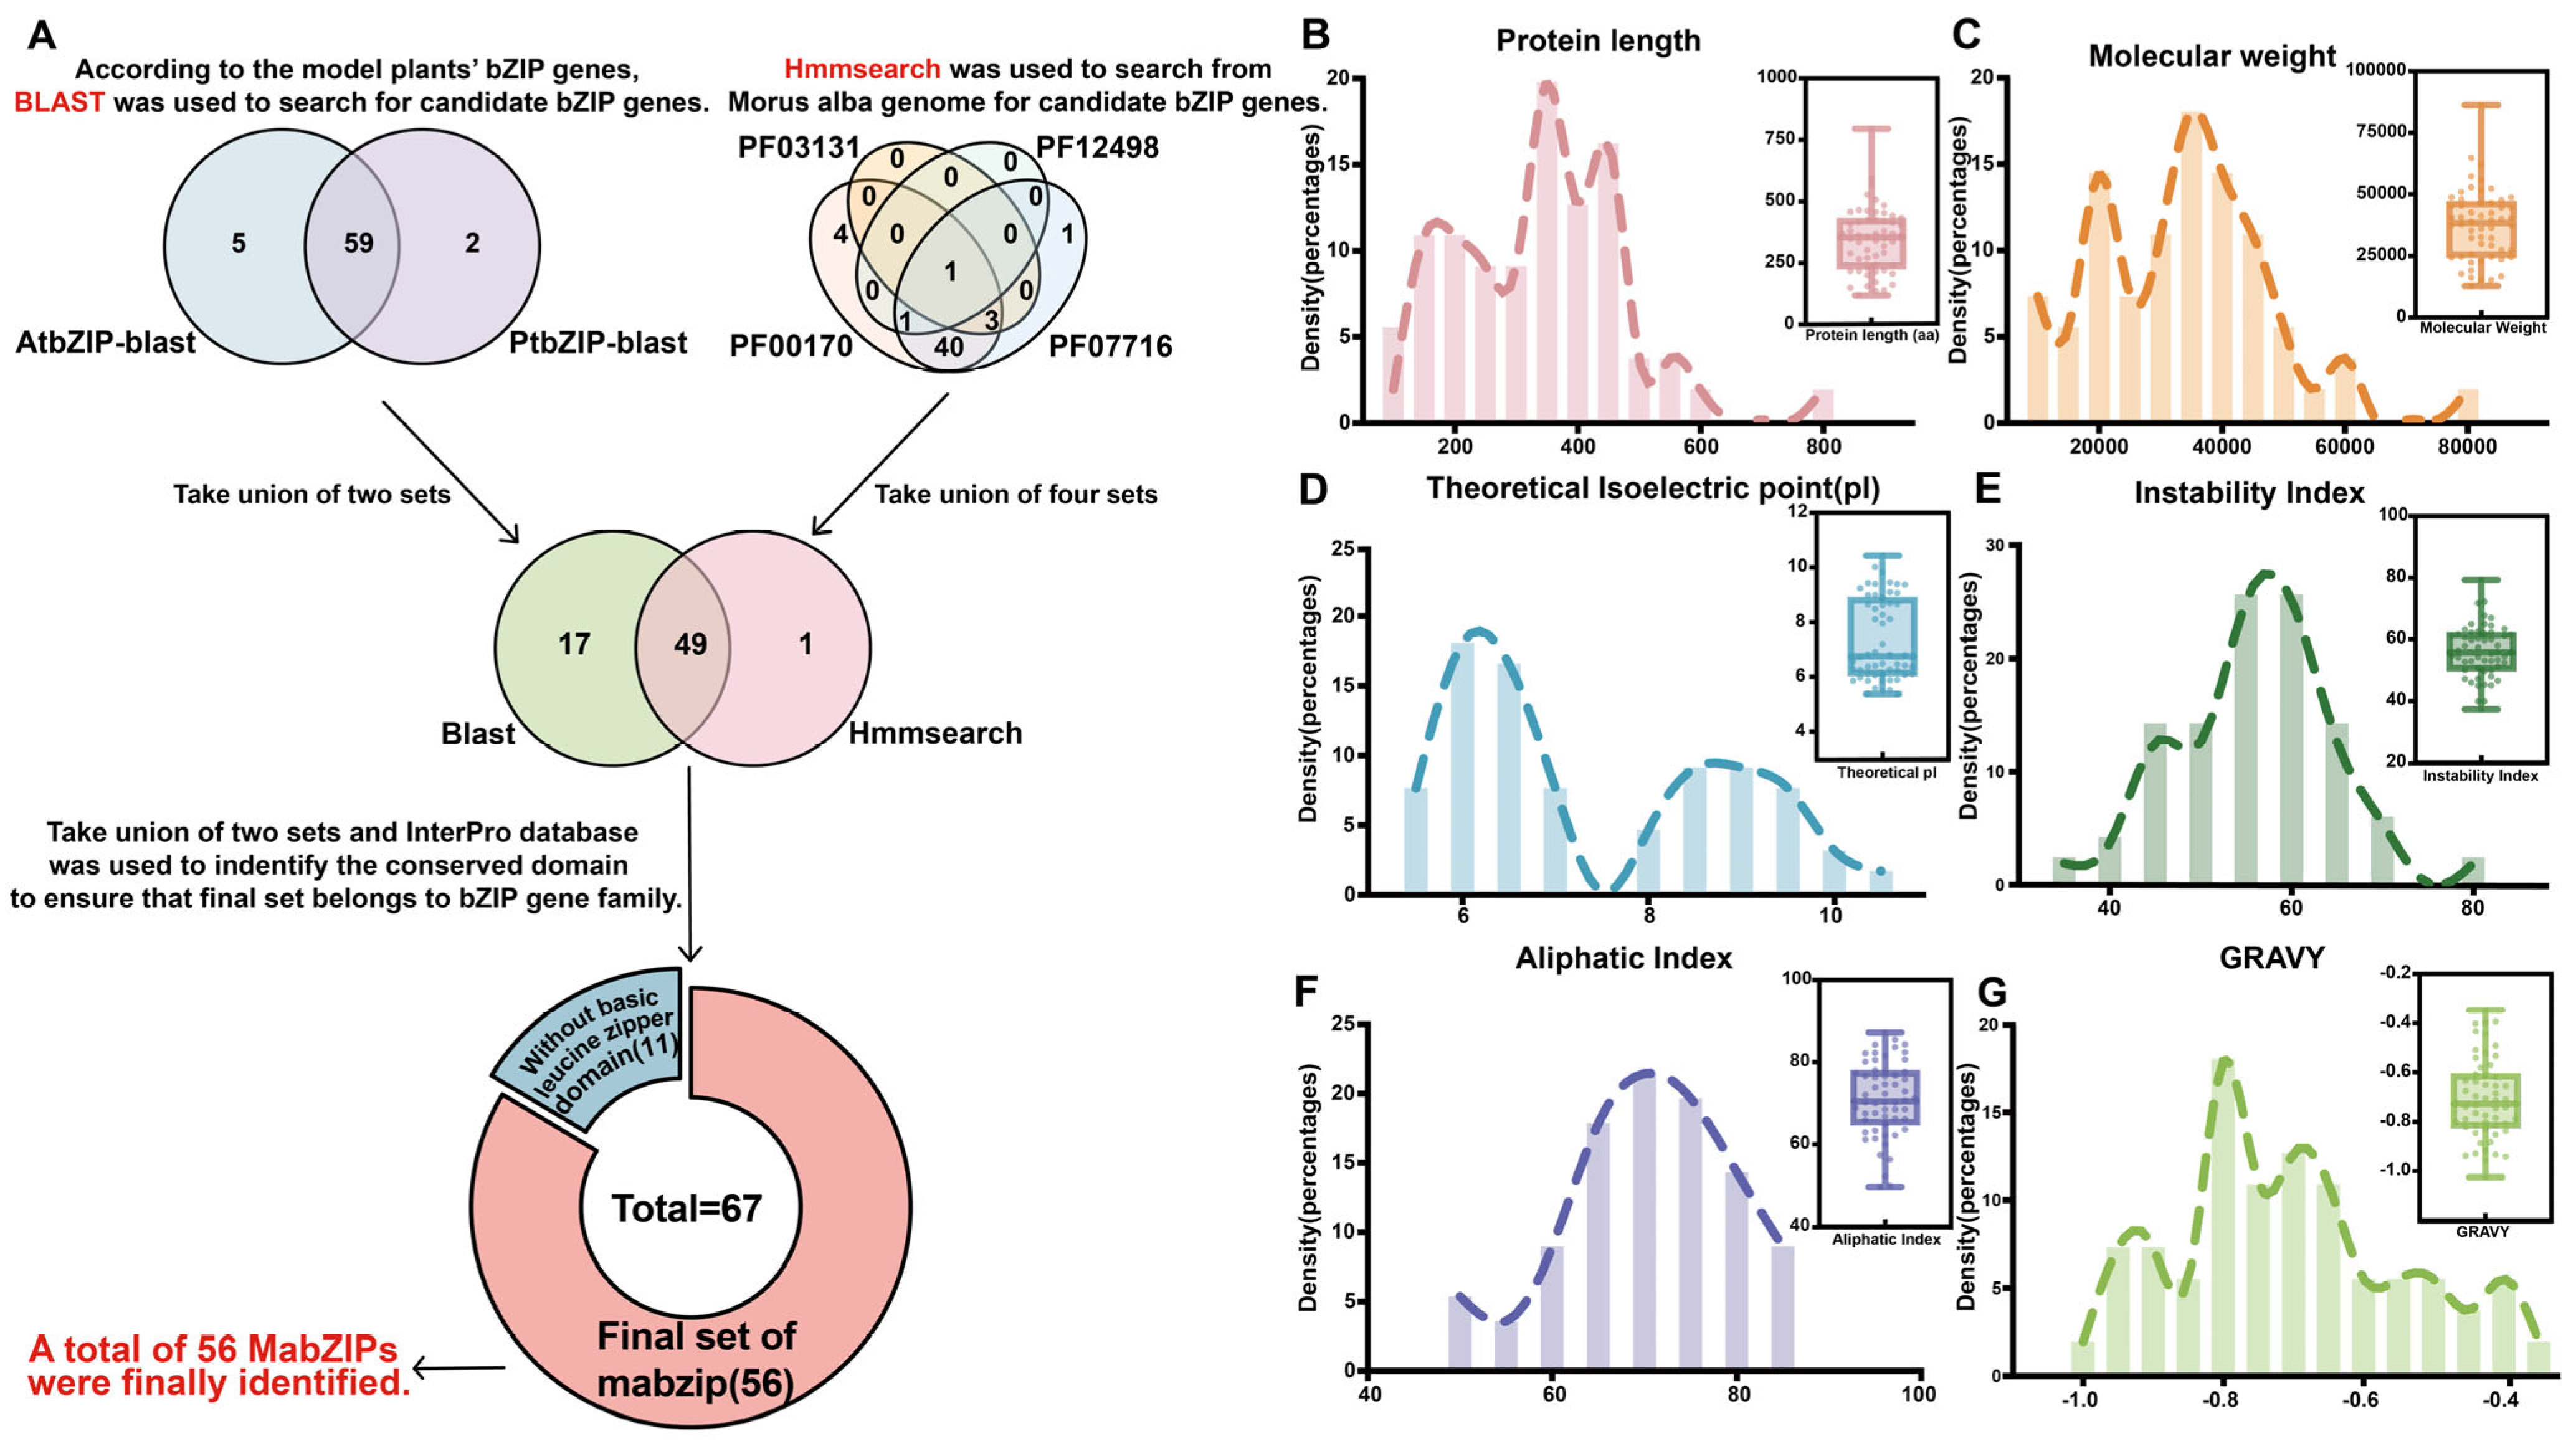
3.1. Identification and Physicochemical Properties Analysis of MabZIP Members in Morus alba

Based on the findings of previous studies, it is shown that bZIP family members have congruent bZIP domains, a basic DNA-binding region, and a neighboring leucine zipper structure [3,4]. Following these criteria, we used BLASTP and HMMER (hmmsearch) analysis to search for candidate MabZIP members in mulberry. Using BLASTP, we found 64 proteins homologous to Arabidopsis bZIP proteins and 61 proteins homologous to poplar bZIP proteins, with 59 proteins shared between the two sets. In total, BLASTP analysis identified 66 candidate bZIP members from mulberry. Through HMMER analysis, we identified 50 candidate bZIP members, 49 of which overlapped with the BLAST results.
Combining the results from both methods, we identified 67 candidate MabZIP proteins. Subsequently, the Interpro database was used to verify the set of 67 candidate proteins [49]. Evidence from verification indicates that 56 mulberry proteins shared basic-leucine zipper domain while 11 proteins without conserved bZIP domain and these 11 proteins were excluded due to the lack of bZIP domain. Interestingly, among 11 proteins lacking canonical bZIP domain, 6 of them harbor a DELAY OF GERMINATION 1 (DOG1) domain, which is homologous to Group D of Arabidopsis and poplar bZIP proteins, suggesting that the bZIP domain may have been lost in evolutionary processes in these 6 proteins (Figures S1A and S2). Taken together, a total of 56 MabZIP members were identified from the whole genome of Morus alba in this study and these confirmed 56 MabZIP members were functionally analyzed in our subsequent study (Figure 1A).
Then, we determined the physicochemical properties and predicted their subcellular locations (Figure 1B–G; Table S1). Most of these proteins consist of 150–600 amino acid residues (AARs). The largest MabZIP protein has 797 AARs and the smallest one only has 121 AARs. The molecular wights range from 13.73 kDa to 86.46 kDa, with an average of 38.21 kDa. The predicted theoretical isoelectric points vary from 5.37 to 10.42 and almost not at 7.5. Instability indexes are in a range of 37.34–79.31 and aliphatic indexes range from 49.46 to 86.99. The grand average of hydropathicity (GRAVYs) of all proteins are less than 0 and vary from −1.017 to −0.345, indicating that all proteins are hydrophilic. Subcellular location prediction suggested that MabZIPs are predominantly in the nucleus region.

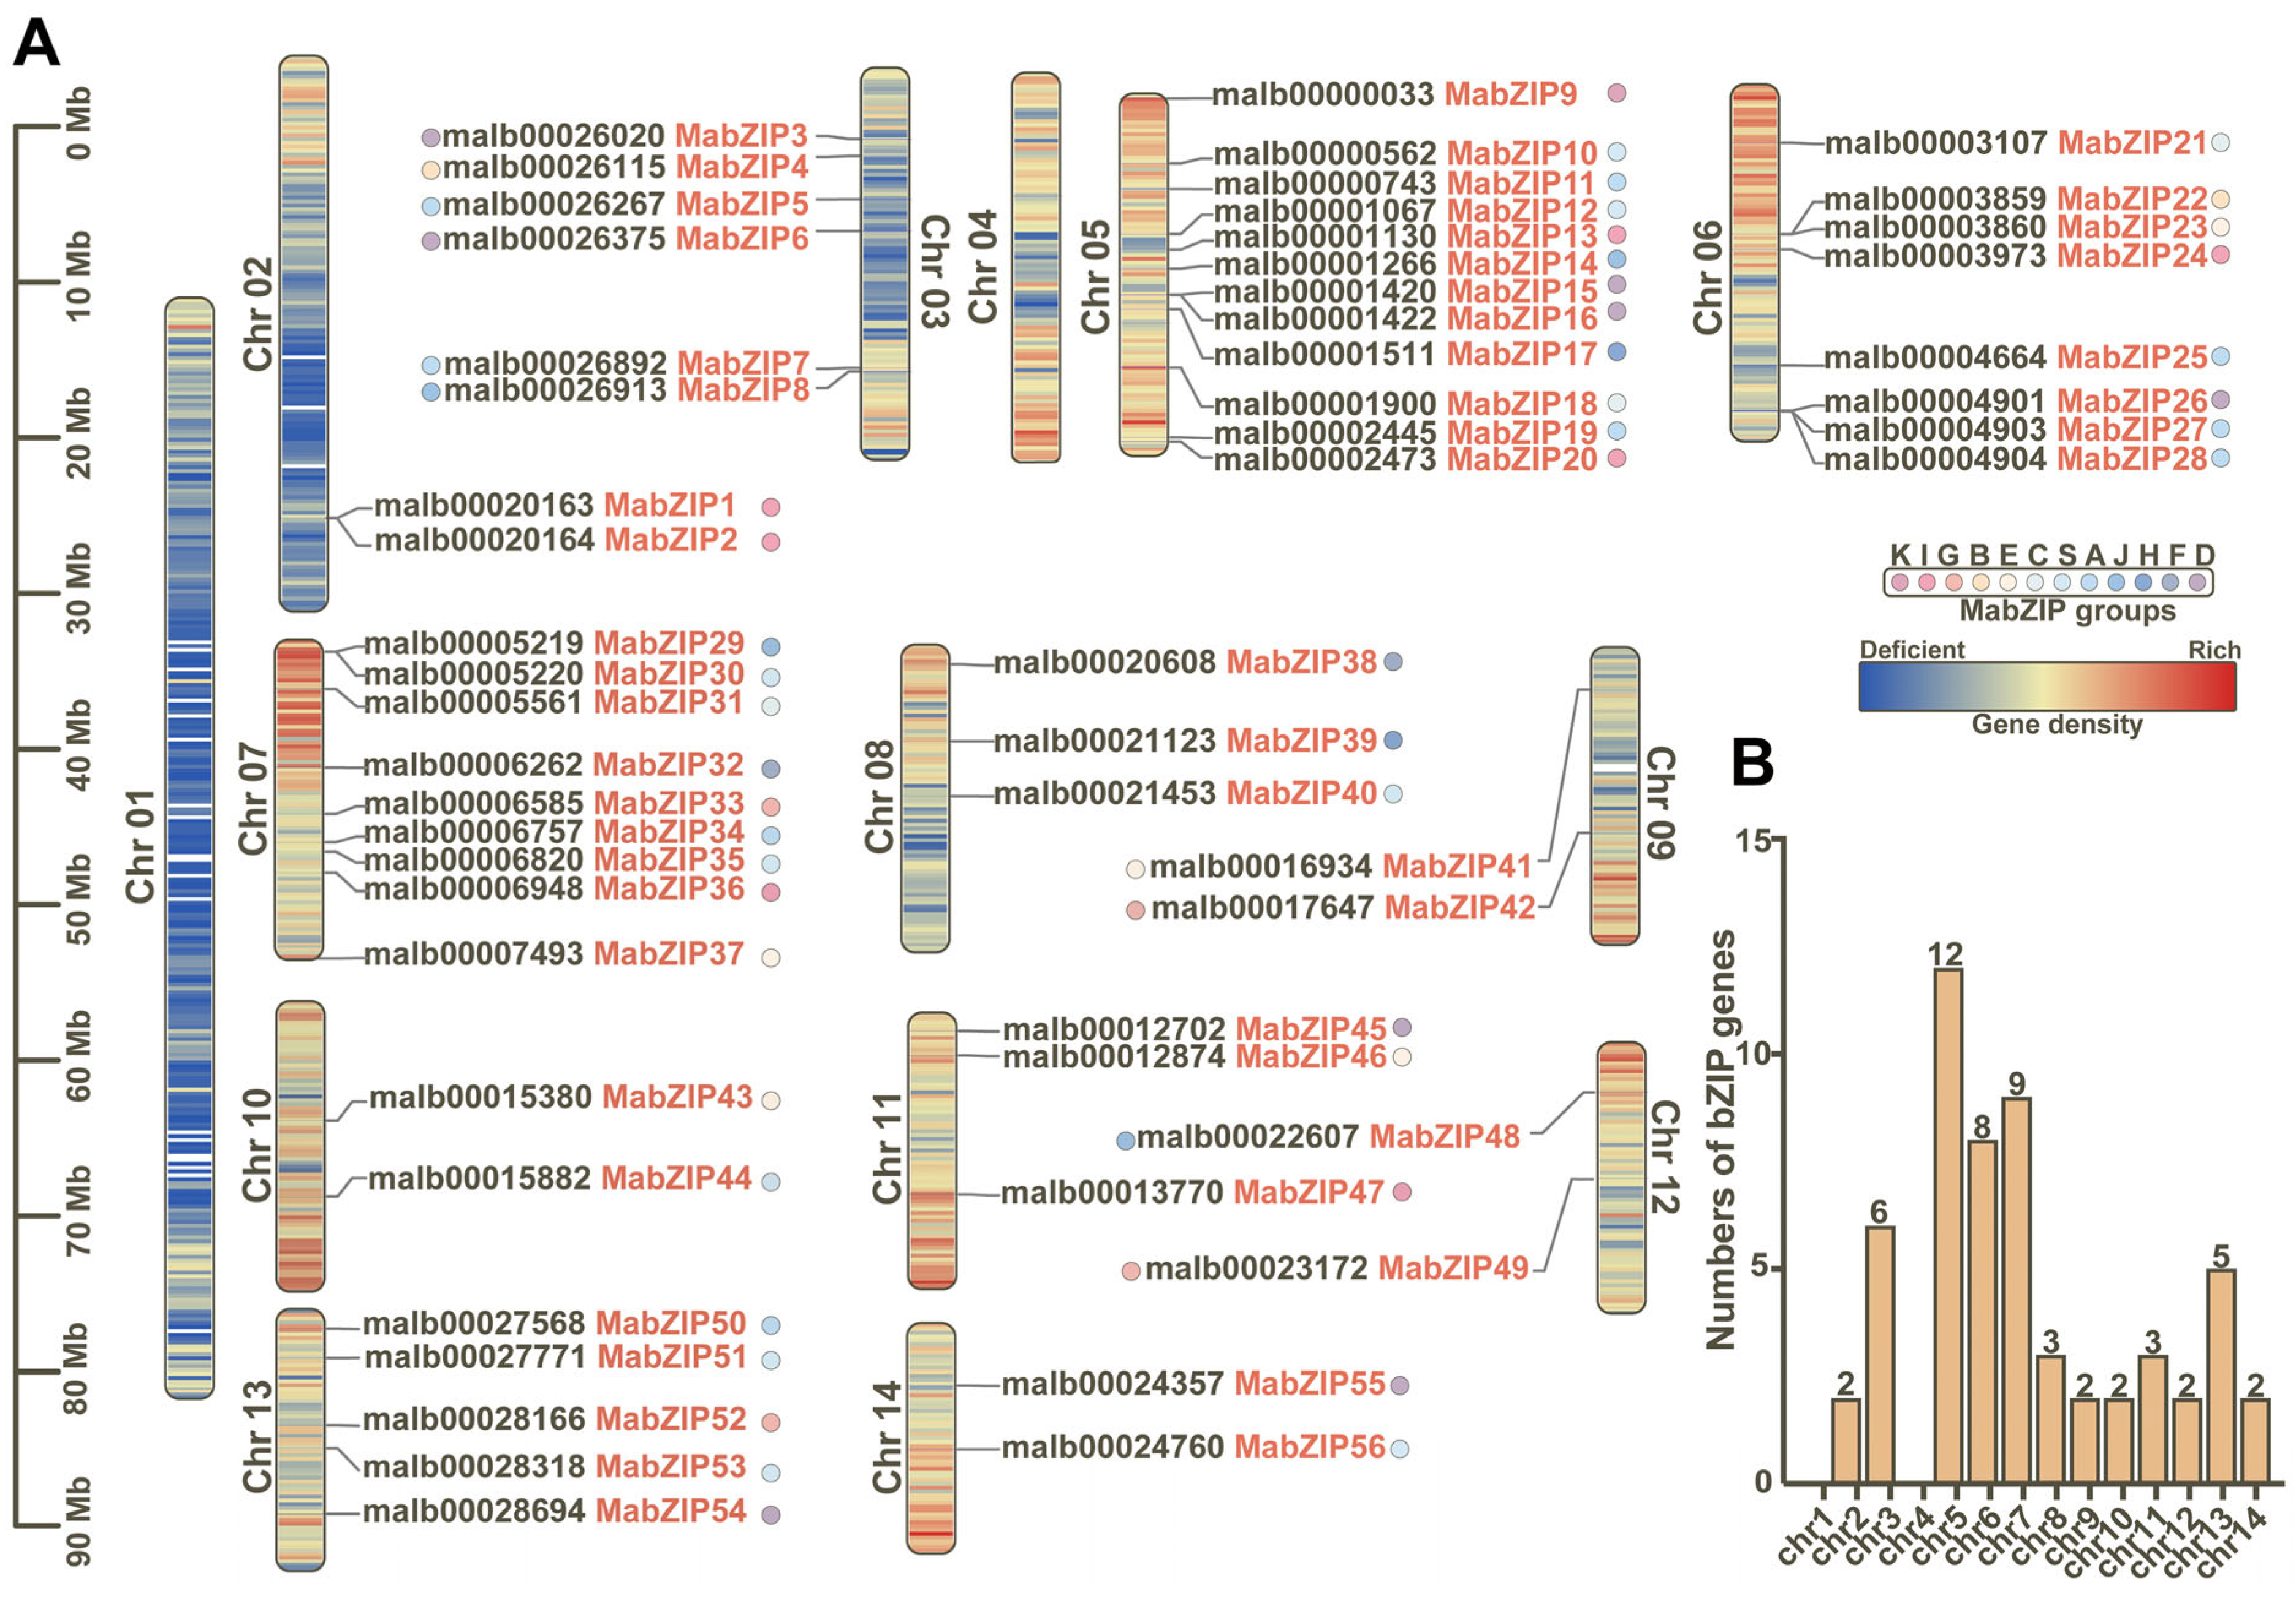
3.2. Chromosome Distribution and Phylogenetic Relationship Analysis of bZIP Genes

The location of genes on chromosomes may affect their function and expression level. We visualized the chromosome distribution of the MabZIP genes and found that the 56 MabZIP genes are unevenly distributed on the 12 chromosomes (Figure 2A). The number of genes on each chromosome is irrelevant to chromosome size. For example, Chr02 is larger than Chr05, but Chr05 contains more MabZIP genes than Chr02. Chr01 and Chr04 do not have MabZIP genes. We named these MabZIP genes based on their locations on chromosomes.
To explore the evolutionary relationships and classification of the bZIP family in mulberry, we constructed a phylogenetic tree, using the amino acid sequences of each member from Arabidopsis, poplar, and mulberry. The AtbZIPs are divided into 13 groups with capital letters, while PtbZIPs consist 12 groups [4,5]. Each group has their own characteristics and unique physiological function. Based on these studies, we divided the MabZIP members into 12 groups (Figure 3; Table S1). The size of the 12 groups varies, ranging from 11 (Group A) to 1 (Group K). Mulberry does not contain a bZIP member in Group M.

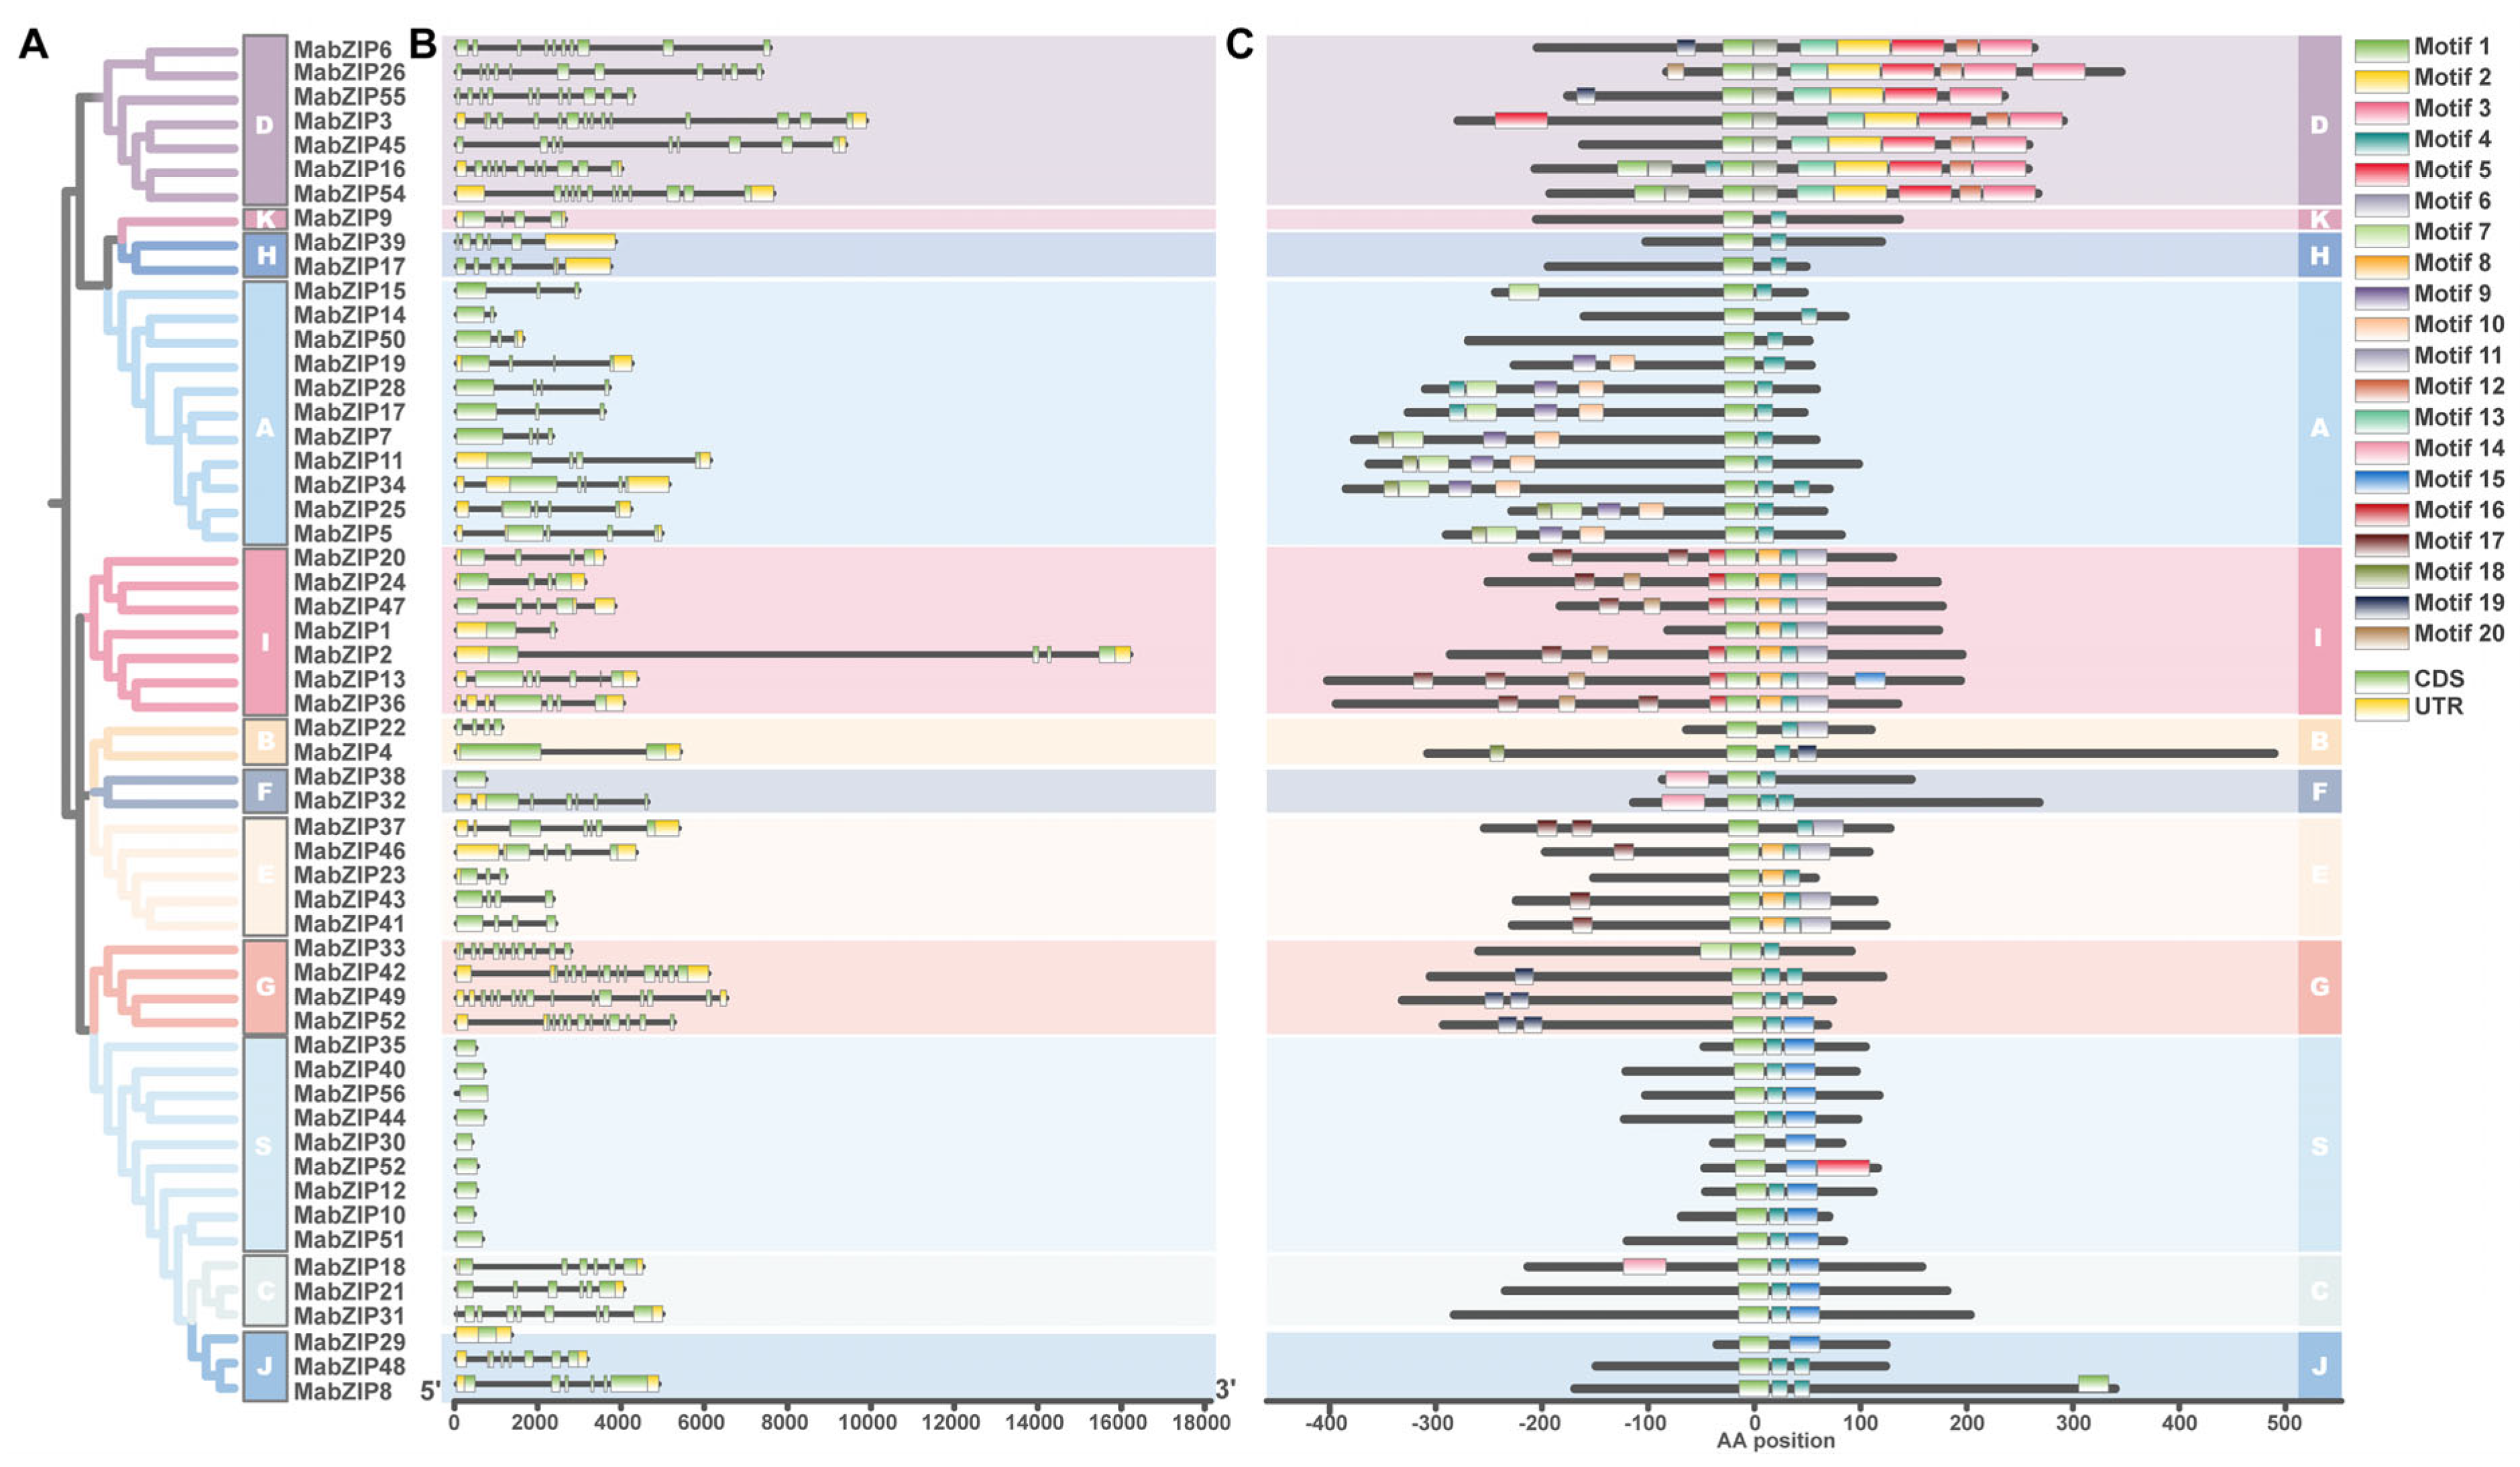
3.3. Conserved Motif and Gene Structure Analysis of MabZIP Genes

To explore the sequence structure of the MabZIP members, we analyzed the intron/exon structure (Figure 4B). As expected, many members with a closer relationship also share similar intron/exon structure, potentially reflecting their origin through evolutionary duplications. Interestingly, all members in group S have only one exon. Using MEME, a total of 20 conserved motif were found from MabZIP members (Figure 4C) [53]. Through the annotation of InterPro database, we found that the motif 1 encodes the bZIP domain and motifs 2, 3, and 5 are related to the DOG1 domain, while other motifs do not have specific annotation information (Table S2) [49].
As expected, all the MabZIP members share motif 1 (bZIP domain). Motif 4 (unknown) presents in the majority of MabZIP members. Motif 2, 3, 5, 11, 12, and 13 exist in all members of Group D, while motif 5 exists not only in Group D, but also in MabZIP52. In addition, motifs 6, 8, and 17 are present in most members of Group I and E. Motifs 7, 9, and 10 were identified in most of the Group A members, while motif 7 was additionally found in MabZIP33m with motif 7, 9, and 10 exhibiting a predominant co-occurrence pattern in most cases. Motif 14 exists in Group F and MabZIP18. Motif 15 exists in Group S, MabZIP29, and MabZIP52. Motif 16 and motif 20 were predominantly observed in most members of Group I, while motif 20 was also uniquely identified in MabZIP26. Motif 18 was detected in five members of Group A and MabZIP4, whereas motif 19 was found to be prevalent in the majority of Group G members, along with MabZIP6 and 55. Many motifs are shared in specific groups, which might be related to specific biological functions awaiting further investigation.

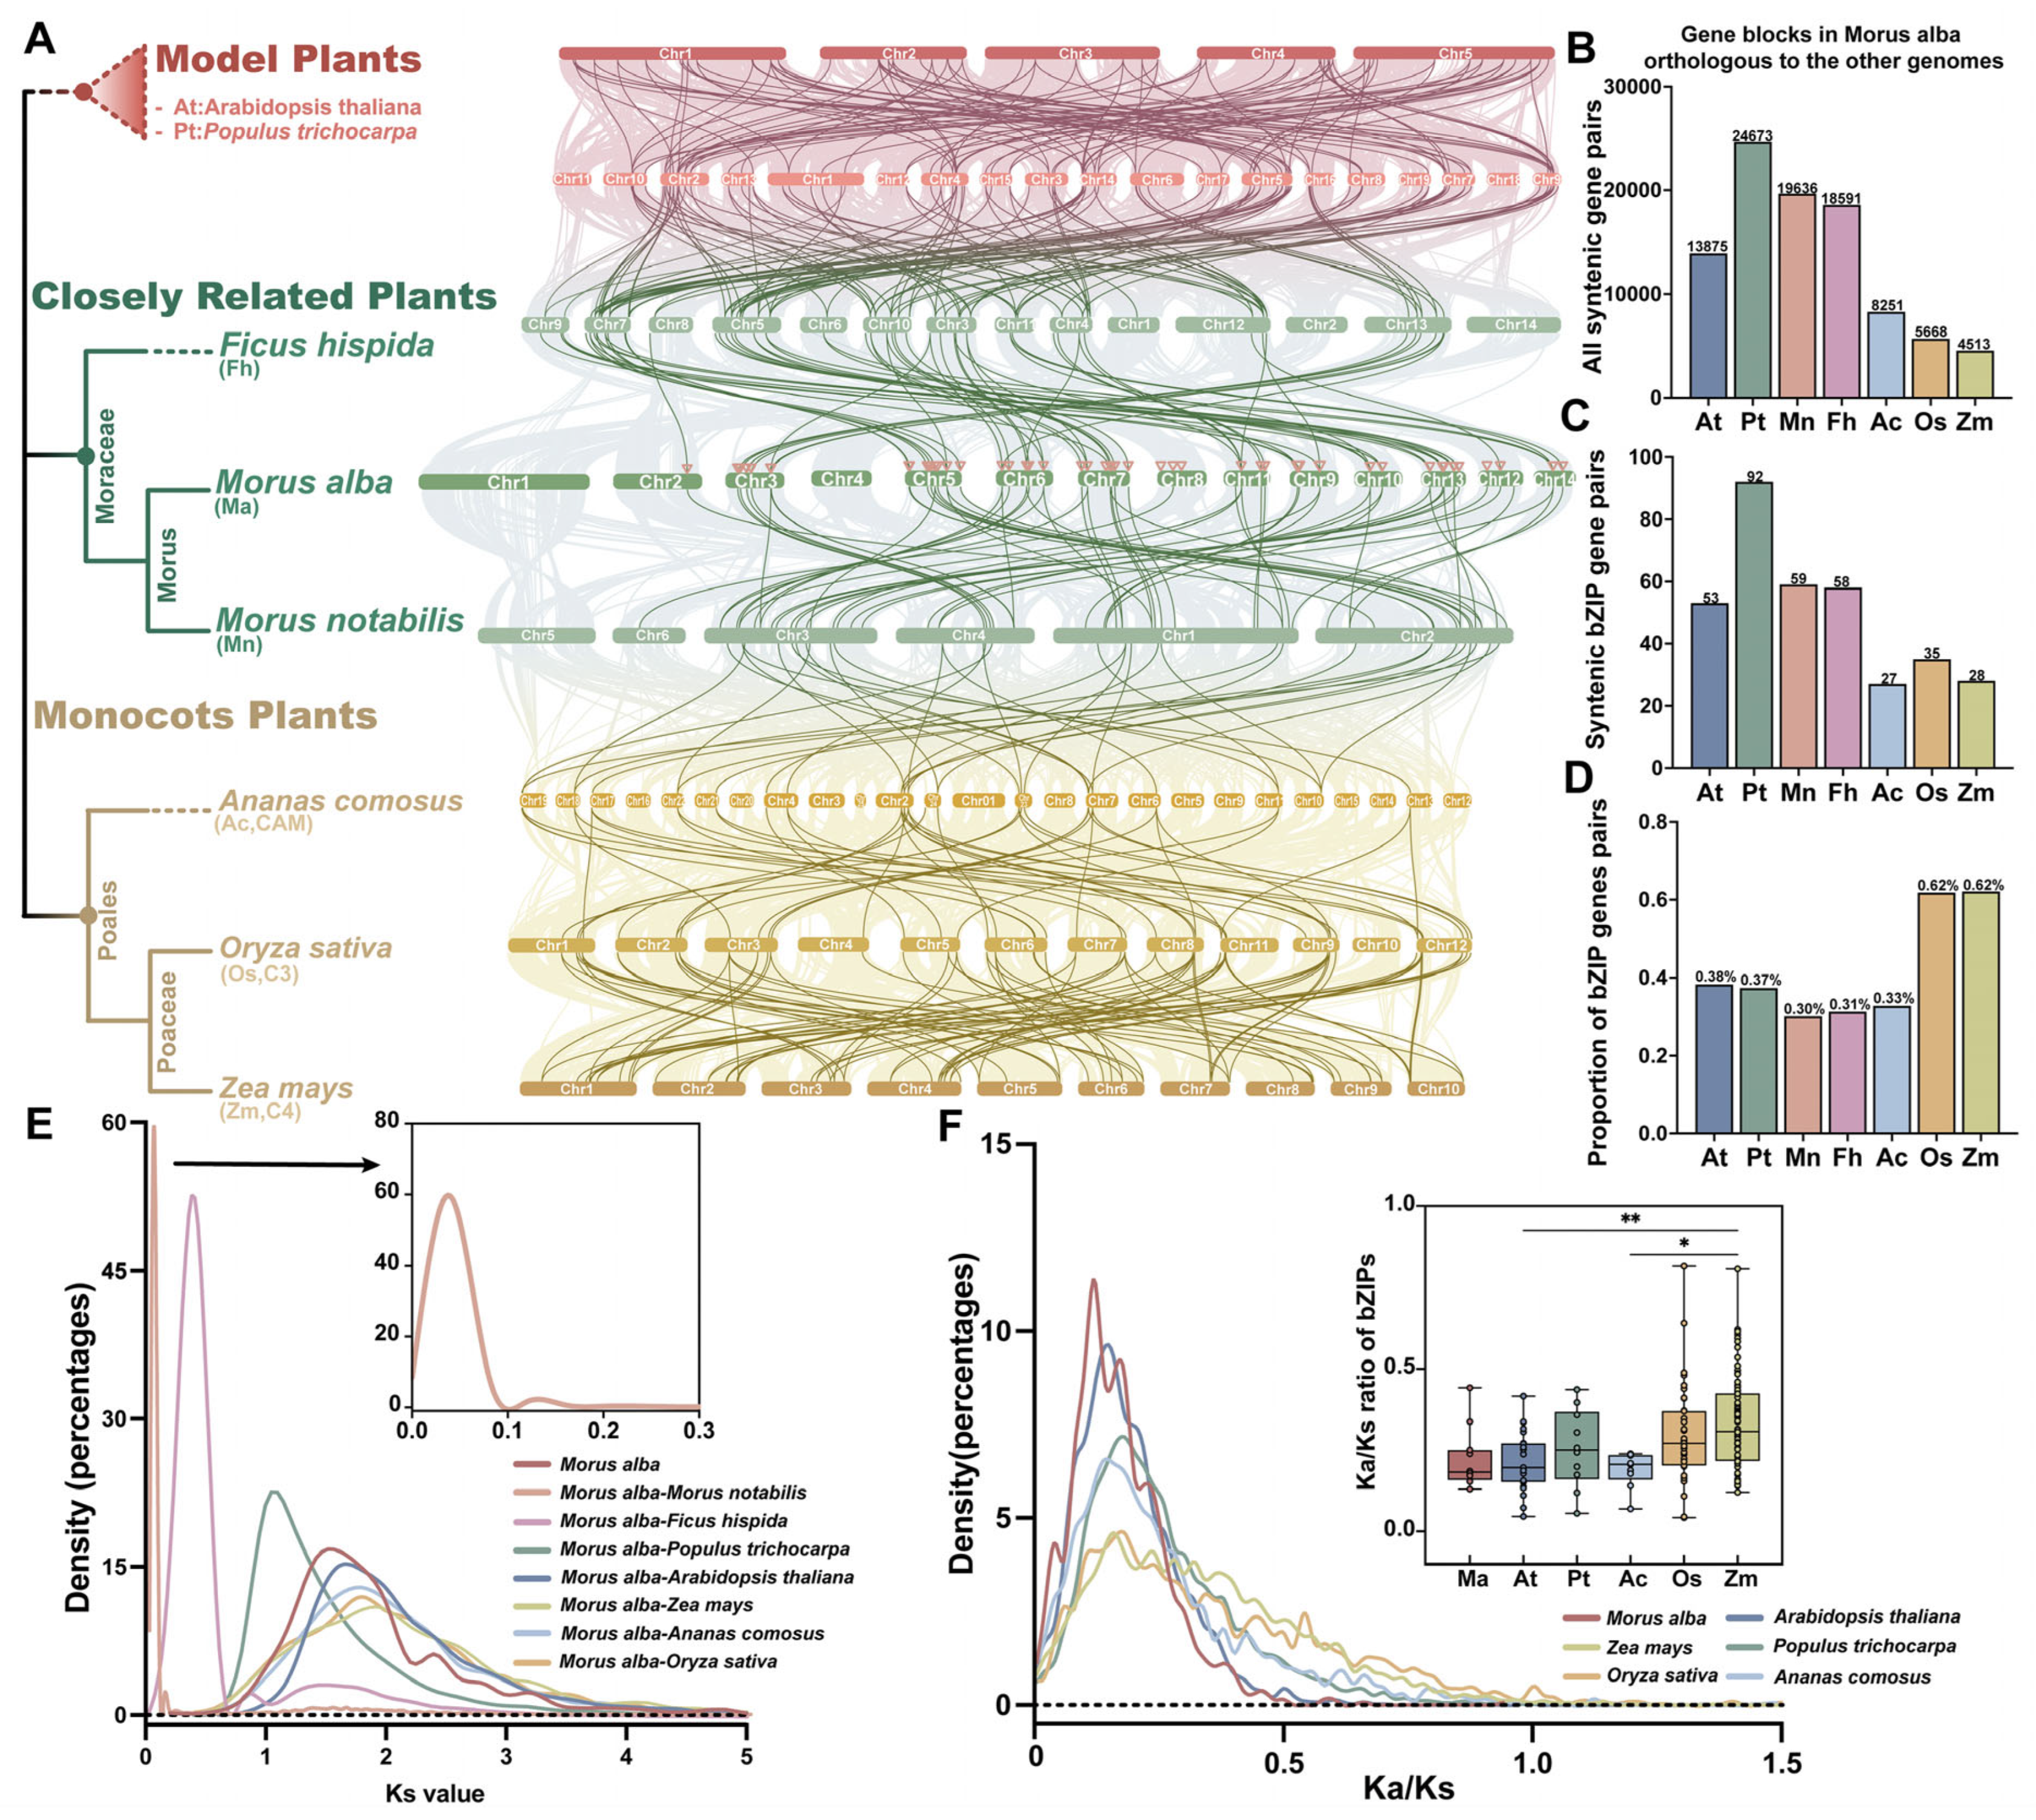
3.4. Collinearity and Evolutionary Analysis of bZIP Genes in Mulberry

Due to the significance of gene duplications including tandem and segmental duplication to large gene family evolution, analyzing the duplication events in MabZIP genes is necessary [61,62]. A total of 13 gene pairs with segmental duplication events and one pair with tandem duplication events were identified, which occurred on 10 of the 14 chromosomes (Figure 5; Table S3). These results suggest that segmental duplication events are the main driving force for the diversity of the bZIP genes in mulberry genome. The Ka/Ks of both segmental duplication and collinearity gene pairs are less than 1, except for the pair of MabZIP1 and MabZIP2, suggesting that the mulberry bZIP family might have undergone strong purifying selection during evolution (Figure 6F).
To study the homology of the bZIP family members among various species in depth, a colinear map of bZIP family genes was drawn, with eight plant species genome sequences, namely the model plant species (Arabidopsis thaliana and Populus trichocarpa), the closely related plant species (Ficus hispida, Morus alba and Morus notabilis), and the monocots plant species (Ananas comosus, Oryza sativa, Zea mays) (Figure 6A). Continuous collinear bZIP gene pairs were observed among these species, highlighting the conservation and functional importance of bZIP genes in plants. Notably, the degree of collinearity between Morus notabilis and Ananas comosus was significantly lower than the average, likely reflecting the substantial divergence between monocots and dicots.
Furthermore, we examined the collinearity relationships between MabZIP genes and their orthologs in the above seven species (Figure 6B–D; Table S4A–G). A total of 51 MabZIP genes exhibited collinearity relationships with 41 Arabidopsis thaliana genes, 68 Populus trichocarpa genes, 43 Morus notabilis genes, 41 Ficus hispida genes, 20 Ananas comosus genes, 21 Zea mays genes, and 28 Oryza sativa genes. The number of orthologous gene pairs between Morus alba and each species are as follows: 53 (Arabidopsis thaliana), 92 (Populus trichocarpa), 59 (Morus notabilis), 58 (Ficus hispida), 27 (Ananas comosus), 28 (Zea mays), and 35 (Oryza sativa). MabZIP genes exhibited higher orthology with the other three woody species compared to the monocots.
To assess evolutionary constraints, we also calculated the synonymous substitution rate (Ks) and the nonsynonymous (Ka)/synonymous (Ks) ratios (Figure 6E,F). Whole genome duplication (WGD) events not only drive speciation and adaptation through gene duplication but also exhibit distinct retention patterns for specific functional gene categories [63,64,65]. Notably, transcription factors demonstrate significant retention advantages following WGD processes, and their retention abilities display significant preferences [61]. The distribution of Ks for Morus alba syntenic blocks confirmed a major WGD peak (Ks = 1.6), indicating that Morus alba experienced the γ hexaploidization event shared in eudicots which is consistent with precious study [39]. Transcription factor families with high retention rates are functionally enriched in developmental regulation and stress response pathways [66]. Notably, the bZIP family demonstrates high-retention rates after WGD, illustrating functional potential in both abiotic and biotic stress adaptation [61].
Furthermore, compared to the genomes of monocots, the ks peaks are concentrated in the range of 1.72–1.94, indicating that the differentiation time of Morus alba and the above three monocots is similar. Ks analyses across dicot species demonstrate distinct divergence time, with Arabidopsis thaliana (Ks peak = 1.6), Populus trichocarpa (1.2), Ficus carica (0.4), and Morus notabilis (0.04) exhibiting sequentially decreasing Ks values relative to Morus alba. This descending gradient in Ks peak distribution correlates with progressively recent speciation events, corresponding to phylogenetic relationships.

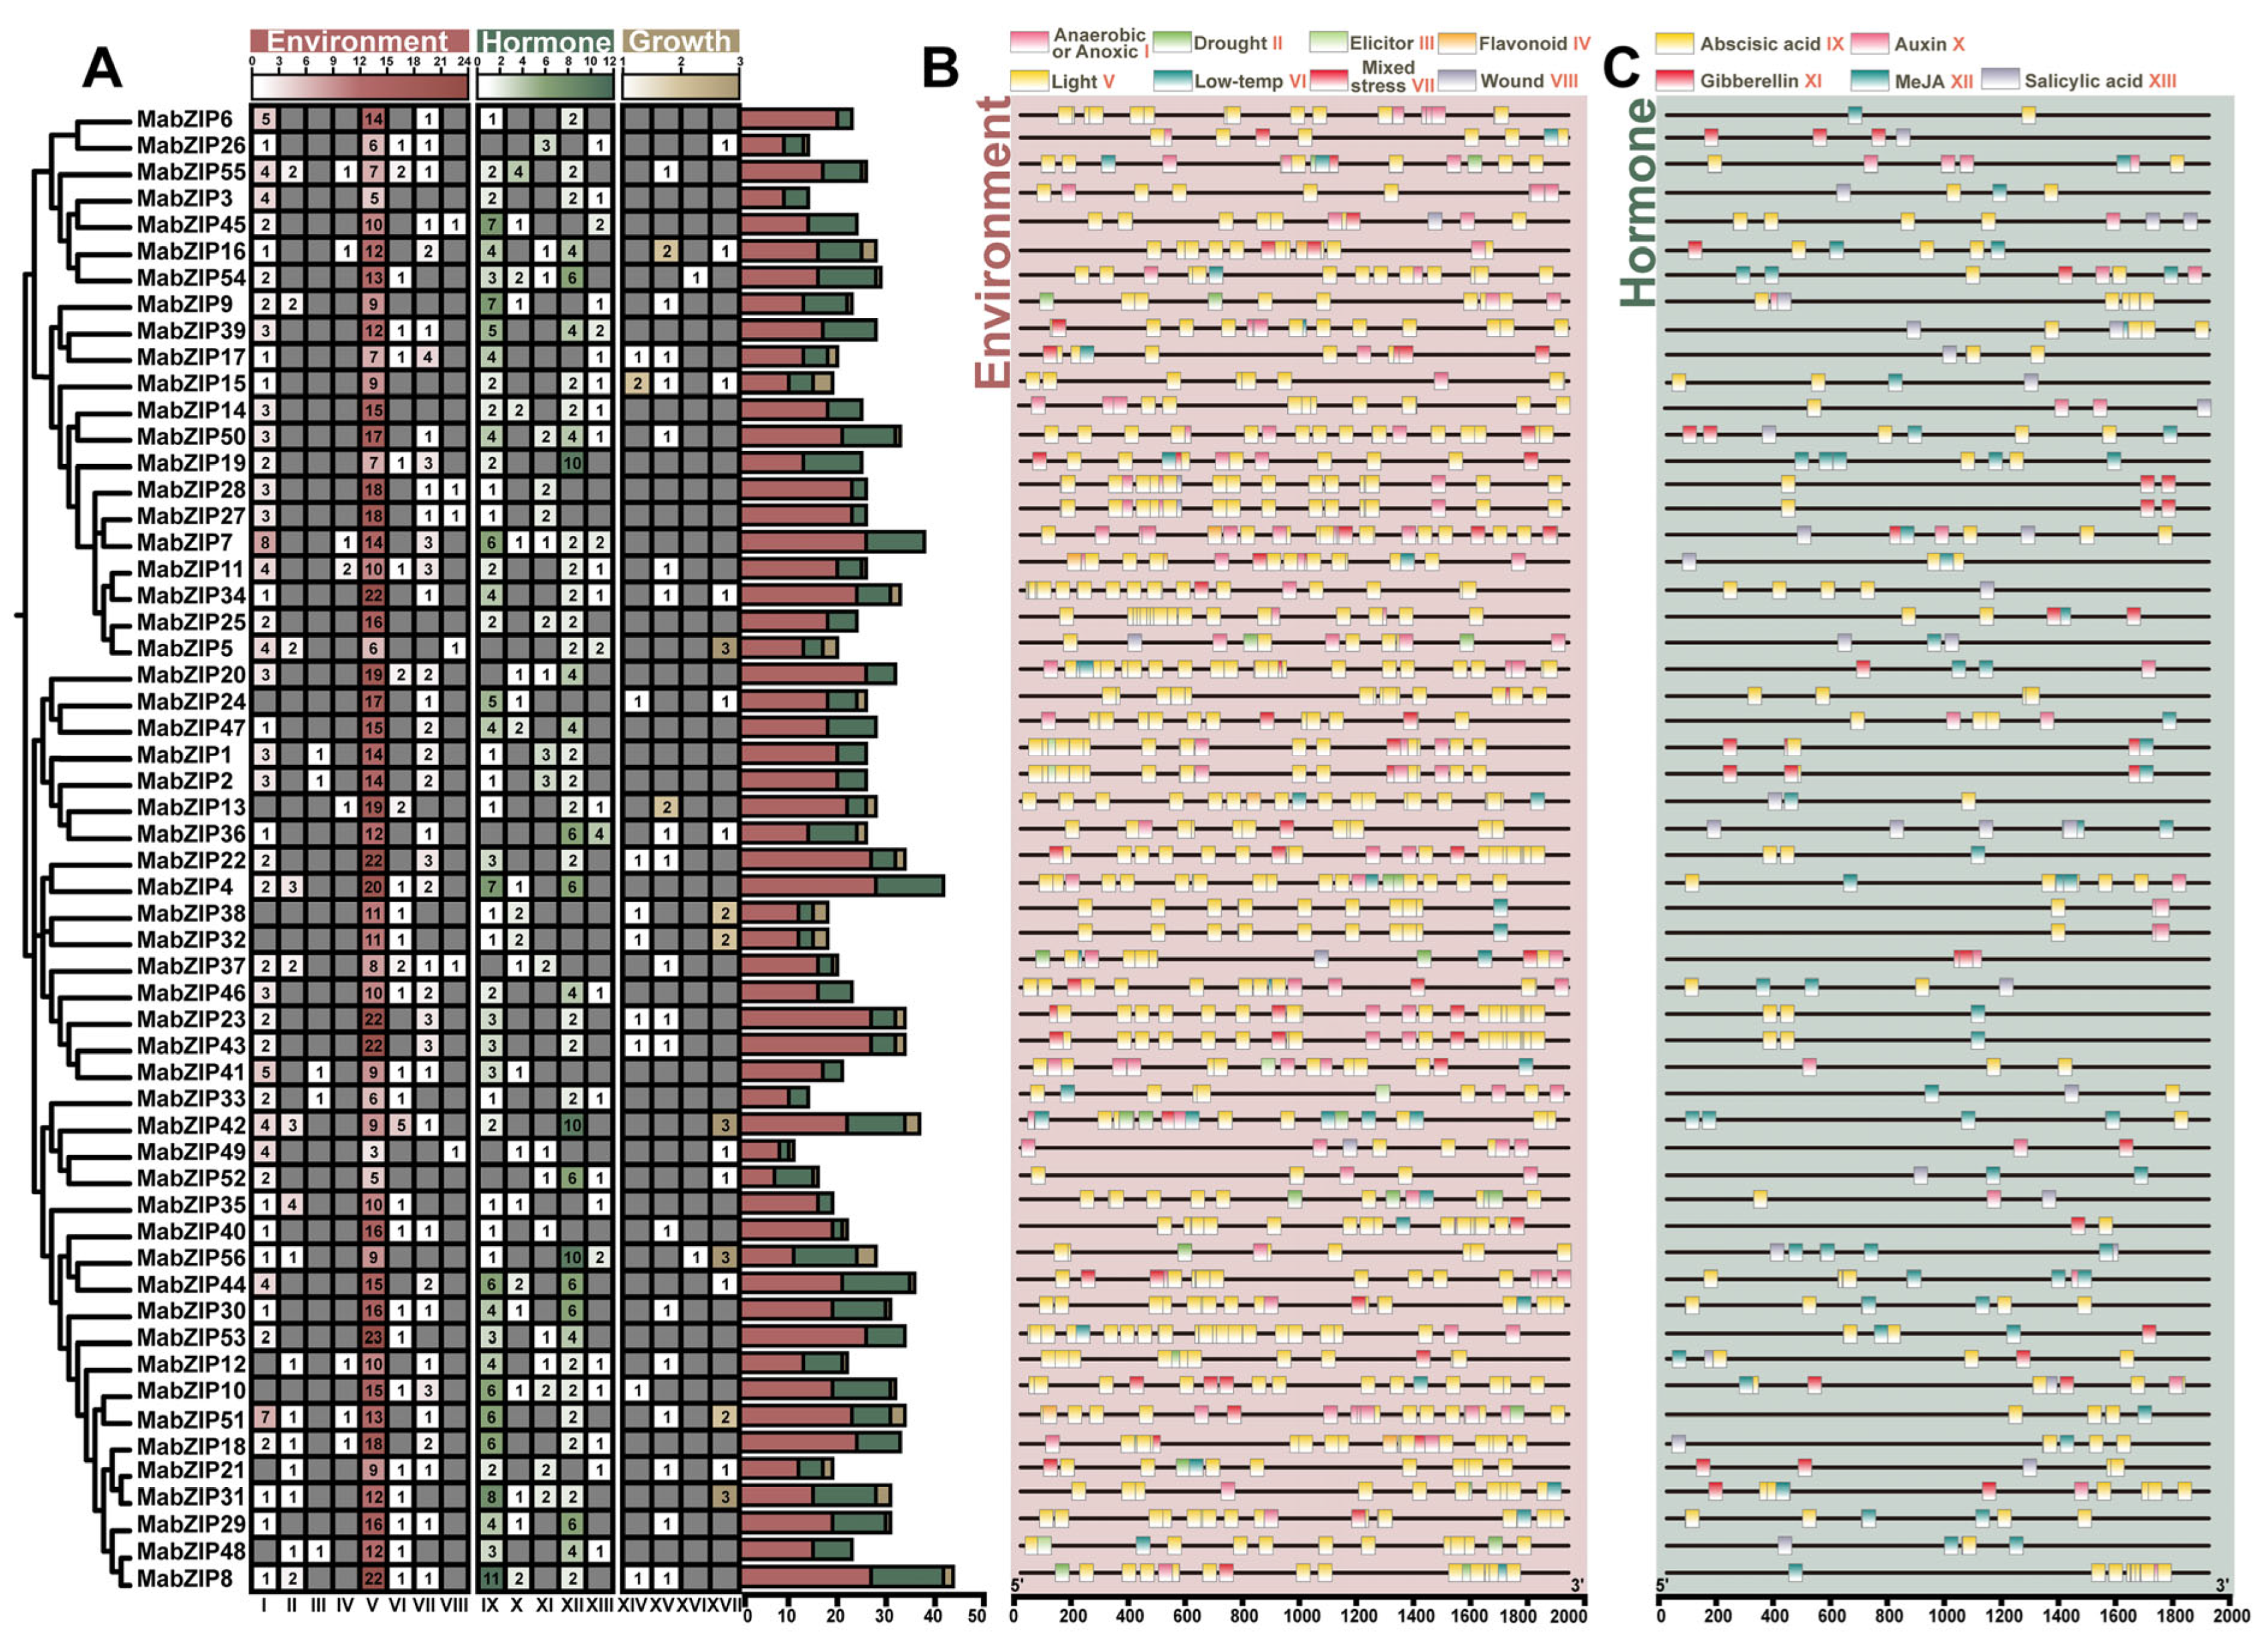
3.5. The Cis-Acting Elements Analysis of the bZIP Genes Promoter in Mulberry

To predict the functional roles of bZIP genes, we analyzed cis-acting elements within the 2000 bp upstream promoter regions of 56 MabZIP genes (Figure 7). Numerous cis-elements were identified and classified into three major categories (Environment, hormone and growth) and seventeen subcategories (Table S5). Light-responsive elements were the most abundant and were present in nearly all MabZIP promoters. Stress-responsive elements were also widely distributed and more abundant compared to growth-related elements, suggesting that the MabZIP family plays crucial roles in mulberry stress resistance. Hormone-responsive elements, particularly those related to ABA and methyl jasmonate (MeJA), were also prominent. Additionally, the widespread presence of MYB-binding sites highlights the potential involvement of MabZIP genes in regulating responses to environmental stresses. Overall, these findings suggest that MabZIP genes play a central role in orchestrating responses to environmental stimuli and hormonal signals.

3.6. Gene Expression in Response to Heat, Salt–Alkaline, and High Light Stress

To characterize the expression profiles of the MabZIP genes under abiotic stresses, we analyzed RNA-seq data collected with mulberry seedlings before and after heat, salt alkaline, and high light treatment (Figure 8A,B; Table S6). Under salt–alkaline stress, 11 genes were up-regulated and 8 down-regulated. Eight genes were up-regulated under high light stress. More differentially expressed MabZIP genes (DEGs) were found under salt–alkaline stress than other stresses. Notably, MabZIP43 and MabZIP24 were differentially expressed under all three conditions.
To further explore the biological processes involving MabZIP43 and MabZIP24, we performed protein–protein interaction (PPI) network and gene set enrichment analyses (Figure 8C–H) [58]. The PPI network of MabZIP43 was enriched for GO terms related to biological regulation, RNA metabolic processes, gene expression, and transcription. Genes in the network clustered into three groups: one enriched for auxin signaling pathways, one comprising spartin-like and VQ motif-containing proteins, and one associated with wound-induced proteins and arabinogalactan peptides. These results suggest that MabZIP43 may regulate mulberry growth, development, and stress responses [33,67]. The PPI network of MabZIP24 was mainly enriched in GO terms associated with cellular components, particularly intracellular membrane-bounded organelles. The network was divided into four clusters: aminoacyl-tRNA hydrolase activity, viral envelope proteins, Set1C/COMPASS complex, and valine biosynthesis. This suggests that MabZIP24 may regulate biotic and abiotic stress responses through effects on translation and DNA methylation [67,68].
Interestingly, MabZIP43 and MabZIP24 showed different expression patterns under heat stress compared to salt–alkaline and high light stresses (Figure 8D,G). Despite the conserved up-regulation of MabZIP24 under both high light and salt–alkaline stresses, its interacting genes, malb00014697 (homologous to Acetohydroxy acid isomeroreductase, AHIR in Arabidopsis) and malb00004982 (homologous to Dioxygenase for auxin oxidation 1, DAO1 in Arabidopsis) exhibit divergent responses, suggesting stress-specific regulatory crosstalk within the interaction network.

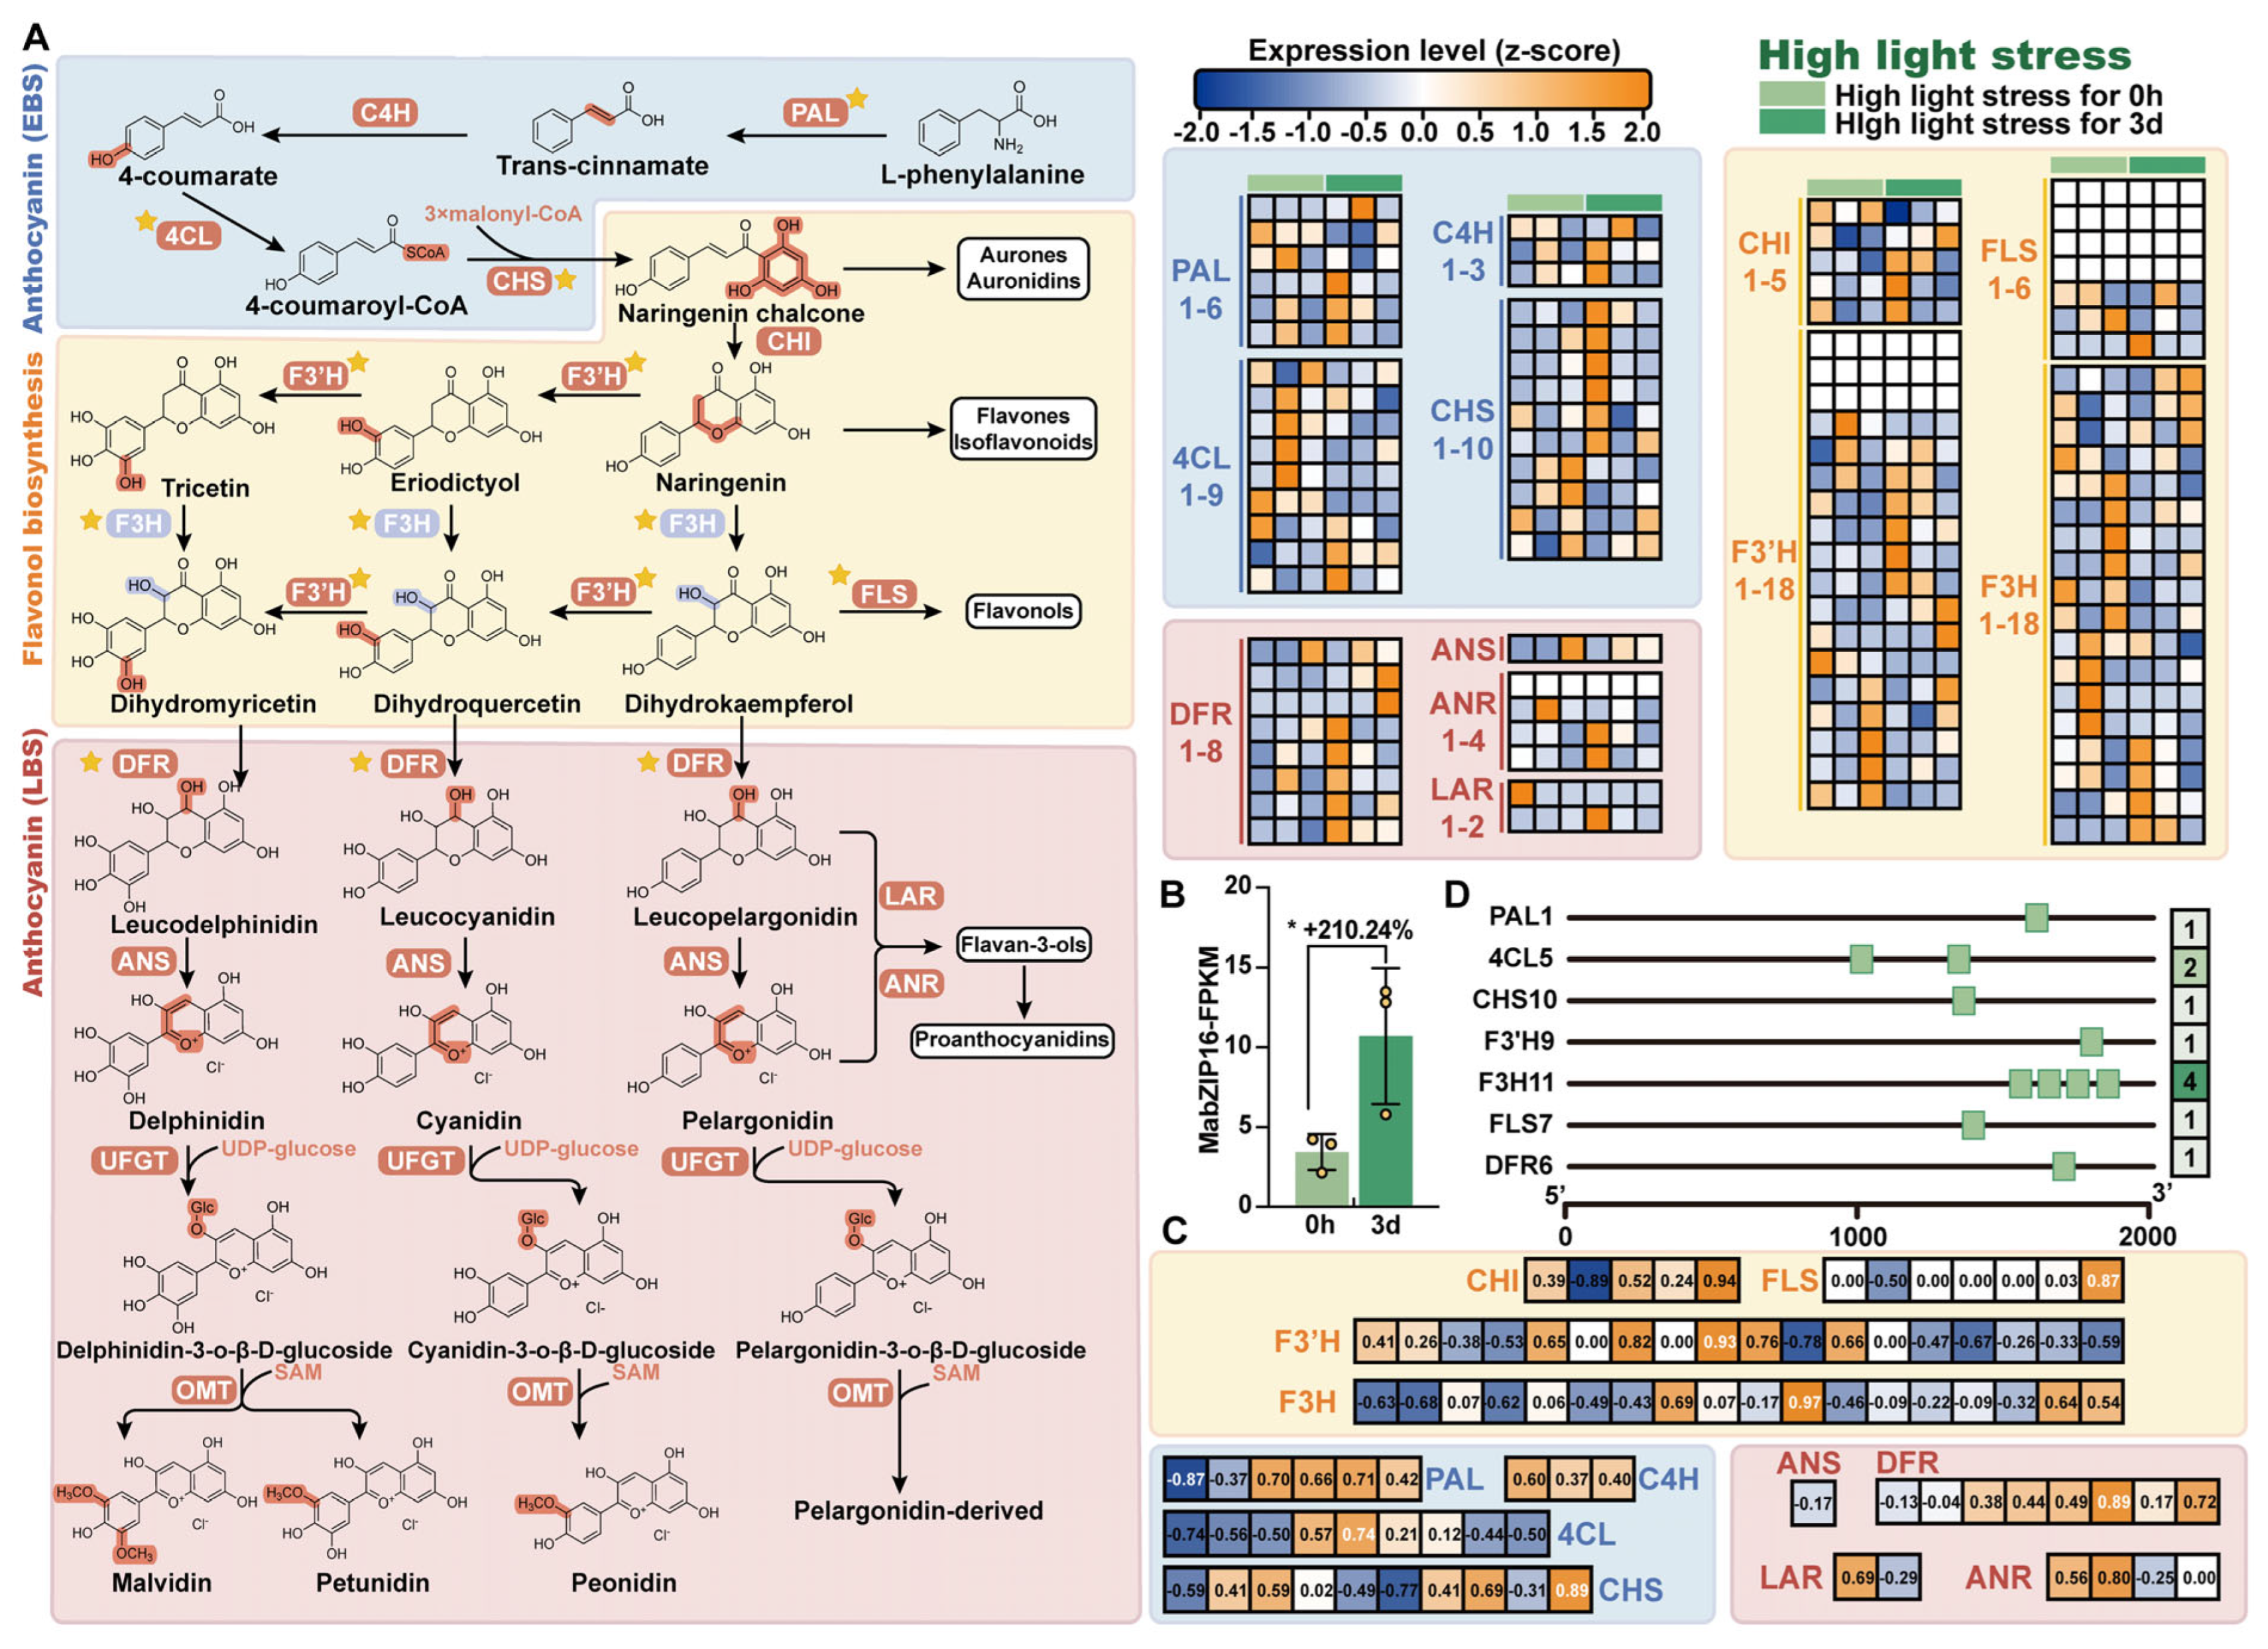
3.7. Identification of MabZIP Genes Involved in Anthocyanin Biosynthesis

Anthocyanin accumulation, commonly triggered by abiotic stresses such as high light, heat, and cold stresses, protects plants by absorbing excess light and provides antioxidant capacity in many plant species [29,33,69]. After high light stress, the juvenile leaves of mulberry seeding displayed a noticeable purple and red phenotype. To identify MabZIPs involved anthocyanin biosynthesis, we performed a co-expression analysis of MabZIP genes with anthocyanin biosynthesis structure genes. We identified 91 genes encoding 12 different enzymes involved in the anthocyanin biosynthetic pathway in genome of Morus alba by using “find best homology” in TBtools (Figure 9A; Table S7) [51]. Among these, two genes were strongly up-regulated and six genes displayed decreased expression in the juvenile leaves after high light treatment for three days.
Some of the bZIP transcription factors were recently reported to regulate anthocyanin biosynthesis [29,70,71]. Through MabZIP gene expression profile analysis of mulberry juvenile leaves (Figure S3), we identified MabZIP16 with significant up-regulation and MabZIP43 and 55 with down-regulation, which might be involving in anthocyanin biosynthesis. MabZIP16 clusters phylogenetically with Populus and Arabidopsis TGA transcription factors in Group D (associated with binding to TGACG motif), implicating its capability to bind to TGACG motif. After high light stress for 3 days, the expression level of MabZIP16 increased 2.1 times and showed significant correlations with most anthocyanin biosynthesis genes (Figure 9B,C). Promoter analysis revealed TGACG motifs in the upstream regions of genes including PAL1, 4CL5, CHS10, F3′H9, F3H9, FLS7, and DFR6, which could be the potential binding site for MabZIP16 (Figure 9D and Figure S2). These results suggest that MabZIP16 might directly regulate anthocyanin regulation under high light stress.

3.8. Validation of Candidate Genes by Quantitive Real-Time PCR

To verify the results of relative expression profiles of RNA-Seq, we used qRT-PCR to quantify the expression levels of MabZIP43 and 24 before and after the heat, salt–alkaline, and high light stress treatment (Figure 10). In addition, the gene expression tendency of Anthocyanin synthase (ANS) and MabZIP16 detected by qRT-PCR were consistent with RNA seq data.

4. Discussion

The cultivated and wild-type mulberry genome has recently been sequenced [38,39,72,73], but comparable studies of bZIP transcription factor in mulberry are still lacking. In this study, we employed a combination of two approaches—BLASTP and hmmsearch—to identify bZIP proteins in the mulberry genome (Figure 1). Two independent methods consistently identified a total of 49 bZIP proteins. Additionally, six proteins solely identified through BLASTP approach exhibited high sequence similarity to bZIP proteins in Arabidopsis and poplar, and manual verification and InterPro database validation conclusively confirm the presence of a conserved bZIP domain (Figure 4 and Figure S1B). This underscores the importance of integrating multiple strategies for comprehensive gene family identification, especially in newly sequenced genomes where domain annotation tools may fail to detect divergent or atypical members.
In total, we identified 56 bZIP-containing proteins in mulberry. Although the overall gene count in the mulberry genome is higher than that in Arabidopsis [38], the number of bZIP genes is slightly lower compared to analyzed angiosperm species, such as 78 in Arabidopsis [4], 86 in poplar [5], and 77 in Tobacco [74]. Interestingly, eleven proteins in mulberry are homologous to bZIP in Arabidopsis and poplar [4,5] but lack of the canonical bZIP domain (Figure 1), suggesting potential domain loss or divergence. The evolutionary and adaptive significance of these proteins in mulberry awaits further investigation. All 56 identified mulberry bZIP proteins possess the canonical bZIP domain, characterized by a conserved basic region for DNA binding and a leucine zipper motif for dimerization, indicating their conserved roles across angiosperms. Based on sequence similarity, these bZIP proteins can be grouped into 12 distinct clades. Comparative analysis revealed that, unlike Arabidopsis, the PtbZIP family lacks members in group K, while mulberry retains a group K homolog but lacks members in group M. This suggests possible functional redundancy or evolutionary divergence in these lineages.
We also analyzed various physicochemical properties of the mulberry bZIP proteins, including sequence length, molecular weight, and isoelectric point (Figure 1). The average gene length (~1190 bp) is consistent with bZIP coding sequences reported in the mulberry genome [38]. All identified bZIP proteins are predicted to be hydrophilic, aligning with their roles as transcription factors. Although according to our result, all MabZIP genes are predicted to be located in nucleus, recent study reported that some bZIP proteins contain signal peptides suggesting localization to the ER, consistent with their putative involvement in ER stress responses [75,76,77].
The DOG domain, known for its role in ABA-mediated seed dormancy and germination, coexists with the bZIP domain in several mulberry bZIP proteins, particularly in group D (Figure 4). This co-occurrence has also been reported in other species [78,79,80], indicating functional diversity and the potential domain co-evolution. However, the mechanisms that the bZIP domain coordinates with other domains remain largely unknown and require further study.
The mulberry tree is one of the few eudicots, yet one of several Rosales, that have not preserved genome duplications for more than 100 million years [38,39]. Gene duplication analysis revealed that thirteen gene pairs with segmental duplication events and one pair with a tandem duplication event were identified among the MabZIP genes (Figure 5), indicating that segmental duplication has played an important role in the expansion of the mulberry bZIP gene family. A similar pattern is observed in poplar. However, unlike mulberry, poplar has undergone at least three whole-genome duplication events, along with numerous segmental duplications, tandem duplications, and transpositions [46,81]. Furthermore, we performed a synteny analysis to explore the evolutionary history of bZIP genes across species (Figure 6). The number of collinear gene pairs between mulberry and other Moraceae plants was higher than those with Arabidopsis or monocots. Surprisingly, the highest number of collinear pairs was observed between mulberry and poplar, possibly due to more genome duplication events or expansion of poplar genome [62]. We further assessed the proportion of bZIP gene pairs relative to all syntenic gene pairs and found the lowest proportion between mulberry and Moraceae species, and the highest between mulberry and monocots. This suggests that, driven by prolonged artificial selection during domestication, the bZIP transcription factor family, pivotal in plant development and stress response, might undergo marked expansion in rice and maize genomes [82,83,84,85]. Ks analysis suggests that bZIPs in mulberry diverged after the split between Arabidopsis and poplar within the angiosperms. Furthermore, Ka/Ks ratios of less than 1 indicate that mulberry bZIP genes have undergone strong purifying selection.
Previous studies have demonstrated that bZIP transcription factors are involved in various physiological processes [86,87,88,89]. Promoter analysis predicted that numerous cis-elements responsive to environmental cues, hormones, and developmental signals present in the promoters of MabZIP genes (Figure 7). To further investigate the potential stress-related functions of bZIP genes, we analyzed their expression under heat, salt–alkaline, and high light stress through transcriptome data. We identified a total of 14, 19, and 8 DEGs, respectively, under these stress conditions. Among them, MabZIP24 and MabZIP43 showed significantly differential expression under all stress treatments. Their Arabidopsis homologs are AtbZIP52 (AT1G06850) and AtbZIP61 (AT3G58120)/AtbZIP34 (AT2G42380), respectively. AtbZIP52 has been reported to playing an important role in pollen development [90] and seed oil biosynthesis via interaction with AtbZIP18 and WRINKLED1, respectively [91]. AtbZIP34 and AtbZIP61 are essential for pollen development in Arabidopsis [92]. Whether these genes function in abiotic stress response remains to be elucidated. To explore the regulatory pathways potentially controlled by MabZIP43 and MabZIP24, we constructed a PPI network followed by GO enrichment analysis. GO enrichment of MabZIP43 interacting proteins related to auxin signaling pathway and auxin has recently been reported to respond to cold stress, indirectly promoting anthocyanin biosynthesis, which would improve cold tolerance in apples [33]. The GO enrichment of MabZIP24 includes aminoacyl-tRNA hydrolase activity and valine biosynthesis. Recently, it has been reported that the plant acquired the trait of thermotolerance through translation reprogramming [93].
Anthocyanins generally accumulate in plant tissues exposed to high light and UV-B stress [29,69,94]. Given the limited knowledge on the role of bZIP genes in regulating anthocyanin biosynthesis in mulberry, we analyzed the expression of bZIP and anthocyanin biosynthesis genes in leaves with high anthocyanin content. Previous research has shown that anthocyanin content is enriched in the second leaf of the mulberry cultivar EP while most other cultivars display yellow green juvenile leaves [95]. Additionally, under high light stress, anthocyanins significantly accumulate in the juvenile leaves but almost none accumulate in most mature leaves in mulberry. We found that MabZIP43 and MabZIP16 expression correlated with anthocyanin biosynthetic genes in the juvenile leaves under high light stress. MabZIP43, also identified as a hub gene in stress responses, may have multiple roles. MabZIP16, previously designated as a TGACG-binding transcription factor, appears to be salicylic acid-regulated, increasing plant tolerance stress by activating anthocyanin biosynthesis [14]. In conclusion, we identified three mulberry bZIP genes—MabZIP24, MabZIP43, and MabZIP16—that may play key roles in anthocyanin biosynthesis and environmental stress responses. Further functional studies using genetic, molecular, and biochemical approaches are needed to clarify their specific roles.

Supplementary Materials

The following supporting information can be downloaded at: https://www.mdpi.com/article/10.3390/horticulturae11060694/s1, Figure S1: Domain validation and methodological comparison of candidate MabZIP genes; Figure S2: Conserved domain and structural features of six candidate proteins. Six proteins retain DOG1 domain but lacking canonical bZIP domain; Figure S3: Heat map of MabZIP genes expression profiles of mulberry juvenile leaves under high light stress for 3 days; Table S1: Physicochemical properties and subcelluar location prediction of MabZIP proteins; Table S2: Annotations of MabZIP protein sequence motifs; Table S3: Duplication events of MabZIP gene pairs; Table S4: Syntenic gene pairs between mulberry and other seven species; Table S5: Classification of cis-acting elements; Table S6: DEGs in response to heat, salt-alkaline and high light stress; Table S7: Gene involved in the anthocyanin biosynthetic pathway in Morus alba; Table S8: The primers used in this study.

Author Contributions

Q.L., Z.H. and X.W. designed the research and experiments. Q.L. performed the experiments and analyzed the data. Q.L. and Z.H. wrote the manuscript. H.F., X.W. and H.Z. corrected the manuscript. All authors reviewed the manuscript. All authors have read and agreed to the published version of the manuscript.

Funding

The study was supported by Fundamental Research Funds for Natural Science Foundation of Chongqing (No. CSTB2024NSCQ-MSX0296); National key research and development program (No.2023YFD1600901); Chongqing Modern Agricultural Industry Technology System, COMAITS202411; and Chongqing Municipal Commerce Committee Silk Development Fund Project, 20240525100320700.

Data Availability Statement

All data sheets and codes to process data are available upon request to the corresponding author, Xiling Wang (wxlswu@163.com). Sequence data generated for this study is available publicly in the NCBI Sequence Read Archive under BioProject ID: PRJNA1020653 (https://www.ncbi.nlm.nih.gov/, accessed on 23 January 2024).

Acknowledgments

We would like to thank the Fundamental Research Funds for the Natural Science Foundation of Chongqing, Chongqing Modern Agricultural Industry Technology System, and Chongqing Municipal Commerce Committee Silk Development Fund Project for supporting the funding for this work.

Conflicts of Interest

The authors declare that they have no known competing financial interests or personal relationships that could have appeared to influence the work reported in this paper.

Abbreviations

PAL—phenylalanine ammonia-lyase; C4H—cinnamate-4-hydroxylase; 4CL—4-Coumaric acid CoA ligase; CHS—chalcone synthase; CHI—chalcone isomerase; F3H—flavanone 3-hydroxylase; F3′H—flavonoid 3′-hydroxylase; FLS—flavonol synthase; DFR—dihydroflavonol reductase; ANS—anthocyanin synthase; LAR—leucoanthocyanidin reductase; ANR—anthocyanidin reductase; UFGT—UDP-glycose flavonoid glycosyltransferase; OMT—flavonoid O-methyltransferase; UPR—unfolded protein response; HY5—HYPOCOTYL5; GBF1—G-box binding factor 1; CAT2—CATALASE2; ROS—reactive oxygen species; NPR1—NONEXPRESSOR OF PATHOGENESIS-RELATED GENES1; ABA—abscisic acid; IAA—indole-3-acetic acid; DOG1—DELAY OF GERMINATION 1; AAR—amino acid residues; GRAVY—grand average of hydropathicity; WGD—whole genome duplication; MeJA—methyl jasmonate; AHIR—Acetohydroxy acid isomeroreductase; DAO1—auxin oxidation; ER—endoplasmic reticulum.

References

  1. Jakoby, M.; Weisshaar, B.; Droge-Laser, W.; Vicente-Carbajosa, J.; Tiedemann, J.; Kroj, T.; Parcy, F. bZIP transcription factors in Arabidopsis. Trends Plant Sci. 2002, 7, 106–111. [Google Scholar] [CrossRef] [PubMed]
  2. Landschulz, W.H.; Johnson, P.F.; McKnight, S.L. The leucine zipper: A hypothetical structure common to a new class of DNA binding proteins. Science 1988, 240, 1759–1764. [Google Scholar] [CrossRef] [PubMed]
  3. Schutze, K.; Harter, K.; Chaban, C. Post-translational regulation of plant bZIP factors. Trends Plant Sci. 2008, 13, 247–255. [Google Scholar] [CrossRef] [PubMed]
  4. Droge-Laser, W.; Snoek, B.L.; Snel, B.; Weiste, C. The Arabidopsis bZIP transcription factor family-an update. Curr. Opin. Plant Biol. 2018, 45, 36–49. [Google Scholar] [CrossRef]
  5. Zhao, K.; Chen, S.; Yao, W.; Cheng, Z.; Zhou, B.; Jiang, T. Genome-wide analysis and expression profile of the bZIP gene family in poplar. BMC Plant Biol. 2021, 21, 122. [Google Scholar] [CrossRef]
  6. Fang, K.; Yao, X.; Tian, Y.; He, Y.; Lin, Y.; Lei, W.; Peng, S.; Pan, G.; Shi, H.; Zhang, D.; et al. Ubiquitin-specific protease UBP14 stabilizes HY5 by deubiquitination to promote photomorphogenesis in Arabidopsis thaliana. Proc. Natl. Acad. Sci. USA 2024, 121, e2404883121. [Google Scholar] [CrossRef]
  7. Gangappa, S.N.; Botto, J.F. The Multifaceted Roles of HY5 in Plant Growth and Development. Mol. Plant 2016, 9, 1353–1365. [Google Scholar] [CrossRef]
  8. Cackett, L.; Luginbuehl, L.H.; Schreier, T.B.; Lopez-Juez, E.; Hibberd, J.M. Chloroplast development in green plant tissues: The interplay between light, hormone, and transcriptional regulation. New Phytol. 2022, 233, 2000–2016. [Google Scholar] [CrossRef]
  9. Xu, X.; Chi, W.; Sun, X.; Feng, P.; Guo, H.; Li, J.; Lin, R.; Lu, C.; Wang, H.; Leister, D.; et al. Convergence of light and chloroplast signals for de-etiolation through ABI4-HY5 and COP1. Nat. Plants 2016, 2, 16066. [Google Scholar] [CrossRef]
  10. Ali, Z.; Sun, Y.; Ma, Z.; Zheng, Y.; Liu, Y. VvHY5 and VvBEE1 antagonistically control resveratrol biosynthesis to mitigate high light-induced damage in grapevine. J. Integr. Plant Biol. 2025, 67, 993–1008. [Google Scholar] [CrossRef]
  11. Brown, B.A.; Jenkins, G.I. UV-B signaling pathways with different fluence-rate response profiles are distinguished in mature Arabidopsis leaf tissue by requirement for UVR8, HY5, and HYH. Plant Physiol. 2008, 146, 576–588. [Google Scholar] [CrossRef] [PubMed]
  12. Jiang, X.; Xu, J.; Lin, R.; Song, J.; Shao, S.; Yu, J.; Zhou, Y. Light-induced HY5 Functions as a Systemic Signal to Coordinate the Photoprotective Response to Light Fluctuation. Plant Physiol. 2020, 184, 1181–1193. [Google Scholar] [CrossRef] [PubMed]
  13. Giri, M.K.; Singh, N.; Banday, Z.Z.; Singh, V.; Ram, H.; Singh, D.; Chattopadhyay, S.; Nandi, A.K. GBF1 differentially regulates CAT2 and PAD4 transcription to promote pathogen defense in Arabidopsis thaliana. Plant J 2017, 91, 802–815. [Google Scholar] [CrossRef] [PubMed]
  14. Li, Z.Y.; Ma, N.; Sun, P.; Zhang, F.J.; Li, L.; Li, H.; Zhang, S.; Wang, X.F.; You, C.X.; Zhang, Z. Fungal invasion-induced accumulation of salicylic acid promotes anthocyanin biosynthesis through MdNPR1-MdTGA2.2 module in apple fruits. Plant J. 2024, 119, 1859–1879. [Google Scholar] [CrossRef]
  15. Pieterse, C.M.; Van Loon, L.C. NPR1: The spider in the web of induced resistance signaling pathways. Curr. Opin. Plant Biol. 2004, 7, 456–464. [Google Scholar] [CrossRef]
  16. Lu, C.; Liu, X.; Tang, Y.; Fu, Y.; Zhang, J.; Yang, L.; Li, P.; Zhu, Z.; Dong, P. A comprehensive review of TGA transcription factors in plant growth, stress responses, and beyond. Int. J. Biol. Macromol. 2024, 258, 128880. [Google Scholar] [CrossRef]
  17. Zavaliev, R.; Dong, X. NPR1, a key immune regulator for plant survival under biotic and abiotic stresses. Mol. Cell 2024, 84, 131–141. [Google Scholar] [CrossRef]
  18. Behringer, C.; Bartsch, K.; Schaller, A. Safeners recruit multiple signalling pathways for the orchestrated induction of the cellular xenobiotic detoxification machinery in Arabidopsis. Plant Cell Environ. 2011, 34, 1970–1985. [Google Scholar] [CrossRef]
  19. Mueller, S.; Hilbert, B.; Dueckershoff, K.; Roitsch, T.; Krischke, M.; Mueller, M.J.; Berger, S. General detoxification and stress responses are mediated by oxidized lipids through TGA transcription factors in Arabidopsis. Plant Cell 2008, 20, 768–785. [Google Scholar] [CrossRef]
  20. Kim, S.Y.; Ma, J.; Perret, P.; Li, Z.; Thomas, T.L. Arabidopsis ABI5 subfamily members have distinct DNA-binding and transcriptional activities. Plant Physiol. 2002, 130, 688–697. [Google Scholar] [CrossRef]
  21. Skubacz, A.; Daszkowska-Golec, A.; Szarejko, I. The Role and Regulation of ABI5 (ABA-Insensitive 5) in Plant Development, Abiotic Stress Responses and Phytohormone Crosstalk. Front. Plant Sci. 2016, 7, 1884. [Google Scholar] [CrossRef] [PubMed]
  22. Yang, Q.; Yang, B.; Li, J.; Wang, Y.; Tao, R.; Yang, F.; Wu, X.; Yan, X.; Ahmad, M.; Shen, J.; et al. ABA-responsive ABRE-BINDING FACTOR3 activates DAM3 expression to promote bud dormancy in Asian pear. Plant Cell Environ. 2020, 43, 1360–1375. [Google Scholar] [CrossRef] [PubMed]
  23. Dietrich, K.; Weltmeier, F.; Ehlert, A.; Weiste, C.; Stahl, M.; Harter, K.; Droge-Laser, W. Heterodimers of the Arabidopsis transcription factors bZIP1 and bZIP53 reprogram amino acid metabolism during low energy stress. Plant Cell 2011, 23, 381–395. [Google Scholar] [CrossRef] [PubMed]
  24. Droge-Laser, W.; Weiste, C. The C/S(1) bZIP Network: A Regulatory Hub Orchestrating Plant Energy Homeostasis. Trends Plant Sci. 2018, 23, 422–433. [Google Scholar] [CrossRef]
  25. Hartmann, L.; Pedrotti, L.; Weiste, C.; Fekete, A.; Schierstaedt, J.; Gottler, J.; Kempa, S.; Krischke, M.; Dietrich, K.; Mueller, M.J.; et al. Crosstalk between Two bZIP Signaling Pathways Orchestrates Salt-Induced Metabolic Reprogramming in Arabidopsis Roots. Plant Cell 2015, 27, 2244–2260. [Google Scholar] [CrossRef]
  26. Gai, S.; Du, B.; Xiao, Y.; Zhang, X.; Turupu, M.; Yao, Q.; Wang, X.; Yan, Y.; Li, T. bZIP Transcription Factor PavbZIP6 Regulates Anthocyanin Accumulation by Increasing Abscisic Acid in Sweet Cherry. Int. J. Mol. Sci. 2024, 25, 10207. [Google Scholar] [CrossRef]
  27. Xu, Z.; Wang, J.; Ma, Y.; Wang, F.; Wang, J.; Zhang, Y.; Hu, X. The bZIP transcription factor SlAREB1 regulates anthocyanin biosynthesis in response to low temperature in tomato. Plant J. 2023, 115, 205–219. [Google Scholar] [CrossRef]
  28. An, J.P.; Yao, J.F.; Xu, R.R.; You, C.X.; Wang, X.F.; Hao, Y.J. Apple bZIP transcription factor MdbZIP44 regulates abscisic acid-promoted anthocyanin accumulation. Plant Cell Environ. 2018, 41, 2678–2692. [Google Scholar] [CrossRef]
  29. Liu, C.C.; Chi, C.; Jin, L.J.; Zhu, J.; Yu, J.Q.; Zhou, Y.H. The bZip transcription factor HY5 mediates CRY1a-induced anthocyanin biosynthesis in tomato. Plant Cell Environ. 2018, 41, 1762–1775. [Google Scholar] [CrossRef]
  30. Shin, D.H.; Choi, M.; Kim, K.; Bang, G.; Cho, M.; Choi, S.B.; Choi, G.; Park, Y.I. HY5 regulates anthocyanin biosynthesis by inducing the transcriptional activation of the MYB75/PAP1 transcription factor in Arabidopsis. FEBS Lett. 2013, 587, 1543–1547. [Google Scholar] [CrossRef]
  31. Stracke, R.; Favory, J.J.; Gruber, H.; Bartelniewoehner, L.; Bartels, S.; Binkert, M.; Funk, M.; Weisshaar, B.; Ulm, R. The Arabidopsis bZIP transcription factor HY5 regulates expression of the PFG1/MYB12 gene in response to light and ultraviolet-B radiation. Plant Cell Environ. 2010, 33, 88–103. [Google Scholar] [CrossRef] [PubMed]
  32. Li, Y.; Xu, P.; Chen, G.; Wu, J.; Liu, Z.; Lian, H. FvbHLH9 Functions as a Positive Regulator of Anthocyanin Biosynthesis by Forming a HY5-bHLH9 Transcription Complex in Strawberry Fruits. Plant Cell Physiol. 2020, 61, 826–837. [Google Scholar] [CrossRef] [PubMed]
  33. Liu, X.; Wei, J.; Li, S.; Li, J.; Cao, H.; Huang, D.; Zhang, D.; Zhang, Z.; Gao, T.; Zhang, Y.; et al. MdHY5 positively regulates cold tolerance in apple by integrating the auxin and abscisic acid pathways. New Phytol. 2025, 246, 2155–2173. [Google Scholar] [CrossRef] [PubMed]
  34. Li, D.; Chen, G.; Ma, B.; Zhong, C.; He, N. Metabolic Profiling and Transcriptome Analysis of Mulberry Leaves Provide Insights into Flavonoid Biosynthesis. J. Agric. Food Chem. 2020, 68, 1494–1504. [Google Scholar] [CrossRef]
  35. Li, H.; Yang, Z.; Zeng, Q.; Wang, S.; Luo, Y.; Huang, Y.; Xin, Y.; He, N. Abnormal expression of bHLH3 disrupts a flavonoid homeostasis network, causing differences in pigment composition among mulberry fruits. Hortic. Res. 2020, 7, 83. [Google Scholar] [CrossRef]
  36. Liu, C.; Hu, J.; Fan, W.; Zhu, P.; Cao, B.; Zheng, S.; Xia, Z.; Zhu, Y.; Zhao, A. Heterotrimeric G-protein gamma subunits regulate ABA signaling in response to drought through interacting with PP2Cs and SnRK2s in mulberry (Morus alba L.). Plant Physiol. Biochem. 2021, 161, 210–221. [Google Scholar] [CrossRef]
  37. Ma, L.; Ma, Y.; Gao, Q.; Liu, S.; Zhu, Z.; Shi, X.; Dai, F.; Reis, R.L.; Kundu, S.C.; Cai, K.; et al. Mulberry Leaf Lipid Nanoparticles: A Naturally Targeted CRISPR/Cas9 Oral Delivery Platform for Alleviation of Colon Diseases. Small 2024, 20, e2307247. [Google Scholar] [CrossRef]
  38. He, N.; Zhang, C.; Qi, X.; Zhao, S.; Tao, Y.; Yang, G.; Lee, T.H.; Wang, X.; Cai, Q.; Li, D.; et al. Draft genome sequence of the mulberry tree Morus notabilis. Nat. Commun. 2013, 4, 2445. [Google Scholar] [CrossRef]
  39. Jiao, F.; Luo, R.; Dai, X.; Liu, H.; Yu, G.; Han, S.; Lu, X.; Su, C.; Chen, Q.; Song, Q.; et al. Chromosome-Level Reference Genome and Population Genomic Analysis Provide Insights into the Evolution and Improvement of Domesticated Mulberry (Morus alba). Mol. Plant 2020, 13, 1001–1012. [Google Scholar] [CrossRef]
  40. Liu, L.; Chao, N.; Yidilisi, K.; Kang, X.; Cao, X. Comprehensive analysis of the MYB transcription factor gene family in Morus alba. BMC Plant Biol. 2022, 22, 281. [Google Scholar] [CrossRef]
  41. Ma, B.; Luo, Y.; Jia, L.; Qi, X.; Zeng, Q.; Xiang, Z.; He, N. Genome-wide identification and expression analyses of cytochrome P450 genes in mulberry (Morus notabilis). J. Integr. Plant Biol. 2014, 56, 887–901. [Google Scholar] [CrossRef] [PubMed]
  42. Hufford, M.B.; Seetharam, A.S.; Woodhouse, M.R.; Chougule, K.M.; Ou, S.; Liu, J.; Ricci, W.A.; Guo, T.; Olson, A.; Qiu, Y.; et al. De novo assembly, annotation, and comparative analysis of 26 diverse maize genomes. Science 2021, 373, 655–662. [Google Scholar] [CrossRef] [PubMed]
  43. Ming, R.; VanBuren, R.; Wai, C.M.; Tang, H.; Schatz, M.C.; Bowers, J.E.; Lyons, E.; Wang, M.L.; Chen, J.; Biggers, E.; et al. The pineapple genome and the evolution of CAM photosynthesis. Nat. Genet. 2015, 47, 1435–1442. [Google Scholar] [CrossRef] [PubMed]
  44. Goodstein, D.M.; Shu, S.; Howson, R.; Neupane, R.; Hayes, R.D.; Fazo, J.; Mitros, T.; Dirks, W.; Hellsten, U.; Putnam, N.; et al. Phytozome: A comparative platform for green plant genomics. Nucleic Acids Res. 2012, 40, D1178–D1186. [Google Scholar] [CrossRef]
  45. Ouyang, S.; Zhu, W.; Hamilton, J.; Lin, H.; Campbell, M.; Childs, K.; Thibaud-Nissen, F.; Malek, R.L.; Lee, Y.; Zheng, L.; et al. The TIGR Rice Genome Annotation Resource: Improvements and new features. Nucleic Acids Res. 2007, 35, D883–D887. [Google Scholar] [CrossRef]
  46. Tuskan, G.A.; Difazio, S.; Jansson, S.; Bohlmann, J.; Grigoriev, I.; Hellsten, U.; Putnam, N.; Ralph, S.; Rombauts, S.; Salamov, A.; et al. The genome of black cottonwood, Populus trichocarpa (Torr. & Gray). Science 2006, 313, 1596–1604. [Google Scholar] [CrossRef]
  47. Liao, Z.; Zhang, T.; Lei, W.; Wang, Y.; Yu, J.; Wang, Y.; Chai, K.; Wang, G.; Zhang, H.; Zhang, X. A telomere-to-telomere reference genome of ficus (Ficus hispida) provides new insights into sex determination. Hortic. Res. 2024, 11, uhad257. [Google Scholar] [CrossRef]
  48. Stiehler, F.; Steinborn, M.; Scholz, S.; Dey, D.; Weber, A.P.M.; Denton, A.K. Helixer: Cross-species gene annotation of large eukaryotic genomes using deep learning. Bioinformatics 2021, 36, 5291–5298. [Google Scholar] [CrossRef]
  49. Blum, M.; Andreeva, A.; Florentino, L.C.; Chuguransky, S.R.; Grego, T.; Hobbs, E.; Pinto, B.L.; Orr, A.; Paysan-Lafosse, T.; Ponamareva, I.; et al. InterPro: The protein sequence classification resource in 2025. Nucleic Acids Res. 2025, 53, D444–D456. [Google Scholar] [CrossRef]
  50. Chen, C.; Wu, Y.; Li, J.; Wang, X.; Zeng, Z.; Xu, J.; Liu, Y.; Feng, J.; Chen, H.; He, Y.; et al. TBtools-II: A “one for all, all for one” bioinformatics platform for biological big-data mining. Mol. Plant 2023, 16, 1733–1742. [Google Scholar] [CrossRef]
  51. Chen, C.; Chen, H.; Zhang, Y.; Thomas, H.R.; Frank, M.H.; He, Y.; Xia, R. TBtools: An Integrative Toolkit Developed for Interactive Analyses of Big Biological Data. Mol. Plant 2020, 13, 1194–1202. [Google Scholar] [CrossRef] [PubMed]
  52. Tamura, K.; Stecher, G.; Kumar, S. MEGA11: Molecular Evolutionary Genetics Analysis Version 11. Mol. Biol. Evol. 2021, 38, 3022–3027. [Google Scholar] [CrossRef] [PubMed]
  53. Bailey, T.L.; Boden, M.; Buske, F.A.; Frith, M.; Grant, C.E.; Clementi, L.; Ren, J.; Li, W.W.; Noble, W.S. MEME SUITE: Tools for motif discovery and searching. Nucleic Acids Res. 2009, 37, W202–W208. [Google Scholar] [CrossRef] [PubMed]
  54. Wang, Y.; Tang, H.; Debarry, J.D.; Tan, X.; Li, J.; Wang, X.; Lee, T.H.; Jin, H.; Marler, B.; Guo, H.; et al. MCScanX: A toolkit for detection and evolutionary analysis of gene synteny and collinearity. Nucleic Acids Res. 2012, 40, e49. [Google Scholar] [CrossRef]
  55. Lescot, M.; Dehais, P.; Thijs, G.; Marchal, K.; Moreau, Y.; Van de Peer, Y.; Rouze, P.; Rombauts, S. PlantCARE, a database of plant cis-acting regulatory elements and a portal to tools for in silico analysis of promoter sequences. Nucleic Acids Res. 2002, 30, 325–327. [Google Scholar] [CrossRef]
  56. Yang, L.; Hou, Z.; Liu, C.; Zhu, C.; Qin, Y.; Wang, X. Exogenous γ-aminobutyric acid enhanced salt-alkaline tolerance in mulberry trees through transcriptomic sequencing analysis. Plant Stress. 2024, 14, 100595. [Google Scholar] [CrossRef]
  57. Anders, S.; Huber, W. Differential expression analysis for sequence count data. Genome Biol. 2010, 11, R106. [Google Scholar] [CrossRef]
  58. Szklarczyk, D.; Nastou, K.; Koutrouli, M.; Kirsch, R.; Mehryary, F.; Hachilif, R.; Hu, D.; Peluso, M.E.; Huang, Q.; Fang, T.; et al. The STRING database in 2025: Protein networks with directionality of regulation. Nucleic Acids Res. 2025, 53, D730–D737. [Google Scholar] [CrossRef]
  59. Hou, Z.; Xu, D.; Deng, N.; Li, Y.; Yang, L.; Li, S.; Zhou, H.; Huang, Q.; Wang, X. Comparative proteomics of mulberry leaves at different developmental stages identify novel proteins function related to photosynthesis. Front. Plant Sci. 2021, 12, 797631. [Google Scholar] [CrossRef]
  60. Hou, Z.; Pang, X.; Hedtke, B.; Grimm, B. In vivo functional analysis of the structural domains of FLUORESCENT (FLU). Plant J. 2021, 107, 360–376. [Google Scholar] [CrossRef]
  61. Wu, S.; Han, B.; Jiao, Y. Genetic Contribution of Paleopolyploidy to Adaptive Evolution in Angiosperms. Mol. Plant 2020, 13, 59–71. [Google Scholar] [CrossRef] [PubMed]
  62. Panchy, N.; Lehti-Shiu, M.; Shiu, S.H. Evolution of Gene Duplication in Plants. Plant Physiol. 2016, 171, 2294–2316. [Google Scholar] [CrossRef] [PubMed]
  63. Freeling, M. Bias in plant gene content following different sorts of duplication: Tandem, whole-genome, segmental, or by transposition. Annu. Rev. Plant Biol. 2009, 60, 433–453. [Google Scholar] [CrossRef] [PubMed]
  64. Maere, S.; De Bodt, S.; Raes, J.; Casneuf, T.; Van Montagu, M.; Kuiper, M.; Van de Peer, Y. Modeling gene and genome duplications in eukaryotes. Proc. Natl. Acad. Sci. USA 2005, 102, 5454–5459. [Google Scholar] [CrossRef]
  65. Soltis, P.S.; Soltis, D.E. Ancient WGD events as drivers of key innovations in angiosperms. Curr. Opin. Plant Biol. 2016, 30, 159–165. [Google Scholar] [CrossRef]
  66. Khan, S.A.; Li, M.Z.; Wang, S.M.; Yin, H.J. Revisiting the Role of Plant Transcription Factors in the Battle against Abiotic Stress. Int. J. Mol. Sci. 2018, 19, 1634. [Google Scholar] [CrossRef]
  67. Jing, Y.; Lin, R. The VQ Motif-Containing Protein Family of Plant-Specific Transcriptional Regulators. Plant Physiol. 2015, 169, 371–378. [Google Scholar] [CrossRef]
  68. Mikheyeva, I.V.; Grady, P.J.; Tamburini, F.B.; Lorenz, D.R.; Cam, H.P. Multifaceted genome control by Set1 Dependent and Independent of H3K4 methylation and the Set1C/COMPASS complex. PLoS Genet. 2014, 10, e1004740. [Google Scholar] [CrossRef]
  69. Zirngibl, M.E.; Araguirang, G.E.; Kitashova, A.; Jahnke, K.; Rolka, T.; Kuhn, C.; Nagele, T.; Richter, A.S. Triose phosphate export from chloroplasts and cellular sugar content regulate anthocyanin biosynthesis during high light acclimation. Plant Commun. 2023, 4, 100423. [Google Scholar] [CrossRef]
  70. Gao, Z.; Sun, Y.; Zhu, Z.; Ni, N.; Sun, S.; Nie, M.; Du, W.; Irfan, M.; Chen, L.; Zhang, L. Transcription factors LvBBX24 and LvbZIP44 coordinated anthocyanin accumulation in response to light in lily petals. Hortic. Res. 2024, 11, uhae211. [Google Scholar] [CrossRef]
  71. Liu, W.; Mei, Z.; Yu, L.; Gu, T.; Li, Z.; Zou, Q.; Zhang, S.; Fang, H.; Wang, Y.; Zhang, Z.; et al. The ABA-induced NAC transcription factor MdNAC1 interacts with a bZIP-type transcription factor to promote anthocyanin synthesis in red-fleshed apples. Hortic. Res. 2023, 10, uhad049. [Google Scholar] [CrossRef] [PubMed]
  72. Dai, F.; Zhuo, X.; Luo, G.; Wang, Z.; Xu, Y.; Wang, D.; Zhong, J.; Lin, S.; Chen, L.; Li, Z.; et al. Genomic Resequencing Unravels the Genetic Basis of Domestication, Expansion, and Trait Improvement in Morus Atropurpurea. Adv. Sci. (Weinh) 2023, 10, e2300039. [Google Scholar] [CrossRef]
  73. Ma, B.; Wang, H.; Liu, J.; Chen, L.; Xia, X.; Wei, W.; Yang, Z.; Yuan, J.; Luo, Y.; He, N. The gap-free genome of mulberry elucidates the architecture and evolution of polycentric chromosomes. Hortic. Res. 2023, 10, uhad111. [Google Scholar] [CrossRef] [PubMed]
  74. Duan, L.; Mo, Z.; Fan, Y.; Li, K.; Yang, M.; Li, D.; Ke, Y.; Zhang, Q.; Wang, F.; Fan, Y.; et al. Genome-wide identification and expression analysis of the bZIP transcription factor family genes in response to abiotic stress in Nicotiana tabacum L. BMC Genom. 2022, 23, 318. [Google Scholar] [CrossRef] [PubMed]
  75. Ko, D.K.; Brandizzi, F. Transcriptional competition shapes proteotoxic ER stress resolution. Nat. Plants 2022, 8, 481–490. [Google Scholar] [CrossRef]
  76. Ko, D.K.; Brandizzi, F. Dynamics of ER stress-induced gene regulation in plants. Nat. Rev. Genet. 2024, 25, 513–525. [Google Scholar] [CrossRef]
  77. Ruberti, C.; Lai, Y.; Brandizzi, F. Recovery from temporary endoplasmic reticulum stress in plants relies on the tissue-specific and largely independent roles of bZIP28 and bZIP60, as well as an antagonizing function of BAX-Inhibitor 1 upon the pro-adaptive signaling mediated by bZIP28. Plant J. 2018, 93, 155–165. [Google Scholar] [CrossRef]
  78. Azeem, F.; Tahir, H.; Ijaz, U.; Shaheen, T. A genome-wide comparative analysis of bZIP transcription factors in G. arboreum and G. raimondii (Diploid ancestors of present-day cotton). Physiol. Mol. Biol. Plants 2020, 26, 433–444. [Google Scholar] [CrossRef]
  79. Yang, Y.; Li, J.; Li, H.; Yang, Y.; Guang, Y.; Zhou, Y. The bZIP gene family in watermelon: Genome-wide identification and expression analysis under cold stress and root-knot nematode infection. PeerJ 2019, 7, e7878. [Google Scholar] [CrossRef]
  80. Zhijun, Z.; Peiyao, Y.; Bing, H.; Ruifang, M.; Vinod, K.K.; Ramakrishnan, M. Genome-wide identification and expression characterization of the DoG gene family of moso bamboo (Phyllostachys edulis). BMC Genom. 2022, 23, 357. [Google Scholar] [CrossRef]
  81. Wang, Y.; Salasini, B.C.; Khan, M.; Devi, B.; Bush, M.; Subramaniam, R.; Hepworth, S.R. Clade I TGACG-Motif Binding Basic Leucine Zipper Transcription Factors Mediate BLADE-ON-PETIOLE-Dependent Regulation of Development. Plant Physiol. 2019, 180, 937–951. [Google Scholar] [CrossRef] [PubMed]
  82. Das, P.; Lakra, N.; Nutan, K.K.; Singla-Pareek, S.L.; Pareek, A. A unique bZIP transcription factor imparting multiple stress tolerance in Rice. Rice 2019, 12, 58. [Google Scholar] [CrossRef] [PubMed]
  83. Nijhawan, A.; Jain, M.; Tyagi, A.K.; Khurana, J.P. Genomic survey and gene expression analysis of the basic leucine zipper transcription factor family in rice. Plant Physiol. 2008, 146, 333–350. [Google Scholar] [CrossRef] [PubMed]
  84. Wei, K.; Chen, J.; Wang, Y.; Chen, Y.; Chen, S.; Lin, Y.; Pan, S.; Zhong, X.; Xie, D. Genome-wide analysis of bZIP-encoding genes in maize. DNA Res. 2012, 19, 463–476. [Google Scholar] [CrossRef]
  85. Wright, S.I.; Bi, I.V.; Schroeder, S.G.; Yamasaki, M.; Doebley, J.F.; McMullen, M.D.; Gaut, B.S. The effects of artificial selection on the maize genome. Science 2005, 308, 1310–1314. [Google Scholar] [CrossRef]
  86. Xu, D.; Lin, L.; Liu, X.; Wangzha, M.; Pang, X.; Feng, L.; Wan, B.; Wu, G.Z.; Yu, J.; Rochaix, J.D.; et al. Characterization of a tomato chlh mis-sense mutant reveals a new function of ChlH in fruit ripening. Plant Biotechnol. J. 2025, 23, 911–926. [Google Scholar] [CrossRef]
  87. Lin, R.; Zhang, W.; Tian, R.; Zhang, L.; Hong, J.; Wang, L.; Kang, H.; Yu, J.; Zhou, Y. CPK27 enhances cold tolerance by promoting flavonoid biosynthesis through phosphorylating HY5 in tomato. New Phytol. 2025, 246, 2174–2191. [Google Scholar] [CrossRef]
  88. Sun, T.; Hazra, A.; Lui, A.; Zeng, S.; Wang, X.; Rao, S.; Owens, L.A.; Fei, Z.; Zhao, Y.; Mazourek, M.; et al. GLKs directly regulate carotenoid biosynthesis via interacting with GBFs in plants. New Phytol. 2025, 246, 645–665. [Google Scholar] [CrossRef]
  89. Wang, J.; Li, X.; Li, J.; Dong, H.; Hu, Z.; Xia, X.; Yu, J.; Zhou, Y. Manipulating the Light Systemic Signal HY5 Greatly Improve Fruit Quality in Tomato. Adv. Sci. (Weinh) 2025, e2500110. [Google Scholar] [CrossRef]
  90. Wiese, A.J.; Steinbachova, L.; Timofejeva, L.; Cermak, V.; Klodova, B.; Ganji, R.S.; Limones-Mendez, M.; Bokvaj, P.; Hafidh, S.; Potesil, D.; et al. Arabidopsis bZIP18 and bZIP52 Accumulate in Nuclei Following Heat Stress where They Regulate the Expression of a Similar Set of Genes. Int. J. Mol. Sci. 2021, 22, 530. [Google Scholar] [CrossRef]
  91. Yang, Y.; Kong, Q.; Tee, W.T.; Li, Y.; Low, P.M.; Patra, B.; Guo, L.; Yuan, L.; Ma, W. Transcription factor bZIP52 modulates Arabidopsis seed oil biosynthesis through interaction with WRINKLED1. Plant Physiol. 2023, 192, 2628–2639. [Google Scholar] [CrossRef] [PubMed]
  92. Gibalova, A.; Steinbachova, L.; Hafidh, S.; Blahova, V.; Gadiou, Z.; Michailidis, C.; Muller, K.; Pleskot, R.; Duplakova, N.; Honys, D. Characterization of pollen-expressed bZIP protein interactions and the role of ATbZIP18 in the male gametophyte. Plant Reprod. 2017, 30, 1–17. [Google Scholar] [CrossRef] [PubMed]
  93. Dannfald, A.; Carpentier, M.C.; Merret, R.; Favory, J.J.; Deragon, J.M. Plant response to intermittent heat stress involves modulation of mRNA translation efficiency. Plant Physiol. 2025, 197, kiae648. [Google Scholar] [CrossRef] [PubMed]
  94. Huang, D.; Yuan, Y.; Tang, Z.; Huang, Y.; Kang, C.; Deng, X.; Xu, Q. Retrotransposon promoter of Ruby1 controls both light- and cold-induced accumulation of anthocyanins in blood orange. Plant Cell Environ. 2019, 42, 3092–3104. [Google Scholar] [CrossRef]
  95. Li, S.; Yang, Y.; Yu, J.; Zhou, H.; Hou, Z.; Wang, X. Molecular and metabolic insights into purplish leaf coloration through the investigation of two mulberry (Morus alba) genotypes. BMC Plant Biol. 2024, 24, 61. [Google Scholar] [CrossRef]
Figure 1. Sequence identification process and physicochemical properties of MabZIP genes. (A) Workflow to identify candidate genes. (BG) Prediction of (B) protein length, (C) molecular wight, (D) theoretical isoelectric point, (E) instability index, (F) aliphatic index, and (G) grand average of hydropathicity (GRAVY) of the identified MabZIP proteins.
Horticulturae 11 00694 g001
Figure 2. Location distribution and quantity of MabZIP genes on each chromosome. (A) Schematic diagram of MabZIP genes mapped on twelve chromosomes of Morus alba. Circles of different colors beside gene labels stand for different groups that MabZIP genes belong to. The length of chromosomes was referred to the scale on the left and the heatmaps of chromosomes stand for their gene density. Black gene labels are the gene ID. Red gene labels are the gene name designated in this study. (B) Statistics of MabZIP genes quantity on different chromosomes.
Horticulturae 11 00694 g002
Figure 3. Phylogenetic analysis of bZIP proteins from Morus alba (Ma), Arabidopsis thaliana (At), and Populus trichocarpa (Pt) conducted by using maximum likelihood approach. The thirteen groups of bZIP proteins (Groups K–D) are distinguished by various colors blocks and branches. The outside symbols of the phylogenetic tree represent Ma (Stars), At (circles) and Pt (squares) bZIPs. The gene labels which are whitened with strikethrough represent mulberry proteins which are homologous to At and Pt bZIPs but without the basic leucine zipper domain.
Horticulturae 11 00694 g003
Figure 4. Phylogenetic analysis, conserved motifs and structural features of MabZIP genes. (A) Phylogenetic tree of MabZIP genes. The MabZIP genes are grouped and named consistent to phylogenetic clades in Figure 3. Blocks and branches of different colors denote different groups of MabZIP genes. (B) The structural features of MabZIP genes. Exons, introns and 5′UTR/3′UTR are presented by green boxes, line segment, and yellow boxes, respectively. (C) Conserved motifs of MabZIP genes. Twenty distinct conserved motifs are represented by different colored boxes. Detailed information about the motifs is listed in Table S2.
Horticulturae 11 00694 g004
Figure 5. Chromosomal collinearity of bZIP genes in Morus alba. Rectangles of different colors represent chromosomes (Chr1–14). From the outer to inner of the plot: yellow, hollow circle for N-ratio distribution, orange bar and heatmap for gene density, overlapped gray line for GC ratio, blue and pink line for GC skew. The light brown curves in the background indicate syntenic gene pairs in Morus alba genome, while the dark brown curves indicate syntenic MabZIP gene pairs.
Horticulturae 11 00694 g005
Figure 6. Syntenic and evolutionary analysis of Morus alba and seven other plants. (A) Syntenic analysis of Arabidopsis thaliana (At), Populus trichocarpa (Pt), Ficus hispida (Fh), Morus alba (Ma), Morus notabilis (Mn), Ananas comosus (Ac), Oryza sativa (Os), and Zea mays (Zm). Total syntenic gene pairs (B) and bZIP-specific syntenic pairs (C) between Morus alba and seven plants. (D) Percentage of bZIP syntenic pairs relative to total syntenic pairs. (E) Distribution of Ks of collinearity genes from Morus alba genome and orthologous gene pairs between Morus alba and other seven plants. (F) Distribution of Ka/Ks ratio of syntenic gene pairs in six plants and the ratio of bZIP gene Ka/Ks (* p < 0.05, ** p < 0.01, Student’s t-test).
Horticulturae 11 00694 g006
Figure 7. Cis-acting element analysis of MabZIP genes. (A) Distribution of cis-acting elements in the 2 kb promoter regions of MabZIP genes. Elements are classified into 3 functional categories (environmental stress, hormone response, and growth/development) and 17 subcategories (Table S5). Different colors and the numbers in the cells represent the quantity of corresponding subcategories and the bar on the right counts the quantity of three categories. (B,C) Category, quantity, and position of environment or hormone element in promoter regions of MabZIP genes.
Horticulturae 11 00694 g007
Figure 8. Expression profiles of MabZIP genes under various abiotic stress conditions, protein–protein interaction (PPI) networks, and gene ontology (GO) enrichment analyses. (A) Circos plot showing expression profiles of MabZIP genes under heat stress, salt–alkaline stress, and high light stress. Gene labels in bold red or blue indicate significantly up- or down-regulated genes, respectively. The Venn plot in the middle reveals the differential expression gene (DEG) sets and their overlaps for heat stress (red), salt–alkaline stress (blue), and high light stress (white). (B) Differential expression summary of all MabZIP genes across the three abiotic stresses. Student’s t-test was applied. p value < 0.05 is indicated in red or blue, while p value ≥ 0.05 is indicated in gray. Dark red or blue indicate |log2FC|≥ 1. (C) PPI network of MabZIP43, which is divided into three clusters. Circles indicate MabZIP43 interaction proteins. The gene ID of their homologs in Arabidopsis are also displayed in orange color. (D) Bar chart depicting the expression level of MabZIP43 (left) and heatmap of DEGs predicted to interact with MabZIP43 (right) (* p < 0.05, ** p < 0.01, **** p < 0.0001, Student’s t-test). (E) GO enrichment analysis of all proteins in the MabZIP43 PPI network. (F) PPI network of MabZIP24 divided into four clusters. (G) Bar chart showing the expression level of MabZIP24 (left) and heatmap for DEGs predicted to interact with MabZIP24 (right) (** p < 0.01, *** p < 0.001, Student’s t-test). (H) GO enrichment analysis of all proteins in the MabZIP24 PPI network.
Horticulturae 11 00694 g008
Figure 9. Screening of MabZIP genes by analysis of the expression pattern of genes involved in anthocyanin biosynthetic pathway in Morus alba. (A) Anthocyanin biosynthesis pathway (left) and the heatmap of expression levels for key enzymes in the anthocyanin biosynthesis pathway (right), measured in juvenile leaves of Morus alba following three days of high-light stress (HL). Anthocyanin biosynthesis pathway is categorized into three stages: early anthocyanin biosynthesis stage (EBS) marked in blue, flavonol biosynthesis stage marked in yellow, and late anthocyanin biosynthesis stage (LBS) marked in red. Stars besides the enzymes indicate the key enzymes which might be regulated by MabZIP16. (B) Bar chart depicting the expression level of MabZIP16 (* p < 0.05, Student’s t-test). (C) Correlation coefficients between candidate bZIP transcription factors and key anthocyanin biosynthesis enzymes. Each cell from left to right represents the gene symbol 1–n of enzymes involved in anthocyanin biosynthesis and gene IDs are listed in Table S7. (D) Quantity and position of TGACG DNA binding motif in promoter regions of enzymes involving in anthocyanin biosynthesis pathway. Key enzymes include PAL (phenylalanine ammonia-lyase), C4H (cinnamate-4-hydroxylase), 4CL (4-Coumaric acid CoA ligase), CHS (chalcone synthase), CHI (chalcone isomerase), F3H (flavanone 3-hydroxylase), F3′H (flavonoid 3′-hydroxylase), FLS (flavonol synthase), DFR (dihydroflavonol reductase), ANS (anthocyanin synthase), LAR (leucoanthocyanidin reductase), ANR (anthocyanidin reductase), UFGT (UDP-glycose flavonoid glycosyltransferase), and OMT (flavonoid O-methyltransferase).
Horticulturae 11 00694 g009
Figure 10. Relative expression level of candidate genes under heat, salt–alkaline and high light stress based on qRT-PCR. MabZIP43 and 24 expression level under (A) heat, (B) salt–alkaline, and (C) high light stress. (D) MabZIP16 and ANS expression level of mulberry juvenile leaves under high light stress. Changes in gene expression were calculated using the 2−ΔΔCt method with MaACTIN as the reference gene and are expressed relative to control group. Each treatment contains three biological replicates. The statistical significance of differences in target genes relative expression was analyzed between treated groups and control group using Student’s t-test. Values are means ± standard deviations (n = 3), and the p values are shown.
Horticulturae 11 00694 g010
Disclaimer/Publisher’s Note: The statements, opinions and data contained in all publications are solely those of the individual author(s) and contributor(s) and not of MDPI and/or the editor(s). MDPI and/or the editor(s) disclaim responsibility for any injury to people or property resulting from any ideas, methods, instructions or products referred to in the content.

