Article

Modulation of Biochemical Traits in Cold-Stored ‘Karaerik’ Grapes by Different Edible Coatings

1
Department of Horticulture, Faculty of Agriculture, Van Yuzuncu Yil University, Van 65080, Turkey
2
Çolemerik Vocational School, Hakkari University, Hakkari 30000, Turkey
3
Department of Biology, Faculty of Science and Art, Erzincan Binali Yıldırım University, Erzincan 24002, Turkey
4
Department of Plant Sciences, North Dakota State University, Fargo, ND 58102, USA
5
Republic of Turkey Ministry of Agriculture and Forestry, Erzincan Horticultural Research Institute, Erzincan 24060, Turkey
6
Department of Horticulture, Faculty of Agriculture, Ankara University, Ankara 06110, Turkey
7
Department of Biostatistics, Basic Medical Sciences, Faculty of Medicine, Van Yuzuncu Yil University, Van 65080, Turkey
8
Department of Horticulture, Institute of Natural and Applied Sciences, Van Yuzuncu Yil University, Van 65080, Turkey
*
Authors to whom correspondence should be addressed.
Horticulturae 2025, 11(6), 672; https://doi.org/10.3390/horticulturae11060672
Submission received: 6 May 2025 / Revised: 5 June 2025 / Accepted: 10 June 2025 / Published: 12 June 2025

Abstract

Understanding the effects of edible coatings on postharvest quality and shelf life of ‘Karaerik’ grapes is crucial for improving storage outcomes and reducing losses. However, limited information exists regarding the effectiveness of different coating materials on this regionally significant variety. In this study, ‘Karaerik’ grapes were treated with carboxymethyl cellulose (CMC) and locust bean gum (KB) coatings and stored under cold conditions (0 ± 0.5 °C, 90–95% relative humidity) for 0, 25, 45, and 60 days. Storage duration and coating treatments significantly affected most physical, physiological, and biochemical parameters. During storage, grape weight loss progressively increased, reaching 9.60% in the control by day 60. Coatings slightly reduced this loss, with KB showing the lowest (5.11%) compared to the control (5.69%). Respiration initially declined but surged again at day 60, especially in the control (96.4 μmol CO2/kg·hour), while coatings helped mitigate this rise. Ethylene release remained unchanged. A slight pH decline (~4.6%) was observed in the control, while KB-treated grapes maintained higher pH and lower acidity. Soluble solids remained stable across treatments. Color changed notably during storage: a* nearly doubled (more redness), b* increased (less blue), and chroma (C*) declined by ~25%, especially in uncoated grapes. Total sugar dropped by ~43% in KB-treated grapes, with the control retaining the most. Tartaric acid decreased by ~55%, notably in KB samples. Antioxidant activity and total phenolics declined significantly (~66%) in the control. CMC coating better-preserved antioxidant capacity, while the control showed the highest phenolic levels overall. Ferulic, gallic, and chlorogenic acids increased toward the end of storage, particularly in coated grapes. In contrast, rutin and vanillic acid peaked mid-storage and were better preserved in the control. The heatmap showed significant metabolite changes in fruit samples across 0D, 25D, 45D, and 60D storage periods under CMC, CNT, and KB treatments, with distinct clustering patterns revealing treatment-specific biochemical responses. The correlation matrix revealed strong positive relationships (r > 0.70) between total sugar, glucose, and fructose levels, while ethylene showed significant negative correlations (−0.65 to −0.85) with maturity index, pH, and total soluble solids, indicating interconnected metabolic pathways during fruit ripening and storage. We conclude that edible coating selection significantly influences grape biochemical stability during cold storage, with CMC emerging as a superior choice for maintaining certain quality parameters.

1. Introduction

Grapes (Vitis vinifera L.) represent a fundamental agricultural commodity with millennia of cultivation history, maintaining their status as a globally significant crop in contemporary agriculture. Beyond their primary role as a food source, these fruits possess considerable nutritional significance attributed to their abundant phenolic compounds and antioxidant constituents, which have garnered attention for their potential anticancer properties [1]. What makes grapes particularly interesting from a health perspective is their diverse collection of bioactive compounds. These include flavonoids, phenolic acids, and anthocyanins, natural substances that studies suggest could protect our hearts, reduce inflammation, and help our cells fight off damaging oxidative stress [2]. The ‘Karaerik’ variety deserves special attention here. This grape thrives in Erzincan’s climate and has become commercially significant for the region. Farmers prize it for producing large, dark berries that resemble plums and offer a distinctive sweet-sour taste. These grapes serve dual purposes in human consumption, they are appreciated both as fresh fruit and as raw material for various traditional processed products including molasses, vinegar, and dried pulp. Despite their widespread global consumption and recognized importance in both nutritional and industrial applications, post-harvest quality maintenance remains a persistent challenge. Effective preservation of both nutritional content and commercial viability requires careful attention to post-harvest management practices. One often-overlooked factor is what happens to the grape cluster’s woody structure after picking. These skeletal parts of the cluster undergo their own physiological changes that can impact overall fruit quality. Moisture loss stands out as a particularly troublesome issue, when grapes lose water content, they quickly lose their fresh appearance and market appeal, creating real economic problems for producers. Immediately following harvest and during storage, cluster peduncle experiences substantial moisture loss, leading to critical issues such as dehydration and browning [3]. Several factors can intensify these physiological changes, particularly grape cracking and grey mold infections, both of which accelerate moisture loss and may compromise the structural integrity of berry pulp, thereby affecting overall fruit quality [4]. However, the most significant determinant of post-harvest quality remains the fruit’s inherent metabolic processes, which persist following detachment from the vine. Continued respiratory and transpiration activities alter gas exchange patterns within the fruit, leading to progressive depletion of water content and soluble solids, consequently diminishing storage life and commercial viability [5].
Microbial contamination presents another major challenge in post-harvest grape management. Botrytis cinerea, commonly known as gray mold, stands as the predominant pathogen responsible for substantial economic losses in grape production worldwide [6]. Additional fungal species, notably Aspergillus niger and various Penicillium species, compound these losses through rapid deterioration of fruit quality parameters including flavor profiles, pigmentation, and textural characteristics. Such microbial activity necessitates the development of enhanced preservation methodologies that surpass the actual coating approaches in both efficacy and safety considerations. Contemporary market demands for premium-quality produce with minimal processing have driven researchers toward innovative preservation technologies. The objective centers on maintaining nutritional integrity while achieving extended storage periods through sustainable methods. Sulfur dioxide has historically dominated grape preservation protocols due to its proven antimicrobial properties and ability to retard ripening processes in both clustered and individual berries [7]. Nevertheless, mounting concerns regarding SO2’s corrosive potential and associated toxicity risks have challenged its continued widespread application [8]. This regulatory and safety landscape has accelerated interest in bio-based coating technologies, particularly those utilizing natural polymer matrices. Carboxymethyl cellulose and locust bean gum have emerged as particularly viable candidates for edible coating formulations. These materials demonstrate considerable promise in addressing multiple deterioration pathways simultaneously. The biggest benefit is that these coatings stop grapes from drying out. They make a thin layer around each grape that lets some water out but keeps most of it in, so the grapes stay plump and fresh. These coatings also protect against germs. They cut off the air and moisture that bad bacteria and mold need to grow on the grape’s skin. Scientists can also mix in other helpful things like natural germ-killers or substances that prevent the grapes from going bad [9].
Storage temperature emerges as a critical variable influencing coating performance and overall preservation outcomes. Standard cold storage protocols utilizing temperatures of 0 °C and 4 °C effectively suppress metabolic activity and microbial development in table grapes. However, temperature variations within this range can produce distinct physiological responses, potentially affecting the interaction between coating materials and fruit surfaces, thereby influencing preservation efficacy. Although previous investigations have established the efficacy of natural polymer coatings in extending storage life, maintaining sensory attributes, and reducing microbiological contamination across diverse fruit commodities [10,11], research efforts have concentrated predominantly on carboxymethyl cellulose applications. Locust bean gum, despite its promising characteristics as a biodegradable coating matrix, has received comparatively limited attention in grape preservation studies. This disparity becomes particularly evident when examining research addressing moisture retention and antimicrobial protection in post-harvest grape storage. Furthermore, systematic comparisons between CMC and locust bean gum performance across variable storage temperatures remain inadequately documented in the current literature. The present investigation seeks to address these knowledge gaps through a comprehensive evaluation of locust bean gum-based coating systems. Our research objectives encompass two primary areas: first, assessing the capacity of locust bean gum coatings to maintain grape quality through reduced dehydration and microbial deterioration; second, establishing comparative performance benchmarks against established coating materials to evaluate their viability as sustainable preservation alternatives. These assessments were conducted under controlled storage conditions at 0 °C and 4 °C, enabling systematic evaluation of coating effectiveness across distinct thermal environments that reflect commercial storage practices.

2. Materials and Methods

2.1. Collection of Grape Samples and Application Procedures

In this study, the ‘Karaerik’ grape variety grown under the ecological conditions of Erzincan was used. We harvested grape clusters when they reached commercial ripeness, which occurred at soluble solids levels between 16–17 °Brix. Immediately after picking, the clusters were placed in plastic crates and transported to the cold storage facilities at Van Yüzüncü Yıl University’s Horticulture Department. The transport vehicle maintained refrigerated conditions at 10 ± 1 °C with a relative humidity of 80 ± 5%. Once at the facility, grape clusters were placed in cold storage for a 24-h pre-cooling period. Following this initial cooling phase, we removed the grapes and cleaned them using a 100ppm sodium hypochlorite solution for two min. The clusters were then washed with distilled water and left to dry naturally at room temperature. The experimental design was a completely randomized design with four treatments and three replications. Each replication consisted of three grape clusters, totaling nine bunches per treatment group. We prepared the coating solutions by mixing 1% (w/v) carboxymethyl cellulose (CMC; Sigma-Aldrich, Taufkirchen, Germany) or 1% (w/v) locust bean gum (KB; Sigma-Aldrich, Germany) with distilled water heated to 60 °C. Each solution was stirred using a magnetic stirrer (Ultra-Turrax T50, IKA, Staufen, Germany) for 30 min until completely dissolved. After that, 1% (v/v) glycerol (Merck, Darmstadt, Germany) was added to each solution as a plasticizer and stirred for an additional 15 min to ensure homogeneity. Coating solutions were prepared fresh and cooled to room temperature (20 ± 2 °C) before use. CMC and KB solutions were used separately for coating application. The grape clusters were dipped in the respective coating solutions for 2 min and then allowed to air-dry at room temperature. Once the coated clusters dried, we packed them in polyethylene bags and placed them in cold storage at 0 °C with 80 ± 5% relative humidity for 60 days. We examined the grape samples at four different times: at the beginning (day 0), and after 25, 45, and 60 days of storage. The experiment included three control groups for comparison: first, grapes that received no treatment at all; second, grapes that were only dipped in distilled water to see if the dipping process itself had any effect; and third, grapes coated with glycerol alone. We used 96 grape clusters in total for this study, which we calculated based on having 4 different treatments, checking them at 4 different time periods, with 3 repetitions of each, and using 2 clusters for each repetition.

2.2. Evaluation of Weight Loss

We tracked weight changes in the grape samples throughout storage by weighing them with precision scales on harvest day and then every 15 days afterward. Using these measurements, we calculated weight loss as a percentage of the original weight for each sample. The following formula was used in this calculation:
Weight Loss (%) = ((Starting Weight − Final Weight)/Starting Weight) × 100

2.3. Evaluation of Respiration Rate

We measured respiration rates by putting grape clusters into sealed containers and leaving them closed for 4 h. After this time, we used a Headspace Gas Analyzer GS3/L device to measure how much carbon dioxide (CO2) had built up inside each container. To calculate the actual respiration rate, we took the CO2 measurements and factored in the container volume, grape volume, grape weight, and the 4-h time period using this formula [12]:
Respiratory Rate (mL CO2/kg) = ((Vk − Vu) × %CO2)/(G × T)) × 10
Vk: Container volume (L)
Vu: Product volume (L)
%CO2: Carbon dioxide rate released by the product into the environment through respiration
G: Product mass (kg)
T: Time (hours)

2.4. Evaluation of External Ethylene

We measured external ethylene production by placing the treated grape clusters in 2-L sealed jars for 3 h. After this period, we collected gas samples from inside each jar using a gas-tight syringe and injected them into a Shimadzu GC-MS QP 2010 plus device (Shimadzu Co., Japan) for analysis. We then analyzed the resulting chromatograms to determine ethylene concentrations. Using a modified version of the respiration rate equation, we calculated external ethylene production and expressed the results in mL C2H4/kg·h [13].
External Ethylene Amount (mL C2H4/kgh) = (X × (Vk − Vu))/(T × G)
X: Sample peak area/standard peak area (ppm)
Vk: Container volume (L)
Vu: Product volume (L)
T: Closed holding time (hour)
G: Product weight (kg)

2.5. Evaluation of pH

The pH values of the grape samples were measured by immersing the pH meter probe into the liquid phase obtained by directly squeezing the fruit juices. The measurements were carried out directly on the fruit juice after the calibration of the device, and the average pH values were recorded for each analysis time.

2.6. Evaluation of Total Soluble Solids (TSS) and Maturity Index

The amount of TSS in must samples obtained from grape berries was measured using a digital hand-held refractometer and the results were expressed in °Brix units. Before the measurement, the refractometer was calibrated with distilled water.

2.7. Evaluation of Titratable Acidity (TA)

We took 10 mL of grape juice and added 20 mL of pure water to it. Then we slowly added sodium hydroxide solution until the pH reached 8.1. The amount of sodium hydroxide used was recorded and total acidity was calculated in terms of tartaric acid using this formula [14]:
A = [(S × N × F × E/C) × 100]
A = Total acidity (in g/L, tartaric acid)
S = Amount of sodium hydroxide used in titration (mL)
N = Normality of sodium hydroxide solution
F = Factor of sodium hydroxide solution
E = Equivalence value for tartaric acid
C = Sample volume used for analysis (mL)

2.8. Evaluation of Color Measurements and Color Changes

Color changes in grape berries during storage were determined using a Minolta CR-440 model color measurement device. Color measurements were made on the berry skin of each sample and were expressed in terms of L* (lightness-darkness), a* (green-red), and b* (blue-yellow) parameters in the CIE Lab* color space. In order to determine the skin color of the grape berries in each replicate, measurements were taken from three different areas of each berry. In line with the data obtained during the storage period, changes were evaluated in terms of L*, a*, and b* values as well as derived color parameters such as chroma (C*) and hue angle (h°).

2.9. Evaluation of Sugar Content

In the quantitative analysis of glucose and fructose, the main sugar components in grape must, the method reported by [15] was applied with some modifications. Must samples be centrifuged at 12,000 rpm for 2 min, and then the obtained supernatant was cleaned using a SEP-PAK C18 solid phase extraction cartridge (Waters Corporation, Milford, MA, USA). The obtained filtrate was stored at −20 °C until the analyses were performed. In chromatographic analyses, the separation of sugars in the must was carried out using a μBondapak-NH2 column (amine-bound phase). We used acetonitrile (Merck) with 85% HPLC purity for the analysis. The samples were analyzed using an HPLC machine with a refractive index detector.

2.10. Evaluation of Total Phenolic Compound Content and Total Antioxidant Capacity

The total phenolic compound content and total antioxidant capacity were evaluated according to the method of Swain and Hillis [16] and Benzie and Strain [17]. Methanol (25 mL) was added to grape berries (5 g) and mixed using a homogenizer for 2 min at medium speed. The samples were kept cold at +4 °C for 10 min. Centrifugation was performed at +4 °C for 30 min at 7000 rpm. The clear upper layer was collected in small tubes and frozen at −20 °C until needed for testing. Phenolic content was measured by the Folin-Ciocalteu method. Readings for samples were taken with a spectrophotometer at 700 nm. Values are given as gallic acid equivalents per 100 g of fresh grape weight. Antioxidant activity was tested using FRAP analysis. The spectrophotometer was set to 593 nm for measurements. Activity levels are reported as Trolox equivalents in μmol per mg of sample.

2.11. Evaluation of Organic Acid Content

In the analysis of organic acids in grape samples, the method reported by Topalovic and Mikulic-Petkovsek [18] was applied with some modifications. Each sample got 20 mL of sulfuric acid (0.009 N). After mixing well, the samples went on a shaker for 1 h. Then they were spun in the centrifuge at 15,000 rpm for 15 min. The water part from spinning was first passed through thick filter paper. After that, it went through a fine 0.45 µm filter two times. At the end, it was cleaned using a SEP-PAK C18 cartridge (Waters Corporation, Milford, MA, USA). In the analyses, 0.009 N H2SO4 solutions passed through a 0.45 µm membrane filter and were used as the mobile phase. The chromatographic separation process was carried out at 214 nm and 280 nm wavelengths via Diode Array Detector (DAD), and the organic acid profile was determined.

2.12. Evaluation of Individual Phenolic Compounds

Phenolic compounds in grape must be measured using the HPLC method described by Rodriguez-Delgado et al. [19], after diluting the must with distilled water and centrifuging it. The clear liquid remaining on the top was filtered with a 0.45 µm pore filter and injected into the device. We performed the separation process using a column with dimensions of 250 × 4.6 mm and a particle size of 4 µm. We worked with two different solutions while making the measurements. The first of these consisted of methanol, acetic acid, and water (10:2:88 ratio); the other was a mixture of the same substances but with a higher concentration of methanol (90:2:8 ratio). The separation of the components was ensured by applying these solutions in stages. Measurements were made at wavelengths of 254 and 280 nm for the determination of phenolic substances.

2.13. Statistical Analysis

All experiments were carried out using a randomized design, and data were collected in triplicate across the cold storage periods (0, 25, 45, and 60 days). Statistical analyses were performed using IBM SPSS Statistics V22.0 software. A one-way analysis of variance (One-Way ANOVA) was conducted to evaluate the effects of CMC and KB edible coatings during storage. Mean comparisons were carried out using Tukey’s multiple range test at the 5% significance level (p < 0.05). Results are presented as mean values ± standard deviation (SD). All experiments were conducted using a completely randomized design. Each treatment group (CMC, KB, and controls) was applied to three biological replicates, each consisting of three grape clusters (9 bunches per treatment). Measurements were taken at four time points: 0, 25, 45, and 60 days of cold storage. In addition, principal component analysis (PCA) was conducted using GraphPad Prism version 9.3.1 (GraphPad Software, LLC, San Diego, CA, USA) to distinguish the effects of CMC and KB treatments over different storage durations based on the evaluated traits. The PCA results were visualized through a biplot. Moreover, a hierarchical clustering heatmap was generated using the SRPLOT online platform (https://www.bioinformatics.com.cn/en, accessed on 21 January 2024) to better visualize the associations and variation density among the treatments and the measured parameters throughout the storage period.

3. Results

3.1. Weight Loss and Respiration Rate

Storage period had a statistically significant effect on weight loss (p < 0.05) (Supplementary File S1). Grape samples lost more weight as the storage time got longer, starting from 0% on day 0, going up to 4.4% on day 25, 7.65% on day 45, and reaching 9.6% by day 60. The difference between treatments was small: the control group lost the most weight (5.69%), followed by CMC (5.44%) and locust bean gum (5.11%). On average, the weight loss was 5.41%. The respiration rate was high at the beginning, dropped on days 25 and 45, then increased again on day 60. This rise was highest in the control group, while the CMC and KB groups showed lower rates. The respiratory rates were relatively similar among treatment groups (CNT: 34.41 ± 12.57; CMC: 30.88 ± 8.27; KB: 31.31 ± 10.50 μmol CO2/kg·h), with an overall average of 32.20 ± 10.41% (Table 1). Neither application methods nor the interaction between storage duration and application methods produced statistically significant changes in respiration (Supplementary File S1). Regarding ethylene release, neither treatment groups (p = 0.949), storage time (p = 0.104), nor their interactions (p = 1.000) showed any significant effect (Supplementary File S1). Ethylene re-lease levels increased in direct proportion to the storage period, with all treatment groups showing similar values on day 0 (0.06 ± 0.03 μmol CO2/kg·h) and KB (0.05 ± 0.01 μmol CO2/kg·h) groups maintained relatively constant levels (Table 1).

3.2. pH, Titratable Acidity, and Total Soluble Solids

Our research showed that storage duration significantly influenced pH measurements (F = 4.997; p = 0.008), as documented in Supplementary File S1. When we began the experiment, every treatment group exhibited identical pH readings of 3.26 ± 0.06. However, after storing samples for 25 days, we noticed clear distinctions among the treatments: our control group registered 3.22 ± 0.06, while samples treated with CMC measured 3.15 ± 0.11, and those receiving KB treatment showed 3.09 ± 0.09. Something interesting happened at the 45-day mark, pH measurements converged and became quite uniform across treatments. We recorded 3.21 ± 0.01 for control samples, 3.20 ± 0.18 for CMC-treated samples, and 3.22 ± 0.07 for KB-treated ones. As we approached day 60, though, we observed an unexpected pattern where both control and CMC groups experienced pH declines to 3.11 ± 0.08 and 3.09 ± 0.07 respectively, yet the KB group maintained relatively elevated levels at 3.17 ± 0.04.
When we examined how different application methods might impact pH, our analysis revealed no statistically meaningful influence (F = 0.312; p = 0.735), which S1 confirms. Calculating the mean pH across all experimental conditions, we arrived at 3.19 ± 0.09, as Table 1 demonstrates. Regarding titratable acidity (TA), we discovered that neither storage duration nor application technique produced statistically significant changes (p > 0.05), according to our Supplementary File S1 dataset. Initially, all groups demonstrated uniform TA measurements of 0.76 ± 0.04. As storage progressed, we noticed the KB treatment group experienced notable declines, particularly at day 45 (0.60 ± 0.08) and day 60 (0.59 ± 0.02). In contrast, the CMC treatment group maintained remarkable consistency, with TA values remaining steady throughout our entire experimental period (0.76 ± 0.04 to 0.76 ± 0.14). CMC treatment had the highest average TA value (0.74 ± 0.08/100), while KB treatment had the lowest (0.66 ± 0.10). The overall TA average was 0.71 ± 0.11 (Table 1). Total soluble solids (TSS) showed no significant differences for storage time or treatment application (p > 0.05) according to S1. All groups started at 16.33 ± 1.52 °Brix. At day 25, control samples increased to 17.77 ± 0.96 °Brix, while CMC and KB groups had 16.47 ± 1.27 and 15.60 ± 0.72 °Brix. By day 60, TSS values were similar across all groups. The highest TSS mean was 16.61 ± 1.29 at day 25. The overall TSS average was 16.29 ± 1.16 °Brix (Table 1). The maturity index showed no significant effects from the treatment method or storage time (p > 0.05). All groups started with 21.83 ± 3.22. After 60 days, the KB group had the highest maturity index at 27.78 ± 1.85 (Table 1).

3.3. Color Parameters

The initial (day 0) color profile was characterized by a hue angle of 276.02 ± 9.29, L* value of 33.30 ± 0.71, a* value of 0.46 ± 0.38, b* value of −2.36 ± 0.36, and C* value of 2.55 ± 0.32. The L* value showed slight increases with storage time, with the highest average recorded on day 25 (34.89 ± 1.43). The color changes of the grapes were monitored during the 60-day storage period. The brightness of the grapes did not change much during storage, all groups remained between 32.58 and 34.99. However, the grapes took on a more reddish color over time. The redness value, which was 0.46 at the beginning, increased to 1.00 on the 60th day. This change was especially noticeable on the last day and reached the highest level in the control group and CMC-applied grapes. The applied methods affected the blue-yellow color balance of the grapes. This value, which was −2.36 at the beginning, decreased to −1.13 and −1.17 at the end of storage. In other words, the grapes became less bluish. The color intensity was the highest at the beginning and on the 25th day and decreased significantly in the following weeks. The grapes applied with KB gave different results than the others. These grapes were the brightest, but their color intensity was the lowest. The color tone also generally decreased, from 276 to 242. The average values for all samples were: brightness 34.02, redness 0.63, blue-yellow balance −1.77, color intensity 2.18, and hue 263.84. As a result, the grapes became slightly redder during storage, but their color faded more and more. Different preservation methods affected these changes in different ways (Table 1).

3.4. Sugar and Acid Content

The sugar profile showed significant variations in response to both storage duration and application methods. On day 0, all treatment groups had identical sugar compositions: fructose at 8.66 ± 0.05 g/L, glucose at 8.42 ± 0.05 g/L, glucose/fructose ratio at 0.97 ± 0.001, and total sugar at 17.08 ± 0.09 g/L. By day 25, the CNT group exhibited increased sugar levels, with total sugar at 22.03 ± 3.39 g/L. As storage progressed, sugar content generally decreased across all groups, with the KB application showing the lowest levels on day 60 (fructose: 5.23 ± 1.98 g/L, glucose: 4.57 ± 1.65 g/L, total sugar: 9.80 ± 3.63 g/L) (Table 2).
In our study, it was observed that the glucose and fructose ratios decreased continuously during storage. This ratio, which was 0.97 at the beginning, decreased to 0.85 on the 60th day. Both the storage period and the applied methods significantly affected the sugar profile. The control group maintained the highest fructose, glucose, and total sugar levels, while the KB application gave the lowest values.

3.5. Antioxidant and Phenolic Compounds

In our study, total antioxidant capacity and phenolic compound levels showed significant differences with storage period, application method, and the effects of these two factors together (p < 0.05) (Supplementary File S1). In control (CNT), total antioxidant capacity was 101.19 ± 1.98 on day 0, while it decreased to 34.36 ± 2.49 on day 60. Similarly, the amount of phenolic compounds decreased from 376.63 to 126.63 in the same group (Table 3). On day 25, the CMC application kept the antioxidant capacity higher at 74.81 ± 0.27 compared to the control group, while the KB application gave the lowest value at 39.48 ± 2.19. A decrease was observed in the number of phenolic compounds on day 25 in all groups. In our findings, on day 45, although the phenolic content was lower in the KB group (111.00 ± 8.13 mg GAE/g) compared to the other treatments, the antioxidant capacity was higher with 62.12 ± 6.85 (Table 3). When the general means were taken into consideration, the average amount of phenolic compounds in all treatments was determined as 204.13 ± 87.80, and the average total antioxidant capacity was determined as 54.49 ± 20.10. The CNT group had the highest average in terms of phenolic compounds (253.82 ± 98.13), while the CMC group had the highest value in terms of antioxidant capacity (56.07 ± 16.48) (Table 3).
In our results, the amount of tartaric acid was the highest in the control group at the beginning but decreased over time. It reached the lowest level in the KB group at the end of storage. The KB application significantly reduced tartaric acid compared to the other methods. Malic acid values varied between 1.23 and 2.54 g/L.
The lowest value was seen in the KB group on the 60th day, and the highest value was seen in the control group on the 25th day. The amount of citric acid followed an up-and-down course throughout storage. The CMC group reached the highest value on the 60th day. Succinic acid levels also varied and peaked on the 60th day in the CMC group. Fumaric acid generally remained at low levels. The value, which was initially 0.07 in the control group, increased to 0.40 on day 25. The tartaric and malic acid ratio was the highest in the control group at the beginning but decreased during storage. The CMC group showed a higher ratio than the other treatments on day 25. In general, the storage period and the applied preservation methods affected the sugar and acid content of the grapes in different ways (Table 4).
The amount of ferulic acid increased in the CNT group on day 60 (4.74 ± 4.54), while CMC and KB applications reduced the accumulation of ferulic acid. Hydroxycinnamic acid reached the highest level in the CNT group on day 25 (0.72 ± 0.11). The amount of gallic acid fluctuated during storage, but CMC and KB coatings kept this value more stable. The highest amount of gallic acid was measured as 4.24 ± 2.35 µg/g on day 60 in the CMC group. Trans-caffeic acid remained low in all groups. The amount of chlorogenic acid increased in all groups on day 60 (CNT: 11.16 ± 0.60, CMC: 13.55 ± 1.28, KB: 11.86 ± 3.98). Trans-p-coumaric acid reached the highest level on days 25 and 45, with a significant increase especially in the CNT group on day 25 (0.57 ± 0.44). The amount of rutin peaked in the CNT group on day 25 (6.53 ± 5.05) and this increase was statistically significant (p < 0.05) (S1), but CMC and KB applications significantly reduced the accumulation of rutin. The amount of syringic acid fluctuated during storage, but an increase was observed in the CNT (3.29 ± 0.71) and KB (3.27 ± 1.59) groups on day 60. The amount of vanillic acid reached the highest value on day 25 in the CNT group (2.47 ± 1.91) and remained generally lower in the CMC and KB applications (Table 5).

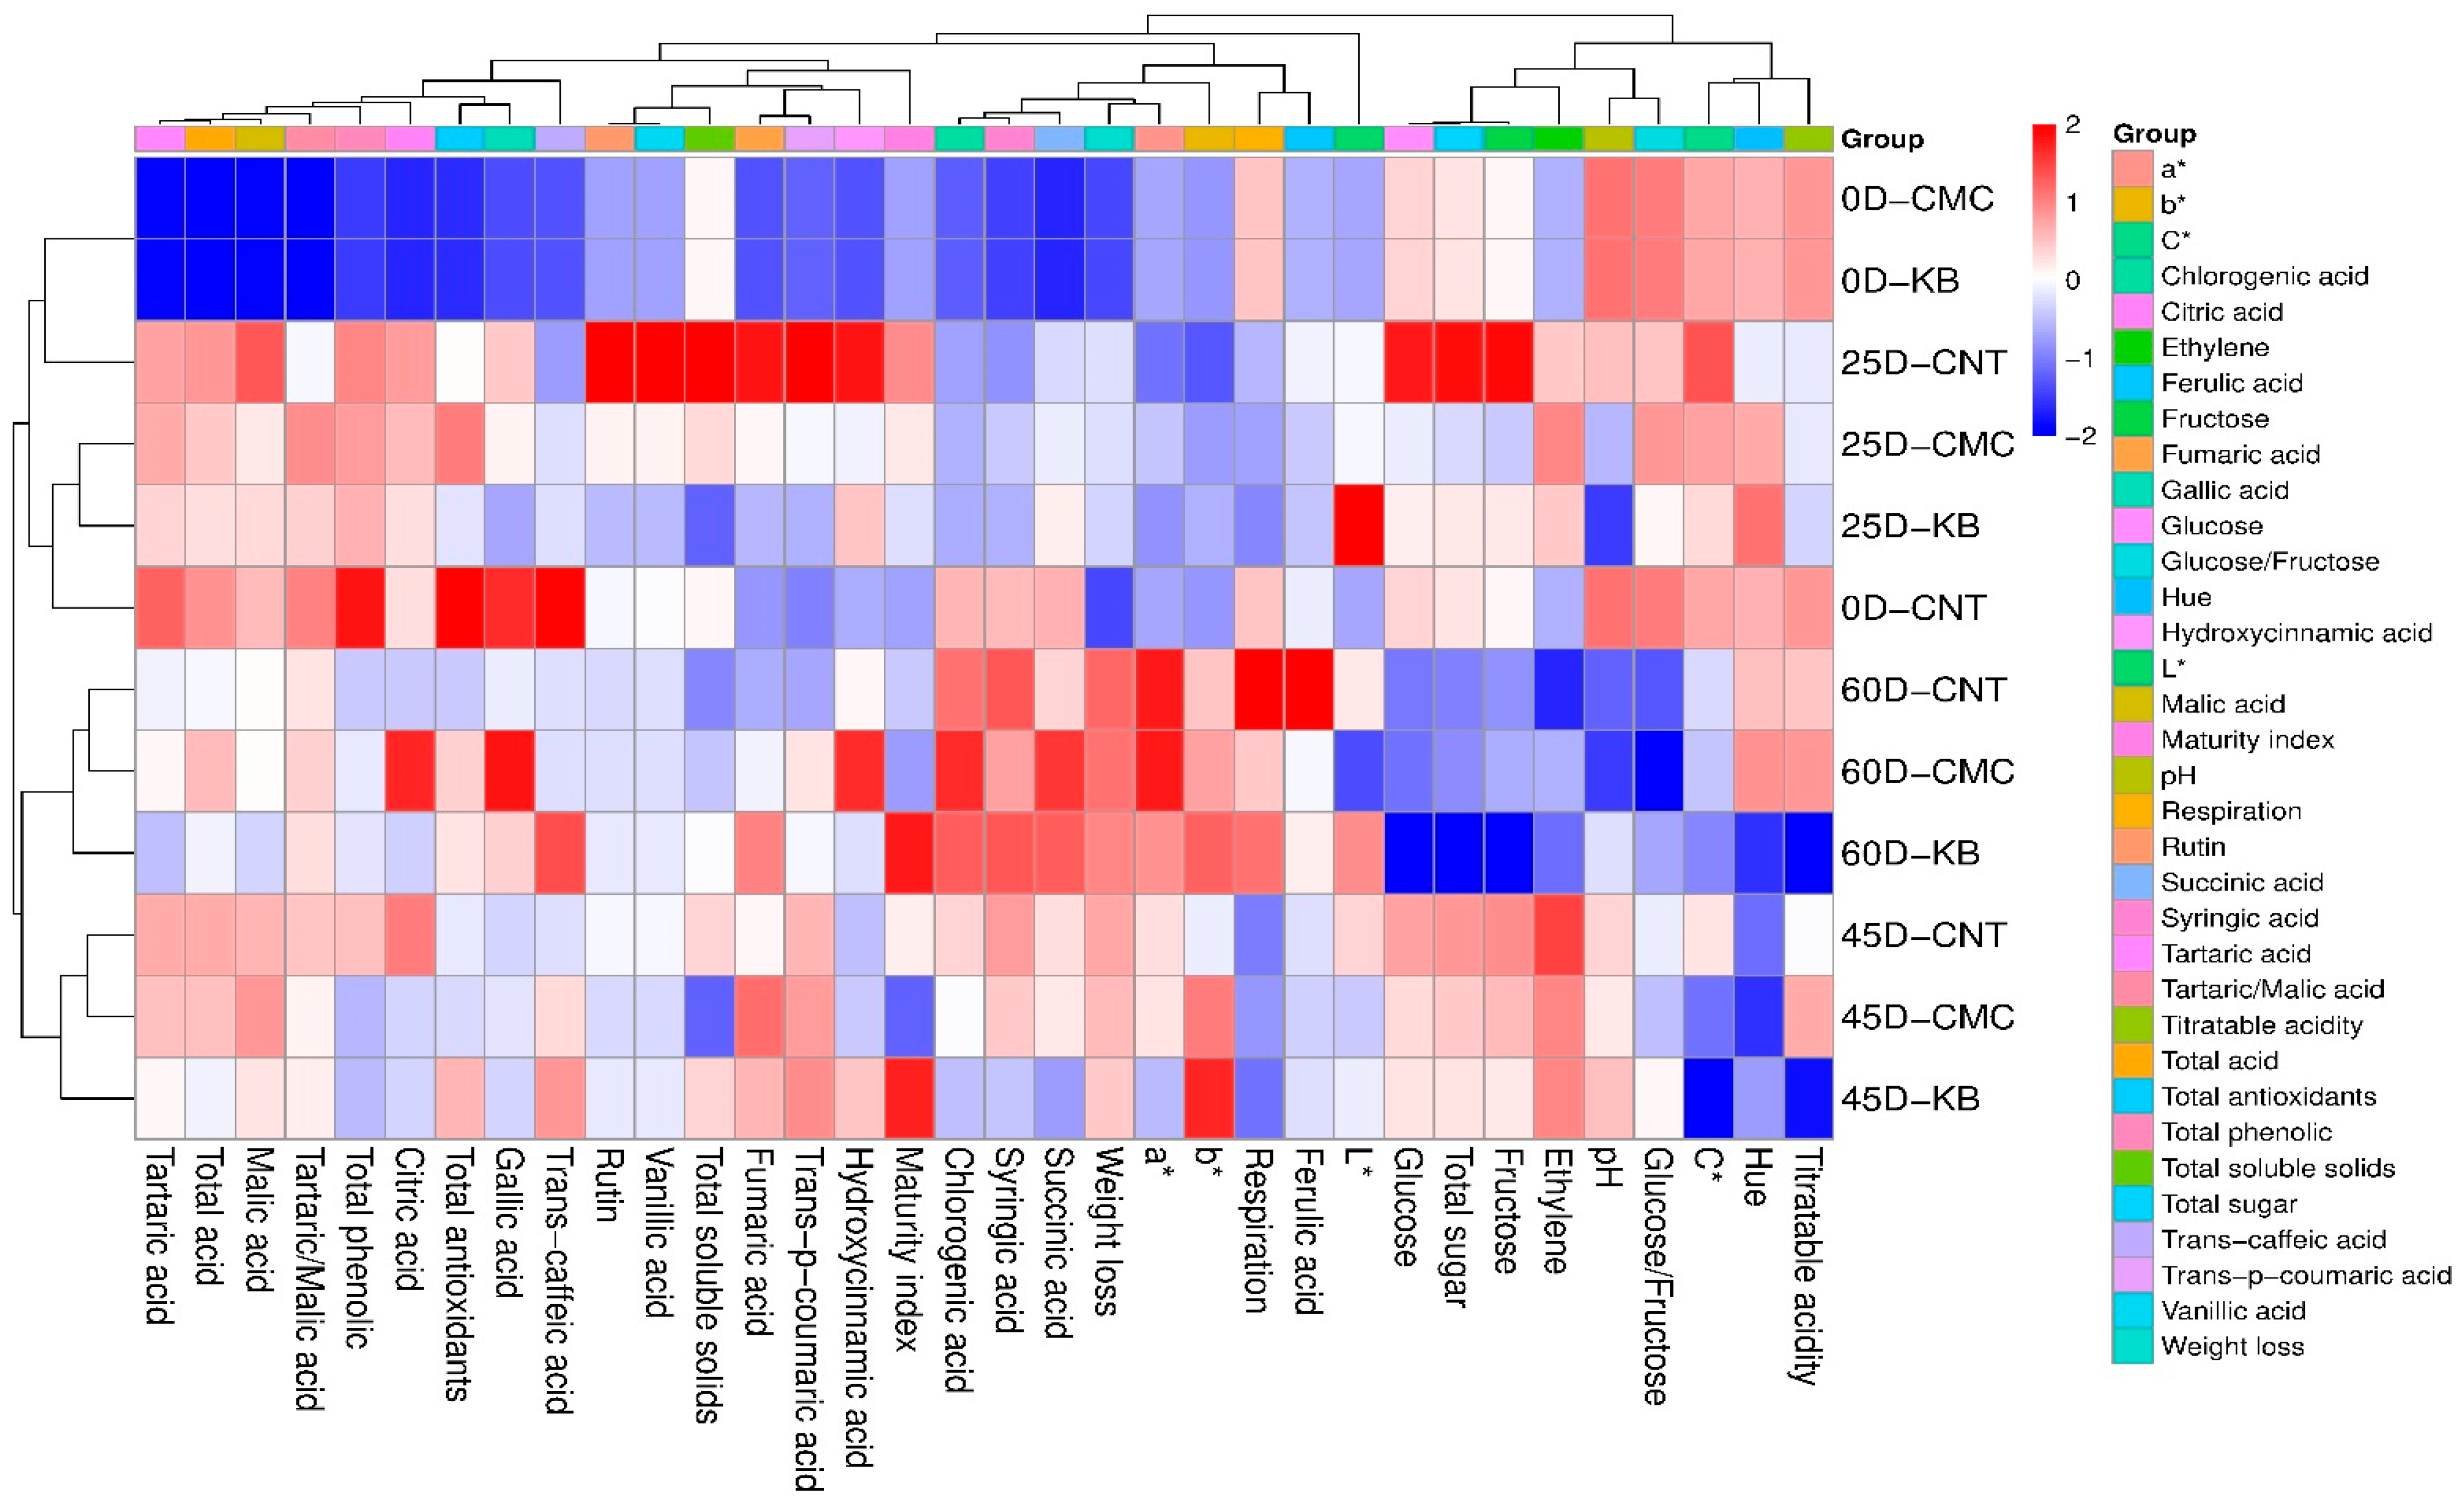
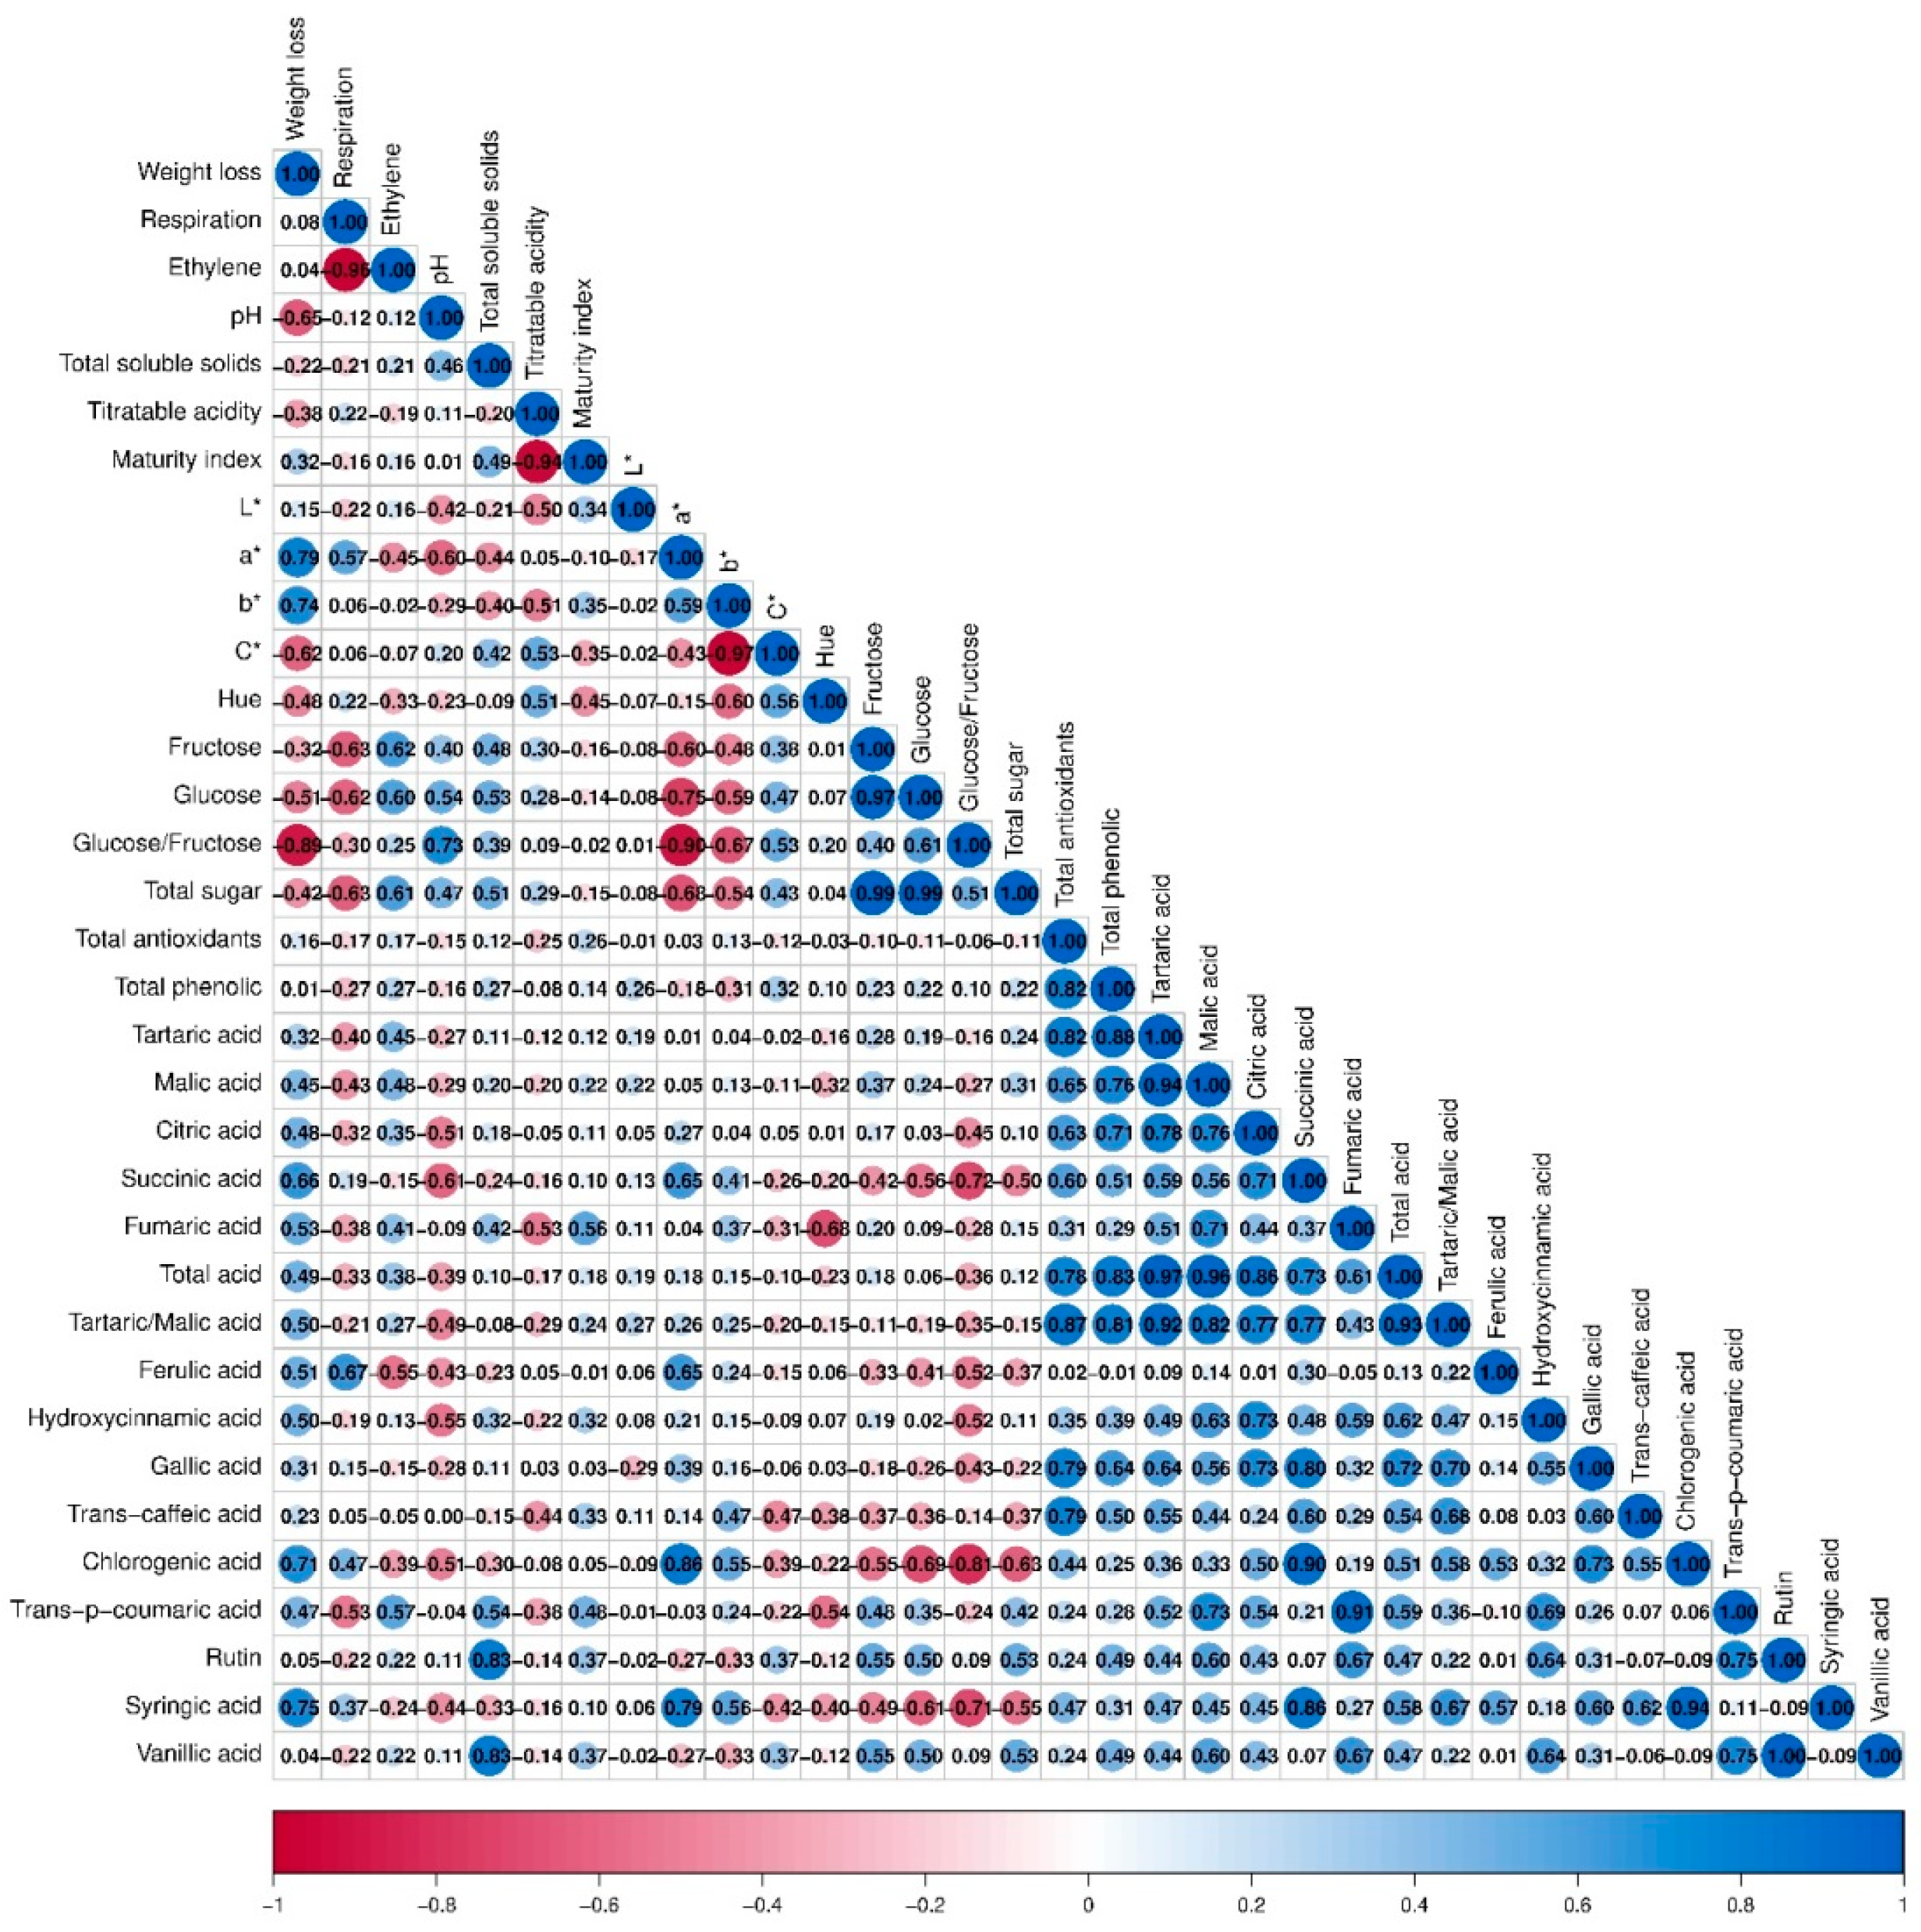
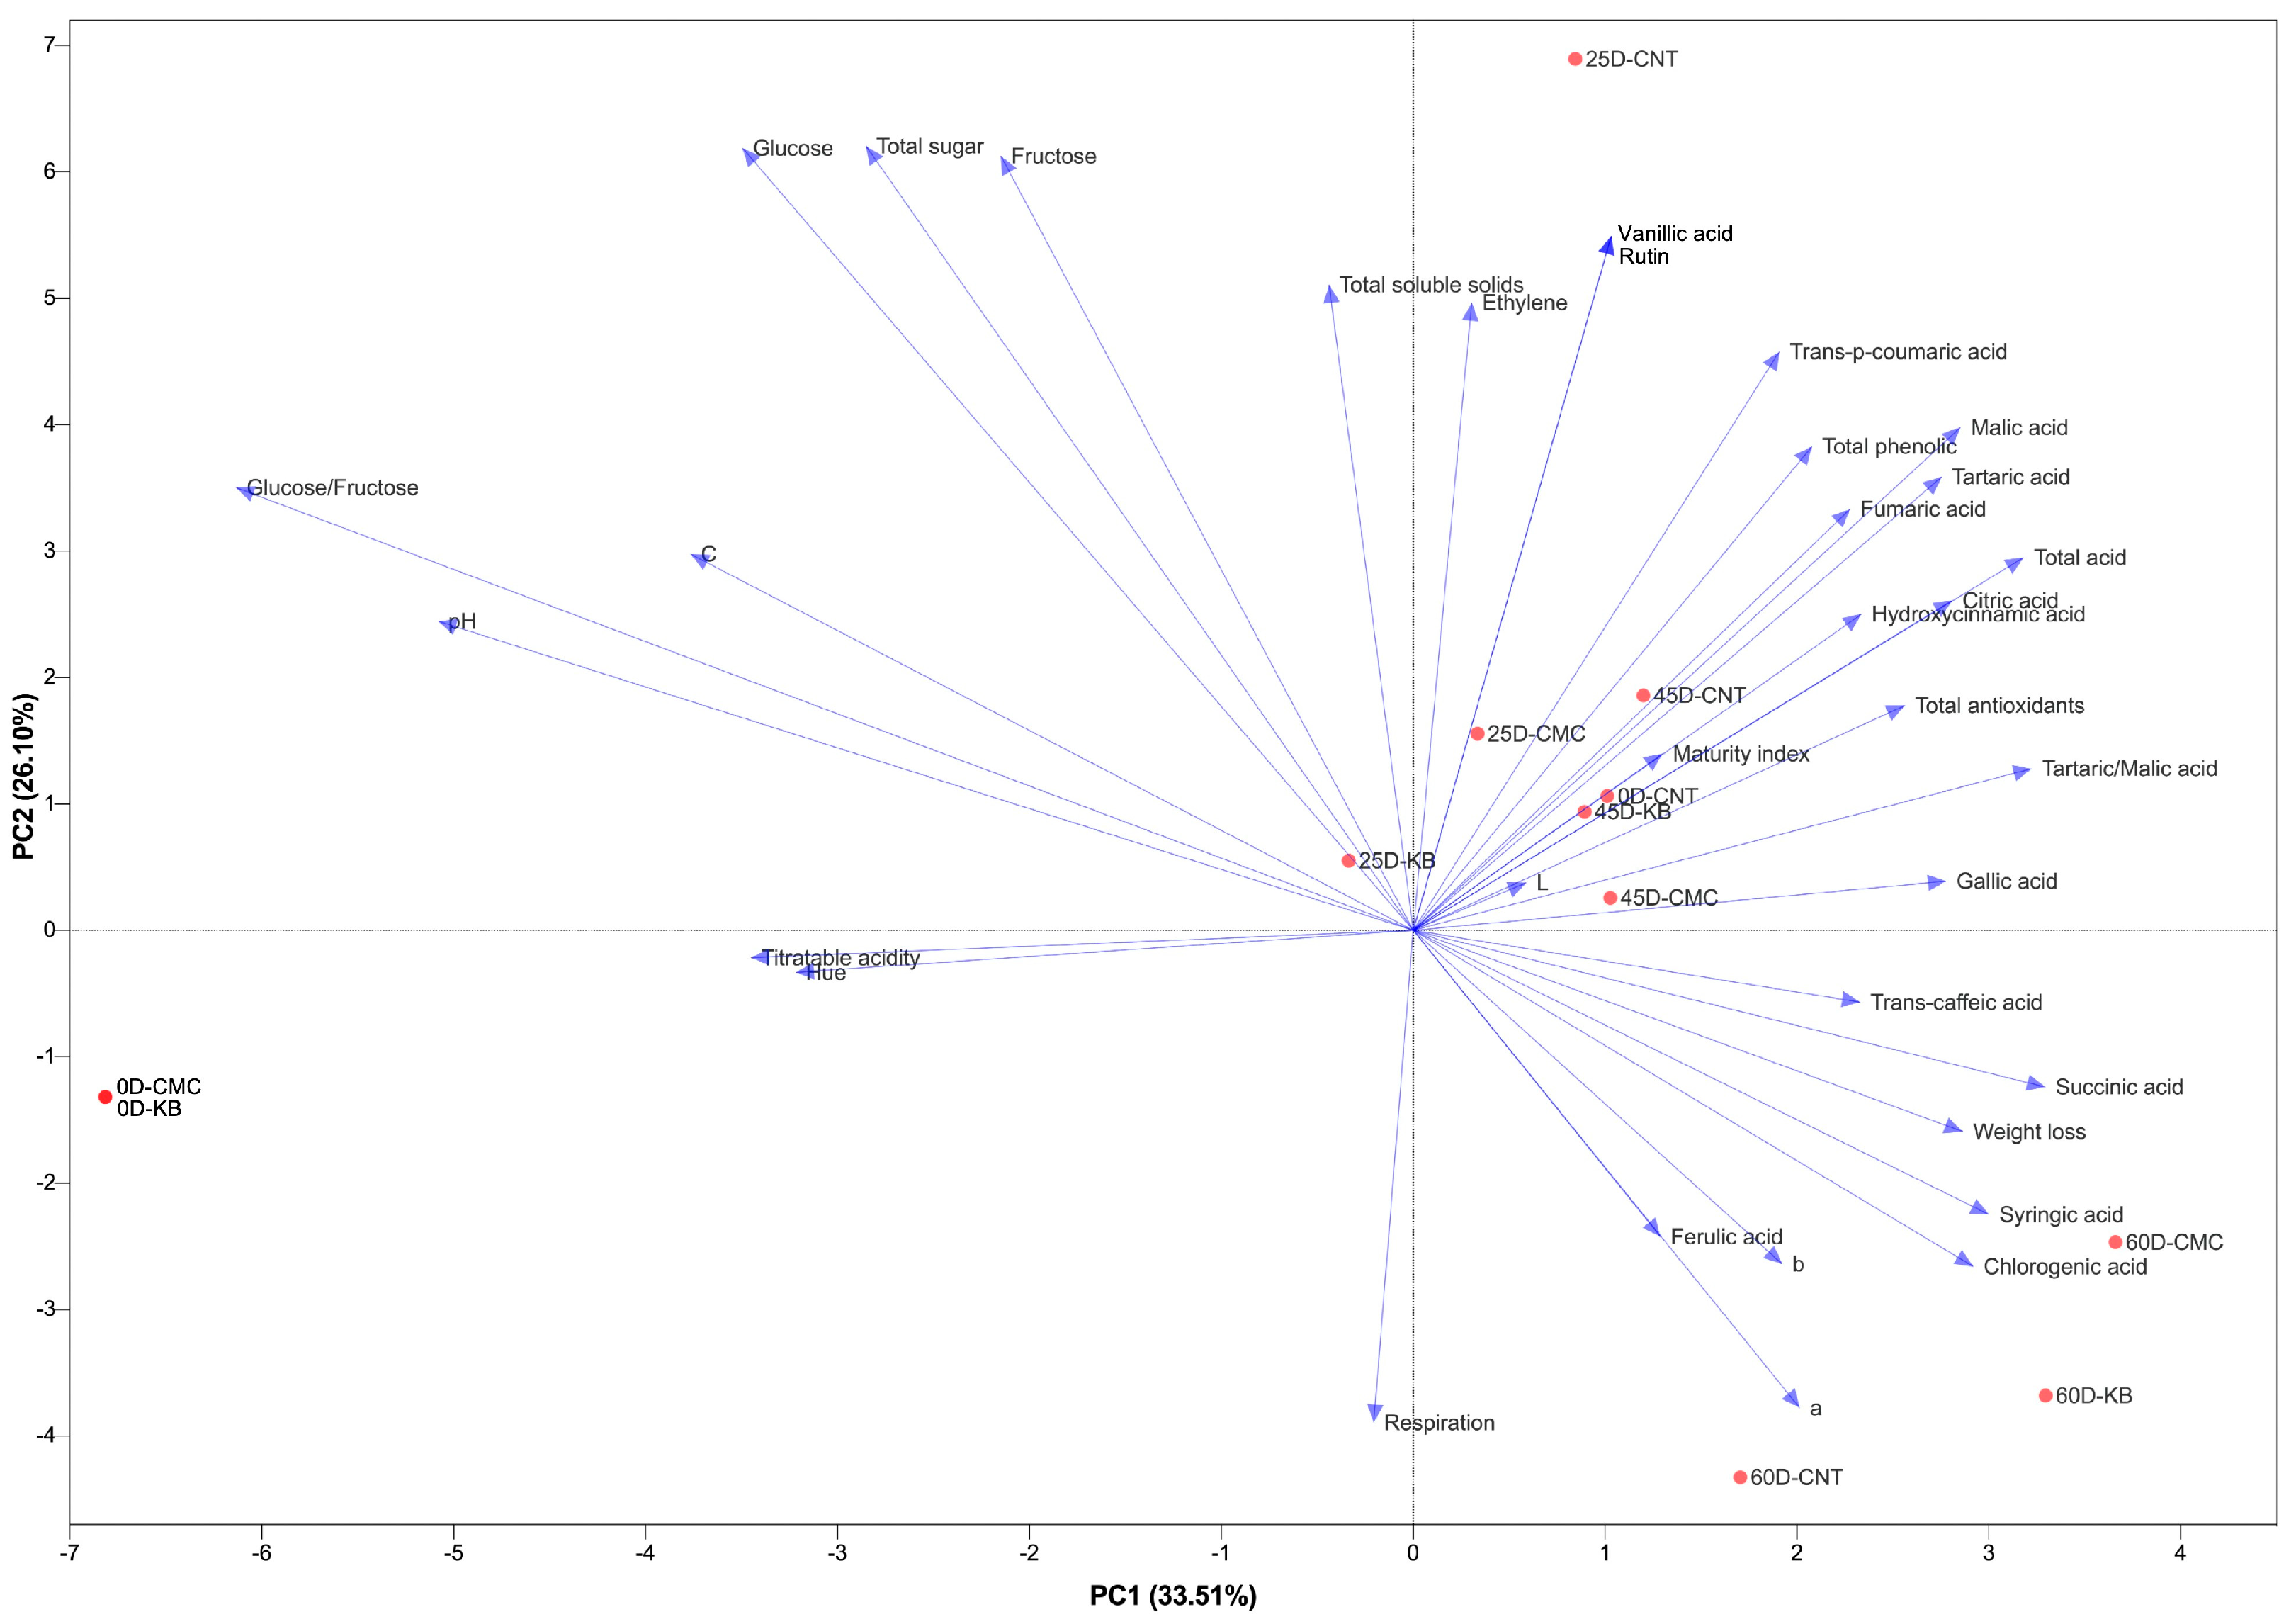
3.6. General Assessment

The heat map and hierarchical clustering analysis (Figure 1) revealed that certain phytochemical components and quality traits showed similar patterns depending on treatment type and storage time. Some groups (e.g., 25D-KB and 45D-CMC) exhibited higher levels of ethylene, total sugar, glucose/fructose ratio, and ferulic acid, while acidic components like tartaric acid, malic acid, and titratable acidity were present in lower concentrations in other samples.
Figure 2 illustrates significant correlations between various parameters. There was a strong positive correlation between antioxidant capacity and phenolic compounds (r = 0.92). Similarly, sugar components like fructose and glucose showed a strong positive correlation (r = 0.93). A negative correlation was found between pH and titratable acidity (r = −0.76), meaning that as pH increases, acidity decreases. Color measurements significantly correlated with soluble solids concentration and maturity index.
Principal Component Analysis (Figure 3) showed a remarkable separation in chemical composition of different sample groups. It shows that 33.51% of the variance can be explained by the first principal component (PC1). This axis includes phenolic and sugar components such as fructose, glucose, vanillic acid, total sugar, and rutin. As seen from the high loading values of these chemicals in the PC1 axis, these variables are the primary factors affecting the separation between the groups. Compounds such as succinic acid, ferulic acid, chlorogenic acid, and syringic acid are primarily found in sample groups with negative PC1 values. It was also noted that weight loss and respiratory rate were high in these groups. In contrast, antioxidant activity, total soluble solids, and vanillic acid were more prevalent in groups with positive PC1 values. The secondary principal component (PC2) explains 26.10% of the variance.
It was observed that variables such as total phenolic substance level, tartaric/malic acid ratio, and fumaric acid exhibited significant variation in the PC2 axis. This suggested that the relevant molecules were identified in a secondary but important way among the samples. The PCA results in Figure 3 indicated that different storage periods and applied coating methods had significant effects on the quality parameters and phenolic composition of the grape samples.

4. Discussion

4.1. Weight Loss and Respiration Rate

Our study revealed that ‘Karaerik’ grapes lost significant weight during extended storage (p < 0.05). This wasn’t surprising, as water naturally escapes from fruit tissues through respiration and transpiration over time. Several researchers have reported similar findings in grapes and other fruits [20,21,22]. When we tested CMC and KB coatings, we found they helped somewhat but didn’t completely solve the problem. Treated grapes showed less weight loss than untreated ones, but the difference wasn’t statistically significant. The coatings seem to offer some protection against moisture loss, but they can’t fully prevent it. Our results mirror what others have found with various coating materials [23,24]. As Zhang et al. [25] pointed out, CMC may delay water loss, but its effectiveness really depends on the fruit’s characteristics and storage environment. We also noticed interesting patterns in respiration rates. They changed considerably throughout storage, with a dramatic spike on day 60 (p < 0.05). This likely happens because the fruit undergoes physiological aging and increased metabolic activity when stored for so long. Uncoated grapes showed higher respiration rates, suggesting they exchange gases more freely, which speeds up their metabolism. Previous research has shown that edible coatings can restrict gas movement, slow down respiration, and delay ripening [26,27,28,29]. Interestingly, we didn’t see much difference between CMC and KB treatments, indicating they had similar effects on respiration. As for ethylene production, it remained fairly consistent regardless of treatment, storage time, or their combined effect. We were detected slight increases as storage progressed, but nothing statistically significant. This makes sense since grapes are non-climacteric fruits where ethylene plays a minor role [30], explaining why production stayed relatively stable throughout our study.

4.2. pH, Titratable Acidity, and Total Soluble Solids

We observed notable changes in pH values throughout the storage period across all treatments. While all groups started with similar pH levels at day 0, these decreased by day 25, with CMC and KB groups showing more pronounced reductions. By day 60, the CMC group exhibited a significant pH decrease, suggesting this coating might suppress pH by affecting microbial activity or organic acid production. This aligns with research showing CMC can increase acidification by limiting microbial growth [31,32]. Though coatings don’t immediately alter pH, they appear to influence natural pH changes over time. Study [33] similarly found that storage time impacts pH more significantly than coating applications, highlighting the importance of proper storage management. For Total Soluble Solids (TSS), both coatings and storage duration had minimal effects (p > 0.05). Starting at 16.33 °Brix (day 0), TSS increased to 17.77 °Brix in the control group by day 25, likely due to sugar accumulation or concentration from water loss during ripening. CMC and KB groups showed no significant TSS increases, with KB even showing a decreasing trend. This suggests these coatings may affect sugar concentration by influencing metabolism or water evaporation. Previous research shows biodegradable coatings can slow TSS increases by reducing water loss and respiration [34]. CMC may limit water evaporation due to its semi-permeable structure, potentially preventing content concentration [35]. The maturity index and titratable acidity showed no significant effects from either coating methods or storage duration (p > 0.05), suggesting these parameters depend mainly on natural variations and physiological development.

4.3. Color Parameters

Color parameters are essential quality indicators that reflect fruit maturity and marketability [36]. Our findings showed that both storage duration and coating treatments affected grape color in several ways. The L* value started at 33.30 on day 0 and increased slightly over time, peaking at 34.89 on day 25, which shows improved surface brightness. KB-coated grapes consistently had the highest L* values, suggesting that some biodegradable coatings can enhance visual appeal by improving brightness [37]. For the a* value (red-green spectrum), we observed an increase during storage, reaching 1.00 by day 60, indicating a shift toward red coloration. This increase was more noticeable in the control and CMC groups, suggesting these treatments better-maintained pigment stability. This trend matches anthocyanin accumulation patterns seen in other studies [38,39]. The b* value (blue-yellow spectrum) started at −2.36 and became less negative during storage (−1.13 on day 45), showing a shift from blue toward warmer, yellowish tones. The significant differences between treatments (p = 0.006) show that coating methods directly influence this color component. Chroma (C*) values were higher initially (2.55 on day 0) but decreased over time, indicating reduced color intensity probably due to anthocyanin degradation [40]. KB-coated grapes had the lowest average C* (1.92 ± 0.64), suggesting this coating was less effective at preserving color saturation. The hue angle shifted from 276.02° initially to 242.29° on day 45, indicating a change from purple toward yellower tones, likely from pigment degradation and enzyme activity [41]. Control samples had higher average hue values (263.47), suggesting they maintained better hue preservation.

4.4. Sugar and Acid Content

Our sugar profile analysis showed that both coating methods and storage duration significantly affected grape sugar components (p < 0.05). Initially, fructose and glucose levels were similar across all groups (8.66 g/L and 8.42 g/L respectively), with a glucose/fructose ratio of 0.97, which typically approaches one in fresh fruits [42]. As storage progressed, this ratio decreased to 0.85 by day 60, indicating faster glucose consumption compared to fructose, supporting the idea that glucose is more actively used in metabolic processes [43]. The control group showed increased total sugar (22.03 g/L), fructose (11.40 g/L), and glucose (10.62 g/L) by day 25, suggesting effective sugar preservation and slowed respiratory sugar loss. CMC and especially KB applications showed more pronounced sugar losses. By day 60, KB-coated grapes had the lowest fructose (5.23 g/L), glucose (4.57 g/L), and total sugar (9.80 g/L) levels, suggesting this coating didn’t create an adequate barrier or sufficiently slow fruit metabolism. Research confirms that coating material properties significantly influence fruit respiration [44,45]. For organic acids, content generally decreased across all groups during storage, aligning with studies showing that tartaric and malic acids are consumed through respiration during ripening and storage [46,47]. The highest initial tartaric acid was in the control group (4.37), but significant decreases occurred during storage in all treatments. KB-coated grapes showed the lowest tartaric acid (1.96) by day 60, indicating poor organic acid stability maintenance. Malic acid similarly decreased over time, though interestingly increased in the control group on day 25 (2.54).

4.5. Antioxidant and Phenolic Compounds

We looked at how CMC and KB coatings affected antioxidant capacity and phenolic compounds. Both storage time and coating type changed these levels a lot (p < 0.05). The control group started with high amounts (376.63 and 101.19 mg GAE/g), but by day 60, these dropped a lot (to 126.63 and 34.36 mg GAE/g). This shows how quickly these beneficial compounds degrade after harvest without any protective treatment. The CMC coating performed well, maintaining higher antioxidant activity (74.81 mg GAE/g) than the control group, especially after day 25, and slowed the decline of phenolic compounds. We think this happens because CMC’s semi-permeable structure helps regulate gas exchange and reduces oxidative stress, which helps preserve these biological compounds. This aligns with research showing CMC coatings can delay cold damage and preserve quality in citrus fruits [48]. KB coating showed mixed results, it provided better antioxidant capacity (62.12 mg GAE/g) than the control group by day 45, but its phenolic compound content was quite low (111.00 mg GAE/g). This suggests KB might offer short-term protection for certain antioxidants but doesn’t preserve phenolic compounds as effectively as CMC does. We also found that ferulic acid increased significantly (4.74 µg/g) in the control group by day 60. This increase likely happens because of cell wall breakdown and texture deterioration, as ferulic acid is an intermediate product in lignin synthesis, as Wang et al. [49] have noted. Both CMC and KB coatings suppressed this ferulic acid increase, suggesting they slow ripening and deterioration by helping maintain tissue integrity [50].

4.6. General Assessment

Our multivariate analyses (Figure 1) revealed key relationships between phytochemicals and quality parameters across coatings and storage periods. We found ethylene, total sugar, glucose/fructose ratio, and ferulic acid levels were higher in day 25 KB and day 45 CMC groups, suggesting increased metabolic activity in these treatments. This aligns with previous research showing positive relationships between ethylene and sugar accumulation [51,52]. Acidic components decreased during storage, consistent with normal ripening [46], but CMC and KB coatings moderated this decrease compared to the control group. Correlation analysis (Figure 2) revealed strong positive relationships between antioxidant capacity and phenolic compounds (r > 0.90), highlighting their crucial role in grape defense systems. The high correlation between total antioxidant capacity and phenolics (r = 0.92) supports findings from Paixao et al. [53] and Terpinc et al. [54] that phenolic profiles largely determine bioactive value [55]. Principal Component Analysis (Figure 3) showed PC1 explaining 33.51% of the variance (associated with phenolics and carbohydrates) and PC2 explaining 26.10% (associated with acid ratios and total phenolics). This confirms PCA’s effectiveness in monitoring fruit quality, consistent with previous studies [1,56].

5. Conclusions

Our study revealed that edible coating selection significantly influences postharvest quality and shelf life of ‘Karaerik’ grapes during cold storage. Comparing carboxymethyl cellulose (CMC) and Locust Bean Gum (KB) coatings, we found that CMC consistently demonstrated superior performance in maintaining fruit quality across physiological and biochemical parameters. During extended storage periods (up to 60 days), CMC-coated grapes maintained lower respiration rates, more stable acidity levels, and higher antioxidant activity compared to KB-coated and control samples. Under cold storage conditions, CMC coating preserved fruit quality by reducing respiratory metabolism, maintaining stable titratable acidity levels, and providing superior protection of antioxidant compounds. The divergent preservation mechanisms between coating materials were particularly evident in their biochemical profiles. While both coatings showed some protective effects, CMC-coated grapes focused on maintaining antioxidant capacity and acid stability, whereas KB-coated samples exhibited lower sugar levels and greater compositional changes over time. These differences translated to significant variations in phenolic profiles and organic acid content, with CMC maintaining better overall biochemical stability during storage, particularly in preserving citric acid content by day 60. Importantly, grapes coated with CMC showed the best overall physiological and biochemical responses, especially at the storage temperature where these variables remained more stable. In comparison, the KB coating demonstrated moderate efficacy but was less effective than CMC, while the untreated control grapes exhibited the greatest deterioration in quality parameters. This concise comparison highlights the clear advantages of CMC as a postharvest treatment. Our findings suggest CMC coating is effective for extending ‘Karaerik’ grape shelf life during commercial cold storage. This approach can be readily implemented within existing postharvest protocols. Future studies should investigate molecular mechanisms between coatings and grape skin, alongside consumer acceptance and economic feasibility analyses to support commercial adoption.

Supplementary Materials

The following supporting information can be downloaded at: https://www.mdpi.com/article/10.3390/horticulturae11060672/s1, File S1. Analysis of variance for storage duration and treatment effects on fruit quality characteristics.

Author Contributions

Conceptualization, O.T. and N.K.; methodology, O.T., N.K., B.K. (Birhan Kunter), S.C. and A.Ç.K.; software, S.K. (Sıddık Keskin), H.H.-V. and O.K.; validation, N.K., O.T., B.K. (Birhan Kunter), S.C., S.K. (Sıddık Keskin) and O.K.; formal analysis, O.T., S.K. (Sıddık Keskin), N.K. and A.Ç.K.; investigation, N.K., S.K., H.H.-V., O.K., S.C., O.T., B.K. (Birol Karadogan), S.K. (Sinem Karakus) and A.Ç.K.; resources, N.K. and O.K.; data curation, N.K., O.T., S.K. (Sinem Karakus) and A.Ç.K.; writing—original draft preparation, N.K., S.K. (Sinem Karakus) and O.K.; writing—review and editing, N.K., S.K. (Sinem Karakus), O.K. and O.T.; visualization, O.K.; supervision, N.K.; project administration, N.K.; funding acquisition, N.K., H.H.-V., O.K. and S.C. All authors have read and agreed to the published version of the manuscript.

Funding

This research was funded by Van Yuzuncu Yil University, Scientific Research Projects Department, grant number FBA-2020-9288.

Data Availability Statement

Data are contained within the article.

Acknowledgments

The authors thank Van Yüzüncü Yıl University for providing facilities to conduct this research. This work was supported by Van Yüzüncü Yıl University under project number FBA-2020-9288. During the preparation of this manuscript, the authors used standard software tools for data analysis and manuscript formatting. The authors have reviewed and edited all content and take full responsibility for this publication.

Conflicts of Interest

The authors declare no conflicts of interest.

References

  1. Kaya, O.; Bozkurt, A.; Karakus, S.; Daler, S.; Yilmaz, T.; Turan, M. Essential Oils in Post-Harvest Disease Management: Metabolic Impact on Narince (Vitis vinifera L. cv) Grapes Against Botrytis cinerea. Physiol. Mol. Plant Pathol. 2024, 132, 102318. [Google Scholar] [CrossRef]
  2. Xia, E.Q.; Deng, G.F.; Guo, Y.J.; Li, H.B. Biological activities of polyphenols from grapes. Int. J. Mol. Sci. 2010, 11, 622–646. [Google Scholar] [CrossRef]
  3. Lichter, A.; Kaplunov, T.; Zutahy, Y.; Daus, A.; Alchanatis, V.; Ostrovsky, V.; Lurie, S. Physical and visual properties of grape rachis as affected by water vapor pressure deficit. Postharvest Biol. Technol. 2011, 59, 25–33. [Google Scholar] [CrossRef]
  4. Al-Qurashi, A.D.; Awad, M.A. Postharvest chitosan treatment affects quality, antioxidant capacity, antioxidant compounds and enzymes activities of ‘El-Bayadi’table grapes after storage. Sci. Hortic. 2015, 197, 392–398. [Google Scholar] [CrossRef]
  5. Kaya, O.; Incesu, M.; Ates, F.; Keskin, N.; Verdugo-Vásquez, N.; Gutiérrez-Gamboa, G. Study of volatile organic compounds of two table grapes (cv. Italia and Bronx Seedless) along ripening in vines established in the Aegean region (Turkey). Plants 2022, 11, 1935. [Google Scholar] [CrossRef]
  6. Romero, I.; Vazquez-Hernandez, M.; Maestro-Gaitan, I.; Escribano, M.I.; Merodio, C.; Sanchez-Ballesta, M.T. Table grapes during postharvest storage: A review of the mechanisms implicated in the beneficial effects of treatments applied for quality retention. Int. J. Mol. Sci. 2020, 21, 9320. [Google Scholar] [CrossRef]
  7. Pandya, J.B. Post-Harvest Nutraceuticals: Edible Coatings for Enhanced Quality and Nutrition; Academic Guru Publishing House: Madhya Pradesh, India, 2025. [Google Scholar]
  8. de Aguiar, A.C.; Higuchi, M.T.; Yamashita, F.; Roberto, S.R. SO2-generating pads and packaging materials for postharvest conservation of table grapes: A review. Horticulturae 2023, 9, 724. [Google Scholar] [CrossRef]
  9. Fakhouri, F.M.; Martelli, S.M.; Caon, T.; Velasco, J.I.; Mei, L.H.I. Edible films and coatings based on starch/gelatin: Film properties and effect of coatings on quality of refrigerated Red Crimson grapes. Postharvest Biol. Technol. 2015, 109, 57–64. [Google Scholar] [CrossRef]
  10. Marín, A.; Plotto, A.; Atarés, L.; Chiralt, A. Lactic acid bacteria incorporated into edible coatings to control fungal growth and maintain postharvest quality of grapes. HortScience 2019, 54, 337–343. [Google Scholar] [CrossRef]
  11. Palou, L.; Valencia-Chamorro, S.A.; Pérez-Gago, M.B. Antifungal edible coatings for fresh citrus fruit: A review. Coatings 2015, 5, 962–986. [Google Scholar] [CrossRef]
  12. Morales, F.; Cabodevilla, A.; Pascual, I.; Urdiain, A. New Instrumentation in Grapevine Research: A Dual Respiration Prototype for Grape Berries and Whole Bunch. The Grape CO2/O2 Respiratory Quotient Revisited. Comput. Electron. Agric. 2024, 217, 108659. [Google Scholar] [CrossRef]
  13. Afifi, M.; Rezk, A.; Obenland, D.; El-Kereamy, A. Vineyard Light Manipulation and Silicon Enhance Ethylene-Induced Anthocyanin Accumulation in Red Table Grapes. Front. Plant Sci. 2023, 14, 1060377. [Google Scholar] [CrossRef] [PubMed]
  14. Xu, M.; Sun, J.; Cheng, J.; Yao, K.; Wu, X.; Zhou, X. Non-destructive Prediction of Total Soluble Solids and Titratable Acidity in Kyoho Grape Using Hyperspectral Imaging and Deep Learning Algorithm. Int. J. Food Sci. Technol. 2023, 58, 9–21. [Google Scholar] [CrossRef]
  15. Liu, H.F.; Wu, B.H.; Fan, P.G.; Li, S.H.; Li, L.S. Sugar and Acid Concentrations in 98 Grape Cultivars Analyzed by Principal Component Analysis. J. Sci. Food Agric. 2006, 86, 1526–1536. [Google Scholar] [CrossRef]
  16. Swain, T.; Hillis, W.E. The Phenolic Constituents of Prunus domestica. I. The Quantitative Analysis of Phenolic Constituents. J. Sci. Food Agric. 1959, 10, 63–68. [Google Scholar] [CrossRef]
  17. Benzie, I.F.; Strain, J.J. The Ferric Reducing Ability of Plasma (FRAP) as a Measure of “Antioxidant Power”: The FRAP Assay. Anal. Biochem. 1996, 239, 70–76. [Google Scholar] [CrossRef]
  18. Topalovic, A.; Mikulic-Petkovsek, M. Changes in Sugars, Organic Acids and Phenolics of Grape Berries of Cultivar Cardinal During Ripening. J. Food Agric. Environ. 2010, 8, 223–227. [Google Scholar]
  19. Rodriguez, F.I.; Esch, J.J.; Hall, A.E.; Binder, B.M.; Schaller, G.E.; Bleecker, A.B. A Copper Cofactor for the Ethylene Receptor ETR1 from Arabidopsis. Science 1999, 283, 996–998. [Google Scholar] [CrossRef]
  20. Unal, S.; Sabir, F.K.; Sabir, A. Aloe Vera Treatments Extend the Postharvest Life of Table Grapes by Delaying Weight Loss, Berry Softening, Rachis Browning, and Biochemical Changes. Erwerbs-Obstbau 2022, 64, 767–775. [Google Scholar] [CrossRef]
  21. Donat, A.; Sucu, S. The Effect of pre-harvest and post-harvest aloe vera gel treatments on fruit quality and Storage Performance of Table Grapes. Sci. Hortic. 2024, 331, 113117. [Google Scholar] [CrossRef]
  22. Hasan, M.U.; Singh, Z.; Shah, H.M.S.; Kaur, J.; Woodward, A. Water Loss: A Postharvest Quality Marker in Apple Storage. Food Bioprocess Technol. 2024, 17, 2155–2180. [Google Scholar] [CrossRef]
  23. Cui, H.; Abdel-Samie, M.A.S.; Lin, L. Novel Packaging Systems in Grape Storage—A Review. J. Food Process Eng. 2019, 42, e13162. [Google Scholar] [CrossRef]
  24. Gidado, M.J.; Gunny, A.A.N.; Gopinath, S.C.B.; Ali, A.; Wongs-Aree, C.; Salleh, N.H.M. Challenges of Postharvest Water Loss in Fruits: Mechanisms, Influencing Factors, and Effective Control Strategies–A Comprehensive Review. J. Agric. Food Res. 2024, 17, 101249. [Google Scholar] [CrossRef]
  25. Zhang, X.; Zhang, X.; Liu, X.; Du, M.; Tian, Y. Effect of polysaccharide derived from Osmunda japonica Thunb-incorporated carboxymethyl cellulose coatings on preservation of tomatoes. J. Food Process. Preserv. 2019, 43, e14239. [Google Scholar] [CrossRef]
  26. Eshghi, S.; Karimi, R.; Shiri, A.; Karami, M.; Moradi, M. The novel edible coating based on chitosan and gum ghatti to improve the quality and safety of ‘Rishbaba’table grape during cold storage. J. Food Meas. Charact. 2021, 15, 3683–3693. [Google Scholar] [CrossRef]
  27. Das, S.; Chaudhari, A.K.; Singh, V.K.; Dwivedy, A.K.; Dubey, N.K. Angelica Archangelica Essential Oil Loaded Chitosan Nanoemulsion as Edible Coating for Preservation of Table Grape Fruit Against Botrytis Cinerea Contamination and Storage Quality Deterioration. Postharvest Biol. Technol. 2023, 205, 112482. [Google Scholar] [CrossRef]
  28. Hassan, M.; Ali, S. Carboxymethyl Cellulose Coating Delays Quality Deterioration in Harvested Table Grapes During Cold and Ambient Storage Conditions. Prog. Org. Coat. 2025, 200, 109031. [Google Scholar] [CrossRef]
  29. Sun, M.; Yang, X.; Zhang, Y.; Wang, S.; Wong, M.W.; Ni, R.; Huang, D. Rapid and Visual Detection and Quantitation of Ethylene Released From Ripening Fruits: The New Use of Grubbs Catalyst. J. Agric. Food Chem. 2019, 67, 507–513. [Google Scholar] [CrossRef]
  30. Liu, M.; Wang, C.; Ji, H.; Sun, M.; Liu, T.; Wang, J.; Cao, H.; Zhu, Q. Ethylene biosynthesis and Signal Transduction During Ripening and softening in Non-Climacteric Fruits: An Overview. Front. Plant Sci. 2024, 15, 1368692. [Google Scholar] [CrossRef]
  31. Jafarzadeh, S.; Nafchi, A.M.; Salehabadi, A.; Oladzad-Abbasabadi, N.; Jafari, S.M. Application of bio-nanocomposite films and edible coatings for extending the shelf life of fresh fruits and vegetables. Adv. Colloid Interface Sci. 2021, 291, 102405. [Google Scholar] [CrossRef]
  32. Elhadef, K.; Chaari, M.; Akermi, S.; Hlima, H.B.; Ennouri, M.; Abdelkafi, S.; Agriopoulou, S.; Salahuddin, A.; Boulekbache-Makhlouf, L.; Mellouli, L.; et al. pH-sensitive films based on carboxymethyl cellulose/date pits anthocyanins: A convenient colorimetric indicator for beef meat freshness tracking. Food Biosci. 2024, 57, 103508. [Google Scholar] [CrossRef]
  33. Yekta, R.; Dabbagh Moghaddam, A.; Hosseini, H.; Sharifan, A.; Hadi, S.; Hosseini-Shokouh, S.J. Effect of using biodegradable film constituting red grape anthocyanins as a novel packaging on the qualitative attributes of emergency food bars during storage. Food Sci. Nutr. 2024, 12, 2702–2723. [Google Scholar] [CrossRef]
  34. Miglioranza, B.M.G.; Spinelli, F.R.; Stoffel, F.; Piemolini-Barreto, L.T. Biodegradable film for raisins packaging application: Evaluation of physico-chemical characteristics and antioxidant potential. Food Chem. 2021, 365, 130538. [Google Scholar] [CrossRef]
  35. Arnon, H.; Zaitsev, Y.; Porat, R.; Poverenov, E. Effects of carboxymethyl cellulose and chitosan bilayer edible coating on postharvest quality of citrus fruit. Postharvest Biol. Technol. 2014, 87, 21–26. [Google Scholar] [CrossRef]
  36. Pérez-Magariño, S.; González-San José, M.L. Polyphenols and colour variability of red wines made from grapes harvested at different ripeness grade. Food Chem. 2006, 96, 197–208. [Google Scholar] [CrossRef]
  37. Perez-Vazquez, A.; Barciela, P.; Carpena, M.; Prieto, M.A. Edible coatings as a natural packaging system to improve fruit and vegetable shelf life and quality. Foods 2023, 12, 3570. [Google Scholar] [CrossRef]
  38. Rolle, L.; Guidoni, S. Color and anthocyanin evaluation of red winegrapes by CIE L*, a*, b* parameters. Oeno One 2007, 41, 193–201. [Google Scholar] [CrossRef]
  39. Baldassi, C.; Lee, C.; Dossett, M.; Castellarin, S.D. High-throughput color determination of red raspberry puree and correlation of color parameters with total anthocyanins. Plant Methods 2024, 20, 78. [Google Scholar] [CrossRef]
  40. Enaru, B.; Drețcanu, G.; Pop, T.D.; Stǎnilǎ, A.; Diaconeasa, Z. Anthocyanins: Factors affecting their stability and degradation. Antioxidants 2021, 10, 1967. [Google Scholar] [CrossRef]
  41. Marszałek, K.; Krzyżanowska, J.; Woźniak, Ł.; Skąpska, S. Kinetic modelling of polyphenol oxidase, peroxidase, pectin esterase, polygalacturonase, degradation of the main pigments and polyphenols in beetroot juice during high pressure carbon dioxide treatment. LWT-Food Sci. Technol. 2017, 85, 412–417. [Google Scholar] [CrossRef]
  42. Conde, C.; Silva, P.; Fontes, N.; Dias, A.C.P.; Tavares, R.M.; Sousa, M.J.; Agasse, A.; Delrot, S.; Gerós, H. Biochemical changes throughout grape berry development and fruit and wine quality. Food 2007, 1, 1–22. [Google Scholar]
  43. Lecourieux, F.; Kappel, C.; Lecourieux, D.; Serrano, A.; Torres, E.; Arce-Johnson, P.; Delrot, S. An update on sugar transport and signalling in grapevine. J. Exp. Bot. 2014, 65, 821–832. [Google Scholar] [CrossRef] [PubMed]
  44. Pham, T.T.; Nguyen, L.L.P.; Dam, M.S.; Baranyai, L. Application of edible coating in extension of fruit shelf life. AgriEngineering 2023, 5, 520–536. [Google Scholar] [CrossRef]
  45. Zhang, Y.; Kong, Q.; Niu, B.; Liu, R.; Chen, H.; Xiao, S.; Wu, W.; Zhang, W.; Gao, H. The dual function of calcium ion in fruit edible coating: Regulating polymer internal crosslinking state and improving fruit postharvest quality. Food Chem. 2024, 447, 138952. [Google Scholar] [CrossRef] [PubMed]
  46. Pott, D.M.; Vallarino, J.G.; Osorio, S. Metabolite changes during postharvest storage: Effects on fruit quality traits. Metabolites 2020, 10, 187. [Google Scholar] [CrossRef]
  47. Ma, W.F.; Li, Y.B.; Nai, G.J.; Liang, G.P.; Ma, Z.H.; Chen, B.H.; Mao, J. Changes and Response Mechanism of Sugar and Organic Acids in Fruits Under Water Deficit Stress. PeerJ 2022, 10, e13691. [Google Scholar] [CrossRef]
  48. Eshghi, S.; Karimi, R.; Shiri, A.; Karami, M.; Moradi, M. Effects of polysaccharide-based coatings on postharvest storage life of grape: Measuring the changes in nutritional, antioxidant and phenolic compounds. J. Food Meas. Charact. 2022, 16, 1159–1170. [Google Scholar] [CrossRef]
  49. Wang, Y.L.; Wang, W.K.; Wu, Q.C.; Yang, H.J. The release and catabolism of ferulic acid in plant cell wall by rumen microbes: A review. Anim. Nutr. 2022, 9, 335–344. [Google Scholar] [CrossRef]
  50. Pan, J.; Li, C.; Liu, J.; Jiao, Z.; Zhang, Q.; Lv, Z.; Yang, W.; Chen, D.; Liu, H. Polysaccharide-Based Packaging Coatings and Films with Phenolic Compounds in Preservation of Fruits and Vegetables—A Review. Foods 2024, 13, 3896. [Google Scholar] [CrossRef]
  51. Kaya, O.; Karakus, S.; Ates, F.; Daler, S.; Hatterman-Valenti, H. Enhancing Royal grape quality through a three-year investigation of soil management practices and organic amendments on berry biochemistry. Chem. Biol. Technol. Agric. 2025, 12, 17. [Google Scholar] [CrossRef]
  52. Li, J.; Min, D.; Li, Z.; Fu, X.; Zhao, X.; Wang, J.; Zhang, X.; Li, F.; Li, X.; Guo, Y. Regulation of sugar metabolism by methyl jasmonate to improve the postharvest quality of tomato fruit. J. Plant Growth Regul. 2022, 41, 1615–1626. [Google Scholar] [CrossRef]
  53. Paixao, N.; Perestrelo, R.; Marques, J.C.; Câmara, J.S. Relationship between antioxidant capacity and total phenolic content of red, rosé and white wines. Food Chem. 2007, 105, 204–214. [Google Scholar] [CrossRef]
  54. Terpinc, P.; Čeh, B.; Ulrih, N.P.; Abramovič, H. Studies of the correlation between antioxidant properties and the total phenolic content of different oil cake extracts. Ind. Crops Prod. 2012, 39, 210–217. [Google Scholar] [CrossRef]
  55. Lattanzio, V. Bioactive polyphenols: Their role in quality and storability of fruit and vegetables. J. Appl. Bot. 2003, 77, 128–146. [Google Scholar]
  56. Karakus, S.; Atıcı, O.; Turan, M.; Kaya, O. Essential Oils Combat Botrytis Cinerea in Apples: Unveiling Sugar, Vitamin, and Antioxidant Dynamics. J. Food Meas. Charact. 2024, 18, 5590–5601. [Google Scholar] [CrossRef]
Figure 1. Heat map and hierarchical cluster analysis showing the relationship between quality parameters and phytochemical compounds in experimental groups.
Horticulturae 11 00672 g001
Figure 2. Pearson correlation matrix between the examined quality, color, sugar-acid composition, antioxidant activity, and phenolic compounds.
Horticulturae 11 00672 g002
Figure 3. Principal component analysis between the examined quality, color, sugar-acid composition, antioxidant activity, and phenolic compounds.
Horticulturae 11 00672 g003
Table 1. Effects of Storage Period and Treatments on Physiological and Biochemical Quality of Grapes.
NDSTWLRESPETHpHTSSTAMIL*a*b*C*Hue
0CNT0.00 ± 0.0036.69 ± 5.390.06 ± 0.033.26 ± 0.0616.33 ± 1.520.76 ± 0.0421.83 ± 3.2233.30 ± 0.710.46 ± 0.38−2.36 ± 0.362.55 ± 0.32276.02 ± 9.29
CMC0.00 ± 0.0036.69 ± 5.390.06 ± 0.033.26 ± 0.0616.33 ± 1.520.76 ± 0.0421.83 ± 3.2233.30 ± 0.710.46 ± 0.38−2.36 ± 0.362.55 ± 0.32276.02 ± 9.29
KB0.00 ± 0.0036.69 ± 5.390.06 ± 0.033.26 ± 0.0616.33 ± 1.520.76 ± 0.0421.83 ± 3.2233.30 ± 0.710.46 ± 0.38−2.36 ± 0.362.55 ± 0.32276.02 ± 9.29
25CNT4.50 ± 0.9827.26 ± 3.310.08 ± 0.053.22 ± 0.0617.77 ± 0.960.70 ± 0.0925.74 ± 4.5533.97 ± 0.310.36 ± 0.13−2.69 ± 0.212.89 ± 0.08261.41 ± 12.83
CMC4.45 ± 0.3725.55 ± 5.710.09 ± 0.063.15 ± 0.1116.47 ± 1.270.70 ± 0.0924.02 ± 4.6533.99 ± 0.420.52 ± 0.25−2.31 ± 0.342.58 ± 0.04276.99 ± 12.99
KB4.23 ± 0.1123.85 ± 4.550.08 ± 0.043.09 ± 0.0915.60 ± 0.720.69 ± 0.1223.03 ± 4.5136.71 ± 0.680.42 ± 0.09−2.19 ± 0.222.35 ± 0.26284.62 ± 2.31
45CNT8.25 ± 1.2823.20 ± 6.580.10 ± 0.063.21 ± 0.0116.50 ± 1.080.71 ± 0.1523.93 ± 5.8634.40 ± 2.210.70 ± 0.30−1.85 ± 0.912.30 ± 0.64242.92 ± 38.12
CMC7.61 ± 1.0824.91 ± 7.540.09 ± 0.073.20 ± 0.1815.60 ± 0.440.75 ± 0.0220.74 ± 0.9433.58 ± 0.670.69 ± 0.26−1.01 ± 0.421.62 ± 0.19234.13 ± 61.23
KB7.09 ± 0.7522.38 ± 1.650.09 ± 0.053.22 ± 0.0716.50 ± 1.510.60 ± 0.0827.71 ± 4.5933.88 ± 1.920.50 ± 0.07−0.54 ± 0.361.09 ± 0.06249.80 ± 41.47
60CNT10.01 ± 1.6250.48 ± 11.220.04 ± 0.023.11 ± 0.0815.77 ± 1.260.74 ± 0.2422.60 ± 6.3334.22 ± 2.561.08 ± 0.29−1.43 ± 0.242.04 ± 0.26273.54 ± 34.89
CMC9.68 ± 1.1336.35 ± 8.120.06 ± 0.033.09 ± 0.0716.03 ± 1.500.76 ± 0.1421.79 ± 6.6832.58 ± 2.251.08 ± 0.18−1.22 ± 0.381.96 ± 0.13280.30 ± 29.76
KB9.13 ± 1.1542.32 ± 11.220.05 ± 0.013.17 ± 0.0416.30 ± 0.850.59 ± 0.0227.78 ± 1.8534.99 ± 1.770.85 ± 0.65−0.86 ± 0.351.71 ± 0.37234.26 ± 20.33
Average of Number of Days Stored00.00 ± 0.00 D36.69 ± 4.67 A0.06 ± 0.023.26 ± 0.05 A16.33 ± 1.310.76 ± 0.0421.83 ± 2.7933.30 ± 0.620.46 ± 0.33 B−2.36 ± 0.31 B2.55 ± 0.27 A276.02 ± 8.04
254.40 ± 0.54 C25.55 ± 4.27 B0.08 ± 0.043.15 ± 0.10 BC16.61 ± 1.290.70 ± 0.0924.26 ± 4.1334.89 ± 1.430.43 ± 0.16 B−2.40 ± 0.32 B2.61 ± 0.27 A274.34 ± 13.77
457.65 ± 1.04 B23.50 ± 5.19 B0.09 ± 0.053.21 ± 0.09 AB16.20 ± 1.060.69 ± 0.1124.13 ± 4.8133.95 ± 1.540.63 ± 0.23 B−1.13 ± 0.78 A1.67 ± 0.62 B242.29 ± 42.15
609.60 ± 1.20 A43.05 ± 10.83 A0.05 ± 0.023.12 ± 0.07 C16.03 ± 1.090.70 ± 0.1624.06 ± 5.4733.93 ± 2.201.00 ± 0.39 A−1.17 ± 0.38 A1.90 ± 0.28 B262.70 ± 33.05
Average of TreatmentsCNT5.69 ± 4.1334.41 ± 12.570.07 ± 0.043.20 ± 0.0716.59 ± 1.290.73 ± 0.1323.53 ± 4.6533.97 ± 1.540.65 ± 0.38−2.08 ± 0.67 B2.44 ± 0.46 A263.47 ± 26.80
CMC5.44 ± 3.8730.88 ± 8.270.07 ± 0.053.18 ± 0.1216.11 ± 1.130.74 ± 0.0822.09 ± 3.9633.36 ± 1.190.69 ± 0.35−1.73 ± 0.72 A2.18 ± 0.46 B266.86 ± 35.80
KB5.11 ± 3.6331.31 ± 10.500.07 ± 0.043.18 ± 0.0916.18 ± 1.090.66 ± 0.1025.08 ± 4.2434.72 ± 1.810.56 ± 0.37−1.49 ± 0.88 A1.92 ± 0.64 C261.18 ± 29.11
Overall Average5.41 ± 3.7832.20 ± 10.410.07 ± 0.043.19 ± 0.0916.29 ± 1.160.71 ± 0.1123.57 ± 4.3434.02 ± 1.590.63 ± 0.36−1.77 ± 0.782.18 ± 0.56263.84 ± 30.00
Control: CNT, carboxymethyl cellulose: CMC, Locust Bean Gum: KB, Number of Days Stored: NDS, Treatments: T, Weight Loss (%): WL, Respiration (µmol CO2/kg·h): RESP, Ethylene (µL C2H4/kg·h): ETH, Total Soluble Solids (°Brix): TSS, Titratable Acidity (g tartaric acid/100 mL): TA, Maturity Index (TSS/TA): MI Weight Loss (%), Respiration Rate (µmol CO2/kg·h), Ethylene Production (µL C2H4/kg·h), pH, Total Soluble Solids (°Brix), Titratable Acidity (g tartaric acid/100 mL), Maturity Index (TSS/TA), and Color Parameters (L*, a*, b*, C, Hue°) of Fruit During Cold Storage. The results show a statistically significant difference with p-value less than 0.05. Different capital letters in the same column indicate statistically significant differences between means at p < 0.05 according to Tukey’s HSD test. Values are presented as mean ± standard deviation.
Table 2. Effect of Different Storage Periods and Treatments on Sugar Content in Grape Samples.
Number of Days StoredTreatmentsFructose (g/L)Glucose (g/L)Glucose/FructoseTotal Sugar (g/L)
0CNT8.66 ± 0.058.42 ± 0.050.97 ± 0.0017.08 ± 0.09
CMC8.66 ± 0.058.42 ± 0.050.97 ± 0.0017.08 ± 0.09
KB8.66 ± 0.058.42 ± 0.050.97 ± 0.0017.08 ± 0.09
25CNT11.40 ± 1.9210.62 ± 1.480.94 ± 0.0322.03 ± 3.39
CMC7.91 ± 1.747.65 ± 1.820.96 ± 0.0215.56 ± 3.56
KB8.85 ± 0.308.09 ± 0.180.92 ± 0.0216.94 ± 0.47
45CNT9.95 ± 0.059.08 ± 0.240.91 ± 0.0219.03 ± 0.29
CMC9.40 ± 0.978.37 ± 0.610.89 ± 0.0317.77 ± 1.58
KB8.85 ± 1.798.20 ± 1.760.92 ± 0.0217.06 ± 3.54
60CNT7.23 ± 1.886.22 ± 1.930.85 ± 0.0513.46 ± 3.81
CMC7.52 ± 0.326.11 ± 0.200.81 ± 0.0713.63 ± 0.12
KB5.23 ± 1.984.57 ± 1.650.88 ± 0.029.80 ± 3.63
Average of Number of Days Stored08.66 ± 0.04 A8.42 ± 0.04 A0.97 ± 0.00 A17.08 ± 0.08 A
259.39 ± 2.04 A8.79 ± 1.82 A0.94 ± 0.03 B18.18 ± 3.85 A
459.40 ± 1.12 A8.55 ± 1.02 A0.91 ± 0.02 C17.95 ± 2.13 A
606.66 ± 1.75 B5.63 ± 1.50 B0.85 ± 0.05 D12.30 ± 3.23 B
Average of TreatmentsCNT9.31 ± 1.98 A8.59 ± 1.95 A0.92 ± 0.0517.90 ± 3.91 A
CMC8.37 ± 1.14 AB7.64 ± 1.28 AB0.91 ± 0.0716.01 ± 2.35 AB
KB7.90 ± 1.98 B7.32 ± 1.96 B0.92 ± 0.0415.22 ± 3.92 B
Overall Average8.53 ± 1.797.85 ± 1.790.92 ± 0.0516.38 ± 3.56
Control: CNT, carboxymethyl cellulose: CMC, Locust Bean Gum: KB. The results show a statistically significant difference with p-value less than 0.05. Different capital letters in the same column indicate statistically significant differences between means at p < 0.05 according to Tukey’s HSD test. Values are presented as mean ± standard deviation.
Table 3. Effect of Different Storage Times and Treatments on Total Phenolic and Antioxidant Contents in Grape Samples.
Number of Days StoredTreatmentsTotal Antioxidants (mg GAE/g)Total Phenolic (mg GAE/g)
0CNT101.19 ± 1.98 a376.63 ± 33.75 a
CMC
KB
25CNT46.12 ± 0.13 e281.63 ± 47.50 b
CMC74.81 ± 0.27 b261.00 ± 10.63 bc
KB39.48 ± 2.19 fg244.75 ± 3.13 bc
45CNT41.40 ± 4.75 ef230.38 ± 1.25 c
CMC36.91 ± 2.81 fg107.25 ± 4.38 e
KB62.12 ± 6.85 c111.00 ± 8.13 e
60CNT34.36 ± 2.49 g126.63 ± 26.25 de
CMC56.49 ± 0.21 d153.50 ± 28.13 d
KB51.98 ± 0.82 d148.50 ± 10.63 de
Average of Number of Days Stored0101.19 ± 1.98376.63 ± 33.75
2553.47 ± 16.30262.46 ± 29.17
4546.81 ± 12.45149.55 ± 60.83
6047.61 ± 10.21142.88 ± 23.48
Average of TreatmentsCNT55.77 ± 27.85253.82 ± 98.13
CMC56.07 ± 16.48173.92 ± 69.98
KB51.19 ± 10.46168.09 ± 60.14
Overall Average54.49 ± 20.10204.13 ± 87.80
Control: CNT, carboxymethyl cellulose: CMC, Locust Bean Gum: KB. The results show a statistically significant difference with p-value less than 0.05. Different lowercase letters in the same column indicate statistically significant differences between means at p < 0.05 according to Tukey’s HSD test. Values are presented as mean ± standard deviation.
Table 4. Effect of Different Storage Times and Treatments on Organic Acid Content in Grape (g/L).
Number of Days StoredTreatmentsTartaric Acid Malic Acid Citric Acid Succinic Acid Fumaric Acid Total Acid Tartaric/Malic Acid
0CNT4.37 ± 1.051.93 ± 0.28 b–d0.70 ± 0.25 ab1.27 ± 0.260.07 ± 0.00 e8.35 ± 1.842.23 ± 0.22 a
CMC
KB
25CNT3.67 ± 0.232.54 ± 0.01 a0.89 ± 0.60 ab0.75 ± 0.230.40 ± 0.03 a8.25 ± 0.631.45 ± 0.10 c
CMC3.59 ± 0.531.65 ± 0.18 c–e0.80 ± 0.00 ab0.84 ± 0.450.18 ± 0.00 c–e7.06 ± 0.252.17 ± 0.09 a
KB3.13 ± 0.151.74 ± 0.05 b–d0.70 ± 0.44 ab1.00 ± 0.420.10 ± 0.02 de6.67 ± 0.201.79 ± 0.04 b
45CNT3.57 ± 0.071.97 ± 0.26 bc0.97 ± 0.32 ab1.08 ± 0.260.18 ± 0.08 cd7.76 ± 0.991.84 ± 0.21 b
CMC3.37 ± 0.142.16 ± 0.09 ab0.48 ± 0.10 b1.03 ± 0.240.32 ± 0.07 ab7.35 ± 0.251.56 ± 0.12 ab
KB2.73 ± 0.651.67 ± 0.32 cd0.48 ± 0.00 b0.49 ± 0.000.25 ± 0.07 bc5.62 ± 1.031.61 ± 0.09 ab
60CNT2.50 ± 0.291.51 ± 0.25 de0.45 ± 0.03 b1.11 ± 0.680.09 ± 0.04 de5.66 ± 0.091.67 ± 0.08 ab
CMC2.72 ± 0.251.53 ± 0.14 c–e1.20 ± 0.53 a1.79 ± 1.170.16 ± 0.08 c–e7.41 ± 2.151.77 ± 0.01 b
KB1.96 ± 0.381.23 ± 0.43 e0.46 ± 0.22 b1.64 ± 0.000.30 ± 0.10 ab5.59 ± 1.111.69 ± 0.28 ab
Average of Number of Days Stored04.37 ± 1.05 A1.93 ± 0.280.70 ± 0.251.27 ± 0.26 AB0.07 ± 0.008.35 ± 1.842.23 ± 0.22
253.46 ± 0.39 B1.98 ± 0.430.80 ± 0.380.86 ± 0.35 B0.23 ± 0.147.33 ± 0.801.80 ± 0.32
453.22 ± 0.50 B1.94 ± 0.300.64 ± 0.300.87 ± 0.33 B0.25 ± 0.096.91 ± 1.221.67 ± 0.18
602.39 ± 0.43 C1.42 ± 0.290.70 ± 0.471.51 ± 0.74 A0.18 ± 0.126.22 ± 1.501.71 ± 0.15
Average of TreatmentsCNT3.53 ± 0.84 A1.99 ± 0.430.75 ± 0.371.05 ± 0.400.18 ± 0.147.51 ± 1.47 A1.80 ± 0.33
CMC3.23 ± 0.49 A1.78 ± 0.310.83 ± 0.411.22 ± 0.770.22 ± 0.097.27 ± 1.10 A1.83 ± 0.28
KB2.60 ± 0.64 B1.55 ± 0.360.55 ± 0.271.04 ± 0.540.22 ± 0.115.96 ± 0.93 B1.70 ± 0.16
Overall Average3.16 ± 0.781.79 ± 0.410.71 ± 0.361.10 ± 0.560.20 ± 0.126.97 ± 1.361.78 ± 0.27
Control: CNT, carboxymethyl cellulose: CMC, Locust Bean Gum: KB. The results show a statistically significant difference with p-value less than 0.05. Different capital and lowercase letters in the same column indicate statistically significant differences between means at p < 0.05 according to Tukey’s HSD test. Values are presented as mean ± standard deviation.
Table 5. Effect of Different Storage Times and Treatments on Phenolic Acid Content in Grape Samples.
Number of Days StoredTreatmentsFerulic Acid (µg/g)Hydroxycinnamic Acid (µg/g)Gallic Acid (µg/g)Trans-Caffeic Acid (µg/g)Chlorogenic Acid (µg/g)Trans-p-Coumaric Acid (µg/g)Rutin (µg/g)Syringic Acid (µg/g)Vanillic Acid (µg/g)
0CNT0.62 ± 0.080.15 ± 0.00 c4.03 ± 0.880.06 ± 0.018.60 ± 2.490.04 ± 0.051.23 ± 1.13 b2.41 ± 0.510.47 ± 0.43 b
CMC
KB
25CNT0.68 ± 0.170.72 ± 0.11 a2.41 ± 1.410.01 ± 0.012.42 ± 1.570.57 ± 0.446.53 ± 5.05 a0.74 ± 0.072.47 ± 1.91a
CMC0.26 ± 0.110.28 ± 0.13 bc1.98 ± 0.080.02 ± 0.002.98 ± 1.390.20 ± 0.051.51 ± 0.03 b1.23 ± 0.460.57 ± 0.01 b
KB0.23 ± 0.110.41 ± 0.15 b0.90 ± 0.220.02 ± 0.022.82 ± 0.850.10 ± 0.100.36 ± 0.10 b1.00 ± 0.100.14 ± 0.04 b
45CNT0.49 ± 0.200.19 ± 0.07 bc1.41 ± 0.050.02 ± 0.027.56 ± 2.060.31 ± 0.031.20 ± 0.31 b2.67 ± 0.360.45 ± 0.12 b
CMC0.35 ± 0.100.21 ± 0.00 bc1.59 ± 0.020.03 ± 0.015.96 ± 0.200.35 ± 0.060.77 ± 0.39 b2.23 ± 0.070.29 ± 0.15 b
KB0.47 ± 0.100.41 ± 0.23 b1.39 ± 0.360.04 ± 0.013.66 ± 0.940.37 ± 0.310.99 ± 0.13 b1.22 ± 0.110.38 ± 0.05 b
60CNT4.74 ± 4.540.32 ± 0.16 bc1.68 ± 0.160.02 ± 0.0211.16 ± 0.600.09 ± 0.090.81 ± 0.38 b3.29 ± 0.710.31 ± 0.15 b
CMC0.75 ± 0.360.68 ± 0.12 a4.24 ± 2.350.02 ± 0.0213.55 ± 1.280.25 ± 0.060.85 ± 0.18 b2.62 ± 1.250.32 ± 0.07 b
KB0.98 ± 0.240.25 ± 0.00 bc2.37 ± 0.090.05 ± 0.0211.86 ± 3.980.20 ± 0.100.98 ± 0.73 b3.27 ± 1.590.37 ± 0.27 b
Average of Number of Days Stored00.62 ± 0.080.15 ± 0.004.03 ± 0.88 A0.06 ± 0.01 A8.60 ± 2.49 B0.04 ± 0.05 B1.23 ± 1.132.41 ± 0.51 AB0.47 ± 0.43
250.39 ± 0.250.47 ± 0.231.76 ± 0.98 BC0.02 ± 0.01 B2.74 ± 1.16 D0.29 ± 0.31 A2.80 ± 3.800.99 ± 0.32 C1.06 ± 1.44
450.44 ± 0.140.27 ± 0.161.46 ± 0.20 C0.03 ± 0.01 B5.72 ± 2.04 C0.34 ± 0.16 A0.99 ± 0.312.04 ± 0.67 B0.37 ± 0.12
602.16 ± 2.990.42 ± 0.222.76 ± 1.65 B0.03 ± 0.02 B12.19 ± 2.36 A0.18 ± 0.10 AB0.88 ± 0.433.06 ± 1.12 A0.33 ± 0.16
Average of TreatmentsCNT1.63 ± 2.700.35 ± 0.252.38 ± 1.280.03 ± 0.027.43 ± 3.660.25 ± 0.292.44 ± 3.322.28 ± 1.070.92 ± 1.26
CMC0.45 ± 0.290.39 ± 0.242.60 ± 1.710.02 ± 0.017.49 ± 4.820.27 ± 0.081.04 ± 0.412.03 ± 0.910.39 ± 0.15
KB0.56 ± 0.360.36 ± 0.161.55 ± 0.680.03 ± 0.026.11 ± 4.800.22 ± 0.210.78 ± 0.481.83 ± 1.340.29 ± 0.18
Overall Average0.96 ± 1.770.36 ± 0.222.20 ± 1.320.03 ± 0.027.06 ± 4.270.25 ± 0.211.52 ± 2.212.07 ± 1.090.58 ± 0.84
Control: CNT, carboxymethyl cellulose: CMC, Locust Bean Gum: KB. The results show a statistically significant difference with p-value less than 0.05. Different capital and lowercase letters in the same column indicate statistically significant differences between means at p < 0.05 according to Tukey’s HSD test. Values are presented as mean ± standard deviation.
Disclaimer/Publisher’s Note: The statements, opinions and data contained in all publications are solely those of the individual author(s) and contributor(s) and not of MDPI and/or the editor(s). MDPI and/or the editor(s) disclaim responsibility for any injury to people or property resulting from any ideas, methods, instructions or products referred to in the content.

