Article

Strawberry Fruit Deformity Detection and Symmetry Quantification Using Deep Learning and Geometric Feature Analysis

1
Shandong Institute of Pomology, Tai’an 271018, China
2
School of Agricultural Engineering, Jiangsu University, Zhenjiang 212013, China
*
Author to whom correspondence should be addressed.
Horticulturae 2025, 11(6), 652; https://doi.org/10.3390/horticulturae11060652
Submission received: 12 May 2025 / Revised: 2 June 2025 / Accepted: 7 June 2025 / Published: 9 June 2025
(This article belongs to the Section Fruit Production Systems)

Abstract

The external appearance of strawberry fruits serves as a critical criterion for their commercial value and grading standards. However, current research primarily emphasizes ripeness and surface defects, with limited attention given to the quantitative analysis of geometric characteristics such as deformity and symmetry. To address this gap, this study proposes a comprehensive evaluation framework that integrates deep learning-based segmentation with geometric analysis for strawberry appearance quality assessment. First, an enhanced YOLOv11 segmentation model incorporating a Squeeze-and-Excitation attention mechanism was developed to enable high-precision extraction of individual fruits, achieving Precision, Recall, AP50, and F1 scores of 91.11%, 87.46%, 92.90%, and 88.45%, respectively. Second, a deformity quantification method was designed based on the number of deformity points (Nd), deformity rate (Rd), and spatial distance metrics (Gmin and Gmax). Experimental results demonstrated significant differences in Rd and Gmax between deformed and normal strawberries, indicating strong classification capability. Finally, principal component analysis (PCA) was employed to extract the primary axis direction, and morphological symmetry was quantitatively evaluated using Intersection over Union (IoU) and Area Difference Ratio (AreaD_Ratio). The results revealed that most samples fell within an IoU range of 0.6–0.8 and AreaD_Ratio below 0.4, indicating noticeable inter-individual differences in fruit symmetry. This study aims to establish a three-stage analytical framework—segmentation, deformity quantification, and symmetry evaluation—for assessing strawberry appearance quality, with the goal of supporting key applications in automated grading and precision quality inspection.

1. Introduction

As one of the most economically important fruit crops worldwide, strawberries possess significant market value. The quality of strawberries directly influences their market competitiveness, making accurate and efficient quality assessment increasingly critical [1]. Traditionally, strawberry quality evaluation has primarily focused on aspects such as taste, nutritional value, and storage stability. Studies on taste [2,3,4] have typically analyzed factors including sweetness, acidity, juice content, and aroma. In terms of nutritional composition, research has emphasized the content of vitamin C [5], antioxidants, and other trace elements [6], highlighting their health-promoting benefits. Regarding storage stability [7], previous work has explored techniques to prolong shelf life [8,9,10,11] and reduce post-harvest quality degradation during transportation and storage.
However, with growing consumer demand for visually appealing produce, the external appearance of strawberries has emerged as a key factor influencing purchasing decisions. In modern agricultural production systems, appearance quality has become an increasingly important element of market competitiveness. In recent years, research on strawberry appearance quality has gained momentum. Current studies predominantly focus on automated detection of surface defects, damage [12,13,14], and fruit ripeness [15,16,17,18]. Many of these efforts integrate deep learning and machine vision technologies to achieve efficient analysis and precise identification of external features. These techniques enable automated recognition of ripeness levels, defect presence, and surface blemishes, thereby facilitating accurate grading and classification.
The morphological characteristics of strawberries—particularly fruit contour shape and symmetry [19,20]—are critical indicators of external quality, yet they are often overlooked in both academic and industrial settings. During natural growth, strawberries exhibit considerable morphological variability [21,22]. While irregular shapes are commonly associated with malformed fruits, even morphologically normal strawberries frequently display varying degrees of asymmetry, such as slight curvature. Moderate asymmetry is generally considered a natural phenomenon, whereas pronounced deformities may be indicative of pathological infections. In practice, strawberry morphology holds significant value across multiple domains, including cultivar selection, postharvest processing, and product design. Symmetrical fruits are preferable for breeding programs and standardized packaging, whereas uniquely shaped or malformed fruits may possess aesthetic appeal for decorative culinary applications. Consequently, the quantitative assessment of fruit deformity and symmetry has emerged as a central task in external quality evaluation. Developing efficient and automated approaches for precise analysis and quantification of strawberry deformities and symmetry remains a key challenge in current research.
Currently, morphological assessments of strawberries largely rely on manual inspection. Although this approach is intuitive and straightforward, it suffers from low efficiency and high subjectivity, making it unsuitable for large-scale production where high accuracy and throughput are required. Moreover, human judgment is prone to inconsistency and error when evaluating large volumes of fruit. Some studies have attempted to classify strawberries into shape-based categories by extracting multiple shape descriptors and employing machine learning algorithms such as random forests [23]. However, most machine vision systems combined with deep learning techniques focus primarily on detecting surface damage [24,25,26] or ripeness [27,28], while the quantitative analysis of morphological variation—particularly the differentiation between deformed and symmetrical normal fruits—remains insufficiently addressed in current research.
To address the aforementioned challenges, this study proposes a comprehensive framework for the quantitative analysis of strawberry deformity and symmetry. The framework first employs an enhanced YOLOv11 segmentation model to achieve precise instance-level segmentation of strawberry fruits, enabling the extraction of detailed morphological features. Subsequently, a deformity quantification approach is introduced to characterize the shape irregularities of strawberries. This approach defines a set of indicators, including the number of deformity points (Nd), deformity rate (Rd), and deformity spacing metrics (Gmin and Gmax), thereby capturing deformity characteristics across three dimensions: quantity, density, and spatial distribution.
To further evaluate the morphological symmetry of normal strawberries, the study integrates Principal Component Analysis (PCA) to extract the primary and secondary axes of each fruit and employs quantitative metrics such as Intersection over Union (IoU) and Area Difference Ratio (AreaD_Ratio) to assess shape symmetry with high precision.
Compared to existing studies, the proposed method offers significant advantages by enabling both effective detection of deformed strawberries and robust quantification of shape symmetry in normal fruits. This approach provides a novel technical solution for appearance quality evaluation and offers theoretical and practical support for large-scale automated inspection and grading of strawberry quality.

2. Materials and Methods

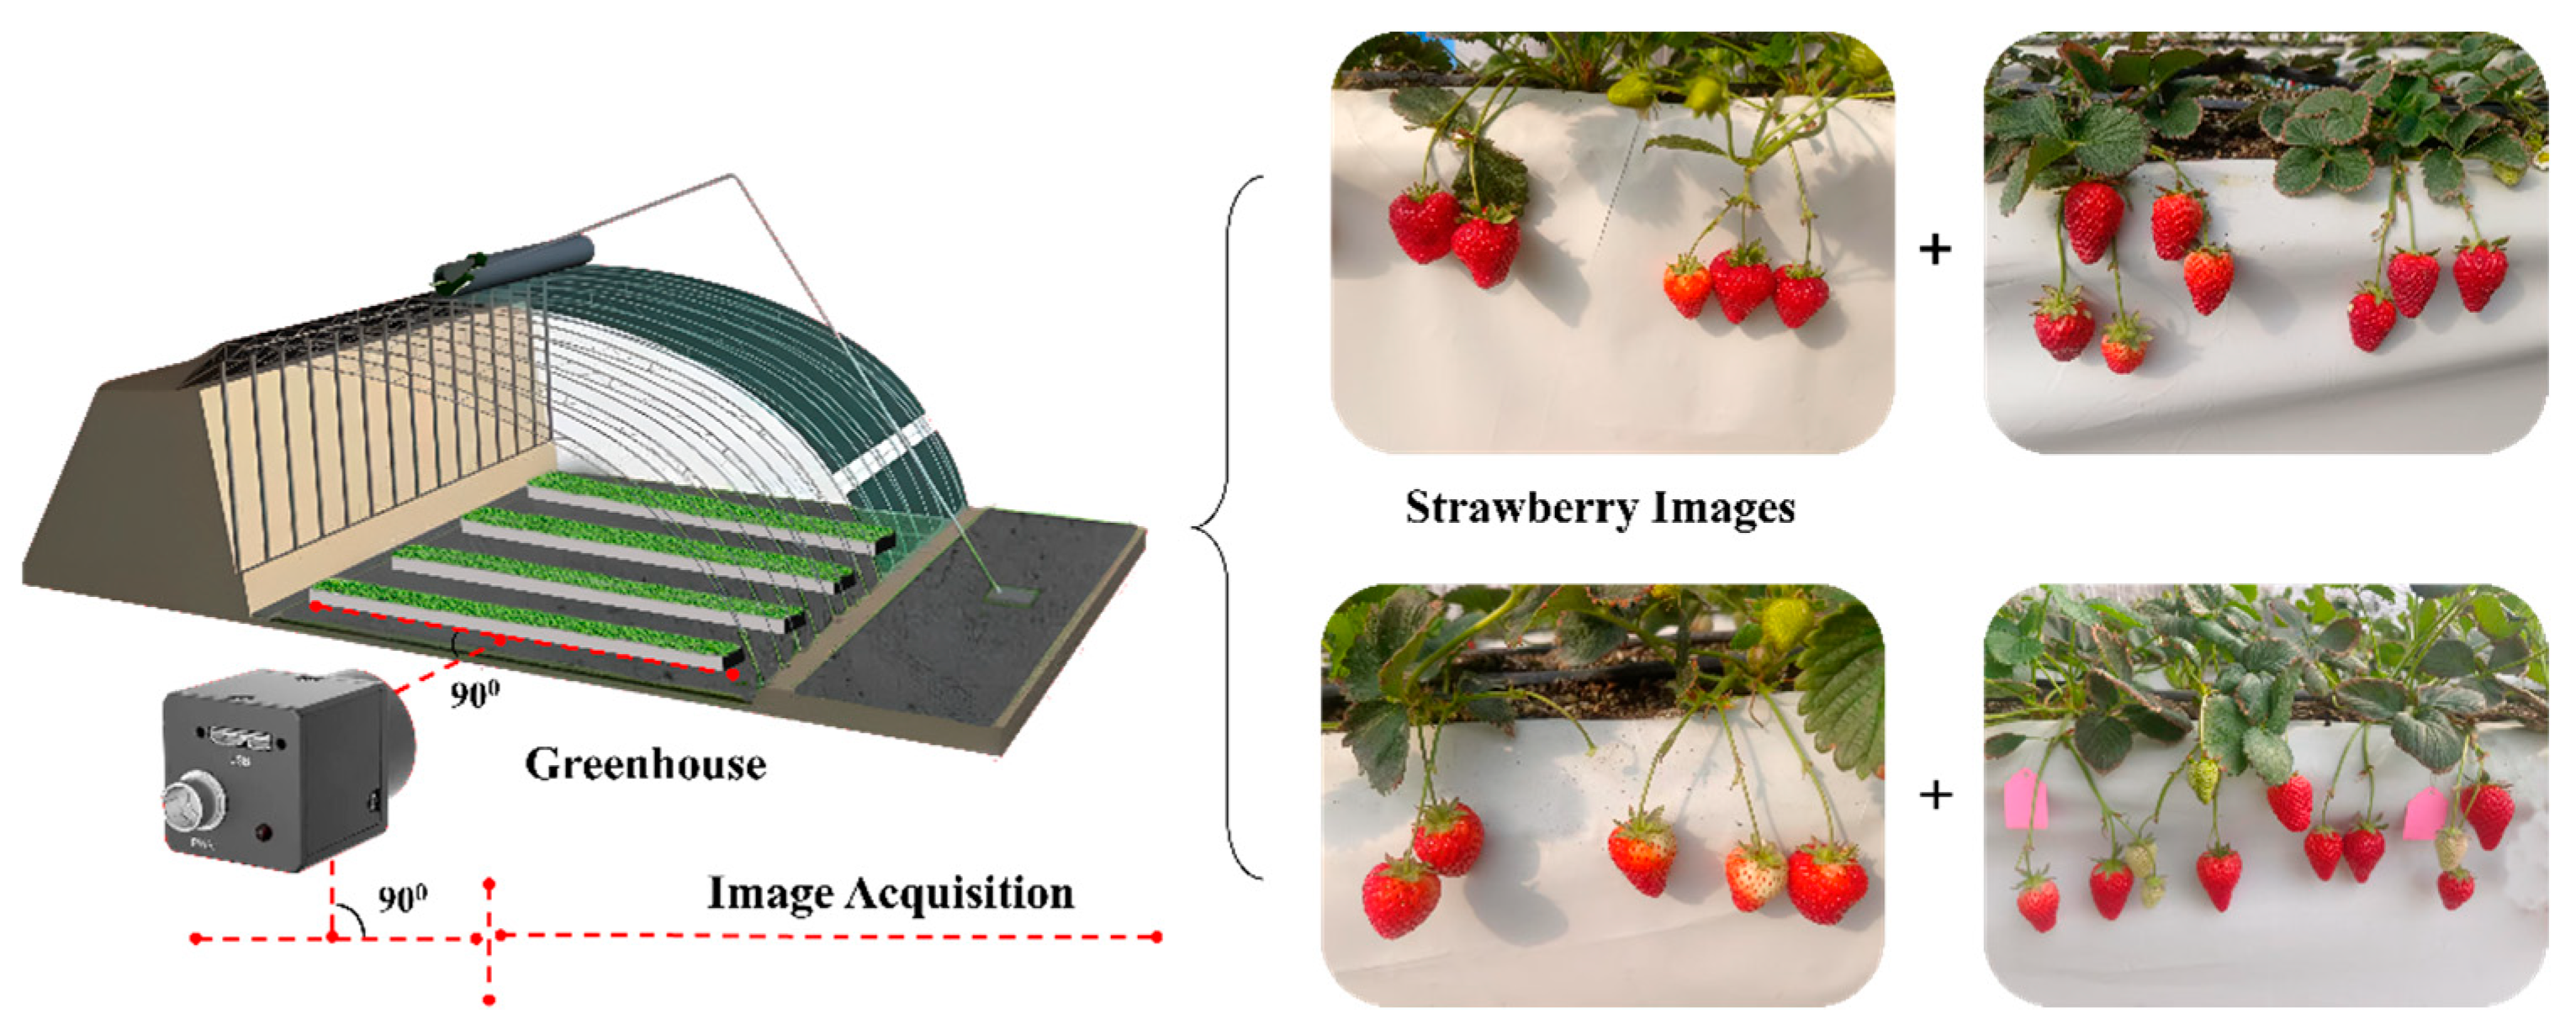
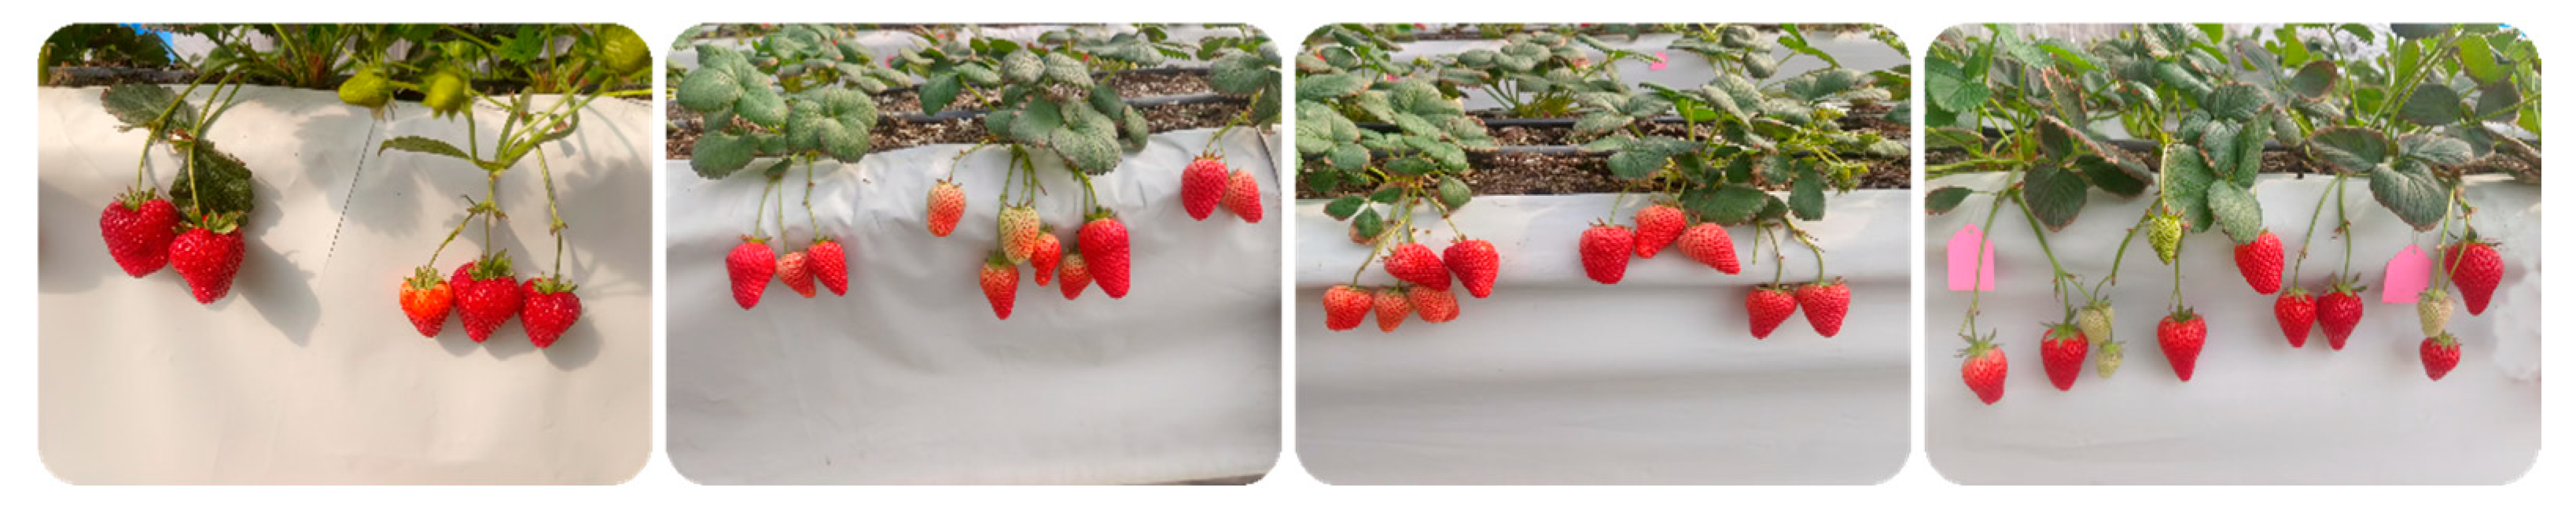
2.1. Image Acquisition and Data Processing

The strawberry image samples used in this study were collected from the Vegetable and Fruit Research Base of the Taian Institute of Pomology, Shandong Province, China. The strawberries were cultivated in greenhouse tunnels, where planting beds were manually constructed and strawberry plants were arranged in organized rows oriented from north to south, as illustrated in Figure 1. During the fruit maturation period, image acquisition was conducted using an MV-CA003-20GC industrial camera. The camera lens was positioned vertically to the ground, and multi-angle images were captured at the cross-sections of the planting ridges. A total of 1,868 images were collected for analysis.
Dataset Construction: To mitigate the risk of model overfitting due to insufficient data, the original dataset was augmented using a series of techniques, including random flipping, rotation, color perturbation, affine transformations, and the addition of various types of noise [17]. These operations expanded the dataset to a total of 4500 images. In addition, the strawberry dataset was manually annotated using the LabelImg tool to ensure high labeling accuracy. The annotated dataset was then randomly sampled and split into training, validation, and test sets at a ratio of 8:1:1.

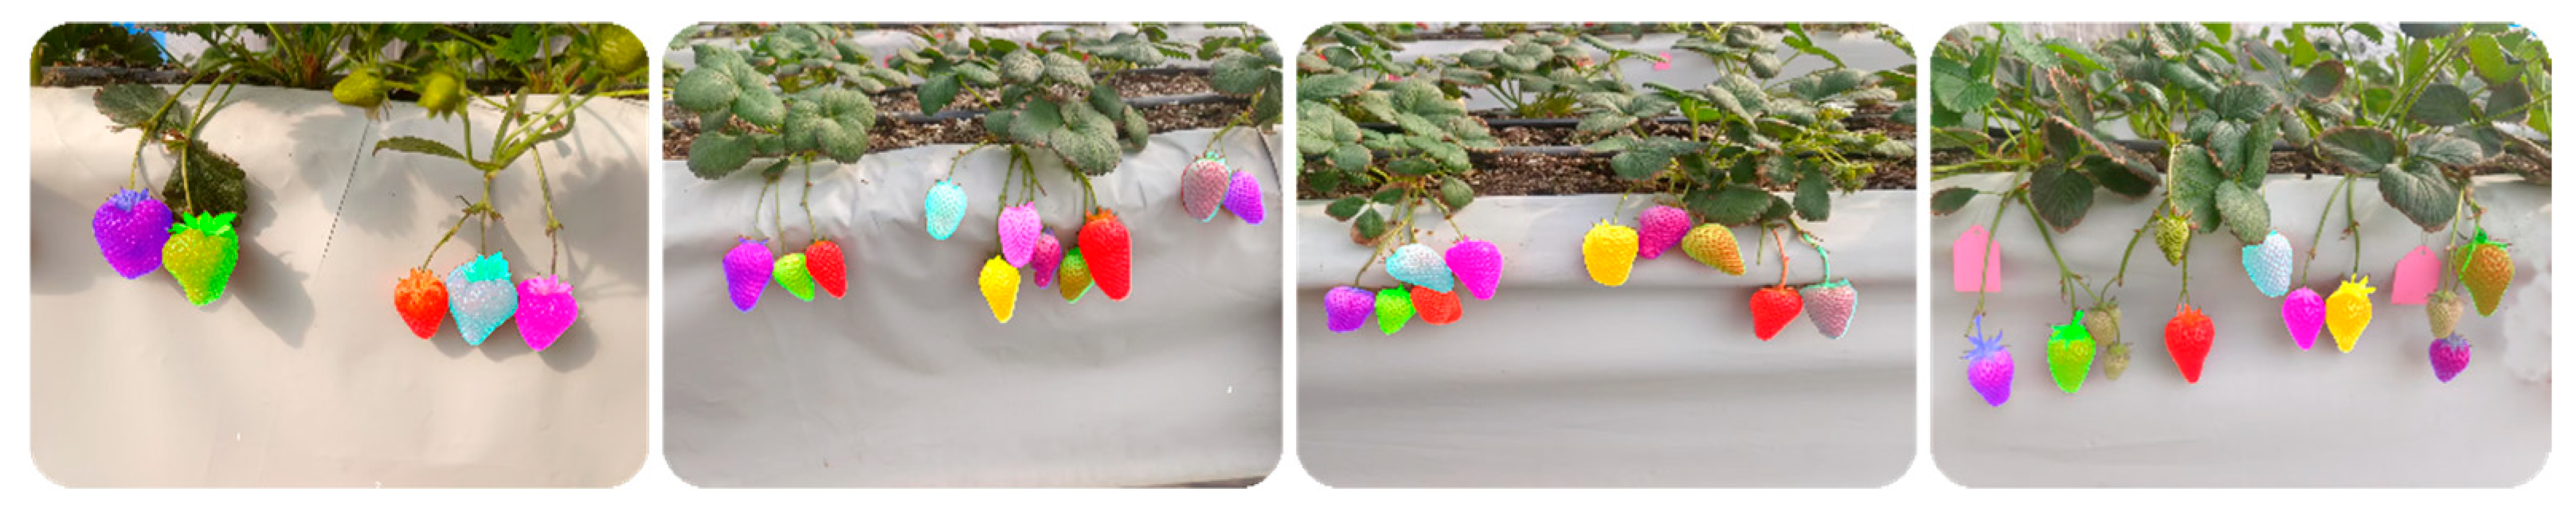
2.2. Strawberry Segmentation Model Based on Improved YOLOv11

2.2.1. Model Selection

YOLOv11, as a state-of-the-art segmentation model, offers significant advantages in terms of accuracy, real-time performance, and architectural flexibility compared to other models in the YOLO series and alternative instance segmentation frameworks [29,30]. By integrating the C3k2 module, the C2PSA spatial attention mechanism, and depthwise separable convolution, YOLOv11 enhances multi-scale feature extraction and computational efficiency, making it well-suited for handling complex scenarios in strawberry segmentation. While maintaining high detection accuracy, YOLOv11 also achieves faster inference speeds, rendering it particularly applicable for real-time agricultural tasks.

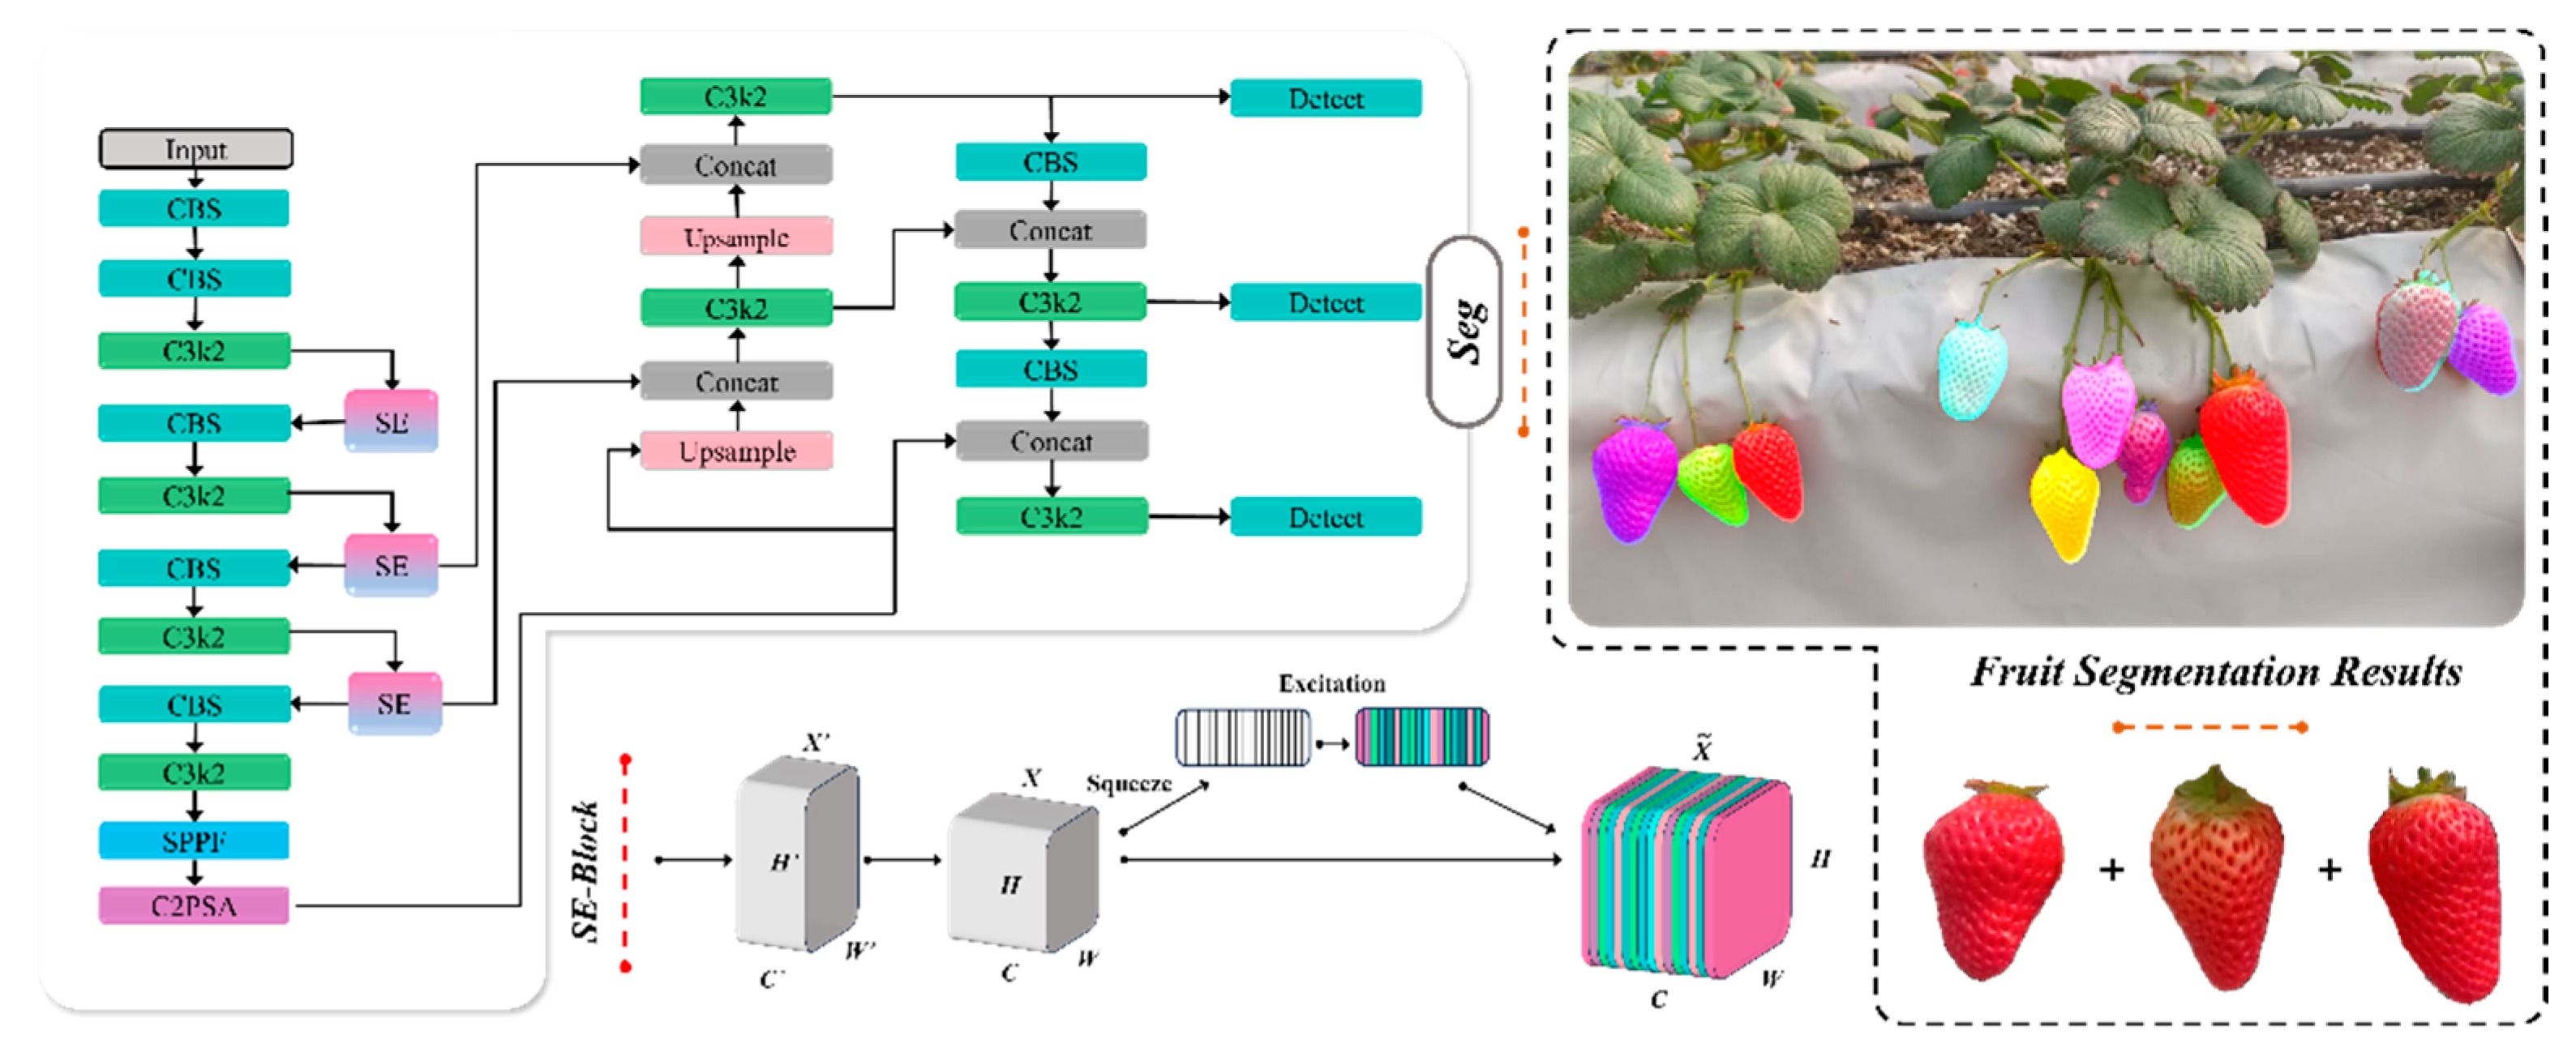
2.2.2. Improved YOLOv11-Based Strawberry Segmentation Model

In this study, the YOLOv11 model was adopted for the task of instance-level strawberry segmentation. However, in practical cultivation environments, overlapping between strawberry fruits is common, which may lead to missed detections during the segmentation process. To address this issue, the model was enhanced by incorporating a Squeeze-and-Excitation (SE) attention mechanism into the original YOLOv11 framework. This modification aims to improve the model’s ability to distinguish individual fruits in densely packed scenes and enhance segmentation accuracy under occlusion conditions.
As shown in Figure 2, the SE (Squeeze-and-Excitation) attention module is positioned after several CBS (Convolution, Batch Normalization, and Activation) blocks, and is designed to optimize feature selection by adaptively recalibrating channel-wise feature responses. The SE module first performs a global information embedding (Squeeze) by applying global average pooling to the input feature maps, generating a compact global descriptor for each channel. Subsequently, through a pair of fully connected layers (Excitation), the module assigns an importance weight to each channel, reflecting its relevance to the current task. These weights are then applied to the original feature maps to enhance informative channels and suppress irrelevant ones. This mechanism strengthens the network’s focus on critical regions, particularly improving segmentation accuracy and robustness under challenging conditions such as complex backgrounds or overlapping fruits.

2.3. Strawberry Deformity Detection and Symmetry Quantification Analysis

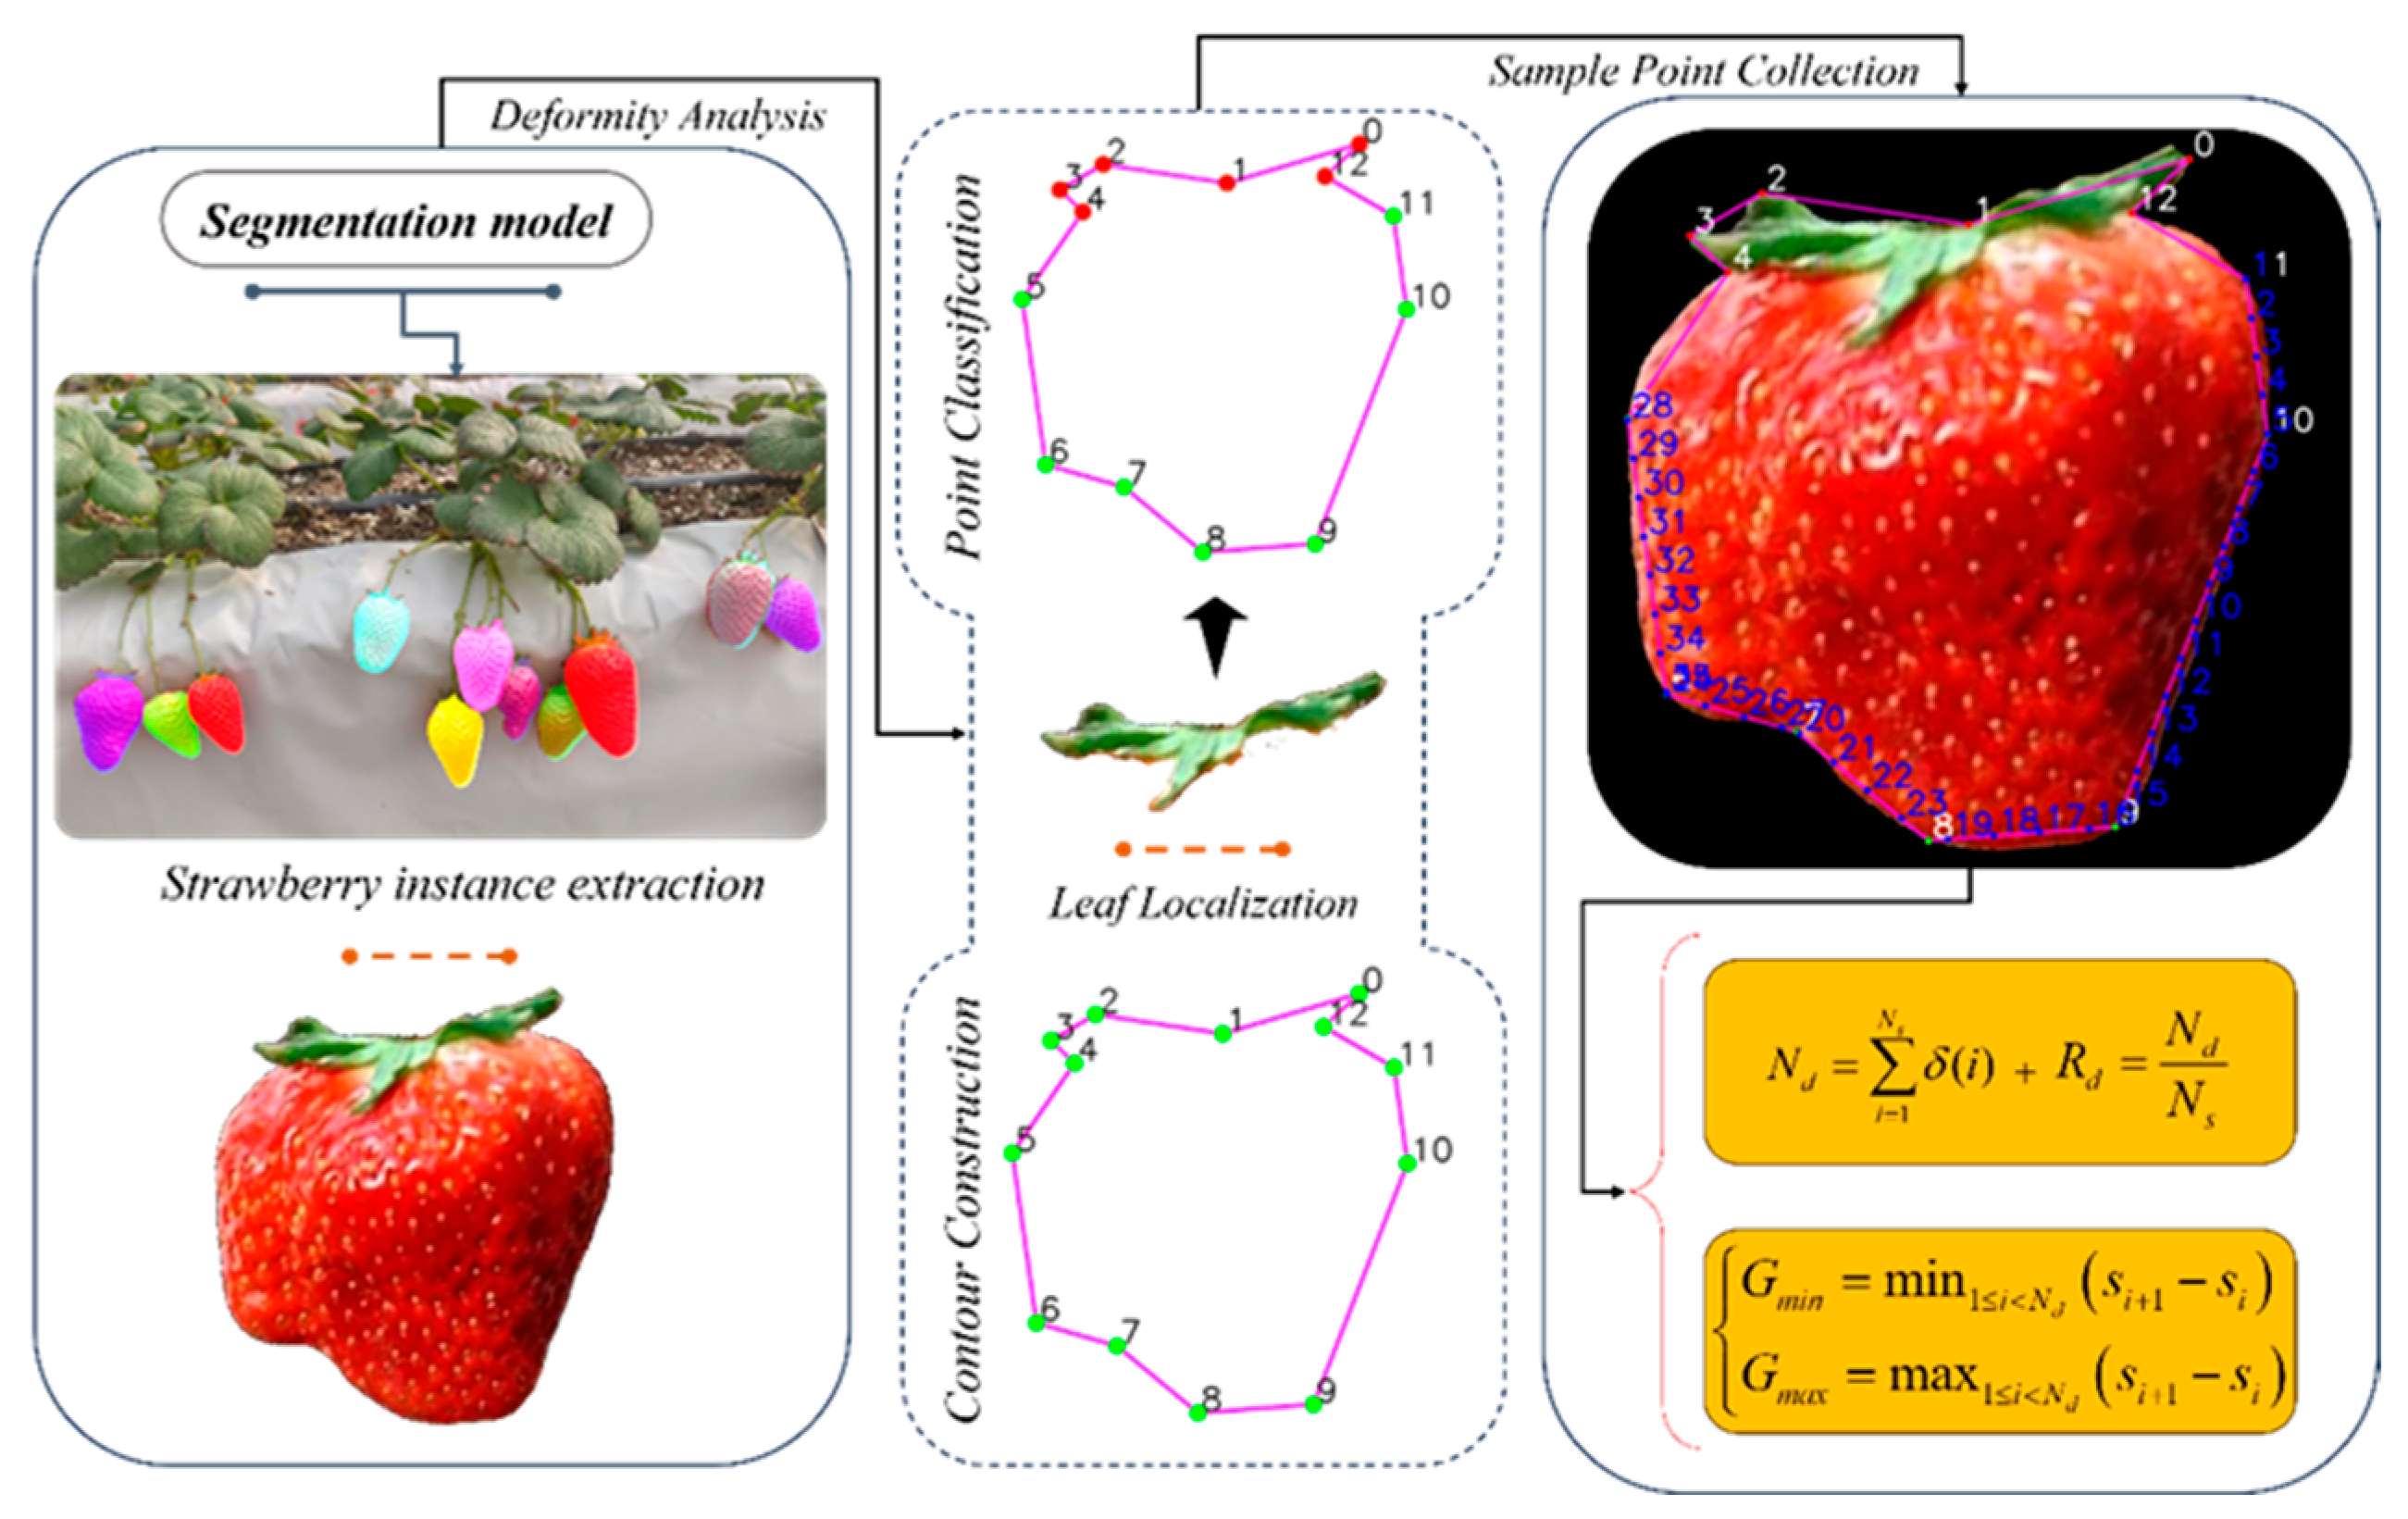
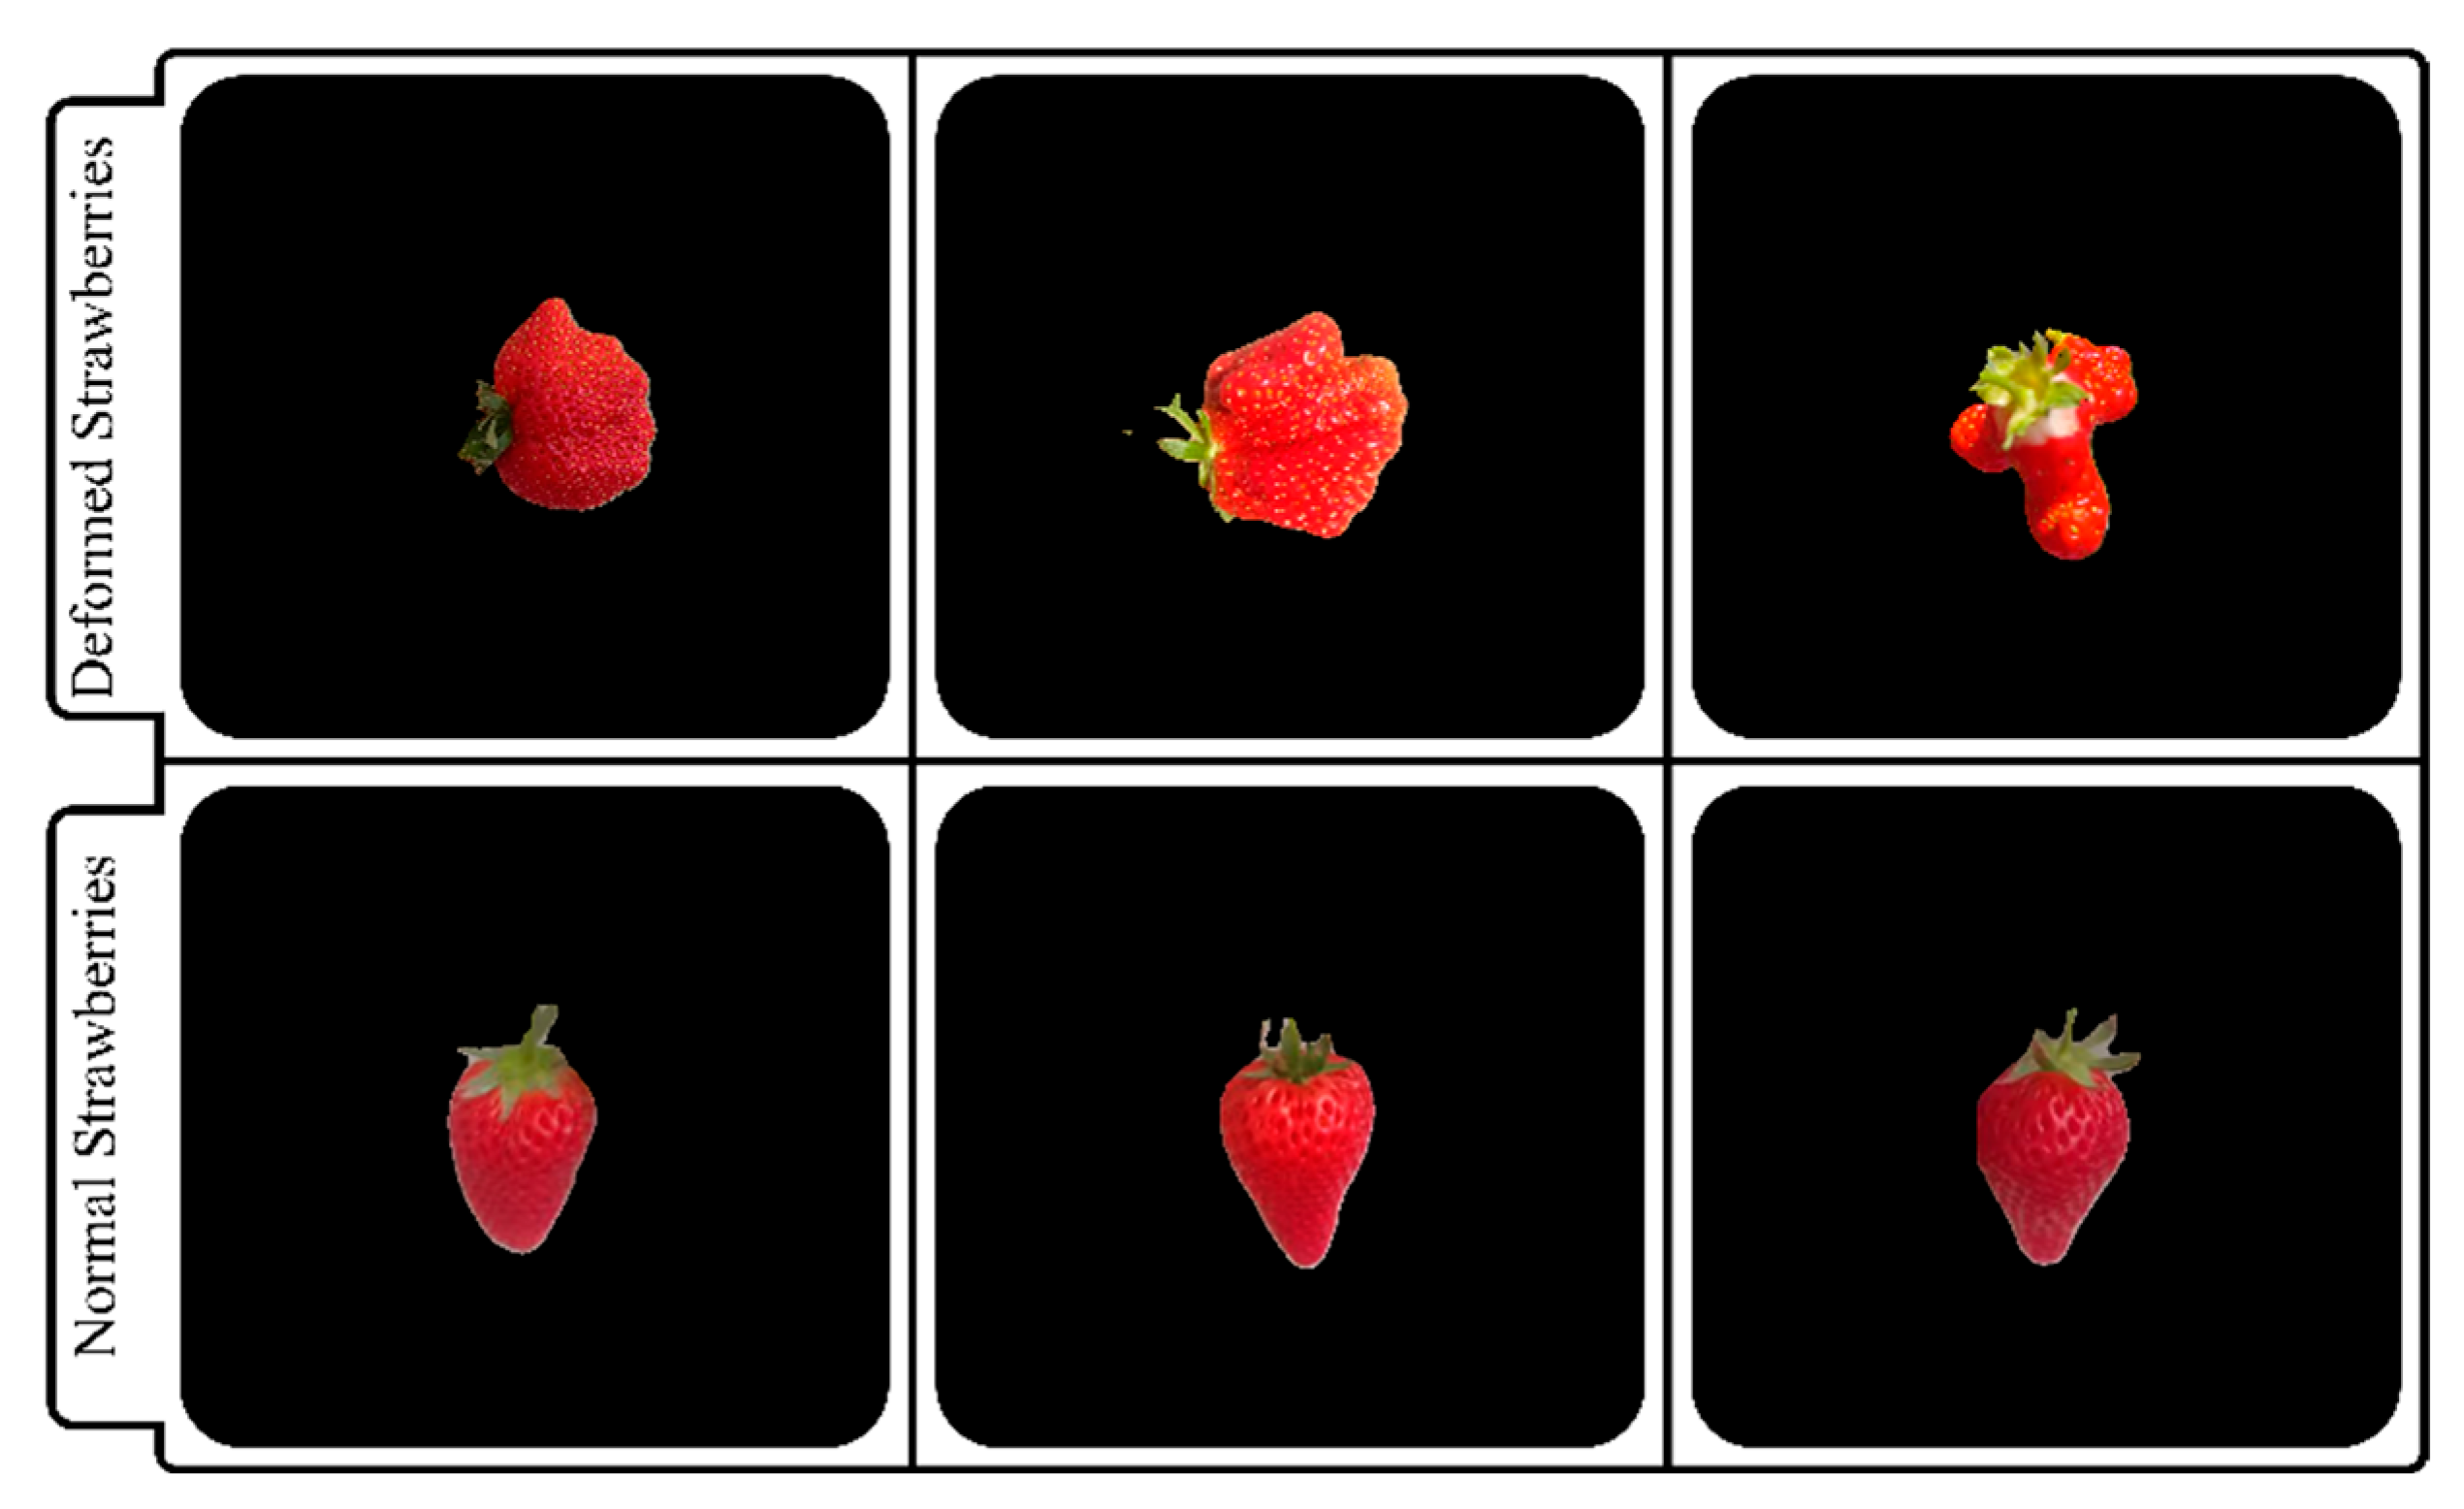
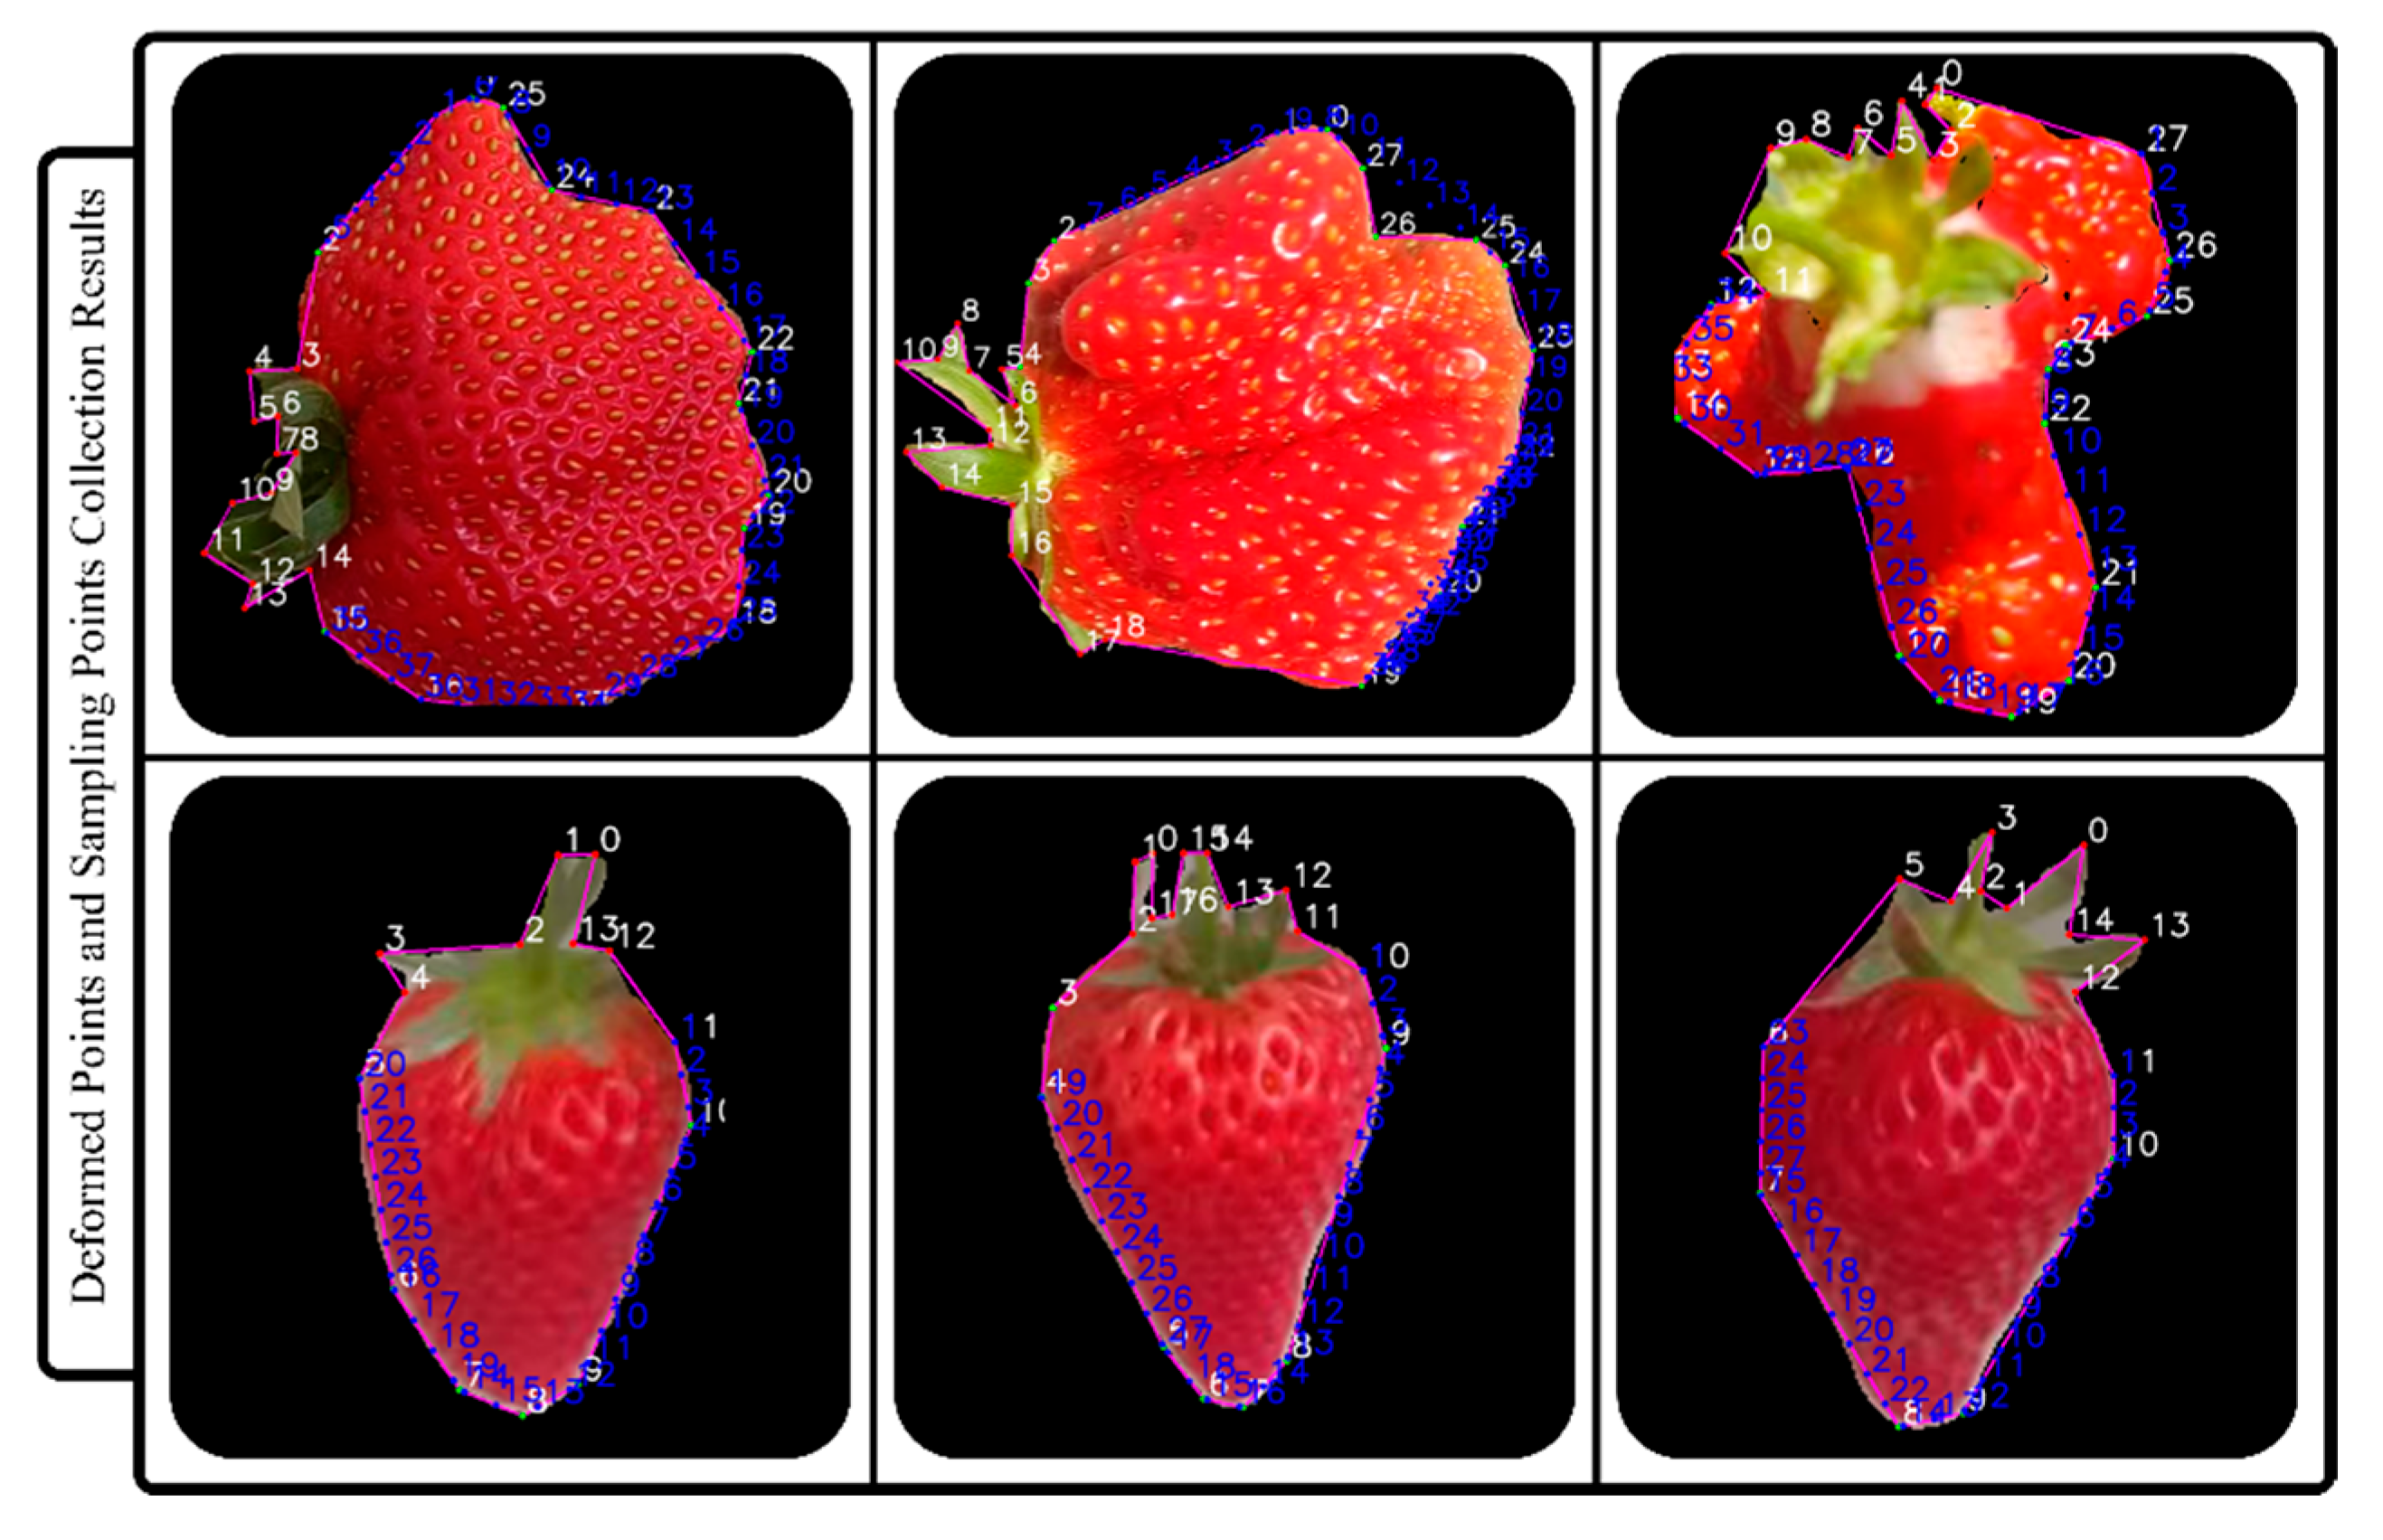
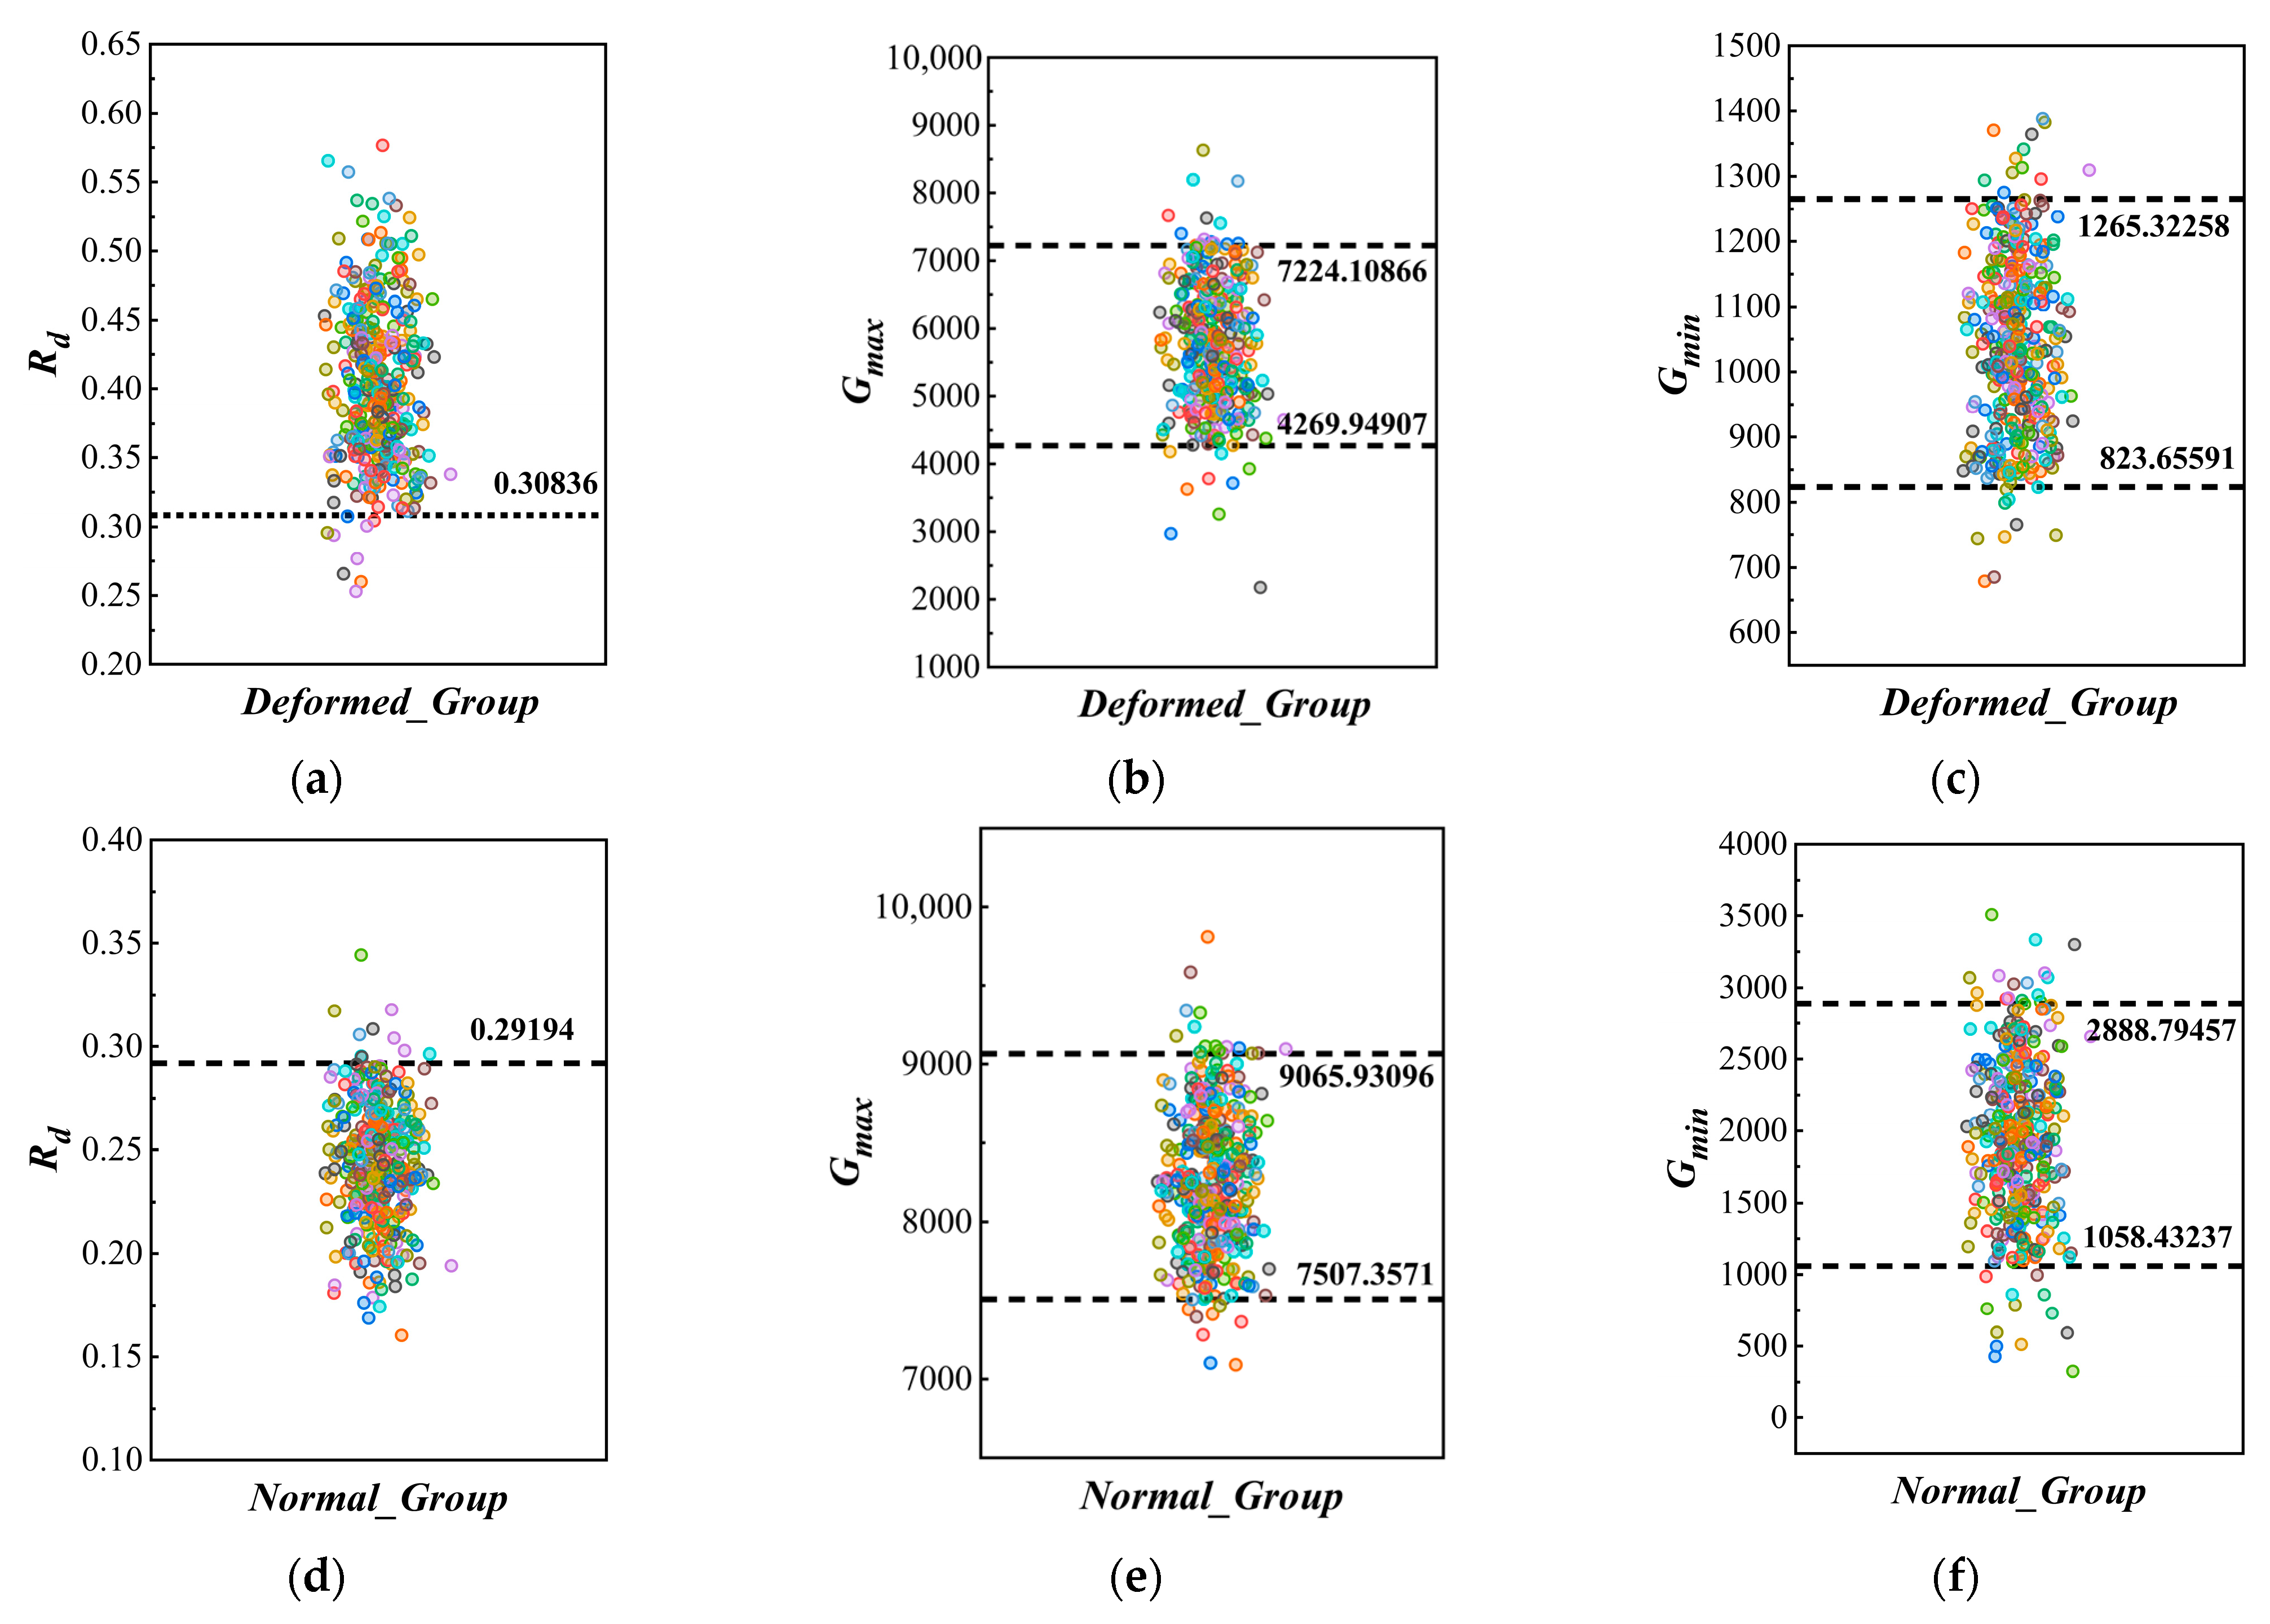
2.3.1. Classification and Quantitative Analysis of Deformed Strawberries

Normal and deformed strawberries exhibit distinct morphological differences, with deformities typically characterized by irregular shapes such as protrusions at the fruit apex or complex, asymmetrical contours. To classify deformed strawberries and quantitatively assess the degree of deformity, this study employed a deformity point quantification approach based on morphological characteristics. Specifically, Kernel Density Estimation (KDE) was used to analyze the spatial distribution of contour irregularities. The analytical process is illustrated in Figure 3.
Based on the segmentation model, individual strawberry fruits were extracted, and their outer contours were approximated using a contour-fitting algorithm. Convex points along the approximated contours were identified as potential deformity points. To eliminate false positives caused by leaf regions, an HSV color space-based leaf masking method was applied to detect and exclude invalid deformity points located within leaf areas. Subsequently, sampling points were generated along the approximated contour, starting from the first identified deformity point to the last. Equidistant sampling was performed in the clockwise direction at intervals of 1000 pixels, and the sampled positions were designated as reference points for analysis.
To quantitatively characterize the degree of fruit deformity, a set of deformity-related metrics was constructed based on the identified convex points and sampled contour points. These included: Nd, the total number of deformity points; Rd, the deformity point ratio, defined as the ratio of deformity points to total sampling points; and Gmin and Gmax, representing the minimum and maximum spacing between adjacent deformity points. The corresponding functional expressions are defined as follows:
N d = i = 1 N s δ ( i )
R d = N d N s
G m i n = min 1 i < N d s i + 1 s i G m a x = max 1 i < N d s i + 1 s i
In the equations, δ(i) is an indicator function for the i-th point, where δ(i) = 1 if the point is identified as a deformity point, and δ(i) = 0 otherwise. Ns denotes the total number of sampled contour points.
This quantification approach characterizes strawberry deformities comprehensively from three perspectives: the number, density, and spacing of deformity points. It provides a robust analytical foundation and data support for deformity classification and quantitative assessment of fruit morphology.

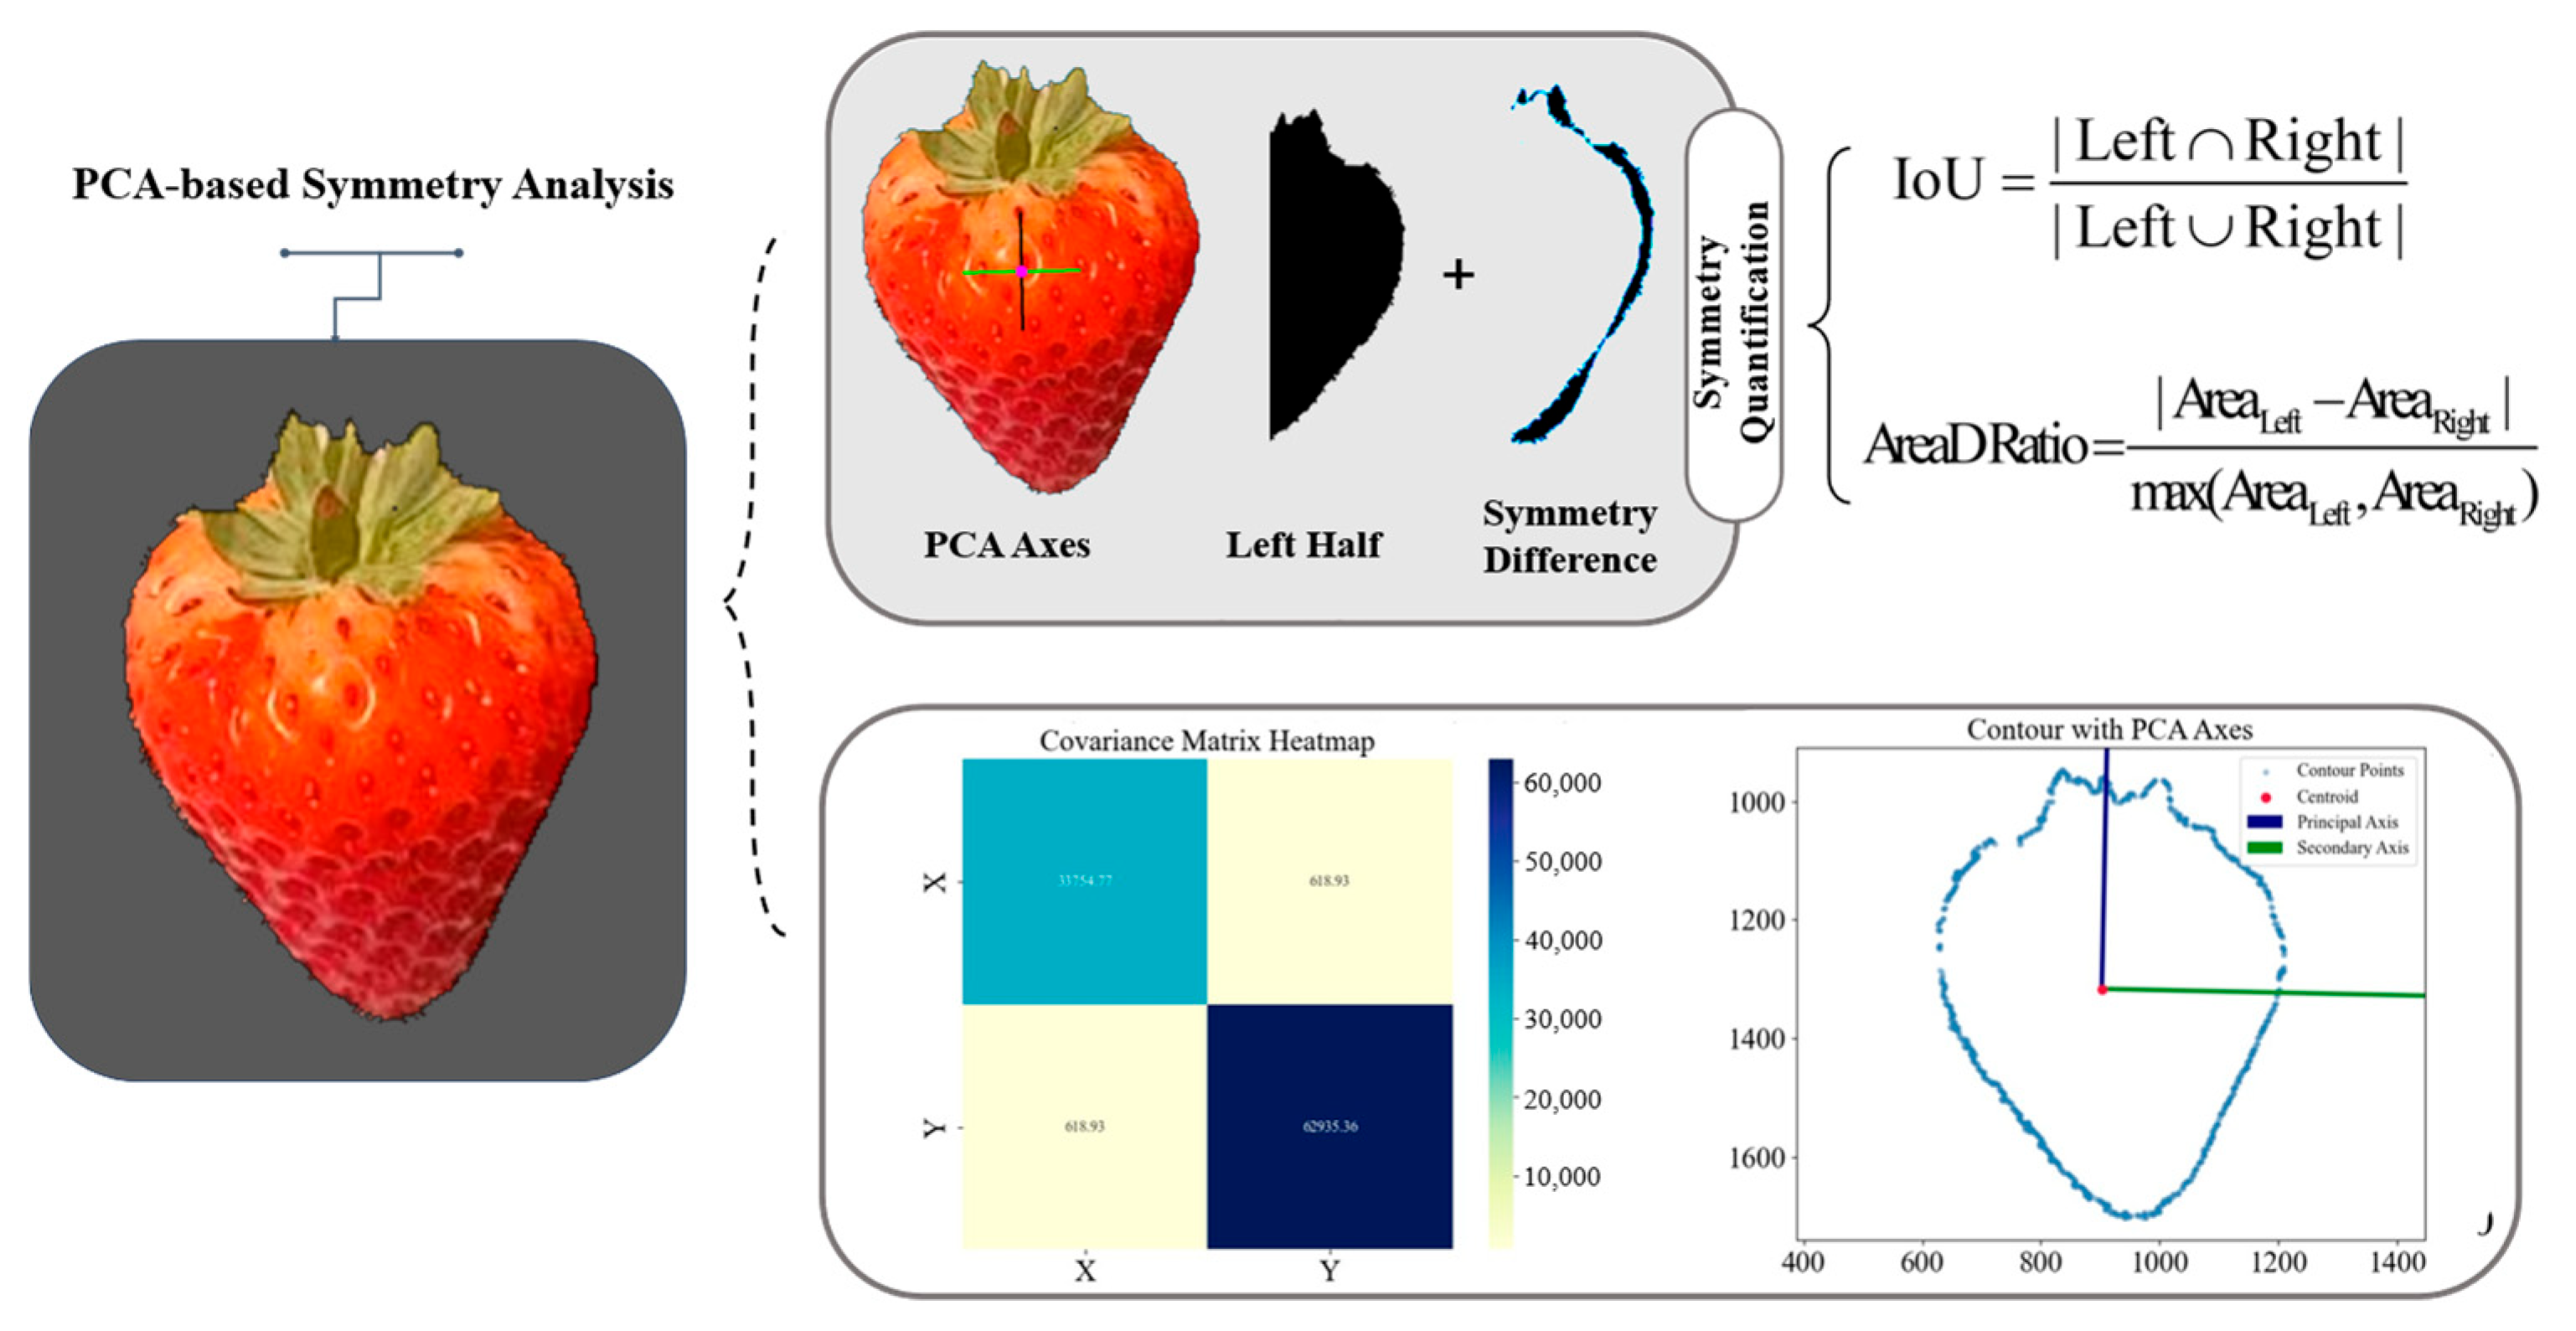
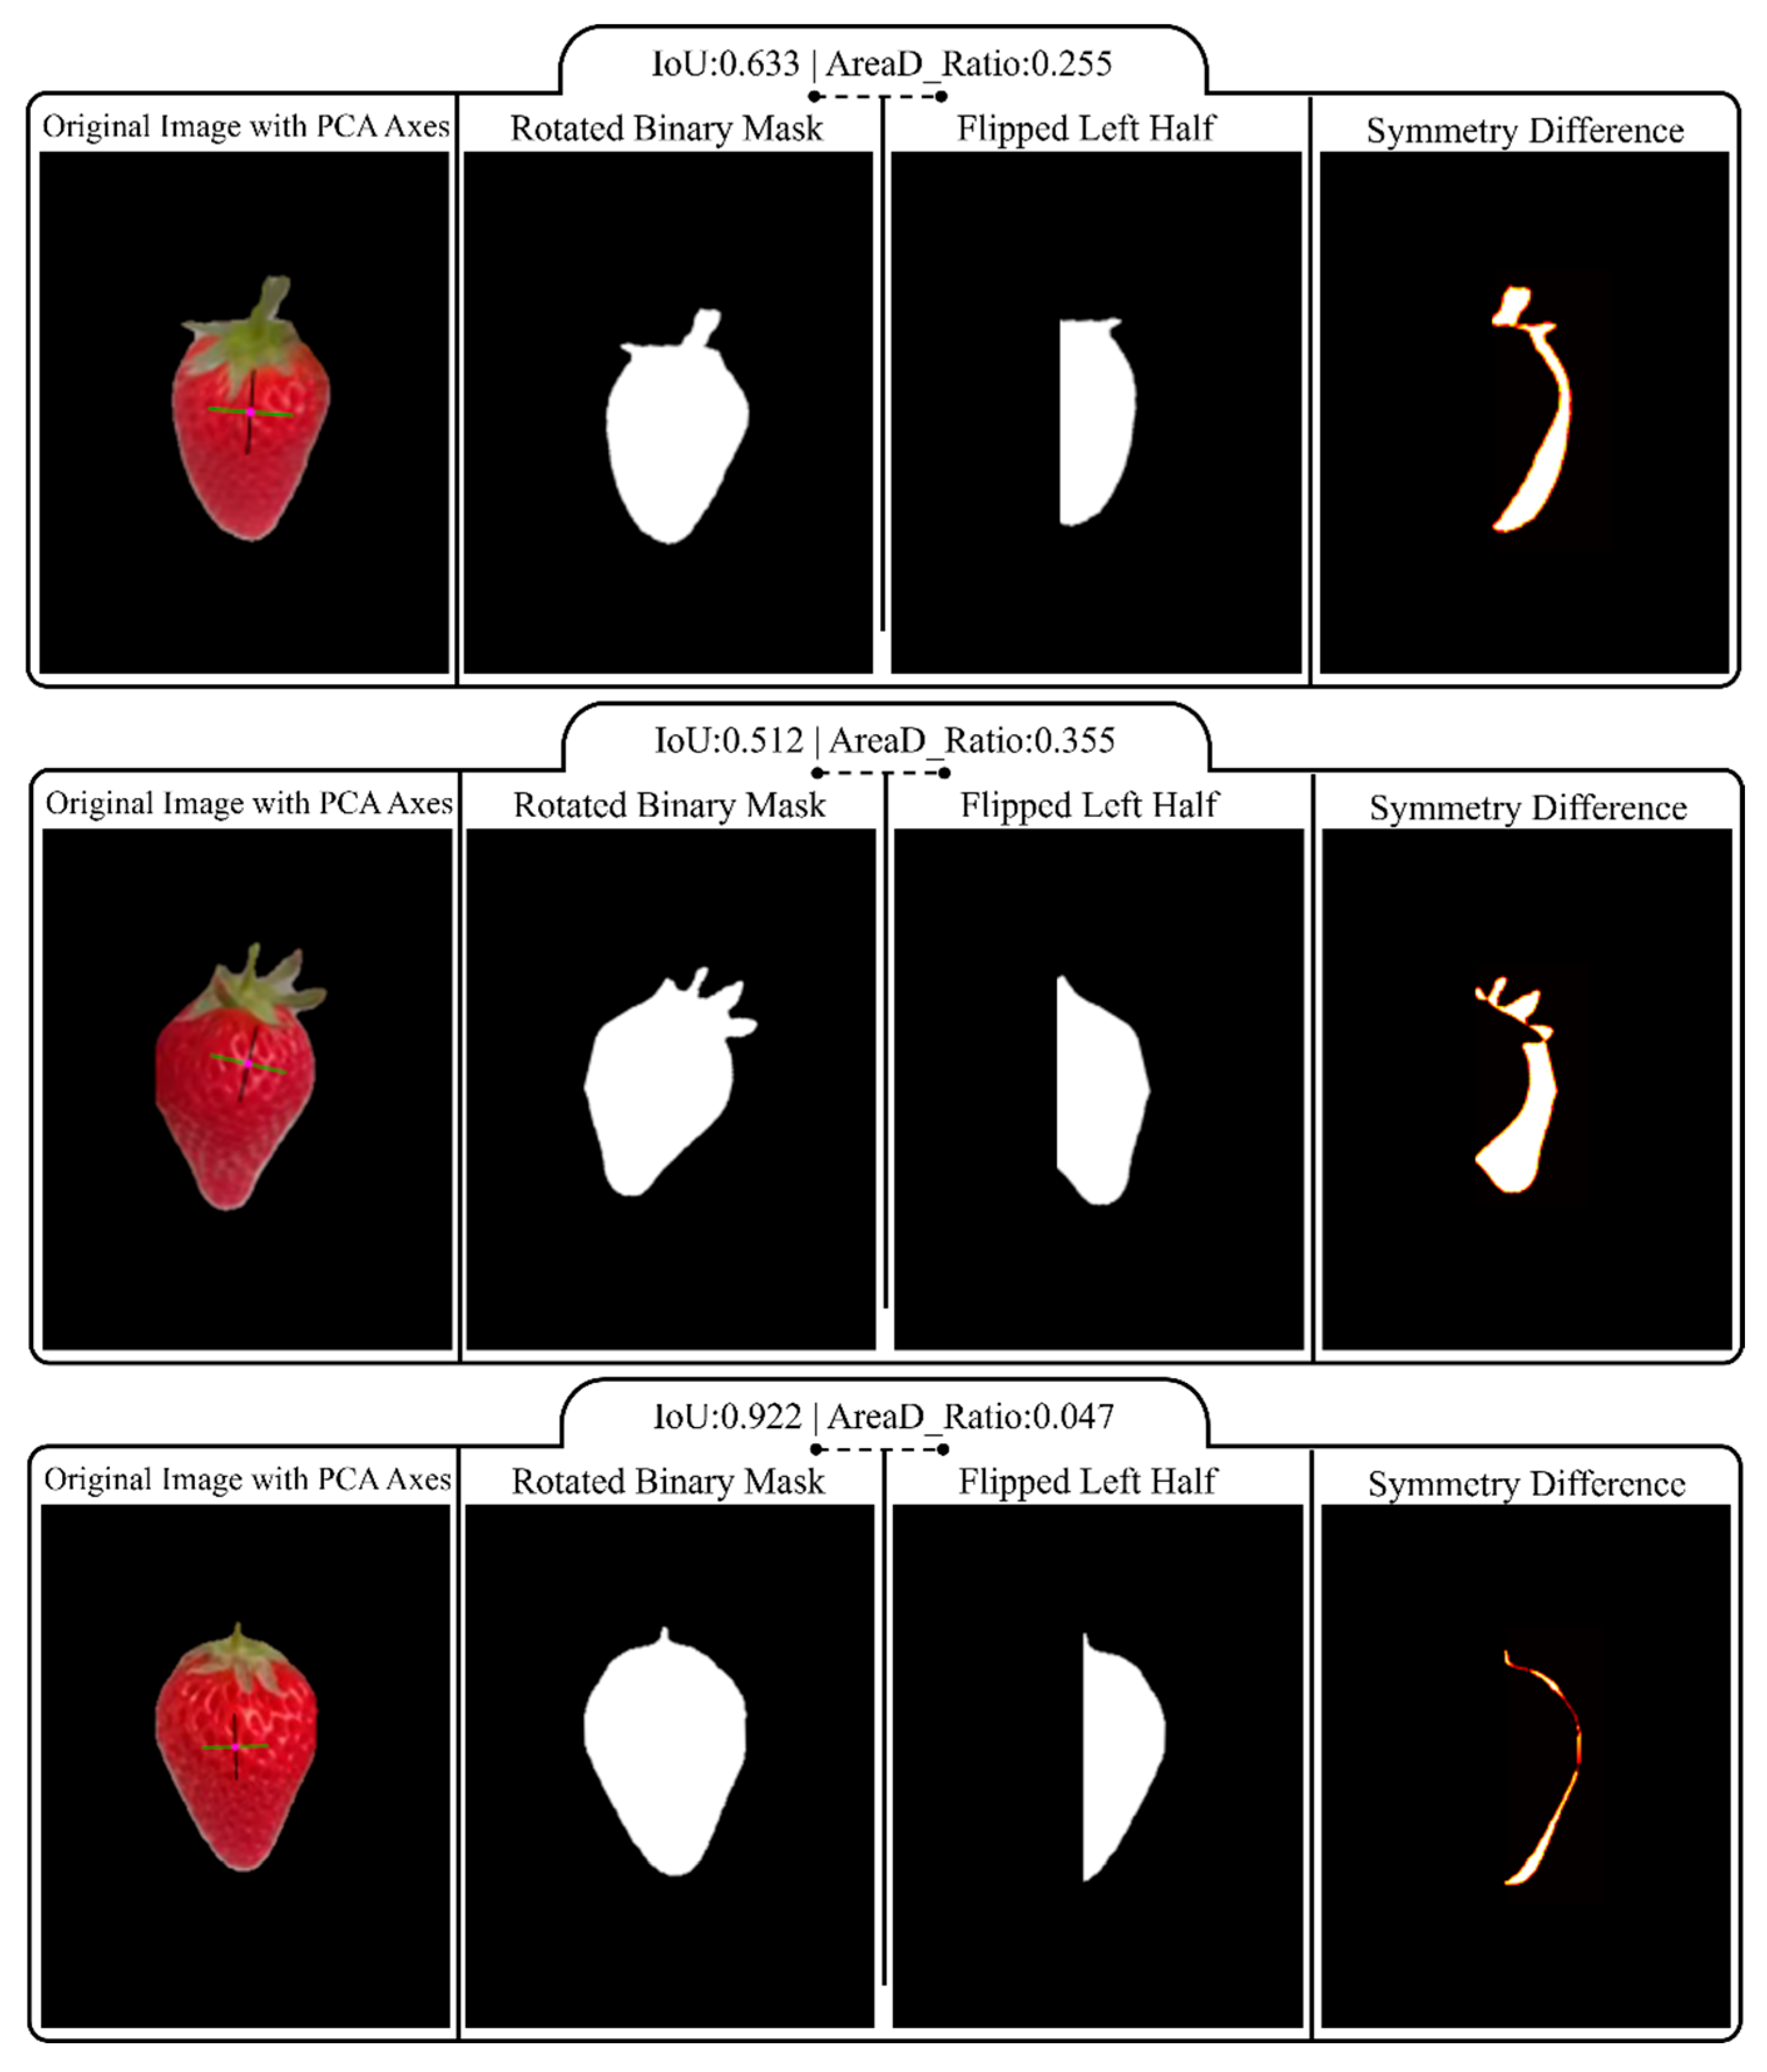
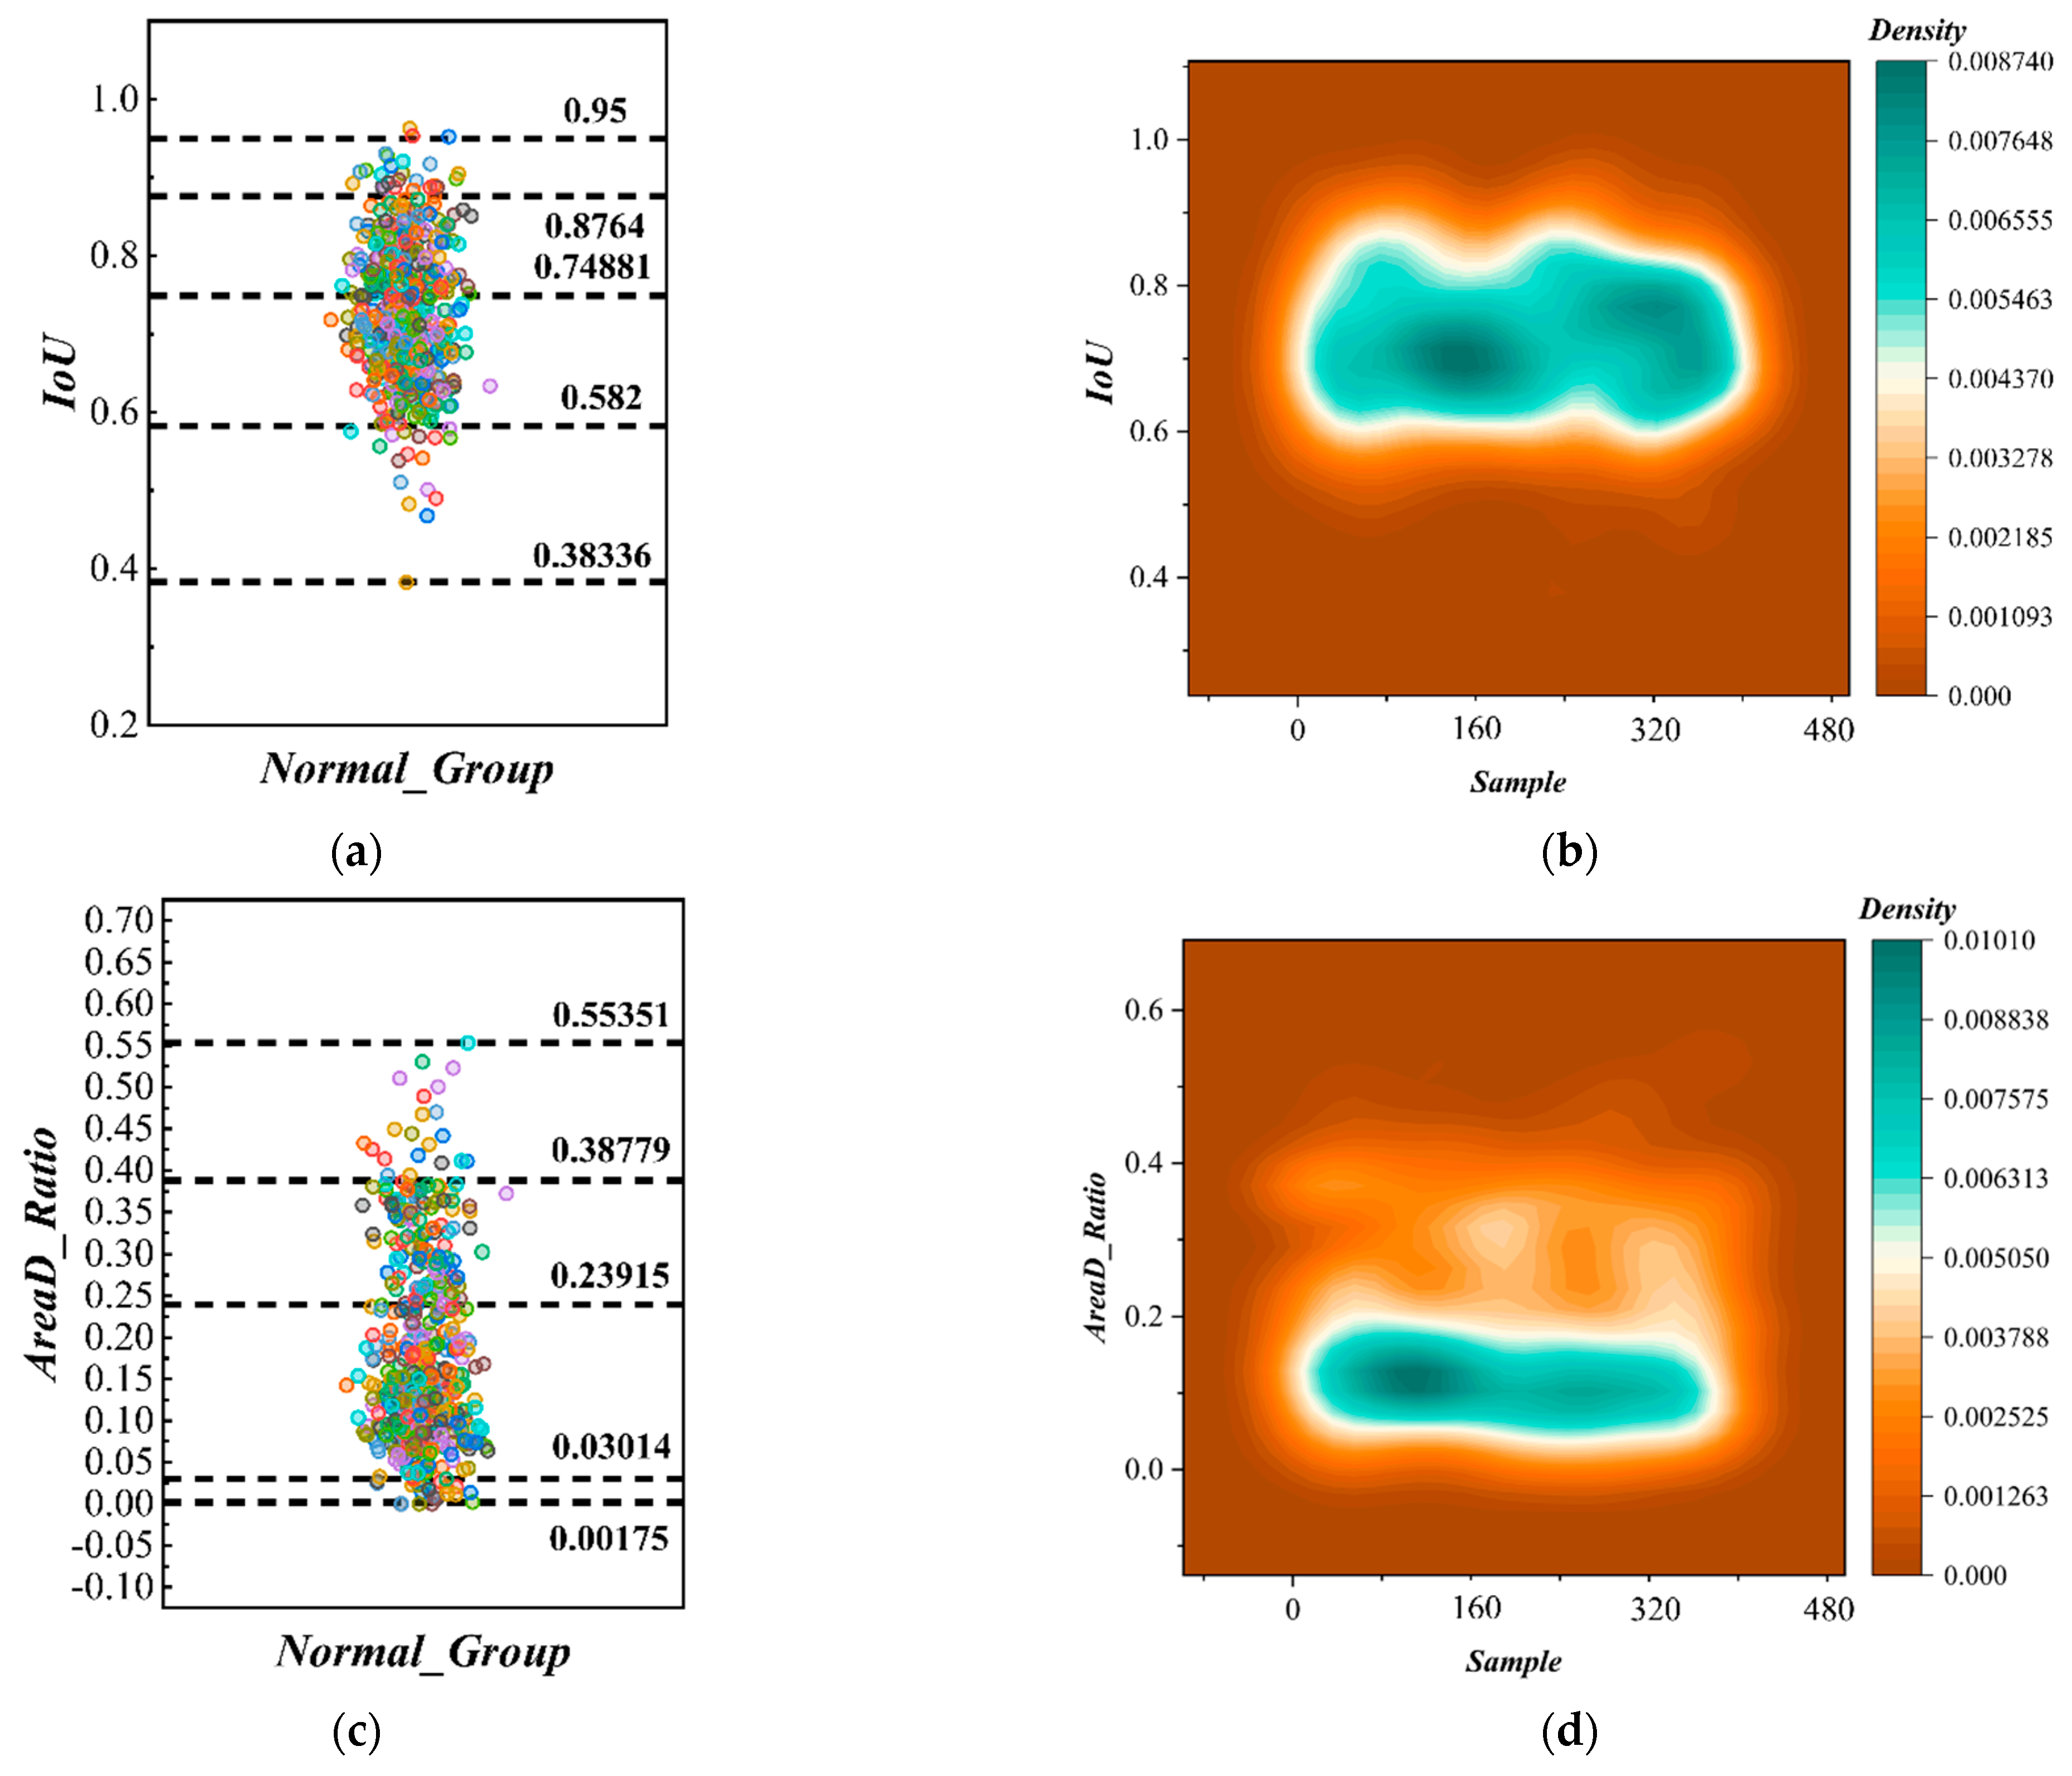
2.3.2. Symmetry Analysis of Normal Strawberries

In this study, Principal Component Analysis (PCA) was employed to quantitatively evaluate the symmetry of normal strawberries and to further investigate the degree of fruit curvature. By extracting the primary and secondary axes of each fruit, the method enables the comparison of geometric properties between the left and right regions of the fruit. This provides an effective set of indicators for symmetry assessment. The analysis process is illustrated in Figure 4.
The extraction of the primary axis is based on two-dimensional Principal Component Analysis (PCA) applied to the contour point cloud of each strawberry. By computing the covariance matrix of the contour points with respect to their centroid and performing eigenvalue decomposition, the principal directions of data variation are obtained. The eigenvector corresponding to the largest eigenvalue represents the primary axis, while the orthogonal direction defines the secondary axis. This method does not rely on clustering algorithms but instead analyzes the morphological orientation based on the statistical structure of the data.
To quantitatively assess the symmetry of strawberry fruits, the image is rotated such that the secondary axis is aligned vertically and then divided along this axis into left and right regions for analysis. The Intersection over Union (IoU) metric is introduced to measure the degree of overlap between the right region and the horizontally flipped left region, reflecting the shape consistency across the vertical midline. In addition, the Area Difference Ratio (AreaD_Ratio) is employed to further describe the disparity in area distribution between the two sides. The corresponding calculation formulas are defined as follows:
IoU = | Left Right | | Left Right |
AreaD   Ratio = | Area Left Area Right | max ( Area Left , Area Right )
In the equations, Left and Right refer to the pixel regions of the left and right halves of the image after alignment and rotation, respectively. AreaLeft and AreaRight denote the pixel areas of the left and right regions. The operator max(·) represents normalization to ensure the values are within a comparable scale.

3. Results and Discussion

3.1. Strawberry Segmentation Experiments and Result Analysis

Accurate instance-level segmentation of strawberry fruits is a prerequisite for deformity analysis. To validate the effectiveness of the improved YOLOv11 model in strawberry image recognition tasks, a set of standard evaluation metrics—Precision, Recall, AP50, and F1-score—was employed. Additionally, a series of quantitative comparison experiments were conducted using alternative segmentation models, including YOLOv8x-seg, YOLOv9e-seg, and YOLOv10x-seg.
A total of 100 strawberry images were selected as segmentation test samples, with representative examples shown in Figure 5. All models were trained on the same dataset and evaluated under identical experimental conditions. The segmentation experiments were conducted on a system running Windows 11, equipped with an Intel i7-14700F CPU and an NVIDIA GeForce RTX 4060Ti GPU (Lenovo, Beijing, China). The experimental results are presented in Figure 6 and Table 1.
As shown in Table 1, the improved YOLOv11 model outperforms all comparison models—including YOLOv9e-seg, YOLOv8x-seg, and YOLOv10x-seg—across all evaluation metrics. Specifically, it achieves a Precision of 91.11%, a Recall of 87.46%, and an AP50 of 92.90%, demonstrating superior segmentation performance. Compared to YOLOv9e-seg, the improvements are 2.61%, 2.31%, and 1.60%, respectively. Relative to YOLOv8x-seg, the gains reach 2.30%, 3.84%, and 2.70%. Moreover, when compared with the original YOLOv11-seg, the improved model still exhibits enhanced performance, with increases of 0.99%, 1.25%, and 1.66%, respectively. These results demonstrate the significant advantage of the improved YOLOv11 model in strawberry image segmentation tasks.
Compared to the other models, the improved YOLOv11 effectively balances precision and recall, as evidenced by its high F1-score of 88.45%, indicating superior performance in optimizing both accuracy and detection coverage. These improvements are attributed to architectural enhancements and feature extraction layer optimization, which together contribute to the model’s increased generalization ability and robustness.
Despite its overall superior performance, the model still exhibits certain limitations. While the inference speed in this study met experimental requirements, further improvements may be necessary for large-scale applications, particularly in real-time monitoring or rapid-response scenarios. Moreover, the model’s performance under high-density planting conditions requires further validation to ensure its scalability and applicability in diverse agricultural environments.

3.2. Experimental Validation of Strawberry Deformity Detection and Symmetry Quantification

3.2.1. Deformity Classification and Quantification Experiments for Strawberries

To evaluate the effectiveness and reliability of the proposed deformity classification and quantification method, a series of experiments were conducted based on the deformity point quantification approach. A total of 800 strawberry images were randomly selected as test data, with an equal distribution of normal and deformed fruits at a ratio of 1:1. Representative image samples are shown in Figure 7.
To ensure the reliability and representativeness of the experimental results, the dataset was divided into eight groups, comprising four groups of deformed strawberries and four groups of normal strawberries, with 100 images in each group. Based on the deformity point quantification method, both deformity points and contour sampling points were extracted for each image, and quantitative analysis was conducted using the previously defined functions (Equations (1)–(3)). The results of deformity point and sampling point extraction are illustrated in Figure 8, while the corresponding quantitative data are summarized in Table 2.
As shown by the quantitative results in Table 2, the number of deformity points (Nd) in the deformed strawberry groups consistently remained around 13.5, which is significantly higher than the average of approximately 6.7 observed in the normal strawberry groups. This indicates a greater concentration of irregular regions along the contours of deformed fruits. Similarly, the deformity rate (Rd) remained above 0.39 across all deformed groups, while in normal groups it was generally below 0.25, further highlighting the distinct differences in contour distortion severity between the two classes.
In terms of structural scale characteristics, the minimum deformity spacing (Gmin) for deformed strawberries was primarily distributed in the range of 1019–1050 pixels, considerably lower than the 1828–1956 pixels observed in the normal groups. This suggests that deformity regions are more densely distributed in deformed fruits. Conversely, the maximum deformity spacing (Gmax) in normal strawberries reached up to 8293 pixels, substantially higher than the approximate 5800 pixels observed in the deformed groups, indicating that normal strawberries possess greater contour continuity and structural integrity, with deformities being more sparse and dispersed.
Additionally, the variation within each group was minimal, demonstrating the stability and robustness of the proposed deformity point quantification method. In summary, the three indicators—Nd, Rd, and Gmin/Gmax—effectively characterize morphological differences in strawberries from the perspectives of quantity, density, and structural scale, thereby validating the applicability and potential of the proposed method in deformity analysis and classification of strawberry fruits.
To further evaluate the discriminative effectiveness of each quantitative indicator in the precise classification of strawberry deformities, a systematic analysis was conducted on 400 deformed and 400 normal strawberry image samples using the proposed deformity point quantification method. Three key quantitative indicators—deformity rate (Rd), maximum deformity spacing (Gmax), and minimum deformity spacing (Gmin)—were extracted and statistically analyzed for each sample. The distribution results are presented in Figure 9.
As illustrated in Figure 9a,d, the deformity rate (Rd) of deformed strawberries is significantly higher than that of normal strawberries, with values predominantly distributed in the range of 0.35–0.55, whereas normal samples are concentrated between 0.20–0.30. This distinct separation indicates that Rd possesses strong discriminative capability for classification tasks. Figure 9b,e displays the distribution of maximum deformity spacing (Gmax), revealing that deformed strawberries are primarily clustered between 4269–7224 pixels, while normal strawberries are distributed in a higher range of 7507–9065 pixels. This clear boundary further supports the reliability of Gmax as a stable classification metric.
In contrast, as shown in Figure 9c,f, minimum deformity spacing (Gmin) exhibits substantial overlap between the two categories, particularly within the range of 1000–1300 pixels, where the distributions of deformed and normal strawberries intersect considerably. This ambiguity renders Gmin less suitable as a standalone indicator for accurate classification.
It is worth noting that several outlier points appear in the plots, deviating from the main cluster of each category. These anomalies may be attributed to: (1) misclassified deformed samples present in the normal group; (2) pronounced natural curvature in some normal fruits, which alters their geometric characteristics; and (3) segmentation errors such as edge loss or contour fragmentation, which interfere with the extraction of deformity features.
Based on the above analysis, the following classification thresholds were established: strawberries with Rd > 0.30 or Gmax < 7300 pixels can be identified as deformed. These thresholds are derived from the observed boundaries in feature distributions and serve to reduce misclassification while improving the precision and robustness of deformity detection.

3.2.2. Symmetry Quantification Experiments for Normal Strawberries

To validate the effectiveness and reliability of the proposed symmetry quantification method, a set of 400 normal strawberry images was randomly selected as the experimental dataset. Symmetry analysis was conducted on this dataset to evaluate the degree of fruit curvature. Representative results from the analysis are presented in Figure 10.
As shown in Figure 10, the proposed method successfully captures the primary geometric features of strawberries by identifying the main axis direction, which represents the principal symmetry axis of the fruit in three-dimensional space. This axis typically corresponds to the fruit’s dominant elongation direction and provides a reliable basis for subsequent symmetry quantification. In addition, the method enables the calculation of Intersection over Union (IoU) and Area Difference Ratio (AreaD_Ratio), two quantitative indicators that precisely evaluate the symmetry and morphological consistency between the left and right sides of the fruit. These metrics offer a solid data foundation for the quantitative analysis and classification of strawberry morphological characteristics.
Based on the normal strawberry dataset, quantitative symmetry experiments were conducted using IoU and AreaD_Ratio to evaluate shape symmetry and bilateral consistency. Moreover, the results were visualized using both scatter plots and density maps to illustrate the symmetry distribution characteristics of normal strawberries.
As shown in Figure 11a, most IoU values in the normal strawberry group are concentrated between 0.6 and 0.95, with the majority of samples clustered in the 0.6–0.8 range. This indicates that most strawberries exhibit high morphological symmetry, with minimal differences between the left and right sides. The distribution reflects a strong overall consistency in symmetry among normal strawberry samples. The density map in Figure 11b further reveals the distribution pattern of IoU values, showing that normal strawberries are predominantly concentrated in the higher IoU range, suggesting good shape uniformity. Only a small number of samples exhibit lower IoU values, indicating that asymmetrical morphology is relatively rare.
In Figure 11c, the scatter plot shows that Area Difference Ratio (AreaD_Ratio) values for normal strawberries are mostly concentrated between 0 and 0.6, with the majority falling below 0.4. This suggests that the area difference between the left and right sides is generally small, supporting the presence of high morphological symmetry. The density plot in Figure 11d aligns with the scatter plot, illustrating that most strawberries exhibit low AreaD_Ratio values, which further confirms their symmetric structure.
A small number of outliers are observed in both scatter and density plots, particularly in regions with low IoU values and high AreaD_Ratio values. These outliers may be attributed to several factors: 1. A small number of deformed strawberries may have been inadvertently included in the normal sample dataset. 2. Inaccurate boundary extraction caused by occlusion or segmentation errors during the image processing stage may have led to exaggerated shape differences.
The observed variation in symmetry is primarily influenced by differences in fruit curvature. For most normal strawberries, the distribution of IoU and AreaD_Ratio values indicates a high degree of bilateral consistency, suggesting that the fruits maintain good symmetry during natural growth. In contrast, strawberries exhibiting more pronounced curvature tend to have lower IoU values and higher AreaD_Ratio values, indicating that curvature significantly affects symmetry—especially in cases of irregular morphology.
Despite the satisfactory performance achieved in quantifying symmetry of normal strawberries and classifying malformed fruits, the current study was conducted using images captured under controlled greenhouse conditions, involving a single cultivar and relatively ideal imaging environments. However, in open-field cultivation scenarios—characterized by greater varietal diversity and more complex illumination conditions—morphological variability and imaging inconsistencies may compromise the stability and accuracy of deformity detection and symmetry analysis. To address these challenges, future research will aim to incorporate a broader range of strawberry cultivars and more diverse cultivation and imaging conditions. This will enable a more rigorous validation of the proposed method’s generalizability and robustness under realistic field applications.

4. Conclusions

This study presents an integrated framework combining deep learning and geometric analysis for automated detection and quantitative evaluation of strawberry deformity and symmetry, aiming to enable precise morphological characterization of strawberry fruits.
Improved segmentation accuracy and model stability: To enhance feature localization in fruit regions, the YOLOv11 network was optimized by incorporating a Squeeze-and-Excitation (SE) attention mechanism. In standard segmentation evaluations, the improved model achieved Precision, Recall, AP50, and F1-score values of 91.11%, 87.46%, 92.90%, and 88.45%, respectively, outperforming YOLOv8, YOLOv9, and YOLOv10 series models. These results demonstrate a well-balanced trade-off between accuracy and recall, ensuring high-precision instance extraction and providing a solid foundation for subsequent morphological analysis.
Construction and validation of deformity quantification indicators: A comprehensive three-dimensional deformity feature representation was developed based on contour fitting and HSV-based masking, comprising the number of deformity points (Nd), deformity rate (Rd), and deformity spacing metrics (Gmin, Gmax). Experimental results revealed that deformed samples exhibited significantly higher Nd and Rd values and lower Gmax values compared to normal samples, with clear and stable classification boundaries. Threshold-based classification (e.g., Rd > 0.30 or Gmax < 7300) enabled efficient identification of deformities, confirming the effectiveness and robustness of the proposed method.
Geometric symmetry quantification and morphological differentiation: For the normal strawberry group, PCA was used to extract the principal axis of each fruit, and symmetry was quantified using Intersection over Union (IoU) and Area Difference Ratio (AreaD_Ratio). Results indicated that most strawberries exhibited high symmetry, with IoU values concentrated in the 0.6–0.8 range and AreaD_Ratio values typically below 0.4. Samples with increased curvature showed decreased IoU and elevated AreaD_Ratio, demonstrating the method’s sensitivity to asymmetry and its ability to distinguish morphological deviations in naturally grown fruits.
Academic significance and future research directions: This study provides an innovative and effective approach for extracting and quantifying strawberry morphological traits, offering both theoretical and engineering support for appearance quality analysis. The proposed method is highly adaptable to curved and morphologically diverse fruits, making it scalable and practically valuable. Future research may integrate 3D reconstruction techniques and multi-modal sensing data to enhance model adaptability under complex field conditions and occlusions. Further deployment and validation in real-world agricultural sorting systems could offer comprehensive support for intelligent fruit grading and standardized quality control.

Author Contributions

Conceptualization, L.J. and Y.W.; Methodology, L.J.; Software, L.J.; Validation, L.J., H.Y., and Y.Y.; Formal analysis, L.J.; Investigation, C.W.; Resources, C.W.; Data curation, C.W.; Writing—original draft preparation, L.J.; Writing—review and editing, Y.W.; Visualization, L.J.; Supervision, L.J.; Project administration, C.W.; Funding acquisition, C.W. All authors have read and agreed to the published version of the manuscript.

Funding

This research was funded by Shandong Provincial Key Research and Development Program (Grant No. 2022CXPT017) and Shandong Provincial Science and Technology Innovation Guidance Program (Grant Nos. YDZX2024040, 2024LYXZ006, and YDZX2023031).

Data Availability Statement

The data presented in this study are available on request from the corresponding author. The data are not publicly available due to confidentiality and privacy restrictions.

Conflicts of Interest

The authors declare no conflicts of interest.

References

  1. Xu, B.; Feng, M.; Chitrakar, B.; Cheng, J.; Wei, B.; Wang, B.; Ma, H. Multi-frequency power thermosonication treatments of clear strawberry juice: Impact on color, bioactive compounds, flavor volatiles, microbial and polyphenol oxidase inactivation. Innov. Food Sci. Emerg. Technol. 2023, 84, 103295. [Google Scholar] [CrossRef]
  2. Terefe, N.S.; Yang, Y.H.; Knoerzer, K.; Buckow, R.; Versteeg, C. High pressure and thermal inactivation kinetics of polyphenol oxidase and peroxidase in strawberry puree. Innov. Food Sci. Emerg. Technol. 2010, 11, 52–60. [Google Scholar] [CrossRef]
  3. Yuan, L.M.; Cai, J.R.; Sun, L.; Han, E.; Ernest, T. Nondestructive measurement of soluble solids content in apples by a portable fruit analyzer. Food Anal. Methods 2016, 9, 785–794. [Google Scholar] [CrossRef]
  4. Garcia-Palazon, A.; Suthanthangjai, W.; Kajda, P.; Zabetakis, I. The effects of high hydrostatic pressure on β-glucosidase, peroxidase and polyphenoloxidase in red raspberry (Rubus idaeus) and strawberry (Fragaria× ananassa). Food Chem. 2004, 88, 7–10. [Google Scholar] [CrossRef]
  5. Zheng, Z.; He, Y.; He, Y.; Zhan, J.; Shi, C.; Xu, Y.; Zhang, C. Micro-nano bubble water subsurface drip irrigation affects strawberry yield and quality by modulation of microbial communities. Agric. Water Manag. 2025, 307, 109228. [Google Scholar] [CrossRef]
  6. Sabbadini, S.; Capocasa, F.; Battino, M.; Mazzoni, L.; Mezzetti, B. Improved nutritional quality in fruit tree species through traditional and biotechnological approaches. Trends Food Sci. Technol. 2021, 117, 125–138. [Google Scholar] [CrossRef]
  7. Tahir, H.E.; Xiaobo, Z.; Jiyong, S.; Mahunu, G.K.; Zhai, X.; Mariod, A.A. Quality and postharvest-shelf life of cold-stored strawberry fruit as affected by gum arabic (Acacia senegal) edible coating. J. Food Biochem. 2018, 42, e12527. [Google Scholar] [CrossRef]
  8. Feng, M.; Chitrakar, B.; Chen, J.; Islam, M.N.; Wei, B.; Wang, B.; Xu, B. Effect of multi-mode thermosonication on the microbial inhibition and quality retention of strawberry clear juice during storage at varied temperatures. Foods 2022, 11, 2593. [Google Scholar] [CrossRef]
  9. Barikloo, H.; Ahmadi, E. Shelf life extension of strawberry by temperatures conditioning, chitosan coating, modified atmosphere, and clay and silica nanocomposite packaging. Sci. Hortic. 2018, 240, 496–508. [Google Scholar] [CrossRef]
  10. Rashid, A.; Qayum, A.; Liang, Q.; Kang, L.; Raza, H.; Chi, Z.; Ma, H. Preparation and characterization of ultrasound-assisted essential oil-loaded nanoemulsions stimulated pullulan-based bioactive film for strawberry fruit preservation. Food Chem. 2023, 422, 136254. [Google Scholar] [CrossRef]
  11. Xu, B.; Chen, J.; Azam, S.R.; Feng, M.; Wei, B.; Yan, W.; Duan, X. Flat dual-frequency sweeping ultrasound enhances the inactivation of polyphenol oxidase in strawberry juice. J. Food Meas. Charact. 2022, 16, 762–771. [Google Scholar] [CrossRef]
  12. Huang, Y.; Xiong, J.; Li, Z.; Hu, D.; Sun, Y.; Jin, H.; Fang, H. Recent Advances in Light Penetration Depth for Postharvest Quality Evaluation of Fruits and Vegetables. Foods 2024, 13, 2688. [Google Scholar] [CrossRef] [PubMed]
  13. Lu, Y.; Gong, M.; Li, J.; Ma, J. Strawberry Defect Identification Using Deep Learning Infrared–Visible Image Fusion. Agronomy 2023, 13, 2217. [Google Scholar] [CrossRef]
  14. Meng, L.; Audenaert, K.; Van Labeke, M.C.; Höfte, M. Detection of Botrytis cinerea on strawberry leaves upon mycelial infection through imaging technique. Sci. Hortic. 2024, 330, 113071. [Google Scholar] [CrossRef]
  15. Yang, S.; Wang, W.; Gao, S.; Deng, Z. Strawberry ripeness detection based on YOLOv8 algorithm fused with LW-Swin Transformer. Comput. Electron. Agric. 2023, 215, 108360. [Google Scholar] [CrossRef]
  16. Li, J.; Xu, Y.; Zhu, W.; Wei, X.; Sun, H. Maturity assessment of tomato fruit based on electrical impedance spectroscopy. Int. J. Agric. Biol. Eng. 2019, 12, 154–161. [Google Scholar] [CrossRef]
  17. Wang, C.; Wang, H.; Han, Q.; Zhang, Z.; Kong, D.; Zou, X. Strawberry Detection and Ripeness Classification Using YOLOv8+ Model and Image Processing Method. Agriculture 2024, 14, 751. [Google Scholar] [CrossRef]
  18. Guo, Z.; Chen, X.; Zhang, Y.; Sun, C.; Jayan, H.; Majeed, U.; Zou, X. Dynamic nondestructive detection models of apple quality in critical harvest period based on near-infrared spectroscopy and intelligent algorithms. Foods 2024, 13, 1698. [Google Scholar] [CrossRef]
  19. Guo, Z.; Hu, X.; Zhao, B.; Wang, H.; Ma, X. Strawsnake: A real-time strawberry instance segmentation network based on the contour learning approach. Electronics 2024, 13, 3103. [Google Scholar] [CrossRef]
  20. Liming, X.; Yanchao, Z. Automated strawberry grading system based on image processing. Comput. Electron. Agric. 2010, 71, S32–S39. [Google Scholar] [CrossRef]
  21. Jeong, H.; Moon, H.; Jeong, Y.; Kwon, H.; Kim, C.; Lee, Y.; Kim, S. Automated Technology for Strawberry Size Measurement and Weight Prediction Using AI. IEEE Access 2024, 12, 14157–14167. [Google Scholar] [CrossRef]
  22. Ariza, M.T.; Soria, C.; Medina, J.J.; Martínez-Ferri, E. Fruit misshapen in strawberry cultivars (Fragaria× ananassa) is related to achenes functionality. Ann. Appl. Biol. 2011, 158, 130–138. [Google Scholar] [CrossRef]
  23. Oo, L.M.; Aung, N.Z. A simple and efficient method for automatic strawberry shape and size estimation and classification. Biosyst. Eng. 2018, 170, 96–107. [Google Scholar] [CrossRef]
  24. Zhou, X.; Ampatzidis, Y.; Lee, W.S.; Zhou, C.; Agehara, S.; Schueller, J.K. Deep learning-based postharvest strawberry bruise detection under UV and incandescent light. Comput. Electron. Agric. 2022, 202, 107389. [Google Scholar] [CrossRef]
  25. Zhao, S.; Liu, J.; Wu, S. Multiple disease detection method for greenhouse-cultivated strawberry based on multiscale feature fusion Faster R_CNN. Comput. Electron. Agric. 2022, 199, 107176. [Google Scholar] [CrossRef]
  26. Li, G.; Jiao, L.; Chen, P.; Liu, K.; Wang, R.; Dong, S.; Kang, C. Spatial convolutional self-attention-based transformer module for strawberry disease identification under complex background. Comput. Electron. Agric. 2023, 212, 108121. [Google Scholar] [CrossRef]
  27. Liu, J.; Guo, J.; Zhang, S. YOLOv11-HRS: An Improved Model for Strawberry Ripeness Detection. Agronomy 2025, 15, 1026. [Google Scholar] [CrossRef]
  28. Ye, R.; Shao, G.; Gao, Q.; Zhang, H.; Li, T. CR-YOLOv9: Improved YOLOv9 multi-stage strawberry fruit maturity detection application integrated with CRNET. Foods 2024, 13, 2571. [Google Scholar] [CrossRef]
  29. He, L.H.; Zhou, Y.Z.; Liu, L.; Cao, W.; Ma, J.H. Research on object detection and recognition in remote sensing images based on YOLOv11. Sci. Rep. 2025, 15, 14032. [Google Scholar] [CrossRef]
  30. He, L.H.; Zhou, Y.Z.; Liu, L.; Zhang, Y.Q.; Ma, J.H. Research on the directional bounding box algorithm of YOLO11 in tailings pond identification. Measurement 2025, 253, 117674. [Google Scholar] [CrossRef]
Figure 1. Schematic diagram of the strawberry image-acquisition setup.
Horticulturae 11 00652 g001
Figure 2. Schematic diagram of the improved strawberry segmentation model architecture.
Horticulturae 11 00652 g002
Figure 3. Workflow of deformity quantification analysis for strawberries.
Horticulturae 11 00652 g003
Figure 4. Quantitative symmetry analysis process for normal strawberries.
Horticulturae 11 00652 g004
Figure 5. Sample images used in the strawberry segmentation experiments.
Horticulturae 11 00652 g005
Figure 6. Segmentation results of strawberry instance extraction using different models.
Horticulturae 11 00652 g006
Figure 7. Sample images used in the deformity classification and quantification experiments.
Horticulturae 11 00652 g007
Figure 8. Annotation results of deformity and sampling points in strawberries: Representative samples from the deformity quantification analysis. The top row shows deformed strawberries, and the bottom row shows normal strawberries. Blue points indicate the uniformly sampled contour points, while green points represent the identified deformity points used for subsequent quantitative analysis.
Horticulturae 11 00652 g008
Figure 9. Deformity quantification analysis results: (a) Distribution of deformity rate (Rd) in deformed strawberries, reflecting the density of contour deformities; (b) Distribution of maximum deformity spacing (Gmax) in deformed strawberries, indicating the structural continuity of deformity regions; (c) Distribution of minimum deformity spacing (Gmin) in deformed strawberries, highlighting the spatial arrangement of deformity points; (d) Distribution of deformity rate (Rd) in normal strawberries, reflecting the density of contour deformities; (e) Distribution of maximum deformity spacing (Gmax) in normal strawberries, indicating higher structural continuity; (f) Distribution of minimum deformity spacing (Gmin) in normal strawberries, showing the spatial arrangement pattern of minor deviations.
Horticulturae 11 00652 g009
Figure 10. Visualization of symmetry evaluation results in normal strawberries.
Horticulturae 11 00652 g010
Figure 11. Symmetry quantification results for normal strawberries: (a) Scatter plot of Intersection over Union (IoU) values for normal strawberries; (b) Density distribution of IoU values; (c) Scatter plot of Area Difference Ratio (AreaD_Ratio); (d) Density distribution of AreaD_Ratio.
Horticulturae 11 00652 g011
Table 1. Results of model comparison experiments.
ModelPrecision/%Recall/%AP50/%F1
YOLOv9e-seg88.5085.1591.3086.79
YOLOv8x-seg88.8183.6290.2086.31
YOLOv10x-seg89.5685.1491.1586.98
YOLOv11-seg90.1186.2191.2487.16
Improved YOLOv1191.1187.4692.9088.45
Table 2. Experimental results of strawberry deformity quantification analysis.
GroupsNdRdGminGmax
Deformed_Group113.48940.39661023.77065726.1149
Deformed_Group213.51090.39321019.68615752.0336
Deformed_Group313.94740.40581039.67075815.4124
Deformed_Group413.78950.39731050.33085775.0839
Normal_Group16.72920.24461913.99308293.9072
Normal_Group26.82290.24791828.56438275.3413
Normal_Group36.73960.24521905.20408274.5819
Normal_Group46.80000.24901956.44328229.4651
Disclaimer/Publisher’s Note: The statements, opinions and data contained in all publications are solely those of the individual author(s) and contributor(s) and not of MDPI and/or the editor(s). MDPI and/or the editor(s) disclaim responsibility for any injury to people or property resulting from any ideas, methods, instructions or products referred to in the content.

