Abstract
Hybrid tea roses (Rosa hybrida) are economically important horticultural crops and highly susceptible to heat stress, which significantly impacts flower quality and yield. As a key member of the heat shock protein (HSP) family, HSP70 protein acts as a molecular chaperone and exhibits diverse abiotic stress response functions in plants. A total of 113 HSP70 transcription factors (TFs) with varying physical and chemical properties were identified in the genome of hybrid tea rose. Phylogenetic analysis showed that the identified TFs could classify into three (I, II, and III) subfamilies, with most members (51 TFs) falling in subfamily II. Wide gene structural variations were observed among the three subfamilies, with group I and II members lacking introns, while group III members only harbored 1~4 exons and introns. Numerous cis-acting elements associated with abiotic stress, hormone response, growth and development responses, as well as light response were detected in the HSP70 gene promoters. In addition, protein interaction networks predicted a wide range of interactions between different hybrid tea rose HSP70 subfamilies. Gene expression analysis revealed that 57 HSP70 genes had strong organ specificity and response to heat stress in the hybrid tea rose plants. Notably, the expression levels of two RhHSP70 genes, RhHSP70-69 and RhHSP70-88, were significantly increased after heat stress, indicating that these two genes might be crucial for plant heat stress response. Subcellular localization of RhHSP70-69 and RhHSP70-88 revealed that their proteins were located in the nucleus. Our results are not only useful for future evaluation of the regulatory roles of RhHSP70 genes in the hybrid tea rose growth and development, but also provides key genes for future molecular breeding of heat tolerant plants.
1. Introduction
Heat shock proteins (HSPs) are highly conserved molecular chaperone proteins that are ubiquitously distributed in prokaryotic and eukaryotic cells, with key roles in plant development and response to biotic and abiotic stresses [1,2]. HSPs are localized in different cell regions, such as the cytoplasm, nucleus, mitochondria, chloroplasts and endoplasmic reticulum [3], and are divided into five subfamilies, including HSP100, HSP90, HSP70, HSP60 and sHSP based on their molecular weights (MW), with HSP70 as the most widely distributed and conservative group [4,5]. Members of the HSP70 family contains three main domains, including an N-terminal nucleotide-binding domain (NBD), a substrate binding domain (SBD), and a C-terminal substrate binding region, with MW of 44, 118, and 10 kDa, respectively [6]. As molecular chaperones, HSP70 family proteins are predominantly involved in the folding of newly synthesized proteins, which prevent protein aggregation, protein transmembrane transfer, targeted protein degradation, and assembly of multi-protein complexes, thus maintaining protein homeostasis [7].
Previous studies have identified the HSP70 gene family in numerous plant species and investigated their underlying mechanisms in plant responses to biotic and abiotic stresses as well as plant growth and development. The profiles of 18 Arabidopsis thaliana HSP70 genes showed varied levels in different tissues, at different developmental stages, and environmental conditions, with representative genes from each subfamily being highly expressed at specific developmental stage and under heat stress [8]. A total of 32 HSP70 genes were reported in the Oryza sativa genome, most of which showed tissue-specificity and sensitivity to environmental stress [9,10]. The expression profiles of 61 soybean (Glycine max) HSP70 genes in different tissues under drought and heat stress showed that the gene family was widely involved in plant tissue development and response to drought and heat stress [11]. The cotton (Gossypium hirsutum) HSP70 genes were previously shown to be involved in the transcriptional regulation of stamen development [12], while the expression profiles of 35 Zea mays HSP70 genes showed higher levels in different tissues, suggesting their regulatory roles in plant vegetative and reproductive growth processes [13].
Hybrid tea roses (Rosa hybrida) are globally important ornamental crops, with heat stress posing a major threat to their cultivation. Elevated temperatures disrupt floral development, and reduce petal size, color intensity, and vase life. Transcriptome data of R. hybrida tissues under heat stress have revealed significant upregulation of heat shock protein (HSP) genes, suggesting their critical role in thermotolerance [14,15]. However, the specific functions and regulatory networks of HSPs in rose remain uncharacterized, limiting molecular breeding efforts for heat-resistant varieties. This study conducted a systematic genome-wide screening of the HSP70 gene family in R. hybrida. Bioinformatic analyses, including gene structure analysis, evolutionary history, conserved motifs, screening of cis-acting elements in gene promoters, protein interaction, and HSP70 gene expression analysis were conducted in the hybrid tea rose plant. Our results provide a basis for functional evaluation of HSP70 genes and future breeding of heat-resistant hybrid tea rose varieties.
2. Materials and Methods
2.1. Genome-Wide Identification and Physicochemical Properties of RhHSP70 Genes
The complete genome sequence and gene annotation of the rose were retrieved from the Ensembl Plants database (accessed on 1 June 2024, via http://plants.ensembl.org/Rosa_chinensis/Info/Index). The full-length amino acid sequence of AtHSP70-17 with the accession number, AT1G09080.1, was retrieved from the A. thaliana genome database (accessed on 1 June 2024, via https://www.arabidopsis.org/), and used as the query sequence due to its well-characterized role in stress response and high sequence conservation among plant species. Preliminary screening of RhHSP70 proteins in the hybrid tea rose genome was performed using TBtools, ver. 2.085 (accessed on 1 June 2024, via https://github.com/CJ-Chen/TBtools-II), with an E-value threshold of 1 × 10⁻⁶ [15]. Subsequently, the HMM file (PF00012) for the HSP70 protein domains was obtained from Pfam database (accessed on 1 June 2024, via http://pfam.sanger.ac.uk/). The HMM file was then input in TBtools to search for HSP70 genes within the rose genome database [16,17]. Candidate protein sequences lacking conserved HSP70 domains were excluded and online tools, including Pfam (accessed on 2 June 2024, via http://pfam.xfam.org/seaRhh#tabview=Table 1), SMART (accessed on 2 June 2024, via http://smart.embl.de/), and NCBI conserved domains database, (CDD, accessed on 2 June 2024, via https://www.ncbi.nlm.nih.gov/cdd/), were used to identify motifs, gene structures, and domains, while WoLF PSORT (accessed on 5 June 2024, via https://wolfpsort.hgc.jp/) was used to predict subcellular localization of RhHSP70 family members. Additionally, TBtools was used to predict the physicochemical properties of RhHSP70 proteins, such as molecular weight and isoelectric point. The above software analyses were conducted using default parameters [18].
2.2. Phylogenetic Analysis and Chromosome Mapping of RhHSP70s
The complete genome sequences, protein sequences, annotation files, as well as protein sequences specifically encoded by the HSP70 gene family were downloaded from the A. thaliana TAIR website (https://www.arabidopsis.org/, accessed on 5 June 2024) [19]. A phylogenetic tree was constructed using the neighbor-joining (NJ) method in the MEGA7 software (https://ngdc.cncb.ac.cn/databasecommons/database/id/572, accessed on 5 June 2024), with 1000 bootstrap replicates [20]. The chromosome location map of the RhHSP70 gene family was constructed in TBtools using gene annotation files from R. hybrida genome.
2.3. Gene Structure, Promoter Sequence, and Collinearity Analysis of RhHSP70s
Introns and exon characteristics of RhHSP70 genes were analyzed using annotation data in TBtools [21]. The MEME online tool (accessed on 9 June 2024, at https://meme-suite.org/meme/tools/meme) was utilized to analyze the conserved motifs within the RhHSP70 proteins [22]. RhHSP70 protein sequences were retrieved using the Phytozome v.13 (https://ngdc.cncb.ac.cn/databasecommons/database/id/572, accessed on 9 June 2024), and their conserved domains analyzed in the NCBI CDD database (accessed on 9 June 2024, at https://www.ncbi.nlm.nih.gov/cdd/). The TBtools software was then used to visualize conserved domains, conserved motifs, and gene structure. Moreover, TBtools was used to retrieve the promoter sequences of all RhHSP70 genes, then the PlantCARE online tool (accessed on 9 June 2024, at http://bioinformatics.psb.ugent.be/webtools/plantcare/html/) was used to scan for cis-acting elements associated with the regulation of light and hormone. The 2000 bp region upstream of ATG was selected as the promoter region [23]. The MCScanX tool, that is integrated within TBtools software (accessed on 9 June 2024, via https://github.com/CJ-Chen/TBtools-II), was used to analyze collinearity of RhHSP70 genes [24,25]. Analysis of selective pressure indices, including Ka, Ks, and Ka/Ks on RhHSP70 protein and their corresponding coding DNA sequences were calculated using TBtools software.
2.4. Analysis of RhHSP70 Protein-Protein Interaction Networks
The protein-protein interaction network of RhHSP70s was constructed using the online Retrieval of Interacting Genes/Proteins database (https://string-db.org/, accessed on 15 June 2024), with the AtHSP70 proteins as templates [26]. A total of five interactions were observed with the protein interaction score of ≥0.4, and then the results visualized using Cytoscape software [27].
2.5. RNA-Seq Expression Analysis of RhHSP70s
Transcriptome data of R. hybrida roots, stems, leaves, flowers, or leaves under heat treatment at 42 °C for 0, 2, 6, or 12 h were downloaded from the PlantExp database (https://biotec.njau.edu.cn/plantExp/, accessed on 19 June 2024) (biological projects, SRX5973698; SRX5973700; SRX5973704; SRX6490241; SRX4195942; SRX4195946; SRX4195947; and SRX4195948). The transcript levels of HSP70 genes were analyzed using the FPKM (Fragments Per Kilobase of transcript per Million mapped reads), followed by |log2 FC| standardization to determine significant foldchange (FC) in the expression of differentially expressed genes (DEGs), then their expression heat maps visualized using TBtools [28].
2.6. Plant Material, Stress Treatments, and Tissue Collection
In this experiment, uniformly growing R. hybrida seedlings, cv. Bright Smile was cultivated for 14 days under conditions of 25 °C, 16 h light/8 h dark photoperiod, light intensity 15 μmol·m−1·s−2, and relative humidity 40–60%. Each rose seedling was grown in a pot with a diameter of 25 cm, filled with soil composed of loam, peat, and sand (2:1:1). For tissue-specific gene expression studies, about 0.2 g of root, stem, leaf (the first leaf under the flower), and flower samples were collected from the growing rose plants. For the heat stress study, uniform rose plant cuttings were soaked in 1/4 × Hoagland’s nutrient solution, pH 6.5, and incubated under 42 °C heat conditions or without (control group, CK). Leaf samples (the first leaf under a flower) were collected at 0, 2, 6, or 12 h after stress treatment. The samples were collected in three biological replicates, snap-frozen in liquid nitrogen and then stored at −80 °C until RNA extraction.
2.7. qRT-PCR Validation of RhHSP70s RNA-Seq Profiles Under Drought Stress
RNA extraction was carried out using the TRIzol (Thermo Fisher Scientific, Waltham, MA, USA) reagent following previously described methods [29,30]. The RevertAid First Strand cDNA Synthesis Kit (Thermo Fisher Scientific, Waltham, MA, USA) was utilized to perform reverse transcription following manufacturer’s instructions, then the resulting cDNA samples stored at −80 °C until use. RhHSP70 gene primers were designed from the R. hybrida transcriptome sequencing data using Primer Premier 5.0 software (www.PremierBiosoft.com, accessed on 16 June 2024) (Table S3), then synthesized by Beijing Qingke Biological Co., Ltd. (Kunming, China). Using Rhactin as a reference gene, qRT-PCR analysis was performed on an ABI Prism 7300 Sequence Detection System (Applied Biosystems, Waltham, MA, USA). The 20 μL qRT-PCR reaction mix consisted of; 10 μL of Hieff®® qPCR SYBR Green Master Mix, sourced from Yeasen Biotechnology Co., Ltd., Wuhan, China; 6.8 μL of RNase-free double-distilled water; 0.6 μL each of the upstream and downstream primers; 2 μL of cDNA. The amplification program was as follows: 40 cycles of heating at 95 °C for 2 min, followed by 95 °C for 15 s, and then 60 °C for 1 min (during which the fluorescent signal was collected). The reliability of the data was assessed using the amplification and dissolution curves obtained from the qRT-PCR. Subsequently, the relative gene expression levels were calculated using the 2−∆∆Ct method.
2.8. Subcellular Localization
To determine the subcellular localization of RhHSP70-69 and RhHSP70-88 in R. hybrida, their coding regions were cloned using the cDNA obtained from mature leaves. The amplified fragments were inserted between the SacI and BamH1 sites on the PC1300-GFP vector to generate RhHSP70-69-GFP and RhHSP70-88-GFP fusion constructs. The PC1300-GFP-RhHSP70-69 and PC1300-GFP-RhHSP70-RhHSP70-88 plasmids, and the empty vector PC1300S-GFP were transformed into Arabidopsis protoplasts using the PEG transformation method [31]. Cells were incubated for 14–20 h in the dark at 28 °C, after which the fluorescence signals were observed using a laser confocal scanning microscope (SP8; Leica, Wetzlar, Germany).
2.9. Statistical Analysis
All experiments were conducted with three biological replicates and statistical analysis was performed using SPSS 18.0 (SPSS Inc., Chicago, IL, USA). Tukey’s test was performed to assess differences among treatments. Statistical differences in means among treatments were considered significant at p < 0.05.
3. Results
3.1. Genome-Wide Identification and Chromosomal Localization of RhHSP70s in R. hybrida
Genome-wide screening of HSP70s using the full-length amino acid sequence of AtHSP70-17 as query sequence identified 113 RhHSP70 members in the R. hybrida genome, which were sequentially named as RhHSP70-1-113 (Table S1). The RhHSP70s varied in lengths from 55 to 1758 amino acids, with MW molecular weight ranging from 6.3 to 19.3 kD, while the isoelectric point (pI) values ranged from 4.39 to 9.85. Most RhHSP70 gene family members (90 genes) showed stable proteins with instability index below 40. The aliphatic index of the RhHSP70s ranged between 67.24 and 122.23, which indicated that the protein encoded by RhHSP70 TFs had good thermal stability. The overall average hydropathy of 104 of the identified proteins was negative, which suggested that most RhHSP70 proteins had hydrophilic properties. Subcellular localization prediction showed that RhHSP70 proteins were predominantly located in the nucleus, except for 24, 20, 9, and 3 RhHSP70s, which showed endoplasmic reticulum, cytoplasmic, mitochondrial, and external cell localizations, respectively.
Chromosomal localization of RhHSP70 genes on the R. hybrida genome revealed that the 113 RhHSP70 genes were unevenly distributed on the seven chromosomes with high gene densities (Figure 1). Notably, highest RhHSP70 gene density was observed on chromosome chr1, with 37 genes, while lowest gene densities were detected on chromosomes chr4 and chr5 each with 4 genes.
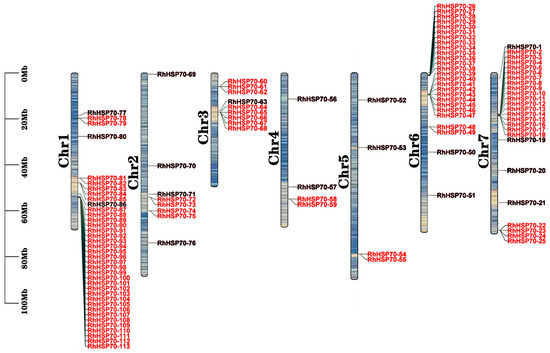
Figure 1.
Chromosomal localization of RhHSP70 gene family members in hybrid tea rose. The scale on the left is in megabytes Blue to yellow in chromosome indicates gene density. The chromosome number is displayed on the left side of the vertical bar; The right side of the vertical bar shows the gene location.
3.2. Phylogenetic Analysis of RhHSP70 Gene Family
Phylogenetic tree constructed using the neighbor-joining (NJ) method based on protein sequences obtained from AtHSP70 and RhHSP70 genes showed that all HSP70 proteins from R. hybrida could be classified into I, II, and III subfamilies, each containing 48, 51, and 14 members, respectively (Figure 2).
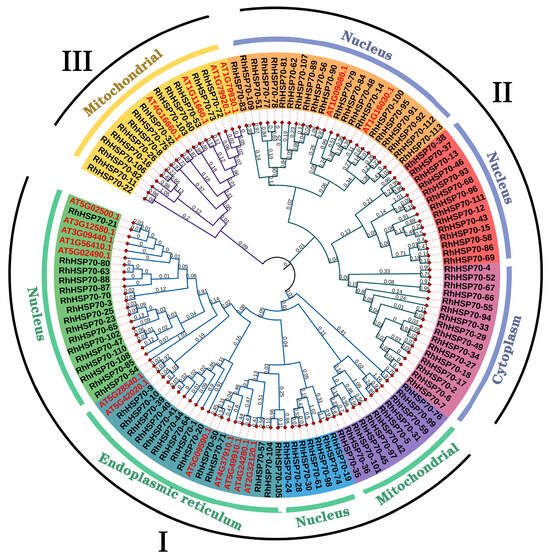
Figure 2.
Phylogenetic analysis of hybrid tea rose and Arabidopsis HSP70 proteins. An unrooted neighbour-joining (NJ) phylogenetic tree was constructed with HSP70 domains of HSP70 proteins from hybrid tea rose and Arabidopsis using MEGA7.0 with a bootstrap of 1000. Three major groups are indicated: I, II and III, with subtypes represented by different colored regions.
3.3. Motifs, Gene Structures, and Domains of RhHSP70s
Conserved motifs, domains, and gene structure analyses were performed to uncover the evolutionary history of RhHSP70s in the hybrid tea rose plant. A simplified phylogenetic analysis showed that the 113 RhHSP70 proteins could be divided into three major groups and seven subgroups (Figure 3A). Conserved motifs analysis of RhHSP70 proteins showed that most members within the same subfamily exhibited similar motif organization and position, which were varied between different subfamilies, suggesting functional differentiation of gene members in the identified subfamilies (Figure 3B). All 36 members of the Rosa rugosa HSP70 gene family contained 10 common motifs, which were highly conserved. The first motif at the N-terminal end was Motif5, which suggested that members of the RrHSP70 proteins subfamilies had similar functions. Subfamily I contained 17 HSP70 members, which harbored ten conserved motifs. Subfamily II had 11 genes that harbored only 1~2 conserved motifs, suggesting that the subfamily lost most of its conserved regions during evolution. All members of the III subfamily contained Motif9, suggesting its critical biological function in R. hybrida.
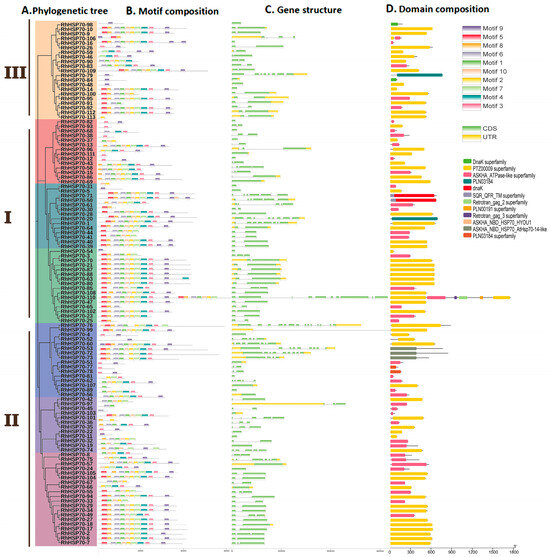
Figure 3.
Phylogenetic tree, Motif, gene structure and domain of RhHSP70 in hybrid tea rose: (A) Phylogenetic tree of RhHSP70 protein (B) Motif composition of RhHSP70 (C) Gene structure of RhHSP70 gene (D) Domain composition of RhHSP70 gene in hybrid tea rose.
As shown in Figure 3C, RhHSP70 genes exhibited a relatively conserved structures, with only limited number of exons in most genes. Of the 113 RhHSP70 genes, 55 had two exons, while 25 had one exon each. Therefore, genes with no more than two exons accounted for 71% of the total genes, while only five members had 10 or more exons and introns. A deletion mutation likely occurred in the conserved motif of gene members with only one exon, such as RhHSP70-98, which only had Motif9. Most members of HSP70 subfamilies I and II only contained exons, while those in subfamily III had fewer (1~4) exons and introns. In addition, genes in each phylogenetic cluster had similar structures and numbers of exons. No obvious changes were observed in the position and length of exons within phylogenetic clusters, but significant variations were detected between the groups.
The analysis of conserved domains showed that RhHSP70 proteins had 12 conserved domains, including DnaK superfamily, PTZ00009 superfamily, ASKHA_ATPase-like superfamily, PLN03184, dnaK, SQR_QFR_TM superfamily, Retrotran_gag_2 superfamily, PLN00191 superfamily, Retrotran_gag_3 superfamily, ASKHA_NBD_HSP70_HYOU1, ASKHA_NBD_HSP70_AtHSP70-14-like, and PLN03184 superfamily (Figure 3D). Most HSP70 protein family members (109 proteins) harbored a single domain, while 63 RhHSP70s contained the PTZ00009 superfamily domain, indicating that it is the main component of this gene family. Of the 63 RhHSP70s, 36 members all harbored 10 conserved motifs, which suggested their roles as the main motifs that constitute the PTZ00009 superfamily domain.
3.4. Cis-Acting Elements Screening in the RhHSP70 Gene Promoters
Cis-acting elements in the gene promoter regions are crucial regulators of gene transcriptional initiation (Figure 4). Screening the promoter region of 113 RhHSP70 genes in the PlantCARE database detected 2810 specific elements, which could be divided into four categories, including light-responsive, hormone responsive, stress-responsive, and development-related elements. These results indicated that the RhHSP70 gene family is tightly associated with growth and development as well as stress response in the hybrid tea rose plant. Notably, most stress related cis-elements were associated with light-response. Moreover, all RhHSP70 gene family members contained stress-responsive elements, with 241 anaerobic induced response elements being detected.
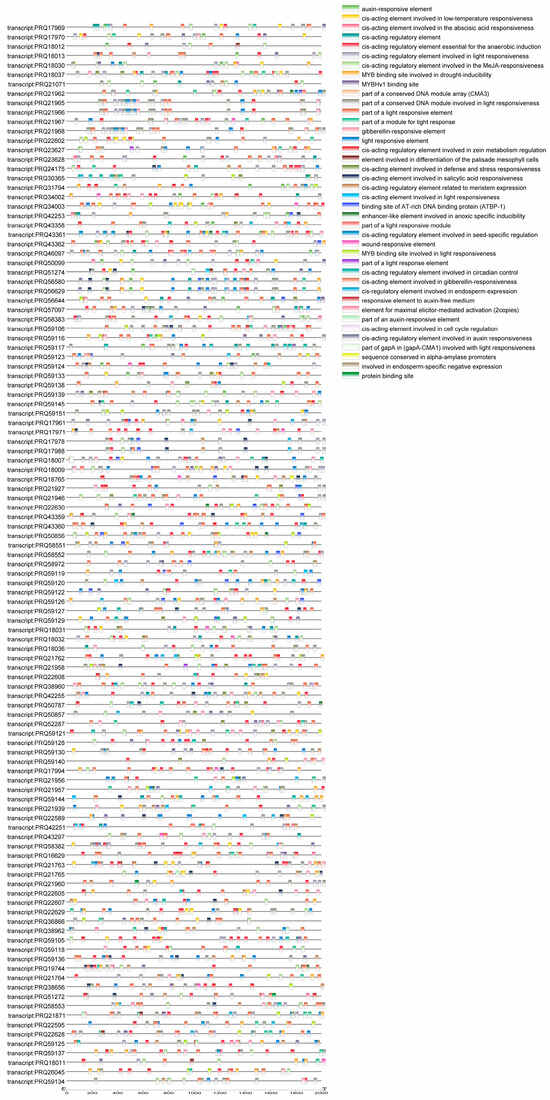
Figure 4.
Distribution of cis-acting elements in the promoter region of the RhHSP70 gene in hybrid tea rose.
3.5. Collinearity Analysis of RhHSP70 Genes
MCScanX in TBtools (ver. 2.085) was used to analyze the duplication events among RhHSP70 genes. Five pairs of segmentally duplicated RhHSP70 genes were identified (Figure 5 and Table S2), with RhHSP70-54 gene showing multiple duplication event. In addition, selective pressure analysis on RhHSP70 protein sequences using substitution rates between non-synonymous (Ka) and synonymous (Ks) and Ka/Ks ratio revealed that the Ka/Ks values of the four duplicated gene pairs were less than 1, which indicated that these genes are mainly under purification selection (Table S2).
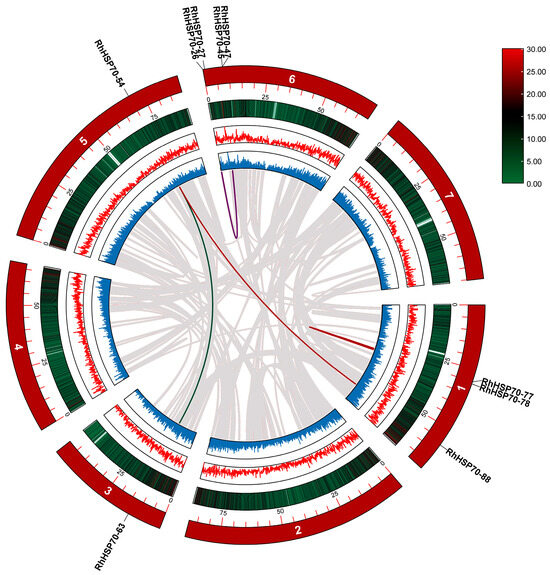
Figure 5.
Gene replication of the HSP70 gene family in Rosa hybrida. The colored lines represent replicated gene pairs in RhHSP70, while the gray lines represent collinear gene pairs in the genome.
3.6. Collinearity Analysis of RhHSP70 Genes Between Plant Species
In order to explore the evolutionary relationship between RhHSP70 genes and other species, the genomes of four plants, including A. thaliana, Ipomoea triloba, Papaver somniferum, and Prunus persica were retrieved and their collinearity compared with that of the hybrid tea rose. A total of 5, 14, 7, and 13 segmentally duplicated pairs were observed between R. hybrida and either A. thaliana, I. triloba, P. somniferum, and P. persica, respectively (Figure 6). Notably, numerous collinear pairs were detected between R. hybrida and I. triloba, indicating that the two species are closely related.
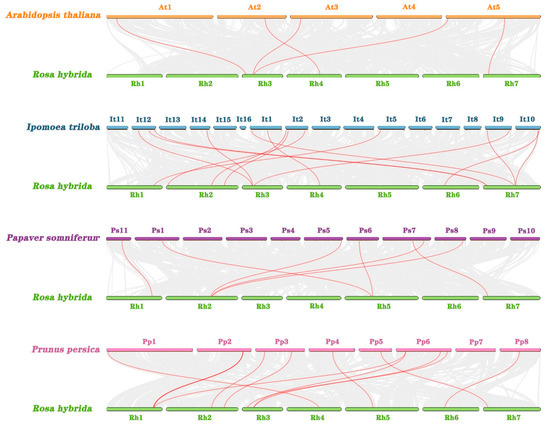
Figure 6.
Collinear analyses of HSP70 genes between hybrid tea rose and four plants (Arabidopsis thaliana, Ipomoea triloba, Prunus persica, Prunus persica). The gray lines between rose and other plants represent collinear blocks in wide regions of the genomes, while red lines show the orthologous relationship of HSP70 genes.
3.7. Analysis of RhHSP70 Protein-Protein Interaction Networks
To analyze the synergistic regulatory effects of RhHSP70 TFs, 18 A. thaliana homologous proteins matched by STRING database were used to construct an interaction network (Figure 7). The RhHSP70 proteins with high sequence similarity to those of A. thaliana, including RhHSP70-50 (AtHSP70-10), RhHSP70-32 (AtHSP70-17), RhHSP70-9 (AtBIP1), RhHSP70-9 (AtBIP2), and RhHSP70-90 (AtBIP3) formed the core nodes of the protein interaction network, indicating that these proteins are functionally crucial in the hybrid tea rose plant. In addition, complex interactions were also detected within and among members of each subfamily, such as RhHSP70-50, RhHSP70-32, and RhHSP70-9, which formed a triangular interaction network, while a core member, RhHSP70-32, had interactions with multiple HSP70 proteins. The complex interaction between members of this gene family reflects their dynamic functional properties in plants.
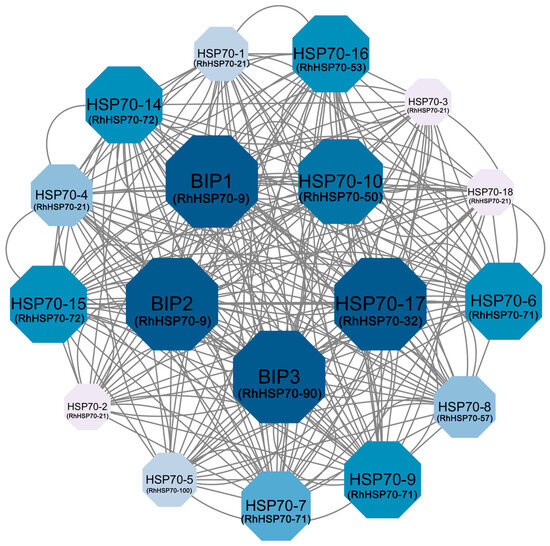
Figure 7.
HSP70 protein interaction network in roses, visualized using Cytoscape (v3.10.0) software. The blue ball (node) represents the RhHSP70 gene. The connecting lines represent potential regulatory relationships, and the text displays the predicted gene names. The larger the size and darker the color of the ball, the more it interacts with other proteins.
3.8. Expression Profiling of RhHSP70s in Different Plant Tissues Under Drought Stress
The expression profiles of the identified 113 RhHSP70 genes were analyzed in the transcriptome data of four different R. hybrida tissues and organs. The results showed that some 57 genes had strong organ specificity (Figure 8). For example, RhHSP70-51 and RhHSP70-21 were highly expressed in the roots and stems, respectively. In addition, RhHSP70-63, RhHSP70-79, RhHSP70-80, and RhHSP70-88 showed high expression levels in the leaves, while and RhHSP70-1 and RhHSP70-72 were highly expressed in flowers.
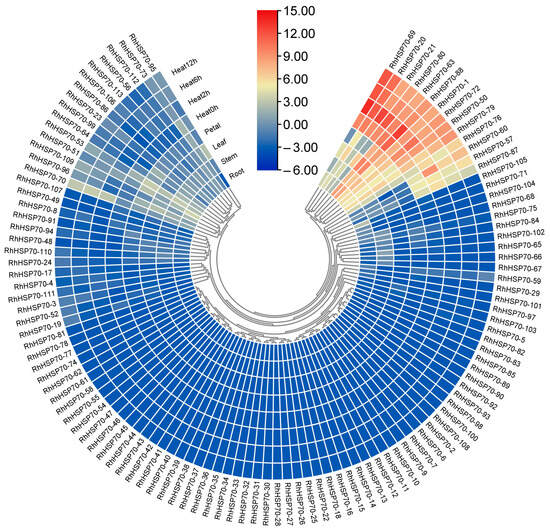
Figure 8.
Heat map of HSP70 gene expression in Rosa hybrida in different tissues and under different durations of drought treatments. The colors from blue to red represent different levels of expression. Blue represents low expression, red represents high expression.
Analysis of heat stress transcriptome data showed that 57 RhHSP70 genes could be expressed in leaves. Differential expression analysis showed that eight genes, including RhHSP70-20, RhHSP70-21, RhHSP70-50, RhHSP70-63, RhHSP70-69, RhHSP70-79, RhHSP70-80, and RhHSP70-88 had highly up-regulated levels under heat stress.
To further verify the functions of RhHSP70 genes, the expression levels of eight genes, including RhHSP70-1, RhHSP70-21, RhHSP70-51, RhHSP70-63, RhHSP70-72, RhHSP70-79, RhHSP70-80, and RhHSP70-88, which showed high expression levels were determined in roots, stems, leaves and flowers (Figure 9). The results showed that RhHSP70-63 and RhHSP70-88 were highly expressed in the four organs, with peak and lowest levels in leaves and stems, respectively. In contrast, the expression levels of RhHSP70-51 and RhHSP70-21 were all very low in the four organs.
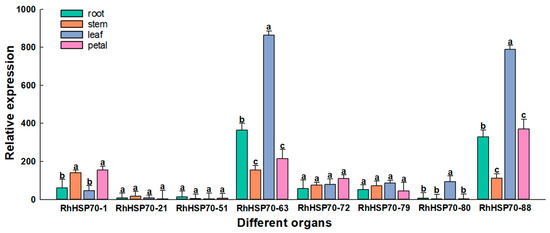
Figure 9.
Relative expression levels of eight RhHSP70 genes were determined by qRT-PCR in different rose organs: roots, stem leaf, and petal. Rhactin was used as the internal control for normalization. Data represent the means ± SEs of three reproducible experiments. Bars with lowercase letters above the columns indicate significant differences between the four organs at p < 0.05 (Tukey’s test).
The roles of the above eight RhHSP70 genes in heat stress were determined by detected by profiling their levels under heat stress (Figure 10). Notably, the expression levels of RhHSP70-20, RhHSP70-21, RhHSP70-69, RhHSP70-80, and RhHSP70-88 were rapidly induced and peaked within 2 h, while the expression levels of RhHSP70-69 and RhHSP70-88 showed a sudden 50-fold increase, suggesting their likely crucial roles in the plant heat stress response. In contrast, RhHSP70-79 showed a slow increase in expression, which significantly increased at 12 h relative to the levels at 0 h.
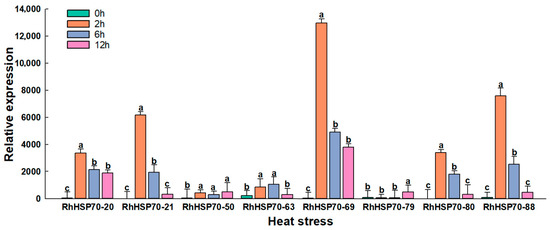
Figure 10.
Relative expression levels of 8 RhHSP70 genes in Rosa × hybrida leaves were determined using qRT-PCR after 0 h (CK), 2 h, 6 h, and 12 h of heat stress. Data represent the means ± SEs of three reproducible experiments. Bars with lowercase letters above the columns indicate significant differences between the different treatments at p < 0.05 (Tukey’s test).
3.9. Subcellular Localization of RhHSP70-69 and RhHSP70-88 in Hybrid Tea Rose
Subcellular localization assay was conducted for RhHSP70-69 and RhHSP70-88 proteins, which were rapidly induced after heat treatment (Figure 11 and Figure 12). Plasmids transformed with RhHSP70-69 and RhHSP70-88 and empty vector PC1300S-GFP were introduced in the Arabidopsis protoplasts, incubated in the dark for 14-20 h, then subcellular localization of RhHSP70-69 and RhHSP70-88 proteins observed under laser confocal microscope. The GPF signal of the fusion protein indicated protein localization. The positive control PC1300S-GFP showed strong green fluorescence throughout the cell, while the fluorescence RhHSP70-69 and RhHSP70-88 proteins showed nucleus localization.
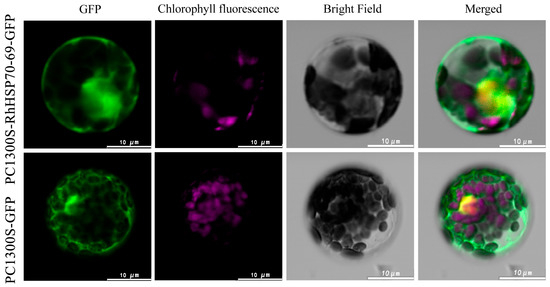
Figure 11.
Subcellular localization of RhHSP70-69 protein in Arabidopsis protoplasts. From left to right are GFP green fluorescent protein, chlorophyll fluorescence, bright field, and merged overlay photos (scale bar = 10 µm).
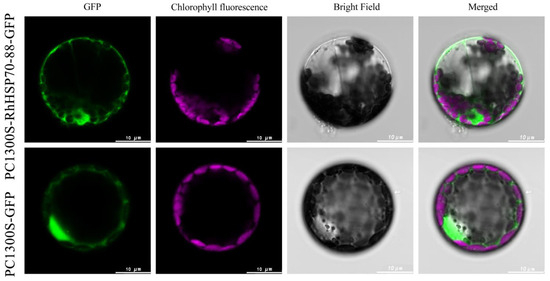
Figure 12.
Subcellular localization of RhHSP70-88 protein in Arabidopsis protoplasts. From left to right are GFP green fluorescent protein, chlorophyll fluorescence, bright field, and merged overlay photos (scale bar = 10 µm).
4. Discussion
The HSP70 gene family is a crucial regulator of plant development and stress response [4]. To date, this gene family has been identified in numerous species, including A. thaliana [8], rice (O. sativa) [9], soybean (G. max) [11], cotton (G. hirsutum) [12], tobacco (Nicotiana tabacum) [32], potato (Solanum tuberosum) [33], switchgrass (Panicum virgatum) [34] and millet (Setaria italica) [35]. In this study, 113 HSP70 genes were identified from the genome of R. hybrida, and their evolutionary characteristics compared with their homologs from A. thaliana [8], rice [9] and other species. The results indicated that the genome of R. hybrida had more HSP70 genes compared to those in other species analyzed. Two or more adjacent gene repeats within a 200-kb interval on the same chromosome are considered as tandem repeats, while gene repeats on two different chromosomes are called fragmental repeats. Gene replication analysis revealed five duplicated gene pairs in R. hybrida, indicating that the plant might have experienced a complex evolutionary process, such as more gene replication and expansion events, which have resulted in the formation of relatively more RhHSP70 genes [36].
Different members of the same gene family usually evolve different exon/intron numbers and structures leading to functional differentiation [37]. Phylogenetic and structural analysis of RhHSP70 gene family, revealed that the structure of most members were relatively conserved, with 71% of the genes having no more than two exons, and the closest members in the same group having similar exon/intron structure and exon number. In addition, genes within the same subfamily exhibited similar types, sequence variations, and protein motifs. Moreover, the arrangement and position of motifs were the same within members of the same subfamily, while proteins within different subfamilies were different, indicating that members of RhHSP70 in a specific subfamily had similar biological functions, which is consistent with previous results [11,38]. The specific aggregation of different motifs and residue loss in specific subfamilies might have contributed to the expansion of RhHSP70 gene density and emergence of new functions [39].
Different HSP70 gene family members have varied expression patterns in the organs of different plants. For example, AtHSP70-1 is highly expressed in A. thaliana leaves, while AtHSP70-2 is more actively expressed in roots [8]. In rice, OsHSP70-1, OsHSP70-2, and OsHSP70-3 are more actively expressed in the leaves, stems, and roots, respectively [9]. In this study, expression analysis of RhHSP70 showed obvious differences in the expression patterns of several genes in different organs. For example, RhHSP70-63, RhHSP70-79, and RhHSP70-80 had varying profiles in different tissues, while RhHSP70-1 and RhHSP70-72 exhibited highest expression levels in leaves and petals, respectively.
Gene promoter regions play key roles in their functional differentiation. Numerous cis-acting elements associated with light-response, hormone-response, and abiotic stress-responses were detected in the promoters of RhHSP70s. Hormone-responsive elements, included cis-acting elements related to MeJA (Methyl jasmonate), ABA (abscisic acid), salicylic acid, and GA (Gibberellic), while abiotic stress-responsive elements, include cis-acting elements related to abiotic stresses, such as light, injury, cold, heat, anaerobic induction, and drought, suggesting that this gene family is involved in the regulation of growth and development as well as abiotic stress responses in R. hybrida.
To further verify the role of RhHSP70s in heat stress resistance of R. hybrida, their gene expression patterns were analyzed in plant leaves under heat stress. Results indicated that eight candidate genes had increased profiles after heat stress, of which five had peak levels at 2 h after treatment before showing decreasing profiles. Similar to the results of RcHSP70 high expression in heat-tolerant varieties of Chinese rose after heat stress, this study also shows that multiple RhHSP70 genes can respond to heat stress [40]. Although RhHSP70-50 and RhHSP70-63 showed up-regulated profiles, their levels remained relatively low. The expression of RhHSP70-79 increased significantly after 12 h of heat stress. Conversely, heat stress in Aquilaria sinensis more rapidly activated the expression of 15 AsHSP70 genes, while others showed slow heat response [41]. The results suggest that the regulation mechanism of HSP70 genes in plant species varies. Although RhHSP70-63 exhibits relatively low expression levels under heat stress, its upregulation in leaves suggests its potential role in maintaining photosynthetic apparatus stability or modulating leaf-specific stress signaling pathways.
Further analysis of RhHSP70-69 and RhHSP70-88 in this study revealed that both genes belonged to subfamily I, which contained fewer introns, with the former having no introns. Previous studies have shown that genes with fewer introns can respond to various stresses quickly [41,42,43]. qPCR analysis to verify the response of eight candidate genes to heat stress showed that RhHSP70-69 and RhHSP70-88 not only exhibited rapid response, but also their expression peaked after 2 h and remained significantly highly expressed than that of other genes. In addition, the expression levels of these two genes in the roots, stems, leaves, and flowers of R. hybrida were significantly higher than those of other genes. Subcellular localization of RhHSP70-69 and RhHSP70-88 indicated that both of their proteins were located in the nucleus, suggesting that they are involved in rapid DNA repair and transcriptional regulation to activate early stress responses. Similarly, RhHSP70-69 and RhHSP70-88 were potentially associated with the growth and development of R. hybrida. The analysis of expressional dynamics of RhHSP70 genes and their expressional regulatory mechanism will potentially contribute to future studies on molecular mechanisms underlying RhHSP70s response to heat stress in R. hybrida.
5. Conclusions
In summary, this study performed bioinformatic analyses to identify 113 HSP70 genes, which could be clustered into three subfamilies in the genome of R. hybrida. Genes in different subfamilies had similar gene structures and conserved motifs. Gene promoter region predominantly contained hormones, light, and stress responsive cis-elements. Numerous RhHSP70s showed strong response to heat stress, with the expression levels of RhHSP70-69 and RhHSP70-88 being significantly higher than those of other genes after heat stress. Moreover, the two genes were located in the nucleus, while their expression levels were the highest in four plant organs, suggesting their key roles in R. hybrida heat stress response. These results provide a theoretical basis for further functional evaluation of RhHSP70s in the growth and development, as well as abiotic stress response in R. hybrida.
Supplementary Materials
The following supporting information can be downloaded at https://www.mdpi.com/article/10.3390/horticulturae11060643/s1, Table S1: Characteristics of identified RhHSP70 gene gamily. Table S2: Intra-segment replication of HSP70 homologous pairs in Rosa × hybrida. Table S3: Primers of RhHSP70 gene needed for fluorescence quantification.
Author Contributions
Conceptualization, J.W., M.D. and X.Y.; methodology, X.Y.; software, X.Y.; validation, X.Y. and Y.H.; formal analysis, J.W. and X.Y.; investigation, X.Y. and Y.H.; resources, X.Y.; data curation, X.Y.; writing—original draft preparation, X.Y.; writing—review and editing, J.W. and M.D.; visualization, X.Y.; supervision, J.W. and X.Y.; project administration, J.W. and M.D.; funding acquisition, J.W. All authors have read and agreed to the published version of the manuscript.
Funding
This project is supported by the National Natural Science Foundation of China (Grant No. 32160721) to Jin-fen Wen of Kunming University of Science and Technology.
Data Availability Statement
All available data are presented in the manuscript.
Conflicts of Interest
The authors declare no conflict of interest.
References
- Park, C.J.; Seo, Y.S. Heat shock proteins: A review of the molecular chaperones for plant immunity. Plant Pathol. J. 2015, 31, 323–333. [Google Scholar] [CrossRef]
- Haq, U.S.; Khan, A.; Ali, M. Heat shock proteins: Dynamic biomolecules to counter plant biotic and abiotic stresses. Int. J. Mol. Sci. 2019, 20, 5321. [Google Scholar] [CrossRef] [PubMed]
- Boston, R.S.; Viitanen, P.V.; Vierling, E. Molecular chaperones and protein folding in plants. Plant Mol. Biol. 1996, 32, 191–222. [Google Scholar] [CrossRef] [PubMed]
- Wang, W.X.; Vinocur, B.; Shoseyov, O. Role of plant heat-shock proteins and molecular chaperones in the abiotic stress response. Trends Plant Sci. 2004, 9, 244–252. [Google Scholar] [CrossRef] [PubMed]
- Kiang, J.G.; Tsokos, G.C. Heat shock protein 70 kDa: Molecular biology, biochemistry, and physiology. Pharmacol. Ther. 1998, 80, 183–201. [Google Scholar] [CrossRef]
- Dragovic, Z.; Broadley, S.A.; Shomura, Y. Molecular chaperones of the HSP110 family act as nucleotide exchange factors of HSP70s. EMBO J. 2006, 25, 2519–2528. [Google Scholar] [CrossRef]
- Hartl, F.U.; Bracher, A.; Hayer-Hartl, M. Molecular chaperones in protein folding and proteostasis. Nature 2011, 475, 324–332. [Google Scholar] [CrossRef]
- Lin, B.L.; Wang, J.S.; Liu, H.C. Genomic analysis of the HSP70 superfamily in Arabidopsis thaliana. Cell Stress Chaperones 2001, 6, 201–208. [Google Scholar] [CrossRef]
- Sarkar, N.K.; Sharma, P.; Grover, A. Functional analysis of HSP70 superfamily proteins of rice (Oryza sativa). Cell Stress Chaperones 2013, 18, 427–437. [Google Scholar] [CrossRef]
- Du, Q.L.; Jiang, J.M.; Chen, M.Q. Cloning, expression analysis and prokaryotic expression of heat shock protein HSP70 gene in rice. J. Plant Prot. 2021, 48, 620–629. [Google Scholar]
- Zhang, L.; Zhao, H.K.; Dong, Q.L. Genome-wide analysis and expression profiling under heat and drought treatments of HSP70 gene family in soybean (Glycine max L.). Front. Plant Sci. 2015, 6, 773. [Google Scholar] [CrossRef]
- Rehman, A.; Atif, R.M.; Qayyum. Genome-wide identification and characterization of HSP70 gene family in four species of cotton. Genomics 2020, 112, 4442–4453. [Google Scholar] [CrossRef] [PubMed]
- Song, J.H.; Ma, H.L.; Weng, Q.Y. Genome-wide identification and analysis of HSP70 gene family in maize. J. Nucl. Agric. Sci. 2017, 31, 1245–1254. [Google Scholar]
- Li, Y. Genome-wide identifcation and analysis of the WRKY gene family and cold stress response in Acer truncatum. Genes 2021, 12, 1867. [Google Scholar] [CrossRef]
- Li, M.Y.; Liu, J.X.; Hao, J.N. Genomic identification of HSP70 transcription factors and functional characterization of two cold resistance-related HSP70 genes in celery (Apium graveolens L.). Planta 2019, 250, 1265–1280. [Google Scholar] [CrossRef]
- Chen, S.B.; Tao, L.Z.; Zeng, L.R.; Vega-Sanchez, M.E.; Umemura, K.; Wang, G.L. A highly efficient transient protoplast system for analyzing defence gene expression and protein-protein interactions in rice. Mol. Plant Pathol. 2006, 7, 417–427. [Google Scholar] [CrossRef] [PubMed]
- Sakuma, Y.; Maruyama, K.; Qin, F. Dual function of an Arabidopsis transcription factor DREB2A in water-stress-responsive and heat-stress-responsive gene expression. Proc. Natl. Acad. Sci. USA 2006, 103, 18822–18827. [Google Scholar] [CrossRef]
- Wu, D.; Zhang, K.; Li, C.Y.; Xie, G.W.; Lu, M.T.; Qian, Y.; Shu, Y.P.; Shen, Q. Genome-wide comprehensive characterization and transcriptomic analysis of HSP70 gene family revealed its role in seed oil and ALA formation in perilla (Perilla frutescens). Gene 2023, 889, 147808. [Google Scholar] [CrossRef]
- Hu, W.J. Genome-wide identifcation and analysis of WRKY gene family in maize provide insights into regulatory network in response to abiotic stresses. BMC Plant Biol. 2021, 21, 427. [Google Scholar] [CrossRef]
- Yuan, H.M. Genome-wide identifcation and expression analysis of the WRKY transcription factor family in fax (Linum usitatissimum L.). BMC Genom. 2021, 22, 375. [Google Scholar] [CrossRef]
- Horton, P. WoLF PSORT: Protein localization predictor. Nucleic Acids Res. 2007, 35, W585–W587. [Google Scholar] [CrossRef]
- Swarbreck, D. Te Arabidopsis Information Resource (TAIR): Gene structure and function annotation. Nucleic Acids Res. 2008, 36, D1009–D1014. [Google Scholar] [CrossRef] [PubMed]
- Kumar, S. MEGA X: Molecular evolutionary genetics analysis across computing platforms. Mol. Biol. Evol. 2018, 35, 1547–1549. [Google Scholar] [CrossRef]
- Gao, S.Q. Genome-wide identifcation of the histone acetyltransferase gene family in Triticum aestivum. BMC Genom. 2021, 22, 49. [Google Scholar] [CrossRef] [PubMed]
- Viana, V.E. When rice gets the chills: Comparative transcriptome profling at germination shows WRKY transcription factor responses. Plant Biol. 2021, 23, 100–112. [Google Scholar] [CrossRef] [PubMed]
- Lescot, M. PlantCARE, a database of plant cis-acting regulatory elements and a portal to tools for in silico analysis of promoter sequences. Nucleic Acids Res. 2002, 30, 325–327. [Google Scholar] [CrossRef]
- Wang, Y.P. MCScanX: A toolkit for detection and evolutionary analysis of gene synteny and collinearity. Nucleic Acids Res. 2012, 40, e49. [Google Scholar] [CrossRef]
- Wang, Y.Y. Genome-wide ldentifcation and expression analysis of NF-YA gene family in gossypium arboreum. Mol. Plant Breed 2021, 19, 4564–4573. [Google Scholar]
- Szklarczyk, D. Te STRING database in 2021: CustomizaRhe protein-protein networks, and functional characterization of user-uploaded gene/measurement sets. Nucleic Acids Res. 2021, 49, D605–D612. [Google Scholar] [CrossRef]
- Doncheva, N.T. Cytoscape StringApp: Network analysis and visualization of proteomics data. J. Proteome Res. 2019, 18, 623–632. [Google Scholar] [CrossRef]
- Chen, C.J.; Chen, H.; Zhang, Y. Tbtools—An integrative toolkit developed for interactive analyses of big biological data. Mol. Plant 2020, 13, 1194–1202. [Google Scholar] [CrossRef] [PubMed]
- Chen, E.L.; Fan, Z.Y.; Wang, S.F. Bioinformatics of tobacco (Nicotiana tabacum) HSP70 gene family and expression analysis of NtHSP70Chl in midrib. Chin. Tob. Sci. 2018, 39, 8–16. [Google Scholar]
- Liu, J.; Pang, X.; Cheng, Y. The HSP70 gene family in solanum tuberosum: Genome-wide identification, phylogeny, and expression patterns. Sci. Rep. 2018, 8, 16628. [Google Scholar]
- Song, G.; Fang, Z.G.; Wang, Y.L. Genome-wide identification and bioinformatics analysis of HSP70 family genes in switchgrass. Pratacultural Sci. 2022, 39, 2112–2126. [Google Scholar]
- Zhang, G.W.; Liu, L.L.; Wang, X.R. Genome-wide identification and bioinformatics analysis of HSP70 genes in foxtail millet. Acta Agric. Zhejiangensis 2015, 27, 1127–1133. [Google Scholar]
- ElBaidouri, M.; Murat, F.; Veyssiere, M. Reconciling the evolutionary origin of bread wheat (Triticum aestivum). New Phytol. 2017, 213, 1477–1486. [Google Scholar] [CrossRef] [PubMed]
- Altenhoff, A.M.; Studer, R.A.; Robinson-Rechavi, M.; Dessimoz, C. Resolving the ortholog conjecture: Orthologs tend to be weakly, but significantly, more similar in function than paralogs. PLoS Comput. Biol. 2012, 8, e1002514. [Google Scholar] [CrossRef]
- Liu, M.Y.; Ma, Z.T.; Sun, W.J.; Huang, L.; Wu, Q.; Tang, Z.Z.; Bu, T.L.; Li, C.L.; Chen, H. Genome-wide analysis of the NAC transcription factor family in Tartary buckwheat (Fagopyrum tataricum). BMC Genom. 2019, 20, 113. [Google Scholar] [CrossRef]
- Zhou, S.S.; Xing, Z.; Liu, H. In-depth transcriptome characterization uncovers distinct gene family expansions for Cupressus gigantea important to this long-lived species’ adaptability to environmental cues. BMC Genom. 2019, 20, 213. [Google Scholar] [CrossRef]
- Jiang, C.; Bi, Y.; Zhang, R.; Feng, S. Expression of RcHSP70, heat shock protein 70 gene from Chinese rose, enhances host resistance to abiotic stresses. Sci. Rep. 2020, 10, 2445. [Google Scholar] [CrossRef]
- Yu, C.; Rong, M.; Liu, Y.; Sun, P.; Xu, Y.; Wei, J. Genome-Wide Identification and Characterization of HSP70 Gene Family in Aquilaria sinensis (Lour.) Gilg. Genes 2022, 13, 8. [Google Scholar] [CrossRef] [PubMed]
- Jin, Z.; Chandrasekaran, U.; Liu, A. Genome-wide analysis of the Dof transcription factors in castor bean (Ricinus communis L.). Genes Genom. 2014, 36, 527–537. [Google Scholar] [CrossRef]
- Jeffares, D.C.; Penkett, C.J.; Bähler, J. Rapidly regulated genes are intron poor. Trends Genet. 2008, 24, 375–378. [Google Scholar] [CrossRef] [PubMed]
Disclaimer/Publisher’s Note: The statements, opinions and data contained in all publications are solely those of the individual author(s) and contributor(s) and not of MDPI and/or the editor(s). MDPI and/or the editor(s) disclaim responsibility for any injury to people or property resulting from any ideas, methods, instructions or products referred to in the content. |
© 2025 by the authors. Licensee MDPI, Basel, Switzerland. This article is an open access article distributed under the terms and conditions of the Creative Commons Attribution (CC BY) license (https://creativecommons.org/licenses/by/4.0/).