Article

Dynamics of Phytohormones in Persistent Versus Deciduous Calyx Development in Pear Revealed by Targeted Metabolomics

1
College of Horticulture and Forestry Science, Tarim University, Alar 843300, China
2
Tarim Basin Biological Resources Protection and Utilization Key Laboratory, Xinjiang Production and Construction Corps, Alar 843300, China
3
Southern Xinjiang Special Fruit Trees High-Quality, High-Quality Cultivation and Deep Processing of Fruit Products Processing Technical National Local Joint Engineering Laboratory, Alar 843300, China
*
Author to whom correspondence should be addressed.
These authors contributed equally to this work.
Horticulturae 2025, 11(6), 642; https://doi.org/10.3390/horticulturae11060642
Submission received: 6 May 2025 / Revised: 30 May 2025 / Accepted: 4 June 2025 / Published: 6 June 2025

Abstract

:
To calyx persistence in Korla fragrant pear (Pyrus sinkiangensis) significantly impacts fruit marketability, with persistent calyx causing up to 40% reduction in premium-grade fruit yield. Investigating the hormonal mechanisms underlying calyx abscission and persistent in Korla Fragrant Pear, we performed comprehensive phytohormone profiling using ultra-performance liquid chromatography-tandem mass spectrometry (UPLC-MS/MS; EXIONLC system coupled with SCIEX 6500 QTRAP+). Flowers from first-position (persistent-calyx) and fourth-position (deciduous-calyx) inflorescences were collected at six developmental stages (0–10 days after flowering). Fourteen endogenous hormones—ACC, ME-IAA, IPA, TZR, SA, IAA, ICA, IP, tZ, DHJA, ABA, JA-ile, cZ, and JA—were identified in the calyx during the flowering stage. The calyx abscission rate was significantly higher in the fourth position (79%) compared to the first position (32%). ACC and ABA are closely linked to abscission, with increased ACC at 0 DAF signaling early abscission and ABA accumulation accelerating late abscission at 8 DAF. Auxin exhibited spatiotemporal specificity, peaking in first-order flowers at 4–6 DAF, potentially inhibiting abscission by maintaining cell activity. Cytokinins generally decreased, while jasmonates significantly increased during the fourth-position anthesis stage 8–10 DAF, suggesting a role in stress-related senescence. By systematic analysis of the flowers at the first order (persistent calyx) and the fourth order (deciduous calyx) from 0 to 10 days after anthesis, we found three key stages of hormone regulation: early prediction stage (0–2 DAF), ACC accumulation at the fourth order was significantly higher than that at the first order at 0 days after anthesis, ACC accumulation at the early stage predicted abscission; During the middle maintenance stage (4–6 DAF), the accumulation of cytokinin decreased significantly, while the accumulation of IAA increased significantly in the first position (persistent calyx); Execution Phase (8–10 DAF), ABA reached its peak at 8 DAF, coinciding with the final separation time. JA played an important role in the late stage. Gibberellin was undetected, implying a weak association with calyx abscission. Venn diagram identified N6-(delta 2-Isopentenyl)-adenine (IP) in first-position flowers, which may influence calyx persistence or abscission. These findings elucidate hormone interactions in calyx abscission, offering a theoretical basis for optimizing exogenous hormone application to enhance fruit quality.

1. Introduction

The Korla fragrant pear (Pyrus sinkiangensis Yu.cv.), a cultivar of the Rosaceae family, is primarily found in the Korla and Aksu regions of the Xinjiang Uygur Autonomous Region in China [1]. Genetically, the Korla fragrant pear exhibits two distinct fruit types: those with a naturally abscission calyx, which develop into regularly shaped fruits with few stone cells and good flavor, and those with a persistent calyx, which have rough skin, abundant stone cells, large stones, reduced edible portions, and diminished aroma upon ripening [2,3]. The latter fruit type is less desirable for consumers, adversely impacting the commercial viability of the Korla fragrant pear industry [3].
Sepal abscission and persistence in Korla fragrant pear are influenced by multiple factors, including age, light, pruning, rootstock, pollination varieties, and inflorescence position [4,5,6]. Among these, phytohormones—particularly auxin (IAA), abscisic acid (ABA), and ethylene—play a central regulatory role by mediating cell separation processes in the abscission zone. Notably, hormone gradients are strongly influenced by inflorescence position [7], fruits in apical positions typically exhibit higher auxin flux, which suppresses ethylene biosynthesis and delays abscission, whereas basal fruits experience earlier hormone-mediated calyx detachment [8]. This positional effect creates a natural experimental system to compare abscising versus persistent calyx phenotypes under shared genetic and environmental conditions—a key rationale for our study design.
Plant hormones are critical to the regulation of plant growth, development, and stress responses [9]. Their complex signaling networks and crosstalk mechanisms make them crucial mediators of defense processes [10]. Plant hormones are typically classified into six major categories: auxin (IAA), cytokinin (CTK), gibberellin (GA), ethylene (ETH), abscisic acid (ABA), and brassinolide (BR) [11]. These natural, cyclic isoprenoid-derived compounds regulate plant growth, development, and responses to biotic and abiotic stresses through modulating nutrient transport [12,13,14,15]. Plant hormones are widely distributed throughout plant tissues and orchestrate various physiological processes [16]. They play a key role in the regulation of plant organs, with some hormones promoting organ abscission and others inhibiting this process [17].
Abscission-promoting hormones, such as ethylene, accelerate abscission by upregulating cell wall-degrading enzymes and increasing abscission zone sensitivity. On the other hand, abscisic acid induces abscission through reactive oxygen species (ROS) signaling and activation of hydrolases. Conversely, abscission-inhibiting hormones like auxin maintain organ attachment by suppressing ethylene biosynthesis and delaying abscission zone differentiation. Cytokinins counteract senescence signals and preserve cell viability in abscission processes. Furthermore, context-dependent regulators play a role in abscission. Gibberellins exhibit stage-specific effects, often inhibiting early abscission but promoting later stages. Brassinosteroids modulate abscission through crosstalk with ethylene signaling pathways.
Research indicates that IAA, riboside (ZR), GA3, and ABA regulate calyx abscission in Korla fragrant pear during flowering [18]. A correlation exists between sepal persistent and endogenous hormone levels in this species [19]. In a study by Hao et al. [20], higher floral positions were found to correlate with elevated sepal abscission rates, along with delayed initiation and peak periods of abscission. Quantification of four phytohormones—IAA, GA3, ABA, and ZR—revealed significant differences in their spatiotemporal distribution patterns, providing critical insights into calyx abscission mechanisms in Korla Fragrant Pear. Furthermore, during the calyx abscission process in Korla fragrant pear, significant heterogeneity exists between the abscission zone tissue and surrounding cells. The initial hormonal changes are typically confined to just a single or a few dozen specialized cells within the abscission zone, making the positional order and temporal progression of abscission critical regulatory factors [21]. Therefore, understanding the spatial distribution of hormones is very important. Building upon these findings, our study employs targeted metabolomics to systematically investigate the tripartite regulatory relationships among calyx morphology, inflorescence position, and hormonal dynamics.
Fruit tree metabolomics involves the systematic analysis of small molecule metabolites in specific organs, tissues, or cells through both qualitative and quantitative methods [22]. Existing hormone measurement methods such as gaschromatography, liquid chromatography, and mass spectrometry can well interpret the changes in plant hormone levels during organ abscission. However, the results obtained are actually the average hormone levels of hundreds or even thousands of cells, and they cannot provide precise localization analysis of hormones. Rather than isolating and identifying individual components, modern metabolomics employs omics techniques to monitor the dynamics of a comprehensive range of small molecule metabolites in particular tissues. Furch et al. [23] utilized liquid chromatography-mass spectrometry to study stress-related phytohormones such as salicylic acid (SA), ABA, JA, cis-2-oxo-phytodienoic acid (cis-OPDA), and (±)7-isojasmonic acid-l-isooxy acid (JA Ile) in the phloem and xylem of cucumber. Gas chromatography was applied to assess olive metabolism under varying irrigation rates, offering data for improved olive management [24].
LC-MS/MS (Liquid Chromatography-Tandem Mass Spectrometry) is a highly sensitive and specific analytical technique that combines the separation capability of liquid chromatography (LC) with the detection power of tandem mass spectrometry (MS/MS). It can be integrated with laser microdissection to achieve hormone localization in 200 μm abscission zone tissues, overcoming the bottleneck of traditional hormone-detection methods that lose spatial information [25]. Additionally, the absolute quantitative data obtained can be utilized for metabolic flux analysis [26]. When studying complex processes such as organ abscission, which involves the coordinated regulation of multiple hormones, LC-MS/MS provides spatiotemporal dynamic information at the molecular level that cannot be obtained through conventional techniques. In the case of Korla fragrant pear, the abscission zone of the calyx can be analyzed using LC-MS/MS to qualitatively and quantitatively determine phytohormone molecules. This enables a better understanding of the regulatory role of plant hormones in calyx abscission.
In this study, target metabolomics was used to absolutely quantify the endogenous hormones in the calyx tube of Korla fragrant pear during the flowering period, and the relationship between calyx abscission and endogenous hormone content in Korla fragrant pear during the flowering period was studied. A total of 24 metabolites were detected, and 14 metabolites related to the abscission of pear calyx were screened out. It provides a theoretical basis for artificially regulating the calyx abscission rate of Korla fragrant pear and scientifically spraying plant growth regulators to regulate the calyx abscission of Korla fragrant pear.

2. Materials and Methods

2.1. Test Site and Materials

The experimental site is situated in the pear orchard on the western side of Tarim University, Alar City, Xinjiang, China. The study focused on 23-year-old Korla fragrant pear trees grafted onto Pyrus betulifolia Bunge rootstock. During the flowering period (April to May), the average diurnal temperature ranged from 12 °C to 25 °C, with extreme highs reaching 30 °C. The average daily photosynthetic active radiation (PAR) was 1800–2200 μmol·m−2·s−1, and cumulative precipitation was <10 mm. The orchard is oriented north-south, employs flood irrigation, and is characterized by sandy loam soil. Conventional management practices are followed, with pear trees spaced 2 m by 4 m apart.

2.2. Sample Collection

The experiment was carried out in April 2019 at Tarim University, Alar City, Xinjiang. Twenty uniformly vigorous Korla fragrant pear trees were selected. Under natural conditions, 10 days after full bloom, the shedding rates of calyces at the first and fourth inflorescence positions (the abscised part being the abscission zone of the inflorescence) were statistically analyzed.
The study was conducted in April 2019 at Tarim University in Alar City, Xinjiang. Twenty Korla fragrant pear trees with uniform growth potential were investigated under natural conditions 10 days after full bloom. The abscission rates of sepals were examined at the first and fourth positions. The abscission rate of sepals at the fourth position was as high as 79%, significantly exceeding the 32% abscission rate observed at the first position (Figure 1). The abscission rate at the fourth position was 47% higher than that at the first position. Consequently, the majority of the first position produced persistent calyx fruit, while the fourth position predominantly yielded decalyx fruit.
Samples were collected on April 2, 4, 6, 8, 10, and 12, with 60 samples collected at each time point. The samples were placed in a freezer and transported to the laboratory, where they were frozen into a powder using liquid nitrogen and stored in an ultra-low-temperature refrigerator at −80 °C. The calyx tube (Abscission zone) was selected for metabolite detection, and the contents of 24 plant hormones were determined. Twelve groups of pear calyx samples were divided into groups A-0, A-2, A-4, A-6, A-8, A-10, B-0, B-2, B-4, B-6, B-8, and B-10, with five biological replicates per group (Table 1).
Sepal abscission rate (%) = fruit drop (fruit)/total fruit number (fruit) × 100%

2.3. Absolute Quantitative and Qualitative Analysis of Endogenous Hormones in Calyx

The absolute quantitative and qualitative determination of endogenous hormones in the calyx tube was commissioned by a qualified professional third-party testing agency Shanghai Baiqu Biomedical Technology Co., Ltd. (Shanghai, China) to complete (www.biotree.cn (accessed on 3 June 2025)).

2.4. Instrument and Equipment

The instruments required for the determination of metabolites include super high efficiency liquid phase (EXIONLC System, Sciex, Framingham, MA, USA), mass spectrometric (SCIEX 6500 QTRAP+), centrifuge (Heraeus Fresco17), Scale (BSA124S-CW), Grinder (JXFSTPRP-24), Pure Water Instrument (Clear D24 UV), Ultrasonic Instrument (YM-080S), Solid Phase Extractor (12 position), Diaphragm Vacuum Pump (GM-0.33A), SPE solid phase extraction small columns (Oasis ® PRiME HLB 1cc (30 mg)), chromatographic column (Waters ACQUITY UPLC CSH C18 (150 × 2.1 mm, 1.7 μm, Waters)).

2.5. Sample Treatment

The samples were ground into powder by freeze-drying. Then, a 25 mg aliquot of each individual sample was precisely weighed and was transferred to an Eppendorf tube. After the addition of 1000 μL of extract solution (50% acetonitrile in water, precooled at −40 °C, containing isotopically labelled internal standard mixture), the samples were vortexed for 30 s and sonicated for 5 min in the ice-water bath and homogenized at 40 Hz for 4 min. The homogenate and sonicate circle were repeated twice. After centrifugation (10 min, 12,000 rpm, and 4 °C), an 800 μL aliquot of the supernatant was further purified with SPE [27]. The SPE cartridges were washed with 1 mL of methanol, then equilibrated with 1 mL 50% ACN/H2O (v/v). After loading a sample (supernatant obtained following the procedure described above), the flow-through fraction was discarded. The cartridge was then rinsed with 1 mL of 60% ACN/H2O (v/v). After this single-step SPE, the samples were evaporated to dryness under a gentle stream of nitrogen and were reconstituted in 100 μL of 10% ACN/H2O (v/v). All the samples were vortexed for 30 s and sonicated for 5 min in the ice-water bath. After centrifugation (15 min, 12,000 rpm, and 4 °C), the clear supernatant was subjected to UHPLC-MS/MS.
The precision of the quantitation was measured as the relative standard deviation (RSD), determined by injecting analytical replicates of a QC sample. The accuracy of quantitation was measured as the analytical recovery of the QC sample determined. The percent recovery was calculated as [(mean observed concentration)/(spiked concentration)] × 100%. Table 2 lists the analytical recoveries and relative standard deviations of the QC samples, with five technical replicates. The recoveries determined were 86.0–113.1% for all the analytes, with all the RSDs below 7.3% (n = 5).

2.6. Preparation of the Standard Solution

Stock solutions were individually prepared by dissolving or diluting each standard substance to give a final concentration of 10 mmol/L. An aliquot of each of the stock solutions was transferred to a 10 mL flask to form a mixed working standard solution. A series of calibration standard solutions were then prepared by stepwise dilution of this mixed standard solution (containing isotopically labelled internal standard mixture in identical concentrations with the samples).
Least squares method was used for the regression fitting. 1/× weighting was applied in the curve fitting since it provided highest accuracy and correlation coefficient (R2). The level was excluded from the calibration if the accuracy of calibration was not within 80–120%.

2.7. Limit of Detection (LOD) and Limit of Quantitation (LOQ)

The calibration standard solution was diluted stepwise, with a dilution factor of 2. These standard solutions were subjected to UHPLC-MRM-MS analysis. The signal-to-noise ratios (S/N) were used to determine the lower limits of detection (LLODs) and lower limits of quantitation (LLOQs). The LLODs and LLOQs were defined as the analyte concentrations that led to peaks with signal-to-noise ratios (S/N) of 3 and 10, respectively, according to the US FDA guideline for bioanalytical method validation.

2.8. Flow Phase Conditions

The UHPLC separation was carried out using an EXIONLC System (Sciex, Framingham, MA, USA), equipped with a Waters ACQUITY UPLC CSH C18 column (150 × 2.1 mm, 1.7 μm, Waters). The mobile phase A was 0.01% formic acid in water, and the mobile phase B was 0.01% formic acid in acetonitrile. The column temperature was set at 50 °C. The auto-sampler temperature was set at 4 °C, the injection volume was 5 μL, and the flow rate was 0.35 mL/min.

2.9. Mass Spectrometric Conditions

A SCIEX 6500 QTRAP+ triple quadrupole mass spectrometer (Sciex), equipped with an IonDrive Turbo V electrospray ionization (ESI) interface, was applied for assay development. Typical ion source parameters were Curtain Gas = 40 psi, IonSpray Voltage = ±4500 V, temperature = 475 °C, Ion Source Gas 1 = 30 psi, Ion Source Gas 2 = 30 psi.
The MRM parameters for each of the targeted analytes were optimized using flow injection analysis, by injecting the standard solutions of the individual analytes, into the API source of the mass spectrometer. The additional transitions acted as ‘qualifier’ for the purpose of verifying the identity of the target analytes.

2.10. Venn Diagram

Venn diagrams were generated using the online tool InteractiVenn (http://www.interactivenn.net (accessed on 3 June 2025)) to visualize unique and shared hormones between flower positions. Three biological replicates per time point were included, with hormone presence defined as detection in ≥2 replicates at levels above the limit of quantification.

2.11. Data Analysis

In this test, all mass spectroscopic data collection and quantitative analysis of the target compounds were performed by SCIEX Analyst Work Station Software (Version 1.6.3) and Sciex MultiQuant™ 3.0.3.

2.12. Statistical Analysis

SPSS 19.0 software was used for statistical analysis of the data, and Origin 2019 was used for drawing. The difference between the two different treatments based on Tukey was significant (p < 0.05), and the difference between the groups was significant (p < 0.05).

3. Results

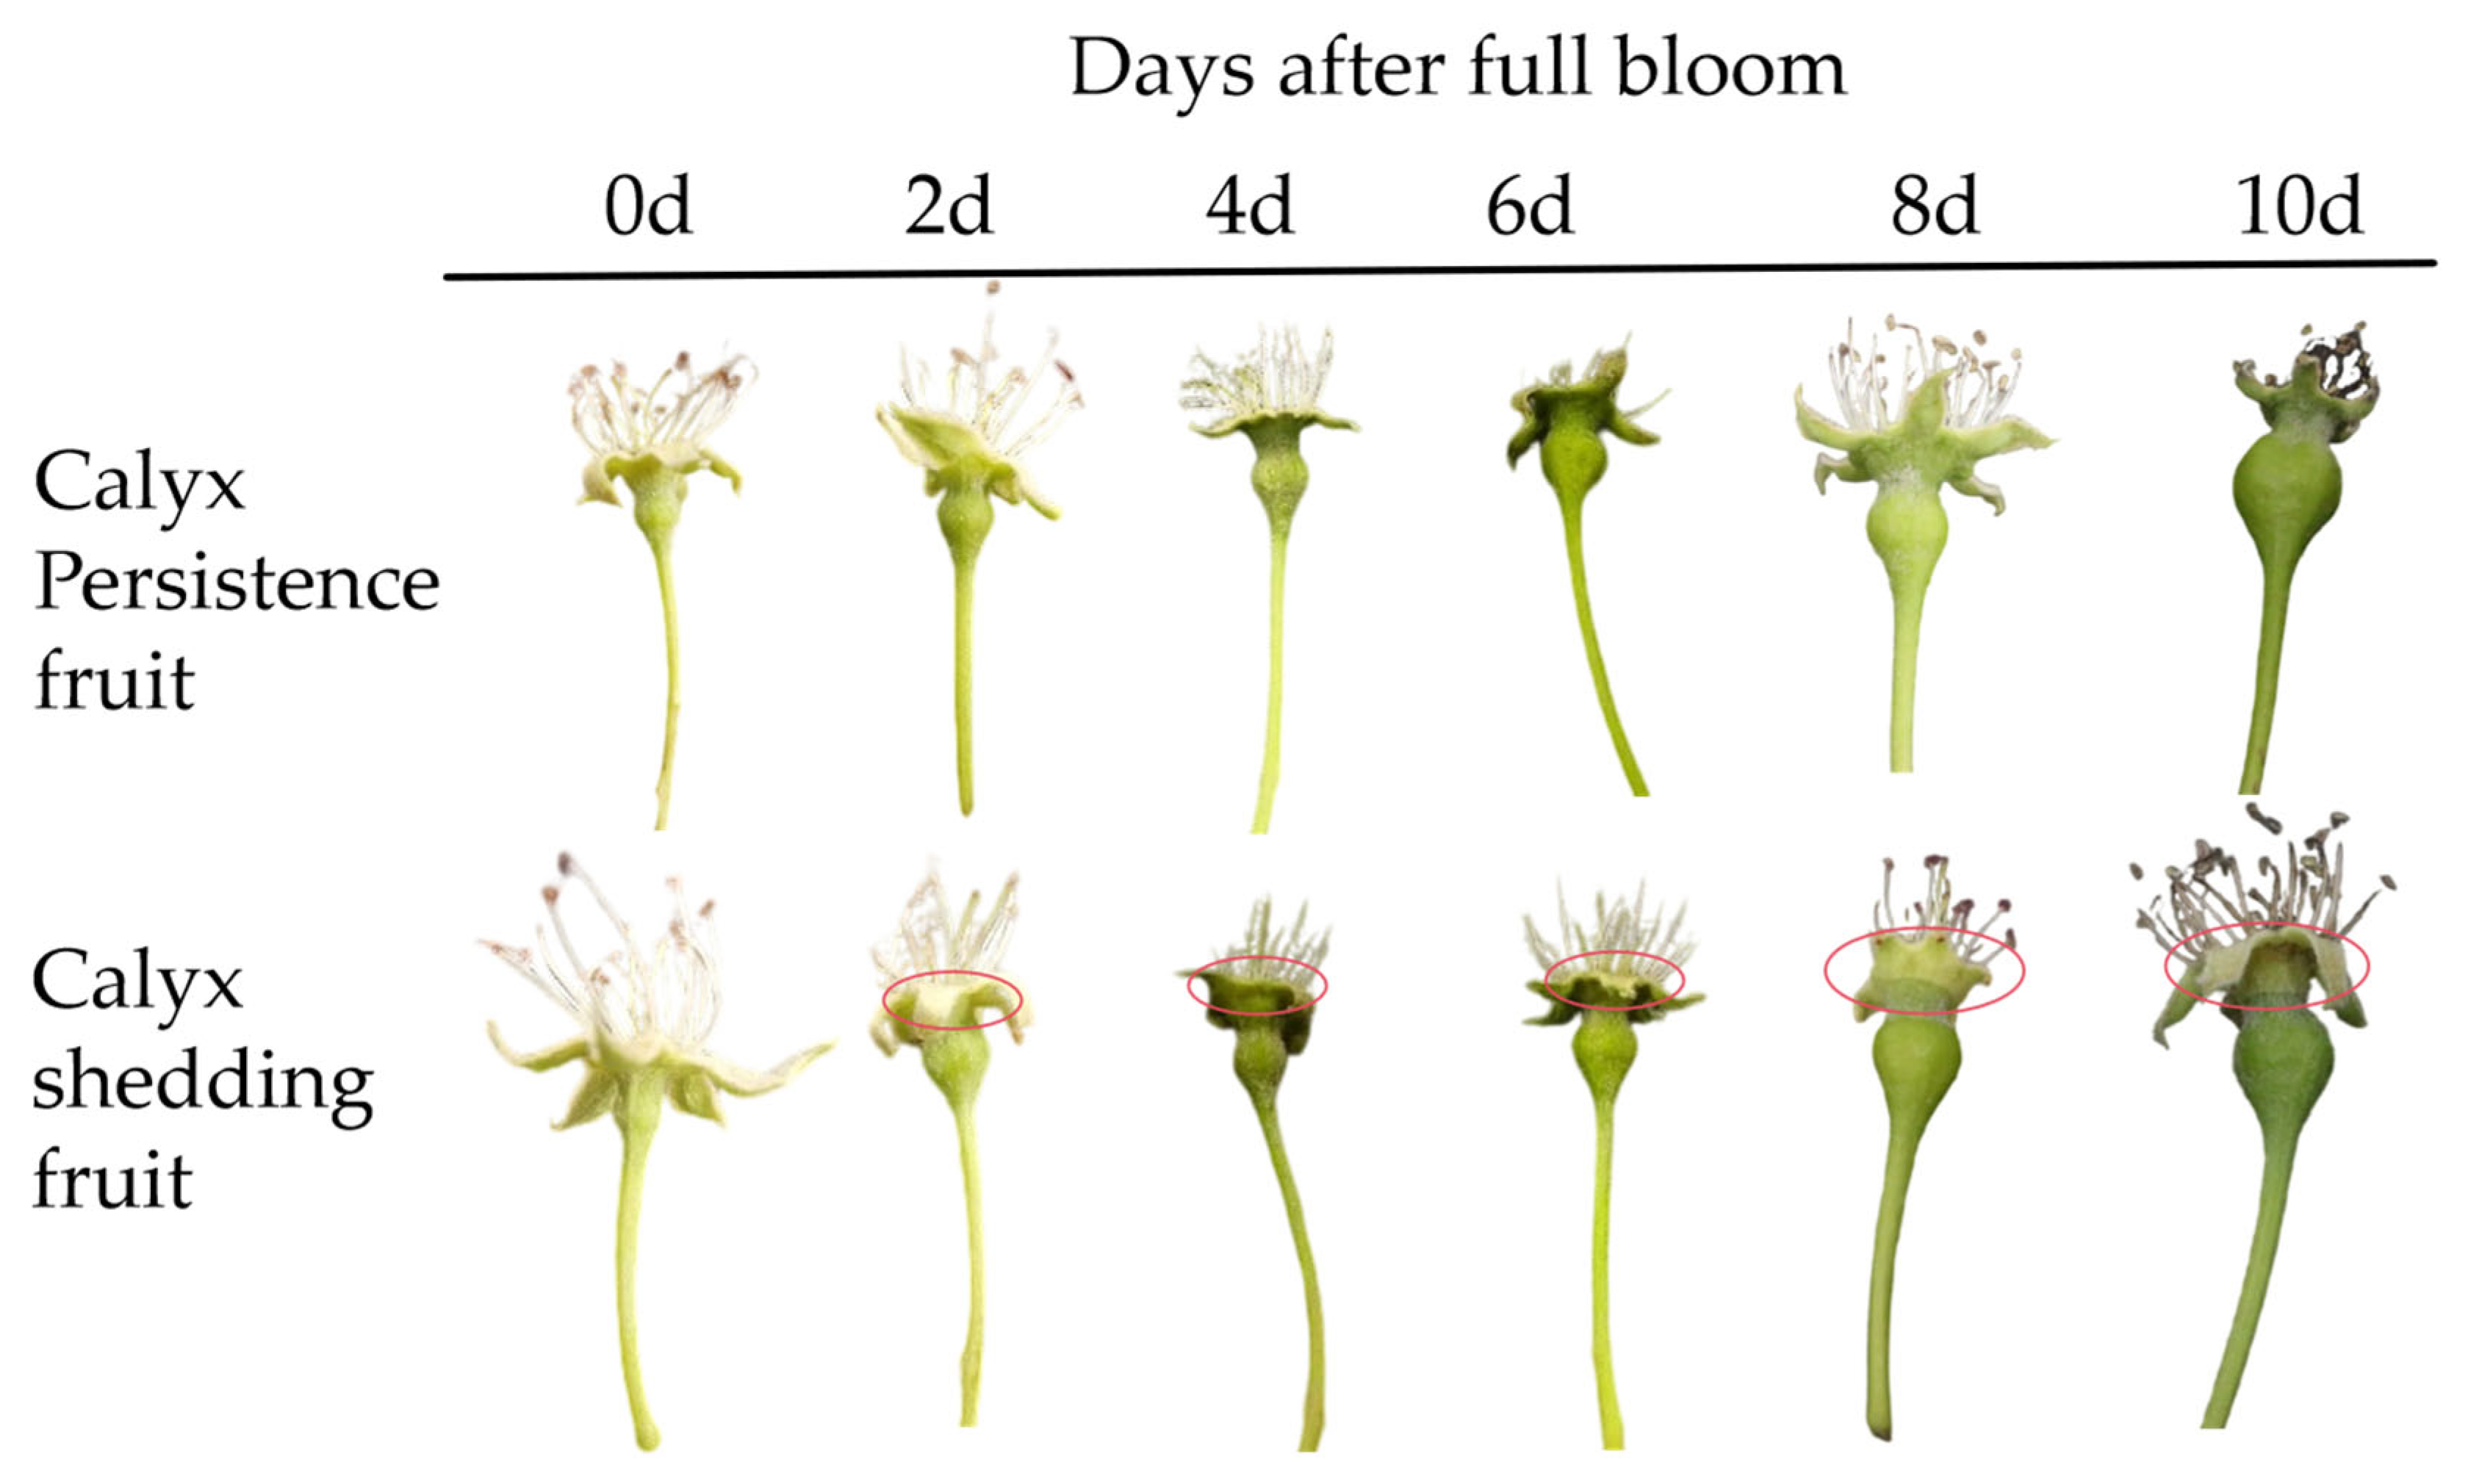
3.1. Appearance Morphological Characteristics of Different Position Sepals of Korla Fragrant Pear

Figure 2 illustrates the morphological changes in sepal development at various stages of persistent calyx and decalyx fruit in Korla fragrant pear. Over time, the calyx tube ofKorla fragrant pear becomes hard and thick, and there is no distinct abscission zone in the sepals. In contrast, the decalyx fruit shows no significant change on the day of flowering. However, a light yellow detachment layer appears in the sepal abscission zone between 2 and 6 days after flowering. By day 8, this layer becomes distinctly yellow, transitioning to yellow–gray by day 10.

3.2. Determination of Metabolic Groups of Calyx in Different Positions
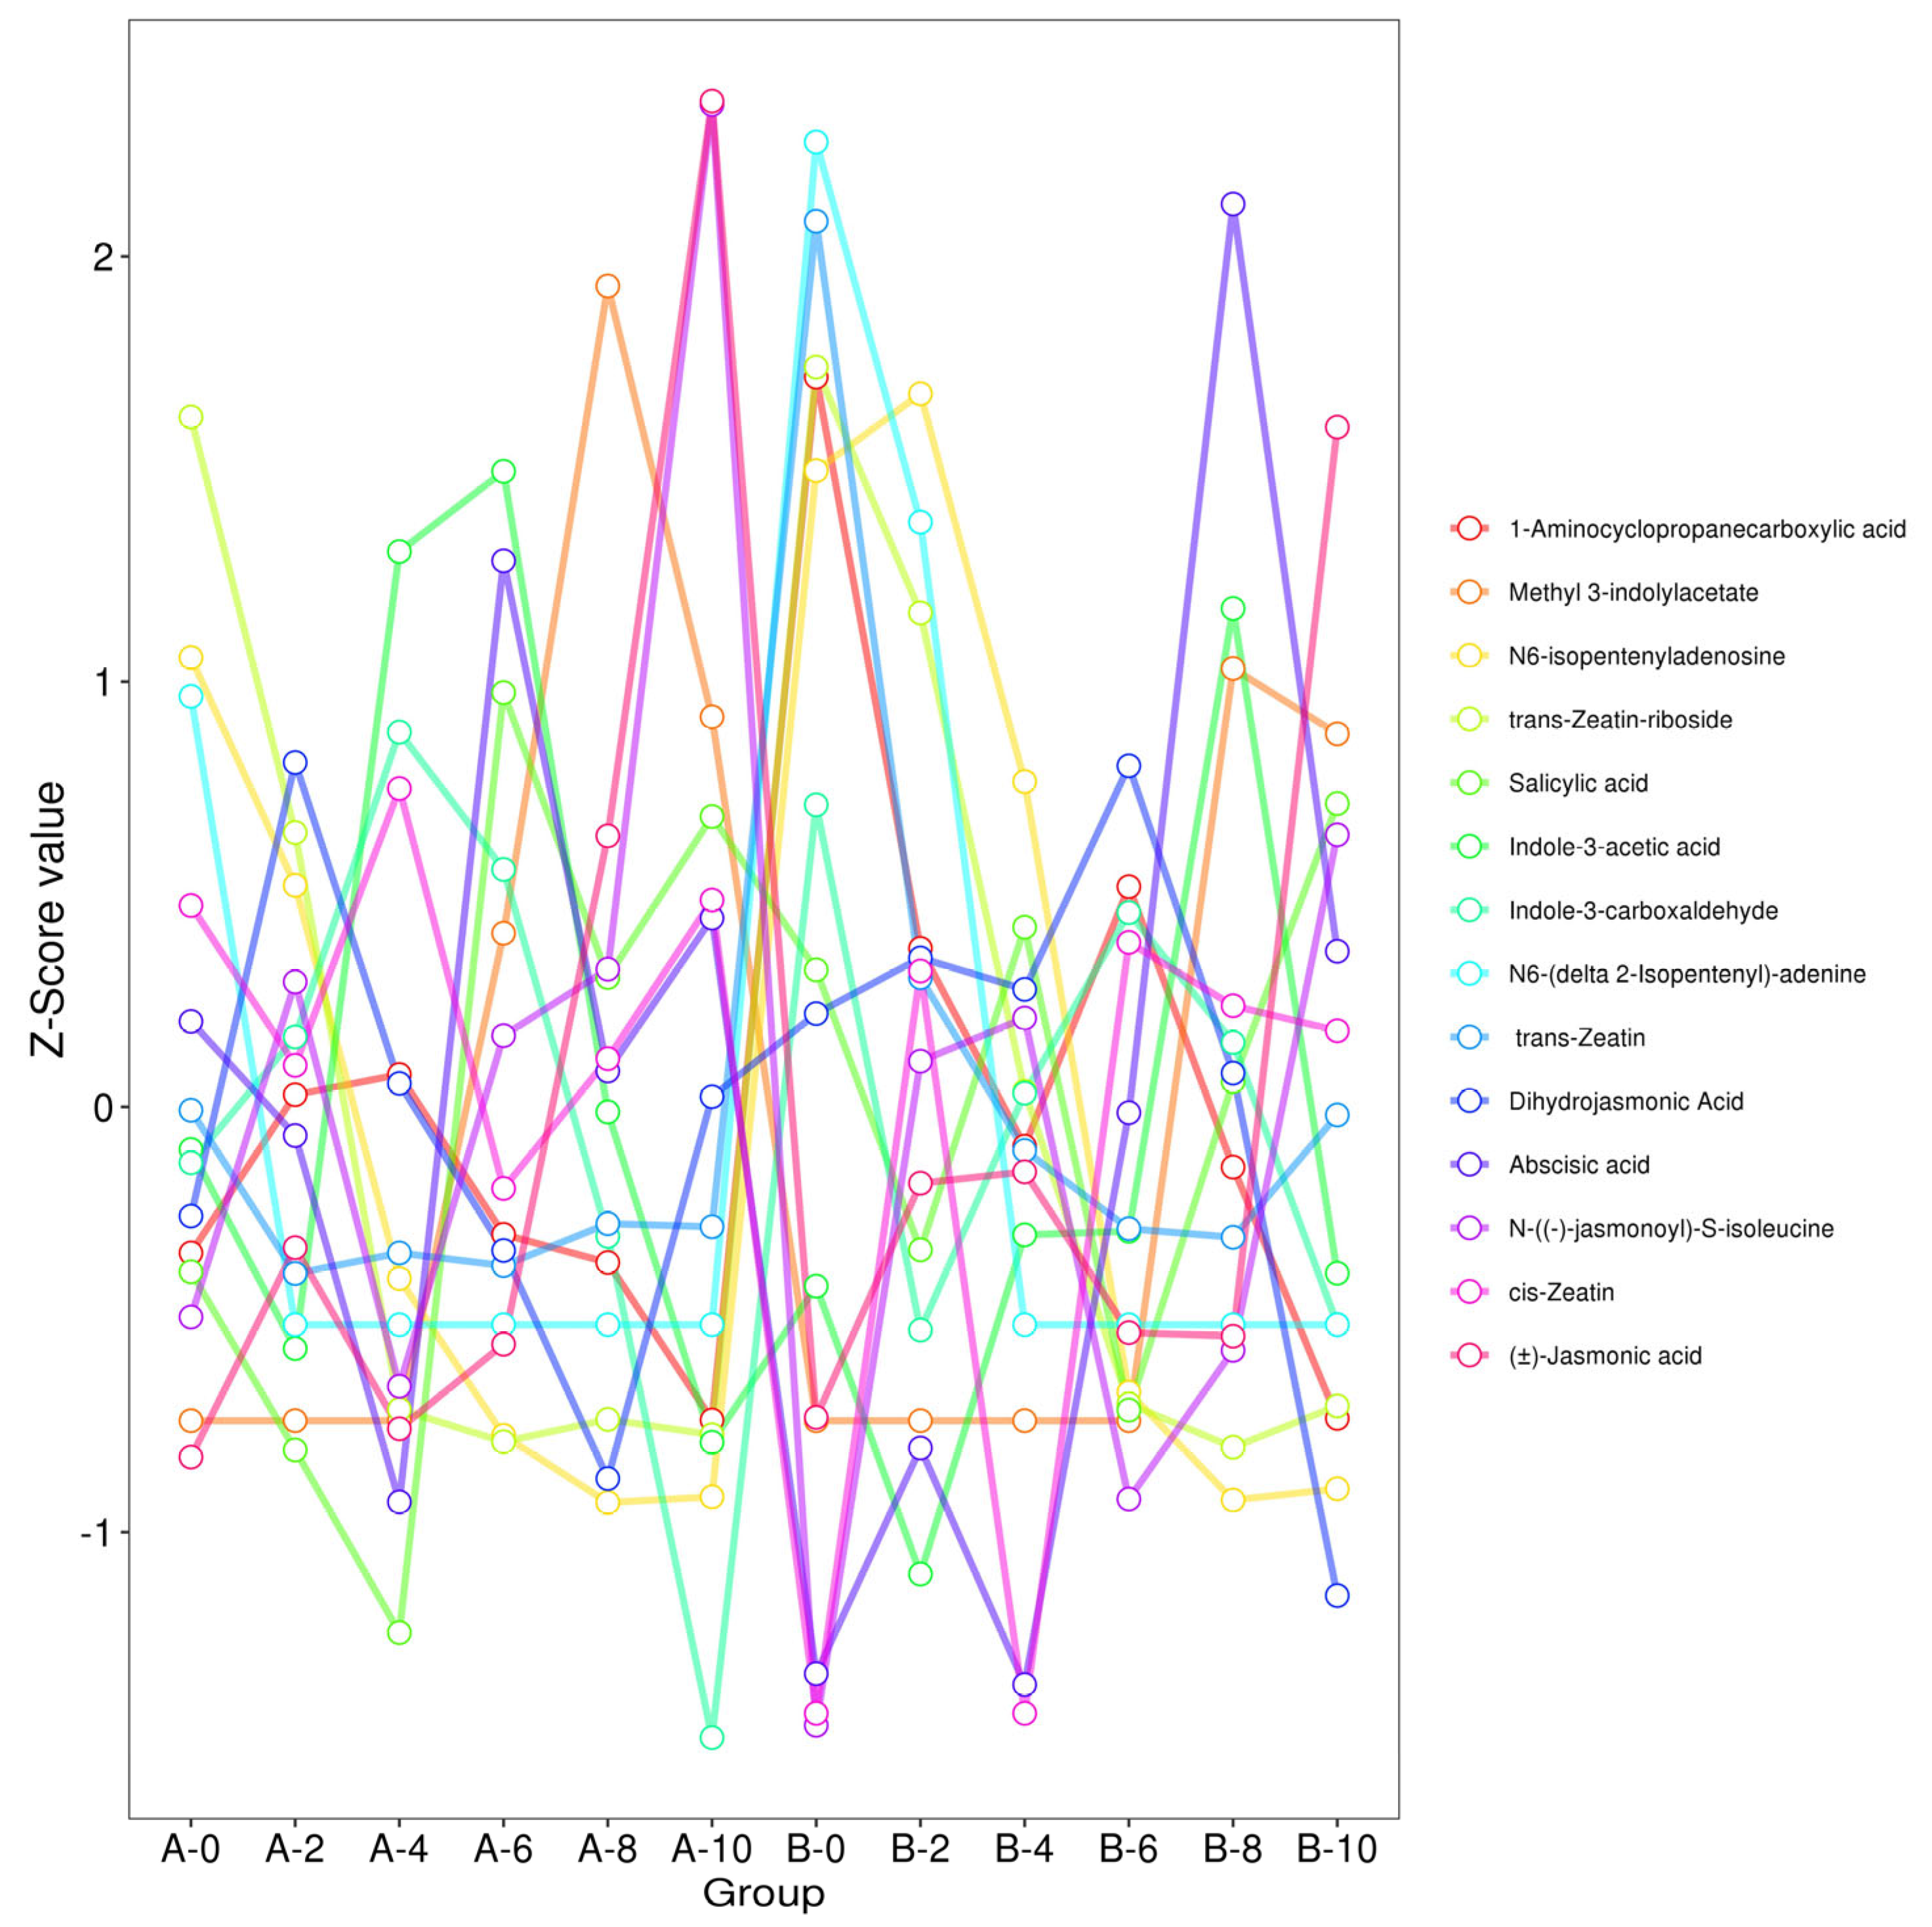
High-performance liquid chromatography-mass spectrometry (HPLC-MS) was employed for systematic analysis of the experimental samples, yielding 24 characteristic peaks in the initial chromatographic detection (Table 3). Subsequent persistent time and characteristic ion fragment analysis of control standards enabled the identification of 14 plant hormones, encompassing three major endogenous hormone groups: (1) auxins, IAA, Methyl 3-indolylacetate (ME-IAA), and indole-3-carboxaldehyde (ICA); (2) cytokinins, comprising N6-isopentenyladenosine (IPA), trans-zeatin-riboside (TRZ), IP, trans-zeatin (tZ), and cis-Zeatin (cZ); (3) defense-related hormones, such as jasmonates Dihydrojasmonic Acid (DHJA), JA-ile andJA, SA, ABA, and the ethylene precursor 1-aminocyclopropanecarboxylic acid (ACC).

3.3. Trend Analysis

The trend chart illustrates (Figure 3) the behavior of the same metabolite across different groups. Following Z-score transformation of the pretreated data, all metabolic trend changes were normalized, with each line representing a distinct metabolite. The analysis revealed that 98% of the standardized metabolic group data fell between −2 and 2, confirming data accuracy and indicating that the systematic error of LC-MS detection in this experiment was within a controllable range, re-examined all data points beyond, there was a difference in the metabolic trend between the first inflorescence after 10 days and the fourth inflorescence after 0 days.

3.4. Heat Map of Different Metabolites

Metabolite quantification values were derived using a Euclidean distance matrix, with metabolite clustering conducted via the complete linkage method, and results displayed as a thermogram (Figure 4). In the heatmap, color indicates the content level, with red representing high content and blue representing low content. The bands reveal distinct regions of high or low expression in the pericarp across various orders and stages, allowing for differentiation of treatment groups based on expression. In the first position, JA-Ile and JA peaked at 10 days post-anthesis, ME-IAA at 8 days, IAA at 6 days, while SA was lowest at 4 days and ICA at 10 days. In the fourth position, ACC, IPA, tZ, and TZR peaked at anthesis, ABA at 8 days, with CZ lowest at 4 and 10 days, and DHJA at 10 days. These findings indicate variations in metabolite types and contents in the pear calyx tube across different stages and positions.

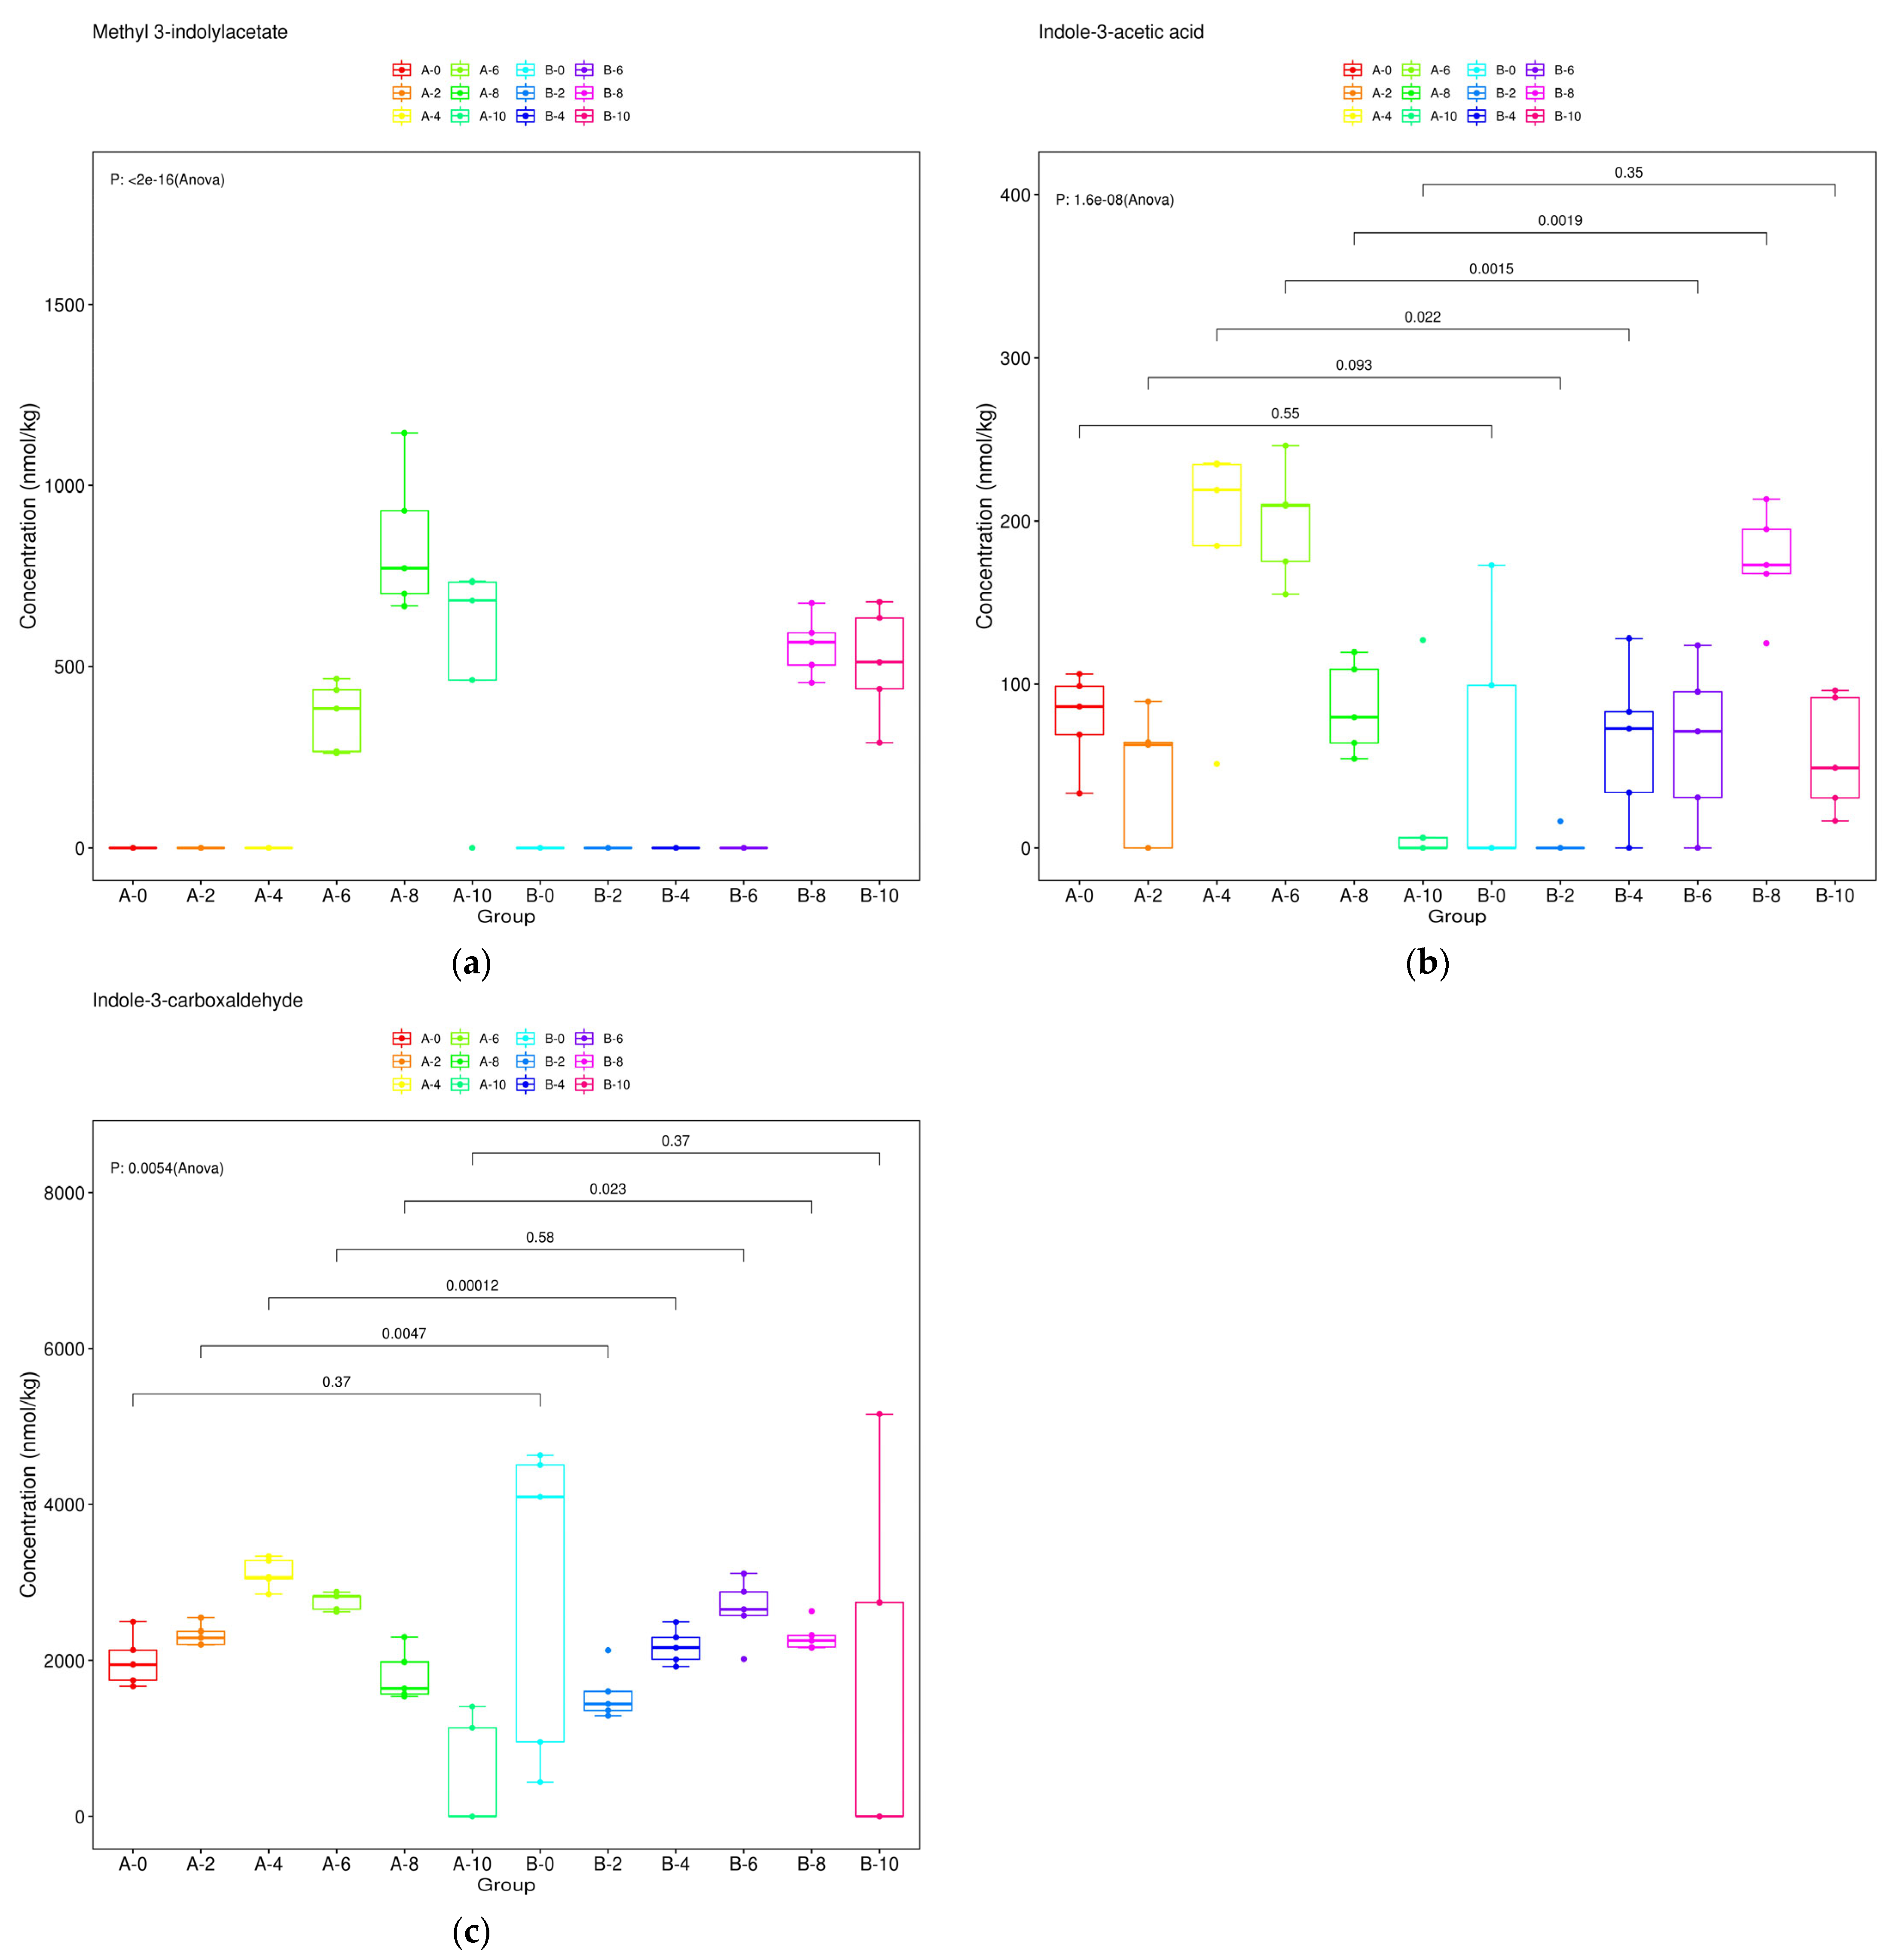
3.5. Dynamic Changes of Auxin Metabolites

The data presented in Figure 5 indicate that the fourth position of Korla fragrant pear exhibits a lower concentration of the ME-IAA metabolite compared to the calyx of the first position. At the position of the first position, no ME-IAA metabolite was detected from 0 to 4 days, but it appeared on the sixth day. The metabolite then displayed a trend of initial increase followed by a decrease from 6 to 10 days. In contrast, at the position of the fourth position, no ME-IAA metabolite was produced from 0 to 6 days, and it only appeared on the eighth day, followed by a decreasing trend from 8 to 10 days (Figure 5a). The content of the metabolite IAA in the first and fourth floral positions of Korla fragrant pear exhibited an initial increasing trend followed by a subsequent decrease. During the 0–2-day period, there was no significant difference between the two positions. However, on the second day, the metabolite content at the fourth floral position was 0. From days 2–6, the metabolite content at the first floral position was significantly higher than that at the fourth position, reaching a maximum of 199.23 nmol/kg. By day 8, the metabolite content at the fourth floral position had become significantly higher than that at the first position, peaking at 174.85 nmol/kg (Figure 5b). The metabolite ICA showed an initial increasing trend followed by a decreasing trend at the first floral position. At the fourth floral position, the metabolite content was higher on day 0. From days 2–10, the content exhibited an initial increasing trend followed by a decreasing trend. During days 2–4, the metabolite content at the first floral position was significantly higher than that at the fourth position. By day 8, the metabolite content at the first floral position was significantly lower than that at the fourth position. No significant differences were observed between the two positions for the other time points (Figure 5c).

3.6. Dynamic Changes of Cytokinin Metabolites

The metabolites of IPA in the first position of Korla fragrant pear exhibited a decreasing trend, while those in the fourth position displayed a similar decreasing pattern. Conversely, the metabolites of IPA showed an initial increasing trend followed by a subsequent decrease across all positions. During the 0–6-day period, the content of the metabolites at the fourth position was significantly higher than that at the first position, peaking at 734.24 nmol/kg on day 2, with no significant difference between the two thereafter (Figure 6a). IP metabolite content in both the first and fourth positions demonstrated an overall decreasing trend, with the highest level of 32.484 nmol/kg observed on day 0 in the first position. The metabolite content in the first position was 0 from days 2–10, while in the fourth position, it gradually decreased from day 0 to 2 and remained at 0 from days 4–10, with no significant difference between the two (Figure 6b). The TZR content in the first and fourth positions exhibited a decreasing trend over time, peaking at 0 days (Figure 6c). The tZ content in the fourth position was significantly higher than the first position at 2–6 days, but this relationship reversed at 8 days, with the first position content being significantly higher. The tZ content followed a similar pattern, with the fourth position reaching the highest level of 46.19 nmol/kg at 0 days (Figure 6d). The cZ content in the fourth position was significantly greater than the first at 2 and 10 days. The cZ content peaked at 8.33 nmol/kg in the first inflorescence position on day 10 (Figure 6e). The cZ content in the first position was significantly higher than the fourth at 0 and 4 days, during which the fourth position had no detectable cZ. No other significant differences were observed among the groups.

3.7. Dynamic Changes of Jasmonic Acid Metabolites

The metabolite content of DHJA and JA-Ile in the first and fourth positions of Korla fragrant pear exhibited distinct temporal patterns. DHJA levels in the first position increased initially, reaching a peak of 24.43 nmol/kg on day 2, before decreasing from day 4 to 8 and then increasing again on day 10. In contrast, DHJA content in the fourth inflorescence showed a decreasing trend from day 6 to 10, with a significantly higher level than the initial value observed on day 8, and the lowest content of 9.19 nmol/kg recorded on day 10 (Figure 7a). The content of JA-Ile in both the first and fourth inflorescences followed a trend of initial increase, followed by a decrease, and then a subsequent increase. At day 0, the JA-Ile content in the fourth inflorescence was significantly lower than that in the first inflorescence, but by day 0, the JA-Ile content in the fourth inflorescence was significantly higher than in the first inflorescence. At day 4, the JA-Ile content in the fourth inflorescence was significantly lower than in the first inflorescence, but this difference was reversed at days 6 and 10, with the fourth inflorescence reaching peak levels of 263.68 nmol/kg and 144.86 nmol/kg, respectively (Figure 7b). The content of JA metabolites in the first and fourth inflorescences exhibited a trend of initial increase, followed by decrease, and then a subsequent increase. On days 0 and 4, the metabolite levels in the fourth inflorescences were significantly higher than those in the first inflorescences. Conversely, on days 8 and 10, the metabolite content in the first inflorescences was significantly elevated compared to the fourth inflorescences, reaching a peak on day 10 at 3677.61 nmol/kg and 2836.20 nmol/kg, respectively (Figure 7c).

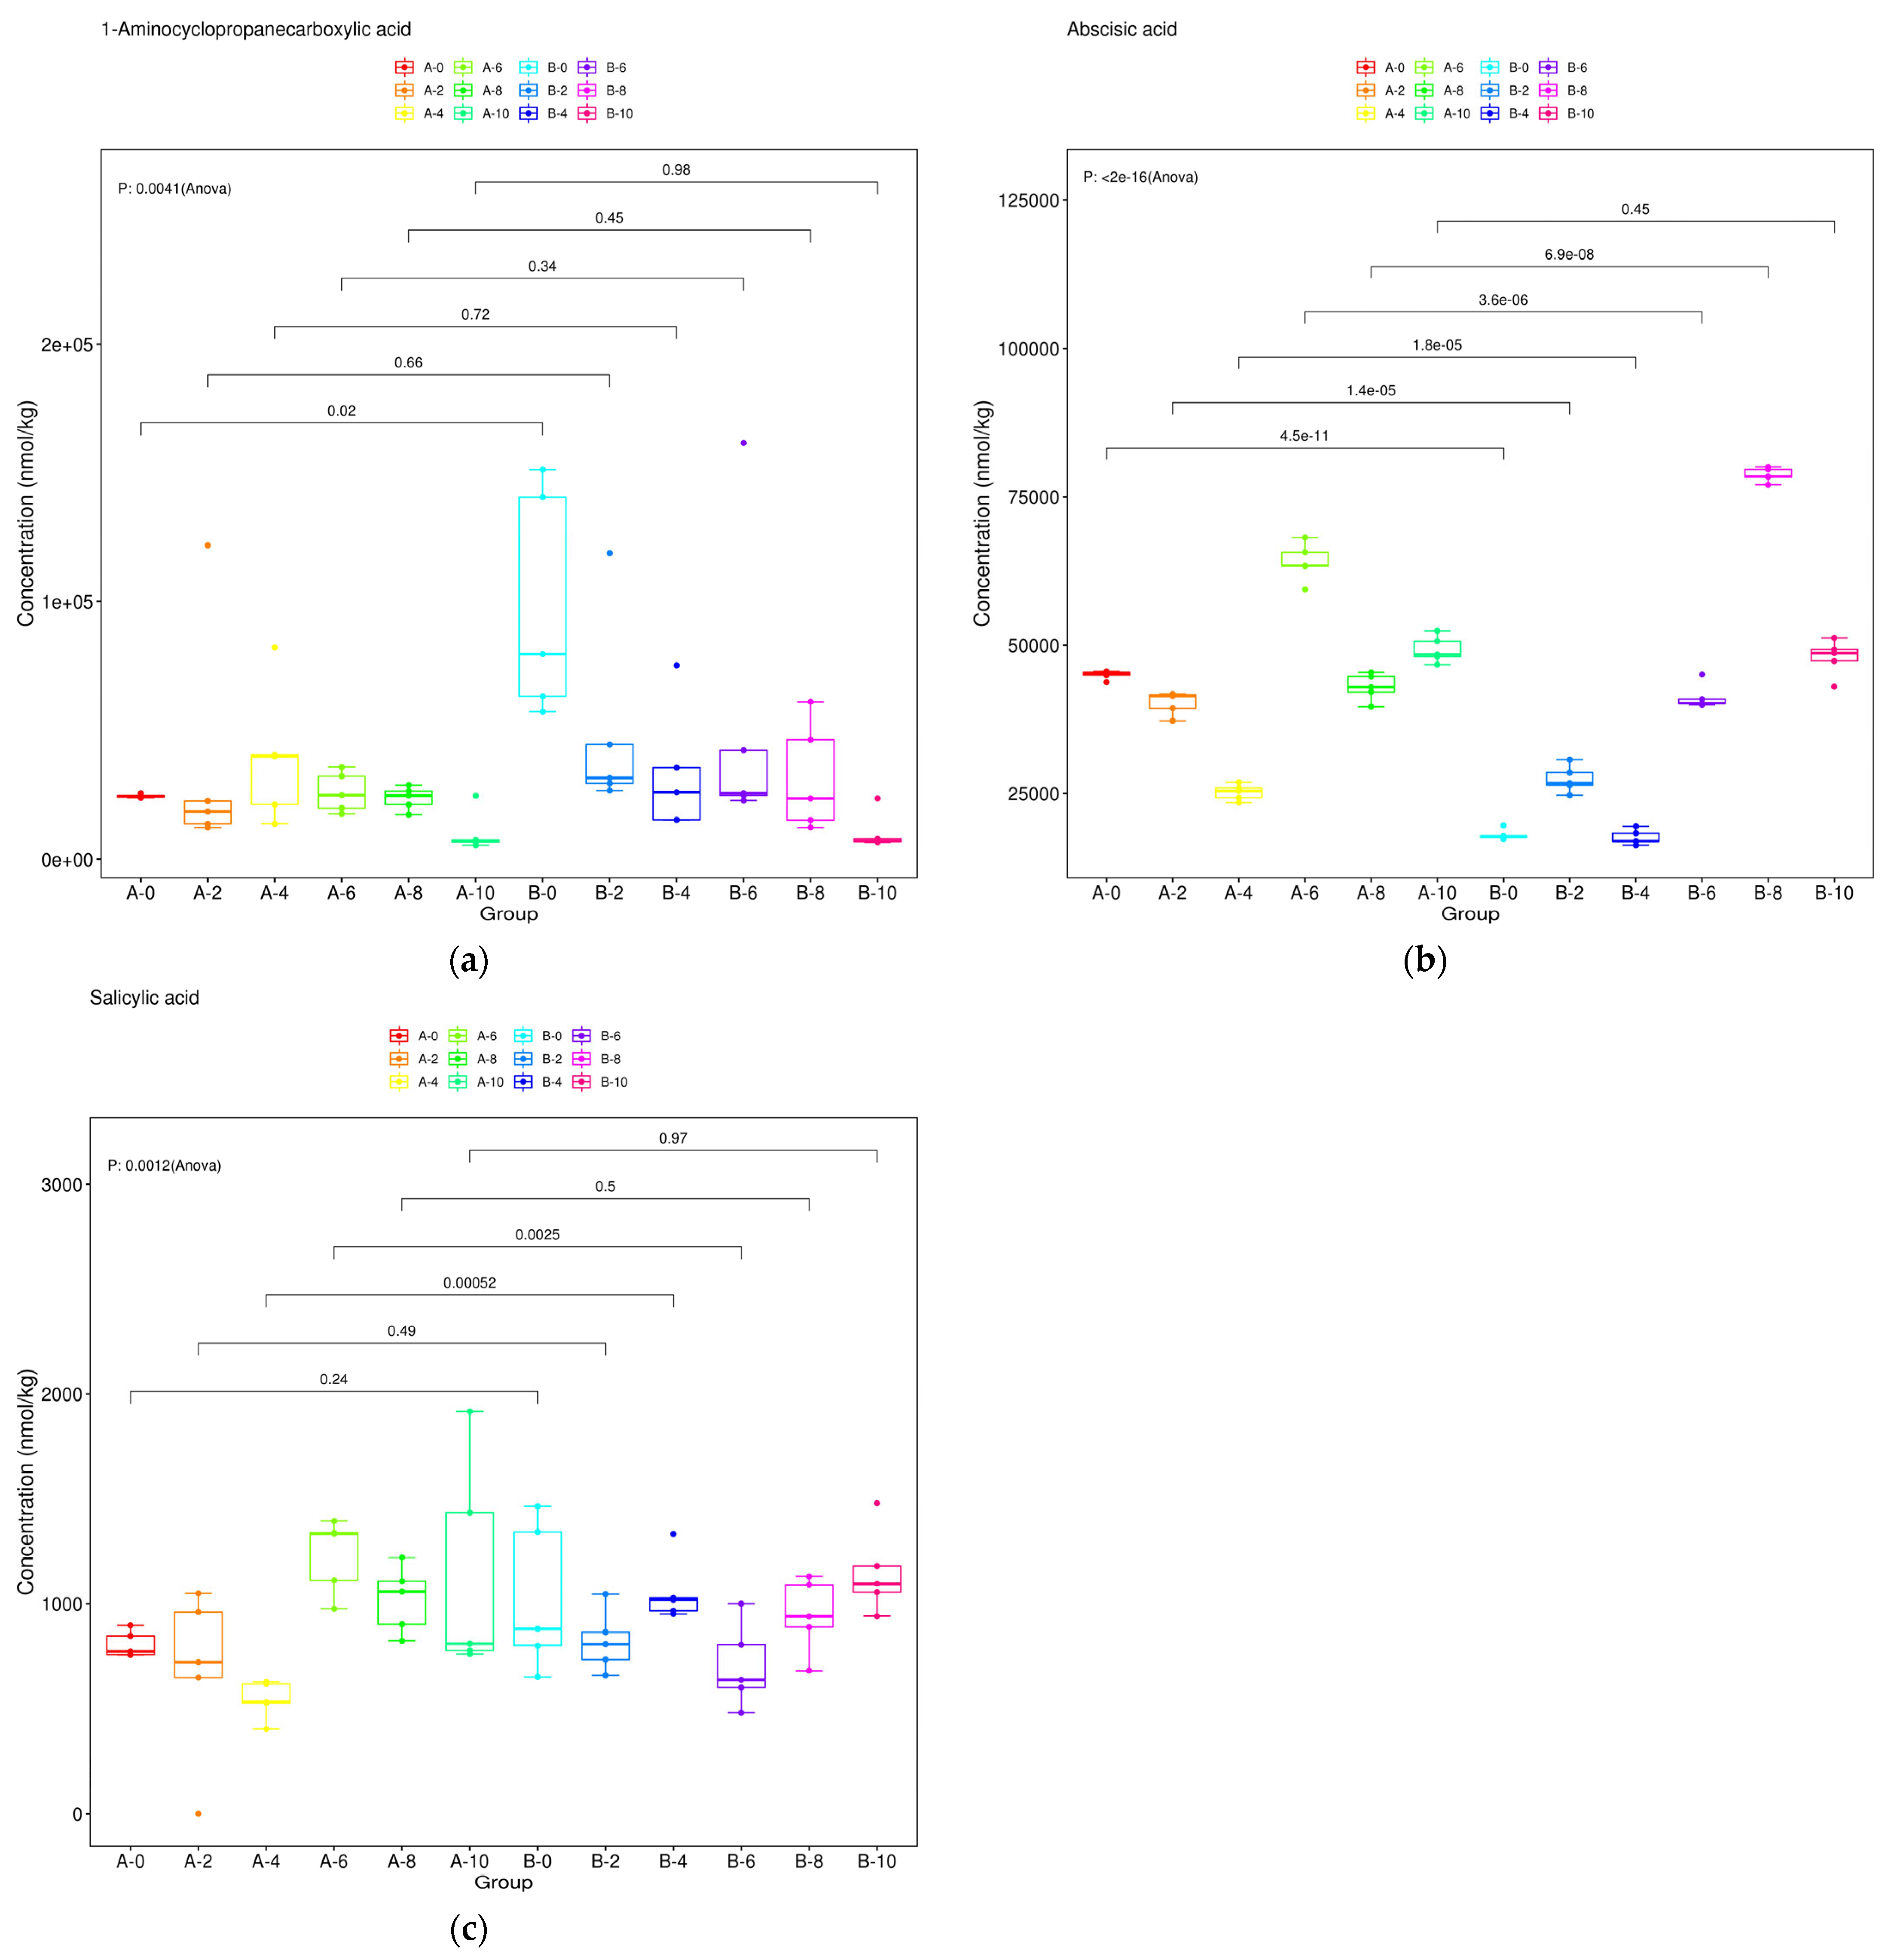
3.8. Dynamic Changes of Metabolites of Ethylene, Abscisic Acid and Salicylic Acid

The overall content of ACC metabolites decreased gradually. At the fourth inflorescence position, the metabolite content was significantly higher than at the first position on day, peaking at 98,377.81 nmol/kg. From days 2 to 10, no significant differences were observed between the first and fourth inflorescence positions (Figure 8a). ABA content in the first inflorescence decreased steadily from day 0 to day 4, peaking at 63,980.48 nmol/kg on day 6. Initially rising from day 0 to day 2, it then decreased sharply from day 4 to day 8, subsequently increasing rapidly in the fourth inflorescence. From day 0 to day 6, the metabolite content in the fourth inflorescence was significantly lower than in the first, reaching a minimum of 17,672.84 nmol/kg on day 4. The calyx tube content at the fourth level was significantly higher than at the first, peaking at 78,682.03 nmol/kg on day 8 (Figure 8b). The SA content exhibited a dynamic pattern across the development of the first and fourth inflorescences. During the initial 0–4 days of the first inflorescence, the metabolite content decreased, followed by a rapid increase at day 6. Subsequently, the metabolite content decreased again at days 8–10. A similar trend was observed in the fourth inflorescence, with a decrease in content at days 0–2, followed by an increase at days 6–10. Notably, at day 4, the SA content in the fourth inflorescence was significantly higher than that of the first inflorescence, while at day 6, the content in the fourth inflorescence was significantly lower than the first (Figure 8c). No other significant differences were observed between the remaining groups.

3.9. Metabolite Correlation Heatmap Across Different Floral Positions in Calyx Tissue

Correlation analysis (Figure 9) revealed the following significant relationships (p < 0.05): cZ showed a significant positive correlation with ABA, but a significant negative correlation with IPA.ME-IAA exhibited significant positive correlations with ABA, SA, JA-Ile, and JA, while displaying significant negative correlations with ICA, DHJA, IP, IPA, TZR, and ACC. ABA was significantly positively correlated with IAA, but significantly negatively correlated with IP, IPA, TZR, ACC, and tZ. SA demonstrated significant positive correlations with JA-Ile and JA, but a significant negative correlation with DHJA. JA-Ile showed a significant positive correlation with JA, but significant negative correlations with ICA, IP, IPA, TZR, ACC, and tZ. JA was significantly negatively correlated with IAA, ICA, DHJA, IP, IPA, TZR, and ACC. IAA exhibited a significant positive correlation with ICA, but significant negative correlations with IP, IPA, and TZR. ICA showed significant positive correlations with ACC and tZ. DHJA was significantly positively correlated with IPA.IP demonstrated significant positive correlations with IPA, TZR, ACC, and tZ. IPA showed significant positive correlations with TZR, ACC, and tZ. TZR was significantly positively correlated with ACC and tZ. ACC exhibited a significant positive correlation with tZ.

3.10. The Proportion of Different Metabolites in Calyx Targeted Metabolism Group at Different Stages

The metabolite profiles across samples exhibited marked variation. In the first inflorescence position, ETH levels increased from 0 to 4 days, peaking at 57.15%, before declining from 6 to 10 days. Conversely, ABA levels decreased from 0 to 4 days, then rose from 6 to 10 days, reaching a maximum of 74.90% at 10 days. JA showed a decline from 0 to 6 days, followed by an increase from 8 to 10 days, culminating in a peak of 6.02% at 10 days (Figure 10a). In the fourth position, ABA was initially low at 0 days but peaked at 74.04% by 10 days. ETH was predominant at 0 days, nearing 80.54%, but its proportion decreased over time. JA was minimal from 0 to 8 days, with a relative increase at 10 days, reaching 3.99%. SA remained minimal throughout the 0–10-day period (Figure 10b). Notably, ethylene was more prevalent in the fourth inflorescence than in the first during the early phase, while ABA and JA were more prominent in the later phase.

3.11. Venn Diagram Analyse

Figure 11 reveals that of the 14 detected metabolites, 12 are present at the first inflorescence position, including IP at 0 days (Figure 11a). This suggests these metabolites may uniquely influence sepal abscission. In contrast, the fourth inflorescence position contains 10 metabolites, but no distinct metabolites are observed across different time points (Figure 11b).

4. Discussion

4.1. Sequence-Specific Dynamics and Abscission Layer Differentiation of Auxin Metabolism

The abscission of floral organs is a complex process regulated by endogenous hormones [28]. The IAA encompasses biosynthesis, transport, degradation, and conjugation [29]. These processes are regulated through a highly dynamic network to maintain local concentration gradients, thereby precisely controlling plant developmental events (such as abscission layer differentiation) [30].
The timing of auxin metabolism is a critical factor in regulating sepal fate [26]. Patterns of methyl ester of ME-IAA accumulation differed significantly between the first and fourth inflorescence position (Figure 5a). The observed temporal divergence in auxin metabolism between the first and fourth inflorescences provides critical insights into how auxin homeostasis regulates organ abscission. A study combined with liquid chromatography-mass spectrometry analysis investigated the rapid metabolism process of auxin in Arabidopsis thaliana. Through analysis of the metabolic pathways at different time points, the dynamic changes of the auxin metabolic network were revealed. This result is similar to that of this study [31]. In the first inflorescence, ME-IAA synthesis began at 6 days after anthesis (DAA), reached a peak of 43.2 nmol/kg at 8 DAA, and then decreased gradually. In contrast, ME-IAA synthesis in the fourth inflorescence was delayed, peaking at 21.5 nmol/kg at 8 DAA and rapidly declining below the detection limit by 10 DAA. A study demonstrated that synthetic Me-IAA analogs can directly modulate root architecture through TIR1-independent pathways, suggesting additional layers of auxin regulation beyond classical degradation mechanisms [32].
This temporal difference aligns with morphological observations of abscission layer development (Figure 2): the fourth position exhibited a pale yellow abscission layer at 2–6 DAA, while the first position calyx tube continued to harden during this period without forming an abscission zone. This phenomenon may be caused by the low IAA level which removes the inhibition on the genes involved in ethylene synthesis (such as ACS and ACO), thereby promoting the ethylene burst and accelerating the programmed cell death of the abscission layer cells [33].
The ICA changes of indolepropionic acid further confirmed this mechanism (Figure 5c). First-order ICA accumulated significantly at 2–4 days after anthesis (DAA), while fourth-order ICA reached its maximum at 8 DAA. This reverse accumulation pattern suggests that the two inflorescences may regulate local auxin levels through differential degradation pathways [34]. In her research on brown algae, Aude Le Bail discovered that IAA might first be oxidized to intermediate products such as 2-oxindole-3-acetic acid (oxIAA),and then undergo further decarboxylation to form ICA [35]. Besides, ICA derivatives (such as indole-3-carboxaldehyde) can accelerate the synthesis of callose, while callose and the degradation of pectin/cellulose in the abscission zone cell wall may have spatiotemporal competition, affecting the efficiency of abscission [36].

4.2. Cytokinin Homeostasis Regulates Sepal Function Maintenance

The homeostatic regulation of cytokinin metabolism is crucial for sepal persistence [37]. Research has demonstrated that cytokinins play crucial roles in floral organ development, particularly in the formation and growth of sepals. The cytokinin signaling pathway regulates gene expression and hormonal homeostasis, thereby significantly influencing sepal morphology and function during their developmental process [38].
IPA, iP, TZR, tZ, and cZ interact through distinct biosynthetic pathways, transport mechanisms, and signaling cascades to regulate plant growth and development. tZ synthesized in the roots is transported via the xylem to the sepal abscission zone [39]. TZR is converted into active tZ by the action of LONELY GUY (LOG), enhancing cytokinin signaling. Both TZR and tZ collectively upregulate cellular activity in the abscission zone. Meanwhile, cZ locally accumulates and promotes the activity of cell wall-loosening enzymes [40]. CKX degrade iP and tZ, thereby attenuating inhibitory signals and allowing ABA and GA3 to dominate the abscission process [18].
Elevated levels of the active cytokinin IPA were maintained in the fourth sepal at 0–6 days after anthesis (Figure 6a). As an active cytokinin, IPA may temporarily inhibit abscission signal transduction by promoting cell proliferation in the abscission zone [41,42]. However, the specific molecular mechanism remains unclear, which will provide a reference for the subsequent experiments.
The rapid decline of IPA at 8–10 DAA in the fourth sepal coincided with the onset of chlorosis in the abscission zone, suggesting its function was limited to the early developmental stage. In contrast, the first sequence calyx tube accumulated cZ at 10 DAA (Figure 6e), while the fourth position did not detect cZ at this stage. Studies indicate that cZ can delay organ aging by enhancing cell wall stability and antioxidant capacity [30]. The specific accumulation of cZ in the first position correlates with the sepal persistence phenotype, suggesting cZ role in maintaining sepal structural integrity [31]. The metabolic transition from IPA to cZ (with IPA predominant in the fourth position and cZ appearing later in the first position) illustrates the adaptive selection of cytokinin forms. IPA is the precursor form of cytokinin and can be converted into the active free base iP through dephosphorylation or further hydroxylated to generate tZ. In Rosaceae plants, iPA may accumulate as an intermediate metabolite, especially in vascular tissues [40].
The biosynthesis of cZ is uniquely dependent on tRNA degradation pathways, resulting in a characteristically slow production rate that leads to its preferential accumulation during specific developmental transitions (organ maturation) or under particular stress conditions (nutrient deprivation) [43]. A notable example of this temporal regulation occurs during seed germination, where cZ initially predominates as the major cytokinin form but is systematically replaced by tZ as vegetative growth progresses, reflecting a developmental-stage-dependent shift in cytokinin homeostasis [40]. This metabolic transition suggests distinct physiological roles for these cytokinin isomers, with cZ potentially serving as a “stress-responsive” or “early-development-specific” signaling molecule, while tZ appears to function as the primary active form during sustained vegetative growth.

4.3. JA-ABA-Ethylene Synergistic Network Drives Terminal Segregation in the Abscission Zone

The synergistic interaction between JA and ABA drives cell separation in the abscission zone [44]. JA-Ile enhances the activity of ACS (ACC synthase), promoting the production of the ethylene precursor ACC, thereby amplifying the abscission signal [45].
A marked increase in JA and its active form, JA-Ile, occurs at 6–10 DAA (Figure 7b,c). This variation underscores the pivotal role of the JA signaling pathway, suggesting JA’s involvement in cell wall degradation by enhancing polygalacturonase (PG) and cellulase (CEL) expression or activity [46]. The peak of abscisic acid accumulation in the fourth sequence occurred 2 days earlier than that in the first sequence (Figure 8b). Early ABA bursts may synergize with JA to promote abscission by enhancing tissue sensitivity to ethylene [40,44,45,46,47,48].
ACC is the direct precursor for ethylene biosynthesis, and its generation and metabolism are key steps in ethylene regulation. Met is generated from SAM under the catalysis of ACC synthase, and then ACC is converted into ethylene by ACC oxidase [49]. In the fourth position, ACC accounted for 80.54% at 0 DAA (Figure 10b), while in the first position, ACC accounted for only 57.15%. Studies have shown that ABA induces the expression of the NCED (a key enzyme for ABA synthesis) gene, thereby increasing the endogenous ABA level. At the same time, it upregulates genes such as ACS/ACO involved in ethylene synthesis, forming a self-reinforcing cycle [50].
The ABA-ethylene positive feedback loop may have accelerated cell separation in the fourth position, while the first position maintained sepal connection by delaying ABA accumulation and ACC depletion [51].

4.4. Hierarchical Characteristics of Resource Allocation Policies

The metabolic resource allocation patterns of calyx tubes at different positions were significantly differentiated, reflecting the plant’s regulation of sink strength priority [52]. SA continued to accumulate in the first-order calyx tube, reaching a peak at 6 days after anthesis and remaining high at 10 DAA (Figure 8c). The sustained accumulation of SA may enhance sepal disease resistance by activating defense-related proteins (PRs) and ensuring the continuous transport of photosynthetic products to dominant fruits [53]. Furthermore, the first position synthesized an ultra-high concentration of JA at 10 DAA, further strengthening its defense investment. The fourth position redistributed resources via an ABA and ACC reduction. This metabolic adjustment likely channels limited resources to dominant sink organs, such as first-order fruits, while curtailing use by weaker sites through programmed abscission [54]. The sequential hierarchy in resource allocation serves as an optimization strategy for plants to adapt to competitive environments, potentially involving the cross-regulation of sucrose transporters (SUCs) and hormone signaling pathways [55].
The metabolites in this study can be classified into auxins, cytokinins, and abscisic acid. Regrettably, in early investigations of pear, ELISA was employed to detect GA in calyx tube [7]. However, this study did not yield positive results for the targeted detection of GA1, GA3, GA4, and GA7. This discrepancy may be attributed to several experimental factors: (1) Degradation of GA species during sample preparation; (2) Target GA isomer concentrations falling below the instrument’s detection limit; and (3) Inadequate resolution of GA congeners due to chromatographic separation conditions. These findings underscore the susceptibility of phytohormone detection to various factors, including extraction methods, detection technologies, and instrument sensitivity.

4.5. IP in Layer-Specificity

Cytokinins exhibit a well-documented antagonistic relationship with both ABA and ethylene during organ abscission processes [56]. Emerging evidence suggests IP plays a crucial role in maintaining auxin homeostasis within the AZ by coordinately upregulating auxin biosynthesis (via YUC gene family activation) while simultaneously inhibiting polar auxin transport (through modulation of PIN protein activity), thereby effectively suppressing abscission zone differentiation [57]. The current understanding of IP’s specific functions in organ abscission remains surprisingly limited, with the majority of existing data relying on indirect hormonal correlations rather than direct experimental evidence [58]. Consequently, comprehensive investigation employing advanced techniques such as CRISPR-Cas9-mediated gene editing and high-resolution spatiotemporal metabolomic profiling will be essential to precisely elucidate IP’s dynamic distribution and mechanistic roles within developing abscission zones.

5. Conclusions

This study employed targeted metabolomics to systematically investigate the endogenous hormonal regulation underlying calyx persistence and abscission in Korla fragrant pear. The results revealed a distinct spatial-temporal pattern of hormone accumulation between first-position (persistent-calyx) and fourth-position (deciduous-calyx) flowers, with the latter exhibiting significantly higher abscission rates (79% vs. 32%). The dynamic hormonal network governing calyx fate determination involves the early accumulation of ethylene precursor ACC in abscising flowers, followed by synergistic actions of ABA and JA during later developmental stages to promote abscission zone formation. Conversely, auxin metabolites and cytokinins appear to function antagonistically by maintaining cellular activity and suppressing abscission processes. These findings offer new insights into the intricate hormonal interactions that govern calyx abscission in pome fruits. They underscore the potential efficacy of interventions like precise administration of ethylene inhibitors or auxin analogs during specific developmental stages to control calyx persistence. Future research should prioritize elucidating cell-type-specific metabolic differences within the abscission zone through single-cell methodologies. Additionally, exploring the molecular interactions among pivotal hormonal pathways and their regulation by environmental factors is crucial. The thorough hormonal profiling outlined in this study not only enhances our basic comprehension of calyx abscission mechanisms but also offers practical insights for enhancing fruit quality in Korla fragrant pear cultivation by refining hormone management strategies.

Author Contributions

M.Y. and F.H. designed the study, examined patients, prepared samples, helped perform biochemical assays; N.Z. and L.W. drafted the manuscript, and wrote the final version of the manuscript; Y.L. designed the study and helped to analyze and to interpret the results; W.F. and T.Z. explained method-specific characteristics and helped to analyze the results; J.B. is responsible for data preservation, project monitoring and final manuscript polishing. All authors have read and agreed to the published version of the manuscript.

Funding

Effects of irrigation at flowering stage on sepal abscission and mitochondrial apoptosis of Korla fragrant pear, Project number: BTYJXM-2024-K61; Effects of irrigation at flowering stage on sepal abscission and mitochondrial apoptosis of Korla fragrant pear, project number: TDGRI2024027; Nanjing Agricultural University—Tarim University Joint Research Fund, Project Number: ZNLH202403.

Data Availability Statement

Since the experimental data from this trial is still in the project implementation phase, the data cannot be disclosed for the time being.

Conflicts of Interest

The authors declare no conflicts of interest.

Abbreviations

The following abbreviations are used in this manuscript:
ACC1-Aminocyclopropanecarboxylic acid.
ME-IAAMethyl 3-indolylacetate.
IPAN6-isopentenyladenosine.
TZRtrans-Zeatin-riboside.
SASalicylic acid.
IAAIndole-3-acetic acid.
ICAIndole-3-carboxaldehyde.
IPN6-(delta 2-Isopentenyl)-adenine.
tZtrans-Zeatin.
DHJADihydrojasmonic Acid.
ABAAbscisic acid.
JA-IleN-((-)-jasmonoyl)-S-isoleucine.
cZcis-Zeatin.
JA(±)-Jasmonic acid.
GAgibberellin
ETHethylene
GA1Gibberellin A1
GA3Gibberellin A3
GA4Gibberellin A4
GA7Gibberellin A7
ZRriboside

References

  1. Pan, Y.; Meng, X.; Che, F.; Xue, S.; Zhang, T.; Zhao, S.; Liao, K. Metabolic Profiles of Sugar Metabolism and Respiratory Metabolism of Korla Pear (Pyrus sinkiangensis Yu) Throughout Fruit Development and Ripening. Sci. Agric. Sin. 2016, 49, 3391–3412. [Google Scholar] [CrossRef]
  2. Guo, K.; Wang, L.; Yu, M.; Fan, W.; Bao, J. Effects of nitrogen application period on fruit setting rate and lignin accumulation during sepal development of Korla fragrant pear. Pomol. J. 2025, 42, 568–576. [Google Scholar] [CrossRef]
  3. Chen, L.; Wang, H.; Chen, Y.; Zheng, Q.; Wang, Z.; Wang, W.; Bao, J. Effects of pre-anthesis and anthesis irrigation on active oxygen metabolism and programmed cell death in calyx tube of Korla fragrant pear. J. Pomol. 2023, 40, 2124–2135. [Google Scholar] [CrossRef]
  4. Muhetar, Z.; Abdul, X.Y.; Yushan, K.; Li, J. Effects of plant endogenous hormone content in different parts of young fruit of Korla fragrant pear on fruit sepal abscission. Plant Physiol. 2020, 56, 2179–2186. [Google Scholar] [CrossRef]
  5. Zhuang, Y.; Wang, X.; Gong, X.; Bao, J. Effects of Different Foliar Fertilizer Treatments on Fruit Quality of the Korla Fragrant Pear. Horticulturae 2024, 10, 51. [Google Scholar] [CrossRef]
  6. Wang, B.-H.; Sun, X.-X.; Niu, J.-X. Cloning of kfpMYB Gene and Its Promoter in Korla Fragrant Pear (Pyrus sinkiangensis) and Determination Their Responses to Hormones. ACTA Hortic. Sin. 2015, 42, 1448–1456. [Google Scholar] [CrossRef]
  7. Chen, Y.; Jin, M.; Wu, C.-Y.; Bao, J.-P. Effects of Plant Growth Regulators on the Endogenous Hormone Content of Calyx Development in ‘Korla’ Fragrant Pear. HortScience 2022, 57, 497–503. [Google Scholar] [CrossRef]
  8. Nakano, R.; Ogura, E.; Kubo, Y.; Inaba, A. Ethylene Biosynthesis in Detached Young Persimmon Fruit Is Initiated in Calyx and Modulated by Water Loss from the Fruit. Plant Physiol. 2003, 131, 276–286. [Google Scholar] [CrossRef]
  9. Waadt, R.; Seller, C.A.; Hsu, P.K.; Takahashi, Y.; Munemasa, S.; Schroeder, J.I. Plant hormone regulation of abiotic stress responses. Nat. Rev. Mol. Cell Biol. 2022, 23, 680–694. [Google Scholar] [CrossRef]
  10. Duan, N.; Jia, Y.K.; Xu, J.; Chen, H.L.; Sun, P. Research Progress on Plant Endogenous Hormones. Chin. Agric. Sci. Bull. 2015, 031, 159–165. [Google Scholar] [CrossRef]
  11. Gray, W.M. Hormonal Regulation of Plant Growth and Development. PLoS Biol. 2004, 2, e311. [Google Scholar] [CrossRef]
  12. Kim, H.U. Lipid Metabolism in Plants. Plants 2020, 9, 871. [Google Scholar] [CrossRef]
  13. Verma, V.; Ravindran, P.; Kumar, P.P. Plant hormone-mediated regulation of stress responses. BMC Plant Biol. 2016, 16, 86. [Google Scholar] [CrossRef] [PubMed]
  14. Ku, Y.-S.; Sintaha, M.; Cheung, M.-Y.; Lam, H.-M. Plant Hormone Signaling Crosstalks between Biotic and Abiotic Stress Responses. Int. J. Mol. Sci. 2018, 19, 3206. [Google Scholar] [CrossRef]
  15. Sytar, O.; Kumari, P.; Yadav, S.; Brestic, M.; Rastogi, A. Phytohormone Priming: Regulator for Heavy Metal Stress in Plants. J. Plant Growth Regul. 2019, 38, 739–752. [Google Scholar] [CrossRef]
  16. Hsiao, Y.-C.; Yamada, M. The Roles of Peptide Hormones and Their Receptors during Plant Root Development. Genes 2021, 12, 22. [Google Scholar] [CrossRef] [PubMed]
  17. Wang, Y.; Zang, Y.; Ma, H.; Xu, K.; Zhang, W.; Zheng, W. Advances in studies on organ abscission and cell wall metabolism in abscission zone of fruit trees. Plant Physiol. 2023, 59, 281–291. [Google Scholar] [CrossRef]
  18. Zheng, L.; Wen, Y.; Lin, Y.; Tian, J.; Shaobai, J.; Hao, Z.; Wang, C.; Sun, T.; Wang, L.; Chen, C. Phytohormonal dynamics in the abscission zone of Korla fragrant pear during calyx abscission: A visual study. Front. Plant Sci. 2024, 15, 1452072. [Google Scholar] [CrossRef] [PubMed]
  19. Pei, M.; Niu, J.; Li, C.; Cao, F.; Quan, S. Identification and expression analysis of genes related to calyx persistence in Korla fragrant pear. BMC Genom. 2016, 17, 132. [Google Scholar] [CrossRef]
  20. Hao, Z.; Wen, Y.; Tian, J.; Shao, B.; Yang, D.; Zhang, F. The relationship between sepal abscission of Korla fragrant pear and phytohormones in different parts of abscission zone. Plant Physiol. 2022, 58, 1369–1380. [Google Scholar] [CrossRef]
  21. Wong, C.; Alabadí, D.; Blázquez, M.A. Spatial regulation of plant hormone action. J. Exp. Bot. 2023, 74, 6089–6103. [Google Scholar] [CrossRef] [PubMed]
  22. Li, J.; Yan, G.; Duan, X.; Zhang, K.; Zhang, X.; Zhou, Y.; Wu, C.; Zhang, X.; Tan, S.; Hua, X.; et al. Research Progress and Trends in Metabolomics of Fruit Trees. Front. Plant Sci. 2022, 13, 881856. [Google Scholar] [CrossRef]
  23. Furch, A.C.U.; Zimmermann, M.R.; Kogel, K.; Reichelt, M.; Mithöfer, A. Direct and individual analysis of stress-related phytohormone dispersion in the vascular system of Cucurbita maxima after flagellin 22 treatment. New Phytol. 2014, 201, 1176–1182. [Google Scholar] [CrossRef]
  24. Martinelli, F.; Basile, B.; Morelli, G.; D’andria, R.; Tonutti, P. ().Effects of irrigation on fruit ripening behavior and metabolic changes in olive. Sci. Hortic. 2012, 144, 201–207. [Google Scholar] [CrossRef]
  25. Wang, W.; Song, X.; Wang, D.; Ma, Y.; Shan, Y.; Ren, X.; Hu, H.; Wu, C.; Yang, J.; Ma, Y. Simultaneous determination of five plant hormones in cotton leaves using QuEChERS combined with HPLC–MS/MS. J. Cotton Res. 2024, 7, 18. [Google Scholar] [CrossRef]
  26. de Falco, B.; Giannino, F.; Carteni, F.; Mazzoleni, S.; Kim, D.-H. Metabolic flux analysis: A comprehensive review on sample preparation, analytical techniques, data analysis, computational modelling, and main application areas. RSC Adv. 2022, 12, 25528–25548. [Google Scholar] [CrossRef] [PubMed]
  27. Šimura, J.; Antoniadi, I.; Široká, J.; Tarkowská, D.; Strnad, M.; Ljung, K.; Novák, O. Plant Hormonomics: Multiple Phytohormone Profiling by Targeted Metabolomics. Plant Physiol. 2018, 177, 476–489. [Google Scholar] [CrossRef] [PubMed]
  28. Lee, J.; Chen, H.; Lee, G.; Emonet, A.; Kim, S.-G.; Shim, D.; Lee, Y. MSD2-mediated ROS metabolism fine-tunes the timing of floral organ abscission in Arabidopsis. New Phytol. 2022, 235, 2466–2480. [Google Scholar] [CrossRef]
  29. Yang, L.; Zhu, S. The Interconnected Relationship between Auxin Concentration Gradient Changes in Chinese Fir Radial Stems and Dynamic Cambial Activity. Forests 2022, 13, 1698. [Google Scholar] [CrossRef]
  30. Gibson, C.L.; Isley, J.W.; Falbel, T.G.; Mattox, C.T.; Lewis, D.R.; Metcalf, K.E.; Muday, G.K. A Conditional Mutation in SCD1 Reveals Linkage Between PIN Protein Trafficking, Auxin Transport, Gravitropism, and Lateral Root Initiation. Front. Plant Sci. 2020, 11, 910. [Google Scholar] [CrossRef]
  31. Tang, Q.; Tillmann, M.; Cohen, J.D. Analytical methods for stable isotope labeling to elucidate rapid auxin kinetics in Arabidopsis thaliana. PLoS ONE 2024, 19, e0303992. [Google Scholar] [CrossRef]
  32. González-García, M.P.; Sáez, A.; Lanza, M.; Hoyos, P.; Bustillo-Avendaño, E.; Pacios, L.F.; Gradillas, A.; A Moreno-Risueno, M.; Hernaiz, M.J.; del Pozo, J.C. Synthetically derived BiAux modulates auxin co-receptor activity to stimulate lateral root formation. Plant Physiol. 2024, 195, 1694–1711. [Google Scholar] [CrossRef]
  33. Li, X.; Han, B.; Yang, Y. Research Progress on the Regulatory Network and Crosstalk of Plant Hormones in Plant Organ Abolition. J. Inn. Mong. Agric. Univ. (Nat. Sci. Ed.) 2023, 44, 92–100. [Google Scholar] [CrossRef]
  34. Gao, J.; Zhuang, S.; Zhang, W. Advances in Plant Auxin Biology: Synthesis, Metabolism, Signaling, Interaction with Other Hormones, and Roles under Abiotic Stress. Plants 2024, 13, 2523. [Google Scholar] [CrossRef]
  35. Le Bail, A.; Billoud, B.; Kowalczyk, N.; Kowalczyk, M.; Gicquel, M.; Le Panse, S.; Stewart, S.; Scornet, D.; Cock, J.M.; Ljung, K.; et al. Auxin Metabolism and Function in the Multicellular Brown Alga Ectocarpus siliculosus. Plant Physiol. 2010, 153, 128–144. [Google Scholar] [CrossRef]
  36. Que, Y.; Huang, D.; Gong, S.; Zhang, X.; Yuan, B.; Xue, M.; Shi, W.; Zeng, F.; Liu, M.; Chen, T.; et al. Indole-3-Carboxylic Acid From the Endophytic Fungus Lasiodiplodia pseudotheobromae LPS-1 as a Synergist Enhancing the Antagonism of Jasmonic Acid Against Blumeria graminis on Wheat. Front. Cell. Infect. Microbiol. 2022, 12, 898500. [Google Scholar] [CrossRef]
  37. Liu, J.; Shi, M.; Wang, J.; Zhang, B.; Li, Y.; Wang, J.; El-Sappah, A.H.; Liang, Y. Comparative Transcriptomic Analysis of the Development of Sepal Morphology in Tomato (Solanum Lycopersicum L.). Int. J. Mol. Sci. 2020, 21, 5914. [Google Scholar] [CrossRef]
  38. Maio, K.A.; Moubayidin, L. ‘Organ’ising Floral Organ Development. Plants 2024, 13, 1595. [Google Scholar] [CrossRef]
  39. E Jameson, P.; Song, J. Will cytokinins underpin the second ‘Green Revolution’? J. Exp. Bot. 2020, 71, 6872–6875. [Google Scholar] [CrossRef]
  40. Zhao, J.; Wang, J.; Liu, J.; Zhang, P.; Kudoyarova, G.; Liu, C.-J.; Zhang, K. Spatially distributed cytokinins: Metabolism, signaling, and transport. Plant Commun. 2024, 5, 100936. [Google Scholar] [CrossRef]
  41. Ismael, S.; Rodrigues, C.; Santos, G.M.; Castela, I.; Barreiros-Mota, I.; Almeida, M.J.; Calhau, C.; Faria, A.; Araújo, J.R. IPA and its precursors differently modulate the proliferation, differentiation, and integrity of intestinal epithelial cells. Nutr. Res. Pract. 2023, 17, 616–630. [Google Scholar] [CrossRef]
  42. Pokimica, N.; Ćosić, T.; Uzelac, B.; Ninković, S.; Raspor, M. Dissecting the Roles of the Cytokinin Signaling Network: The Case of De Novo Shoot Apical Meristem Formation. Biomolecules 2024, 14, 381. [Google Scholar] [CrossRef]
  43. Hluska, T.; Hlusková, L.; Emery, R.J.N. The Hulks and the Deadpools of the Cytokinin Universe: A Dual Strategy for Cytokinin Production, Translocation, and Signal Transduction. Biomolecules 2021, 11, 209. [Google Scholar] [CrossRef]
  44. Kućko, A.; Florkiewicz, A.B.; Wolska, M.; Miętki, J.; Kapusta, M.; Domagalski, K.; Wilmowicz, E. Jasmonate-Dependent Response of the Flower Abscission Zone Cells to Drought in Yellow Lupine. Plants 2022, 11, 527. [Google Scholar] [CrossRef]
  45. Staswick, P.E.; Tiryaki, I. The Oxylipin Signal Jasmonic Acid Is Activated by an Enzyme That Conjugates It to Isoleucine in Arabidopsis. Plant Cell 2004, 16, 2117–2127. [Google Scholar] [CrossRef]
  46. Wasternack, C.; Song, S. Jasmonates: Biosynthesis, metabolism, and signaling by proteins activating and repressing transcription. J. Exp. Bot. 2017, 68, 1303–1321. [Google Scholar] [CrossRef]
  47. Sawicki, M.; Barka, E.A.; Clément, C.; Vaillant-Gaveau, N.; Jacquard, C. Cross-talk between environmental stresses and plant metabolism during reproductive organ abscission. J. Exp. Bot. 2015, 66, 1707–1719. [Google Scholar] [CrossRef]
  48. Ziogas, V.; Tanou, G.; Morianou, G.; Kourgialas, N. Drought and Salinity in Citriculture: Optimal Practices to Alleviate Salinity and Water Stress. Agronomy 2021, 11, 1283. [Google Scholar] [CrossRef]
  49. Polko, J.K.; Kieber, J.J. 1-Aminocyclopropane 1-Carboxylic Acid and Its Emerging Role as an Ethylene-Independent Growth Regulator. Front. Plant Sci. 2019, 10, 1602. [Google Scholar] [CrossRef]
  50. Mou, W.; Li, D.; Bu, J.; Jiang, Y.; Khan, Z.U.; Luo, Z.; Mao, L.; Ying, T. Comprehensive Analysis of ABA Effects on Ethylene Biosynthesis and Signaling during Tomato Fruit Ripening. PLoS ONE 2016, 11, e0154072. [Google Scholar] [CrossRef]
  51. Galindo-Trigo, S.; Khandare, V.; Roosjen, M.; Adams, J.; Wangler, A.-M.; Bayer, M.; Borst, J.W.; Smakowska-Luzan, E.; Butenko, M.A. A multifaceted kinase axis regulates plant organ abscission through conserved signaling mechanisms. Curr. Biol. 2024, 34, 3020–3030.e7. [Google Scholar] [CrossRef]
  52. Muhlemann, J.K.; Maeda, H.; Chang, C.Y.; San Miguel, P.; Baxter, I.; Cooper, B.; Perera, M.A.; Nikolau, B.J.; Vitek, O.; Morgan, J.A.; et al. Developmental changes in the metabolic network of snapdragon flowers. PLoS ONE 2012, 7, e40381. [Google Scholar] [CrossRef]
  53. Ding, L.-N.; Li, Y.-T.; Wu, Y.-Z.; Li, T.; Geng, R.; Cao, J.; Zhang, W.; Tan, X.-L. Plant Disease Resistance-Related Signaling Pathways: Recent Progress and Future Prospects. Int. J. Mol. Sci. 2022, 23, 16200. [Google Scholar] [CrossRef]
  54. Fooyontphanich, K.; Morcillo, F.; Joët, T.; Dussert, S.; Serret, J.; Collin, M.; Amblard, P.; Tangphatsornruang, S.; Roongsattham, P.; Jantasuriyarat, C.; et al. Multi-scale comparative transcriptome analysis reveals key genes and metabolic reprogramming processes associated with oil palm fruit abscission. BMC Plant Biol. 2021, 21, 92. [Google Scholar] [CrossRef]
  55. Wang, J.; Cai, Y.; Zhang, N.; Zhang, Y. Regulatory Factors and Molecular Mechanism of Sucrose Transporters’ Expressions in Plant. Biotechnol. Bull. 2021, 37, 115–124. [Google Scholar] [CrossRef]
  56. Yuan, Y.; Khourchi, S.; Li, S.; Du, Y.; Delaplace, P. Unlocking the Multifaceted Mechanisms of Bud Outgrowth: Advances in Understanding Shoot Branching. Plants 2023, 12, 3628. [Google Scholar] [CrossRef]
  57. Kućko, A.; Wilmowicz, E.; Pokora, W.; Alché, J.D.D. Disruption of the Auxin Gradient in the Abscission Zone Area Evokes Asymmetrical Changes Leading to Flower Separation in Yellow Lupine. Int. J. Mol. Sci. 2020, 21, 3815. [Google Scholar] [CrossRef]
  58. Gundesli, M.A.; Kafkas, S.; Guney, M.; Kafkas, N.E. Identification of the profile of endogenous cytokinin-like compounds during different plant growth stages and their effects on flower bud abscission in pistachio (Pistacia vera L.). Folia Hortic. 2020, 32, 21–35. [Google Scholar] [CrossRef]
Figure 1. The abscission rate of sepals on different order inflorescences of Korla fragrant pear. Note: ** Indicates that the inter-group differences are significant at the level of p < 0.01.
Horticulturae 11 00642 g001
Figure 2. Morphological characteristics of the calyx of Korla fragrant pear. Note: The red circle marks the morphological changes of the layers in different time periods.
Horticulturae 11 00642 g002
Figure 3. Metabolic trend of endogenous hormones in Korla fragrant pear.
Horticulturae 11 00642 g003
Figure 4. Hierarchical cluster thermogram of different metabolites in different order and different period of Korla fragrant pear.
Horticulturae 11 00642 g004
Figure 5. Korla fragrant pear dynamic changes of auxin metabolites in different periods and different positions; (a): Methyl 3-indolylacetate (b): Indole-3-acetic acid (c): Indole-3-carbaldehyde.
Horticulturae 11 00642 g005
Figure 6. Korla fragrant pear dynamic changes of cytokinin metabolites in different periods and different sequence positions; (a): N6-isopentenyladenosine (b): N6-(delta 2-Isopentenyl)-adenine (c): trans-Zeatin-riboside (d): trans-Zeatin (e): cis-Zeatin.
Horticulturae 11 00642 g006aHorticulturae 11 00642 g006b
Figure 7. Dynamic changes of jasmonic acid metabolites in different periods and different sequences of Korla fragrant pear; (a): Dihydrojasmonic Acid (b): N-((-)-jasmonoyl)-S-isoleucine (c): (±)-Jasmonic acid.
Horticulturae 11 00642 g007
Figure 8. Dynamic changes of ethylene, abscisic acid, and salicylic acid metabolites in Korla fragrant pear at different stages and different positions; (a): 1-Aminocyclopropanecarboxylic acid (b): Abscisic acid (c): Salicylic acid.
Horticulturae 11 00642 g008
Figure 9. Heatmap of correlation analysis for group; The horizontal and vertical axes in the figure represent the two sets of compared metabolites. Red indicates a positive correlation, blue indicates a negative correlation, and the non-significant correlations are marked with an “×”.
Horticulturae 11 00642 g009
Figure 10. The proportion of differential metabolites in the floral calyx targeted metabolome of Korla sweet pears during different growth stages; (a): The proportion of different metabolites in the targeted metabolome of the first inflorescence’s calyx (b): The proportion of different metabolites in the targeted metabolome of the fourth inflorescence’s calyx.
Horticulturae 11 00642 g010
Figure 11. Venn diagram of differential metabolites in different periods and different sequences of Korla fragrant pear; (a): Venn diagram of targeted metabolites of the first inflorescence’s calyx at different growth stages (b): Venn diagram of targeted metabolites of the fourth inflorescence’s calyx at different growth stages.
Horticulturae 11 00642 g011
Table 1. Sample information table.
Sampling Time
The First Position
Group NameSampling Time
The Fourth Position
Group Name
0 DAFA-00 DAFB-0
2 DAFA-22 DAFB-2
4 DAFA-44 DAFB-4
6 DAFA-66 DAFB-6
8 DAFA-88 DAFB-8
10 DAFA-1010 DAFB-10
Table 2. Hormone content information table.
Abbr.Concentration (nmol/L)RecoveryRSD
ACC200.00106.13.9%
ME-IAA200.0098.44.1%
IPA200.0093.47.0%
K31.2599.84.9%
tZR200.0095.05.1%
Me-JA31.2597.83.8%
SA200.00100.03.1%
IAA200.0093.55.4%
IBA200.0092.67.3%
ICA200.0086.01.9%
IP31.25105.05.1%
tZ31.25103.12.0%
H2-JA31.25100.52.0%
ABA200.0095.72.7%
JA-Ile15.6399.52.8%
cZ31.2598.34.3%
dh-Z31.2598.62.7%
GA131.2595.83.1%
GA331.25101.51.1%
GA431.2599.76.0%
GA731.25102.43.1%
Me-SA200.0093.15.3%
JA200.0097.83.6%
BL31.25113.11.2%
Table 3. Extract of endogenous hormones in ‘Korla fragrant pear’ calyx tube.
Compounds NameAbbr.FormulaTest Results
1-Aminocyclopropanecarboxylic acid.ACC.C4H7NO2
Methyl 3-indolylacetate.ME-IAA.C11H11NO2
N6-isopentenyladenosine.IPA.C15H21N5O4
Kinetin.6-KT.C10H9N5O
trans-Zeatin-riboside.TZR.C15H21N5O5
Methyl jasmonate.MeJA.C13H20O3
Salicylic acid.SA.C7H6O3
Indole-3-acetic acid.IAA.C10H9NO2
3-Indolebutyric acid.IBA.C12H13NO2
Indole-3-carboxaldehyde.ICA.C9H7NO
N6-(delta 2-Isopentenyl)-adenine.IP.C10H13N5
trans-Zeatin.tZ.C10H13N5O
Dihydrojasmonic Acid.DHJA.C12H20O3
Abscisic acid.ABA.C15H20O4
N-((-)-jasmonoyl)-S-isoleucine.JA-Ile.C18H29NO4
cis-Zeatin.cZ.C10H13N5O
DL-Dihydrozeatin.DL-DHZ.C10H15N5O
Gibberellin A1.GA1.C19H24O6
Gibberellin A3.GA3.C19H22O6
Gibberellin A4.GA4.C19H24O5
Gibberellin A7.GA7.C19H22O5
Methyl salicylate.MESA.C8H8O3
(±)-Jasmonic acid.JA.C12H18O3
BrassinolideBLC28H48O6
Note: △ indicates that the hormone is present in the test result; — indicates that the hormone is not present in the test result.
Disclaimer/Publisher’s Note: The statements, opinions and data contained in all publications are solely those of the individual author(s) and contributor(s) and not of MDPI and/or the editor(s). MDPI and/or the editor(s) disclaim responsibility for any injury to people or property resulting from any ideas, methods, instructions or products referred to in the content.

