Article

Current and Future Geographical Distribution and Potential Habitat of Carpinus fangiana Hu (Betulaceae) Under Different Climate Change Scenarios

1
College of Landscape Architecture, Nanjing Forestry University, Nanjing 210037, China
2
Co-Innovation Center for Sustainable Forestry in Southern China, Nanjing Forestry University, Nanjing 210037, China
3
Research Center for Urban and Rural Living Environment, Zhijiang College of Zhejiang University of Technology, Shaoxing 312030, China
4
College of Life Sciences, Zhejiang Normal University, Jinhua 321004, China
5
Jinpu Research Institute, Nanjing Forestry University, Nanjing 210037, China
*
Author to whom correspondence should be addressed.
Horticulturae 2025, 11(6), 575; https://doi.org/10.3390/horticulturae11060575
Submission received: 15 April 2025 / Revised: 18 May 2025 / Accepted: 20 May 2025 / Published: 23 May 2025
(This article belongs to the Section Floriculture, Nursery and Landscape, and Turf)

Abstract

:
Climate change has greatly affected the survival and distribution of various species. Understanding the distribution of species and their responses to climate change is helpful for species conservation and the utilization of germplasm resources. Carpinus fangiana is endemic to China, and it is used as an ornamental plant and in traditional Chinese medicine. However, its distribution remains unclear. In this study, we aimed to reconstruct the current and future ecological niches of C. fangiana. The prediction results indicated that annual precipitation and elevation are the key factors limiting its distribution. Our research found that it also exists in southern Chongqing and southwestern Hunan, and distinct suitable distribution areas and core suitable areas have been detected in these areas. Currently, the suitable distribution areas and core suitable areas of C. fangiana are mainly located in southwestern China around the Sichuan Basin. Although it is distributed in southeastern Yunnan, no distinct suitable distribution areas were detected there. In contrast, suitable distribution areas and core suitable areas were detected in the Qinling and Dabashan mountains, the mountainous areas in western Hubei, and southeastern Xizang, where C. fangiana is not currently distributed. Future climate change will likely have a considerable impact on its distribution, with a clear trend of suitable distribution areas migrating toward higher latitudes and elevations. The suitable distribution areas located in southeastern Xizang and northwestern Yunnan are expected to be lost in the future. In particular, under the high-concentration scenario, a substantial loss of suitable distribution areas is predicted.

1. Introduction

Since the Industrial Revolution, the global climate has undergone drastic changes, and global warming has continued to intensify [1,2]. According to the Intergovernmental Panel on Climate Change (IPCC), the global surface temperature from 2011 to 2020 was 1.1 °C higher than that from 1850 to 1900 [2]. Human activities, especially the emission of greenhouse gases, have greatly affected the global climate, leading to global warming and the intensification of extreme weather [2]. Future climate change poses a serious threat to the survival and distribution of many species and will likely exacerbate the risk of extinction [3,4,5]. Endangered species and those with limited distribution are especially sensitive to the impacts of climate change [6]. Therefore, understanding the mechanisms through which species respond to climate change is important for species conservation and biodiversity maintenance.
Generally speaking, the geographical distribution of plants is inextricably related to climate, however, the responses of different species to climate change are complex [7]. Predicting the effects of climate change on different species is important for their conservation and utilization. Ecological niche models have been extensively applied in the study of suitable habitats for species and in the assessment of the impacts of global change [8]. The Maximum Entropy (MaxEnt) model, which was developed based on the ecological niche concept and Maximum Entropy theory, can be used to effectively predict the potential distribution of a species [9,10]. This model has the advantages of strong predictive capabilities and high accuracy [11], and it has been widely used in various fields for predicting endangered species habitats [6,12,13], planning suitable cultivation areas for crops [14,15], identifying and planning species priority conservation areas [16], studying dynamic changes in population history and distribution [13,17], and forecasting and managing invasion by invasive species [18,19].
The Betulaceae Gray family is divided into six genera and currently has over 150 species. It is an important component of northern temperate forests and subtropical mountainous forests, and has significant ecological, ornamental, and economic value [20,21]. Among them, it is estimated that more than 50 species of the genus Carpinus are widely distributed across the northern temperate and subtropical regions globally [20,21,22,23,24]. In China, more than 30 species are extensively found in Northeast, North, Northwest, Southwest, East, Central, and South China [20,21,23,24]. Species of the genus Carpinus possess substantial ornamental and economic value, and many are used as ornamental trees, for the production of wood products, in traditional Chinese medicine, and for the cultivation of black fungus and glossy Ganoderma. Carpinus fangiana, a deciduous plant belonging to the Betulaceae family, is endemic to China [20,21,25,26,27], which usually grows in mountain forests at elevations of 700–2100 m. This species is primarily distributed in southwestern China, including Sichuan, southeastern Yunnan, Guizhou, and northwestern Guangxi [20,21,28,29]. It has an aesthetically pleasing shape with considerable ornamental value, and its root bark can be used in traditional Chinese medicine for clearing heat and detoxification. Analysis of the current and future potential distribution patterns of C. fangiana will be beneficial for the collection, protection, and utilization of germplasm resources under future climate change conditions.
Although C. fangiana has considerable potential for various applications, its geographical distribution pattern is not yet clear, which limits its development and utilization. Therefore, we used specimen data, ArcGIS v10.2 software, and the MaxEnt model to reconstruct the current and future ecological niches of C. fangiana. We aimed to (1) explore the current potential geographical distribution of C. fangiana to facilitate further field research, (2) identify the key factors that restrict its survival and distribution to facilitate its cultivation and management, and (3) project the impact of future climate change scenarios on its geographical distribution to provide guidance for the conservation and utilization of its germplasm resources.

2. Materials and Methods

2.1. Acquisition and Processing of Distribution Data

The C. fangiana distribution data obtained in this study mainly originated from specimens in museums in China and previous research papers. Specimens were obtained from the Chinese Virtual Herbarium (CVH, https://www.cvh.ac.cn, accessed on 11 May 2024). After obtaining these specimens, those with unclear geographical locations or the same collection location were removed, and each specimen was identified to exclude those with identification errors. Subsequently, distribution data were obtained by consulting research papers on C. fangiana [27,28,29]. To prevent model overfitting due to the concentration of distribution points, only one point was retained within each 2.5′ × 2.5′ region, and a total of 120 valid distribution data points were obtained.

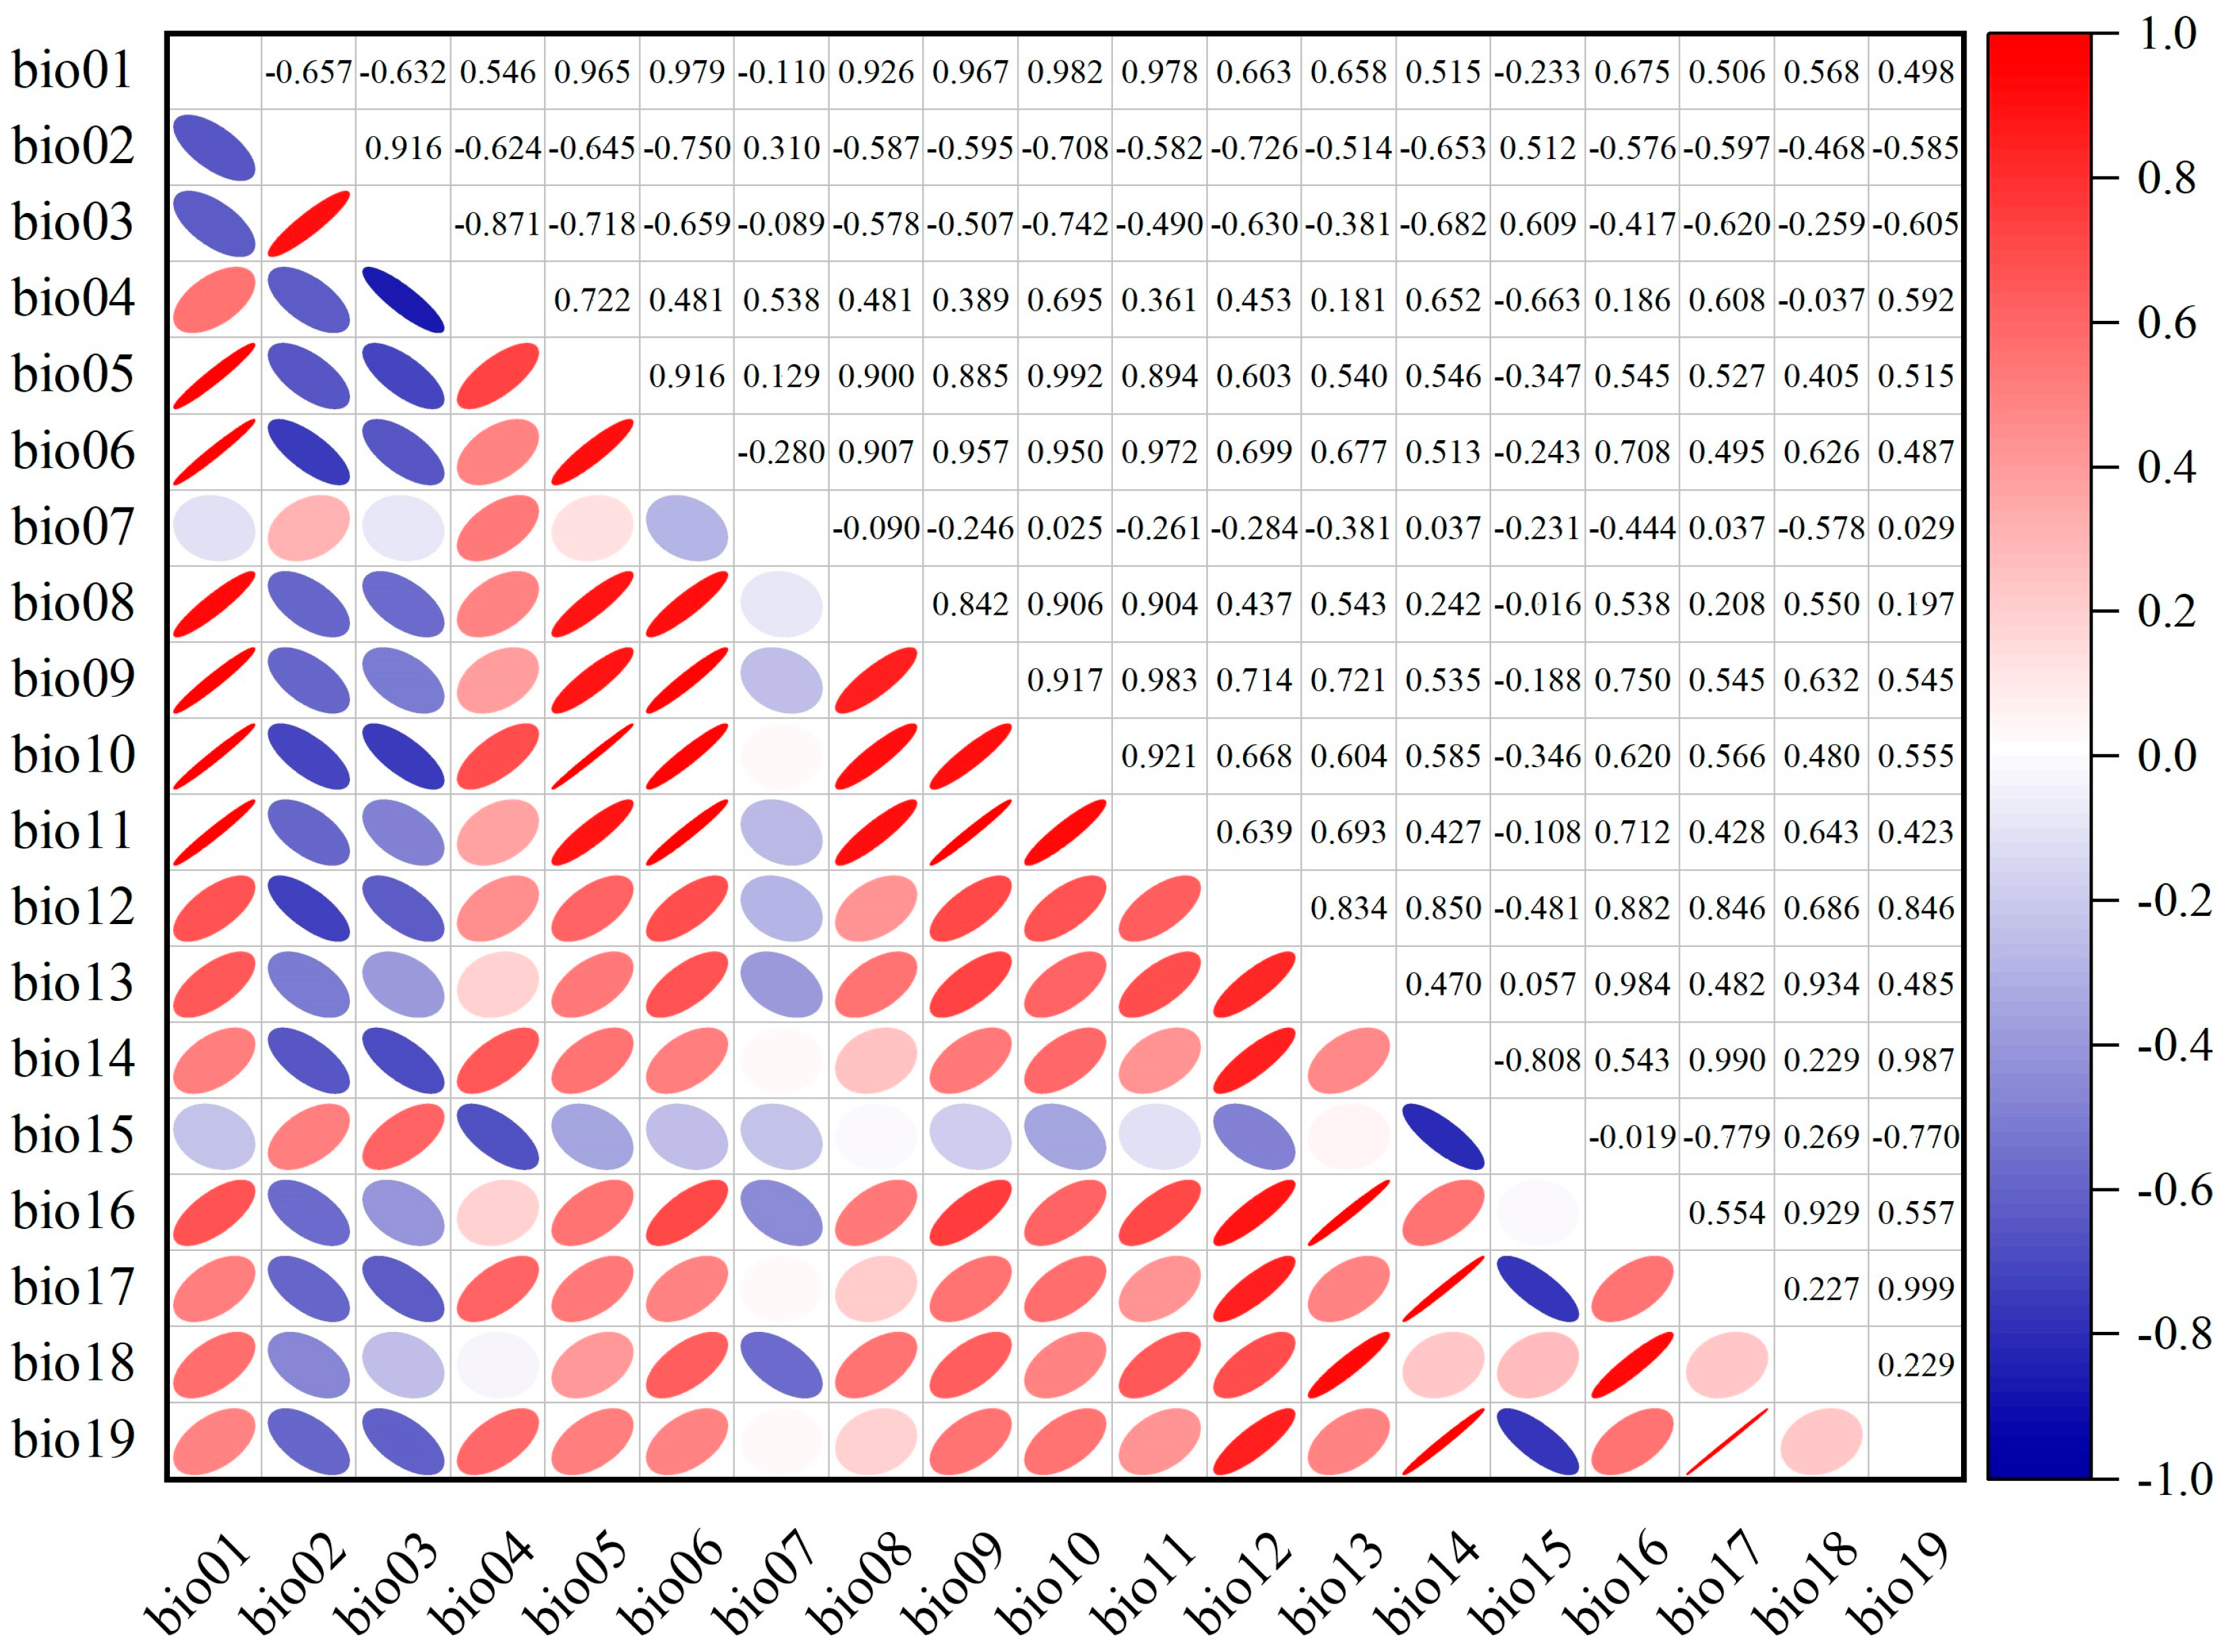
2.2. Acquisition and Processing of Environmental Variables

Data on the elevation and current and future climate were sourced from WorldClim v2.1 (https://www.worldclim.org/, accessed on 13 May 2024), with a spatial resolution of 2.5′ (Table A1). The climate data for each period included 19 bioclimatic variables, and the selected global climate model for future periods was the BCC-CSM2-MR. BCC-CSM2-MR was developed by the National (Beijing) Climate Center and has higher accuracy and reliability in temperature simulation [30]. In precipitation simulation, it is more accurate in simulating seasonal and monthly precipitation changes in East Asia, and can simulate the trend of precipitation changes in eastern China [31,32].
The future climate data in this study included three periods: 2050s (2041–2060), 2070s (2061–2080), and 2090s (2081–2100), with two shared socioeconomic pathways (SSPs) of bioclimatic variables (SSP2-4.5 and SSP3-7.0) selected for each period. The SSP2-4.5 scenario is an updated scenario in CMIP6 for the RCP4.5 scenario in CMIP5. It represents the combination of moderate social vulnerability and moderate radiative forcing. Its radiative forcing is stable at 4.5 w/m2 in 2100. The SSP3-7.0 is a new radiation forcing scenario in CMIP6, which represents the combination of high social vulnerability and relatively high anthropogenic radiation forcing, and its radiation forcing is stable at 7.0 w/m2 in 2100.
In order to identify the most important variables shaping the distribution of C. fangiana, Pearson correlation coefficients were conducted using ArcGIS v10.2 (ESRI Inc., Redlands, CA, USA) and Origin v2022 (Electronic Arts Inc., Redwood, CA, USA) (Figure A1). When the correlation between a pair of bioclimatic variables was greater than or equal to |0.85|, only one variable from each highly intercorrelated pair was retained. The selection principle was based on the contribution rate output of the MaxEnt model after running the model with all the bioclimatic variables (Table A1). Ultimately, elevation and seven bioclimatic variables were selected to establish the model.

2.3. Construction and Evaluation of the MaxEnt Model

The current and future ecological niches of C. fangiana were reconstructed using MaxEnt v3.4.4 (https://biodiversityinformatics.amnh.org/open_source/maxent/, accessed on 1 December 2023). The jackknife technique was used to check the weights of the environmental variables, and the logistic output format was selected for the model running results. The cross-validation was used as the replicated run type. The contribution rate was used to evaluate the dominant environmental factors limiting the geographical distribution of C. fangiana. The accuracy of the model was assessed using the area-under-the-curve (AUC) value. The entire model was run 10 times, and the average of the 10 results was selected as the final prediction result.

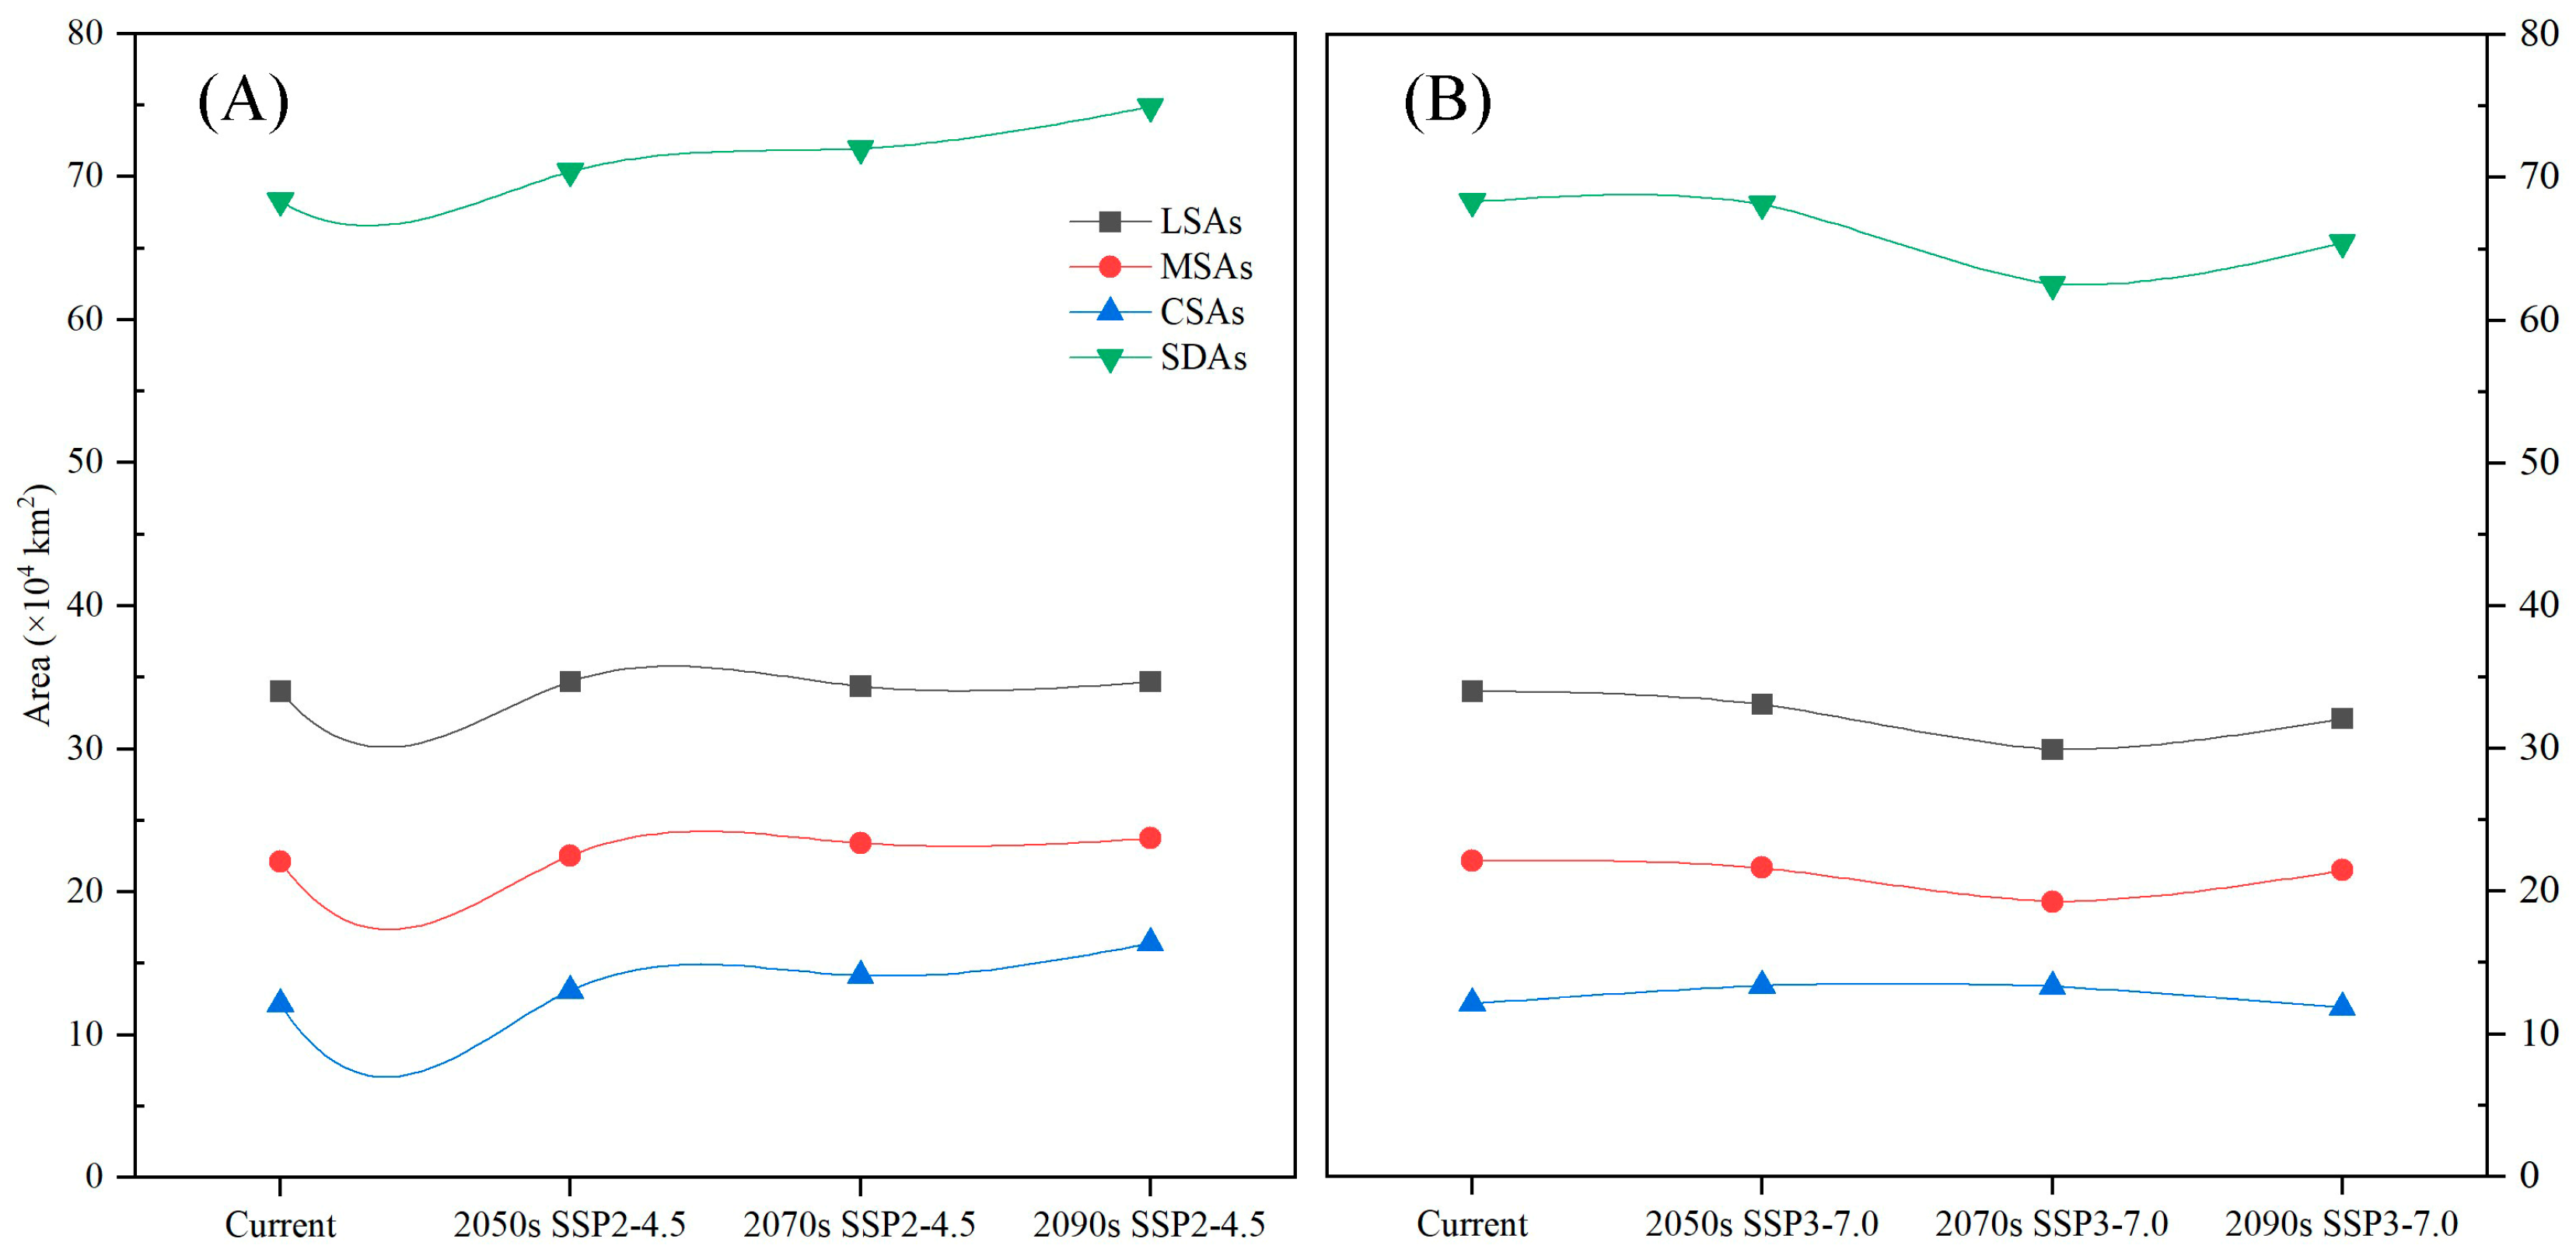
2.4. Classification of and Dynamic Changes in Suitable Distribution Areas

The MaxEnt model provides multiple logistic thresholds for converting predicted results into suitable/unsuitable areas. The logistic threshold of “Maximum training sensitivity and specificity” was adopted to distinguish between the unsuitable areas (USAs) and suitable distribution areas (SDAs) of C. fangiana. Subsequently, the logistic threshold of “10 percentile training presence” and “Equal test sensitivity and specificity” were used to divide the SDAs into low suitable areas (LSAs), moderately suitable areas (MSAs), and core suitable areas (CSAs), respectively. To visually demonstrate the impact of future climate change on the potential distribution of C. fangiana, ArcGIS v10.2 was used to extract the areas that have always been its SDAs and CSAs under SSP2-4.5 and SSP3-7.0 climate scenarios, as well as in the current and future periods. Additionally, areas that were SDAs of C. fangiana at present but were not SDAs in the future were defined as “Lost”, while areas that were SDAs in the future but were not SDAs at present were defined as “Increased”, and areas that were SDAs in both the current and future were defined as “Stable”. The same method is also used for CSAs. The map of China’s administrative divisions is sourced from the National Platform for Common GeoSpatial Information Services (https://www.tianditu.gov.cn/).

3. Results

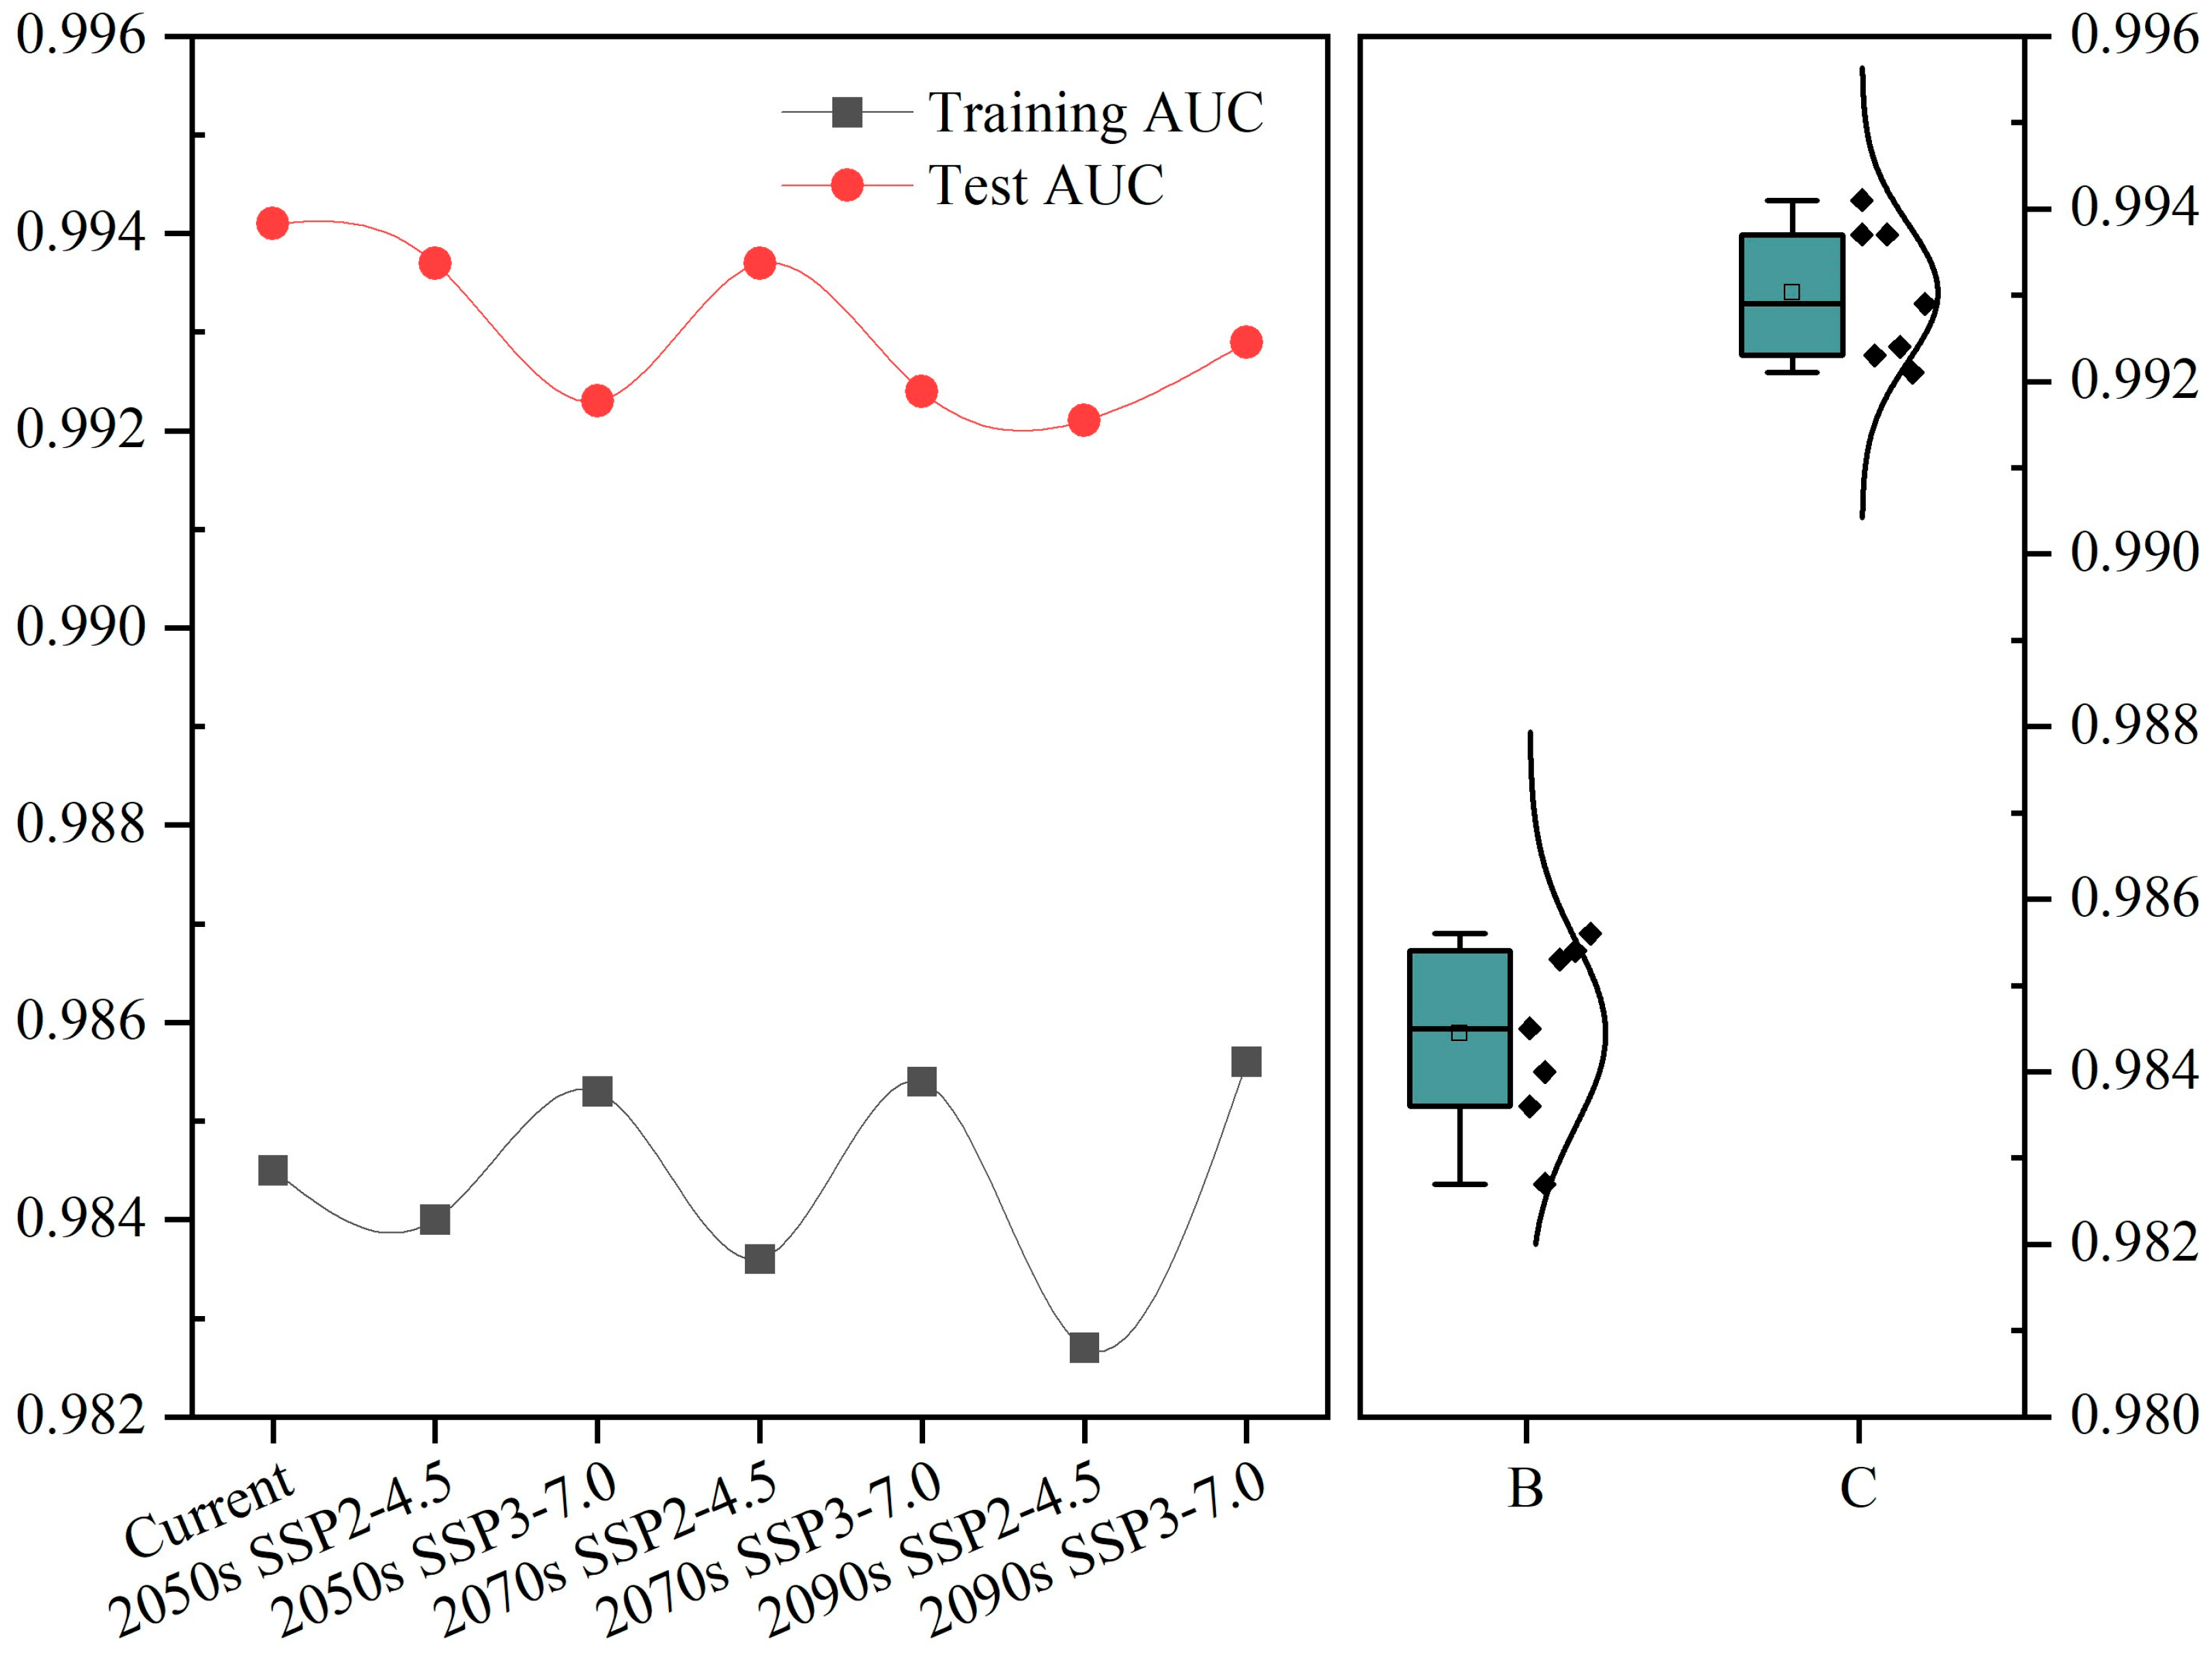
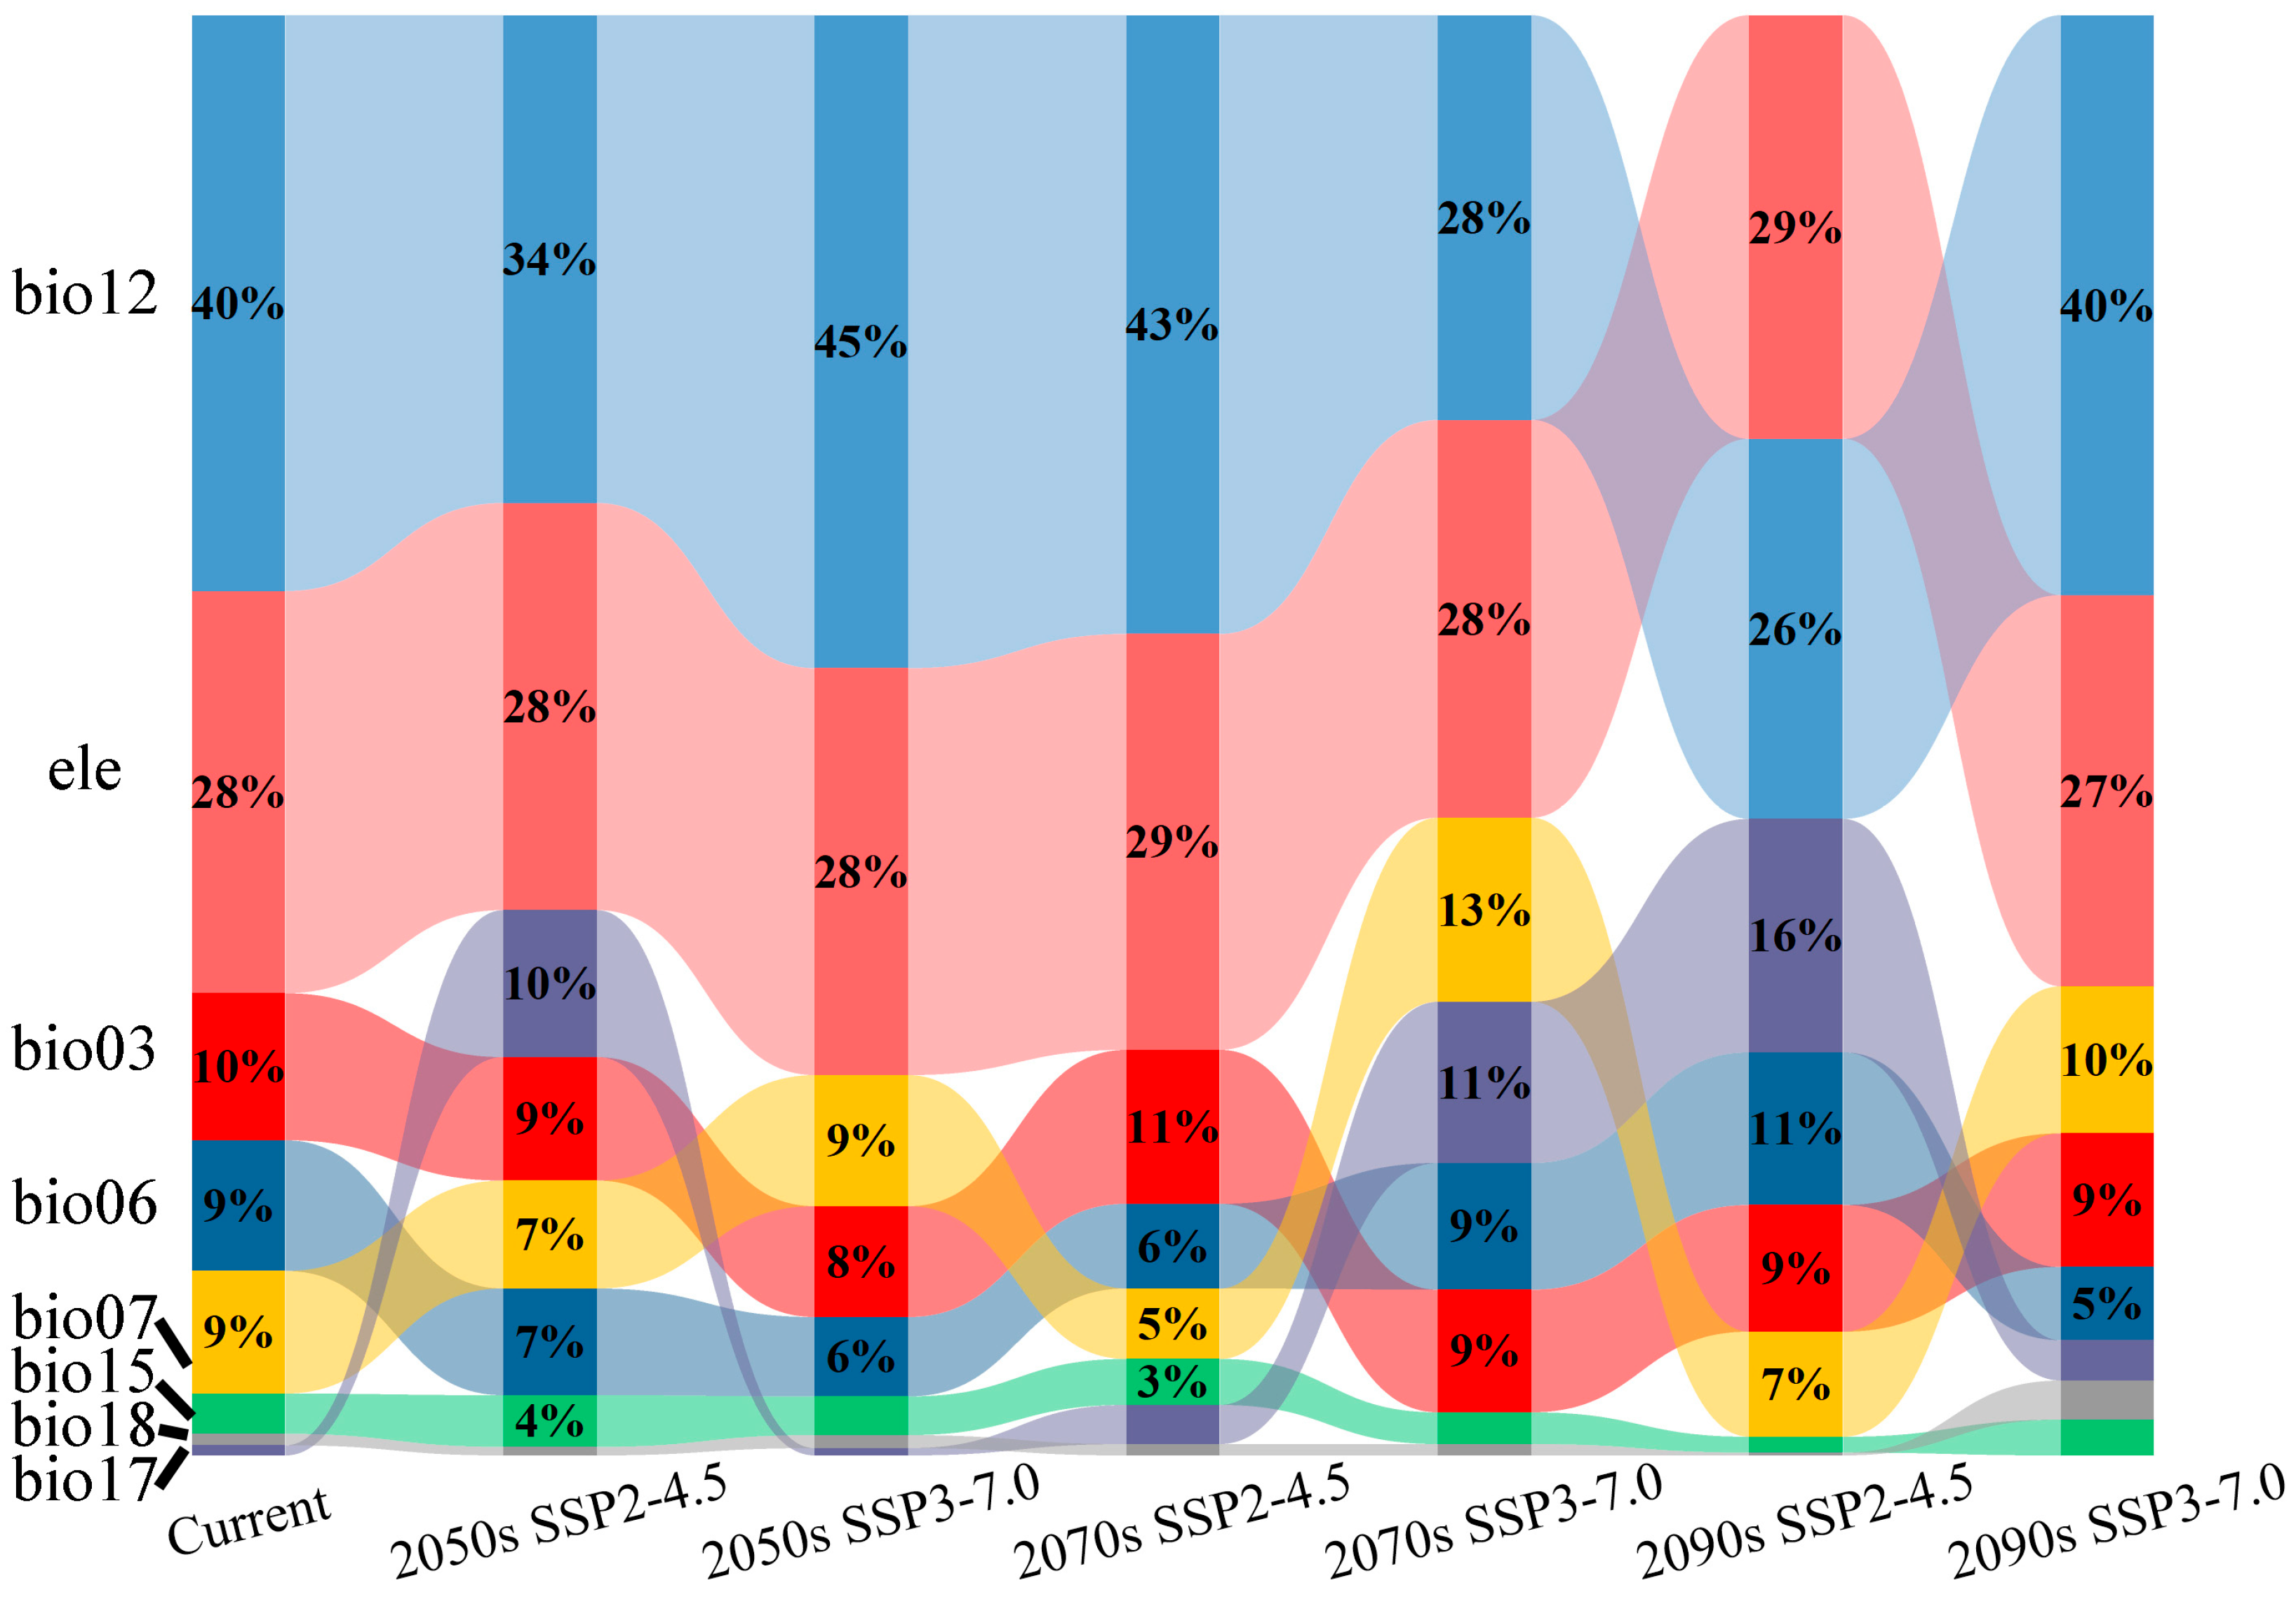
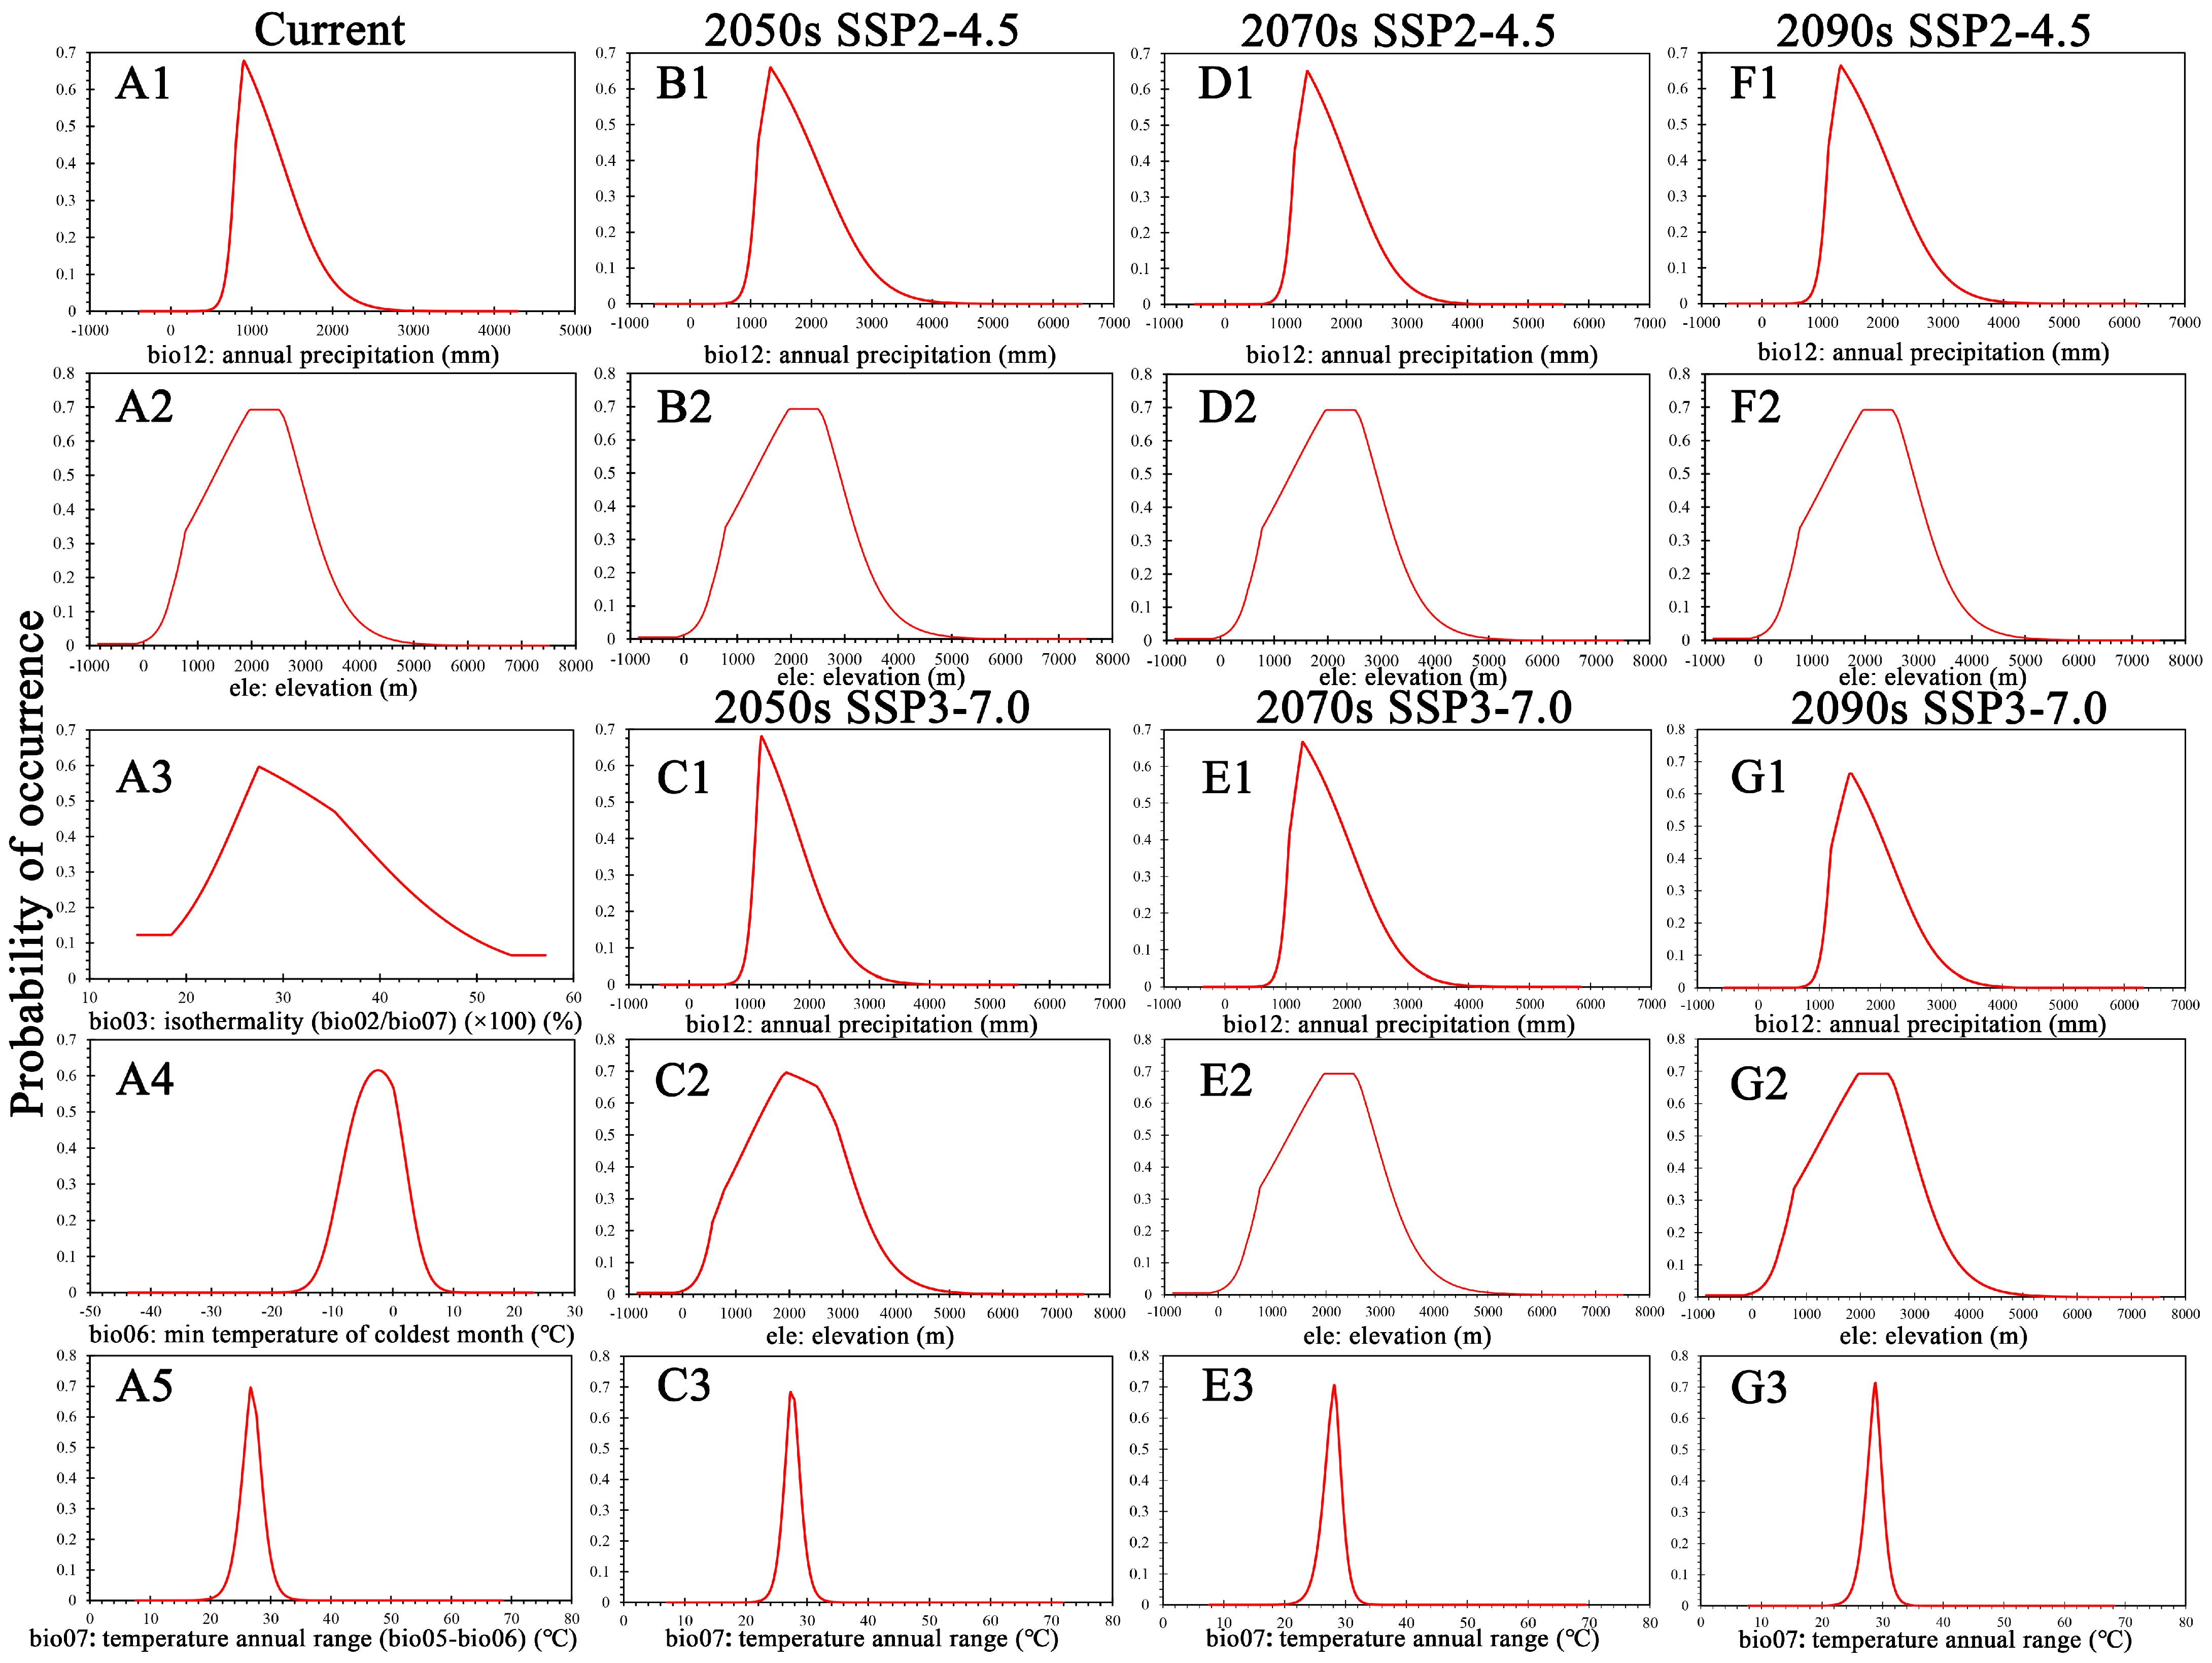
3.1. Model Accuracy and Key Environmental Factors Affecting Distribution

The training and test AUC values under the current climate scenario were 0.9845 and 0.9941, respectively (Figure A2). Under future climate change conditions, the training AUC values exceeded 0.98, and the test AUC values exceeded 0.99, with average training and test AUC values of 0.9844 and 0.9929, respectively (Figure A2). This indicates that the model had extremely high accuracy and that the predicted results can be used to identify the current and potential future geographical distributions of C. fangiana.
According to the prediction results of the MaxEnt model for the current period, the contribution rates of bio12 (annual precipitation), ele (elevation), bio03 (isothermality), bio06 (min temperature of coldest month), and bio07 (temperature annual range) were 40.0%, 27.9%, 10.2%, 9.1%, and 8.5%, respectively, with a cumulative contribution rate of 95.7% (Figure A3). Among these, the contribution rates of bio12 and ele were significantly higher than those of the other environmental variables, with a cumulative contribution rate of 67.9% (Figure A3), suggesting that these were the key factors restricting the geographical distribution of C. fangiana. In the future, bio12 and ele will consistently have the highest contribution rates, with average contribution rates of 36.17% and 28.27%, respectively. Under the SSP3-7.0 scenario, bio12, ele, and bio07 had the highest contribution rates, with bio07 having an average contribution rate of 10.7%.
According to the response curve of the environmental variables under current climate conditions (Figure 1), 900 mm was the optimal bio12 value for the survival and distribution of C. fangiana. When the bio12 value was approximately between 800–1350 mm, the habitat suitability value was very high (above 0.425). The habitat suitability value could meet its survival and distribution requirements when the bio12 value was approximately between 650–2100 mm (above 0.0675). When the bio12 value was below 400 mm or above 2600 mm, the habitat suitability value was nearly zero. The elevation of approximately 2000–2500 m was found to be the most suitable for the survival and distribution of C. fangiana (Figure 1). The habitat suitability value exceeded 0.425 when ele was approximately between 1050–3000 m. The habitat suitability value exceeded 0.0675 when ele was approximately between 300–4050 m. The habitat suitability value was nearly zero when ele was below 0 m or above 5000 m.
Under future climate scenarios, the habitat suitability value exceeded 0.425 when bio12 was approximately between 1200 and 1800 mm. The habitat suitability value exceeded 0.0675 when bio12 was approximately between 1000 and 2800 mm. The habitat suitability value was nearly zero when bio12 was below 600 mm or above 3600 mm (Figure 1). The habitat suitability value exceeded 0.425 when ele was approximately between 2000 and 2500 m. The habitat suitability value exceeded 0.0675 when ele was approximately between 1075 and 3000 m. The habitat suitability value was nearly zero when ele was below 0 m or above 5000 m (Figure 1). Under SSP3-7.0, the habitat suitability value exceeded 0.425 when bio07 was approximately between 27.5 and 28.5 °C. The habitat suitability value exceeded 0.0675 when bio07 was approximately between 25 and 31 °C. The habitat suitability value was nearly zero when bio07 was below 20 °C or above 34 °C (Figure 1).

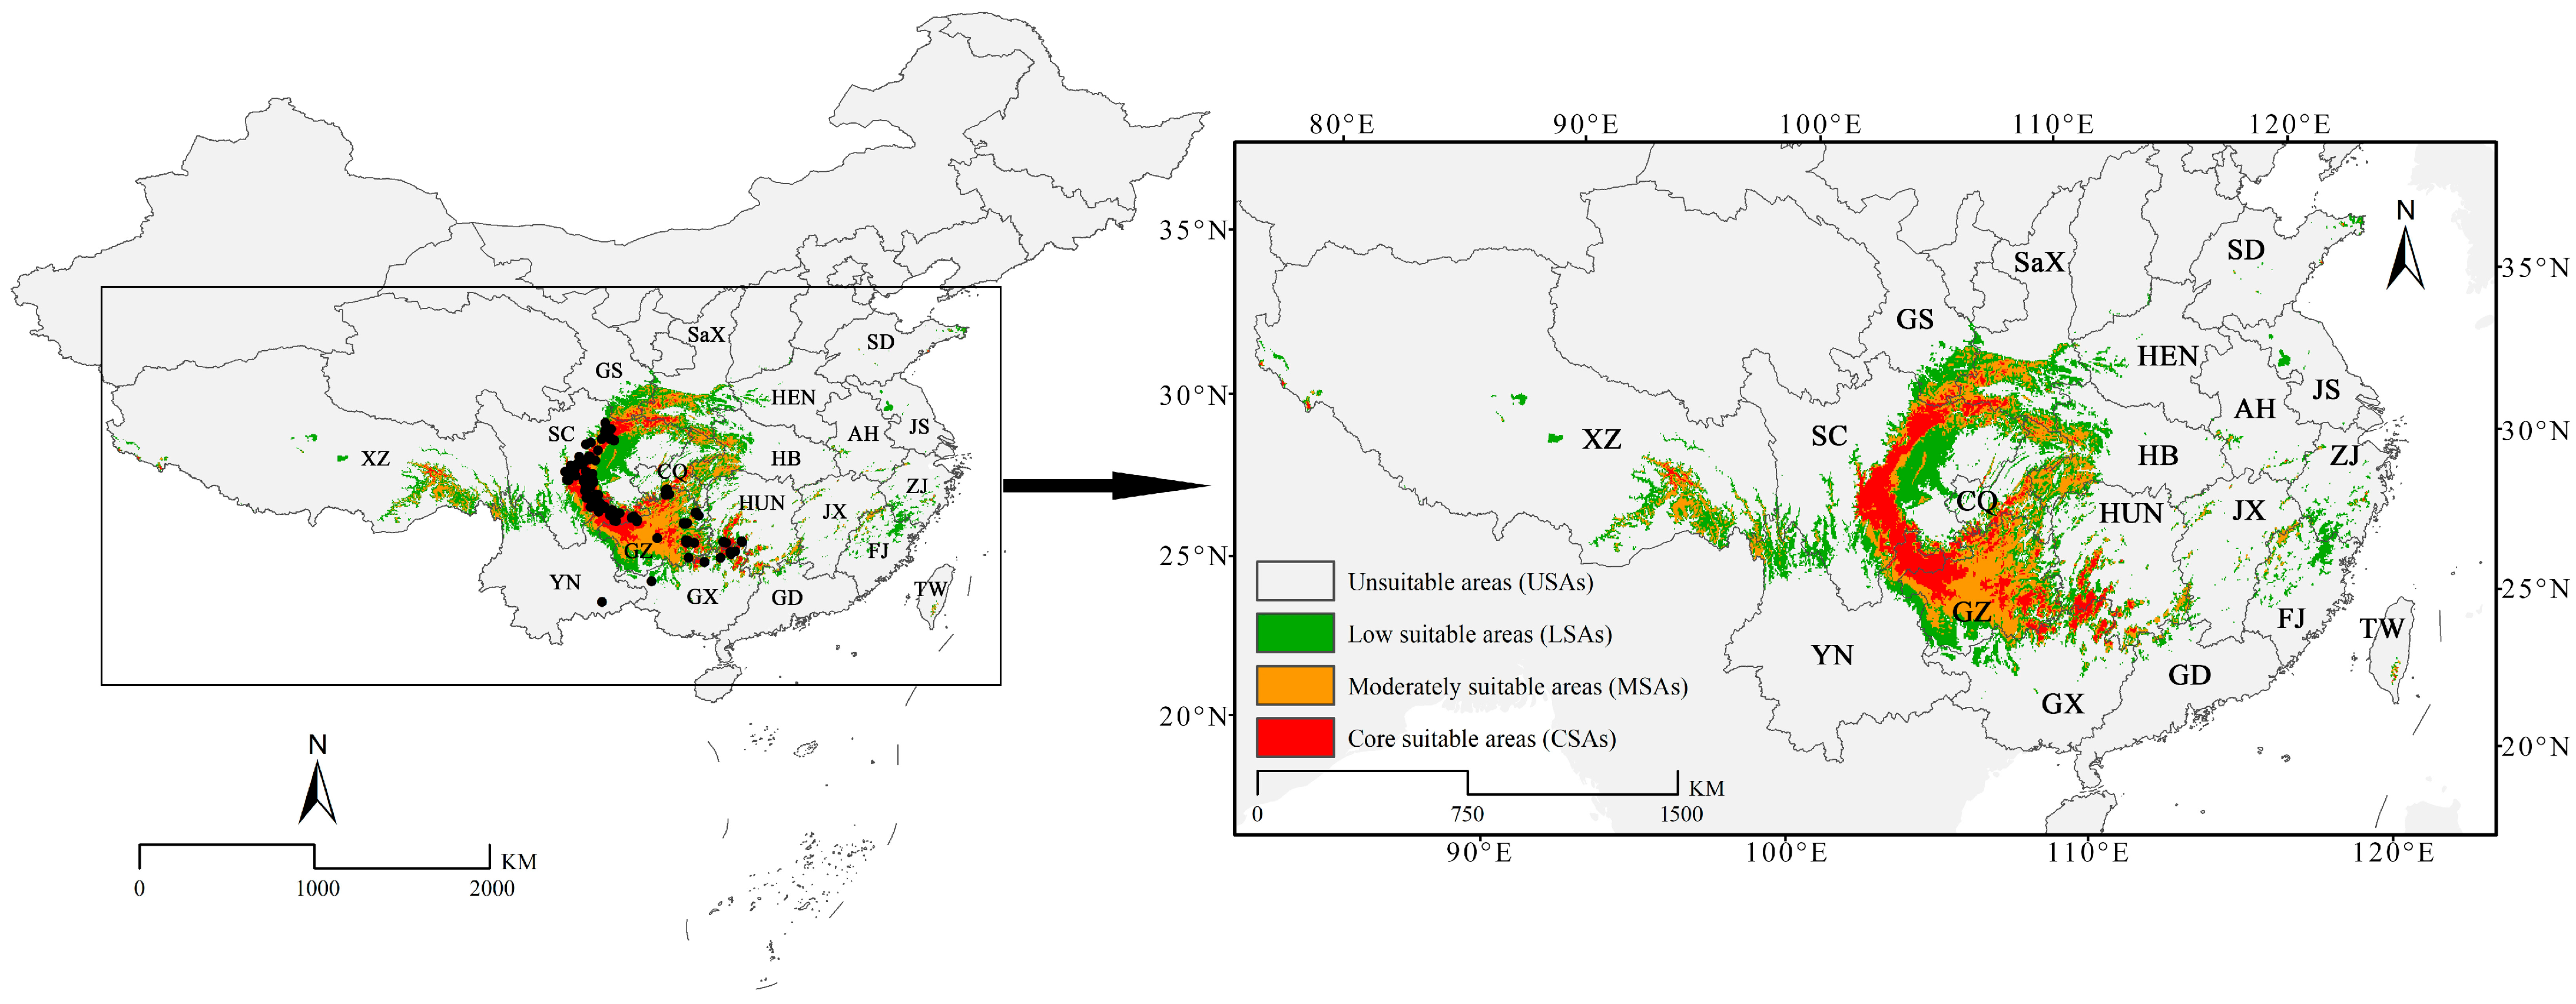
3.2. Current Potential Geographical Distribution

The prediction results indicated that the SDAs of C. fangiana accounted for approximately 68.29 × 10⁴ km2, with the LSAs, MSAs, and CSAs accounting for 34.03 × 10⁴ km2, 22.12 × 10⁴ km2, and 12.15 × 10⁴ km2, respectively (Figure 2, Figure A4). The SDAs of C. fangiana were primarily located around the Sichuan Basin in southwestern China, including Guizhou; the Hengduan Mountains in Sichuan; northeastern Yunnan; the Qinling Mountains in southern Shaanxi; the Daba Mountains in the border areas of Gansu, Shaanxi, and Hubei; the Wushan Mountains in western Hubei and southern Chongqing; northeastern Guangxi; and southwestern Hunan.
The CSAs were primarily concentrated around the Sichuan Basin, particularly in the western, northern, and southern regions of the Sichuan Basin, as well as in the border regions of southeastern Guizhou, southwestern Hunan, and northern Guangxi (Figure 2). Notably, C. fangiana was not distributed in the Qinling Mountains in southern Gansu and Shaanxi; the Daba Mountains at the junction of Gansu, Shaanxi, Sichuan, and Hubei; southeastern Xizang; or the mountainous areas in western Hubei; however, SDAs and CSAs were detected in these regions. Additionally, although C. fangiana was distributed in southeastern Yunnan, no SDAs were detected there.

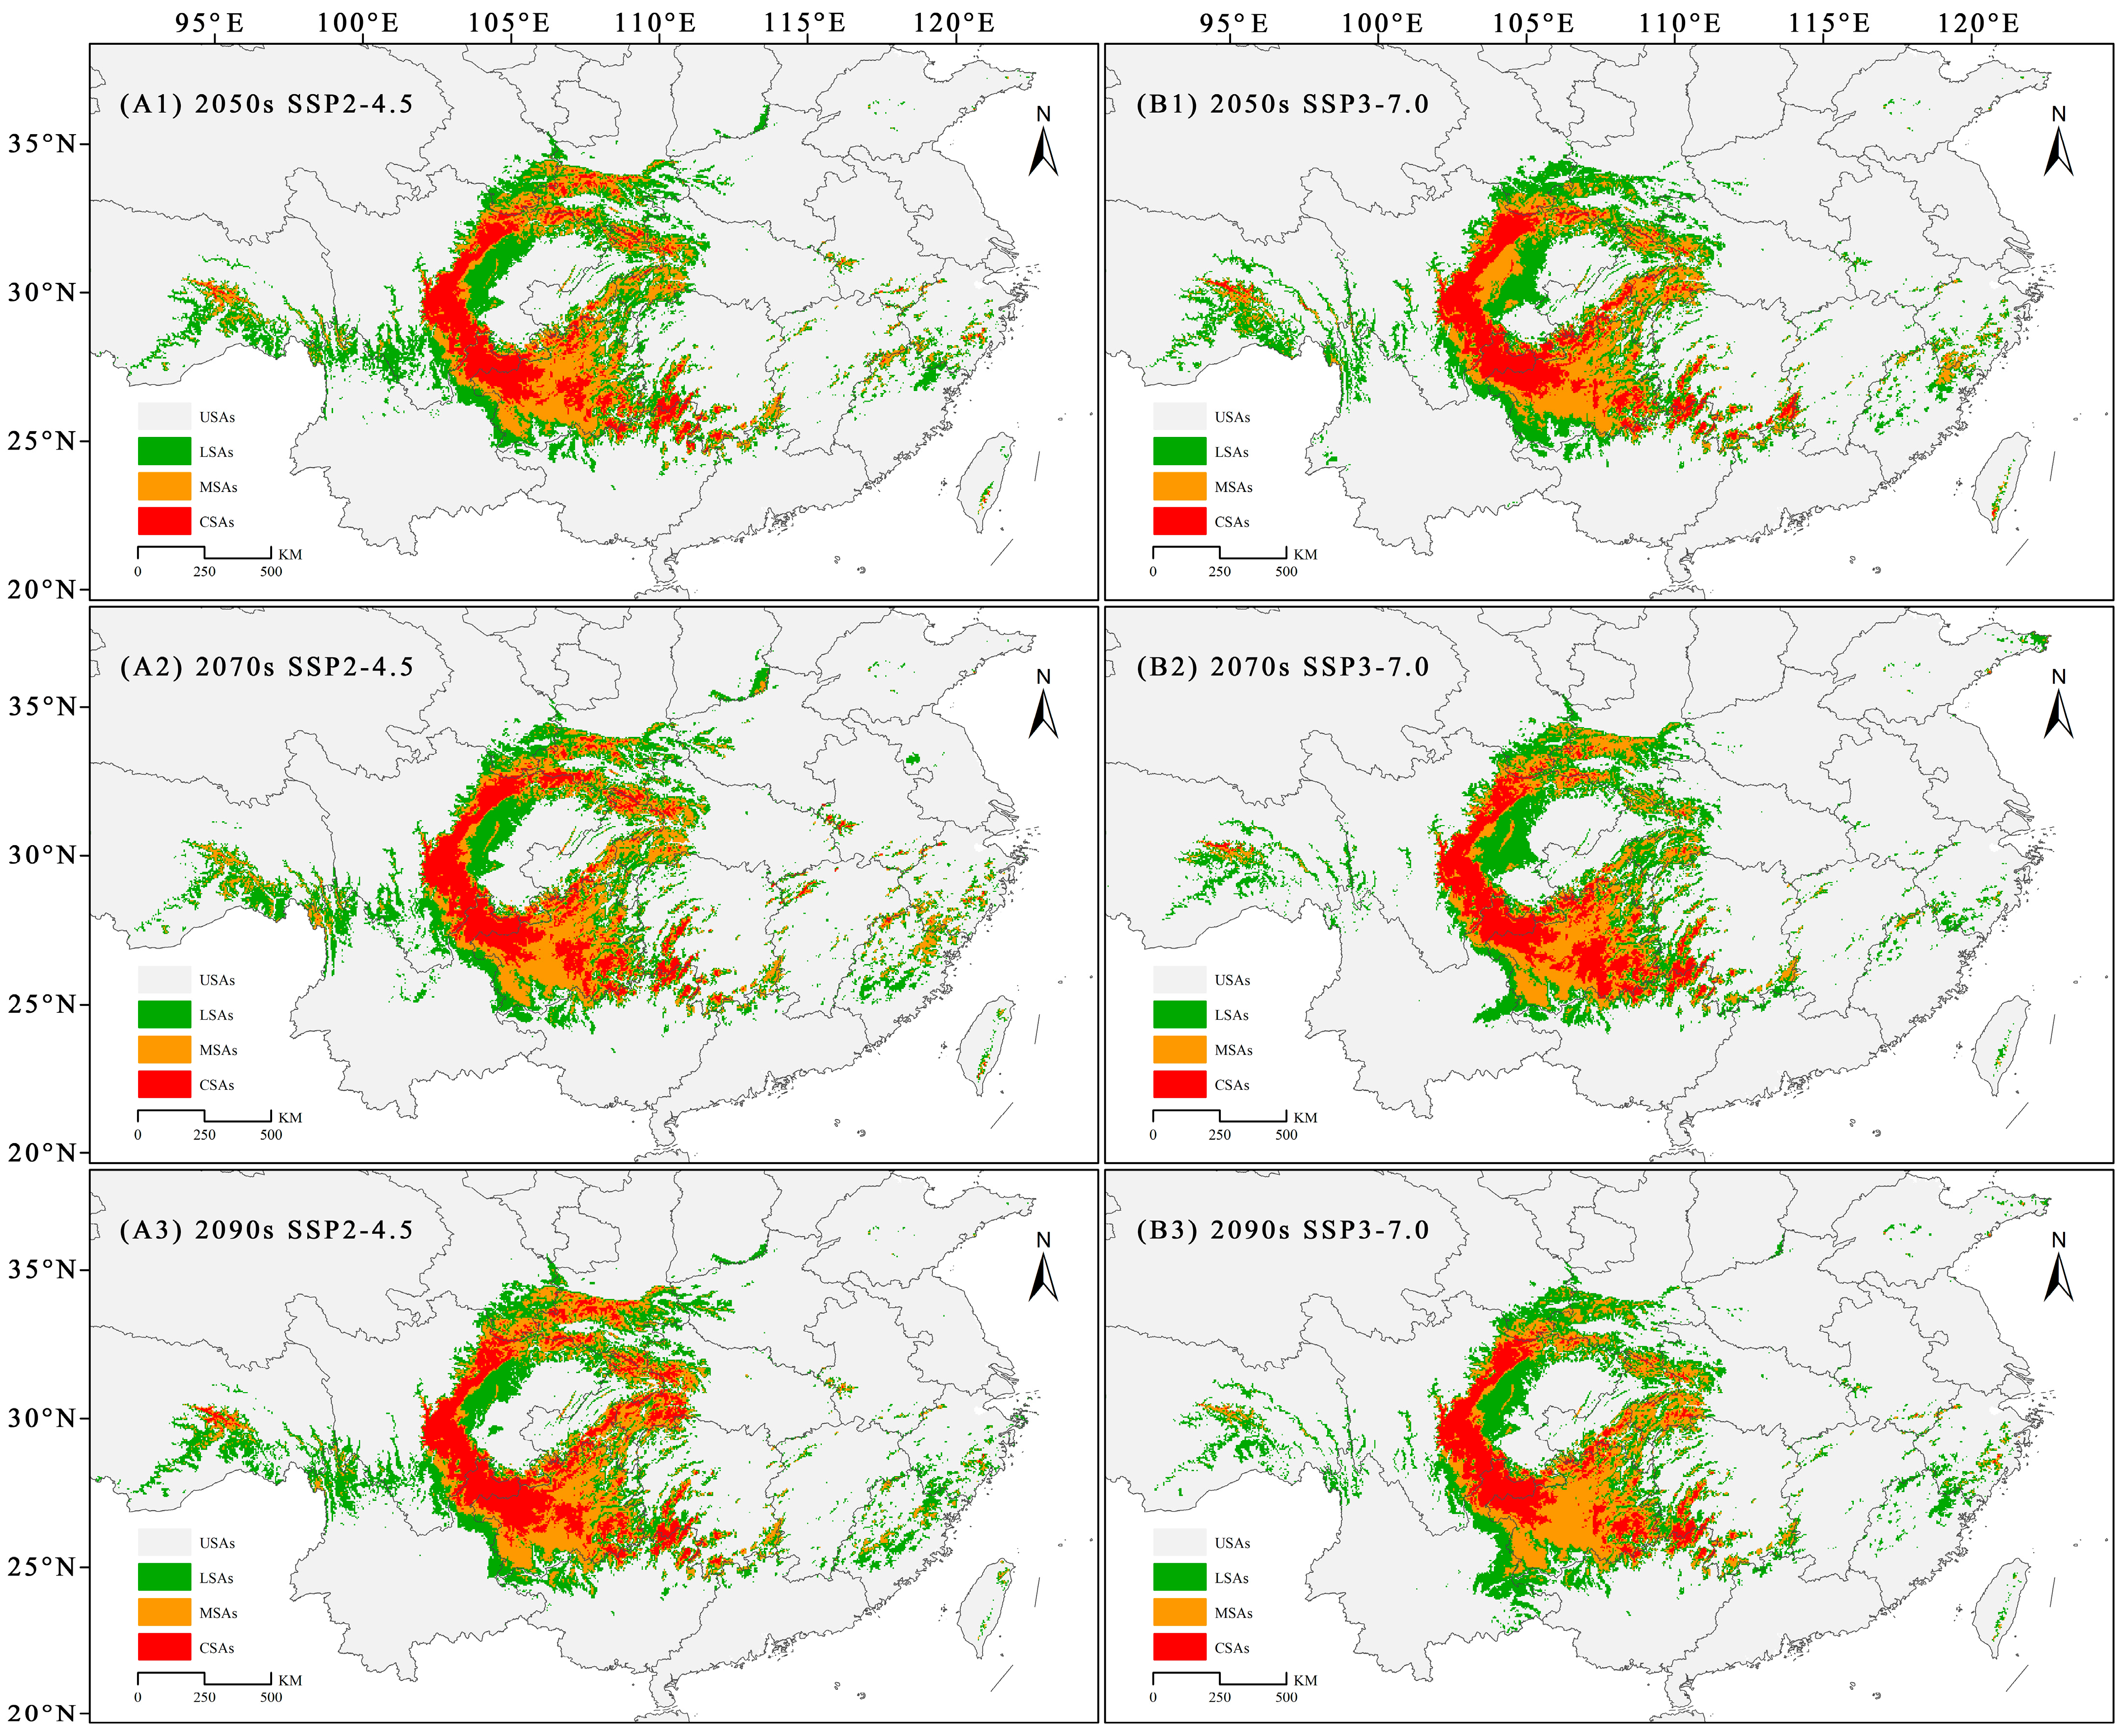
3.3. Future Potential Distribution of C. fangiana

In the future, the SDAs of C. fangiana will be primarily located around the Sichuan Basin, including central Sichuan, northeastern Yunnan, Guizhou, western Hubei, the Qinling Mountains, the Daba Mountains, southwestern Hunan, and northern Guangxi (Figure 3). The CSAs will be mainly located in central Sichuan; northeastern Yunnan; northern, northwestern, and southeastern Guizhou; northern Guangxi; and southwestern Hunan (Figure 3). Additionally, CSAs were detected in the Qinling, Daba, and Wushan mountains (Figure 3).
The SDAs and CSAs of C. fangiana showed increasing trends under the SSP2-4.5 scenario. Under the SSP3-7.0 scenario, the SDAs showed a decreasing trend, while the CSAs showed a decreasing trend in the 2090s and an increasing trend in the 2050s and 2070s (Figure 3 and Figure A4). Under all current and future climate scenarios, the area for SDAs of C. fangiana accounted for approximately 50.64 × 10⁴ km2, and the CSAs accounted for approximately 8.77 × 10⁴ km2. Under the SSP2-4.5 scenario, the SDAs accounted for approximately 62.33 × 10⁴ km2, and the CSAs accounted for approximately 11.36 × 10⁴ km2. Under the SSP3-7.0 scenario, the SDAs accounted for approximately 53.96 × 10⁴ km2, and the CSAs accounted for approximately 9.57 × 10⁴ km2 (Figure A4).
Under the current and future climate scenarios, the areas that were consistently identified as SDAs of C. fangiana were mainly located around the Sichuan Basin, including central Sichuan; the Qinling and Daba mountains at the junction with Gansu, Shaanxi, Sichuan, and Hubei; southwestern Hubei; and Guizhou (Figure 4). The areas that were consistently CSAs were mainly located in the western and southern regions of the Sichuan Basin; northwestern, northern, and southeastern Guizhou; southwestern Hunan; and northern Guangxi (Figure 4).

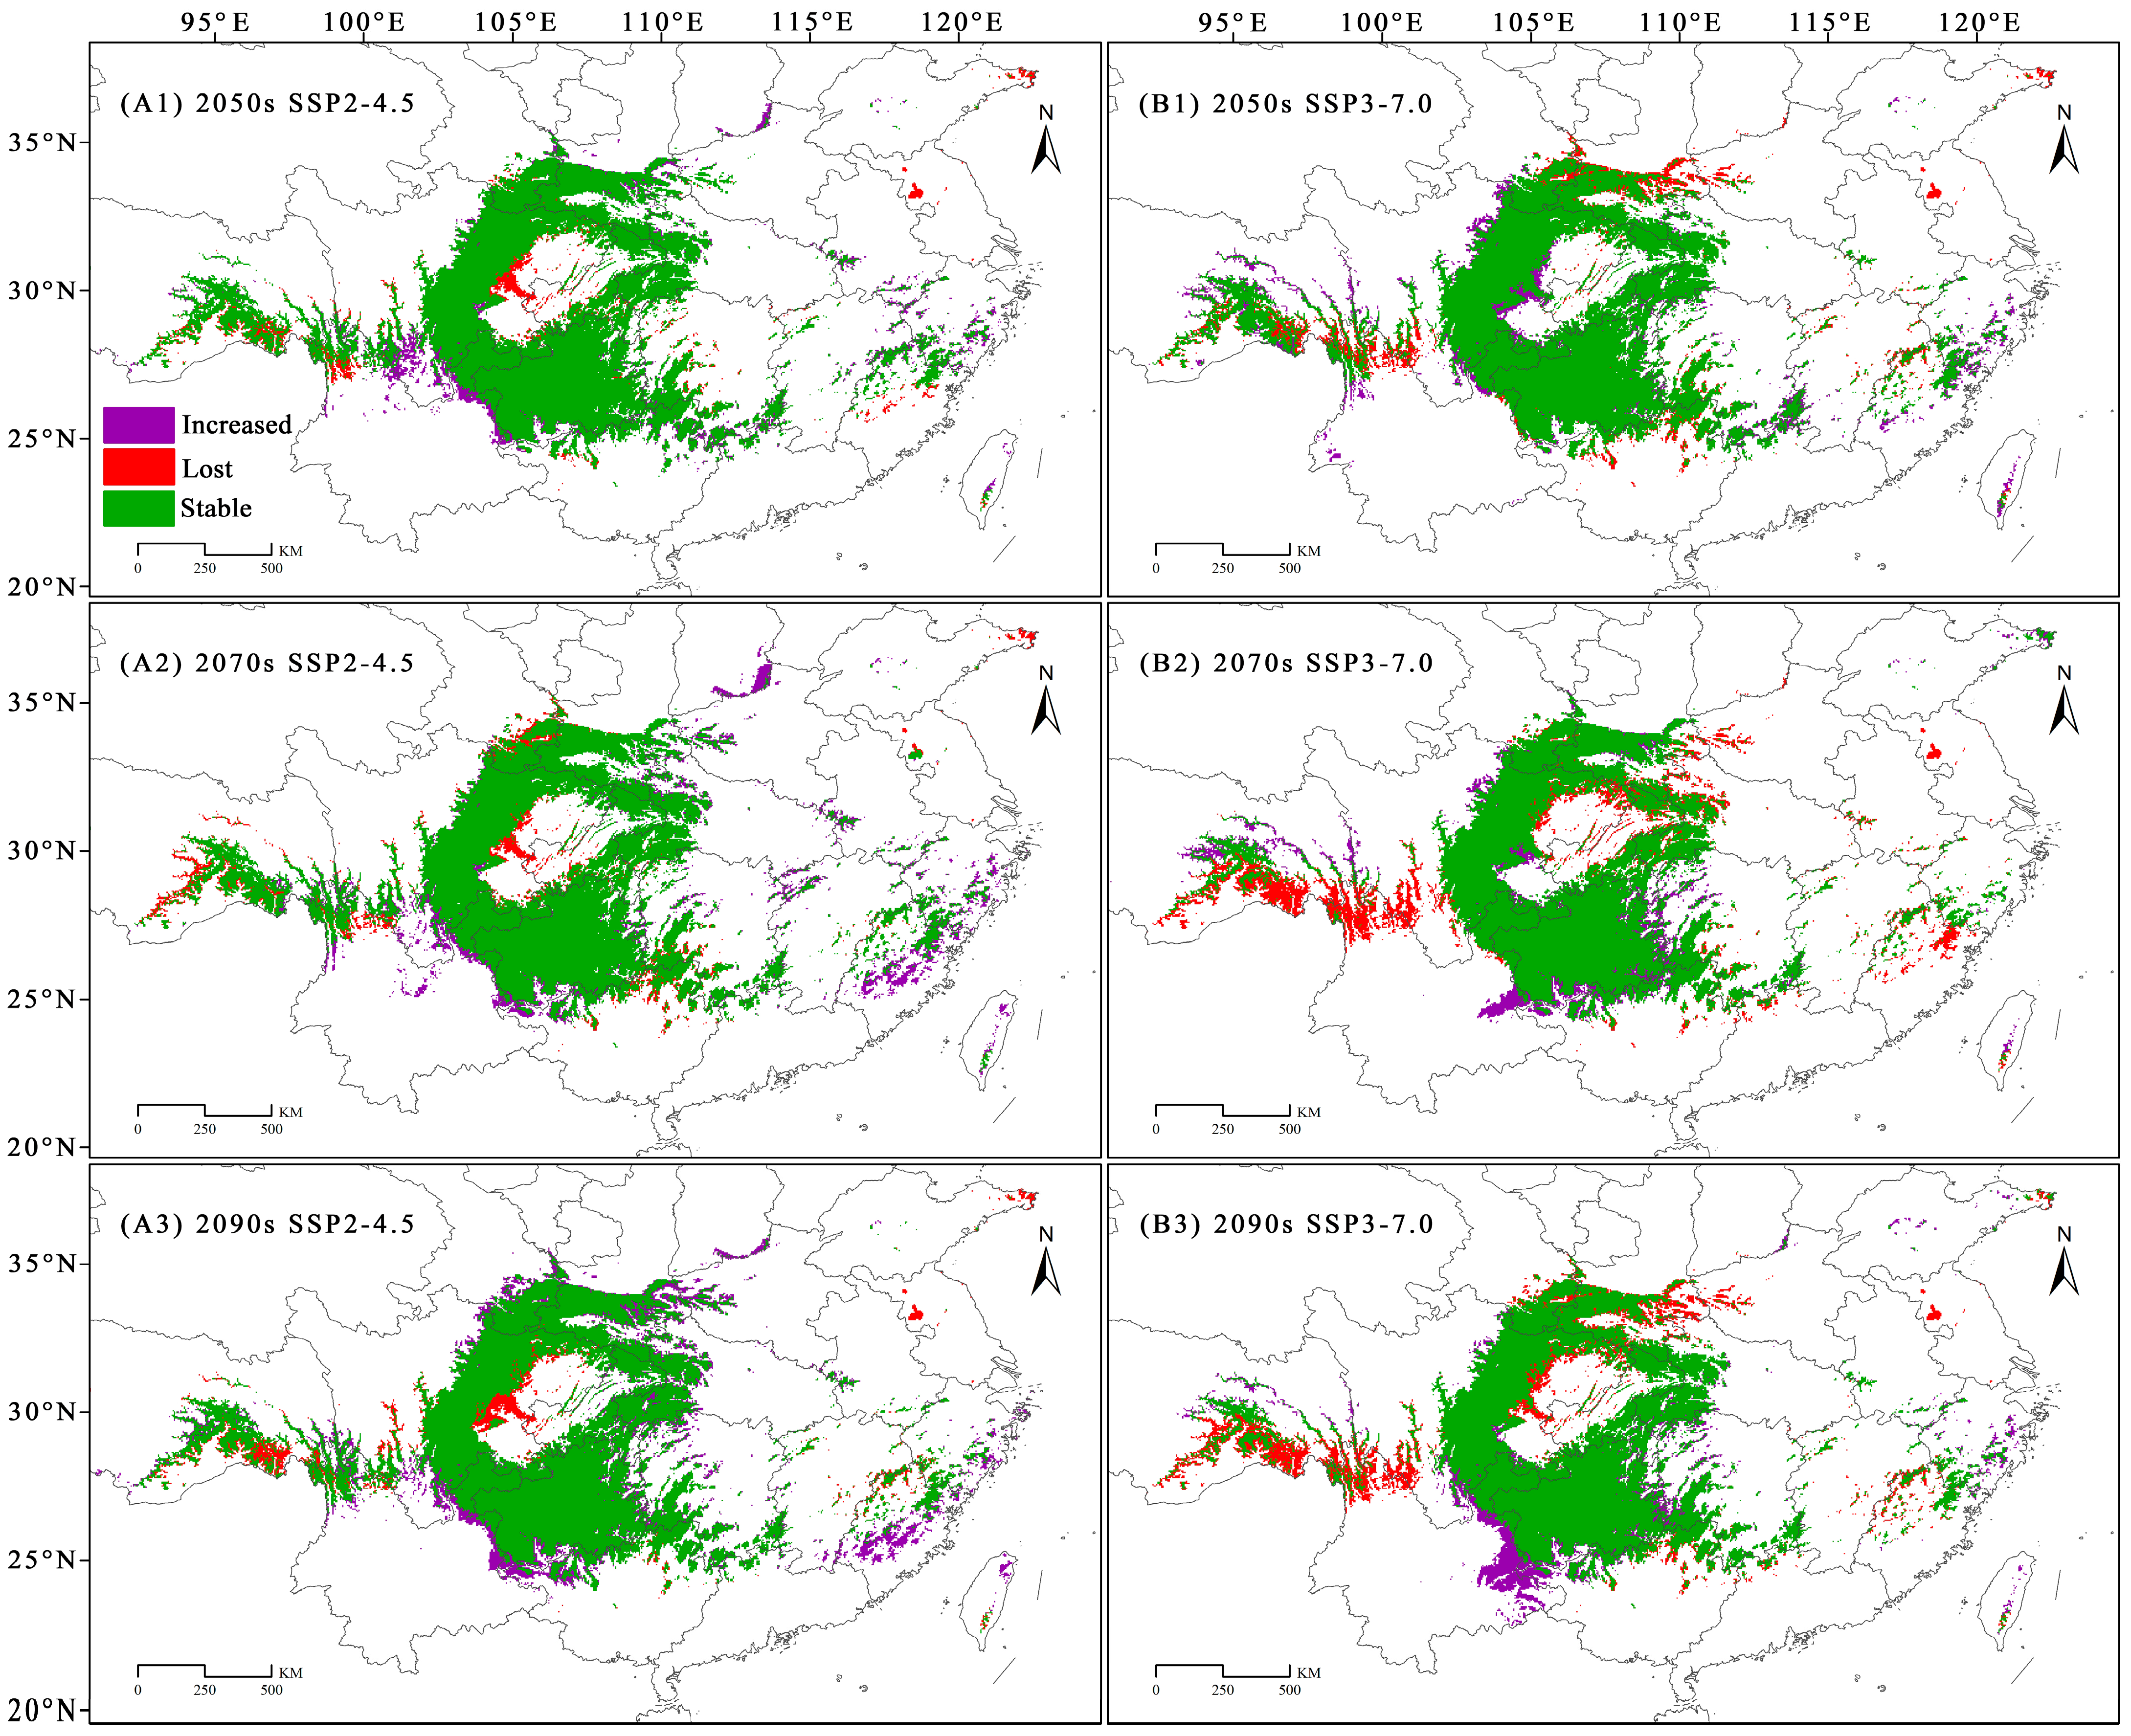
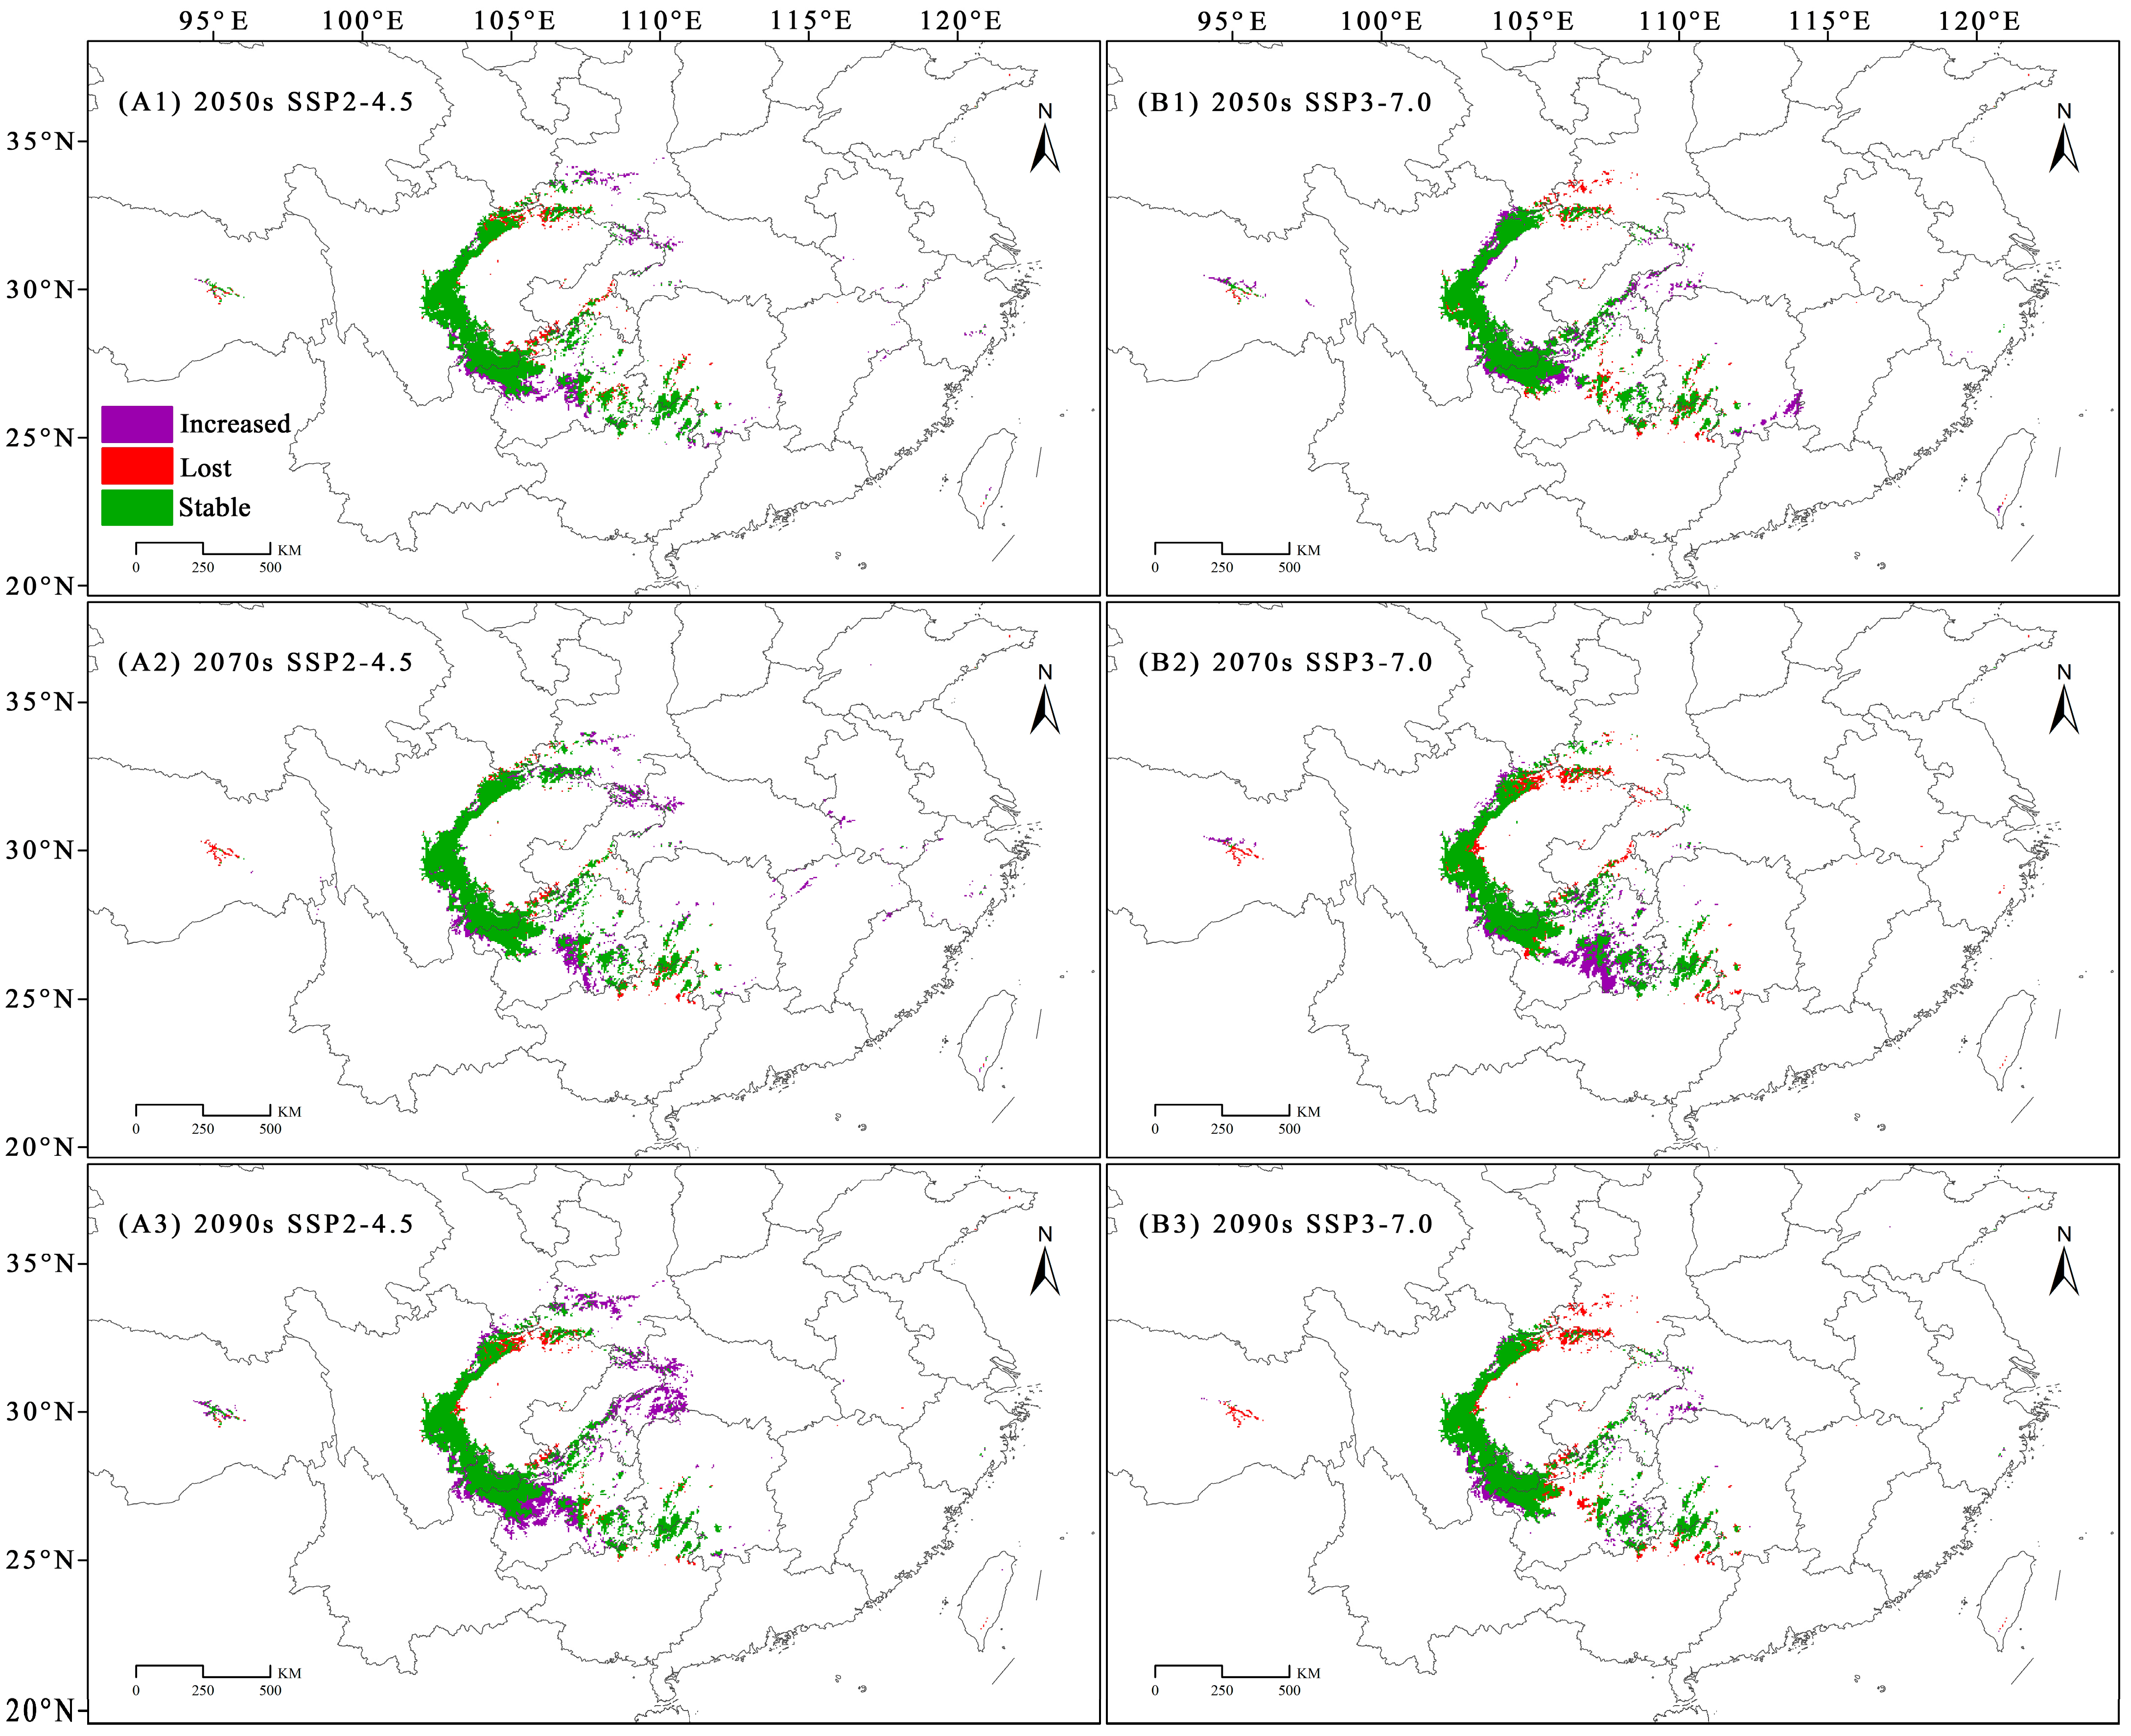
3.4. Dynamic Changes in the Geographical Distribution of C. fangiana Under Climate Change

Future climate change will likely affect the geographical distribution of C. fangiana. Compared with the distribution under the current climatic conditions, under the SSP2-4.5 scenario, the “increased” areas of the SDAs of C. fangiana were greater than the “lost” areas, while under the SSP3-7.0 scenario, the “increased” areas were less than the “lost” areas. Under all future scenarios, the areas that consistently increased represented approximately 0.32 × 10⁴ km2, while the areas that consistently decreased represented approximately 0.36 × 10⁴ km2. Specifically, under the SSP2-4.5 scenario, the areas that consistently increased represented approximately 2.51 × 10⁴ km2, while the areas that consistently decreased represented approximately 1.72 × 10⁴ km2. Under the SSP3-7.0 scenario, the areas that consistently increased represented approximately 1.45 × 10⁴ km2, whereas the areas that consistently decreased represented approximately 3.56 × 10⁴ km2 (Figure 5 and Figure A5).
Under the SSP2-4.5 scenario, the SDAs located in eastern Sichuan decreased substantially. Under the SSP3-7.0 scenario, the SDAs in the low altitude areas of the Qinling, Daba, and Wushan mountains in Central China, as well as those in Jiangxi and Fujian in Eastern China, are likely to be lost under future climate change. Under the current climate scenario, there were SDAs in southeastern Xizang and northwestern Yunnan, but these were nearly lost under the SSP3-7.0 scenario (Figure 5).
Compared with those under the current scenario, under the SSP2-4.5 scenario, the newly added CSAs of C. fangiana were larger than the lost CSAs. Under the SSP3-7.0 scenario, in the 2090s, the newly added CSAs were less than the lost CSAs, while in the 2050s and 2070s, the newly added CSAs were greater than the lost CSAs. Under all future scenarios, the area of the CSAs that consistently increased was approximately 0.25 × 10⁴ km2, while the area that consistently decreased was approximately 0.07 × 10⁴ km2. Specifically, under the SSP2-4.5 scenario, the area of the CSAs that consistently increased was approximately 1.19 × 10⁴ km2, while the area that consistently decreased was approximately 0.24 × 10⁴ km2. Under the SSP3-7.0 scenario, the area of the CSAs that consistently increased was approximately 0.46 × 10⁴ km2, while the area that consistently decreased was approximately 0.53 × 10⁴ km2 (Figure 6 and Figure A5).
Under the SSP2-4.5 scenario, the CSAs located in the northern and southern Sichuan Basin, as well as in northern Guangxi and southwestern Hunan, decreased substantially, while those in the central part of Guizhou and the Daba Mountains at the junction of Sichuan, Chongqing, Hubei, and Shaanxi increased. Under the SSP3-7.0 scenario, the CSAs in the Qinling and Daba Mountains, located at the junction of Sichuan, Gansu, and Shaanxi, as well as northern Guangxi and southwestern Hunan, decreased substantially, while some CSAs increased in the northwestern and southwestern Sichuan Basin (Figure 6).

4. Discussion

The genus Carpinus is an important component of the Tertiary fossil flora [20] and has substantial scientific research value. This genus is a vital part of forests in temperate and subtropical regions, with many species serving as pioneer trees for soil and water conservation [33] and afforestation [34], thus possessing considerable ecological value. Numerous species within this genus are used for ornamental purposes, making traditional Chinese medicine, manufacturing wood boards, and cultivating black fungus and glossy Ganoderma, which underscores their substantial economic value. However, most species of this genus remain in the wild, and only a few have been studied extensively. Although C. fangiana is an important ornamental tree species and is used in traditional Chinese medicine, its geographical distribution pattern was unclear.
According to the Flora Republicae Popularis Sinica (FRPS) [20] and the Flora of China (FOC) [21], C. fangiana is distributed only in southwestern China, including Sichuan, Guizhou, eastern Yunnan, and northern Guangxi. However, based on the collected specimen records, C. fangiana was also found in southern Chongqing and southwestern Hunan, and clear SDAs and CSAs were detected in these areas. Notably, C. fangiana is distributed in southeastern Yunnan, but no distinct SDAs were detected there. This may be because only a few effective distribution points were detected in southeastern Yunnan, and these distribution points were too concentrated. Additionally, SDAs were detected in the Qinling Mountains, the Daba Mountains, the mountainous areas of western Hubei, and southeastern Xizang, although C. fangiana is not distributed in these areas. These regions may have natural populations that have not yet been identified and could be explored through field investigations.
The survival and distribution of species are strongly correlated with climate, where temperature and precipitation are key factors affecting species distribution [35], and precipitation largely determines the survival and distribution of plants [36]. We found that under current and future climate scenarios, annual precipitation (bio12) and elevation (ele) were consistently key factors limiting the geographical distribution of C. fangiana. In particular, bio12 had the greatest effect on C. fangiana survival and distribution. Under future climate scenarios, the areas were suitable for survival when bio12 was between 1000 and 2800 mm, whereas C. fangiana could not survive if bio12 was below 600 mm or above 3600 mm. Precipitation is a key factor that limits the geographical distribution of many plants [37,38]. The species of the genus Carpinus are highly sensitive to water availability, and the critical environmental factor affecting the geographical distribution of C. cordata is also the annual precipitation [39]. Through field research and cultivation, it was found that drought could cause the leaves of Carpinus species to wilt or wither, potentially resulting in plant death.
Mountainous climatic conditions greatly influence the distribution of mountainous plants [40]. According to FRPS [20] and FOC [21], wild C. fangiana individuals were primarily distributed within an elevation range of 700–2100 m. In this study, we determined that under current and future climate scenarios, an elevation of 325–4000 m was suitable for the survival of C. fangiana, and it cannot survive at elevations below 0 m or above 5000 m. The vast majority of land in China meets these requirements, while areas above 5000 m are primarily located on the Qinghai–Tibet Plateau [41]. The Qinghai–Tibet Plateau has a cold climate, thin and dry air, intense solar radiation, and large glacier areas [41], which hinder the survival and distribution of many species.
Climate change greatly affects the survival and distribution of species, leading to their redistribution [42]. To avoid the adverse conditions caused by future climate change and rising temperatures, most species will likely migrate to higher latitudes or elevations [42,43]. Under future climate change scenarios, the SDAs of C. fangiana that were located in low-elevation areas are expected to be lost, with a trend of migration to high-elevation areas. Additionally, the SDAs in low-latitude and low-elevation areas, such as Fujian in East China and Guangxi in South China, diminished under future climate change scenarios, and there was a trend of migration toward high-latitude and high-elevation areas. Moreover, under SSP3-7.0, there was a noticeable increase in the loss of SDAs. C. fangiana is a wind-pollinating plant with small, light seeds and winged structures that can spread farther with the wind [20,21,44,45]. The species of the genus Carpinus are also often pioneer tree species in the succession of mountain forest vegetation [34,46], and their fruits can be propagated to high-altitude or high latitude areas through upwelling air currents or canyon winds to seize opportunities.
As a potential ornamental plant, future climate change may bring opportunities for its introduction and cultivation. In areas such as the Qinling–Daba Mountains and the mountainous areas of western Hubei, which have not yet been found to have distributions of C. fangiana, we identified SDAs and CSAs under the current and future climate change scenarios. In addition, almost all regions in Guizhou were its suitable distribution areas. These areas are suitable for the introduction and cultivation of C. fangiana. With the rapid development of urbanization, the maintenance and management of artificial green spaces have gradually been strengthened, which is conducive to their application and promotion. Studies have shown that climate is the key factor affecting the survival and distribution of species [47,48,49], while land use change also has a significant impact on species distribution [50]. This study found that the potential distribution areas of C. fangiana are mainly located in high-altitude mountainous areas, which rarely involve large-scale land cover changes. Its core suitable areas are almost not coincident with urban and rural residential areas and farmland. Therefore, this study mainly focuses on the impact of future climate change on its survival and distribution, without considering the influence of human factors such as land use change.

5. Conclusions

Based on specimen records, we determined that C. fangiana was distributed in southern Chongqing and southwestern Hunan. We reconstructed the current and future ecological niches of C. fangiana, and found that annual precipitation and elevation were always the key factors limiting C. fangiana distribution. Under future climate change, survival was nearly impossible at precipitation levels below 600 mm or above 3600 mm. Similarly, C. fangiana could not survive at elevations below 0 m or above 5000 m. Currently, the suitable distribution areas (SDAs) of C. fangiana were primarily located around the Sichuan Basin and Guizhou in southwestern China. There were distribution records of C. fangiana in southeastern Yunnan, however, no SDAs were detected there. The Qinling Mountains, Daba Mountains, mountainous areas of western Hubei, and southeastern Xizang did not have distributions of C. fangiana, but SDAs were detected in these regions. The core suitable areas (CSAs) were mainly concentrated around the Sichuan Basin, as well as the border areas of southeastern Guizhou, southwestern Hunan, and northern Guangxi.
Under all current and future climate scenarios, the SDAs of C. fangiana were mainly located around the Sichuan Basin, including central Sichuan; the Qinling and Daba mountains at the junction with Gansu, Shaanxi, Sichuan, and Hubei; western and southwestern Hubei; and Guizhou. The areas that were consistently identified as CSAs were primarily located in the western and southern Sichuan Basin; northwestern, northern, and southeastern Guizhou; southwestern Hunan; and northern Guangxi. These areas may be potential cultivation areas for large-scale cultivation, and it is necessary to conduct field research to further search for undiscovered germplasm resources. The results of this study elucidate the potential impact of future climate change on C. fangiana distribution, which will contribute to germplasm resource collection and cultivation management.

Author Contributions

Conceptualization, R.Z.; methodology, R.Z.; formal analysis, R.Z., Q.H. and X.C.; investigation, R.Z. and Q.H.; data curation, R.Z.; writing—original draft preparation, R.Z.; writing—review and editing, R.Z., Q.H., X.C. and Z.Z.; supervision, Z.Z.; project administration, R.Z. and Z.Z.; funding acquisition, R.Z. and Z.Z. All authors have read and agreed to the published version of the manuscript.

Funding

This research was funded by the Postgraduate Research and Practice Innovation Program of Jiangsu Province, grant number KYCX22_1104; the Forestry and Grassland Science and Technology Achievements National Promotion Project, grant number 2019[19]; the National Natural Science Foundation of China, grant number 31770752; and the “333” Scientific Research Project in Jiangsu Province, grant number BRA2018065.

Data Availability Statement

The original contributions presented in this study are included in the article. Further inquiries can be directed to the corresponding author.

Conflicts of Interest

The authors declare no conflicts of interest.

Abbreviations

The following abbreviations are used in this manuscript:
AUCArea under the curve
BCC-CSM2-MRBeijing Climate Center-Climate System Model version 2-Medium Resolution
CMIPCoupled Model Intercomparison Project Phase
CSAsCore suitable areas
CVHChinese Virtual Herbarium
IPCCIntergovernmental Panel on Climate Change
LSAsLow suitable areas
MaxEntMaximum Entropy
MSAsModerately suitable areas
RCPRepresentative concentration pathway
SDAsSuitable distribution areas
SSPsShared socioeconomic pathways

Appendix A

Table A1. The 20 variables and contribution rate of MaxEnt model (%).
VariablesVariable DescriptionUnitPercent Contribution
bio12Annual Precipitationmm34.4
eleElevationm25.3
bio03Isothermality (bio02/bio07) (×100)%7.6
bio06Min Temperature of Coldest Month°C6.9
bio04Temperature Seasonality (standard deviation × 100)%5.6
bio14Precipitation of Driest Monthmm5.1
bio15Precipitation Seasonality (Coefficient of Variation)%4.0
bio09Mean Temperature of Driest Quarter°C2.9
bio07Temperature Annual Range (bio05-bio6)°C2.5
bio02Mean Diurnal Range
(Mean of monthly (max temp − min temp))
°C2.0
bio11Mean Temperature of Coldest Quarter°C1.7
bio17Precipitation of Driest Quartermm0.8
bio19Precipitation of Coldest Quartermm0.4
bio10Mean Temperature of Warmest Quarter°C0.3
bio18Precipitation of Warmest Quartermm0.2
bio05Max Temperature of Warmest Month°C0.2
bio13Precipitation of Wettest Monthmm0.1
bio08Mean Temperature of Wettest Quarter°C0.1
bio16Precipitation of Wettest Quartermm0
bio01Annual Mean Temperature°C0

Appendix B

Figure A1. The correlation coefficient between the bioclimatic variables.
Horticulturae 11 00575 g0a1
Figure A2. The AUC value of MaxEnt Model output.
Horticulturae 11 00575 g0a2
Figure A3. Contribution rates of environmental variables in the MaxEnt model (%).
Horticulturae 11 00575 g0a3
Figure A4. The area of potential distribution areas of Carpinus fangiana (×104 km2). (A,B) Climate scenarios of SSP2-4.5 and SSP3-7.0, respectively. LSAs: low suitable areas, MSAs: moderately suitable areas, CSAs: core suitable areas, SDAs: suitable distribution areas.
Horticulturae 11 00575 g0a4
Figure A5. The area changes in the suitable distribution areas and core suitable areas of Carpinus fangiana (×104 km2). (A1,A2) suitable distribution areas, (B1,B2) core suitable areas.
Horticulturae 11 00575 g0a5

References

  1. Kogan, F. The IPCC Reports on Global Warming and Land Changes. In Remote Sensing Land Surface Changes; Springer: Cham, Switzerland, 2022. [Google Scholar] [CrossRef]
  2. Calvin, K.; Dasgupta, D.; Krinner, G.; Mukherji, A.; Thorne, P.W.; Trisos, C.; Romero, J.; Aldunce, P.; Barrett, K.; Blanco, G.; et al. IPCC, 2023: Climate Change 2023: Synthesis Report. Contribution of Working Groups I, II and III to the Sixth Assessment Report of the Intergovernmental Panel on Climate Change; Core Writing Team, Lee, H., Romero, J., Eds.; IPCC: Geneva, Switzerland, 2023. [Google Scholar]
  3. Bellard, C.; Bertelsmeier, C.; Leadley, P.; Thuiller, W.; Courchamp, F. Impacts of climate change on the future of biodiversity. Ecol. Lett. 2012, 15, 365–377. [Google Scholar] [CrossRef] [PubMed]
  4. Urban, M.C. Accelerating extinction risk from climate change. Science 2015, 348, 571–573. [Google Scholar] [CrossRef]
  5. Malanoski, C.M.; Farnsworth, A.; Lunt, D.J.; Valdes, P.J.; Saupe, E.E. Climate change is an important predictor of extinction risk on macroevolutionary timescales. Science 2024, 383, 1130–1134. [Google Scholar] [CrossRef]
  6. Zhao, R.N.; Chu, X.J.; He, Q.Q.; Tang, Y.; Song, M.; Zhu, Z.L. Modeling current and future potential geographical distribution of Carpinus tientaiensis, a critically endangered species from China. Forests 2020, 11, 774. [Google Scholar] [CrossRef]
  7. Briscoe, N.J.; Morris, S.D.; Mathewson, P.D.; Buckley, L.B.; Jusup, M.; Levy, O.; Maclean, I.M.; Pincebourde, S.; Riddell, E.A.; Roberts, J.A.; et al. Mechanistic forecasts of species responses to climate change: The promise of biophysical ecology. Glob. Change Biol. 2023, 29, 1451–1470. [Google Scholar] [CrossRef]
  8. Franklin, J. Species distribution modelling supports the study of past, present and future biogeographies. J. Biogeogr. 2023, 50, 1533–1545. [Google Scholar] [CrossRef]
  9. Phillips, S.J.; Dudík, M.; Schapire, R.E. A maximum entropy approach to species distribution modeling. In Proceedings of the Twenty-First International Conference on Machine Learning (ICML ’04), Banff, AB, Canada, 4–8 July 2004; Association for Computing Machinery: New York, NY, USA, 2004. [Google Scholar] [CrossRef]
  10. Phillips, S.J.; Anderson, R.P.; Dudík, M.; Schapire, R.E.; Blair, M.E. Opening the black box: An open-source release of Maxent. Ecography 2017, 40, 887–893. [Google Scholar] [CrossRef]
  11. Ahmadi, M.; Hemami, M.R.; Kaboli, M.; Shabani, F. MaxEnt brings comparable results when the input data are being completed; Model parameterization of four species distribution models. Ecol. Evol. 2023, 13, e9827. [Google Scholar] [CrossRef]
  12. Mapunda, K.K.; Andrew, S.M. Predicting the distribution of critically endangered tree species Karomia gigas under climate change in Tanzania. Ecol. Eng. 2023, 195, 107065. [Google Scholar] [CrossRef]
  13. Zhao, R.N.; He, Q.Q.; Chu, X.J.; He, A.G.; Zhang, Y.L.; Zhu, Z.L. Regional environmental differences significantly affect the genetic structure and genetic differentiation of Carpinus tientaiensis Cheng, an endemic and extremely endangered species from China. Front. Plant Sci. 2024, 15, 1277173. [Google Scholar] [CrossRef]
  14. Li, X.L.; Wu, K.N.; Hao, S.H.; Yue, Z.; Ran, Z.; Ma, J.L. Mapping cropland suitability in China using optimized MaxEnt model. Field Crop. Res. 2023, 302, 109064. [Google Scholar] [CrossRef]
  15. Yang, Y.; He, J.; Liu, Y.X.; Zeng, J.X.; Zeng, L.Q.; He, R.L.; Guiang, M.M.; Li, Y.Q.; Wu, H. Assessment of Chinese suitable habitats of Zanthoxylum nitidum in different climatic conditions by Maxent model, HPLC, and chemometric methods. Ind. Crops Prod. 2023, 196, 116515. [Google Scholar] [CrossRef]
  16. Wang, Y.J.; Zhao, R.X.; Zhou, X.Y.; Zhang, X.L.; Zhao, G.H.; Zhang, F.G. Prediction of potential distribution areas and priority protected areas of Agastache rugosa based on Maxent model and Marxan model. Front. Plant Sci. 2023, 14, 1200796. [Google Scholar] [CrossRef]
  17. Huang, L.L.; Li, S.F.; Huang, W.Y.; Jin, J.H.; Oskolski, A.A. Late Pleistocene glacial expansion of a low-latitude species Magnolia insignis: Megafossil evidence and species distribution modeling. Ecol. Indic. 2024, 158, 111519. [Google Scholar] [CrossRef]
  18. Cui, L.; Berger, U.; Cao, M.; Zhang, Y.; He, J.; Pan, L.; Jiang, J. Conservation and Restoration of Mangroves in Response to Invasion of Spartina alterniflora Based on the MaxEnt Model: A Case Study in China. Forests 2023, 14, 1220. [Google Scholar] [CrossRef]
  19. Sorbe, F.; Gränzig, T.; Förster, M. Evaluating sampling bias correction methods for invasive species distribution modeling in Maxent. Ecol. Inform. 2023, 76, 102124. [Google Scholar] [CrossRef]
  20. Li, P.Q.; Zheng, S.X. Betulaceae. In Flora Republicae Popularis Sinica 21; Kuang, K.R., Li, P.Q., Eds.; Science Press: Beijing, China, 1979; pp. 84–85. [Google Scholar]
  21. Li, P.C.; Skvortsov, A.K. Betulaceae. In Flora of China 4; Wu, C.Y., Raven, P.H., Eds.; Science Press: Beijing, China, 1999; pp. 289–300. [Google Scholar]
  22. Holstein, N.; Weigend, M. No taxon left behind? A critical taxonomic checklist of Carpinus and Ostrya (Coryloideae, Betulaceae). Eur. J. Taxon. 2017, 375, 1–52. [Google Scholar] [CrossRef]
  23. Xue, L.; Jia, L.B.; Nam, G.S.; Huang, Y.J.; Zhang, S.T.; Wang, Y.Q.; Zhou, Z.; Chen, Y.S. Involucre fossils of Carpinus, a northern temperate element, from the Miocene of China and the evolution of its species diversity in East Asia. Plant Divers. 2020, 42, 155–167. [Google Scholar] [CrossRef]
  24. Dong, C.C.; Lu, Z.Q.; Zhang, H.; Liu, J.Q.; Li, M.J. Delimiting 33 Carpinus (Betulaceae) species with a further phylogenetic inference. AoB Plants 2022, 14, plac006. [Google Scholar] [CrossRef]
  25. Hu, H.H. Two new species of Carpinus from Szechuan. J. Arnold Arbor. 1929, 10, 154–156. [Google Scholar] [CrossRef]
  26. Lancaster, R.; Rix, M. 705. Carpinus fangiana. Curtis’s Bot. Mag. 2011, 28, 103–110. [Google Scholar] [CrossRef]
  27. Yang, X.Y.; Wang, Z.F.; Zhang, L.; Hao, G.Q.; Liu, J.Q.; Yang, Y.Z. A chromosome-level reference genome of the hornbeam, Carpinus fangiana. Sci. Data 2020, 7, 24. [Google Scholar] [CrossRef]
  28. Wang, Z.F.; Jiang, Y.Z.; Yang, X.Y.; Bi, H.; Li, J.L.; Mao, X.X.; Ma, Y.Z.; Ru, D.F.; Zhang, C.; Hao, G.Q.; et al. Molecular signatures of parallel adaptive divergence causing reproductive isolation and speciation across two genera. Innovation 2022, 3, 100247. [Google Scholar] [CrossRef] [PubMed]
  29. Wang, Z.F.; Kang, M.H.; Li, J.L.; Zhang, Z.Y.; Wang, Y.F.; Chen, C.L.; Yang, Y.L.; Liu, J.Q. Genomic evidence for homoploid hybrid speciation between ancestors of two different genera. Nat. Commun. 2022, 13, 1987. [Google Scholar] [CrossRef]
  30. Chen, H.P.; Sun, J.Q.; Lin, W.Q.; Xu, H.W. Comparison of CMIP6 and CMIP5 models in simulating climate extremes. Sci. Bull. 2020, 65, 1415–1418. [Google Scholar] [CrossRef] [PubMed]
  31. Wu, T.; Lu, Y.; Fang, Y.; Xin, X.; Li, L.; Li, W.; Jie, W.; Zhang, J.; Liu, Y.; Zhang, L.; et al. The Beijing Climate Center Climate System Model (BCC-CSM): The main progress from CMIP5 to CMIP6. Geosci. Model Dev. 2019, 12, 1573–1600. [Google Scholar] [CrossRef]
  32. Xin, X.; Wu, T.; Zhang, J.; Yao, J.; Fang, Y. Comparison of CMIP6 and CMIP5 simulations of precipitation in China and the East Asian summer monsoon. Int. J. Climatol. 2020, 40, 6423–6440. [Google Scholar] [CrossRef]
  33. Liang, S.C. A preliminary study on the structure and dynamics of pubescent hornbeam population in karst mountain of Guiyang. Chin. J. Plant Ecol. 1992, 16, 108–117. [Google Scholar]
  34. Verma, D.; Singh, G.; Ram, N. Carpinus viminea: A pioneer tree species of old landslide regions of Indian Himalaya. Curr. Sci. 2009, 97, 1277–1278. [Google Scholar]
  35. Gutierrez-Hernandez, O.; Garcia, L.V. Chapter 11-relationship between precipitation and species distribution. In Precipitation; Rodrigo-Comino, J., Ed.; Elsevier Science: Amsterdam, The Netherlands, 2021; pp. 239–259. [Google Scholar] [CrossRef]
  36. Amissah, L.; Mohren, G.M.J.; Bongers, F.; Hawthorne, W.D.; Poorter, L. Rainfall and temperature affect tree species distribution in Ghana. J. Trop. Ecol. 2014, 30, 435–446. [Google Scholar] [CrossRef]
  37. Shi, P.J.; Preisler, H.K.; Quinn, B.K.; Zhao, J.; Huang, W.W.; Röll, A.; Cheng, X.F.; Li, H.R.; Hölscher, D. Precipitation is the most crucial factor determining the distribution of moso bamboo in Mainland China. Glob. Ecol. Conserv. 2020, 22, e00924. [Google Scholar] [CrossRef]
  38. Zhang, L.J.; Zhu, L.Q.; Li, Y.H.; Zhu, W.B.; Chen, Y.Y. Maxent Modelling Predicts a Shift in Suitable Habitats of a Subtropical Evergreen Tree (Cyclobalanopsis glauca (Thunberg) Oersted) under Climate Change Scenarios in China. Forests 2022, 13, 126. [Google Scholar] [CrossRef]
  39. Zhao, R.N.; He, Q.Q.; Chu, X.J.; Lu, Z.Q.; Zhu, Z.L. Prediction of potential distribution of Carpinus cordata in China under climate change. Chin. J. Appl. Ecol. 2019, 30, 3833–3843. [Google Scholar]
  40. Oke, O.A.; Thompson, K.A. Distribution models for mountain plant species: The value of elevation. Ecol. Model. 2015, 301, 72–77. [Google Scholar] [CrossRef]
  41. Wang, J.; Liang, S.; Shi, P. Topography and Landforms. In The Geography of Contemporary China; World Regional Geography Book Series; Springer: Cham, Switzerland, 2022. [Google Scholar]
  42. Chen, I.C.; Hill, J.K.; Ohlemüller, R.; Roy, D.B.; Thomas, C.D. Rapid range shifts of species associated with high levels of climate warming. Science 2011, 333, 1024–1026. [Google Scholar] [CrossRef]
  43. Spence, A.R.; Tingley, M.W. The challenge of novel abiotic conditions for species undergoing climate-induced range shifts. Ecography 2020, 43, 1571–1590. [Google Scholar] [CrossRef]
  44. Chen, Z.D. Phylogeny and Phytogeography of the Betulaceae. Acta Phytotaxon. Sin. 1994, 32, 1–31. Available online: https://www.plantsystematics.com/CN/Y1994/V32/I1/1 (accessed on 1 January 2025).
  45. Chen, Z.D. Phylogeny and Phytogeography of the Betulaceae (Cont.). Acta Phytotaxon. Sin. 1994, 32, 101–153. Available online: https://www.plantsystematics.com/CN/Y1994/V32/I2/101 (accessed on 1 January 2025).
  46. Liang, S.C. Study on dynamics of pubescent hornbeam population in Karst Mountain of Guiyang. Acta Ecol. Sin. 1992, 12, 53–60. [Google Scholar]
  47. Manthey, M.; Box, E. Realized climatic niches of deciduous trees: Comparing western Eurasia and eastern North America. J. Biogeogr. 2007, 34, 1028–1040. [Google Scholar] [CrossRef]
  48. Carotenuto, F.; Di Febbraro, M.; Melchionna, M.; Castiglione, S.; Saggese, F.; Serio, C.; Mondanaro, A.; Passaro, F.; Loy, A.; Raia, P. The influence of climate on species distribution over time and space during the late Quaternary. Quat. Sci. Rev. 2016, 149, 188–199. [Google Scholar] [CrossRef]
  49. Román-Palacios, C.; Wiens, J.J. Recent responses to climate change reveal the drivers of species extinction and survival. Proc. Natl. Acad. Sci. USA 2020, 117, 4211–4217. [Google Scholar] [CrossRef] [PubMed]
  50. Tsiftsis, S.; Štípková, Z.; Rejmánek, M.; Kindlmann, P. Predictions of species distributions based only on models estimating future climate change are not reliable. Sci. Rep. 2024, 14, 25778. [Google Scholar] [CrossRef] [PubMed]
Figure 1. Response curves of the major environmental variables. (A1A5) current period. (B1,B2,D1,D2,F1,F2) SSP2-4.5 climate scenario for the 2050s, 2070s, and 2090s, respectively. (C1C3,E1E3,G1G3) SSP3-7.0 climate scenario for the 2050s, 2070s, and 2090s, respectively.
Horticulturae 11 00575 g001
Figure 2. The current potential geographical distribution of Carpinus fangiana. AH: Anhui Province; CQ: Chongqing City; FJ: Fujian Province; GD: Guangdong Province; GS: Gansu Province; GX: Guangxi Zhuang Autonomous Region; GZ: Guizhou Province; HB: Hubei Province; HEN: Henan Province; HUN: Hunan Province; JS: Jiangsu Province; JX: Jiangxi Province; SaX: Shaanxi Province; SC: Sichuan Province; SD: Shandong Province; TW: Taiwan Province; XZ: Xizang Autonomous Region; YN: Yunnan Province; ZJ: Zhejiang Province.
Horticulturae 11 00575 g002
Figure 3. Potential distribution of Carpinus fangiana under future climate scenarios. USAs: unsuitable areas; LSAs: low suitable areas; MSAs: moderately suitable areas; CSAs: core suitable areas. (A1A3) SSP2-4.5 climate scenario for the 2050s, 2070s, and 2090s, respectively. (B1B3) SSP3-7.0 climate scenario for the 2050s, 2070s, and 2090s, respectively.
Horticulturae 11 00575 g003
Figure 4. The stable suitable distribution areas (SDAs) and core suitable areas (CSAs) of Carpinus fangiana. (A1,B1) The SDAs and CSAs under the SSP2-4.5 scenario, respectively. (A2,B2) The SDAs and CSAs under the SSP3-7.0 scenario, respectively. (A3,B3) The SDAs and CSAs in all current and future climate scenarios, respectively.
Horticulturae 11 00575 g004
Figure 5. The dynamic changes in suitable distribution areas (SDAs) of Carpinus fangiana. (A1A3) SSP2-4.5 climate scenario for the 2050s, 2070s, and 2090s, respectively. (B1B3) SSP3-7.0 climate scenario for the 2050s, 2070s, and 2090s, respectively.
Horticulturae 11 00575 g005
Figure 6. The dynamic changes in the core suitable areas (CSAs) of Carpinus fangiana. (A1A3) SSP2-4.5 climate scenario for the 2050s, 2070s, and 2090s, respectively. (B1B3) SSP3-7.0 climate scenario for the 2050s, 2070s, and 2090s, respectively.
Horticulturae 11 00575 g006
Disclaimer/Publisher’s Note: The statements, opinions and data contained in all publications are solely those of the individual author(s) and contributor(s) and not of MDPI and/or the editor(s). MDPI and/or the editor(s) disclaim responsibility for any injury to people or property resulting from any ideas, methods, instructions or products referred to in the content.

