Article

A Point Mutation of the Alpha-Tubulin Gene ClTUA Causes Dominant Dwarf Phenotype in Watermelon (Citrullus lanatus)

1
Ningbo Academy of Agricultural Sciences, Ningbo 315040, China
2
Shandong Laboratory of Advanced Agricultural Sciences, Peking University Institute of Advanced Agricultural Sciences, Weifang 261325, China
*
Author to whom correspondence should be addressed.
Horticulturae 2025, 11(6), 562; https://doi.org/10.3390/horticulturae11060562
Submission received: 20 April 2025 / Revised: 13 May 2025 / Accepted: 19 May 2025 / Published: 22 May 2025
(This article belongs to the Special Issue Germplasm Resources and Genetics Improvement of Watermelon and Melon)

Abstract

:
Vine length is a crucial plant architecture trait in watermelon, which determines its height. In this study, we identified a dominant dwarf watermelon mutant by treating G42 with Ethyl methanesulfonate (EMS). In order to clarify the causes of the dwarfism in mutants, genetic statistics, phenotypic observation, and cytological observation were carried out. Meanwhile, individual resequencing combined with molecular markers was used to map the candidate gene. Our results demonstrated that the dwarf mutant exhibited incomplete dominance. The dwarf plants showed a decrease in the number of internodal cells, shortened internodes, and reduced vine length. Gene mapping indicated that the target gene responsible for this mutation was ClTUA, which encodes α-tubulin. A point mutation in the dwarf plants was identified, specifically, a change from C to T at the 1851st base pair. Further experiments, including transcriptome analysis and Liquid Chromatography–Tandem Mass Spectrometry (LC-MS/MS), revealed that this gene mutation affected auxin synthesis, leading to the dwarfing of the plants. This study provides new germplasm resources and a theoretical foundation for plant architecture breeding in watermelon.

1. Introduction

Watermelon (Citrullus lanatus) is an important economic crop in China, valued not only for its refreshing qualities as a popular summer fruit but also for its pivotal role in rural revitalization and improving farmers’ livelihoods due to its high cultivation efficiency [1]. China is the largest producer and consumer of watermelons in the world. According to the data statistics of the Food and Agriculture Organization of the United Nations (FAO) (http://www.fao.org, accessed on 1 March 2025), China’s watermelon production reached 63.24 million tons in 2023, accounting for more than 70% of the world’s total watermelon production. However, with the rapid pace of urbanization and a declining agricultural labor force, traditional labor-intensive watermelon cultivation methods are increasingly unsustainable. In response to these challenges, the development and adoption of simplified and labor-saving cultivation practices have become essential for ensuring productivity and maximizing returns under limited labor and land resources.
Since the onset of the first “Green Revolution”, substantial progress has been made in reducing plant height, which has improved light energy utilization, enhanced lodging resistance, and increased compatibility with mechanized cultivation, management, and harvesting [2,3]. In watermelon, vine length affects plant height. Excessively tall plants increase the complexity and labor requirements of field management practices, such as vine training, tying, pesticide application, and harvesting. Additionally, excessive height can hinder proper ventilation in the growth area. Mutants provide valuable genetic resources for understanding the regulatory mechanisms of plant height [4]. Take rice as an example, where more than 90 dwarf mutants have been identified. Among them, most of the dwarf mutants such as d50, dwl1, tdd, ddu1, htd3, and sad1 are controlled by recessive genes [5,6,7], while KL908, Y98149, DS1, 986083D, D1, DMF-1, Sdt97, D53, and KA-902 are controlled by dominant genes [8,9]. Another example is maize. Plant height can be influenced by multiple genes or a single gene. Currently, over 60 single genes associated with maize dwarfism have been reported, such as brachytic (br), brachytic2 (br-2), brevis plant1 (bv1), Dwarf8 (D8), etc. Among them, D8, D9, D(t), D-10, D11, and D8-1023 are dominantly inherited, and the others are recessively inherited [10,11]. Vine length is an important plant architecture trait of watermelon. For watermelon, the reported dwarf mutants include dw-1, dw-1s, dw-2, dw-3, dw-4, SV-1, and dsh [12,13,14,15,16]. Currently, most of the reported dwarf mutants in cucurbit crops are controlled by recessive genes, and there has been no report of a dominant dwarf mutant in watermelon.
The release of the whole-genome sequence for the cultivated watermelon variety 97103 in Southeast Asia [17], along with the telomere-to-telomere (T2T) reference genome assembly of the watermelon line G42 [18], has provided valuable genomic resources for gene mapping, cloning, and functional analysis of key agronomic traits in watermelon. Researchers have mapped four dwarf genes in watermelons. Wei et al. [19] and Gebremeskel et al. [20] utilized various watermelon mapping populations to map the same gene, Cla015407. This gene is located on chromosome 9 and encodes a gibberellin 3 β-hydroxylase protein (GA3ox). Jang et al. [21] located another gene, Cla015405, on chromosome 9 through BSA analysis and high-resolution melting analysis. This gene encodes a GA2-oxidase protein (GA2ox). Dong et al. [22] mapped the candidate gene Cla010726 located on chromosome 7 in the dwarf mutant dsh through Bulked Segregant Analysis by Sequencing (BSA-seq), and speculated that this gene encodes a GA20-oxidase-like protein. In addition to these dwarf genes related to the synthesis and metabolism of gibberellin, by using the stable dwarf inbred line WM102 developed from “Bush Sugar Baby”, the candidate gene was mapped to Cla010337 on chromosome 9 through BSA-seq. This gene encodes an ABCB subfamily transporter and may be involved in the auxin transport pathway [23]. Therefore, hormones play a very important role in the plant architecture of watermelon.
At present, available genetic resources for dwarf mutants in watermelon remain extremely limited. Therefore, the identification of novel mutants and their corresponding causal genes is crucial for advancing the understanding and manipulation of plant architecture in this species. In this study, a dwarf mutant was generated through EMS mutagenesis of the inbred watermelon line G42 [18]. Unlike previously reported watermelon dwarf mutants, which are typically governed by recessive genes, this mutant is controlled by a dominant gene. Dominant inheritance allows the expression of dwarf traits in the heterozygous state, thereby facilitating more efficient and stable selection during breeding. Through whole-genome resequencing of individuals from an F2 segregating population and the use of molecular markers, the causal gene was mapped to ClG42_10g0100600 (gene ID Cla97C10G193030 in 97103v2) on chromosome 10. This gene encodes an α-tubulin (TUA), named as ClTUA. This study fills the gap by identifying dominant gene inheritance of the dwarf plant architecture in watermelon and provides new mutant germplasm materials and gene resources for research and breeding of vine length in watermelon.

2. Materials and Methods

2.1. Plant Materials and Mapping Population

In this study, the seeds of the dwarf mutant were sourced from the Peking University Institute of Advanced Agricultural Sciences, Weifang, Shandong, China (36°50′ N, 119°44′ E). The dwarf mutant and the inbred watermelon line G42 were used as parents and crossed to obtain F1 plants. G42 was a high-generation inbred line material obtained after 13 generations of self-pollination, and it was a diploid long-vine watermelon [18]. The F1 plants were self-pollinated to produce F2 seeds. The F2 plants were, respectively, planted in the glass greenhouse of the Institute of the Peking University Institute of Advanced Agricultural Sciences and the plastic greenhouse of the Ningbo High-tech Agricultural Technology Experimental Park, Ningbo, Zhejiang, China (29°81′ N, 121°66′ N) in the spring and autumn of 2024. The phenotypes of the F2 plants were observed throughout the whole growth period.

2.2. Cytological Observation of the Internodes

Thirty days after the F2 plants were transplanted, internodes from the 8th node of different vine length types were collected for paraffin sectioning. Three plants from each vine length type were selected, and three internodes were taken from each plant for embedding. The tissues were fixed in 70% FAA for 24 h. Following fixation, the tissues were dehydrated using a series of alcohol at varying concentrations, and then immersed in molten paraffin. Once the paraffin solidified, the tissues were trimmed. The trimmed wax blocks were then placed on a paraffin microtome for sectioning at a thickness of 4 μm. Finally, the sections were stained with toluidine blue and examined under white light with a microscope (DMLB, Leica, Germany), where images were captured. ImageJ (version 1.8.0.345) software was used to measure cell size and count the number of cells.

2.3. DNA Extraction and Resequencing Analysis

Leaves were taken from 100 plants of the F2 segregating population, among which there were 20 plants with long vines (N+/+), 60 semi-dwarf plants (D+/−), and 20 dwarf plants (D+/+). DNA was extracted using the Cetyltrimethylammonium Bromide (CTAB) method, and then these samples were resequenced through the Illumina Hi Seq X Ten platform with a sequencing depth of 30X. The clean reads were aligned to the G42 genomes (http://watermelondb.cn/#/map, accessed on 11 February 2024.) using the BWA-MEM tool (Bwa-mem2, version 2.2.1) with default parameters; the specific analysis process refers to the previous method [18].

2.4. Fine Mapping Through KASP Markers

Based on the SNP loci obtained from the results of the resequencing analysis, molecular marker primers for Kompetitive Allele Specific PCR (KASP) were designed (Table S1). The DNA of the tender leaves of F2 plants was extracted using the CTAB method and then diluted to 50 ng·μL−1. The AQPTM-SNP/Indel Genotyping Kit (JasonGen Biotech, Beijing, China) was employed for genotyping detection, and the specific operation was carried out in accordance with the instruction manual. The QuantStudioTM 6 Flex (Applied Biosystems, Thermo Fisher Scientific, San Diego, CA, USA) was used to detect the fluorescence signals.

2.5. Cloning, Sequencing Analysis, and Phylogenetic Analysis of Candidate Gene

Genomic sequence amplification was performed using the DNA of long vines (N+/+) and dwarf plants (D+/+) as templates, with specific primers listed in Table S1. The amplification kit used was TransStart® FastPfu DNA Polymerase (TransGen Biotech, Beijing, China), and the specific operation was performed according to the instruction manual. The protein sequence of the candidate gene was uploaded to the Swiss-Model online tool to predict its three-dimensional protein structure model. The TUA gene family sequences in Arabidopsis thaliana, Oryza sativa, and Citrullus melon were obtained through NCBI (https://blast.ncbi.nlm.nih.gov/Blast.cgi, accessed on 19 April 2025). Sequences’ alignment was performed by the ClustalW program of MEGA11, which was further used to construct the phylogenetic tree with the statistical method of neighbor joining (NJ).

2.6. Quantitative RT-PCR and Gene Expression Analysis

The total RNA in the leaves of N+/+, D+/−, and D+/+ plants was extracted using the RNAiso Plus extraction kit (TaKaRa, Shiga, Japan), and reverse transcription was performed using the PrimerScript RT reagent kit (TaKaRa, Shiga, Japan) to generate the first strand of cDNA. qRT-PCR experiments were carried out on a QuantStudioTM 6 Flex (Applied Biosystems) using the PerfectStart® Green qPCR SuperMix (TransGen Biotech, Beijing, China). ClACTIN was used as the internal control gene, and the gene-specific primers are shown in Table S1. For each sample, three biological replicates were performed, and the relative expression level of the gene was calculated using the 2−ΔΔCt method [24].

2.7. Detection of Auxin Content

Forty-five days after transplantation, the internodes of the 8th node of N+/+, D+/−, and D+/+ plants were collected, and the auxin content in the plant internodes was determined by LC-MS/MS. The chromatographic column conditions referred to the previous method [25]. The mass spectrometry data were processed using MultiQuant 3.0.3 software. By referring to the retention time and peak shape information of the standard substances, the chromatographic peaks detected in different samples were integrated and corrected. Standard substance solutions with different concentrations of 0.01 ng·mL−1, 0.05 ng·mL−1, 0.1 ng·mL−1, 0.5 ng·mL−1, 1 ng·mL−1, 5 ng·mL−1, 10 ng·mL−1, 50 ng·mL−1, 100 ng·mL−1, 200 ng·mL−1, and 500 ng·mL−1 were prepared, and the mass spectrometry peak intensity data of the corresponding quantitative signals of each concentration of standard substances were obtained. With the ratio of the external standard to the internal standard concentration (Concentration Ratio) as the abscissa and the ratio of the external standard to the internal standard peak area (Area Ratio) as the ordinate, standard curves of different substances were drawn. The auxin contents in different vine length types were calculated according to the standard curves.

2.8. Application of Exogenous IAA

When the seedlings of D+/+ plants grew to the stage with three leaves and one terminal bud, 100 mg·L−1 IAA was sprayed externally, while the plants sprayed with water were taken as controls. One hour after the treatment, leaves of the control plants and the treated plants were collected for RNA extraction, and qRT-PCR was used to detect the expression change level of the target gene. The specific operation is referred to in Section 2.6.

2.9. RNA-Seq Analysis

The Total RNA in the leaves of N+/+ and D+/+ plants was extracted using the RNAiso Plus extraction kit (TaKaRa, Shiga, Japan), and mRNA was enriched using the NEBNext Poly(A) mRNA Magnetic Isolation Module (NEB, E7490). Using mRNA as a template, an on-machine library was constructed using the NEBNext mRNA Library Prep Master Mix Set for Illumina (NEB, E6110) and NEBNext Multiplex Oligos for Illumina (NEB, E7500). Three biological replicates were performed for each treatment. The qualified libraries were sequenced on the Illumina HiSeqTM 2500 platform [26]. The original fastq data were filtered by fastp to obtain valid data, and the quality of the filtered data was controlled using fastqc. The filtered transcriptome data were aligned with the 97103v2 genome. Differential expression analysis was performed using DESeq2, and significant differences were filtered using the p-value. The screening threshold was p-value < 0.05 and |log2FoldChange| > 1.0. After obtaining the Gene Ontology (GO) annotation information of all differentially expressed genes (DEGs) using agriGO [27], the information was submitted to WEGO [28], and a GO enrichment analysis of the DEGs was conducted.

2.10. Statistical Analysis

The chi-square test was employed to identify deviations between the observed data of dwarf plants and long-vine plants in the F2 segregating population and the theoretically expected segregation ratio. One-way ANOVA with Tukey’s HSD test was performed using IBM SPSS Statistics 27 (version 27.0.0), and graphs were drawn using GraphPad Prsim 9 (version 9.0.0).

3. Results

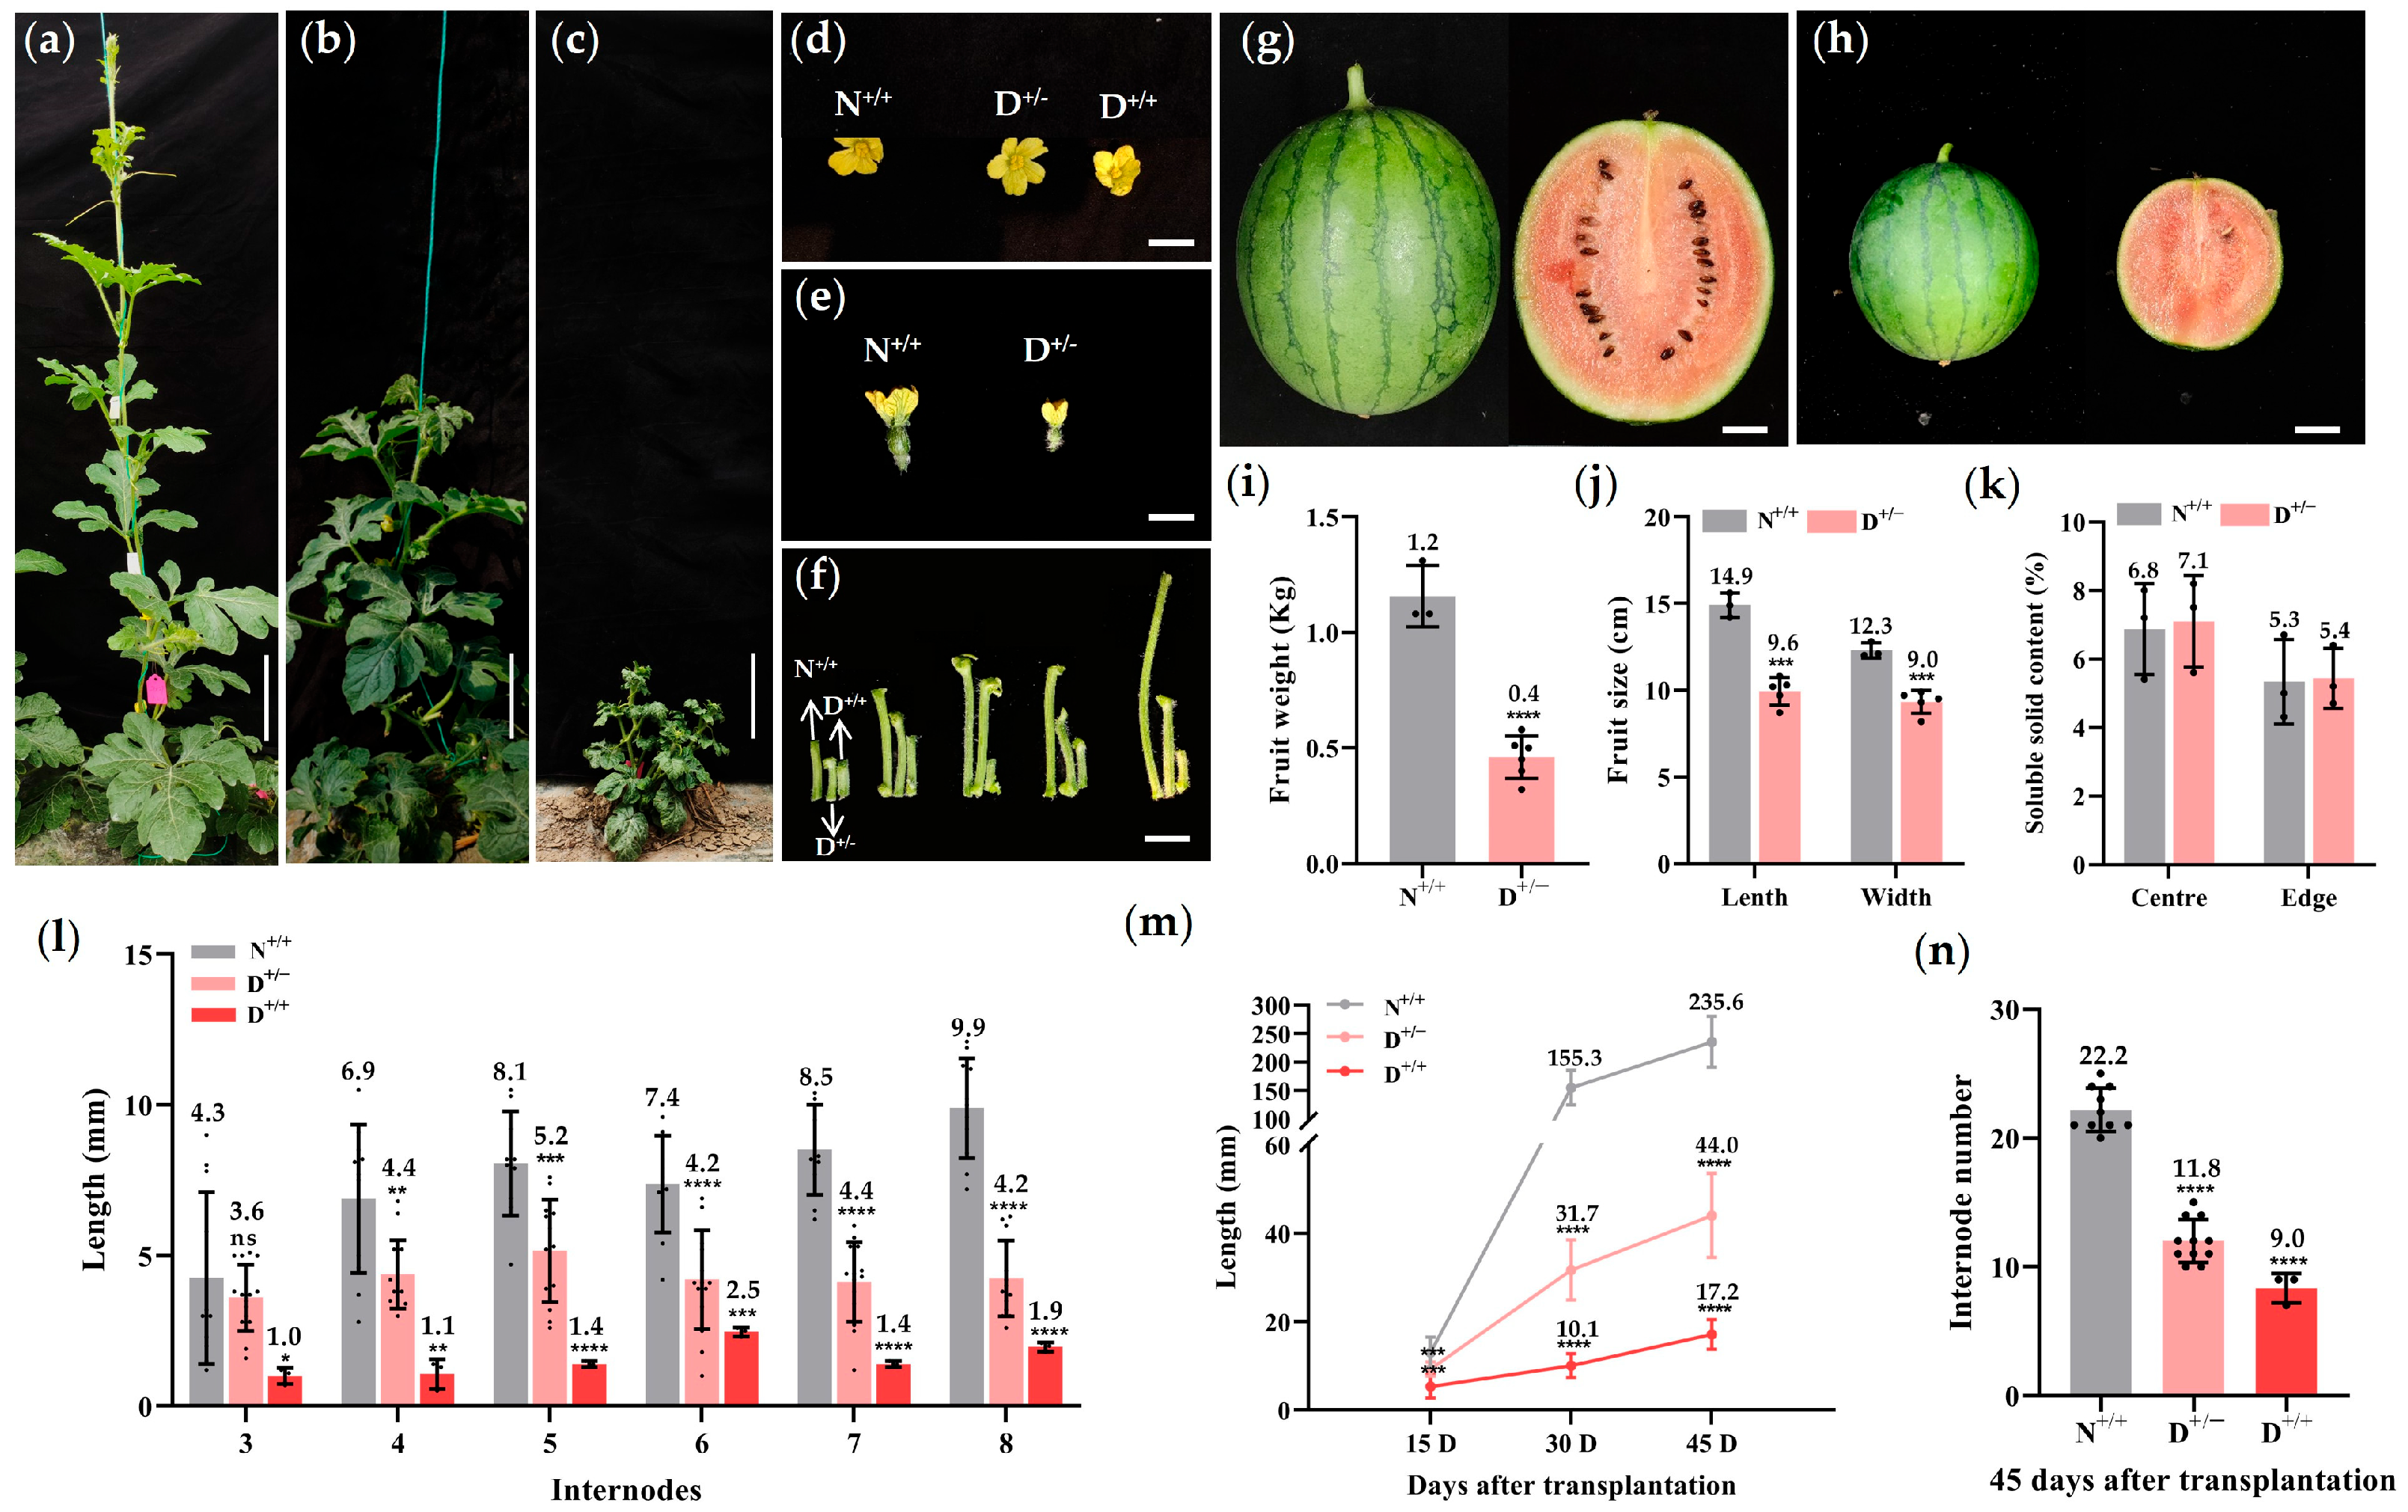
3.1. The Mutant Plants Exhibited Shortened Internodes and Dwarfism

The mutant was crossed with the diploid long-vine watermelon G42 [18] to construct an F2 segregating population. In this population, three architectures of plants with varying vine lengths emerged: long-vine plants (N+/+), semi-dwarf plants (D+/−), and dwarf plants (D+/+) (Figure 1a–c). The observed segregation in the F2 individuals showed that 15 and 20 plants were segregated as long-vine, 35 and 63 plants were segregated as semi-dwarf, while 10 and 21 plants were segregated as complete dwarf during spring/Shandong and autumn/Zhejiang, respectively. The results are in good agreement with the expected segregation ratio of 1:2:1 (χ2 = 3.21; χ2 = 4.67) (Table S2), indicating that this mutation is incompletely dominant inheritance.
The phenotypes of three distinct plant architectures within the F2 segregating population were observed. In the segregating population, the vine length changed significantly, which leads to the change in plant height. Fifteen days after transplanting, the plant heights of the N+/+ plants were significantly higher than those of the D+/− and D+/+ plants, and as the plants grew, the difference in heights among the three became more noticeable. Forty-five days after transplantation, the average heights of the N+/+, D+/−, and D+/+ plants were 235.6 cm, 44.0 cm, and 17.2 cm; compared with the N+/+ plants, the plant heights of the D+/− and D+/+ plants decreased by 81.3% and 92.7%, respectively (Figure 1m).
The internode length and number determine the length of the watermelon vine. From the fourth internode onwards, the lengths of each internode in the D+/− and D+/+ plants were significantly shorter than those in the N+/+ plants, with a more significant reduction observed in D+/+ plants. In comparison to N+/+ plants, the lengths of the internodes at the eighth node in D+/− and D+/+ plants were reduced by 57.1% and 80.1%, respectively (Figure 1f,l). Moreover, the numbers of internodes in D+/− and D+/+ plants were significantly less than that in N+/+ plants, decreasing by 46.8% and 59.5%, respectively (Figure 1n).
In addition to plant height and internode length, the sizes of other tissues in the D+/− and D+/+ plants also changed. The leaf sizes of D+/− and D+/+ plants were also significantly smaller than those of N+/+ plants (Figure S1). The size of the ovary in the female flowers of D+/− was smaller than that of N+/+ (Figure 1e), resulting in the fruit size and weight of D+/− being significantly smaller than those of N+/+. Meanwhile, female flowers were almost non-existent in the D+/+ plants. There was no obvious difference in male flowers among N+/+, D+/−, and D+/+ plants (Figure 1d). Although the fruit size varied between N+/+ and D+/− plants, there was no significant difference in the soluble solid content at the center and edge of the fruits (Figure 1g–k). Additionally, UPC2 was used to analyze the changes in carotenoid content in the fruits of N+/+ and D+/− plants. The results indicated that there was no significant difference in lycopene content (Figure S2).
In summary, the homozygous D+/+ plants showed a marked reduction in overall size and exhibited impaired development of female flowers. In contrast, the heterozygous D+/− plants were also smaller, but they were generally larger than the homozygous D+/+ plants. Additionally, the heterozygous D+/− plants did not negatively impact the reproductive growth of watermelons, and the quality of the fruit remained unaffected.

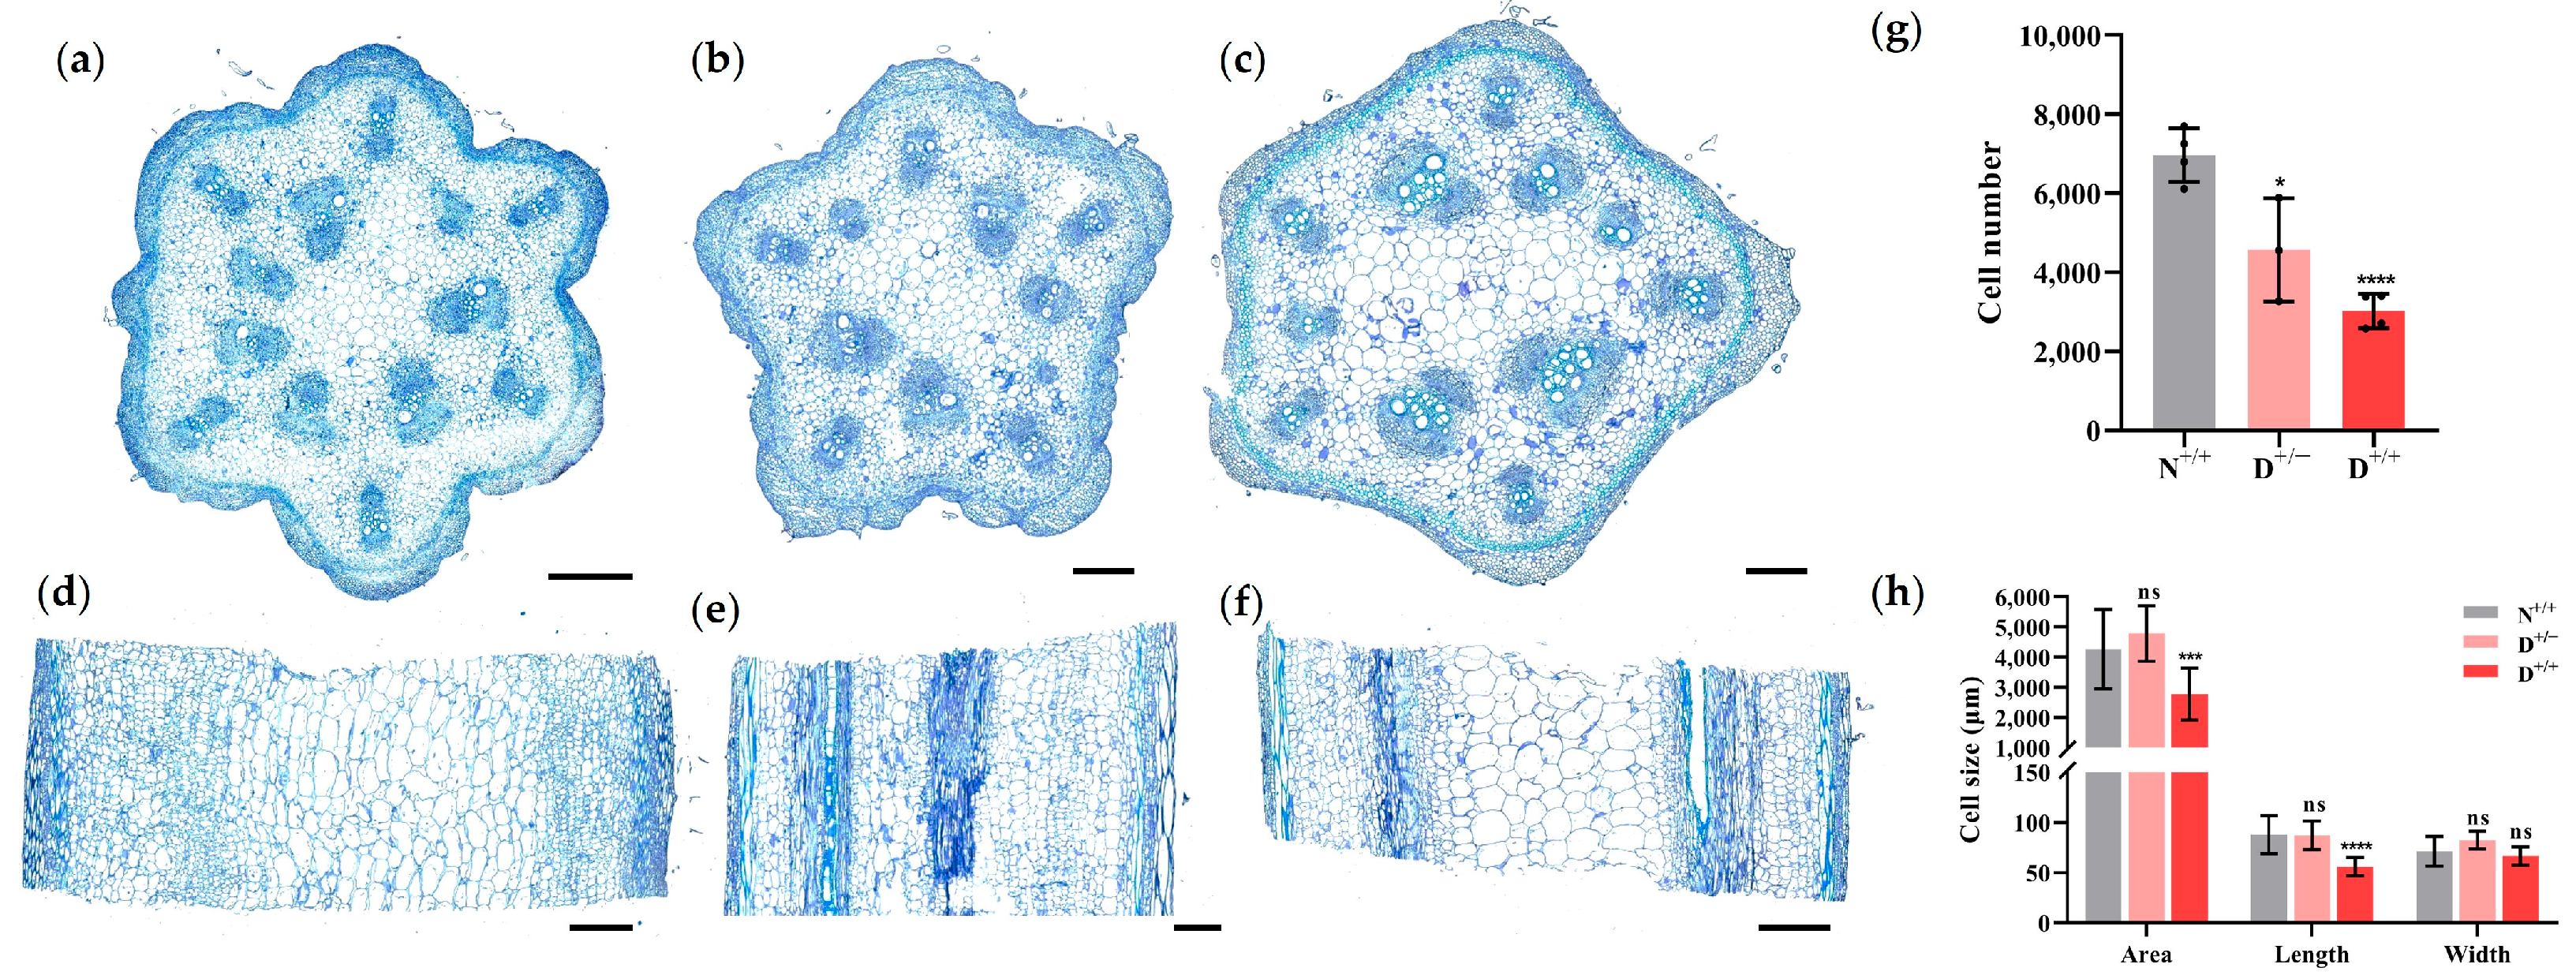
3.2. The Number of Cells Decreases in the Dwarf Plants

To investigate the reasons behind the dwarfing of the mutant plants, we collected the internodes from the eighth node of various plant architectures in the F2 generation, and then used paraffin sectioning to examine the cellular changes. We observed changes in cell number by examining the cross-section of the internode and the changes in cell size through the longitudinal section.
A statistical analysis was conducted on the number of cells in the cross-section. The results showed that the number of cells in both D+/− and D+/+ plants were significantly lower than in N+/+ plants, with D+/+ plants exhibiting the fewest cells. Compared with the N+/+ plants, the number of internode cells in D+/− and D+/+ plants decreased by 34.4% and 56.6%, respectively (Figure 2g). Although there was no significant difference in cell size between D+/− and N+/+ plants, the cell length in D+/+ plants was significantly shorter than that in N+/+ plants, decreasing by 56.7%, which led to the cell area being significantly smaller than that of N+/+ plants (Figure 2h). Therefore, the shortening of the internodes in D+/+ and D+/− plants was caused by the reduction in the number of cells, and the shorter cell length made the D+/− plants exhibit a more dwarfed phenotype.

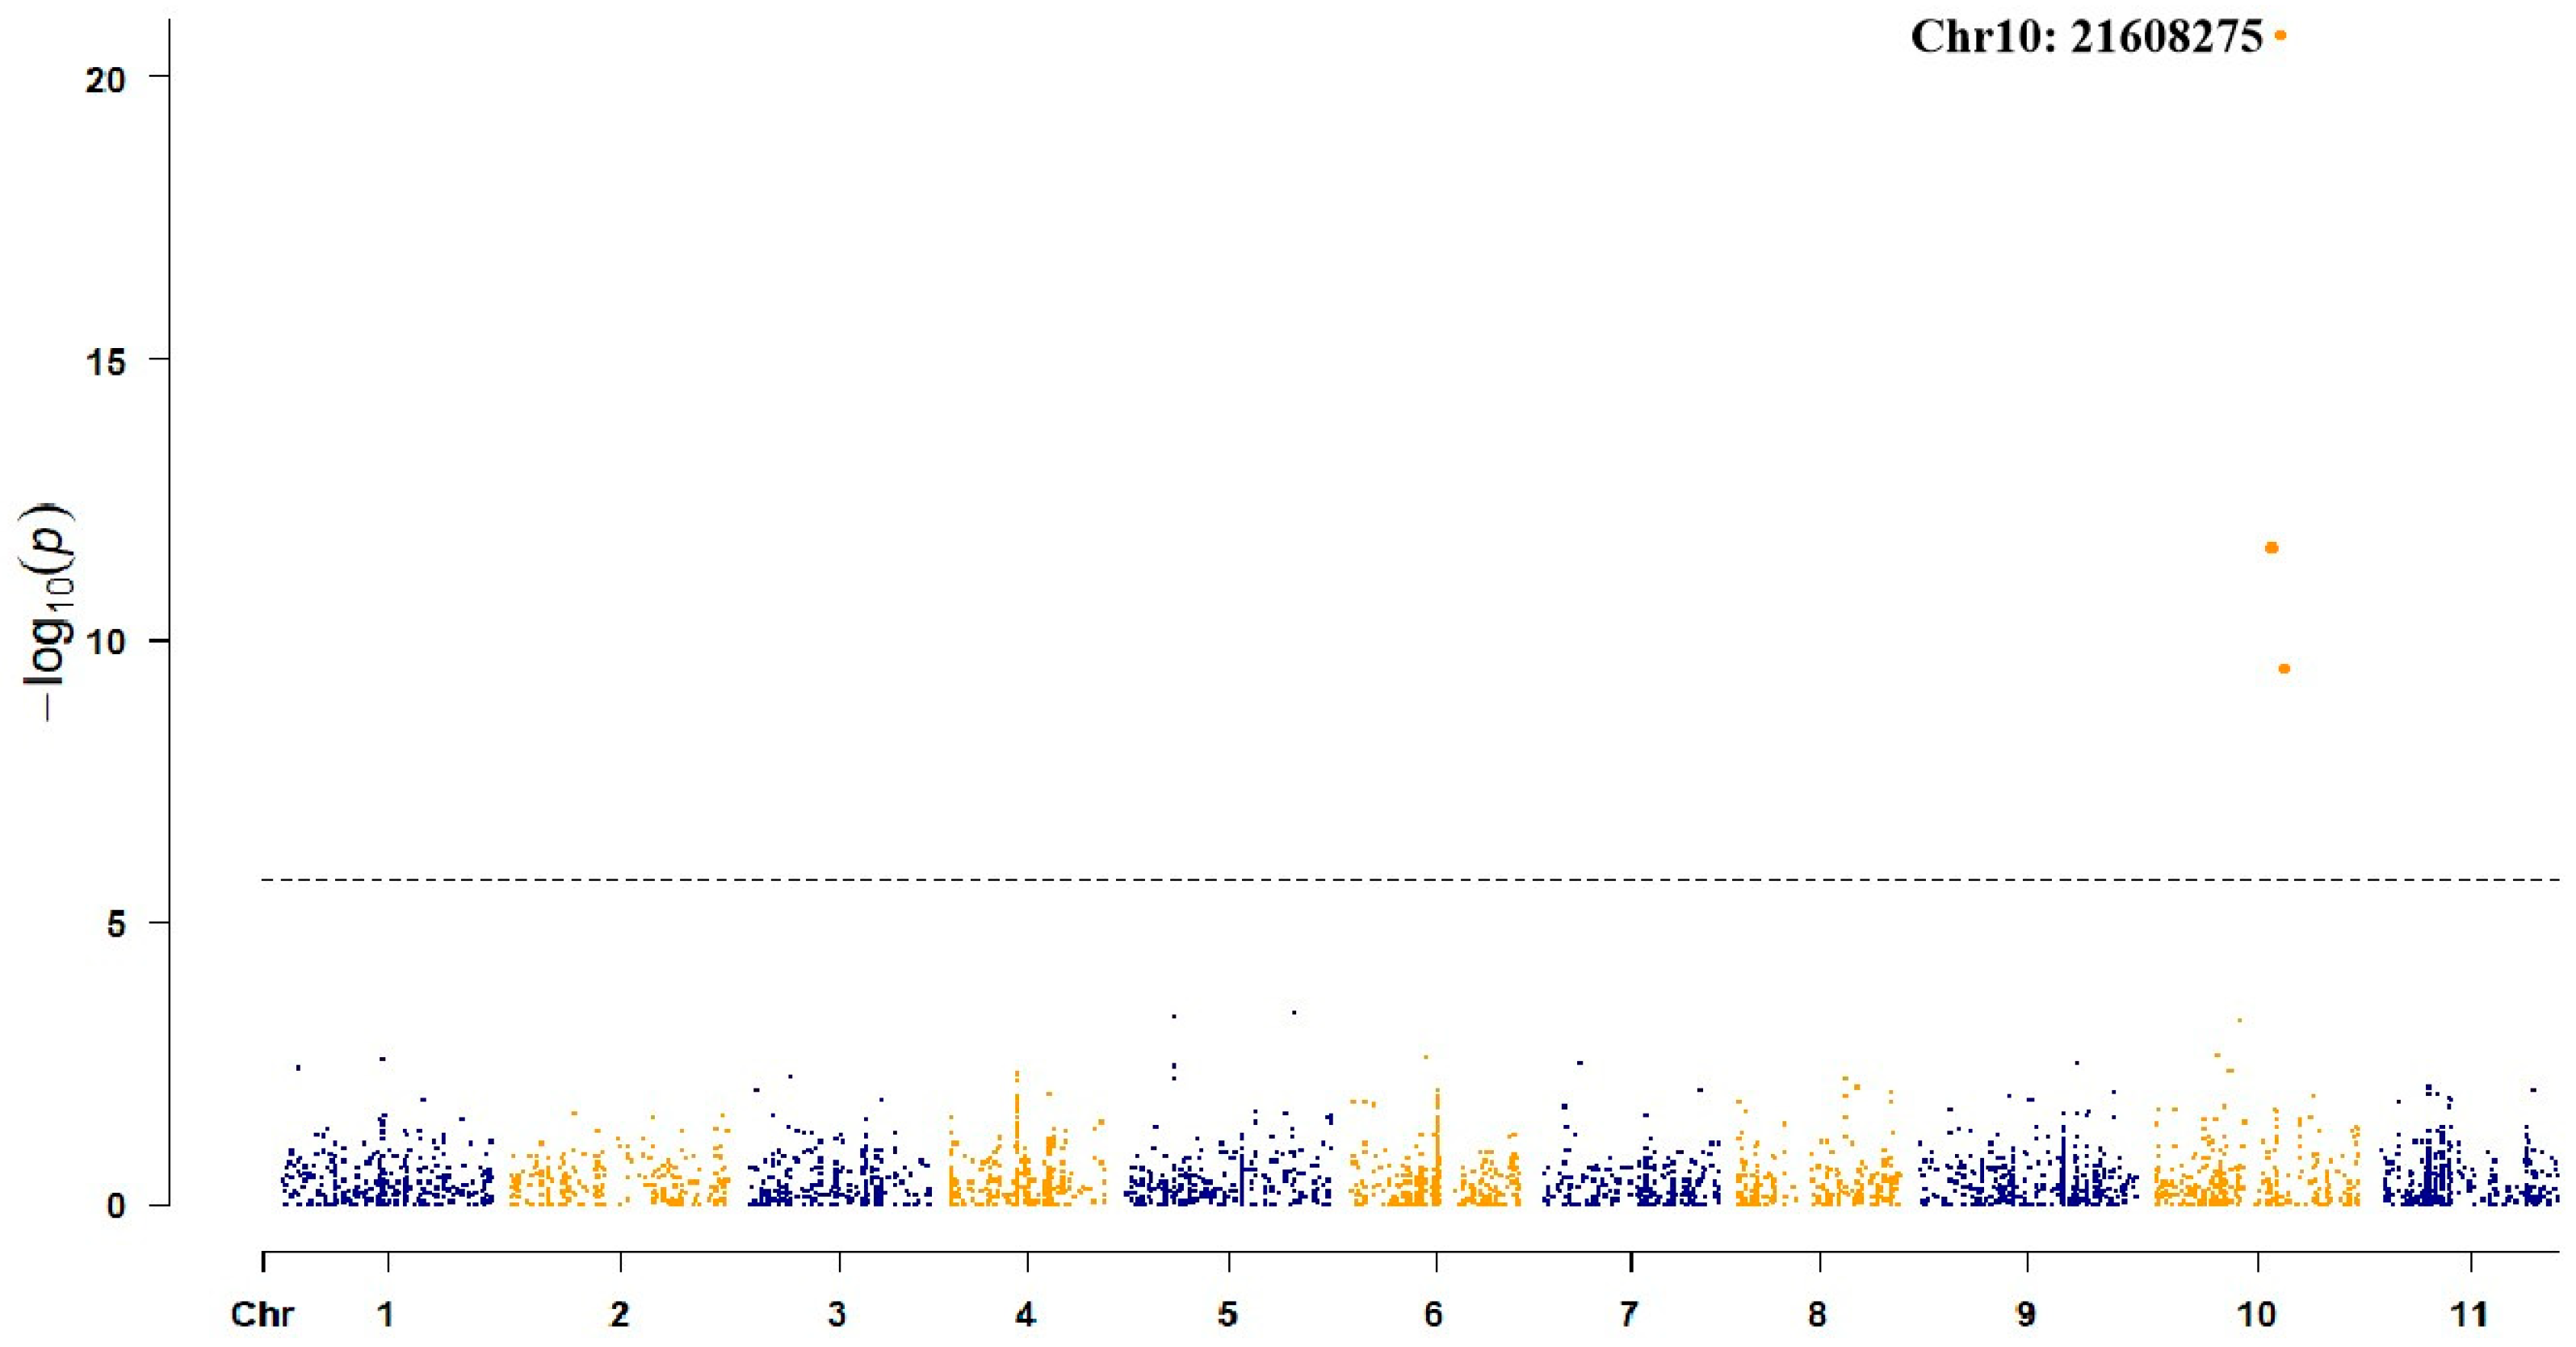
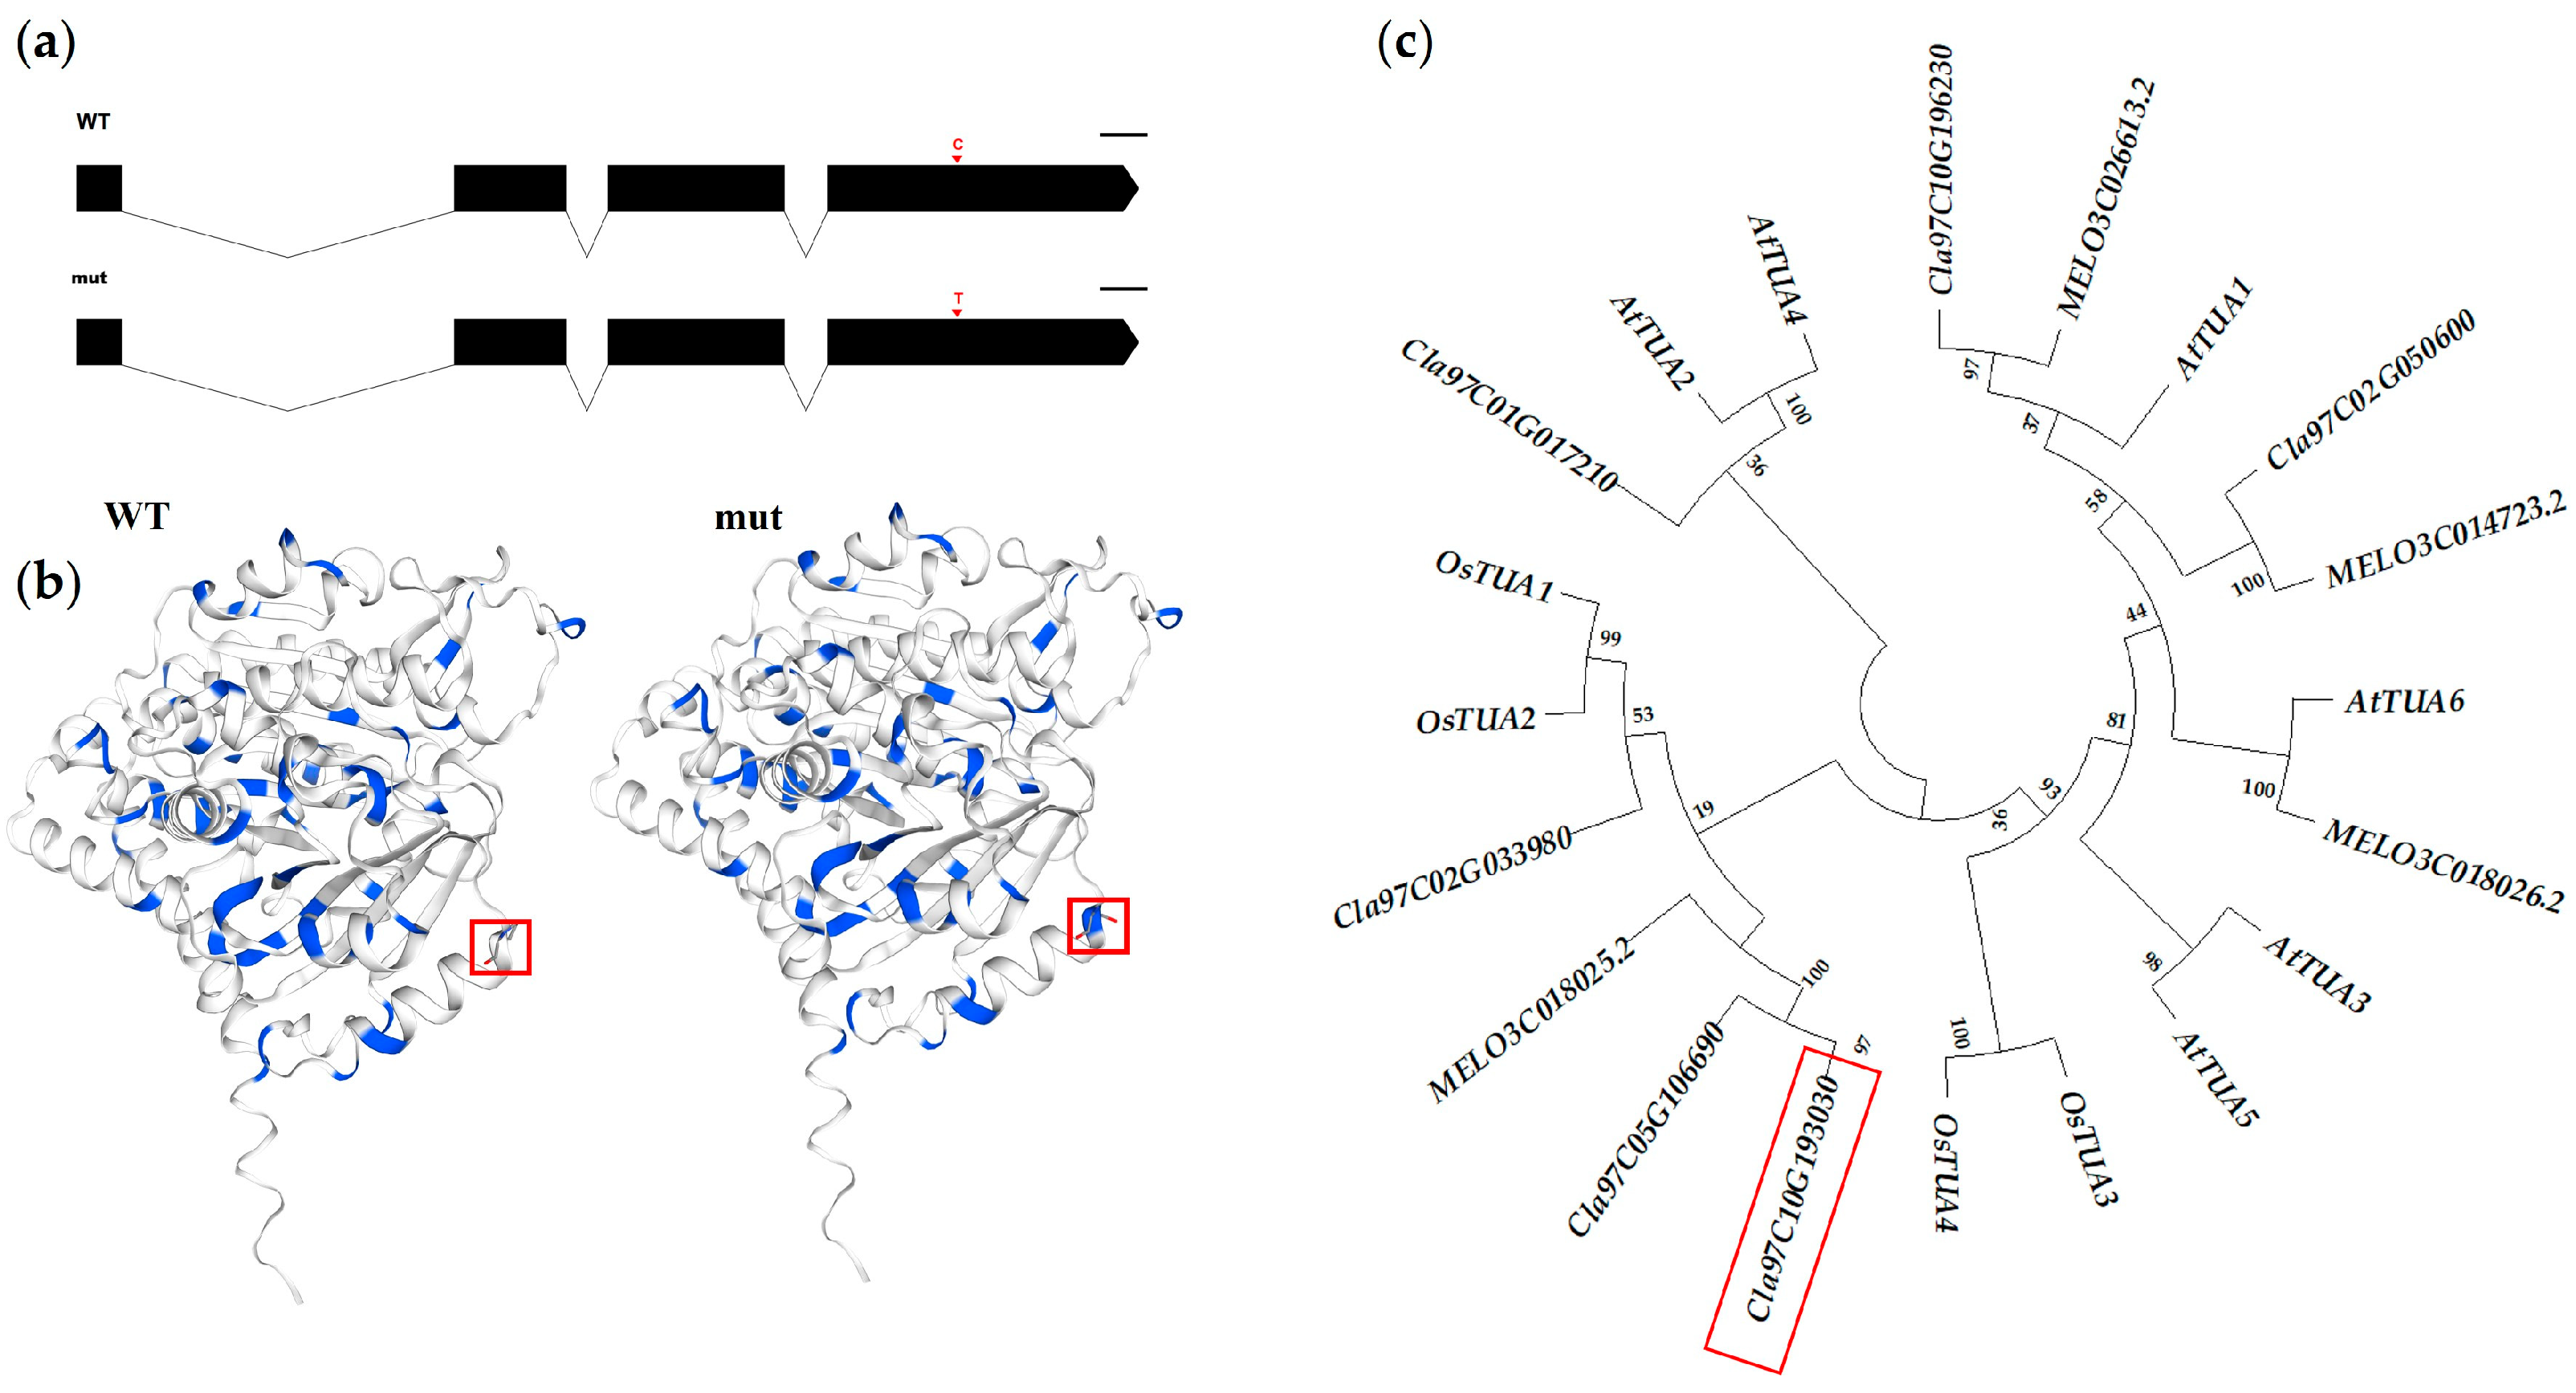
3.3. Localization of Candidate Gene

Individual resequencing was carried out for plants with different vine lengths among 100 plants in the F2 segregating population to map the candidate gene, and the gene was preliminarily mapped to chromosome 10. There were three SNPs loci within the interval of 19957968–22242121 on chromosome 10 that were significantly associated with the phenotype. Using G42 as reference genomes, these three SNPs loci were analyzed. The results showed that the SNP loci, Chr10: 19957968, was located between genes, while Chr10: 21608275 and Chr10: 22242121 were located in the exon regions of the genes ClG42_10g0100600 and ClG42_10g0103800, respectively. According to the SNPs loci, KSAP molecular markers were designed and verified in the F2 segregating population. The results showed that only the results of the molecular marker at the locus Chr10: 21608275 had a 100% coincidence rate with the phenotype, indicating that ClG42_10g0100600 was the target gene controlling the dwarf phenotype of the mutant (Figure 3 and Figure S3).
ClG42_10g0100600 (gene ID Cla97C10G193030 in 97103v2) encodes α-tubulin. In dwarf plants, the ClTUA sequence has a mutation from C to T at the 1851 bp position (Figure 4a and Figure S4), resulting in the change in the amino acid sequence at the 325th position from proline to serine (Figure 4b). The MEGA11 (version 11.0.13) software was used to construct a phylogenetic tree for the TUA family members in Arabidopsis thaliana, Oryza sativa, Citrullus melon, and Citrullus lanatus (Figure 4c). The results showed that ClTUA was mainly classified into one group with the TUAs in cucurbitaceous plants, and had a relatively distant relationship with the TUAs in Oryza sativa and Arabidopsis thaliana.
qRT-PCR was used to detect the expression of ClTUA in N+/+, D+/−, and D+/+ plants. The results showed that compared with N+/+ plants, the expression levels of ClTUA in D+/− and D+/+ plants decreased significantly, with the reduction being more pronounced in the D+/+ plants. The expression levels decreased by 81.5% and 98.6%, respectively (Figure 5). The qRT-PCR result indicated that the expression of ClTUA positively correlated with the vine length of watermelon, showing a dose-dependent effect.

3.4. ClTUA May Respond to the Auxin Pathway to Regulate the Vine Length

According to previous reports, hormones play an important role in plant architecture [19,20,21,22,23]. In order to explore whether the mutants are regulated by hormones, we conducted transcriptome sequencing analysis on N+/+ and D+/+ plants.
Using screening thresholds of |log₂(Fold Change)| > 1 and padj < 0.05, we identified a total of 1946 differentially expressed genes, which included 958 up-regulated genes and 988 down-regulated genes (Figure 6a). We performed Gene Ontology (GO) enrichment analysis on these differentially expressed genes. In the Biological Process (BP) category, the pathway with the highest number of enriched genes was the auxin response pathway (Figure 6b). Consequently, we conducted a gene annotation analysis on these genes, which revealed that they were primarily auxin-responsive family genes homologous to SAUR in Arabidopsis thaliana. Analysis of their expression levels indicated that all SAURs were up-regulated in D+/+ plants (Figure 6c).
LC-MS/MS was used to detect the content of Indole-3-acetic acid (IAA) in N+/+, D+/−, and D+/+ plants. The results showed that, similar to the expression level of ClTUA (Figure 5), the content of IAA also exhibited a dosage effect. As the degree of plant dwarfing increased, the content of IAA became lower (Figure 6d). Interestingly, although the IAA content in D+/− and D+/+ plants was lower compared to N+/+ plants, the levels of inactive substances such as Methyl indole-3-acetate (MEIAA) and 3-Indoleacetonitrile (IAN) were higher in the dwarf plants (Figure S5). From this, we speculated that the ClTUA mutation might lead to auxin inactivation. Additionally, we externally sprayed 100 mg·L−1 IAA on D+/+ plants. One hour after spraying, we measured the expression level of ClTUA, which showed an increase following IAA treatment (Figure 6e).
In conclusion, the mutation of ClTUA affects the auxin pathway, thereby influencing plant architecture.

4. Discussion

The length of the vine is an important trait for watermelon plants. Currently, most of the cultivated varieties on the market feature long main vines and loose internodes. This design leads to low land utilization and increases the difficulty and labor intensity of tasks such as pruning, spraying pesticides, and harvesting. In contrast, short-vine plants have a more compact structure, allowing for dense planting without the need for pruning. This not only optimizes land resources but also lowers management costs. As a result, identifying short-vine germplasm resources and exploring the key genes that control vine length are crucial for breeding watermelon varieties that are suitable for simplified, mechanized, and intensive cultivation.
Currently, some dwarf mutants have been identified in watermelons. dw-1 is the first reported dwarf mutant in watermelon, which shows short vines, fewer branches, and a reduction in the number of cells in the internodes [12]. The allelic mutant dw-1s of dw-1 has a vine length between that of normal vines and short vines [13]. dw-2 shows short vines due to the shortening of internodes caused by the decrease in the number of cells and the shortening of cell length [29]. In addition to the dwarf phenotype, dw-3 is accompanied by the appearance of the male sterility phenotype [15]. All the dwarf mutants identified in watermelon so far are controlled by recessive genes. In this study, the watermelon inbred line G42 was mutagenized by EMS, and a dwarf mutant controlled by a dominant gene was identified for the first time. After crossing with G42, an F2 segregating population was constructed. Three types of plants appeared in the F2 population, namely long-vine plants (N+/+), semi-dwarf plants (D+/−), and completely dwarf plants (D+/+) (Figure 1a–c). The results of genetic analysis showed that this mutant was incompletely dominant (Table S2). The D+/− and D+/+ plants were significantly smaller than the N+/+ plants in terms of leaves, internode length, plant height, etc. Among these, the dwarf phenotype of D+/+ was particularly noticeable, and its female flower development was also affected. While the D+/− plants could still produce fruit, the fruits were smaller in size. However, the quality of the fruit remained unaffected, as there were no significant differences in soluble solid content or lycopene content compared to the N+/+ plants (Figure 1, Figures S1 and S2 ClTUA was mapped as the candidate gene through individual re-sequencing of the F2 segregating population and KASP molecular markers, encoding an α-tubulin protein (Figure 3 and Figure S3). The ClTUA gene has a mutation from C to T at the 1851st base pair in the dwarf plants. This mutation changes the amino acid at the 325th position from proline to serine. Despite this sequence change, the overall structure of the ClTUA protein remains unchanged (Figure 4a,b). Interestingly, the expression level of ClTUA was decreased in D+/− and D+/+ plants, showing a dose-dependent effect (Figure 5). The results of qRT-PCR indicated that this dominant mutant is a loss-of-function mutant. Combining the phenotypic characteristics of the mutant and the results of gene expression analysis, we speculate that this dominant dwarf mutant exhibits haploinsufficiency. Haploinsufficiency in plants is usually translated into a semidominant phenotype [30]. Numerous studies on humans, animals, and microorganisms indicate that genes exhibiting haploinsufficiency typically interact with other proteins to form multimers that carry out their functions. Furthermore, some of these genes are involved in signal transduction pathways or act as transcription factors to regulate the expression of downstream genes [31]. α-tubulin (TUA) usually forms a heterodimer with β-tubulin (TUB) to create microtubules with a tubular structure. Microtubules are one of the cytoskeletal systems required for various fundamental cellular functions in eukaryotes [32]. Therefore, this further confirms our speculation.
Plant microtubules regulate processes such as cell morphology, cell division, and cell wall formation, thus directly affecting phenotypic characteristics such as leaf morphology and plant height development [33]. Cytological observations revealed that the number of internodes in the D+/− and D+/+ plants was significantly lower than in the N+/+ plants. Additionally, the length of internode cells in the D+/+ plants became shorter, resulting in the cell size being significantly smaller than that of the N+/+ and D+/− plants (Figure 2). Thus, ClTUA can affect the plant architecture of watermelon by influencing cell division and even cell elongation.
Mutations in the α-tubulin gene leading to changes in plant architecture have been reported in other crops. In the soybean it1 mutant, the mutation of the gene encoding α- tubulin leads to changes in the arrangement and morphology of microtubules in pavement cells, resulting in a compact plant structure, reduced plant height, shortened petioles, wrinkled leaves, and sunken seeds in the mutant plants [34]. In the rice mutant sng, the mutation of α-tubulin OsTUBA3 impairs its binding to β-tubulin, forms defective heterodimers, changes the stability of microtubules, and thus affects cell expansion and morphology, leading to different changes in the sizes of glumes and caryopses and causing notches in the grains [35]. However, among the reported functions of the α-tubulin gene, the phenomenon of haploinsufficiency has not been found. The results of the phylogenetic analysis indicate that ClTUA primarily clusters with TUAs found in cucurbitaceous plants, showing a relatively distant relationship with TUAs in Oryza sativa and Arabidopsis thaliana (Figure 4c). Therefore, we speculate that the function of ClTUA in cucurbitaceous plants may differ from its function in Oryza sativa and Arabidopsis thaliana. We plan to conduct further studies to verify the function of ClTUA in future research.
Numerous studies have shown that most plant dwarf mutants are mainly related to gibberellins (GAs) and brassinolide (BR), while a few are associated with auxin [9,10,36,37,38,39,40]. However, previous studies have shown that auxin can act on microtubules, thereby affecting cell elongation [41]. Transcriptome sequencing was performed on D+/+ and N+/+ plants. The results of GO enrichment analysis showed that in the BP pathway, the differentially expressed genes were most enriched in the auxin response pathway. Moreover, the differentially expressed genes among them were homologous to SAUR in Arabidopsis thaliana and were up-regulated in D+/+ plants (Figure 6b,c). The SAUR gene family can respond in the early stage of auxin induction and is one of the three major gene families that respond early to auxin [41]. The results of LC-MS/MS showed that the content of IAA decreased in dwarf plants, and it was positively correlated with the dwarf phenotype. At the same time, exogenous application of IAA could increase the expression level of ClTUA (Figure 6d,e). Therefore, we speculate that ClTUA may be involved in the auxin pathway to regulate the plant architecture of the mutant. However, how auxin regulates ClTUA requires further research.

5. Conclusions

In this study, a loss-of-function dwarf mutant controlled by a dominant gene was obtained through EMS mutagenesis. Genetic analyses revealed that this trait exhibited incomplete dominance, resulting in three distinct plant architectures within the F2 segregation population. The gene ClTUA, encoding an α-tubulin protein, was identified as the target gene responsible for this mutant, with a point mutation specifically detected as a C-to-T transition at the 1851st base pair in the dwarf plants. The results of morphological analysis, cytological analysis, and expression level analysis indicated that ClTUA has a dosage effect in the mutant; as its expression level decreases, the effects on cell expansion and elongation become more pronounced, resulting in a more noticeable dwarf phenotype in the plants, exhibiting haploinsufficiency. Meanwhile, in the dwarf plants, the content of IAA decreased, and exogenous IAA could stimulate an increase in the expression of ClTUA in the dwarf plants. Therefore, it is speculated that ClTUA can participate in the auxin pathway and thus play a role in plant architecture.

Supplementary Materials

The following supporting information can be downloaded at: https://www.mdpi.com/article/10.3390/horticulturae11060562/s1, Figure S1: Leaf phenotype. (a) Leaf of N+/+. (b) Leaf of D+/−. (c) Leaf of D+/+. (d) Statistical analysis of leaf size. ** significant at p < 0.01; *** significant at p < 0.001; **** significant at p < 0.0001; Figure S2: Lycopene content in N+/+ and D+/− plants; Figure S3: Result of KASP genotyping. The red, green, and blue represent the genotypes of D+/+, D+/−, and N+/+ plants, respectively; Figure S4: The amplification results of the ClTUA gene sequence in D+/+, D+/−, and N+/+ plants, respectively; Figure S5: The content of auxin in D+/+, D+/−, and N+/+ plants. (a) The content of Methyl indole-3-acetate (MEIAA). (b) The content of 3-Indoleacetonitrile (IAN). (c) The content of Indole-3-acetyl-L-aspartic acid (IAA-Asp). (d) The content of Indole-3-carboxaldehyde (ICAld); Table S1: The primer sequences in this study; Table S2: Genetic statistics of the segregating population.

Author Contributions

Conceptualization, Z.H., Q.Y., H.Z., X.Z., Y.W. and Y.D.; methodology, Z.H., X.Z. and Y.D.; software, J.S.; validation, Z.H., L.Z. and Y.D.; formal analysis, Z.H.; investigation, Z.H., L.Z., J.S. and Y.D.; resources, X.Z. and Y.D.; data curation, Z.H.; writing—original draft preparation, Z.H.; writing—review and editing, L.Z., X.Z. and Y.D.; visualization, Z.H.; supervision, Z.H., X.Z., Y.W. and Y.D.; project administration, X.Z.; funding acquisition, Z.H. and Y.W. All authors have read and agreed to the published version of the manuscript.

Funding

This research was funded by the Public Welfare Science and Technology Project in Ningbo, grant number 2023S069; the Ningbo Key Research and Development Program, grant number 2023Z115; and the National Industrial Technology System of Watermelon and Muskmelon, grant number CARS-26.

Data Availability Statement

The original contributions presented in this study are included in the article/Supplementary Material. Further inquiries can be directed to the corresponding author(s).

Conflicts of Interest

The authors declare no conflicts of interest.

Abbreviations

The following abbreviations are used in this manuscript:
KASPKompetitive Allele Specific PCR
IAAIndole-3-acetic acid
MEIAAMethyl indole-3-acetate
IAN3-Indoleacetonitrile
IAA-AspIndole-3-acetyl-L-aspartic acid
ICAldIndole-3-carboxaldehyde
GOGene Ontology
BPBiological Process
EMSEthyl methanesulfonate
LC-MS/MSLiquid Chromatography–Tandem Mass Spectrometry
BSA-seqBulked Segregant Analysis by Sequencing
CTABCetyltrimethylammonium Bromide

References

  1. Dane, F.; Liu, J. Diversity and origin of cultivated and citron type watermelon (Citrullus lanatus). Genet. Resour. Crop Evol. 2006, 54, 1255–1265. [Google Scholar] [CrossRef]
  2. Khush, G.S. Green revolution: The way forward. Nat. Rev. Genet. 2001, 1, 815–822. [Google Scholar] [CrossRef]
  3. Salamini, F. Hormones and the Green Revolution. Science 2003, 302, 71–72. [Google Scholar] [CrossRef]
  4. Sakamoto, T.; Miura, K.; Itoh, H.; Tatsumi, T.; Ueguchi-Tanaka, M.; Ishiyama, K.; Kobayashi, M.; Agrawal, G.K.; Takeda, S.; Abe, K.; et al. An overview of gibberellin metabolism enzyme genes and their related mutants in rice. Plant Physiol. 2004, 34, 1642–1653. [Google Scholar] [CrossRef]
  5. Sato-Izawa, K.; Nakaba, S.; Tamura, K.; Yamagishi, Y.; Nakano, Y.; Nishikubo, N.; Kawai, S.; Kajita, S.; Ashikari, M.; Funada, R.; et al. DWARF50 (D50), a rice (Oryza sativa L.) gene encoding inositol polyphosphate 5-phosphatase, is required for proper development of intercalary meristem. Plant Cell Environ. 2012, 35, 2031–2044. [Google Scholar] [CrossRef]
  6. Li, W.Q.; Yoshida, A.; Takahashi, M.; Maekawa, M.; Kojima, M.; Sakakibara, H.; Kyozuka, J. SAD1, an RNA polymerase I subunit A34.5 of rice, interacts with mediator and controls various aspects of plant development. Plant J. 2015, 81, 282–291. [Google Scholar] [CrossRef]
  7. Ren, D.Y.; Rao, Y.C.; Wu, L.W.; Xu, Q.K.; Li, Z.Z.; Yu, H.P.; Zhang, Y.; Leng, Y.J.; Hu, J.; Zhu, L.; et al. The pleiotropic ABNORMAL FLOWER AND DWARF1 affects plant height, floral development and grain yield in rice. J. Integr. Plant Biol. 2016, 58, 529–539. [Google Scholar] [CrossRef]
  8. Jiang, L.; Liu, X.; Xiong, G.S.; Liu, H.H.; Chen, F.L.; Wang, L.; Xiangbing Meng, X.B.; Liu, G.F.; Yu, H.; Yuan, Y.D.; et al. DWARF53 acts as a repressor of strigolactone signalling in rice. Nature 2013, 504, 401–405. [Google Scholar] [CrossRef]
  9. Zhou, M.; Li, Y.K.; Cheng, Z.W.; Zheng, X.Y. Important factors controlling gibberellin homeostasis in plant height regulation. J. Agric. Food Chem. 2023, 71, 15895–15907. [Google Scholar] [CrossRef]
  10. Wang, Y.J.; Deng, D.X.; Ding, H.D.; Xu, X.M.; Zhang, R.; Wang, S.X.; Bian, Y.L.; Yin, Z.T.; Chen, Y. Gibberellin biosynthetic deficiency is responsible for maize dominant dwarf11 (D11) mutant phenotype: Physiological and transcriptomic evidence. PLoS ONE 2013, 8, e66466. [Google Scholar] [CrossRef]
  11. Cassani, E.; Bertolini, E.; Badone, F.C.; Landoni, M. Characterization of the first dominant dwarf maize mutant carrying a single amino acid insertion in the VHYNP domain of the dwarf 8 gene. Mol. Breed. 2009, 24, 375–385. [Google Scholar] [CrossRef]
  12. Mohr, H.C. Mode of inheritance of bushy growth characteristic in watermelon. Proc. Assoc. South Agric. Work. 1956, 53, 174. [Google Scholar]
  13. Dyutin, K.E.; Afanas’eva, E.A. Interaction of short stem in watermelon. Tsitologiya I Genet. 1987, 21, 227–229. [Google Scholar]
  14. Robinson, R.W.; Munger, H.M.; Whitake, T.W. Genes of Cucubitaceae. Hortscience 1976, 11, 554–568. [Google Scholar] [CrossRef]
  15. Huang, H.X.; Zhang, X.Q.; Wei, Z.C.; Li, Q.H.; Li, X. Inheritance of male-sterility and dwarfism in watermelon [Citrullus lanatus (Thunb.) Matsum. and Nakai]. Sci. Hortic. 1998, 74, 175–181. [Google Scholar]
  16. Li, Y.G.; Xu, A.J.; Dong, W.; LI, Z.; Li, G.S. Genetic analysis of a dwarf vine and small fruit watermelon mutant. Hortic. Plant J. 2016, 2, 224–228. [Google Scholar] [CrossRef]
  17. Guo, S.; Zhang, J.; Sun, H.; Salse, J.; Lucas, W.J.; Zhang, H.; Zheng, Y.; Mao, L.; Ren, Y.; Wang, Z.; et al. The draft genome of watermelon (Citrullus lanatus) and resequencing of 20 diverse accessions. Nat. Genet. 2013, 45, 51–58. [Google Scholar] [CrossRef]
  18. Deng, Y.; Liu, S.C.; Zhang, Y.L.; Tan, J.S.; Li, X.P.; Chu, X.; Xu, B.H.; Tian, Y.; Sun, Y.D.; Li, B.S.; et al. A telomere-to-telomere gap-free reference genome of watermelon and its mutation library provide important resources for gene discovery and breeding. Mol. Plant 2022, 15, 1268–1284. [Google Scholar] [CrossRef]
  19. Wei, C.H.; Zhu, C.Y.; Yang, L.P.; Zhao, W.; Ma, R.X.; Li, H.; Zhang, Y.; Ma, J.X.; Yang, J.Q.; Zhang, X. A point mutation resulting in a 13 bp deletion in the coding sequence of Cldf leads to a GA-deficient dwarf phenotype in watermelon. Hortic. Res. 2019, 6, 132. [Google Scholar] [CrossRef]
  20. Gebremeskel, H.; Dou, J.L.; Li, B.B.; Zhao, S.J.; Muhammad, U.; Lu, X.Q.; He, N.; Liu, W.G. Molecular Mapping and Candidate Gene Analysis for GA3 Responsive Short Internode in Watermelon (Citrullus lanatus). Int. J. Mol. Sci. 2020, 21, 290. [Google Scholar] [CrossRef]
  21. Jang, Y.J.; Yun, H.S.; Rhee, S.J.; Seo, M.; Kim, Y.J.; Lee, G.P. Exploring molecular markers and candidate genes responsible for watermelon dwarfism. Hortic. Environ. Biote. 2020, 61, 173–182. [Google Scholar] [CrossRef]
  22. Dong, W.; Wu, D.; Li, G.; Wu, D.W.; Wang, Z.C. Next-generation sequencing from bulked segregant analysis identifies a dwarfism gene in watermelon. Sci. Rep. 2018, 8, 2908. [Google Scholar] [CrossRef]
  23. Zhu, H.; Zhang, M.; Sun, S.; Yang, S.; Li, J.X.; Li, H.; Yang, H.H.; Zhang, K.G.; Hu, J.B.; Liu, D.M.; et al. A single nucleotide deletion in an ABC transporter gene leads to a dwarf phenotype in watermelon. Front. Plant Sci. 2019, 10, 1399. [Google Scholar] [CrossRef]
  24. Livak, K.; Schmittgen, T. Analysis of relative gene expression data using real-time quantitative PCR and the 2−ΔΔCt method. Methods 2001, 25, 402–408. [Google Scholar] [CrossRef]
  25. Niu, Q.; Zong, Y.; Qian, M.; Yang, F.; Teng, Y. Simultaneous quantitative determination of major plant hormones in pear flowers and fruit by UPLC/ESI-MS/MS. Anal. Methods 2014, 6, 1766. [Google Scholar] [CrossRef]
  26. Shen, X.P.; Xu, L.A.; Liu, Y.H.; Dong, H.; Zhou, D.; Zhang, Y.Z.; Lin, S.; Cao, J.S.; Huang, L. Comparative transcriptome analysis and ChIP-sequencing reveals stage-specific gene expression and regulation profiles associated with pollen wall formation in Brassica rapa. BMC Genom. 2019, 20, 264. [Google Scholar] [CrossRef]
  27. Tian, T.; Liu, Y.; Yan, H.; You, Q.; Yi, X.; Du, Z.; Xu, W.; Su, Z. agriGO v2.0: A GO analysis toolkit for the agricultural community, 2017 update. Nucleic Acids. Res. 2017, 45, W122–W129. [Google Scholar] [CrossRef]
  28. Ye, J.; Fang, L.; Zheng, H.; Zhang, Y.; Chen, J.; Zhang, Z.; Wang, J.; Li, S.; Li, R.; Bolund, L.; et al. WEGO: A web tool for plotting GO annotations. Nucleic Acids. Res. 2006, 34, W293–W297. [Google Scholar] [CrossRef]
  29. Liu, P.B.W.; Loy, J.B. Inheritance and morphology of two dwarf mutants in watermelon. Am. Soc. Hortic. Sci. 1972, 97, 745–748. [Google Scholar] [CrossRef]
  30. Navarro-Quiles, C.; Daniel, L.S.; Muñoz-Nortes, T.; Candela, H.; Micol, J.L. The genetic and molecular basis of haploinsufficiency in flowering plants. Trends Plant Sci. 2024, 29, 72–85. [Google Scholar] [CrossRef]
  31. Wilkie, A. Themolecular basis of genetic dominance. J. Med. Genet. 1994, 31, 89–98. [Google Scholar] [CrossRef]
  32. Cleary, J.M.; Hancock, W.O. Molecular mechanisms underlying microtubule growth dynamics. Curr. Biol. 2021, 31, R560–R573. [Google Scholar] [CrossRef]
  33. Wasteneys, G.O. Progress in understanding the role of microtubules in plant cells. Curr. Opin. Plant Biol. 2004, 7, 651–660. [Google Scholar] [CrossRef]
  34. Su, B.H.; Guo, Y.; Li, Z.F.; Gao, H.w.; Wei, Z.Y.; Qiu, L.J. Ideal type 1 is caused by a point mutation in the a-tubulin gene that affects microtubule arrangement in soybean. Crop J. 2023, 11, 713–722. [Google Scholar] [CrossRef]
  35. Xu, C.S.; Chen, B.T.; Huang, S.J.; Deng, Z.Y.; Wang, T. A point mutation in the rice alpha-tubulin gene OsTUBA3 causes grain notching. New Phytol. 2023, 240, 1052–1065. [Google Scholar] [CrossRef]
  36. Sun, T.P. Gibberellin-GID1-DELLA: A pivotal regulatory module for plant growth and development. Plant Physiol. 2010, 154, 567–570. [Google Scholar] [CrossRef]
  37. Castorina, G.; Consonni, G. The role of brassinosteroids in controlling plant height in poaceae: A genetic perspective. Int. J. Mol. Sci. 2020, 21, 1191. [Google Scholar] [CrossRef]
  38. Yamamuro, C.; Ihara, Y.; Wu, X.; Noguchi, T.; Fujioka, S.; Takatsuto, S.; Ashikari, M.; Kitano, H.; Matsuoka, M. Loss of function of a rice brassinosteroid insensitive1 homolog prevents internode elongation and bending of the lamina joint. Plant Cell 2000, 12, 1591–1606. [Google Scholar] [CrossRef]
  39. Chono, M.; Honda, I.; Zeniya, H.; Yoneyama, K.; Saisho, D.; Akeda, K.; Takatsuto, T.; Hoshino, T.; Watanabe, Y. A semidwarf phenotype of barley uzu results from a nucleotide substitution in the gene encoding a putative brassinosteroid receptor. Plant Physiol. 2003, 133, 1209–1219. [Google Scholar] [CrossRef]
  40. Mano, Y.; Nemoto, K. The pathway of auxin biosynthesis in plants. J. Exp. Bot. 2012, 63, 2853–2872. [Google Scholar] [CrossRef]
  41. Chen, X.; Grandont, L.; Li, H.; Hauschild, R.; Paque, S.; Abuzeineh, A.; Rakusová, H.; Benkova, E.; Perrot-Rechenmann, C.; Friml, J. Inhibition of cell expansion by rapid ABP1-mediated auxin effect on microtubules. Nature 2014, 516, 90–93. [Google Scholar] [CrossRef] [PubMed]
Figure 1. Phenotypic characteristics of mutant plants. (a) Long internode plant (N+/+). (b) Semi-dwarf plant (D+/−). (c) Dwarf plant (D+/+). (d) Male flower of N+/+, D+/−, and D+/+, respectively. (e) Female flower of N+/+ and D+/−. (f) The 4th to 7th internode of N+/+, D+/−, and D+/+, respectively. (g) Fruit of N+/+. (h) Fruit of D+/−. (i) Fruit weight measurements of N+/+ and D+/+ plants. The numbers represent the average weight of the fruits. (j) Fruit size measurements of N+/+ and D+/+ plants. The numbers represent the average length and width of the fruits. (k) Soluble solids content measurements of N+/+ and D+/+ plants. The numbers represent the average soluble solids content of the fruits. (l) Length measurements of the 3rd to 8th internodes for N+/+, D+/−, and D+/+ plants, respectively. The numbers represent the average length of internodes. (m) Height measurements of N+/+, D+/−, and D+/+ plants at different days after transplantation. The numbers represent the average height of plants. (n) The number of internodes in N+/+, D+/−, and D+/+ plants 45 days after transplantation. The numbers represented the average number of internodes. Scale bar: 10 cm in (ac), 1 cm in (dh). ns: non-significant; * significant at p < 0.05; ** significant at p < 0.01; *** significant at p < 0.001; **** significant at p < 0.0001.
Horticulturae 11 00562 g001
Figure 2. Cytological observation of internodes. (ac) Transverse sections of the internodes of N+/+ plants (a), D+/− plants (b), and D+/+ plants (c). (df) Longitudinal sections of the internodes of N+/+ plants (d), D+/− plants (e), and D+/+ plants (f). (g) Statistical analysis of cell number. (h) Statistical analysis of cell size. Scale bar: 500 μm. ns: non-significant; * significant at p < 0.05; *** significant at p < 0.001; **** significant at p < 0.0001.
Horticulturae 11 00562 g002
Figure 3. Individual resequencing result of dwarf-related loci in the F2 population. The orange dots represent the SNP loci related to the dwarf trait.
Horticulturae 11 00562 g003
Figure 4. Schematic diagram of the ClTUA structure and phylogenetic tree. (a) Structural diagram of ClTUA in WT and mutant. The red-marked loci indicate the mutation site and the mutated base. (b) Three-dimensional structure of ClTUA protein. Serine is represented by blue, the mutation site is indicated by the red frame. (c) Phylogenetic tree of the TUA gene family in Arabidopsis thaliana, Oryza sativa, Cucumis melo, and Citrullus lanatus, the red frame indicates the target gene. WT: Wild Type; mut: mutant.
Horticulturae 11 00562 g004
Figure 5. ClTUA expression level in N+/+, D+/−, and D+/+ plant. ClACTIN was used as the internal control gene. *** significant at p < 0.001.
Horticulturae 11 00562 g005
Figure 6. IAA function on ClTUA. (a) Volcano plot of genes in N+/+ and D+/+ plants. (b) Gene Ontology (GO) functional enrichment analysis. BP: Biological Process; CC: Cell Component; MF: Molecular Function. (c) Heatmap of the DEGs in response to auxin pathway. (d) The IAA content in N+/+, D+/−, and D+/+ plants. (e) The expression change of ClTUA in D+/+ plants one hour after exogenous treatment with IAA. ** significant at p < 0.01.
Horticulturae 11 00562 g006
Disclaimer/Publisher’s Note: The statements, opinions and data contained in all publications are solely those of the individual author(s) and contributor(s) and not of MDPI and/or the editor(s). MDPI and/or the editor(s) disclaim responsibility for any injury to people or property resulting from any ideas, methods, instructions or products referred to in the content.

