Article

Metabolomic and Transcriptomic Insights into Quality Formation of Orange-Red Carrot (Daucus carota L.) During Maturation

College of Horticulture, Shanxi Agricultural University, Jinzhong 030801, China
*
Author to whom correspondence should be addressed.
Horticulturae 2025, 11(5), 542; https://doi.org/10.3390/horticulturae11050542
Submission received: 9 April 2025 / Revised: 5 May 2025 / Accepted: 15 May 2025 / Published: 17 May 2025

Abstract

:
Carrots, a multi-nutrient dietary source rich in natural bioactive compounds, have gained broad recognition due to their nutritional properties and potential health-promoting effects. Studying metabolic changes during carrot maturation can provide deeper insights into the formation of their nutritional value and quality. Using Liquid Chromatograph Mass Spectrometer (LC-MS) metabolomics, we systematically profiled metabolic dynamics during orange-red carrot maturation, with large-scale compound detection, structural identification, and absolute quantification. The results showed that a total of 607 metabolites were detected. Further analysis of three distinct stages of taproot swelling and maturation revealed the following: Most sugars in primary metabolites exhibited an increasing accumulation trend across the three stages. Organic acids (including TCA cycle intermediates) displayed a pronounced decreasing accumulation pattern. Transcriptomic analysis revealed significantly upregulated expression of differentially expressed genes (DEGs) involved in the TCA cycle from the fleshy root formation stage (30 days after sowing, DAS), expansion stage (50 DAS), and maturation stage (115 DAS) in carrots. Phytochemical profiling identified 206 secondary metabolites (92 phenolic acids and 114 non-phenolic compounds). Notably, many phenolic acids maintained relatively high levels during early carrot development but exhibited a rapid decline in subsequent stages. The extensive downregulation of genes involved in phenolic acid biosynthesis pathways likely drives the rapid decline in phenolic acid content during early developmental stages. Correlation analysis further revealed significant crosstalk between primary and secondary metabolites during carrot maturation, with a pronounced negative correlation between sugars and secondary metabolites. These data provide a global perspective of carrot metabolomics and a comprehensive analysis of metabolic variations during development, establishing a molecular and metabolic basis for a deeper and more systematic understanding of carrot quality traits.

1. Introduction

Carrot (Daucus carota L.) is a biennial herbaceous plant of the Apiaceae family and ranks among the top ten globally cultivated vegetable crops [1]. Carrots are rich in carotenoids, dietary fiber, anthocyanins, and flavonoids, as well as phenolic derivatives that stimulate human anticancer mechanisms [2,3]. With their exceptional nutritional profile, phytochemical composition, and antioxidant capacity, they have gained international recognition as a high-value functional food [4].
Generally, the growth cycle of carrots spans 90–140 days, during which the primary root undergoes distinct developmental stages driven by cambium activity: fleshy root formation stage, expansion stage, and maturation stage. Previous physiological studies on carrot growth and development have identified sugars, bitter compounds, and terpenes as the most critical determinants of carrot flavor profiles. The primary sugars associated with sweet perception—glucose, fructose, and sucrose constitute over 95% of free sugars and 40–60% of stored carbohydrates in carrot taproots [5]. Bitterness arises from terpenoids and water-soluble phenolic compounds, including polyacetylenes, sesquiterpenoids, phenylpropanoids, and isocoumarins. Notably, isocoumarins and phenolic acids have been identified as potential bitter compounds localized primarily in carrot epidermis [6,7]. Terpenoid compounds constitute key flavor determinants in carrots, contributing to their distinctive aroma profiles. Differential terpenoid composition defines varietal-specific fragrance characteristics across carrot cultivars [8].
Carrots are nutritionally distinguished by their health-promoting secondary metabolites, particularly phenolic compounds. Among these, carotenoids and phenolic acids have been extensively studied as potent natural antioxidants with demonstrated anticancer properties [9]. Flavonoids, as a major class of secondary metabolites, play diverse roles in plants, with numerous flavonoid compounds demonstrating significant relevance to human health [10]. Carrots also contain substantial amounts of vitamins, which serve not only as essential human nutrients but also play critical roles in antioxidant defense, immune modulation, and metabolic regulation [11]. Coumarins and alkaloids, as secondary metabolites, exhibit defined pharmacological benefits within appropriate dosage ranges [12]. Beyond nutritional functions, in vitro studies demonstrate that phytonutrients such as carotenoids and phenolics may play significant roles in protecting biological systems from oxidative stress.
Recent advances in metabolomic and transcriptomic approaches have yielded substantial progress in elucidating the regulatory mechanisms underlying nutrient composition and flavor quality in carrots. Clausen et al. [13] demonstrated distinct metabolite profiles among carrot cultivars through metabolomic analysis, revealing that orange varieties exhibit significantly higher sucrose and β-carotene content but lower fructose and glucose levels compared to other cultivars. Chevalier et al. [14] identified environment-dependent accumulation patterns of sugars and carotenoids in carrots, revealing significant metabolic plasticity in response to growing conditions. However, Lui et al. proposed that the biosynthesis of carbohydrates such as glucose, fructose, and starch is regulated by DcSus genes in carrots [15]. Machaj et al. employed transcriptomics to compare wild and cultivated carrot taproots across three developmental stages, revealing that protein-coding genes involved in sugar metabolism were significantly upregulated in mature storage roots compared to young and developing roots [16]. Furthermore, Wang et al. integrated metabolomic and transcriptional profiling to elucidate the potential role of SWEET transporters in sugar accumulation during three key developmental phases of carrot taproots [17]. Ibdah et al. [18] comprehensively characterized the diversity of volatile terpenes and terpenoids across genetically distinct carrot genotypes, elucidating chemotypic variations at the molecular level. While multi-omics approaches for evaluating nutrient dynamics during crop development and maturation have predominantly been applied in fruit studies, Xu et al. [19] employed large-scale detection, identification, and quantitative analysis to investigate the comprehensive metabolic changes occurring during ‘Pinova’ apple development and ripening. Wang et al. [20] systematically characterized dynamic metabolic profiles and regulatory networks across five developmental stages of hawthorn fruit, elucidating the formation mechanisms of bioactive compounds. Current research on carrot metabolites predominantly focuses on carotenoids, anthocyanins, or other single categories of functional metabolites, whereas comprehensive metabolomic analyses of carrots remain scarce. Few studies have investigated the dynamic changes in metabolites and associated gene expression during taproot growth and development.
Therefore, this study utilizes integrated omics approaches to systematically investigate nutrient dynamics during carrot taproot maturation, providing a comprehensive elucidation of the regulatory mechanisms governing quality trait formation and accumulation during taproot expansion and ripening. This work significantly advances the theoretical understanding of carrot quality determinants.

2. Materials and Methods

2.1. Plant Material and Sample Preparation

The experimental material was the maternal line of the orange-red carrot cultivar ‘Tianhong No.1’, bred by the College of Horticulture at Shanxi Agricultural University. This cultivar features cylindrical taproots with smooth epidermis and vibrant orange-red pigmentation uniformly distributed across the periderm, phloem, cambium, and xylem tissues. With a growth cycle of 105–120 days, it demonstrates strong environmental adaptability.
The carrots were sown on 13 August 2020, in the solar greenhouse of the Horticultural Experimental Station at Shanxi Agricultural University. Cultivation employed raised beds with the following specifications: bed height 15 cm, bed width 40 cm, and inter-bed spacing 30 cm. Seeds were drill-sown in double rows, with seedlings thinned to 10 cm plant spacing at the 5-true-leaf stage. Standard agronomic practices were maintained throughout the growth period. Metabolomic profiling was performed on phloem tissues collected at three critical developmental stages of carrot taproots. At each sampling time point, six carrot plants with uniform growth status and consistent coloration were randomly selected and pooled as one biological replicate, with three independent biological replicates performed in total. All sampling procedures were conducted on ice. Using sterile razor blades, we excised the epidermal layer (2 cm below the crown) and pooled the tissues. After rinsing with sterile water and blot-drying, samples were randomly divided into three aliquots, flash-frozen in liquid nitrogen for ≥2 min, and subsequently stored at −80 °C. The sample preparation protocol followed our previously published methodology [21].

2.2. Widely Targeted Metabolomics Analysis

The widely targeted metabolomics analysis was performed by Wuhan Metware Biotechnology Co., Ltd. (Wuhan, China) (http://www.metware.cn/ (accessed on 1 September 2024)).

2.2.1. Sample Preparation and Extraction

Biological samples were lyophilized using a vacuum freeze-dryer (Scientz-100F, Ningbo, China) and ground to a fine powder with a grinding mill (MM 400, Retsch, Haan, Germany; 30 Hz, 1.5 min). Exactly 100 mg of the powdered material was dissolved in 1.2 mL of 70% methanol extraction buffer. The mixture was vortexed every 30 min (30 s per cycle, 6 cycles total) and incubated overnight at 4 °C. After centrifugation (12,000 rpm, 10 min), the supernatant was collected, filtered through a 0.22 μm microporous membrane, and stored in injection vials for UPLC-MS/MS analysis.

2.2.2. Chromatographic and Mass Spectrometric Conditions

The instrumental system for data acquisition primarily consisted of an ultra-high performance liquid chromatography (Ultra Performance Liquid Chromatography, UPLC) (SHIMADZU Nexera X2, Tokyo, Japan) coupled with a tandem mass spectrometer (Tandem mass spectrometry, MS/MS) (Applied Biosystems 4500 QTRAP). The chromatographic separation was performed on an Agilent SB-C18 column (1.8 µm, 2.1 mm × 100 mm) with mobile phase A (ultrapure water containing 0.1% formic acid) and mobile phase B (acetonitrile containing 0.1% formic acid). The gradient elution program was as follows: 5% B at 0.00 min, linearly increased to 95% B over 9.00 min, and maintained at 95% B for 1 min, then decreased to 5% B from 10.00 to 11.10 min, and finally equilibrated at 5% B until 14 min. The flow rate was 0.35 mL/min, column temperature was maintained at 40 °C, and the injection volume was 4 µL.
For mass spectrometry analysis, both linear ion trap (LIT) and triple quadrupole (QQQ) scans were acquired using a Q TRAP LC-MS/MS system (AB4500 Q TRAP Applied Biosystems, Foster City, CA, USA) equipped with an ESI Turbo Ion Spray interface, controlled by Analyst 1.6.3 software (AB Sciex) in both positive and negative ion modes. The ESI source parameters were set as follows: ion source, turbo spray; source temperature 550 °C; ion spray voltage (IS) 5500 V (positive ion mode) or −4500 V (negative ion mode); ion source gas I (GSI), gas II (GSII), and curtain gas (CUR) were set at 50, 60, and 25.0 psi, respectively, with collision-induced ionization parameters set to high. Instrument tuning and mass calibration were performed using 10 and 100 µmol/L polypropylene glycol solutions for QQQ and LIT modes, respectively. QQQ scans were conducted in MRM mode with collision gas (nitrogen) set to medium. Further optimization of declustering potential (DP) and collision energy (CE) was performed to establish optimal MRM transitions. Specific MRM ion pairs were monitored for each metabolite according to their respective elution periods.

2.2.3. Metabolite Identification and Quantification

Metabolite identification was performed using the in-house MetWare Database (MWDB) (Wuhan Metware Biotechnology Co., Ltd., Wuhan, China) by matching secondary mass spectra, with careful exclusion of isotopic signal, adduct ions (including K+, Na+, and NH4+ adducts), and fragment ions derived from higher molecular weight compounds to ensure analytical specificity. This rigorous filtering process significantly enhanced the accuracy of metabolite annotation while minimizing false identifications. Metabolite quantification was achieved using the multiple reaction monitoring (MRM) mode on a triple quadrupole mass spectrometer, which significantly enhances analytical specificity and precision. In this mode, the first quadrupole (Q1) selectively filters the precursor ion (parent ion) of the target compound while excluding ions of other molecular weights to eliminate initial interference. The selected precursor ion then undergoes collision-induced dissociation in the collision cell, generating various fragment ions. Subsequently, the third quadrupole (Q3) precisely filters a specific characteristic fragment ion from these fragments, effectively excluding non-target ion interference. This two-stage mass filtering mechanism provides exceptional selectivity, enabling highly accurate quantification with superior reproducibility. Following acquisition of metabolomic mass spectrometry data across samples, all detected metabolite peaks were subjected to peak area integration. To ensure data comparability, intensity normalization was systematically performed for identical metabolites detected in different samples, accounting for potential variations in instrument response and matrix effects.
The quality control (QC) sample mixture was evidenced by the total ion current (TIC) chromatogram, as shown in Figure S1. Figure S2 presents multiple reaction monitoring (MRM) metabolite detection profiles.

2.3. RNA Extraction and RNA-Seq Analysis

This study employed transcriptomic sequencing of carrot peel samples collected during three key developmental stages corresponding to the metabolomic sampling: seedling stage (B1–B3), color transition stage (A1–A3), and mature stage (R1–R3), with three biological replicates per stage. Total RNA was extracted using the TIANGEN RNeasy Plant Mini Kit, with quality and concentration verified by Agilent 2100 Bioanalyzer (Agilent Technologies, Foster City, CA, USA).
Library preparation involved the following:
(1)
mRNA enrichment via oligo (dT) magnetic beads;
(2)
RNA fragmentation and first-strand cDNA synthesis with random hexamers;
(3)
Second-strand synthesis using DNA Polymerase I/RNase H;
(4)
Purification (QiaQuick PCR Extraction Kit, Canspec, Shanghai, China) and size selection (agarose gel electrophoresis).
Sequencing was performed on an Illumina platform after library quality control (Agilent 2100). Raw reads were processed by the following:
  • Removing adapter sequences;
  • Discarding reads with > 10% N bases or Q20 < 50%;
  • Filtering rRNA and low-quality reads to obtain clean data (Q30 > 90%).
Clean reads were aligned to the Daucus carota reference genome (GCF_001625215.1) using HISAT2, with transcript assembly and quantification via StringTie. Differentially expressed genes (DEGs) were identified (|log2FC| > 1, FDR < 0.01) and functionally annotated through GO and KEGG pathway analyses (OmicShare tools, Tokyo, Japan).

2.4. Statistical Analysis

IBM SPSS Statistics 26 was used for the variance test; heat mapping from Origin 2024; and Excel 2016 for data sorting. The identified metabolites were annotated using the KEGG Compound database (http://www.example.com(accessed on 7 March 2025)). Map the annotated metabolites to the KEGG pathway database (http:www.kegg.jp/kegg/pathway.html (accessed on 7 March 2025)).

3. Results

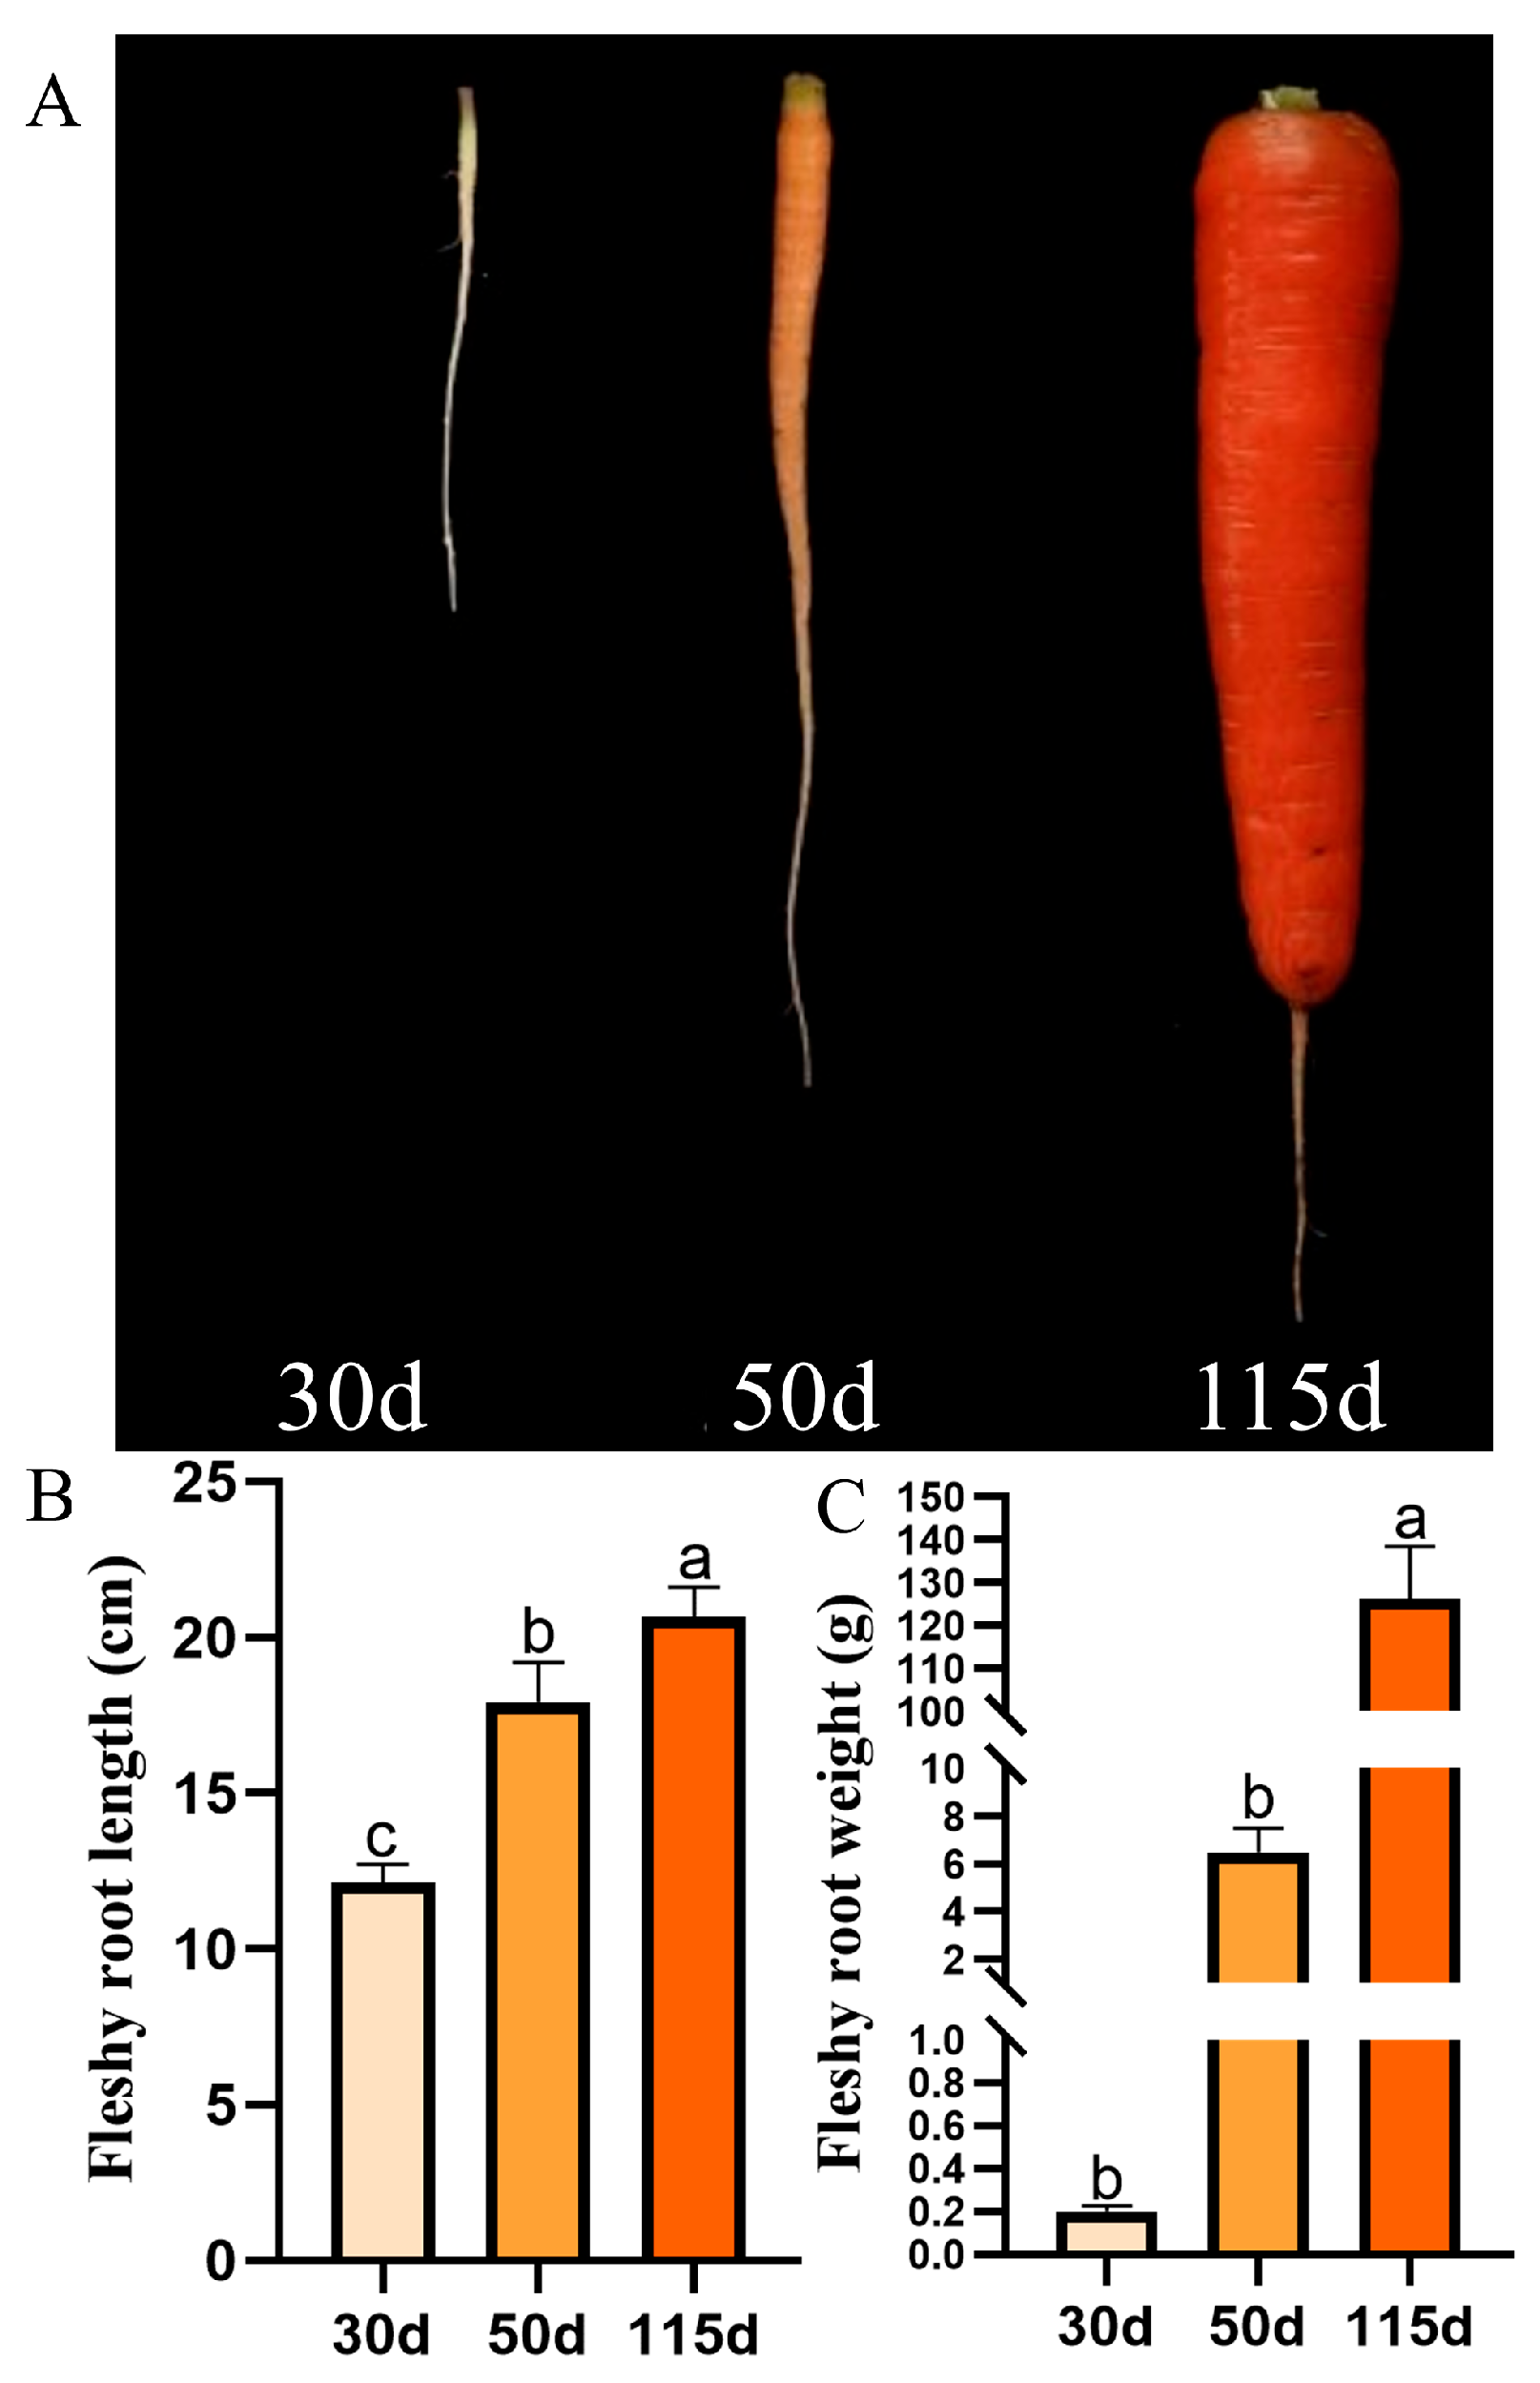
3.1. Morphological Physiology of Carrots

Figure 1A displays three stages: fleshy root formation stage S (30 days after sowing, DAS), expansion stage L (50 DAS), and maturation stage H (115 DAS). The taproot underwent rapid elongation between 30 and 50 days after sowing (DAS), with a growth rate reaching 148.0%. After 50 DAS, the elongation rate significantly decreased to only 12.68% (Figure 1B). While the fresh weight of taproots showed a modest increase of 6.29 g during the first 50 DAS, it exhibited a remarkable surge starting at 50 DAS until stabilizing at maturity, accompanied by visible color transition (Figure 1C).

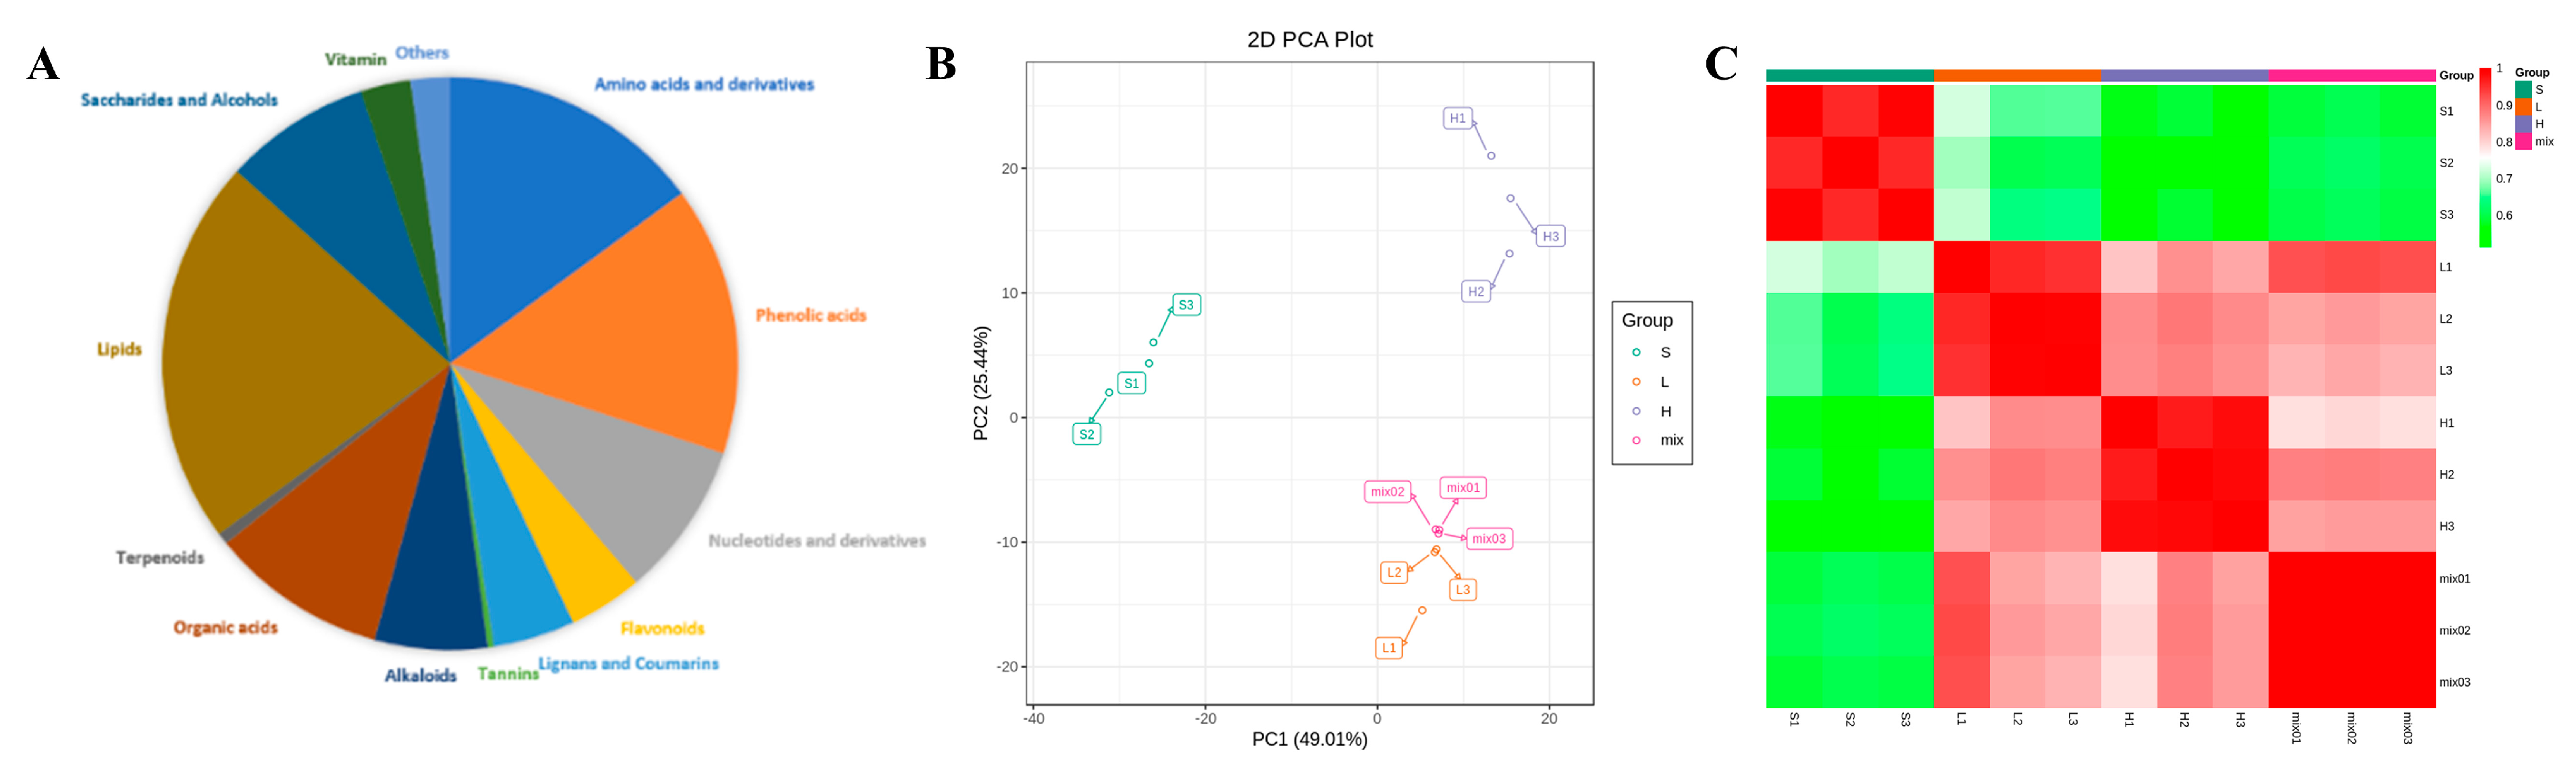
3.2. Analysis of Carrot Metabolites

A total of 607 metabolites were identified in carrot samples across three developmental stages (S, L, H) using LC-MS/MS analysis. These metabolites were systematically classified into 14 distinct categories (Figure 2A). The metabolic composition analysis revealed lipids as the most abundant class (21.7%), followed by phenolic acids (15.1%), amino acids and derivatives (14.8%), organic acids (9.9%), nucleotides and derivatives (8.7%), sugars and alcohols (8.2%), alkaloids (6.3%), lignins and coumarins (4.6%), flavonoids (4.1%), and vitamins (2.8%). Additionally, the profile included 4 tannins, 2 terpenoids, 1 stilbene, and 15 unclassified compounds, collectively representing the major chemical constituents during the maturation of orange-red carrots.
To elucidate the dynamic changes and interrelationships of metabolite accumulation patterns across different developmental stages of carrots, principal component analysis (PCA) was performed on the metabolic profiles of nine samples (representing three biological replicates per stage), as illustrated in Figure 2B. The principal component analysis yielded clear separation patterns, with the first principal component (PC1) accounting for 49.01% of the total variance and effectively discriminating samples according to their distinct maturation stages. The second principal component (PC2) explained an additional 25.44% of the variance, revealing significant metabolic differences between developmental phases while demonstrating high reproducibility, as evidenced by the tight clustering of biological replicates within each time point. The L-group samples were positioned intermediately between the S- and H-groups along the PC1 axis, which aligns perfectly with the chronological progression of carrot developmental stages. Subsequent correlation analysis (Figure 2C) revealed high consistency among biological replicates, with inter-replicate correlation coefficients all exceeding 0.8 throughout carrot maturation. These results demonstrate excellent experimental reproducibility and confirm the reliability of our metabolomic datasets, which is fully consistent with the distinct clustering patterns observed in the PCA.

3.3. Characteristics of Primary Metabolism During Carrot Maturation

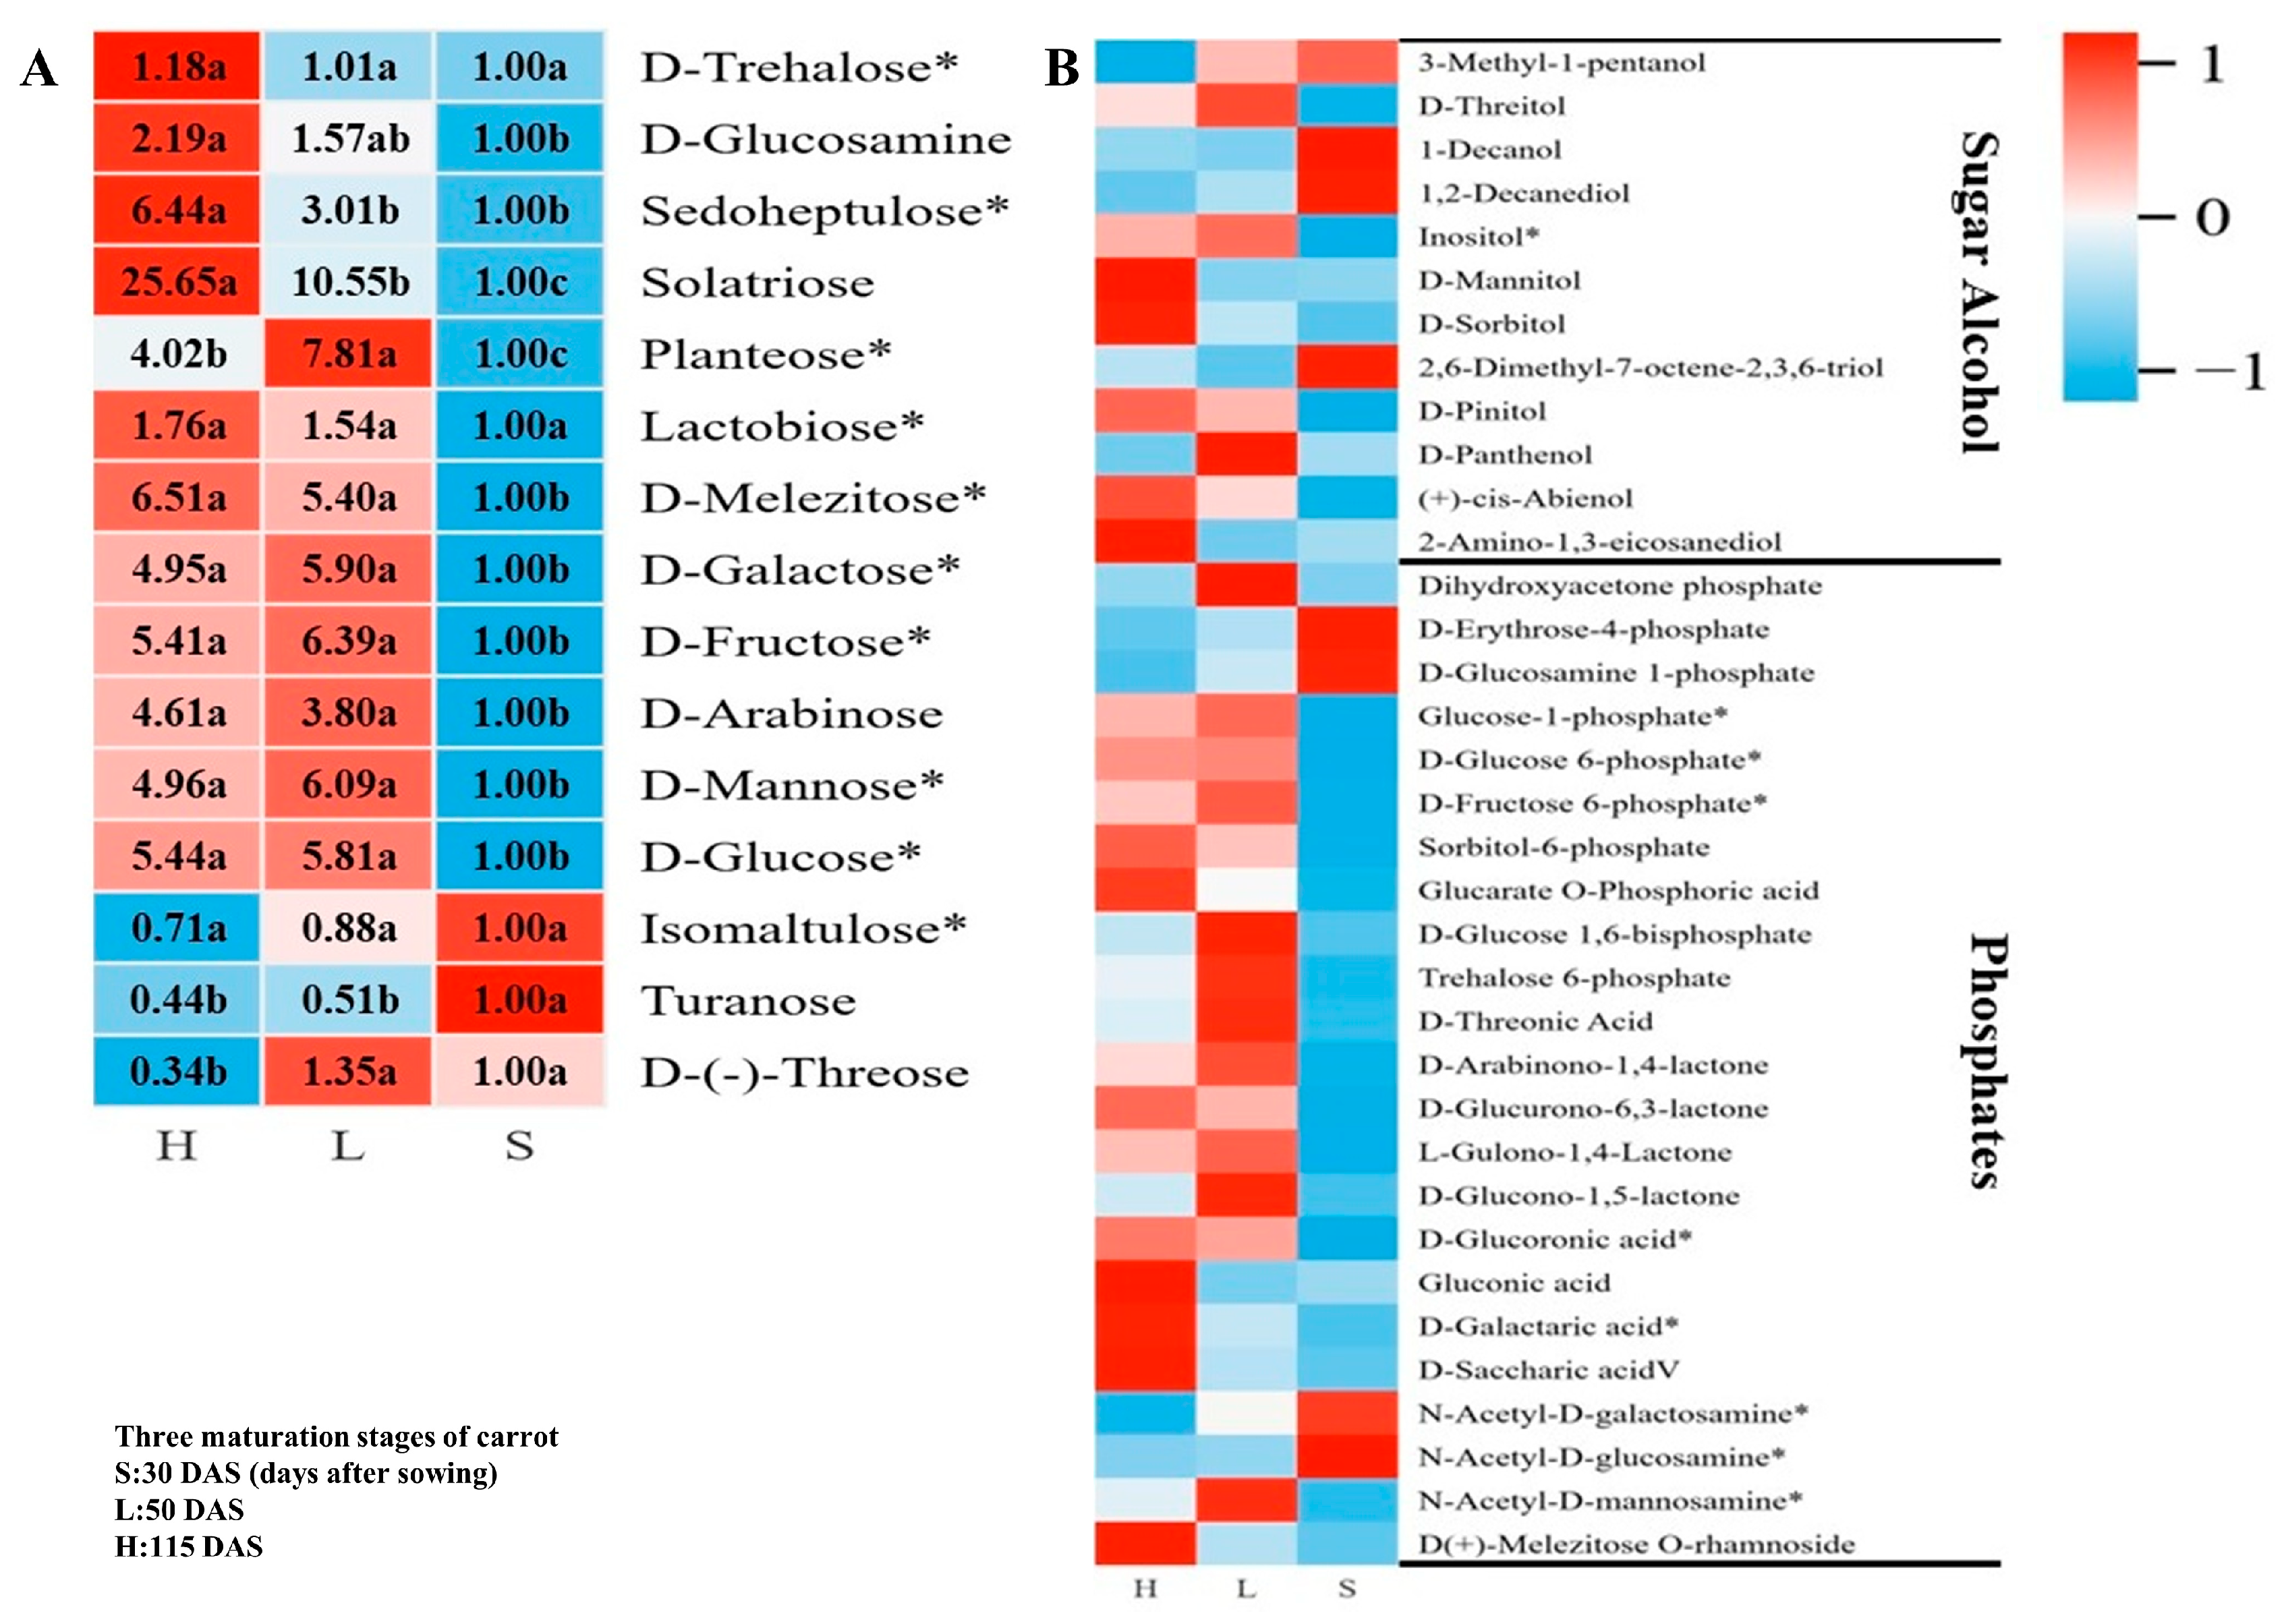
3.3.1. Metabolism of Sugar, Sugar Alcohols, and Their Phosphates

Fructose (Fru), sucrose (Suc), and glucose (Glu) were identified as the primary sugars associated with sweet taste perception. The content trends of fructose and glucose showed similar patterns, both exhibiting a significant rapid increase from stage S to L, while remaining relatively stable from stage L to H. Notably, sucrose was not detected by the widely targeted metabolomics approach across all three developmental stages of carrot. Furthermore, the contents of D-Galactose, D-Arabinose, Mannose, Lactobiose, and D-Melezitose exhibited similar changing trends to the two major soluble sugars mentioned above (Figure 3A). D-Trehalose, D-Glucosamine, Solatriose, and Sedoheptulose showed continuous increases across the three maturation stages of carrots. Planteose and D-(-)-Threose accumulated significantly during the color-turning stage but subsequently declined. Most sugars demonstrated an overall increasing trend during carrot maturation, with the exception of Isomaltulose and Turanose. These results indicate that sugar accumulation, which determines carrot sweetness, primarily occurs from the S to L stages. Among the 12 sugar alcohol metabolites detected, 2-Amino-1,3-eicosanediol D-Mannitol and D-Sorbitol exhibited significant accumulation in stage H. D-Threitol, Inositol, D-Pinitol, and (+)-cis-Abienol showed a rapid and significant increase from stage S to L, but remained relatively stable from L to H. In contrast, D-Panthenol accumulated markedly during stage L, then declined significantly by maturation stage (H). 2,6-Dimethyl-7-octene-2,3,6-triol, 3-Methyl-1-pentanol, 1-Decanol, and 1,2-Decanediol all exhibited a gradual decline during carrot maturation (Figure 3B). Most sugar phosphates increased from stage S to L, accumulating predominantly during the expansion stage, with no significant differences observed from L to H. Among them, Dihydroxyacetone phosphate (DHAP), D-Glucose-1,6-bisphosphate, and Trehalose-6-phosphate (T6P) reached high accumulation levels during the color-turning stage before rapidly declining to low levels. D-Erythrose-4-phosphate and D-Glucosamine-1-phosphate accumulated during the early carrot maturation stages but subsequently decreased sharply to basal levels.

3.3.2. Organic Acid Metabolism

A total of 60 organic acid metabolites were detected across the three maturation stages of carrot fleshy roots. Although nearly one-third of organic acids showed increasing trends during carrot fleshy root expansion, the overall content of organic acids exhibited a declining tendency. Among these, Fumaric acid exhibited continuous accumulation throughout carrot maturation, while Succinic acid declined at stage L before rebounding, ultimately showing higher levels at stage H compared to the S stage (Figure 4). With the exception of Succinic acid and Fumaric acid, the concentrations of other TCA cycle intermediate organic acids (α-Ketoglutaric acid, Citric acid, Isocitric acid, and L-Malic acid) at stage H were all lower than those at the initial stage S. Citric acid and Isocitric acid showed coordinated changes, both decreasing significantly at stage L and subsequently stabilizing. α-Ketoglutaric acid levels declined progressively from stage S to H. In contrast, L-Malic acid increased transiently at stage L before decreasing, ultimately exhibiting a non-significant reduction at maturation compared to the formation stage. In summary, these organic acids are intermediate products of the TCA cycle, and their levels typically decrease significantly during the development of storage organs. Quinic acid and Azelaic acid exhibited patterns similar to Citric acid and Isocitric acid, showing pronounced decreases during carrot maturation. Conversely, 3-Dehydro-L-Threonic acid and D-Xylonic acid mirrored Succinic acid dynamics—declining at stage L before rebounding at stage H, with D-xylonate reaching statistically significant levels.

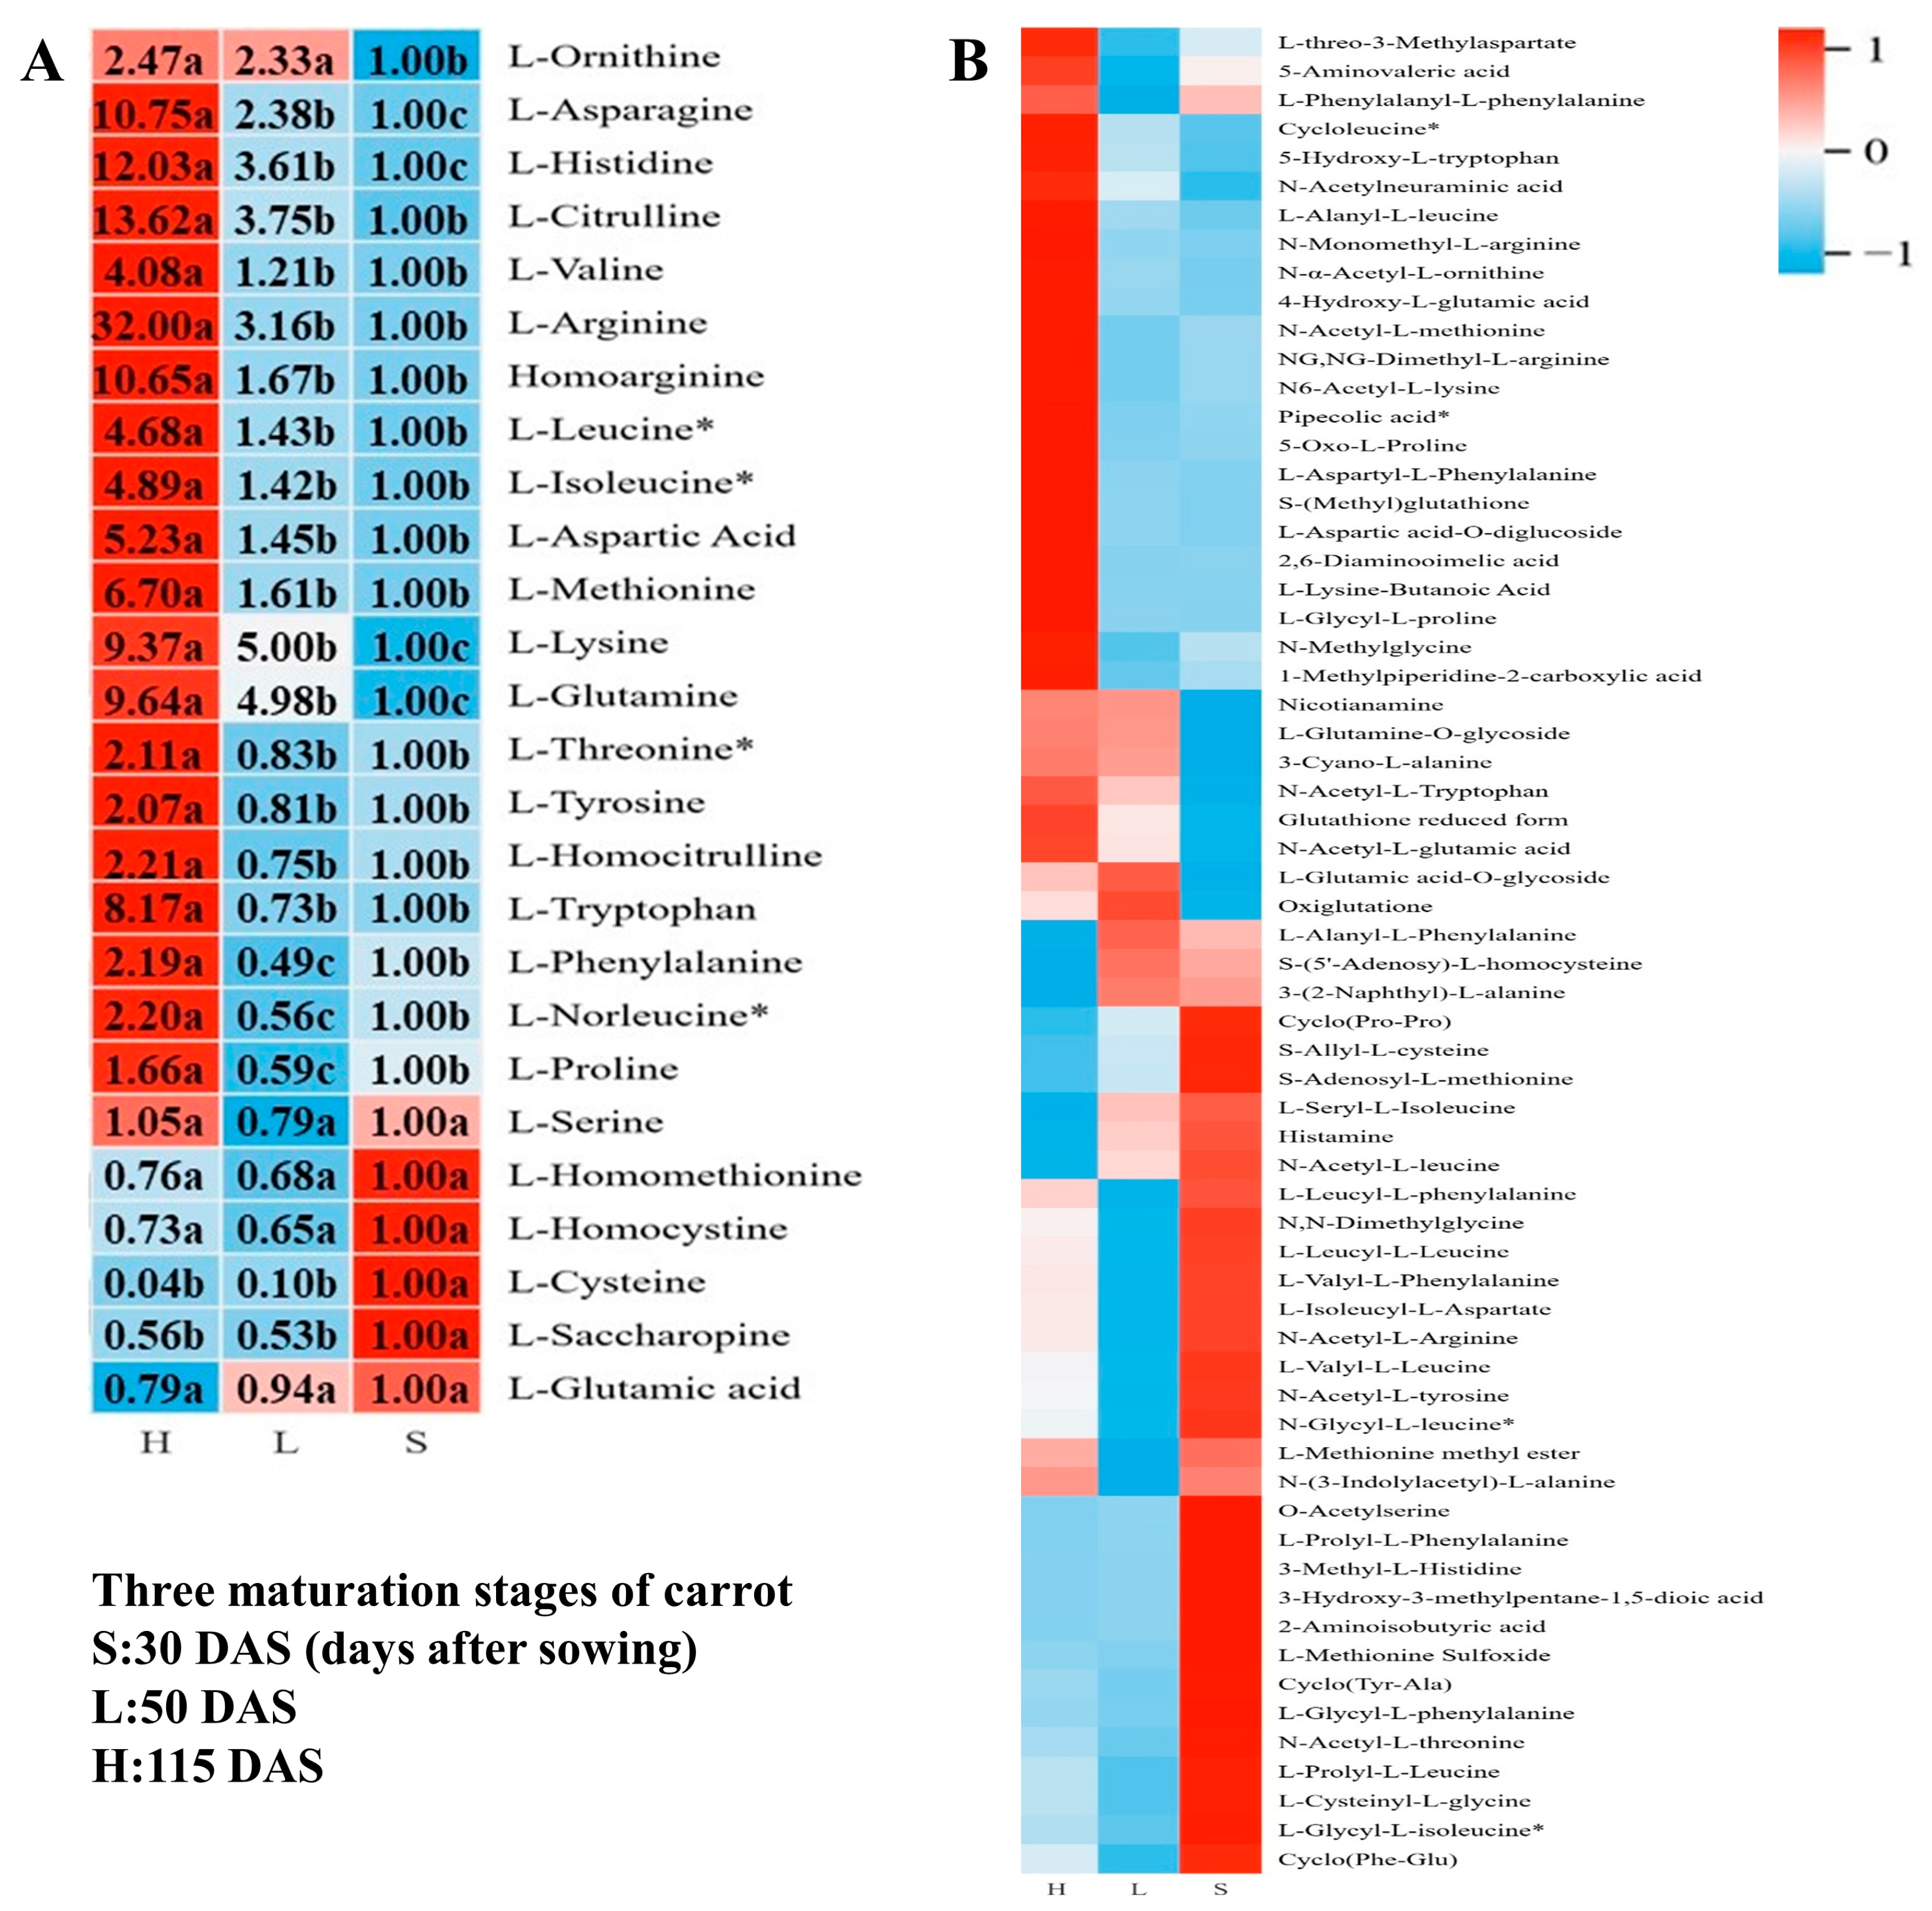
3.3.3. Accumulation Profiles of Amino Acids and Their Derivatives

A total of 26 amino acids and 64 amino acid derivatives were detected during carrot maturation. The majority of amino acids exhibited significant accumulation at stage H (Figure 5). Specifically, L-Lysine (Lys) and L-Glutamine (Gln) showed rapid accumulation from the forming stage S through the expansion stage L, persisting until maturity H. L-Ornithine (Orn) was upregulated at stage L and remained stable thereafter, with marked accumulation at stage H. A total of nine amino acids were analyzed, including L-aspartic acid (Asp), L-histidine (His), L-citrulline (Cit), and others, displayed no significant increase at stage L but underwent a sharp transition post-L, culminating in significant accumulation at H. Seven amino acids, including L-threonine (Thr), L-tyrosine (Tyr), and L-homocitrulline, showed downregulation during the expansion stage but significant accumulation at the maturation stage. In contrast, L-Homomethionine, L-Homocysteine, L-Cysteine (Cys), L-Saccharopine, and L-glutamate (Glu) exhibited high accumulation levels during the early developmental stages of carrots. Among these, Glu gradually decreased throughout growth and development, remaining lower than other highly accumulated amino acids at corresponding stages. L-Serine (Ser) showed elevated levels at the forming stage S, declined thereafter, but rebounded to high accumulation levels at stage H. Overall, amino acid derivatives exhibited a bimodal accumulation pattern: approximately half showed peak levels at the forming stage (S), while the other half peaked at the maturation stage (H). The majority of derivatives remained stable after undergoing changes during the expansion stage (L).

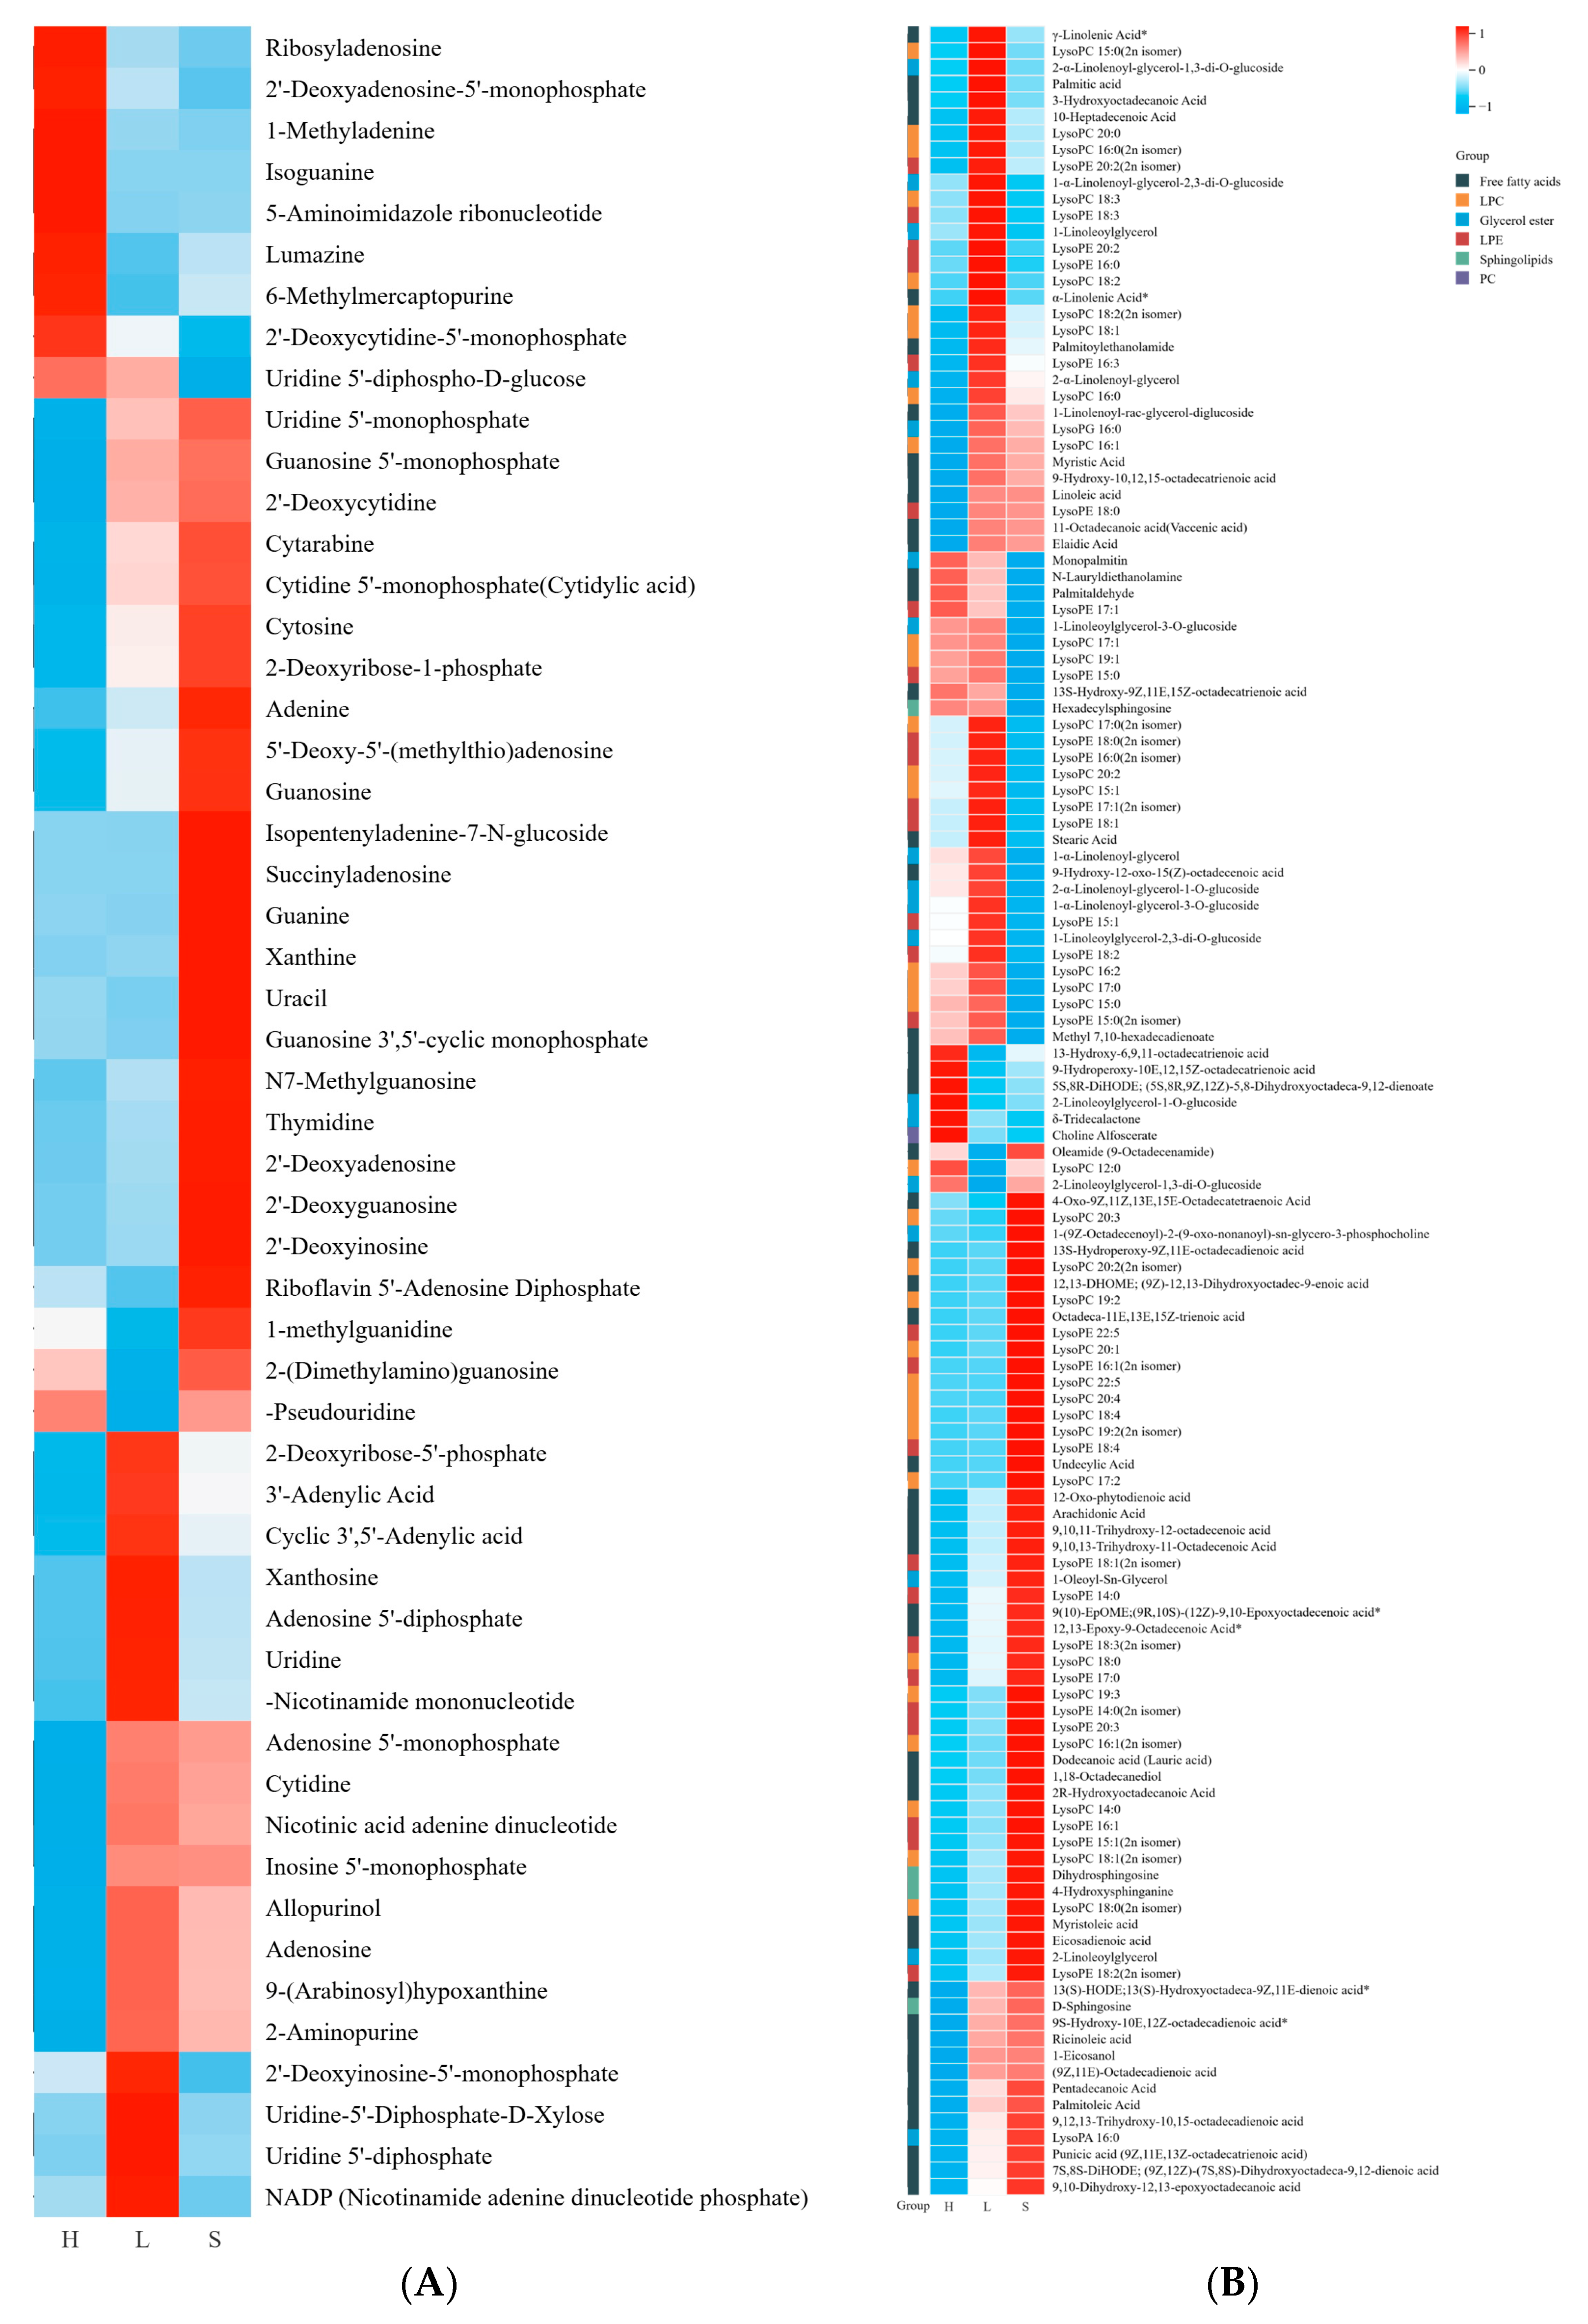
3.3.4. Other Primary Metabolites

A total of 132 lipid metabolites were detected, comprising 49 free fatty acids (FFAs), 33 lysophosphatidylcholines (LPCs), 27 lysophosphatidylethanolamines (LPEs), 18 glycerolipids, sphingolipids, and 1 sphingophosphatidylcholine. The results demonstrated that the majority of lipids were depleted during carrot maturation, while the following compounds accumulated at the harvest stage (H): eight FFAs, six LPCs, three LPEs, most glycerolipids, and one sphingolipid (Figure 6B).
A total of 53 nucleotides and derivatives were detected in carrot fleshy roots (Figure 6A). Nearly half of these compounds (e.g., uracil, cytosine, adenine, guanine, guanosine, and thymidine) exhibited high accumulation levels during early developmental stages, followed by a gradual decline. At maturity, approximately one-fifth of nucleotides/derivatives showed significant accumulation. Another one-fifth (e.g., uridine 5′-diphosphate, uridine, and xanthosine) initially increased then decreased during development. The remaining compounds remained stable initially but decreased sharply from the expanding stage (L) to maturation (H).

3.4. Secondary Metabolism Characteristics During Carrot Maturation

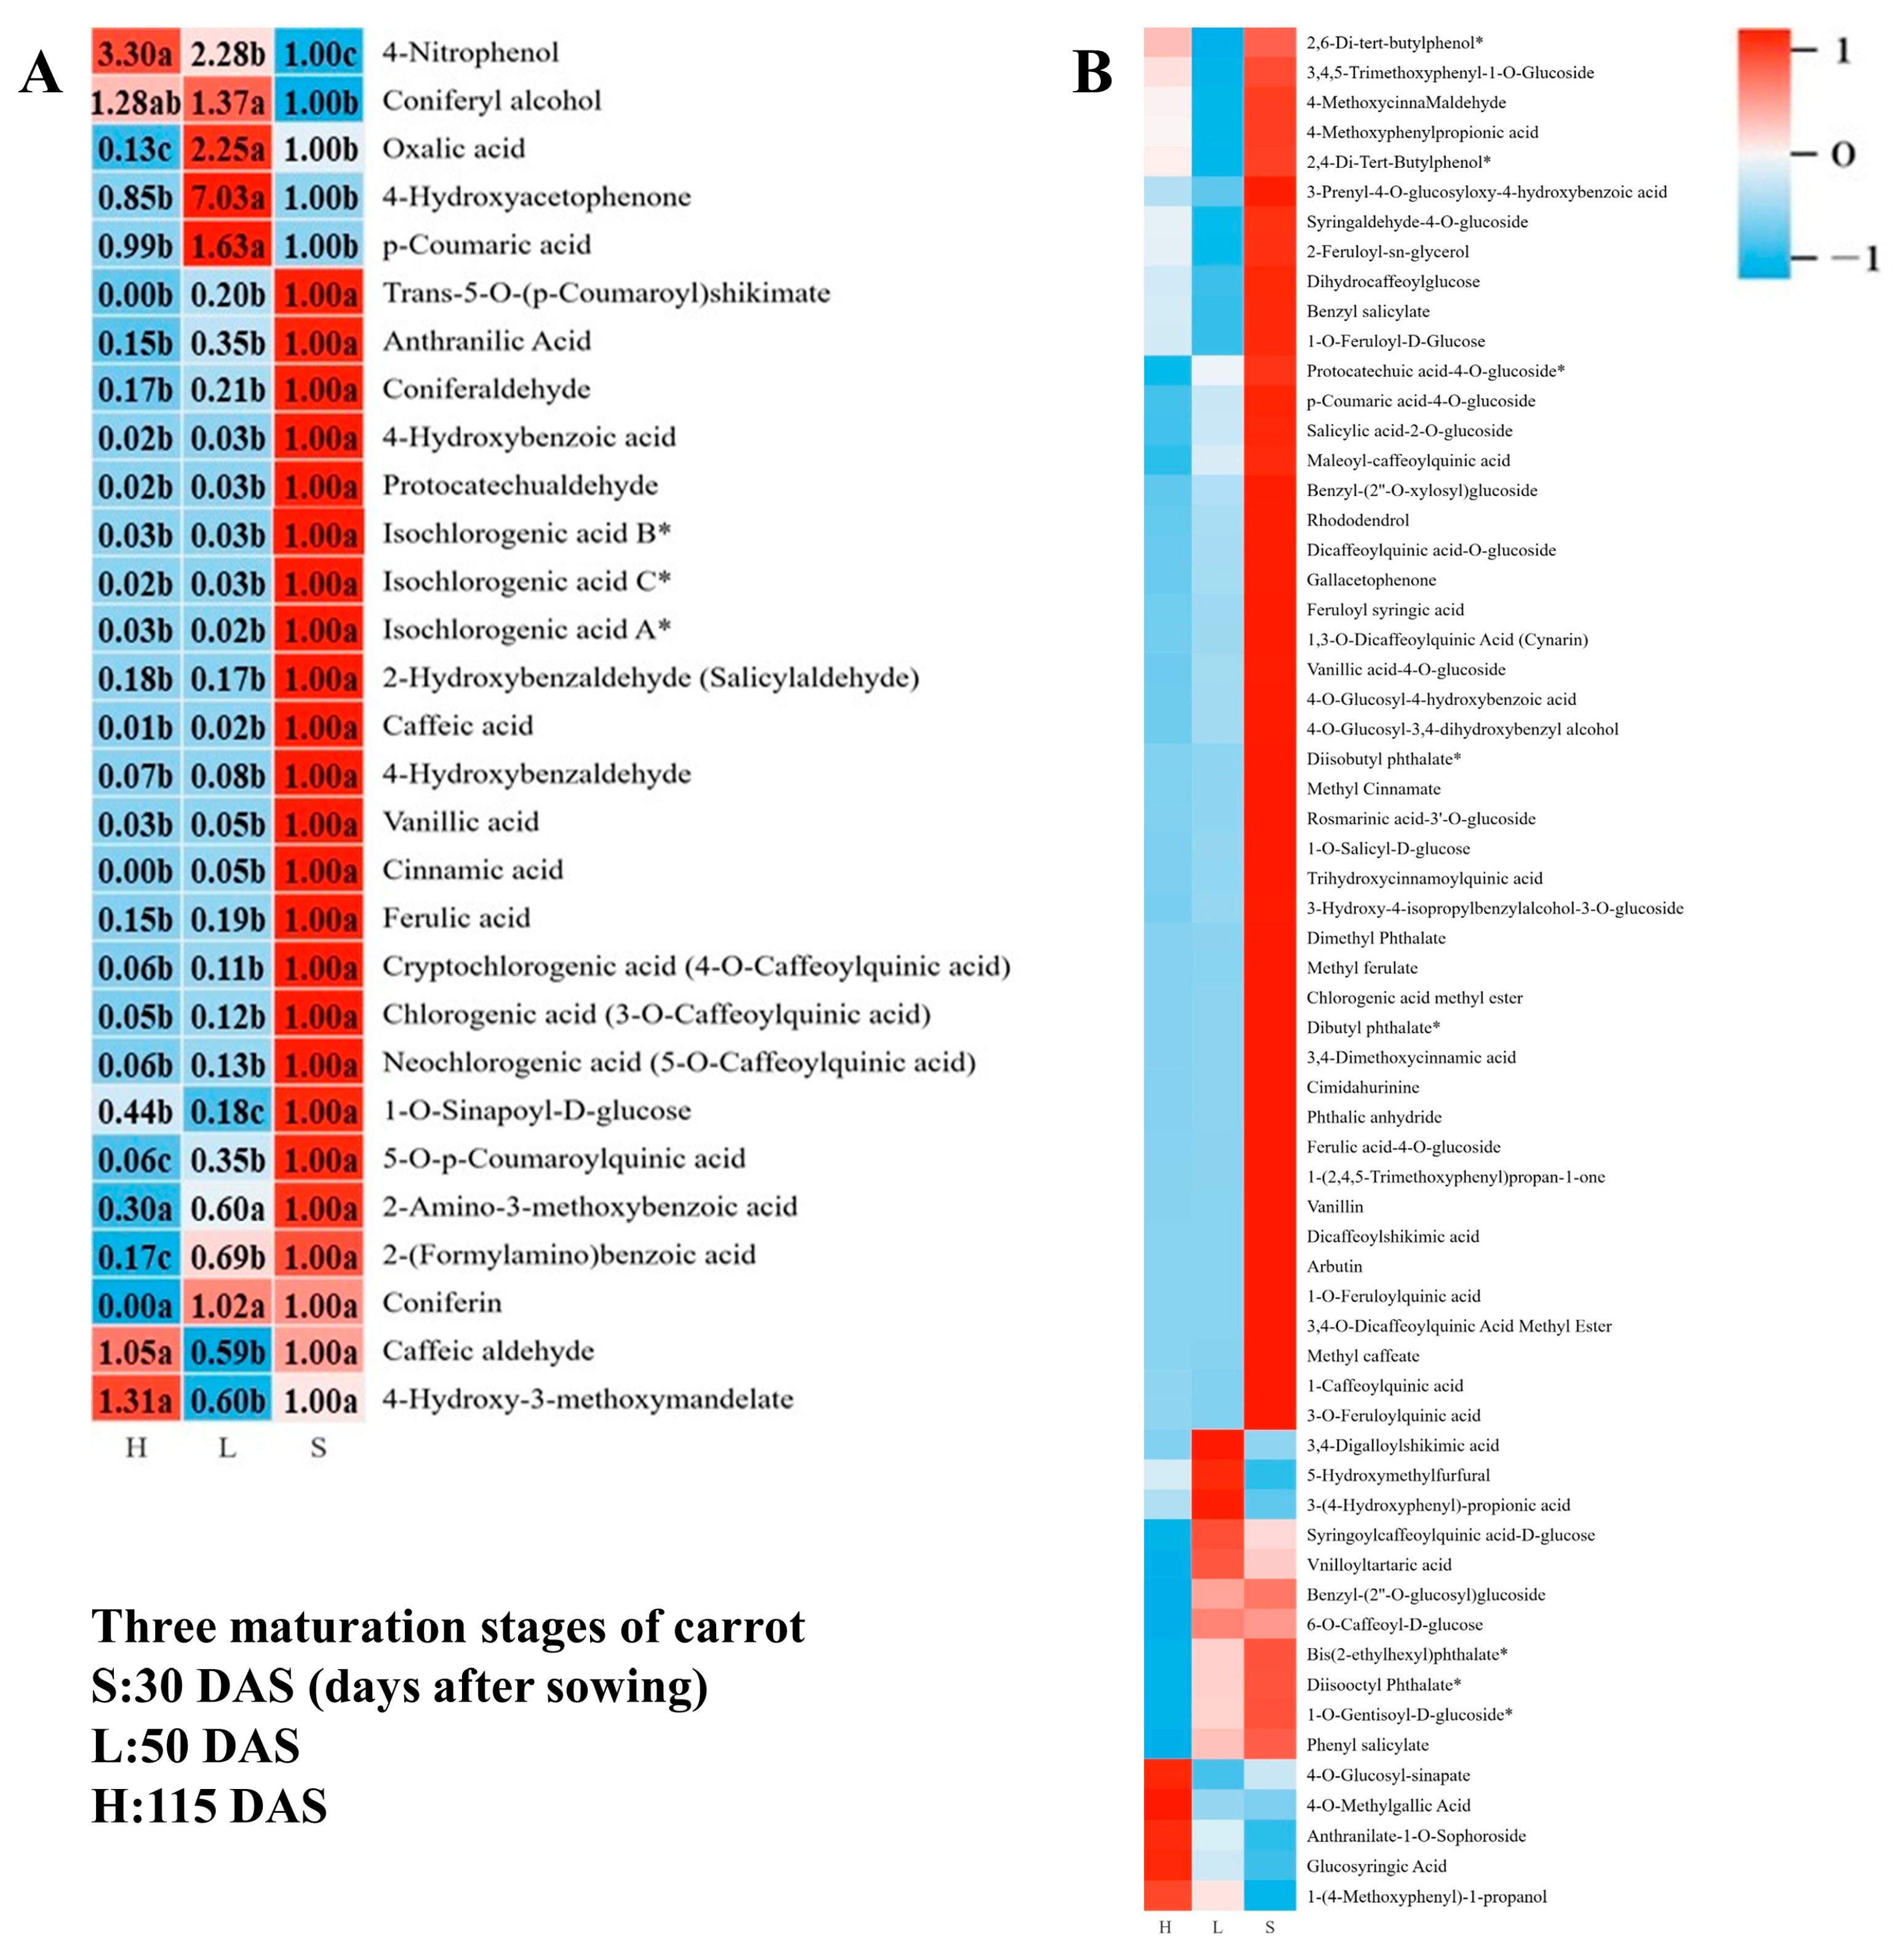
3.4.1. Metabolism of Phenolic Acid

This study detected a total of 206 secondary metabolites, comprising 92 phenolic acids and 114 other secondary metabolites. Most phenolic acids exhibited peak accumulation during the early developmental stages of carrots, followed by a significant decline to low levels at the expanding stage (L), after which they remained stable (Figure 7). Specifically, Bis (2-ethylhexyl) phthalate, Diisooctyl Phthalate, 1-O-Galloyl-D-glucose, 2-(Formylamino) benzoic acid, and phenyl salicylate showed progressive decreases throughout carrot maturation. Six phenolic acids, including Oxalic acid and Coniferin, were significantly downregulated from stage S to L. Another six phenolic acid metabolites, such as Coniferyl alcohol and p-Coumaric acid, exhibited a characteristic rise-and-fall pattern with significant accumulation at the color-turning stage. Additionally, eight phenolic acid metabolites, including 4-Nitrophenol, 4-O-Methylgallic Acid, and 4-Hydroxy-3-methoxymandelate, showed marked accumulation at the maturation stage (H).

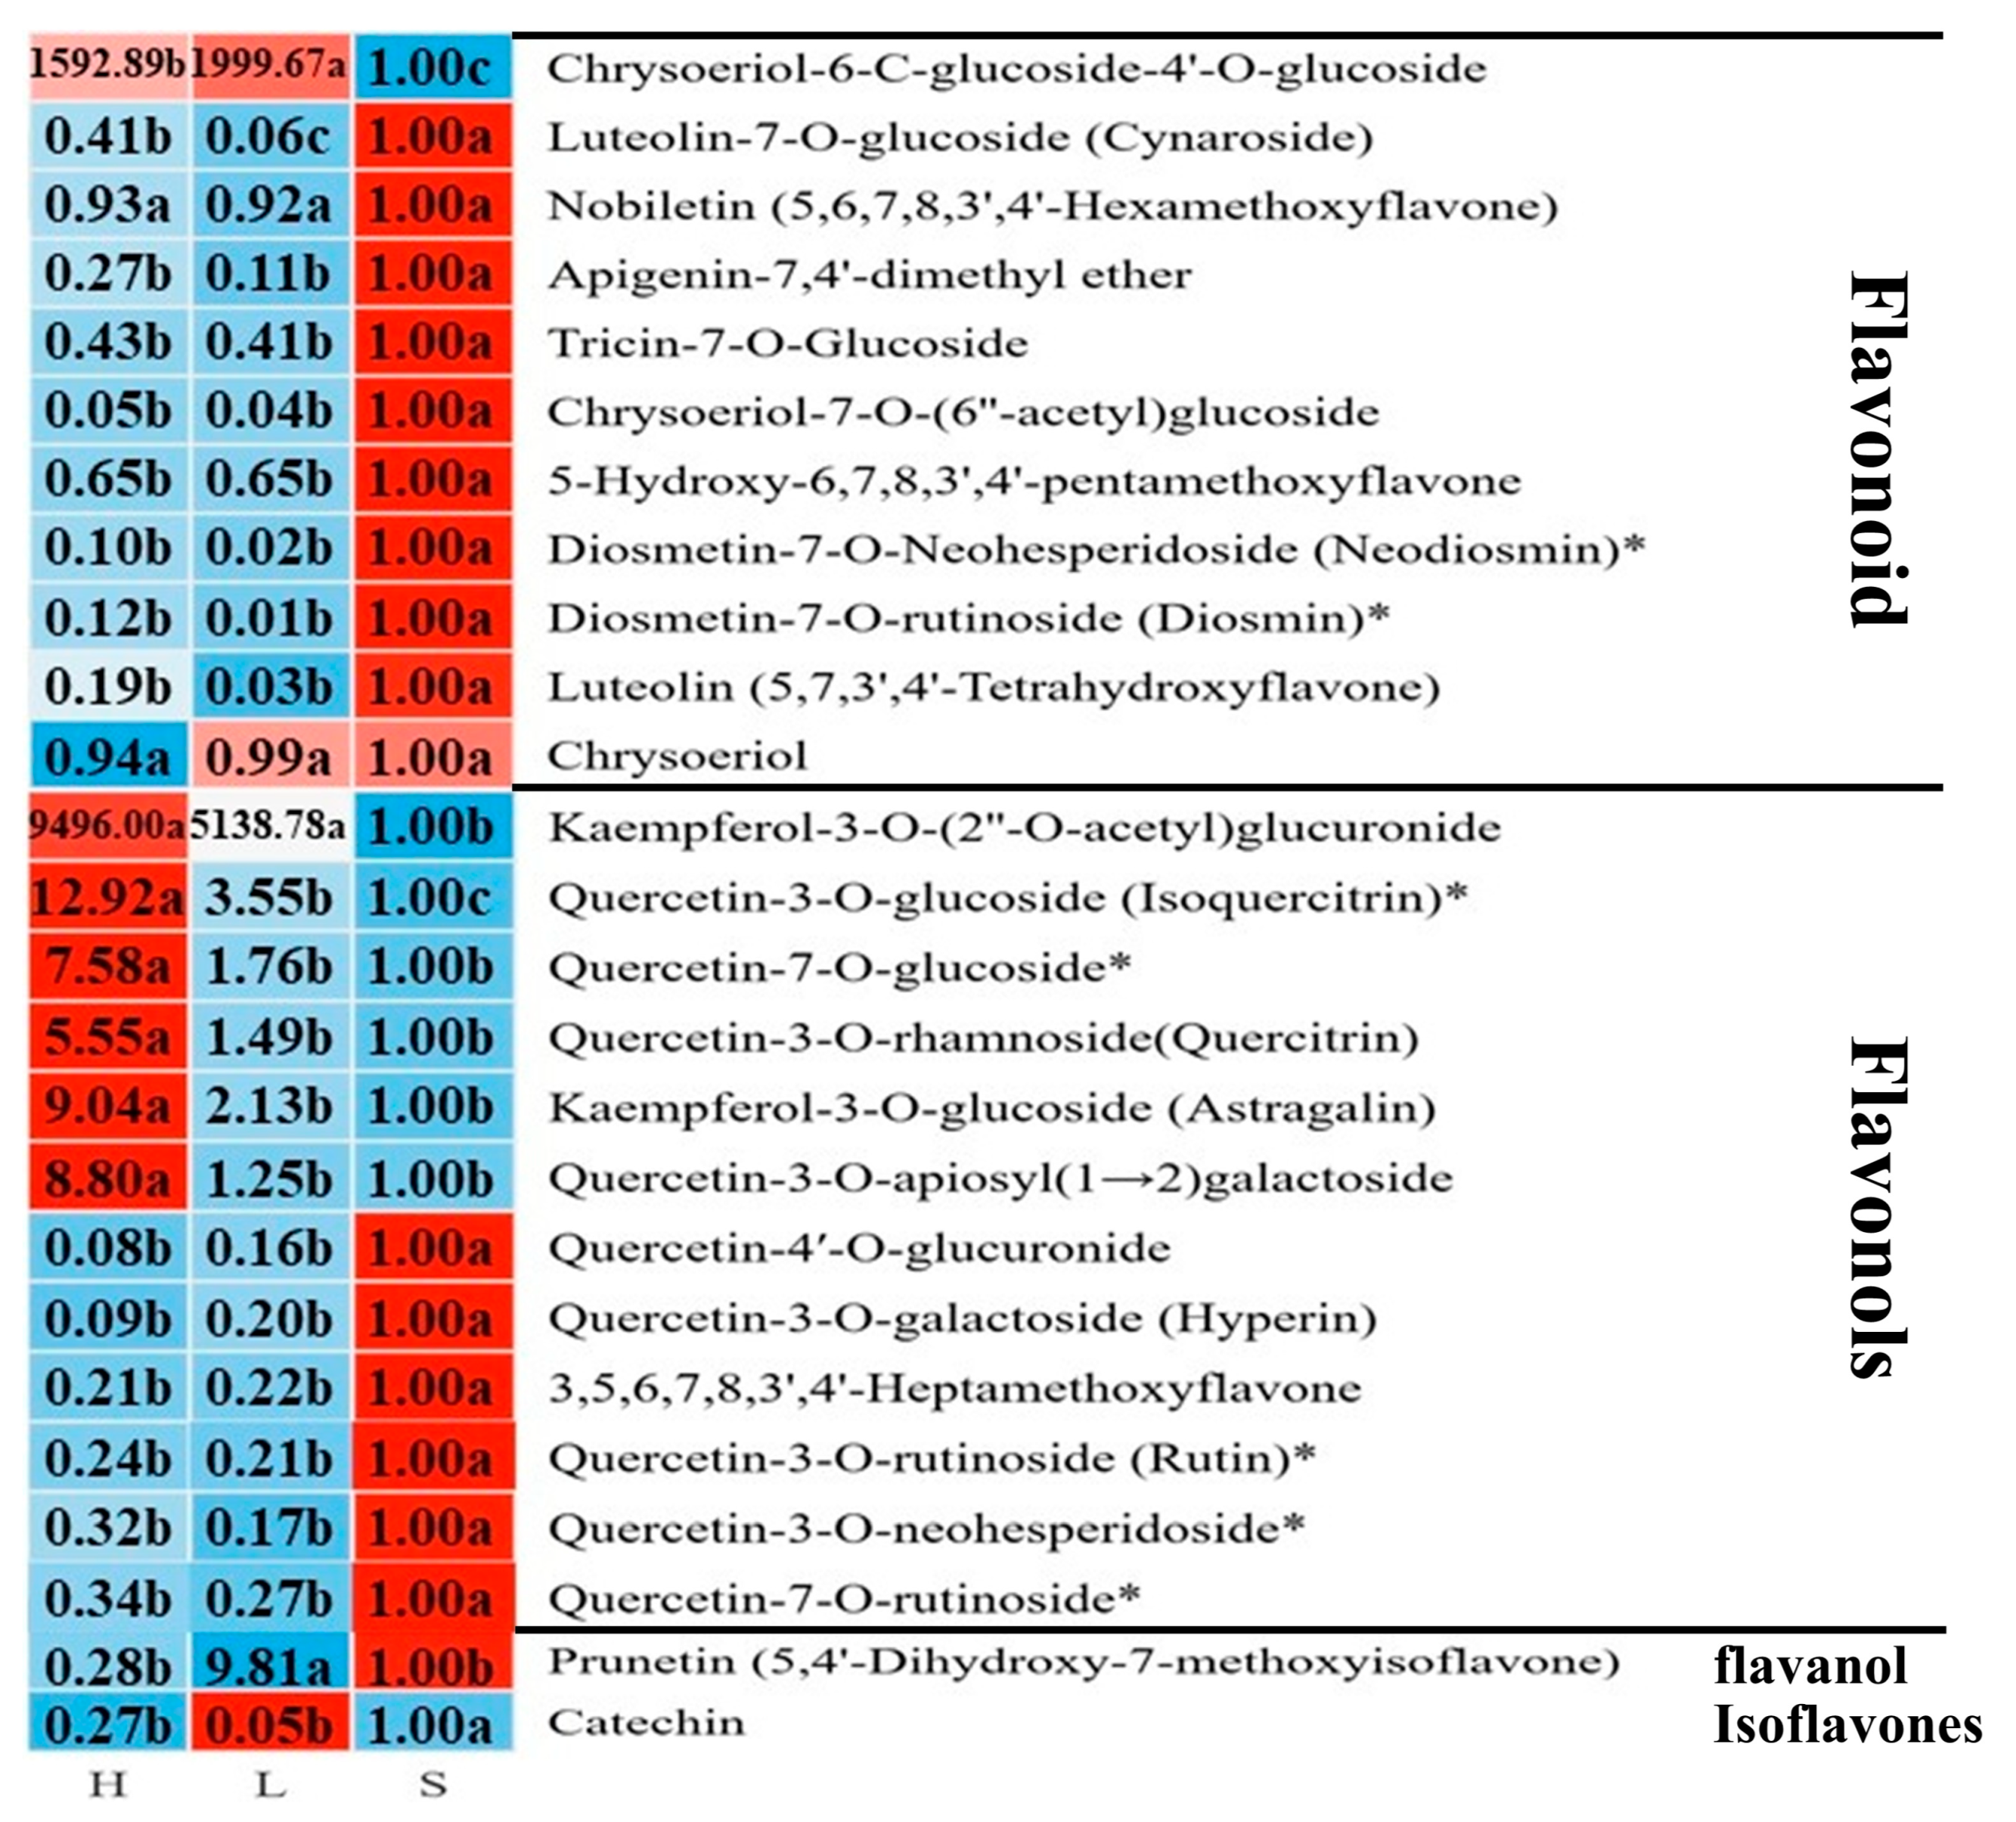
3.4.2. Flavonoid Metabolism

A total of 25 flavonoid compounds were detected, including 11 flavones and 12 flavonols (Figure 8), as well as one isoflavone and one flavanol. The majority of flavonoid compounds accumulated during the early developmental stages of carrots, subsequently decreased during the expanding stage, and then remained largely stable through the harvest period. Among these flavonoids, Nobiletin initially accumulated during the early stage before declining, though not to a statistically significant extent. Notably, at the maturation stage, its accumulation level reached the highest among all detected flavonoids, exceeding other flavonoid compounds by an order of magnitude. Flavonols showing significant accumulation at the maturation stage included the following: Isoquercitrin (Quercetin-3-O-glucoside), Quercitrin (Quercetin-3-O-rhamnoside), Astragalin (Kaempferol-3-O-glucoside), Quercetin-7-O-glucoside, Quercetin-3-O-apiosyl (1 → 2) galactoside, and Kaempferol-3-O-(2″-O-acetyl)glucuronide. The remaining flavonols exhibited higher concentrations during the early developmental stage (S) of carrots, followed by a significant downregulation at the expanding stage (L), and subsequently remained stable through the maturation stage (H). Catechin showed significant accumulation during the expanding stage (L), while Prunetin (5,4′-Dihydroxy-7-methoxyisoflavone) exhibited higher initial levels during early development (S), followed by marked downregulation at stage L and a slight (non-significant) recovery at maturation (H).

3.4.3. Accumulation of Other Secondary Metabolites

A total of 23 coumarins and 5 lignans were detected during carrot maturation (Figure 9A). Most coumarins and all lignans accumulated during the early developmental stage (S), then significantly decreased at the expanding stage (L) and remained stable thereafter. Bergamottin and Syringaresinol-4′-O-(6″-acetyl) glucoside showed slight re-accumulation at the maturation stage (H), though their levels remained lower than during the forming stage. Aurapten and Notopterol accumulated at the maturation stage, while 1-Methoxyphaseollin and Fraxetin-8-O-glucoside (Fraxin) exhibited significant accumulation at the expanding stage, followed by a decline, displaying a characteristic rise-and-fall pattern.
A total of 38 alkaloids were detected, comprising 11 phenolic amines, 6 indole alkaloids, and 21 other alkaloids (Figure 9B). Among these, 17 alkaloids, including Betaine, showed significant accumulation at the harvest stage (H). N-Feruloyltyramine and Trigonelline exhibited progressive increases throughout carrot maturation. In contrast, compounds such as Cadaverine, Spermine, Indole 3-acetic acid (IAA), and Indole-3-carboxylic acid, which were present at higher levels during the early developmental stages, were subsequently depleted. The highest concentration of Putrescine was observed at the expanding stage (L). Choline accumulated during early development but was depleted after the expanding stage, ultimately reaching levels at harvest that were significantly lower than those during the forming stage.
A total of 17 distinct vitamins were detected in carrots (Figure 9C), including L-Ascorbic acid (Vitamin C) and Dehydroascorbic acid, vitamin B2, B3, and their derivatives, as well as vitamin K2. The majority of vitamins accumulated at the maturation stage (H), with vitamin C maintaining stable levels after peaking at the expanding stage (L). Nicotinate D-ribonucleoside and Biotin exhibited a decline-then-rise pattern. The remaining vitamins gradually decreased during development, though four (e.g., vitamin B2 and K2) showed significant reduction at stage L before stabilizing through maturation.
Additionally, 3 tannins, 2 triterpenes, 1 stilbene, 1 proanthocyanidin, and 15 unclassified metabolites were detected (Figure 9D). All three tannins showed a “decline-then-rise” pattern—being depleted during the expanding stage (L) before re-accumulating at the maturation stage (H). The stilbene 2,4,6,4′-Tetrahydroxy-stilbene-2-O-glucoside exhibited identical dynamics to the tannins. Among the triterpenes, 2α-Hydroxyursolic acid progressively increased throughout development, peaking at harvest, and 3-O-(2-O-Acetyl-glucosyl)oleanolic acid accumulated specifically during the expanding stage (L). Procyanidin B2 showed substantial accumulation at the maturation stage (H).

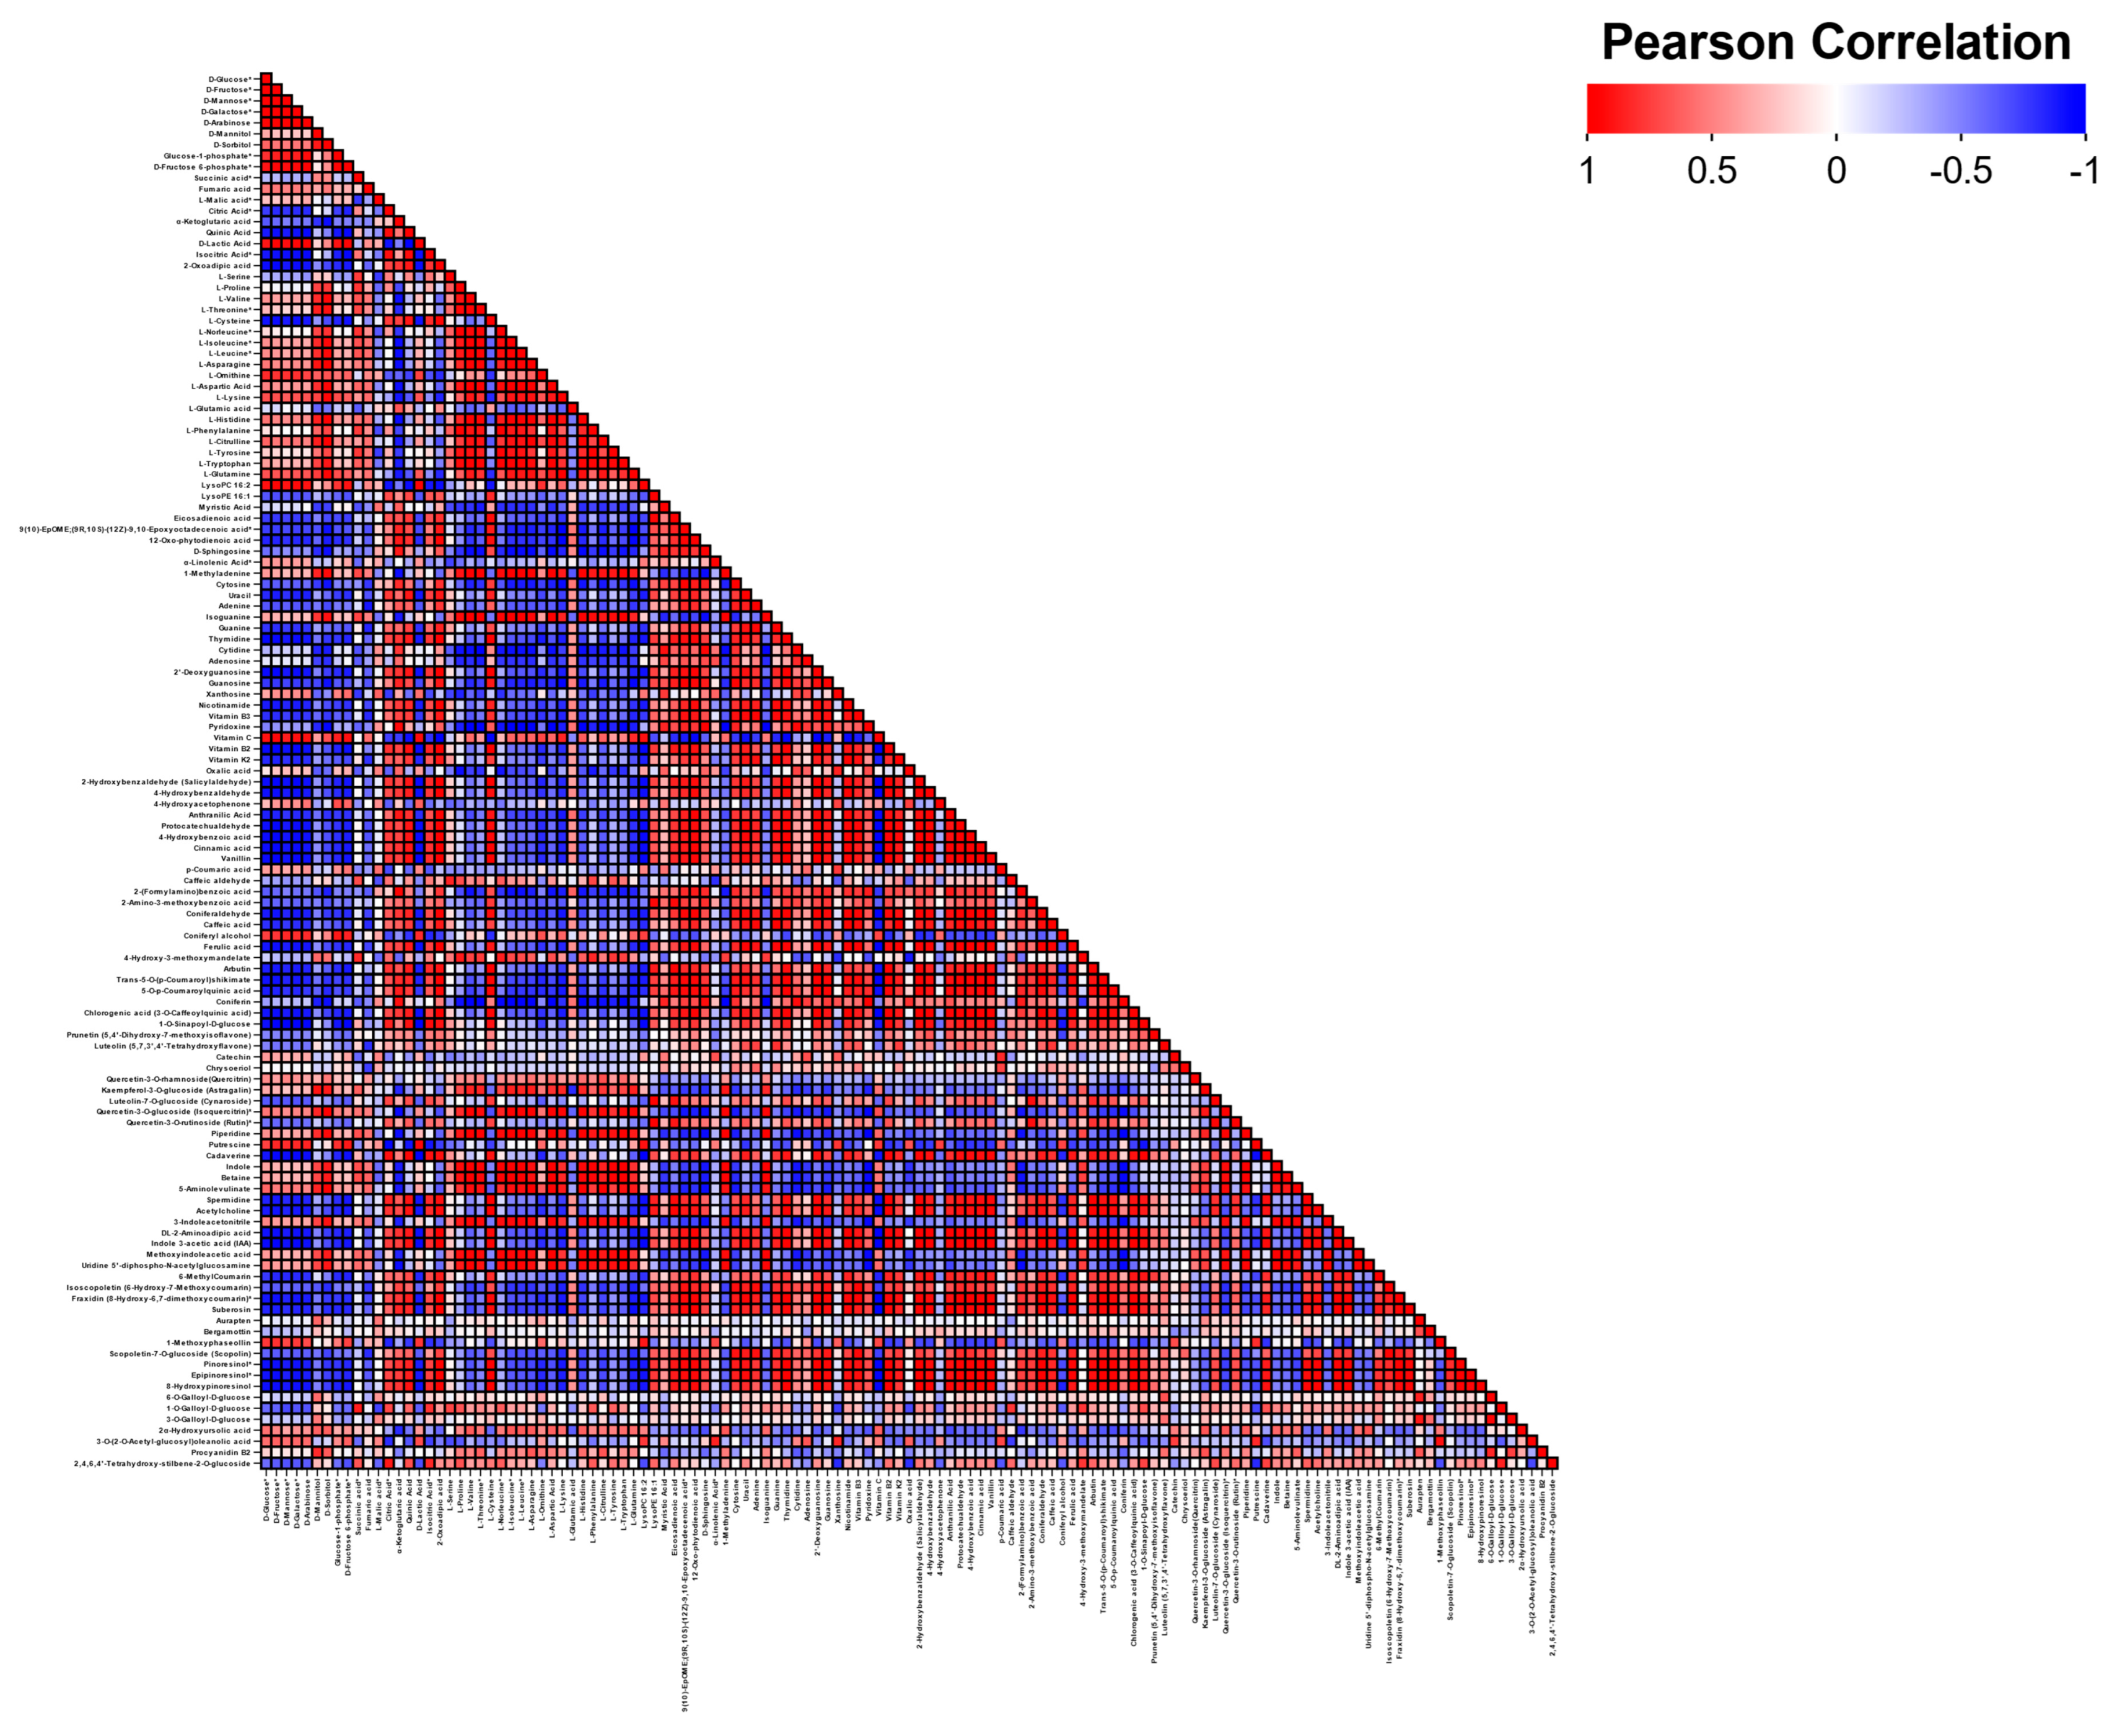
3.5. Metabolite–Metabolite Correlation During Carrot Maturation

To investigate the correlations among metabolites during carrot maturation, Pearson correlation coefficient analysis was performed on 127 representative metabolites, with results visualized as a heatmap (Figure 10). Detailed information on the 127 representative metabolites used for correlation analysis is provided in Supplementary Table S1. Sugars and sugar alcohols (particularly D-Glucose, D-Fructose, D-Galactose, D-Arabinose, and D-Mannose) showed a considerable number of significant negative correlations with numerous primary and secondary metabolites, including the majority of organic acids, lipids, nucleotides and their derivatives, vitamins, phenolic acids, a small subset of flavonoids, as well as a substantial number of alkaloids, lignins, and coumarins. They showed positive correlations with most amino acids and their derivatives, as well as significant positive correlations with a small number of primary and secondary metabolites including D-lactic acid, L-ornithine, lysophosphatidylcholine 16:2, vitamin C, coniferyl alcohol, putrescine, and 1-methoxycoumarin. D-Mannitol and D-Sorbitol exhibited similar correlation patterns with other metabolites, showing significant positive correlations with only a few metabolites while demonstrating significant negative correlations with secondary metabolites. With the exception of D-Mannitol and D-Sorbitol, most sugar and sugar alcohol metabolites showed significant or highly significant positive correlations with each other.
Among organic acids, Citric acid, Isocitric acid, and Quinic acid exhibited highly significant positive correlations with each other. All organic acids showed significant or extremely highly significant positive correlations with numerous primary and secondary metabolites, including lipids, nucleotides, vitamins, phenolic acids, alkaloids, coumarins, and terpenoids, while demonstrating relatively lower correlations with amino acids and their derivatives. 2-Propylsuccinic acid and α-Ketoglutaric acid showed similar correlation patterns with these three acids (citric, isocitric, and quinic acids), but exhibited highly negative correlations with amino acids and their derivatives. Succinic acid, Fumaric acid, and L-Malic acid displayed opposite but non-significant correlation trends compared to these three acids.
Furthermore, among amino acids and their derivatives, all metabolites exhibited significant or highly significant positive correlations with each other, with the exception of L-Cysteine and L-Glutamic acid. Amino acids and their derivatives showed negative correlations with many primary and secondary metabolites, while demonstrating highly positive correlations with 1-Methyladenine, Isoguanine, Astragalin, Isoquercitrin, Piperidine, and six alkaloids. L-cysteine and L-glutamic acid displayed opposite correlation patterns compared to other amino acids.
Various lipids showed significant positive correlations with each other. Specifically, eicosadienoic acid, 9,10-epoxyoctadecenoic acid, 12-oxo-phytodienoic acid, and D-sphingosine exhibited highly significant positive correlations. These lipids were positively correlated with most organic acids, nucleotides, vitamins, phenolic acids, flavonoids, and alkaloids, as well as lignans and coumarins. LysoPE 16:2 and α-linolenic acid showed positive correlations with each other but opposite correlation patterns with other lipids, demonstrating negative correlations with most nucleotides and vitamins, and significant negative correlations with some secondary metabolites. LysoPE 16:1 and myristic acid displayed similar correlation patterns with the aforementioned four lipids. With the exception of 1-methyladenine and Isoguanine, nucleotides and their derivatives exhibited similar correlations with these four lipids. Vitamin C (VC) showed significant positive correlations with sugars and sugar alcohols but negative correlations with most secondary metabolites. In contrast, other vitamins demonstrated similar correlation patterns with lipids as described above.
Phenolic acids exhibited significant positive correlations among themselves, with the exception of oxalic acid, 4-hydroxyacetophenone, p-coumaric acid, caffeic aldehyde, coniferyl alcohol, and 4-hydroxy-3-methoxymandelic acid, and showed correlation patterns similar to the aforementioned four lipids. In contrast, coniferyl alcohol displayed opposite correlation trends with these phenolic acids while demonstrating a significant positive correlation with VC. Oxalic acid and 4-hydroxyacetophenone showed significant positive correlations with each other but exhibited opposite (though non-significant) correlation patterns with other phenolic acids. Flavonoids showed marked correlations with most primary and secondary metabolites. Specifically, astragalin and isoquercitrin exhibited highly positive correlations with six alkaloids and significant positive correlations with sugar alcohols and the majority of amino acids. The coumarin scopolin and three lignins displayed lipid-like correlation patterns. Tannins and terpenoids generally showed no significant correlations with various metabolic products.

3.6. Differentially Accumulated Metabolites Among Different Carrot Maturation

Using screening criteria of VIP > 1 and −1 < log2FC < 1 for differential metabolite analysis, compared with stage S, 77 metabolites were upregulated and 184 were downregulated in stage L. In the L vs. H comparison, 94 metabolites showed upregulation while 114 were downregulated. For S vs. H, 108 metabolites were upregulated and 211 downregulated (Figure 11A). These results demonstrate significant metabolic changes throughout carrot maturation, with distinct accumulation patterns of differential metabolites at different developmental stages. Further analysis identified common differentially expressed metabolites (DEMs) across all three maturation stages (Figure 11B). Venn diagram analysis revealed 72 shared DEMs, including phenolic acids, lipids, nucleotides and derivatives, amino acids and derivatives, sugars and alcohols, and organic acids (with one representative each from vitamins, flavonoids, and alkaloids). Notably, the DEMs from organic acids, phenolic acids, sugar alcohols, and lipids—primarily primary metabolites—are closely associated with carrot flavor and aroma characteristics. To investigate the biological processes involved, the differential metabolites were mapped to KEGG pathways. DEMs between S and L were significantly enriched in amino acid biosynthesis, 2-oxocarboxylic acid metabolism, purine metabolism, and phenylpropanoid biosynthesis pathways (Figure 11C). For L vs. H comparisons, DEMs were predominantly enriched in purine metabolism and aminoacyl-tRNA biosynthesis pathways (Figure 11D).

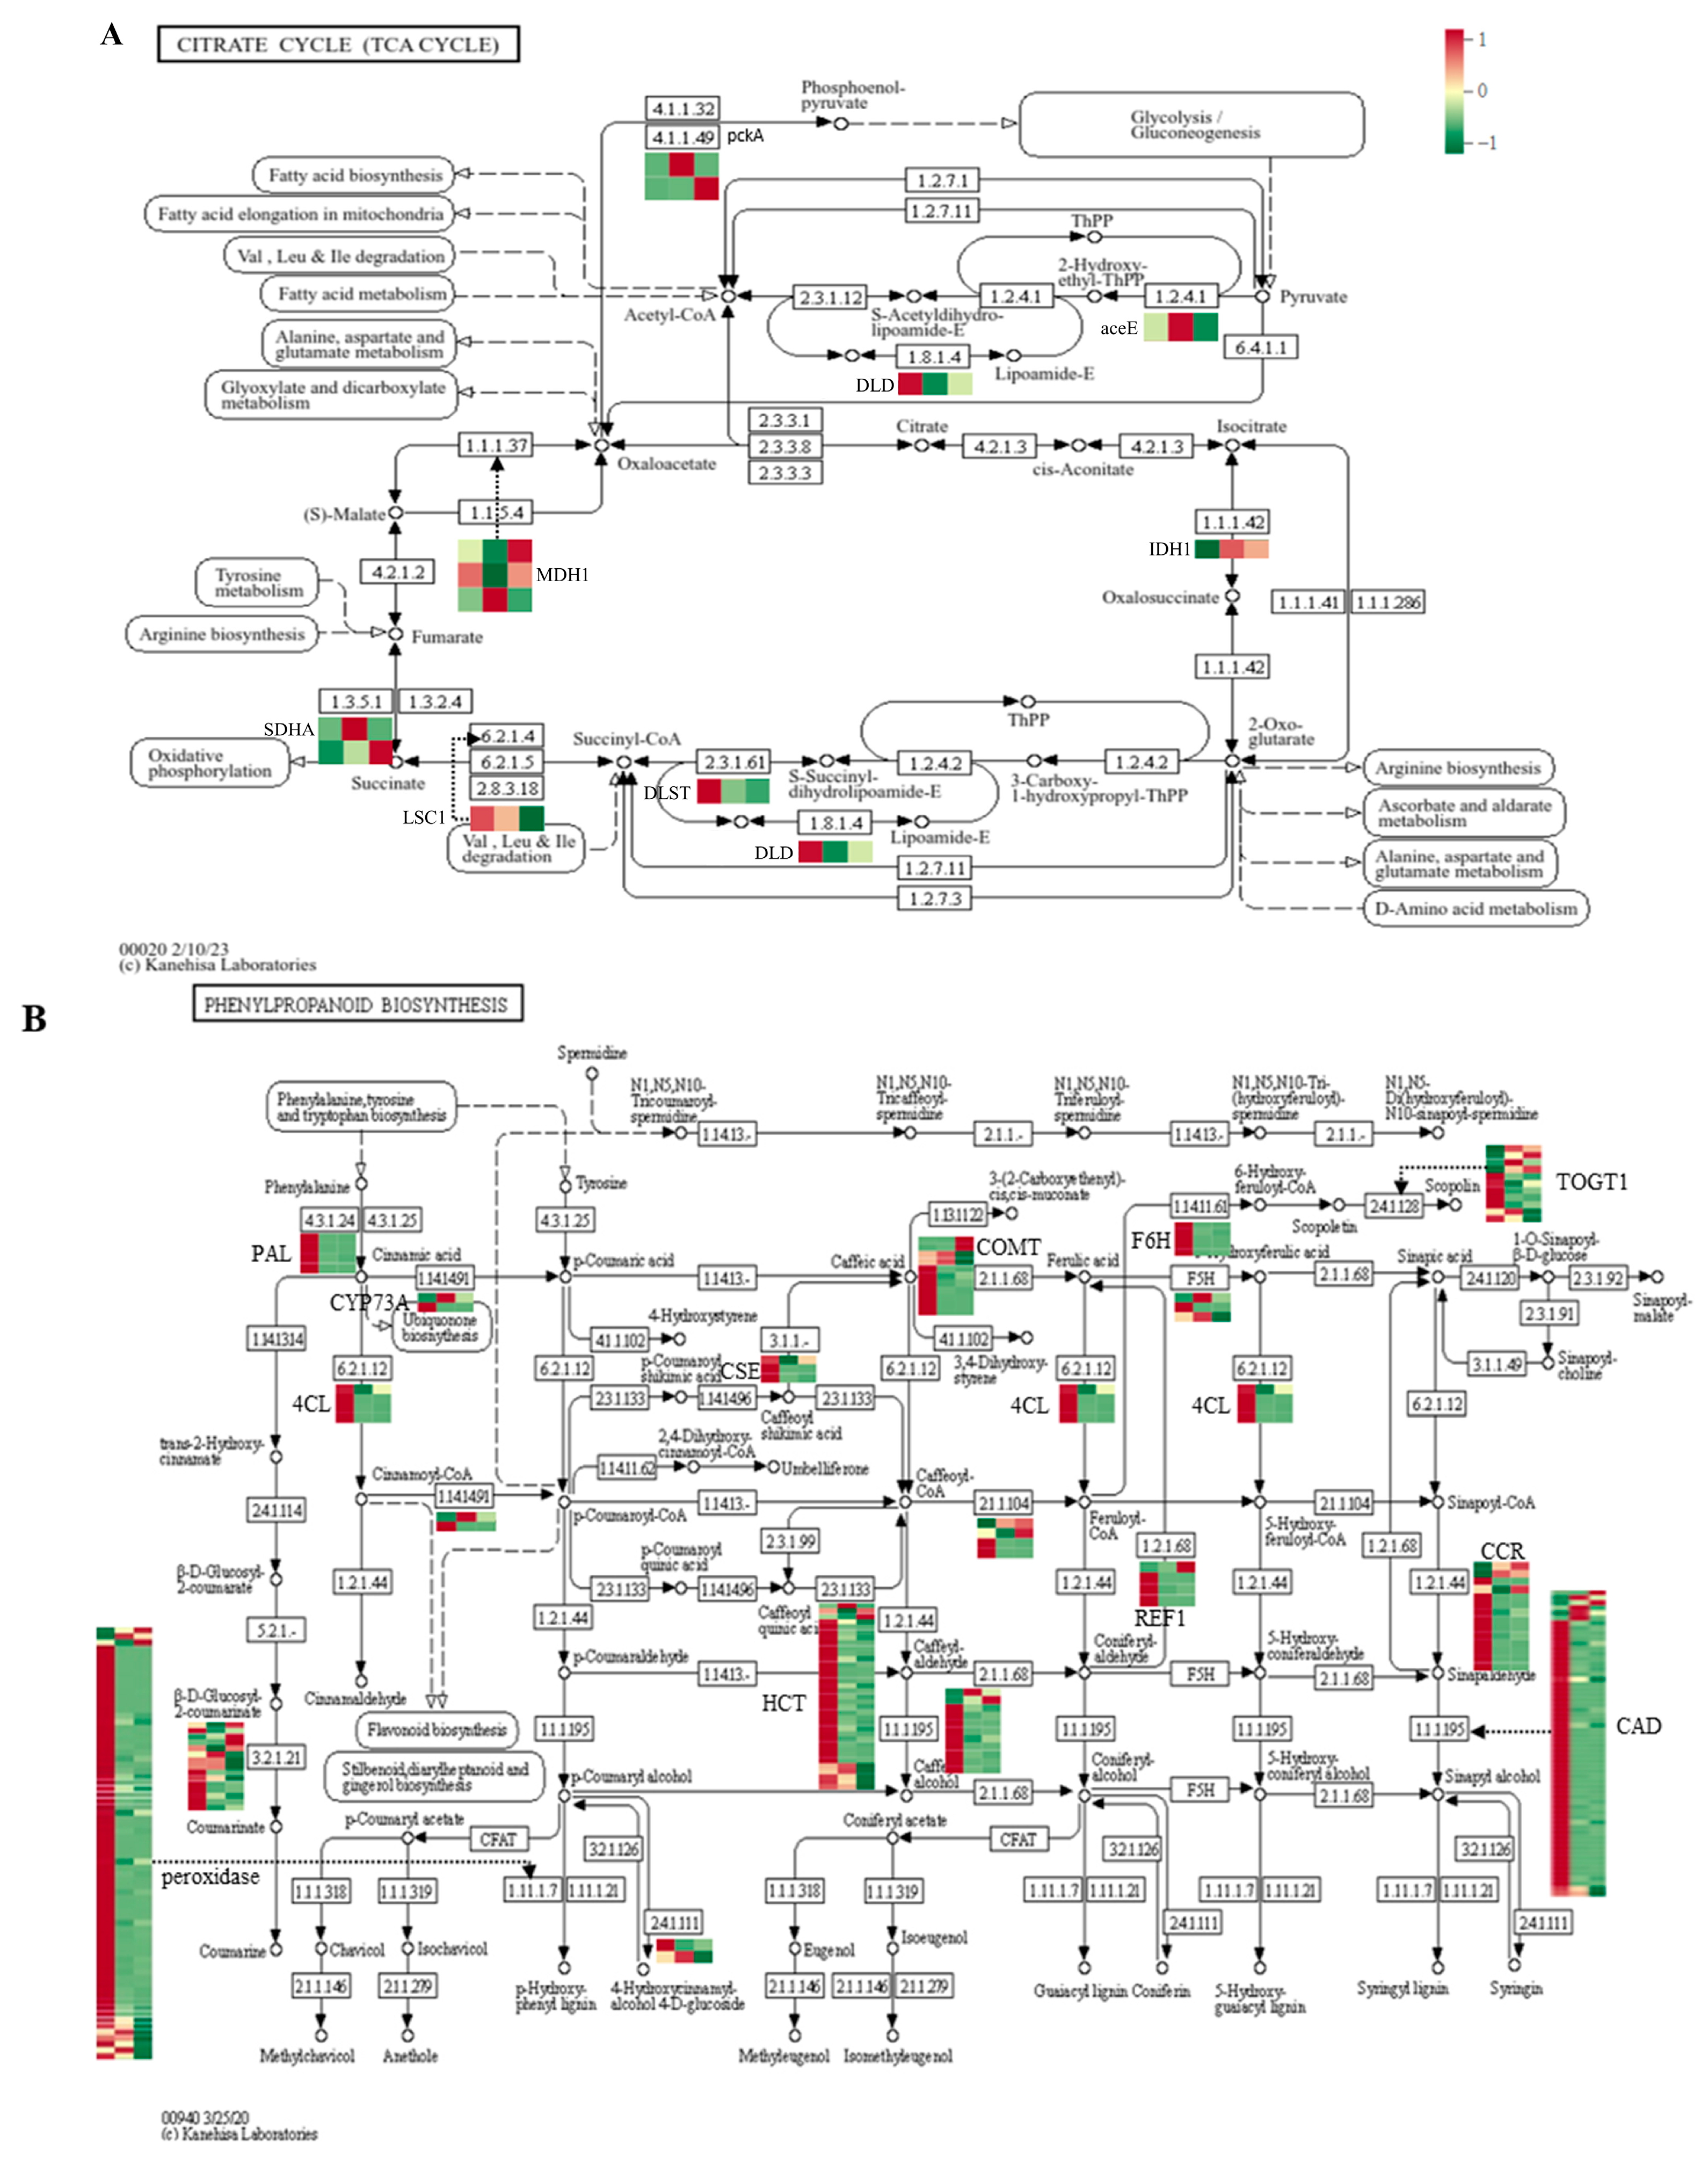
3.7. Expression Patterns of Metabolic Pathway-Related Genes During Carrot Development and Maturation

To further investigate the transcriptional regulation during carrot maturation, transcriptome analysis was conducted across three developmental stages (S/L/H), with three biological replicates per stage. DEGs between maturation stages were systematically mapped to their respective metabolic pathways. The expression patterns of DEGs involved in the TCA cycle metabolic pathway are shown in Figure 12. Compared to stage S, numerous TCA cycle-related genes were upregulated during stages L and H. However, the levels of TCA cycle intermediates (α-ketoglutarate, citrate, isocitrate, and L-malate) decreased during fruit development, indicating that while genes associated with the TCA cycle were activated, the corresponding metabolites were being consumed as substrates for downstream metabolic pathways. The two transcript variants of SDH (succinate dehydrogenase gene) were upregulated during the L and H stages, promoting the conversion of succinate to fumarate, which corresponds to the observed fumarate accumulation during carrot development. Conversely, the two transcript variants of PEPCK (phosphoenolpyruvate carboxykinase) showed stage-specific upregulation during the L and H phases, accelerating the transformation of oxaloacetate into phosphoenolpyruvate and its subsequent flux into the gluconeogenesis pathway.
Numerous genes involved in glycolysis/gluconeogenesis were significantly upregulated during carrot maturation, while a substantial proportion of sugar metabolites exhibited increasing accumulation trends across all three developmental stages. This indicates coordinated activation of glycolytic/gluconeogenic genes coupled with progressive accumulation of their metabolic products (Figure S3). Phosphoenolpyruvate (PEP)—a central metabolic intermediate participating in glycolysis/gluconeogenesis, the TCA cycle, and pyruvate metabolism—exhibited its highest concentration during the early developmental stage (S) of carrots, followed by a progressive decline through maturation. Notably, PEP accumulation showed a negative correlation with the expression of ENO (enolase gene), which increased steadily during carrot root development and reached peak expression levels at harvest maturity (H).
We subsequently investigated the expression patterns of differentially expressed genes (DEGs) in the phenylpropanoid pathway (Figure 12B). During carrot maturation, most DEGs in the phenylpropanoid pathway, including phenylalanine ammonia-lyase(PAL), 4-coumarate--CoA ligase (4CL), caffeoylshikimate esterase (CSE), shikimate O-hydroxycinnamoyltransferase (HCT), cinnamyl-alcohol dehydrogenase (CAD), and PRDX6 genes, showed downregulated expression levels. Cinnamic acid accumulated most abundantly during the early developmental stage (S stage) of carrots and then gradually decreased, with its accumulation pattern positively correlated with PAL gene expression. The downregulation of caffeic acid 3-O-methyltransferase (COMT) gene expression inhibited the biosynthesis pathway of ferulic acid from caffeic acid, resulting in a decrease in ferulic acid during the expanding stage (L stage) followed by stabilization. The downregulation of ACL gene expression during the L stage led to reduced biosynthesis of coniferaldehyde and caffealdehyde. p-Coumaric acid accumulation peaked during the L stage, while the downregulation of the HCT gene resulted in decreased biosynthesis of p-coumaroyl shikimate and p-coumaroyl quinate. In summary, the expression levels of most DEGs during the L stage were significantly lower than during the S stage, and metabolomics data showed that the levels of many phenolic acid metabolites significantly decreased during carrot maturation, likely due to the inhibition of genes in the phenylpropanoid biosynthesis pathway leading to reduced synthesis of corresponding metabolites.

4. Discussion

4.1. Primary Metabolites

Sugars and organic acids are critical components influencing the flavor and texture of storage organs. Previous studies have identified fructose, sucrose, and glucose as the primary soluble sugars contributing to sweet taste perception. However, in the current experiment, sucrose was not detected across all three maturation stages of carrots. Sucrose synthesis and degradation typically involve three key enzymes: sucrose phosphate synthase (SPS), sucrose synthase (SUS), and invertase (INV) [15]. In this study, transcriptomic analysis revealed that the sucrose phosphate synthase (SPS) gene-LOC108218718—a key rate-limiting enzyme in sucrose synthesis—was upregulated, while the sucrose phosphatase (SPP) gene-LOC108206327—a positive regulatory gene—was downregulated, resulting in slowed sucrose synthesis. During early carrot development, genes in the sucrose metabolic pathway were highly expressed. Notably, sucrose synthase (SUS) catalyzes the reversible cleavage of sucrose into UDP-glucose (UDPG) and fructose in the presence of uridine diphosphate (UDP). On the other hand, gene-LOC108209529, which encodes sucrose invertase (INV), was upregulated and irreversibly catalyzes the hydrolysis of sucrose into glucose and fructose. These combined pathways likely contribute to the predominant breakdown and conversion of sucrose, explaining its absence in the detected metabolites. The absence of detectable sucrose levels in our study may also be attributed to sampling location specificity. As demonstrated by Aubert et al. [22] in their spatial distribution analysis of nutrients in two orange carrot cultivars, sucrose predominantly accumulates in the phloem (vascular tissue), and glucose and fructose dominate in the outer cortex/periderm. Notably, sucrose levels decreased progressively from the root apex to the base in one cultivar. In our experiment, metabolomic sampling focused on the middle cortex near the epidermis, which likely explains the sucrose-negative results. Emel Yusuf et al. [23] observed fructose and glucose in all carrot varieties studied, with sucrose being undetected in miniature purple carrots (MiPC) as well, consistent with our findings. This study further revealed that fructose (Fru) and glucose (Glc) exhibited an increasing trend during carrot development, with rapid accumulation from the early stage (S) to the expanding phase (L) (Figure 3). Similarly, many other sugars also accumulated predominantly from stage S to L. These results indicate that sugar-driven sweetness in carrots is primarily established before the expanding phase (L).
Previous studies have shown that carrots primarily accumulate Malic acid, Citric acid, and Isocitric acid [24,25]. In this study, Citric acid and Isocitric acid were significantly enriched at maturity stage H, ranking second and third in relative abundance among organic acid components. The Malic acid content exhibited a significant decreasing trend during stage L (Figure 4). Additionally, the TCA cycle intermediates—Succinic acid, Fumaric acid, and α-Ketoglutaric acid—also showed declining trends during carrot maturation. Meanwhile, Shikimic acid and Quinic acid demonstrated reduced accumulation levels throughout fleshy root development. Furthermore, correlation analysis revealed that α-Ketoglutaric acid and Shikimic acid exhibited significant associations with abundant metabolites, including sugars, nucleotides, various amino acids, and flavonoids, indicating their pivotal roles in metabolic networks (Figure 10). α-Ketoglutaric acid serves as a key intermediate in the TCA cycle and a critical node connecting carbon and nitrogen metabolism. The shikimate pathway bridges carbohydrate metabolism with the biosynthesis of aromatic amino acids and phenylpropanoids. Although most TCA cycle intermediates declined during carrot development, a substantial number of genes associated with the TCA cycle were upregulated (Figure 8). It is hypothesized that the transcriptional activity of the TCA cycle may have been enhanced, while the corresponding metabolites were likely channeled into downstream metabolic fluxes. This phenomenon could be attributed to a faster consumption rate relative to synthesis, ultimately leading to reduced metabolite accumulation. These results demonstrate that organic acid metabolism remains highly active during carrot taproot maturation, but it becomes progressively channeled into the biosynthesis of various primary and secondary metabolites following the formation stage, leading to its gradual depletion.
During carrot maturation, lipids are the most diverse primary metabolites that have been detected. These compounds were extensively catabolized as metabolic intermediates and exhibited significant negative correlations with soluble sugars. Furthermore, in this study, fatty acids, as key metabolic precursors among lipids, were substantially depleted during carrot maturation. These compounds were utilized for synthesizing volatile flavor compounds like monoterpenes and sesquiterpenes through the mevalonate (MVA) pathway, and generating volatile aldehydes (e.g., hexanal and nonanal) via the lipoxygenase (LOX) pathway from linolenic and linoleic acids, thereby contributing to carrot’s distinctive aroma [26,27]. In contrast to lipid depletion, amino acids significantly accumulated during carrot maturation. Essential amino acids (e.g., lysine, threonine, and valine) showed substantial enrichment, contributing to dietary diversity, while bioactive compounds such as methionine, cysteine, arginine, and glutamine accumulated, providing antioxidant functions. The conversion of some amino acids, such as leucine and isoleucine, to volatile aldehydes and ketones may be part of the unique aroma flavor of carrots.
In summary, the dynamic metabolic shifts during carrot maturation, characterized by sugar accumulation, organic acid depletion, lipid conversion, and amino acid enrichment, collectively contribute to the formation of its distinctive flavor profile at harvest maturity.

4.2. Secondary Metabolites

Phenolic compounds, as plant secondary metabolites, are characterized by aromatic rings with one or more hydroxyl groups. These compounds significantly influence the sensory attributes of both plants and plant-derived food products [28,29]. Phenolic compounds constitute the predominant contributors to antioxidant capacity in many plants. Dietary intake of these phytochemicals is associated with beneficial health effects, particularly through their antioxidant activities—including anti-aging and anti-inflammatory properties. Furthermore, they help maintain normal blood glucose and cholesterol levels, as well as support proper neurological function. In this study, most phenolic acids exhibited declining accumulation levels from stage S to L, followed by stabilization until harvest maturity (Figure 8). This pattern was observed in compounds including phlorizin, chlorogenic acid, coumaric acid, caffeic acid, ferulic acid, quercitrin, isoquercitrin, and rutin. Integrated transcriptomic analysis revealed that the majority of genes exhibited downregulation during the color-transition stage and maintained stable expression thereafter, mirroring the observed metabolic shifts in phenylpropanoid compounds. This pattern indicates substantial reprogramming of secondary metabolism during the critical developmental window encompassing both pigmentation initiation (color-transition stage) and taproot expansion phases in carrots. Chlorogenic acid and caffeic acid, as representative constituents of total phenolic compounds, serve as significant dietary antioxidant sources [30]. Chlorogenic acid demonstrates particularly notable bioactivities, including potent antioxidant effects, anti-inflammatory properties, antiviral action, and blood lipid regulation. Their biosynthesis occurs via the shikimate pathway, initiating with an aldol condensation between phosphoenolpyruvate (PEP) and erythrose 4-phosphate. This multi-stage process culminates in the formation of prephenate as the key intermediate [31]. As reported by Zhang et al. [32], hydroxycinnamic acid derivatives dominate the phenolic profile in carrots, with chlorogenic acid accounting for 42.2–61.8% of total phenolics. Consistent with this, Arscott et al. [33] identified monoaromatic phenolic compounds in carrots, predominantly chlorogenic acid. In this study, chlorogenic acid(chlorogenic acid, neochlorogenic acid, cryptochlorogenic acid, and isochlorogenic acids A, B, and C) were the predominant hydroxycinnamic acid derivatives accumulated at stage H. This finding aligns with previous reports on purple and black carrots [6,34]. The results demonstrate that chlorogenic acid serves as a primary accumulated metabolite during taproot maturation in carrot (a model root vegetable), with its biosynthesis being directly regulated by HCT (hydroxycinnamoyl-CoA shikimate/quinate transferase) gene expression. 4-Nitrophenol, a plant cell activator, rapidly penetrates plant tissues and enhances cytoplasmic streaming, significantly accelerating root initiation. Consequently, its accumulation progressively increases during carrot growth and development. Notably, in this study, 4-NP emerged as the most abundant phenolic compound at harvest maturity, exceeding all other phenolic acids in concentration. Studies indicate that carrot cell division and expansion consume substantial phenolic compounds, leading to a rapid decline in phenolic concentrations during early development. The phenolic acid metabolism in carrots is largely completed during the color-transition stage, and the subsequent decline in metabolite levels during the maturation phase can be primarily attributed to cellular expansion in the taproot. Accordingly, this study observed decreased phenolic acid and water-soluble phenolic levels during stage S, followed by stabilization. However, their subsequent accumulation at stage H may correlate with enhanced bitterness in mature carrots.
Furthermore, among the remaining phenolic compounds, flavonoids constituted the predominant phenolic class accumulated during stage H. The results demonstrated that key flavonoids—including nobiletin, isoquercitrin, astragalin, and luteoloside—exhibited downregulation from stage S to L, followed by significant accumulation at maturity. Nobiletin, the predominant flavonoid accumulated during carrot stage H, is a clinically significant polymethoxylated flavone demonstrating potent bioactivities including anti-inflammatory effects, anticancer properties, and metabolic syndrome prevention [35]. Furthermore, a marked decline in most flavonoid contents was observed from stage S through subsequent developmental phases (Figure 8). This observation corresponds to significant downregulation of flavonoid biosynthetic genes—including pivotal enzymes CHS, F3H, and FLS—when comparing stages S and L. Moreover, the dilution effect caused by fleshy root expansion and cell enlargement partially accounts for the rapid decline in flavonoid concentrations during early carrot development.
Carrots are rich in various vitamins, with VC playing a pivotal role in regulating cellular redox potential. As proposed by Troesch et al. [36], VC should be prioritized as a key nutritional enhancement target in horticultural crops. In this study, VC content in orange-red carrots showed significant accumulation at stage H, ranking second only to D-pantothenic acid in concentration. Studies indicate that VC content varies significantly among carrot cultivars, with deep-orange carrots containing 4-fold higher VC levels than yellow, purple, or standard orange varieties [37]. This suggests cultivar selection may explain the pronounced VC accumulation in orange-red carrots at stage H. Additionally, vitamin B2 (riboflavin), B3 (niacin), and K2 (menaquinone) also exhibited marked accumulation at harvest, collectively enhancing the nutritional value of orange-red carrots.

5. Conclusions

In summary, flavor, color, and nutritional composition constitute critical quality determinants in carrots. Significant variations in primary metabolite profiles were observed across the developmental stages—initial growth, color transition, and maturation—which likely serve as the biochemical basis for stage-specific quality attributes. Therefore, the composition and content of various metabolites during carrot development lead to significant changes in quality traits. Further correlation analysis emphasized the density of metabolic connections, revealing associations between primary and secondary metabolism. In addition, integrated metabolomic and transcriptomic analysis demonstrated significant correlations among sugars, organic acids, phenolic metabolites, and related genes. This study provides a comprehensive understanding of the metabolic changes during carrot development and maturation, offering new insights into the molecular and metabolic basis of carrot growth and quality formation. The findings reveal the critical timing and mechanisms underlying carrot quality establishment, particularly highlighting the importance of the expansion stage, and identify potential gene targets for genome editing based on developmental stage-specific expression patterns. These results have practical implications for optimizing water and fertilizer management in carrot cultivation. The study establishes a valuable framework for both basic research and agricultural applications in root crop improvement. While the research methodology is applicable to other root vegetables, further investigation is needed to elucidate the molecular metabolic mechanisms of intermediate developmental processes.

Supplementary Materials

The following supporting information can be downloaded at: https://www.mdpi.com/article/10.3390/horticulturae11050542/s1. Figure S1: Total ion chromatogram (TIC) of mass spectrometry analysis for pooled samples. Figure S2: Multiple reaction monitoring (MRM) chromatograms of detected metabolites. Figure S3: Expression patterns of glycolysis/gluconeogenesis pathway-related genes during carrot maturation. Table S1: Detailed information of 127 representative metabolites used for correlation analysis.

Author Contributions

C.G.: Investigation, Project administration, Visualization, Writing and original draft & editing. H.Z.: Methodology, Project administration, Data curation. J.W.: Formal analysis. Z.G.: Formal analysis. R.S.: Formal analysis. W.Z.: Formal analysis. T.S.: Formal analysis. H.S.: Conceptualization, Resources, review, Supervision, Review—Editing, Funding acquisition. All authors have read and agreed to the published version of the manuscript.

Funding

This work was supported by the Applied Basic Research Project of Shanxi Province (Grant No. 202403021221091); Shanxi Province key research and development plan key project (Grant No. 202302010101003); Shanxi Province modern agricultural industrial technology system construction special fund project (Grant No. 2025CYJSTX08).

Data Availability Statement

The data that support the findings of this study are available from the corresponding author upon reasonable request.

Conflicts of Interest

The authors declare no conflicts of interest.

References

  1. Que, F.; Hou, X.-L.; Wang, G.-L.; Xu, Z.-S.; Tan, G.-F.; Li, T.; Wang, Y.-H.; Khadr, A.; Xiong, A.-S. Advances in research on the carrot, an important root vegetable in the Apiaceae family. Hortic. Res. 2019, 6, 69. [Google Scholar] [CrossRef] [PubMed]
  2. Sharma, K.D.; Karki, S.; Thakur, N.S.; Attri, S. Chemical composition, functional properties and processing of carrot—A review. J. Food Sci. Technol. 2011, 49, 22–32. [Google Scholar] [CrossRef]
  3. Riaz, N.; Yousaf, Z.; Yasmin, Z.; Munawar, M.; Younas, A.; Rashid, M.; Aftab, A.; Shamsheer, B.; Yasin, H.; Najeebullah, M.; et al. Development of Carrot Nutraceutical Products as an Alternative Supplement for the Prevention of Nutritional Diseases. Front. Nutr. 2022, 8, 787351. [Google Scholar] [CrossRef]
  4. Haq, R.-U.; Prasad, K. Nutritional and processing aspects of carrot (Daucus carota)—A review. South Asian J. Food Technol. Environ. 2015, 1, 1–14. [Google Scholar] [CrossRef]
  5. Nothnagel, T.; Ulrich, D.; Dunemann, F.; Budahn, H. Sensory Perception and Consumer Acceptance of Carrot Cultivars Are Influenced by Their Metabolic Profiles for Volatile and Non-Volatile Organic Compounds. Foods 2023, 12, 4389. [Google Scholar] [CrossRef]
  6. Akhtar, S.; Rauf, A.; Imran, M.; Qamar, M.; Riaz, M.; Mubarak, M.S. Black carrot (Daucus carota L.), dietary and health promoting perspectives of its polyphenols: A review. Trends Food Sci. Technol. 2017, 66, 36–47. [Google Scholar] [CrossRef]
  7. Schmid, C.; Sharma, S.; Stark, T.D.; Günzkofer, D.; Hofmann, T.F.; Ulrich, D.; Dunemann, F.; Nothnagel, T.; Dawid, C. Influence of the Abiotic Stress Conditions, Waterlogging and Drought, on the Bitter Sensometabolome as Well as Agronomical Traits of Six Genotypes of Daucus carota. Foods 2021, 10, 1607. [Google Scholar] [CrossRef] [PubMed]
  8. Muchlinski, A.; Ibdah, M.; Ellison, S.; Yahyaa, M.; Nawade, B.; Laliberte, S.; Senalik, D.; Simon, P.; Whitehead, S.R.; Tholl, D. Diversity and function of terpene synthases in the production of carrot aroma and flavor compounds. Sci. Rep. 2020, 10, 9989. [Google Scholar] [CrossRef]
  9. Prasad, K.; Haq, R.-U.; Bansal, V.; Siddiqui, M.W.; Ilahy, R. Carrot: Secondary metabolites and their prospective health benefits. In Plant Secondary Metabolites; Apple Academic Press: Palm Bay, FL, USA, 2017; Volume 2, pp. 133–220. [Google Scholar]
  10. Slika, H.; Mansour, H.; Wehbe, N.; Nasser, S.A.; Iratni, R.; Nasrallah, G.; Shaito, A.; Ghaddar, T.; Kobeissy, F.; Eid, A.H. Therapeutic potential of flavonoids in cancer: ROS-mediated mechanisms. Biomed. Pharmacother. 2022, 146, 112442. [Google Scholar] [CrossRef]
  11. Carr, A.; Maggini, S. Vitamin C and Immune Function. Nutrients 2017, 9, 1211. [Google Scholar] [CrossRef]
  12. Velu, G.; Palanichamy, V.; Rajan, A.P. Phytochemical and Pharmacological Importance of Plant Secondary Metabolites in Modern Medicine. In Bioorganic Phase in Natural Food: An Overview; Springer: Cham, Switzerland, 2018; pp. 135–156. [Google Scholar]
  13. Clausen, M.R.; Edelenbos, M.; Bertram, H.C. Mapping the Variation of the Carrot Metabolome Using 1H NMR Spectroscopy and Consensus PCA. J. Agric. Food Chem. 2014, 62, 4392–4398. [Google Scholar] [CrossRef] [PubMed]
  14. Chevalier, W.; Moussa, S.-A.; Ottoni, M.M.N.; Dubois-Laurent, C.; Huet, S.; Aubert, C.; Desnoues, E.; Navez, B.; Cottet, V.; Chalot, G.; et al. Evaluation of pedoclimatic factors and cultural practices effects on carotenoid and sugar content in carrot root. Eur. J. Agron. 2022, 140, 126577. [Google Scholar] [CrossRef]
  15. Liu, Y.-J.; Wang, G.-L.; Ma, J.; Xu, Z.-S.; Wang, F.; Xiong, A.-S. Transcript profiling of sucrose synthase genes involved in sucrose metabolism among four carrot (Daucus carota L.) cultivars reveals distinct patterns. BMC Plant Biol. 2018, 18, 8. [Google Scholar] [CrossRef]
  16. Machaj, G.; Bostan, H.; Macko-Podgórni, A.; Iorizzo, M.; Grzebelus, D. Comparative Transcriptomics of Root Development in Wild and Cultivated Carrots. Genes 2018, 9, 431. [Google Scholar] [CrossRef] [PubMed]
  17. Wang, G.; Xu, Y.; Wu, J.; Chen, Y.; An, Y.; Hu, Z.; Xiong, A. Integrated metabolome analysis and transcript profiles revealed a potential role of SWEETs in sugar accumulation during Carrot taproot development. BMC Plant Biol. 2025, 25, 470. [Google Scholar] [CrossRef]
  18. Ibdah, M.; Muchlinski, A.; Yahyaa, M.; Nawade, B.; Tholl, D. Carrot Volatile Terpene Metabolism: Terpene Diversity and Biosynthetic Genes. In The Carrot Genome; Compendium of Plant Genomes; Springer: Cham, Switzerland, 2019; pp. 279–293. [Google Scholar]
  19. Xu, J.; Yan, J.; Li, W.; Wang, Q.; Wang, C.; Guo, J.; Geng, D.; Guan, Q.; Ma, F. Integrative Analyses of Widely Targeted Metabolic Profiling and Transcriptome Data Reveals Molecular Insight into Metabolomic Variations during Apple (Malus domestica) Fruit Development and Ripening. Int. J. Mol. Sci. 2020, 21, 4797. [Google Scholar] [CrossRef]
  20. Wang, Y.; Hao, R.; Guo, R.; Nong, H.; Qin, Y.; Dong, N. Integrative analysis of metabolome and transcriptome reveals molecular insight into metabolomic variations during hawthorn fruit development. Metabolites 2023, 13, 423. [Google Scholar] [CrossRef]
  21. Song, H.; Lu, Q.; Song, T.; Gao, C.; Zhu, W.; Guo, X. Study on the Mechanism of Carotenoid Production and Accumulation in Orange Red Carrot (Daucus carota L.). Sci. Hortic. 2024, 327, 112825. [Google Scholar] [CrossRef]
  22. Aubert, C.; Bruaut, M.; Chalot, G. Spatial distribution of sugars, organic acids, vitamin C, carotenoids, tocopherols, 6-methoxymellein, polyacetylenic compounds, polyphenols and terpenes in two orange Nantes type carrots (Daucus carota L.). J. Food Compos. Anal. 2022, 108, 104421. [Google Scholar] [CrossRef]
  23. Yusuf, E.; Tkacz, K.; Turkiewicz, I.P.; Wojdyło, A.; Nowicka, P. Analysis of chemical compounds’ content in different varieties of carrots, including qualification and quantification of sugars, organic acids, minerals, and bioactive compounds by UPLC. Eur. Food Res. Technol. 2021, 247, 3053–3062. [Google Scholar] [CrossRef]
  24. Schaller, R.G.; Schnitzler, W.H. Nitrogen nutrition and flavour compounds of carrots (Daucus carota L.) cultivated in Mitscherlich pots. J. Sci. Food Agric. 2000, 80, 49–56. [Google Scholar] [CrossRef]
  25. Bonasia, A.; Conversa, G.; Lazzizera, C.; Gambacorta, G.; Elia, A. Morpho-Biometrical, Nutritional and Phytochemical Characterization of Carrot Landraces from Puglia Region (Southern Italy). Sustainability 2021, 13, 3940. [Google Scholar] [CrossRef]
  26. Li-Beisson, Y.; Shorrosh, B.; Beisson, F.; Andersson, M.X.; Arondel, V.; Bates, P.D.; Baud, S.; Bird, D.; DeBono, A.; Durrett, T.P.; et al. Acyl-Lipid Metabolism. Arab. Book 2013, 11, e0161. [Google Scholar] [CrossRef]
  27. Kebede, B.T.; Grauwet, T.; Palmers, S.; Vervoort, L.; Carle, R.; Hendrickx, M.; Van Loey, A.J.F.C. Effect of high pressure high temperature processing on the volatile fraction of differently coloured carrots. Food Chem. 2014, 153, 340–352. [Google Scholar] [CrossRef]
  28. Brglez Mojzer, E.; Knez Hrnčič, M.; Škerget, M.; Knez, Ž.; Bren, U. Polyphenols: Extraction Methods, Antioxidative Action, Bioavailability and Anticarcinogenic Effects. Molecules 2016, 21, 901. [Google Scholar] [CrossRef]
  29. Di Mauro, M.D.; Giardina, R.C.; Fava, G.; Mirabella, E.F.; Acquaviva, R.; Renis, M.; D’Antona, N. Polyphenolic profile and antioxidant activity of olive mill wastewater from two Sicilian olive cultivars: Cerasuola and Nocellara etnea. Eur. Food Res. Technol. 2017, 243, 1895–1903. [Google Scholar] [CrossRef]
  30. Sun, T.; Simon, P.W.; Tanumihardjo, S.A. Antioxidant Phytochemicals and Antioxidant Capacity of Biofortified Carrots (Daucus carota L.) of Various Colors. J. Agric. Food Chem. 2009, 57, 4142–4147. [Google Scholar] [CrossRef]
  31. Bartley, G.E.; Avena-Bustillos, R.J.; Du, W.-X.; Hidalgo, M.; Cain, B.; Breksa, A.P., III. Transcriptional regulation of chlorogenic acid biosynthesis in carrot root slices exposed to UV-B light. Plant Gene 2016, 7, 1–10. [Google Scholar] [CrossRef]
  32. Zhang, D.; Hamauzu, Y. Phenolic compounds and their antioxidant properties in different tissues of carrots (Daucus carota L.). J. Food Agric. Environ. 2004, 2, 95–100. [Google Scholar] [CrossRef]
  33. Arscott, S.A.; Tanumihardjo, S.A. Carrots of many colors provide basic nutrition and bioavailable phytochemicals acting as a functional food. Compr. Rev. Food Sci. Food Saf. 2010, 9, 223–239. [Google Scholar] [CrossRef]
  34. Czepa, A.; Hofmann, T. Quantitative studies and sensory analyses on the influence of cultivar, spatial tissue distribution, and industrial processing on the bitter off-taste of carrots (Daucus carota L.) and carrot products. J. Agric. Food Chem. 2004, 52, 4508–4514. [Google Scholar] [CrossRef] [PubMed]
  35. Li, S.; Wang, H.; Guo, L.; Zhao, H.; Ho, C.-T. Chemistry and bioactivity of nobiletin and its metabolites. J. Funct. Foods 2014, 6, 2–10. [Google Scholar] [CrossRef]
  36. Troesch, B.; Hoeft, B.; McBurney, M.; Eggersdorfer, M.; Weber, P. Dietary surveys indicate vitamin intakes below recommendations are common in representative Western countries. Br. J. Nutr. 2012, 108, 692–698. [Google Scholar] [CrossRef] [PubMed]
  37. Szymczak, P.; Gajewski, M.; Radzanowska, J.; Dabrowska, A. Sensory quality and consumer liking of carrot cultivars of different genotype. Veg. Crops Res. Bull. 2007, 67, 163. [Google Scholar] [CrossRef]
Figure 1. Three important periods of orange-red carrot (A); Carrot taproot length (B); and carrot taproot weight (C). Different lowercase letters indicate statistically significant differences at the 0.05 level (p < 0.05).
Horticulturae 11 00542 g001
Figure 2. Classification and proportion of 607 metabolites detected in orange-red carrots (A); Principal component analysis (PCA) of orange-red carrot samples (B); Correlation analysis between samples (C).
Horticulturae 11 00542 g002
Figure 3. Sugar (A), sugar alcohol, and phosphate (B) metabolites detected by widely targeted UPLC-MS across three fleshy root developmental stages. Note: Using stage S as the calibration factor, the heatmap displays fold changes of each metabolite across these three stages. Significance analysis was performed using IBM SPSS Statistics 26 software with Tukey’s test at p < 0.05, indicated by lowercase letters (a, b, and c) in the figure. Different letters denote statistically significant differences between samples. The same convention applies to subsequent figures. Note: * indicates that the metabolite shows a statistically significant difference.
Horticulturae 11 00542 g003
Figure 4. Organic acid metabolites detected by UPLC-MS across three fleshy root developmental stages: (A) Heatmap of 12 representative organic acids; (B) Organic acids and quinate derivatives. Different letters denote statistically significant differences between samples. Note: * indicates that the metabolite shows a statistically significant difference.
Horticulturae 11 00542 g004
Figure 5. Amino acid (A) and amino acid derivative (B) metabolites detected by widely targeted UPLC-MS across three fleshy root developmental stages. Different letters denote statistically significant differences between samples. Note: * indicates that the metabolite shows a statistically significant difference.
Horticulturae 11 00542 g005
Figure 6. Lipids (A) and nucleotides/nucleotide derivatives (B) detected by widely targeted UPLC-MS across three fleshy root developmental stages. Note: * indicates that the metabolite shows a statistically significant difference.
Horticulturae 11 00542 g006
Figure 7. Representative phenolic acid metabolites (A) and other phenolic acid metabolites (B) detected by UPLC-MS across three fleshy root developmental stages. Different letters denote statistically significant differences between samples. Note: * indicates that the metabolite shows a statistically significant difference.
Horticulturae 11 00542 g007
Figure 8. Flavonoid metabolites detected by UPLC-MS across three fleshy root developmental stages. Different letters denote statistically significant differences between samples. Note: * indicates that the metabolite shows a statistically significant difference.
Horticulturae 11 00542 g008
Figure 9. Metabolites detected by UPLC-MS across three fleshy root developmental stages: (A) lignans and coumarins, (B) alkaloids, (C) vitamins, and (D) other metabolites. Note: * indicates that the metabolite shows a statistically significant difference.
Horticulturae 11 00542 g009
Figure 10. A heat map of metabolite–metabolite correlations along with the carrot maturation: 127 representative metabolites were selected from the total 607 metabolites to analyze their correlations. Pearson algorithm was applied to assess metabolite–metabolite correlation coefficients using Origin 2024R software. Each square of the heat map indicates a correlation coefficient score resulting from Pearson analysis, which represents the correlation between the metabolite heading the row and the metabolite heading the column. The 127 representative metabolites for the correlation analysis are listed in Table S1. Note: * indicates that the metabolite shows a statistically significant difference.
Horticulturae 11 00542 g010
Figure 11. Statistics of differentially accumulated metabolites (DEMs) during carrot maturation across different stages (S/L/H) (A) and Venn diagram of shared DEMs among these comparisons (B). Top 20 KEGG pathway enrichment analysis of DEMs is shown for S vs. L (C) and L vs. H (D).
Horticulturae 11 00542 g011
Figure 12. Metabolic and transcriptional regulation during carrot development and maturation: (A) Genes associated with the TCA cycle pathway; (B) Genes associated with the phenylpropanoid biosynthesis pathway. The heatmaps illustrate the expression patterns of DEGs involved in these respective pathways. In each heatmap, rows represent individual transcripts, while the three columns from left to right correspond to the three developmental stages (S, L, H).
Horticulturae 11 00542 g012
Disclaimer/Publisher’s Note: The statements, opinions and data contained in all publications are solely those of the individual author(s) and contributor(s) and not of MDPI and/or the editor(s). MDPI and/or the editor(s) disclaim responsibility for any injury to people or property resulting from any ideas, methods, instructions or products referred to in the content.

