Article

Effects of Different LED Light Quality Combinations on Nutritional Quality and Physiological Characteristics of Celery

by
Kaiyue Liu
,
Li Tang
,
Qianwen Chu
,
Yingyi Lu
,
Lihong Su
,
Shaobo Cheng
,
Zhongqun He
* and
Xiaoting Zhou
College of Horticulture, Sichuan Agricultural University, Chengdu 611130, China
*
Author to whom correspondence should be addressed.
These authors contributed equally to this work and share the first authorship.
Horticulturae 2025, 11(5), 524; https://doi.org/10.3390/horticulturae11050524
Submission received: 17 April 2025 / Revised: 6 May 2025 / Accepted: 8 May 2025 / Published: 13 May 2025
(This article belongs to the Section Protected Culture)

Abstract

:
Light is essential for vegetable growth, with varying combinations of light quality affect differently on plant growth and development. In order to clarify the optimal light quality combination of celery LEDs, under hydroponic and full LED light conditions, this study investigated distinct combinations of light quality have various impacts on the growth and quality of celery using “Hongcheng Red Celery” as test material. Red-blue (R:B = 3:1, control), red-blue-purple (R:B:P = 3:1:1, purple (P)), red-blue-green (R:B:G = 3:1:1, green (G)), red-blue-yellow (R:B:Y = 3:1:1, yellow (Y)), and red-blue-far-red (R:B:FR = 3:1:1, far-red (FR)) light conditions were set up in the experiment, and plants were treated for 45 days. The findings indicated that the best growth in celery was achieved under the RBP, while RBG inhibited the growth of celery. The chlorophyll a and total chlorophyll contents of celery leaves were increased significantly by the RBP treatments compared to RB. In addition, net photosynthetic rate, stomatal conductance, and transpiration rate were highest in RBP. In RBP treatment, soluble protein, vitamin C, total phenols, total flavonoids, Ca, Fe, Zn in leaves and petioles of celery were higher than in other treatments. And the anthocyanins content in celery petioles was higher than other treatments. The RBP and RBG treatments reduced nitrate content. The RBP treatment increased the activities of apigenin synthesis-related enzymes CHS, FNS, ANS, and up-regulated expression of related genes CHS, FNS, and ANS, and increased apigenin content. In summary, the RBP is more favorable for celery growth and nutrient synthesis.

1. Introduction

Celery (Apium graveolens L.) is a vegetable belonging to Apiaceae family [1]. It is widely cultivated for its low calorie, abundant celluloses, vitamin, and carotene content [2]. Celery is rich in nutrients, in particular, apigenin has antioxidant properties [3]. Celery likewise can prevent diseases such as including those which are hypolipidemic, hypoglycemic [3], antihypertensive [4], anti-inflammatory, and anti-cancerous [5]. In addition, research has found that celery may be a useful functional food that helps with the regeneration of bone defects [6].
Light is an important environmental factor for plant growth. In order to promote the growth of vegetables, we need to choose the right artificial light [7]. During the growing process, light emitting diodes (LEDs) can be used to control these parameters to optimize yield and quality [8]. LEDs have higher luminous efficacy and lower power consumption compared to traditional fluorescent lamps [9], have the advantages of monochromatic light [10], small size [11], low heat dissipation, and long lifespan [12], ideal for growing a variety of vegetables [13], to provide the optimal light conditions for plant growth [14]. LED light sources are also used in plant factories. Plant factories are highly intelligent and specialized kinds of facility agriculture, which can effectively improve the utilization of light energy as well as conserve water, and due to the fact that they are virtually unaffected by changes in the external environment, they can achieve an annual supply of crops, which improves the economic efficiency [15]. The photosynthesis process is the basis of plant growth, which requires the energy of light [16], chlorophyll and carotenoids are important photosynthetic pigments [17]. Chlorophylls a and b absorb mainly blue light at 350–480 nm and red light at 580–680 nm [18,19]. Carotenoids, including lutein and carotene [20,21], are the main receptors for blue light, and they are main components of the light-trapping complexes [22,23]. In addition, R, B, and FR can be used as light signals [10]. Red light promotes stalk elongation in lettuce [24], blue light can inhibit growth in wheat [25], while supplemental FR light could increase biomass [24]. Green light promotes photomorphogenesis [26]. Purple light was most effective in reducing yellowing and retaining chlorophyll by down-regulating the expression of chlorophyll degradation-related genes, yellow, blue, and purple light increased the total phenolic and carotenoid content [27]. This means that light quality is important for plant growth [18].
Light is an indispensable source of energy during plant growth and influences plant development and morphogenesis, which can promote vegetable growth and enhance quality. The morphogenesis of plants and material accumulation are related to light quality [28,29]. Various plants grown under a combination of red and blue light showed better growth advantages compared to monochromatic light including red and blue light [30]. The optimal ratio of B and R light enhances photosynthesis and promotes the growth and development of lettuce and cucumber plants [31,32]. Different combinations of light quality affect plant growth and development. Supplementing green light to a combination of red and blue light, can improve the growth of lettuce, and the leaf area of lettuce was the largest [33,34,35]. Blue-green light treatment increased flavonoids and carotenoids [36]. Soluble sugars in lettuce can be increased by reducing the proportion of yellow light and adding the right amount of purple light during plant cultivation [37]. Therefore, choosing the right combination of light will better promote quality formation in vegetables.
Flavonoids belong to plant secondary metabolites. Flavonoids such as anthocyanins and apigenin have antimicrobial and antioxidant effects, and these secondary metabolites also have medicinal value and biological significance [38]. Light is a key environmental factor influencing flavonoid synthesis for plants. Different light qualities can indirectly regulate the expression of flavonoid-regulated genes, thereby controlling flavonoid accumulation by regulating photosensitive pigments and cryptochromes [39]. High-red/far-red light is beneficial for flavonoids [14]. Different ratios of light quality favor spinach flavonoid synthesis [40]. Flavonoid biosynthesis requires the synthesis of related enzymes and the expression of related genes, it was found that with increasing blue light, the expression of PAL and CHS genes was up-regulated in the flavonoid metabolism pathway of lettuce [41]. The content of kaempferol, isoquercitrin, and quercetin in the leaves of Cyclocarya paliurus was highest under blue light irradiation, and correlation analysis showed that the flavonoid content of the leaves of Cyclocarya paliurus was significantly and positively correlated with the expression of genes related to the upstream key enzymes (phenylalanine ammonia-lyase, PAL, 4-coumaroyl-coenzyme A ligase, 4CL, and chalcone synthase, CHS) [42].
In summary, different combinations of light have varying effects on plants, but there is limited research on the synthesis of flavonoids and other substances in celery, and the relevance between quality related physiological indicators and light quality. Therefore, in this study, we explore the effects of LED light source on the physiological characteristics and nutritional quality of celery by treating celery with different combinations of light quality, analyzed the effects of different combinations of light quality on the morphological indexes, photosynthetic indexes, and nutritional quality of celery, and obtained the LED combined light source suitable for the growth of celery in plant factories.

2. Materials and Methods

2.1. Experimental Materials

The test material is the high-quality celery variety ‘Hongcheng Red Celery’ screened out by the group in the previous period, and the seeds used in the test came from Tianjin Hongcheng Celery Research Institute.

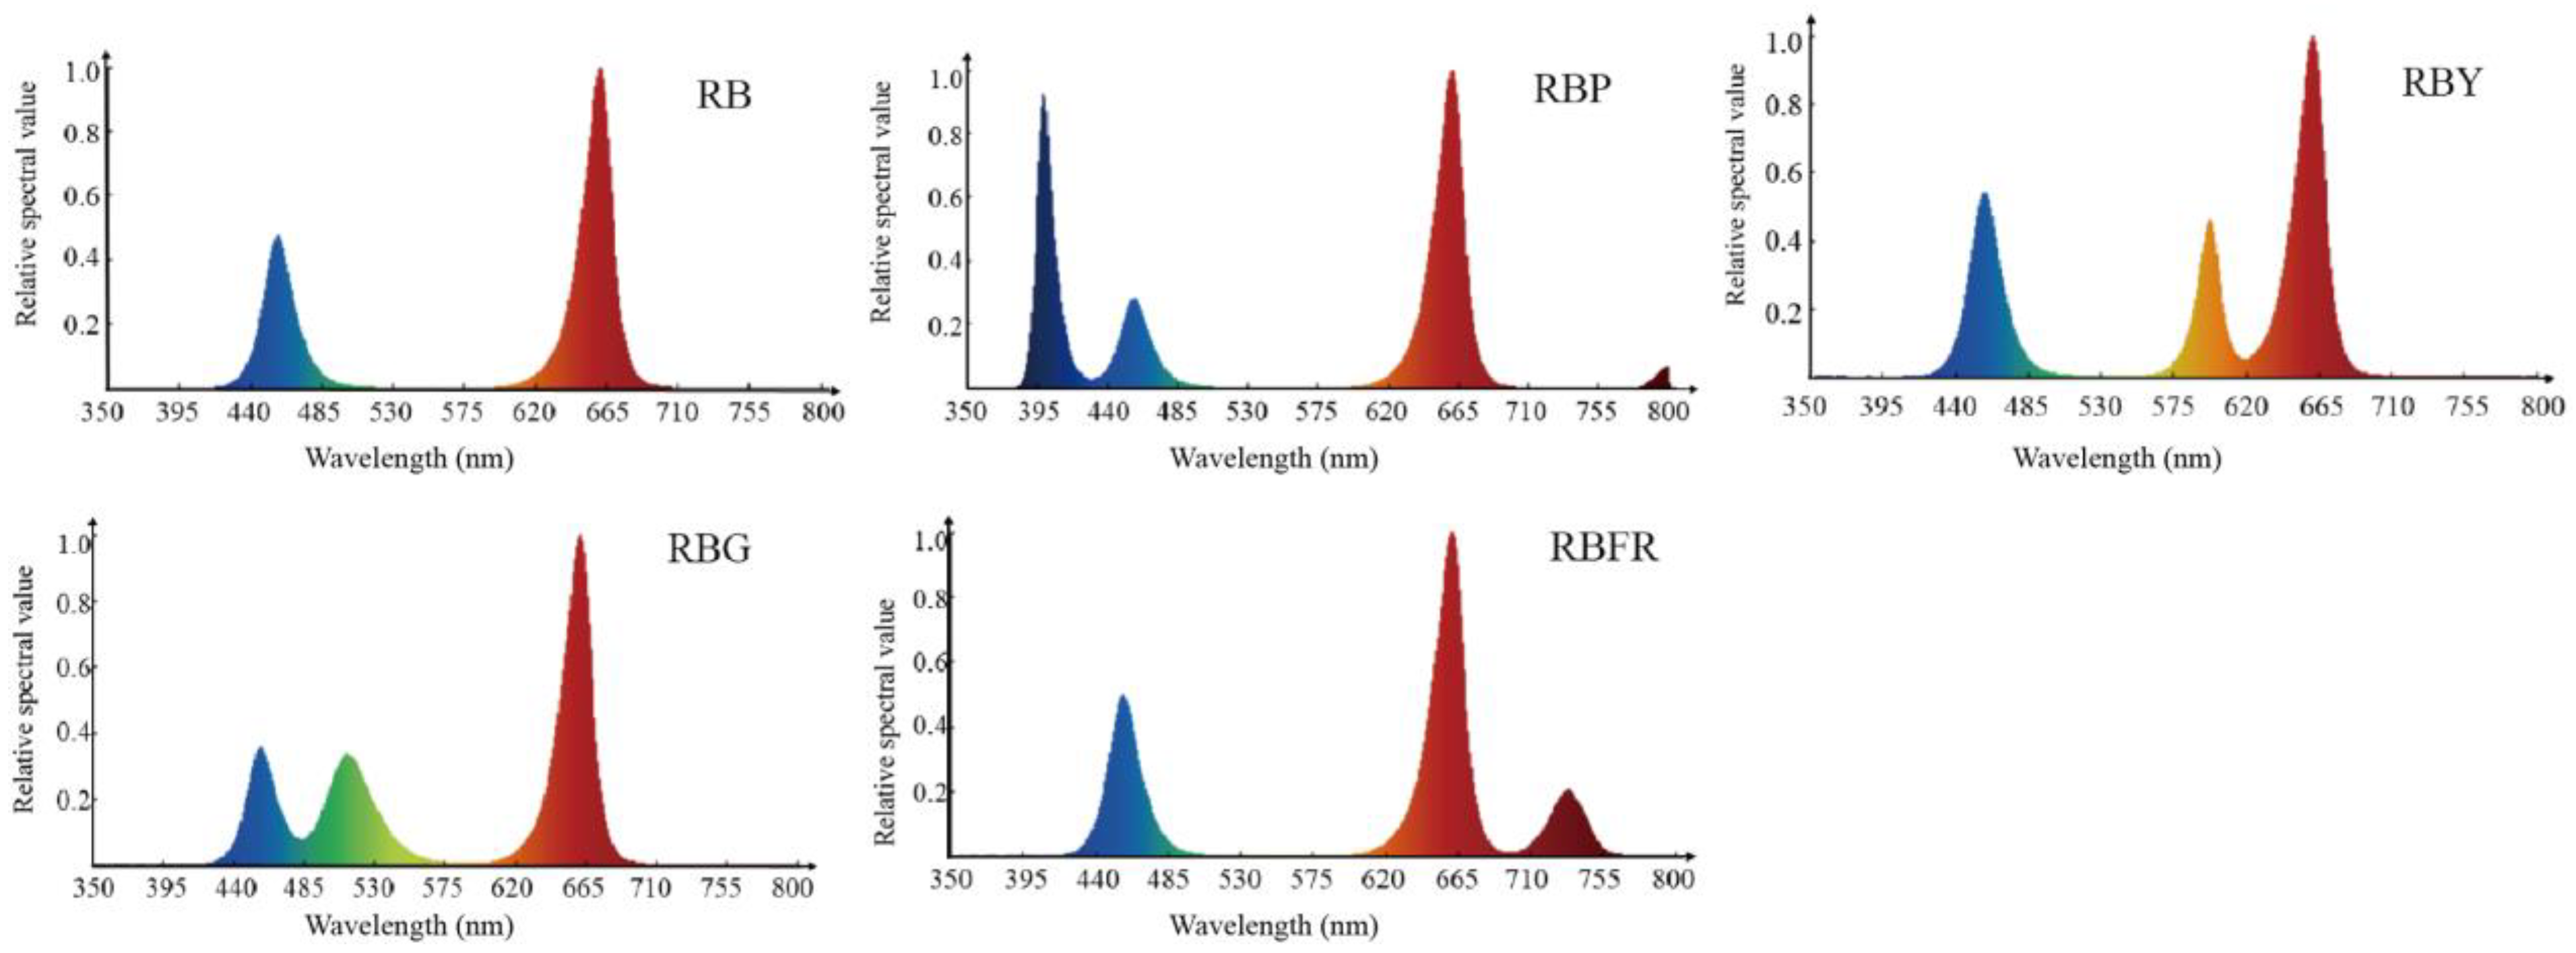
2.2. Experimental Treatments

In the experiment, five treatments were set up with red-blue light (3R1B) as the control, red-blue (R:B = 3:1, control), red-blue-purple (R:B:P = 3:1:1, purple (P)), red-blue-green (R:B:G = 3:1:1, green (G)), red-blue-yellow (R:B:Y = 3:1:1, yellow (Y)), and red-blue-far-red (R:B:FR = 3:1:1, far-red (FR)) light conditions were set up. The wave peaks of purple, green, yellow, and far-red light are 400 nm, 522 nm, 590 nm, and 735 nm, respectively. The photosynthetic photon flux density was 200 ± 10 μmol·m−2·s−1 for each treatment. Photon flux density was measured using a plant light analyzer (OHSP-350P, HOPOO COLOR) at 25 cm below the LED light. The LED lamp specifications for 1200 cm, power 18 W, and the manufacturer is Nanjing Hengyu Instrument Equipment Manufacturing Co. The relative spectral maps for each treatment are shown in Figure 1.

2.3. Cultivation Conditions

Celery seeds were placed in warm water (50 °C) for 30 min, soaked in cool water for 24 h, treated in a refrigerator at 4 °C for 6 h. Subsequently, germination was carried out in an incubator (temperature 18 °C, humidity 80%, and keeping the gauze moist for a long period of time), they were sown in seedling sponges (250 × 250 × 20 mm3) with round holes for hydroponic seedling cultivation. The temperature was controlled at 24 °C/18 °C (day/night), and a photoperiod of 12/12 h (day/night), air humidity of 50%, and light intensity of 200 μmol·m−2·s−1 were implemented. When the celery seedlings have five leaves and one heart, we transplanted the celery seedlings into hydroponic tanks in plant factories. The experiment was set up with five treatments, each treatment had 24 celery plants and was replicated three times for a total of 72 seedlings. We used the Hoagland nutrient formulation as well as universal micronutrient formulation with pH was 6.5 ± 0.5 and the EC was 2 ± 0.5 ms·cm−1. Then, we changed the nutrient solution every 15 days and took a sample after 45 days of treatment.

2.4. Determination of Plant Growth and Morphology

Growth was measured for 45 d of treatment. Random samples were taken, plant height and root length were measured with a millimeter scale, vernier scale was used to measure the stalk thickness, the fresh weights of aboveground and roots were determined with an electronic balance, and dried at 60 °C, and then weighed with an electronic balance of one thousandth of a degree to measure the dry weights, and iterated three times for each treatment. And calculate the water content using the following formula: (fresh weight − dry weight)/fresh weight × 100%.

2.5. Measurement of Photosynthetic Parameters

Photosynthetic indexes such as net photosynthetic rate (Pn), stomatal conductance (Gs), intercellular CO2 concentration (Ci) and transpiration rate (Tr) were determined with a portable photosynthesis meter (Li-6400, Lincol, NE, USA).
Celery was harvested after 45 days of treatment, and then the photosynthetic pigment content was determined [43]. Chlorophyll a and b, carotenoids and total chlorophyll content were determined by 80% acetone extraction, the leaves of three celery plants were randomly selected and repeated three times.

2.6. Determination of Nutritional Quality Indicators

Weigh 0.5 g of fresh sample. Then, the soluble sugars were determined by anthrone colorimetric method [44,45], and soluble proteins were determined by Coomassie brilliant blue G-250 method [44]. Weigh 0.5 g of fresh sample. The nitrate content was measured with reference to the salicylic acid-sulfuric acid colorimetric method [46]. Weigh 0.5 g of celery leaves and petioles from each treatment. The ascorbic acid content was determined by molybdenum blue spectrophotometry [47]. Accurately weigh 0.05 g of the dry sample, cellulose content was measured by digestion and gravimetric technique [48].
Accurately weighed 0.5 g samples were soaked in 80% acetone at room temperature for 1 h, and total phenol and total flavonoid content were determined [49,50]. The total flavonoid content was determined by employing the aluminum chloride colorimetric method. Total phenol content was determined by the Folin–Ciocalteau reagent method using gallic acid as a standard. Weigh 0.5 g of sample. Then, the anthocyanin content was determined by the method of Li [51], and we calculated the anthocyanin content. The method for the determination of apigenin content was carried out with some modifications as previously described [44,52,53], and the apigenin content was determined using liquid chromatography.

2.7. Determination of Mineral Element Content

The method for the determination of mineral element content was carried out with some modifications as previously described [54]. In brief, a dry sample of 0.5 g of the powder was weighed and digested using a microwave digestor. Calcium (Ca), magnesium (Mg), iron (Fe), zinc (Zn) were determined by atomic absorption spectrophotometer.

2.8. Determination of Flavonoid-Related Enzyme Activities

The activities of phenylalanine deaminase (PAL), chalcone synthase (CHS), chalcone isomerase (CHI), flavonoid synthase (FNS), and anthocyanin synthase (ANS) in the synthesis process of the major flavonoids were determined by using ELISA kits produced by Jiangsu Enzyme Immunity Industry Co in Yancheng, China.

2.9. Expression Analysis of Key Flavonoid-Related Genes

Following the OMEGA kit’s instructions, the extraction of RNA from celery was performed by a modified CTAB method, total RNA was extracted from the petioles and leaves of celery that had been treated for 45 days. The quality of the extracted RNA was tested using 1.2% agar gel electrophoresis, and an ultra-trace nucleic acid protein concentration analyzer (Thermo Fisher NanoDrop One, Waltham, MA, USA) was used to detect RNA concentration and purity.
The total RNA obtained was reverse transcribed into cDNA using the instructions of TaKaRa Reverse Transcription Kit Prime Script TM RT reagent Kit and gDNA Eraser (Takara Biomedical Technology (Beijing) Co., Ltd., Beijing, China). The reverse transcribed cDNA was diluted with sterile ddH2O and stored in −20 °C refrigerator.
Real-time fluorescence quantitative analysis uses a 20 µL reaction system: 2 µL of template cDNA, 2 µL of upstream and downstream primers, 10 µL of SYBR Green fluorescent dye (Takara), and then ddH2O was added to 20 µL. The specific reaction program is as follows: pre-denaturation at 95 °C for 3 min, 40 cycles of 95 °C for 30 s, 58 °C for 30 s, and 72 °C for 30 s, and then the reaction was completed at 72 °C for 5 min. Each reaction was set up in 3 replicates. The calculation and analysis of gene expression relative quantification were performed using the 2-ΔΔCt method. The primer sequences are shown in Table 1 below:

2.10. Statistical Analysis

Experimental data were statistically analyzed by analysis of variance (ANOVA) using IBM SPSS Statistics 23.0. Differences between treatments were determined using LSD multiple range tests at a significance level of p ≤ 0.05. Data were expressed as mean ± standard error (SE). Origin 2018 was used for graphing.

3. Results and Analysis

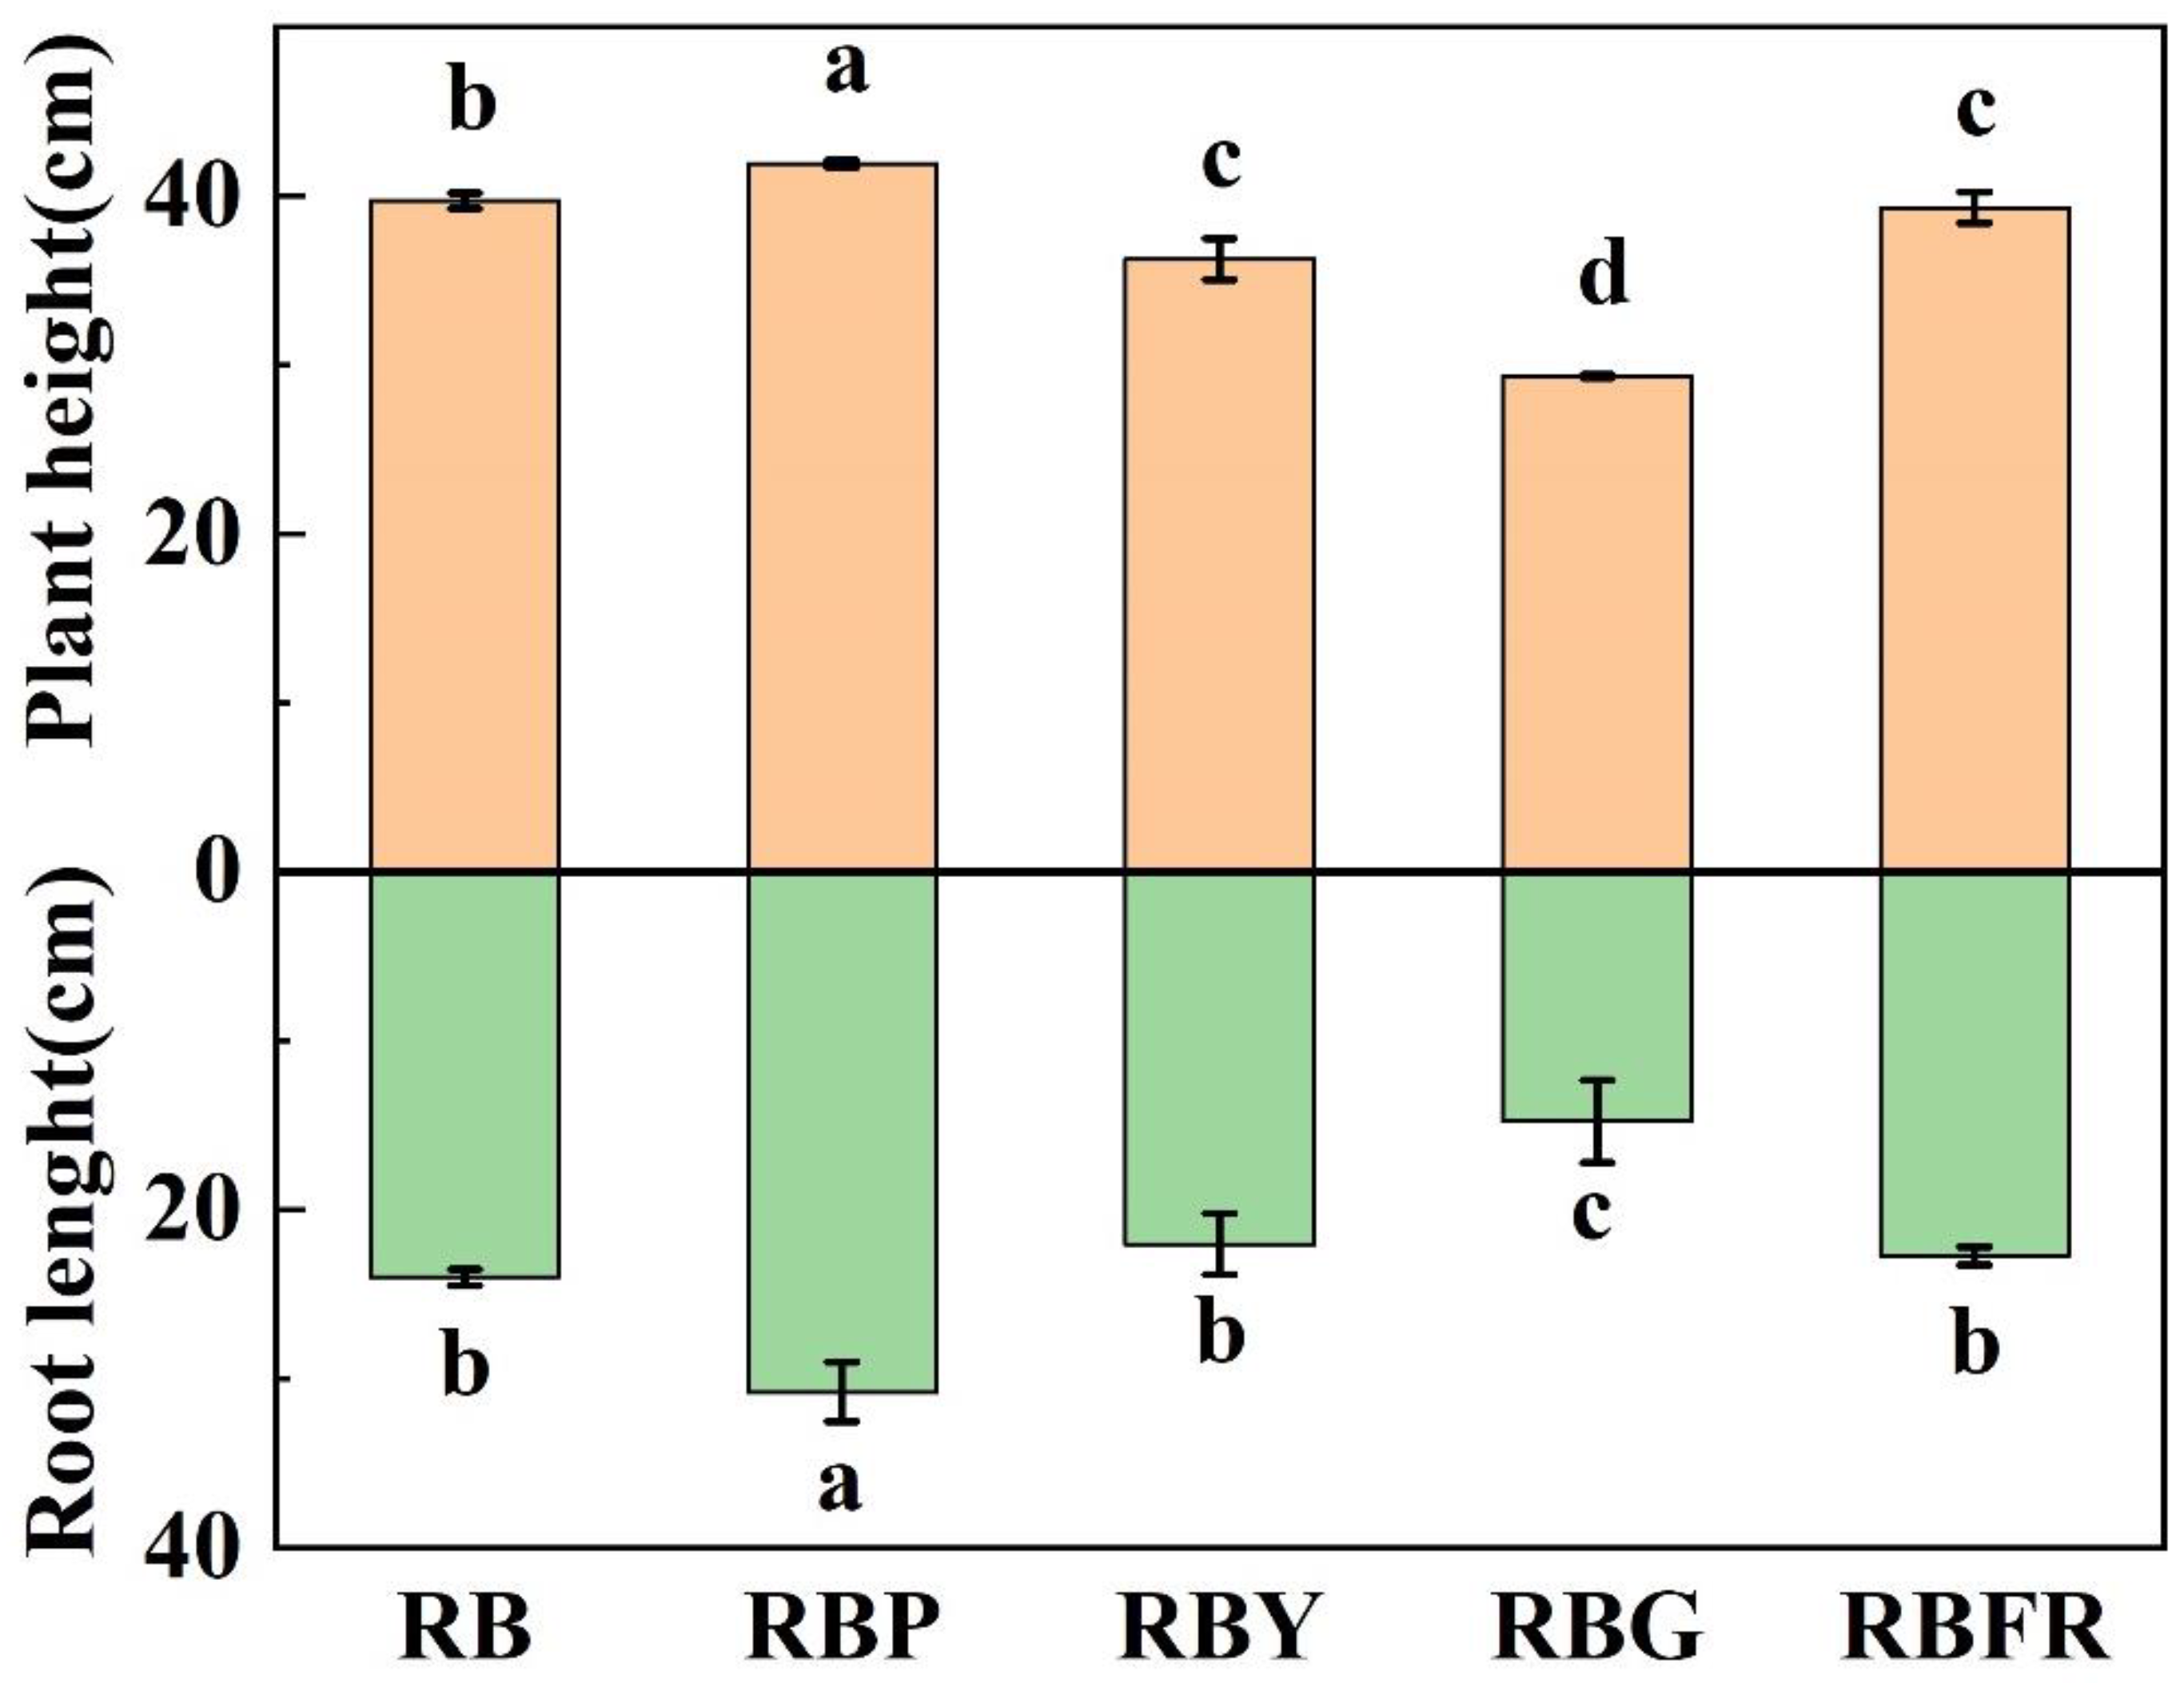
3.1. Effects of LED Combined Light on Growth and Morphological Characteristics of Celery

Figure 2 shows the influence of different LED combination light sources on celery growth. As can be seen in Figure 2, the plant height and root length of celery were differently affected under different LED combination light treatments. RBP significantly promoted, increasing by 5.63% and 28.30%, respectively, compared with RB. Compared with RB, the plant height of celery was significantly reduced under RBY and RBFR light treatments, while there was no significant difference in root length (Figure 2).
Table 2 shows effects of different light quality on celery growth indexes. Under the RBP combination, light irradiation, aboveground fresh and dry weight, root fresh and dry weight, and stem thickness of celery significantly increased by 24.40%, 85.55%, 20.35%, 13.19%, and 12.00%, respectively, compared to RB. Aboveground fresh weight, root fresh and dry weight, and stem thickness were reduced under RBG and RBFR treatments compared to RB treatment (Table 2). Therefore, combined light RBP is beneficial for celery above-ground growth and can be moderately supplemented with red, blue, and violet light during cultivation of celery.

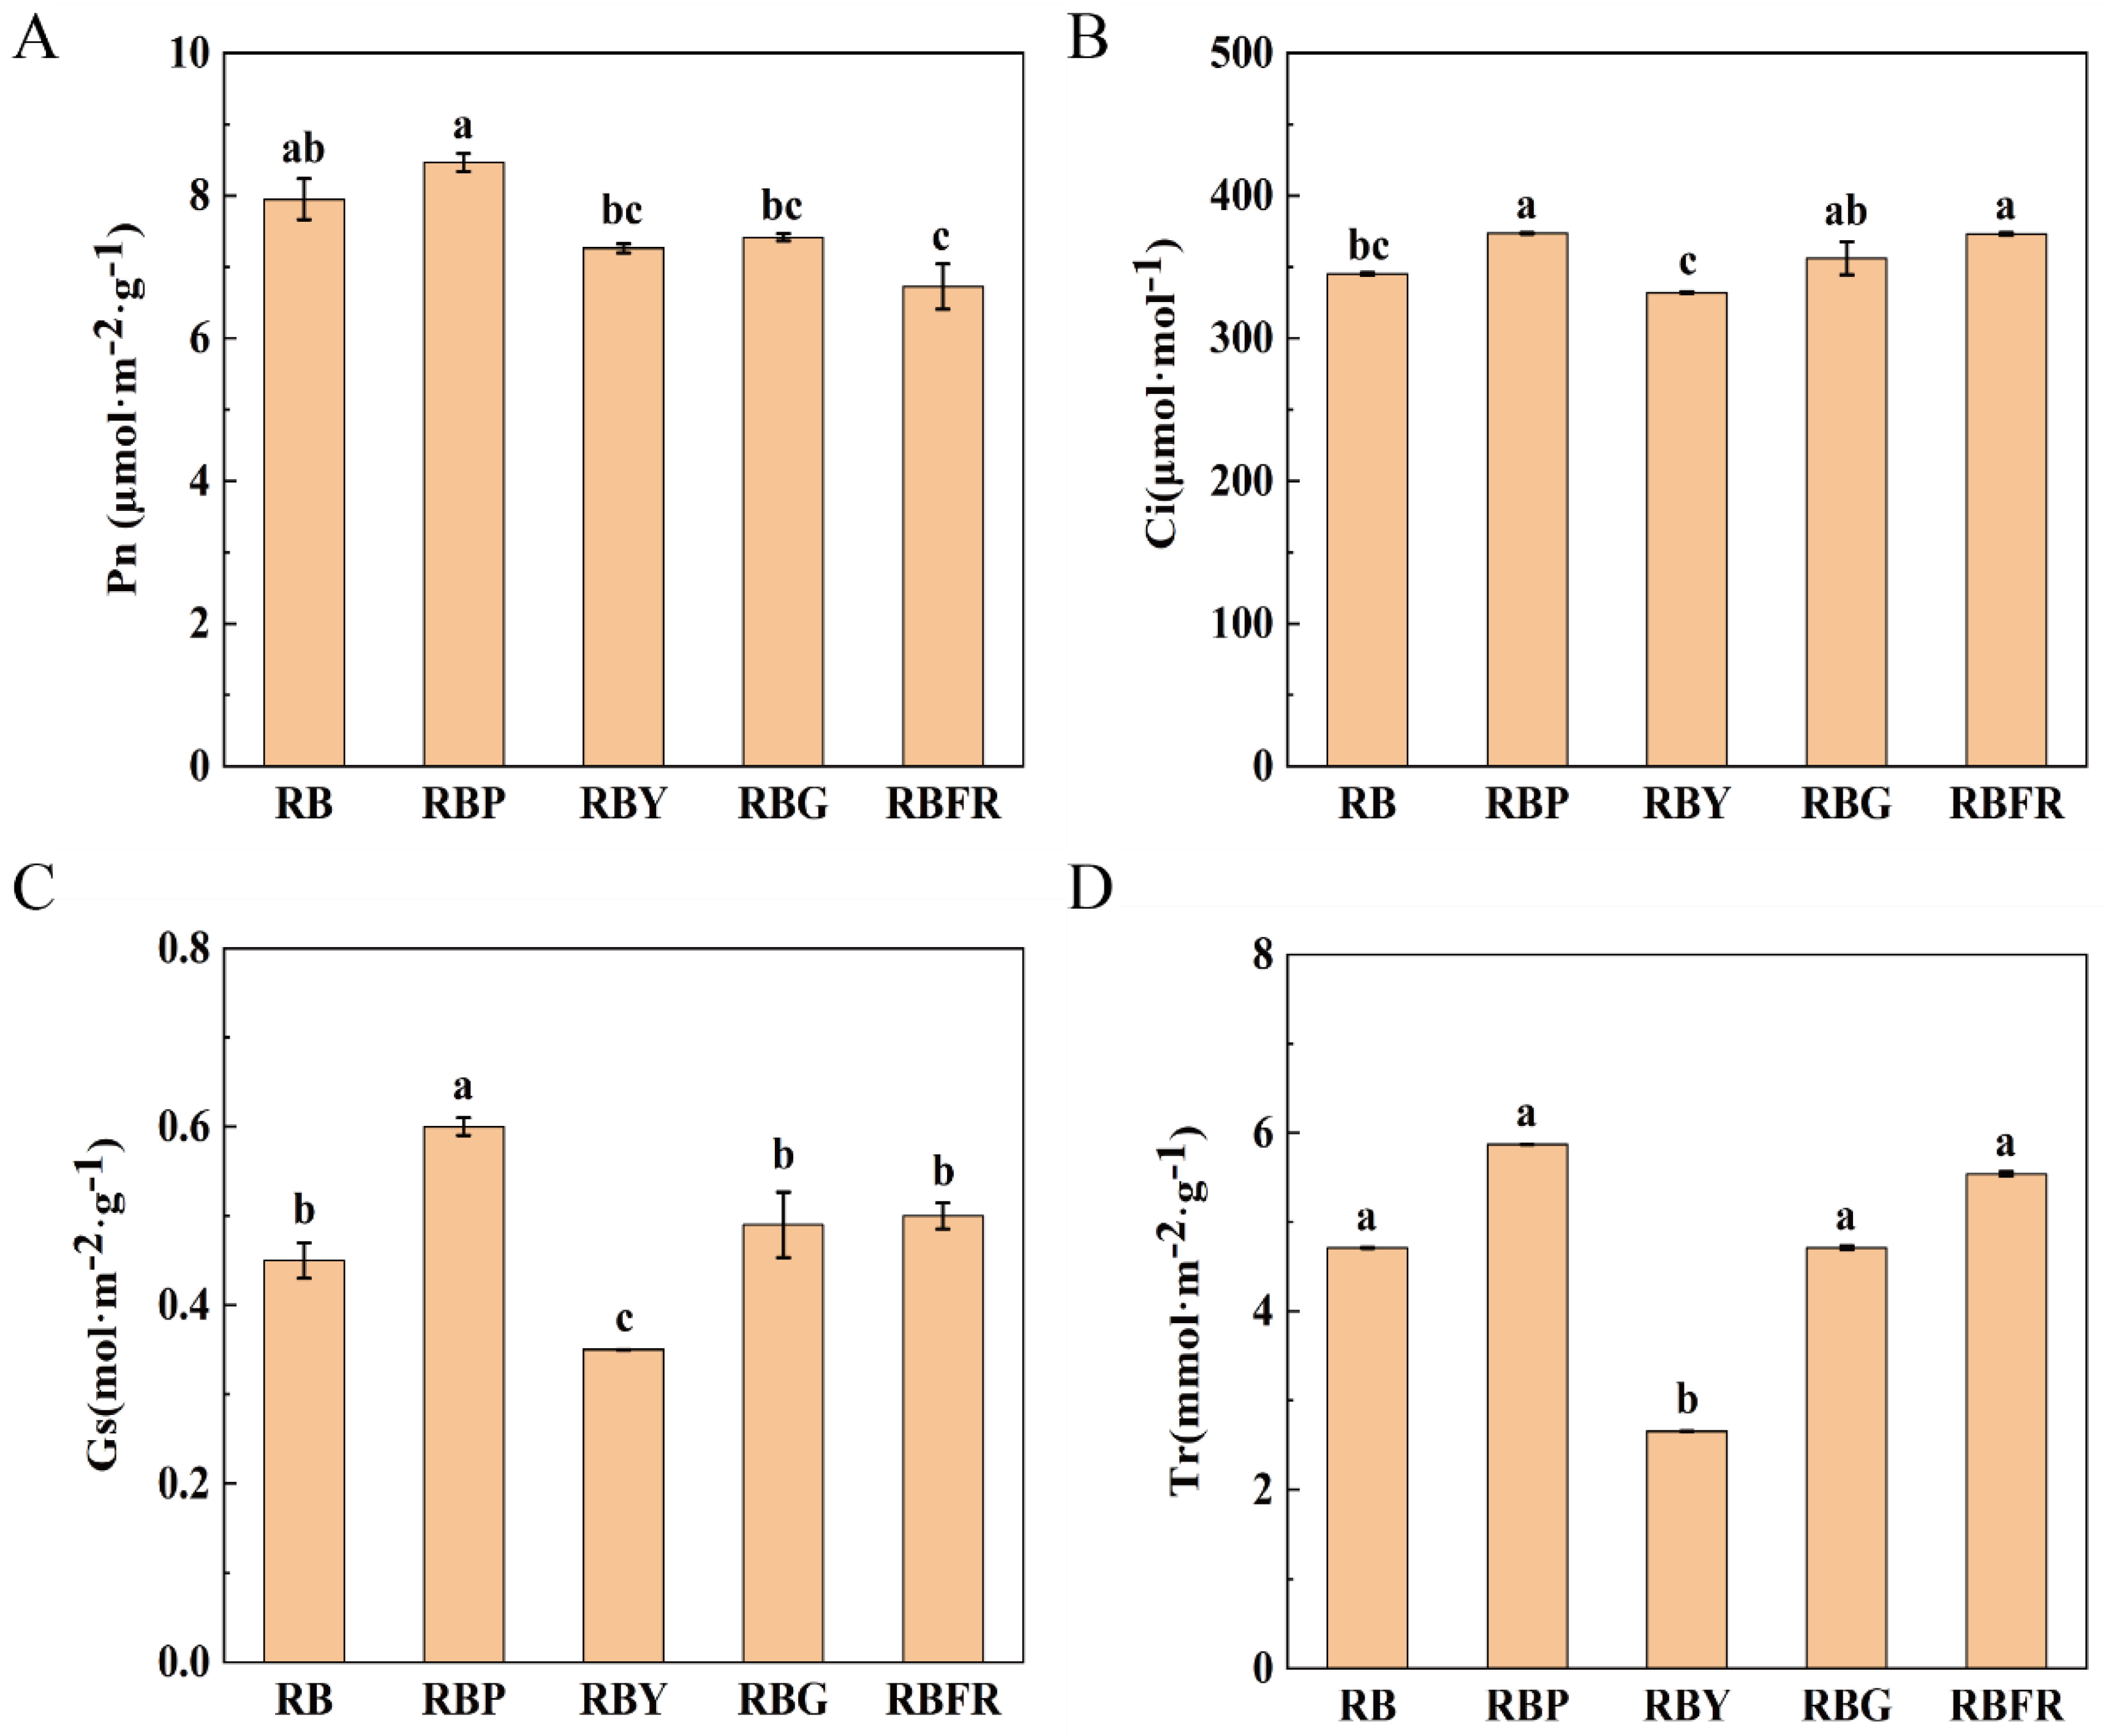
3.2. Effect of LED Combined Light on Photosynthetic Parameters of Celery

Figure 3 shows effects of celery treated with different light quality on photosynthetic pigments. As can be seen in Figure 3, the photosynthetic pigment contents of celery varied under different LED combination light treatments. Under RBP treatment, the content of chlorophyll a, carotenoids and total chlorophyll increased by 29.15%, 24.23% and 50.70% than RB, respectively, and compared to RB, the content of chlorophyll b decreased significantly under RBG (Figure 3).
Figure 4 shows the effects of different light quality treatments on gas exchange parameters of celery. As can be seen from Figure 4, under RBP treatment, Pn of celery was increased compared to RB control and significantly decreased under RBFR treatment. Ci was significantly increased by 8.29% and 8.25% under RBP and RBFR treatments compared to RB. Compared to RB, Gs and Tr increased by 33.33% and 24.63% under RBP treatment, while they decreased by 22.22% and 43.64% under RBY treatment, respectively (Figure 4).

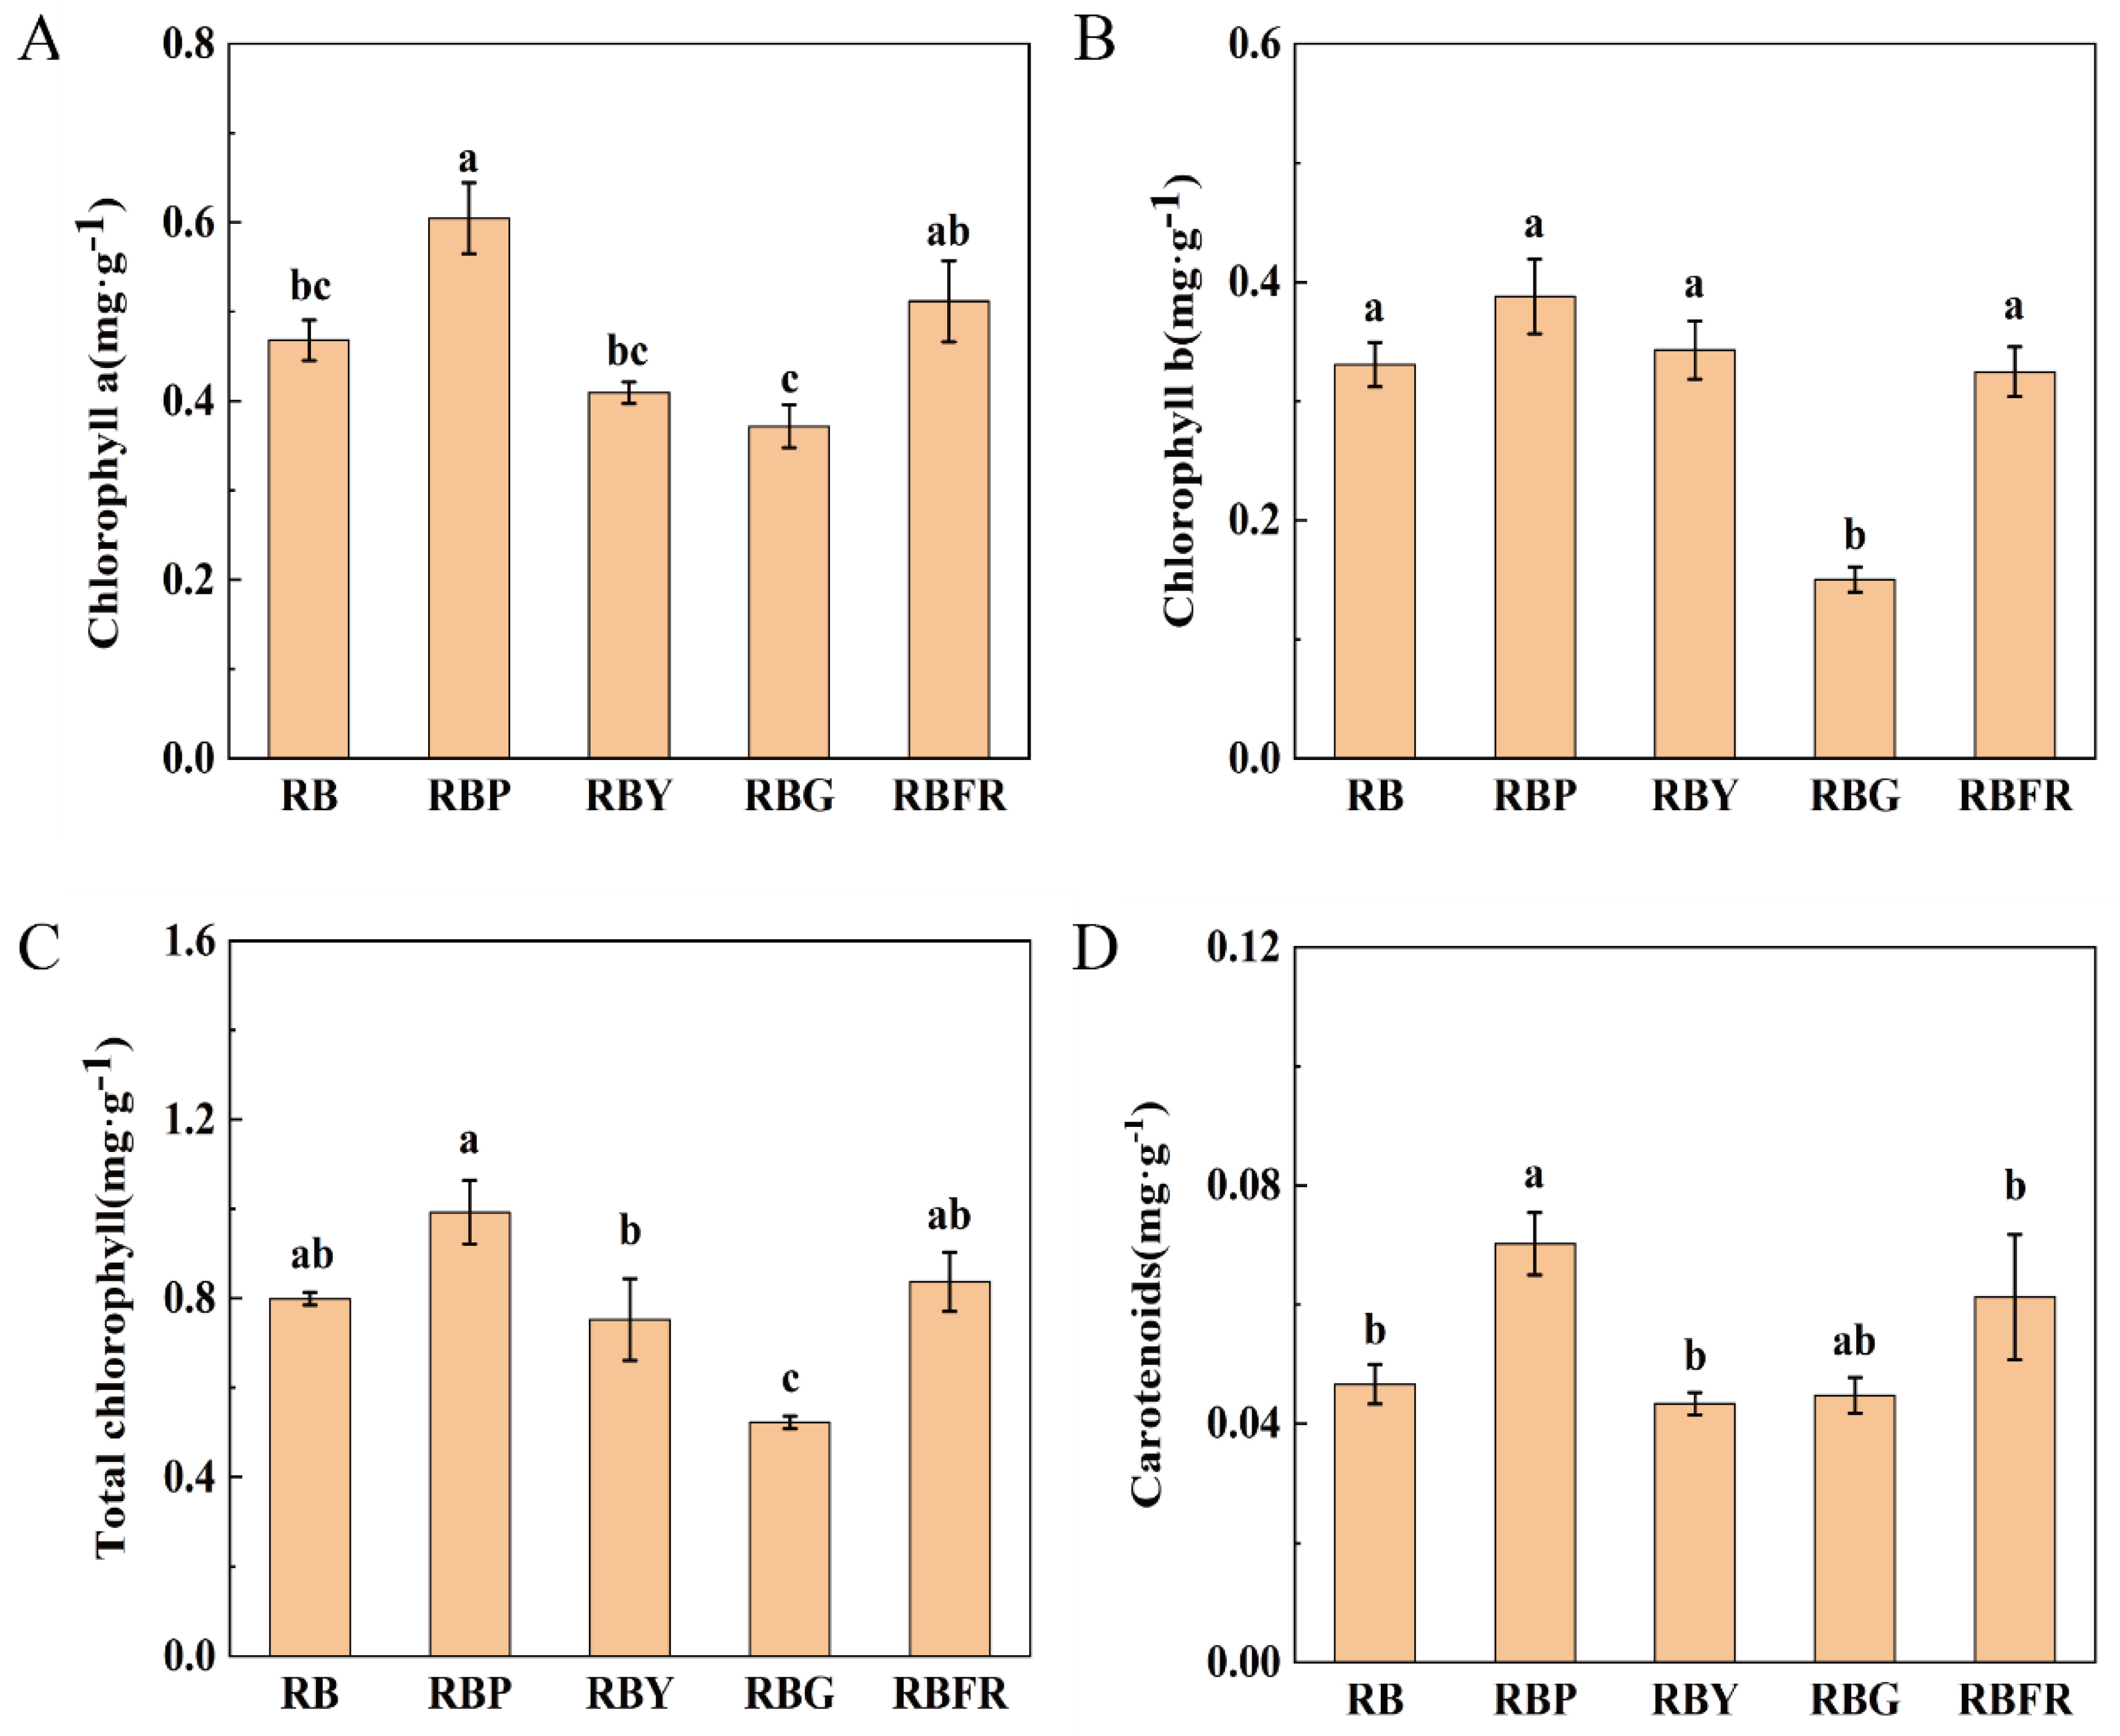
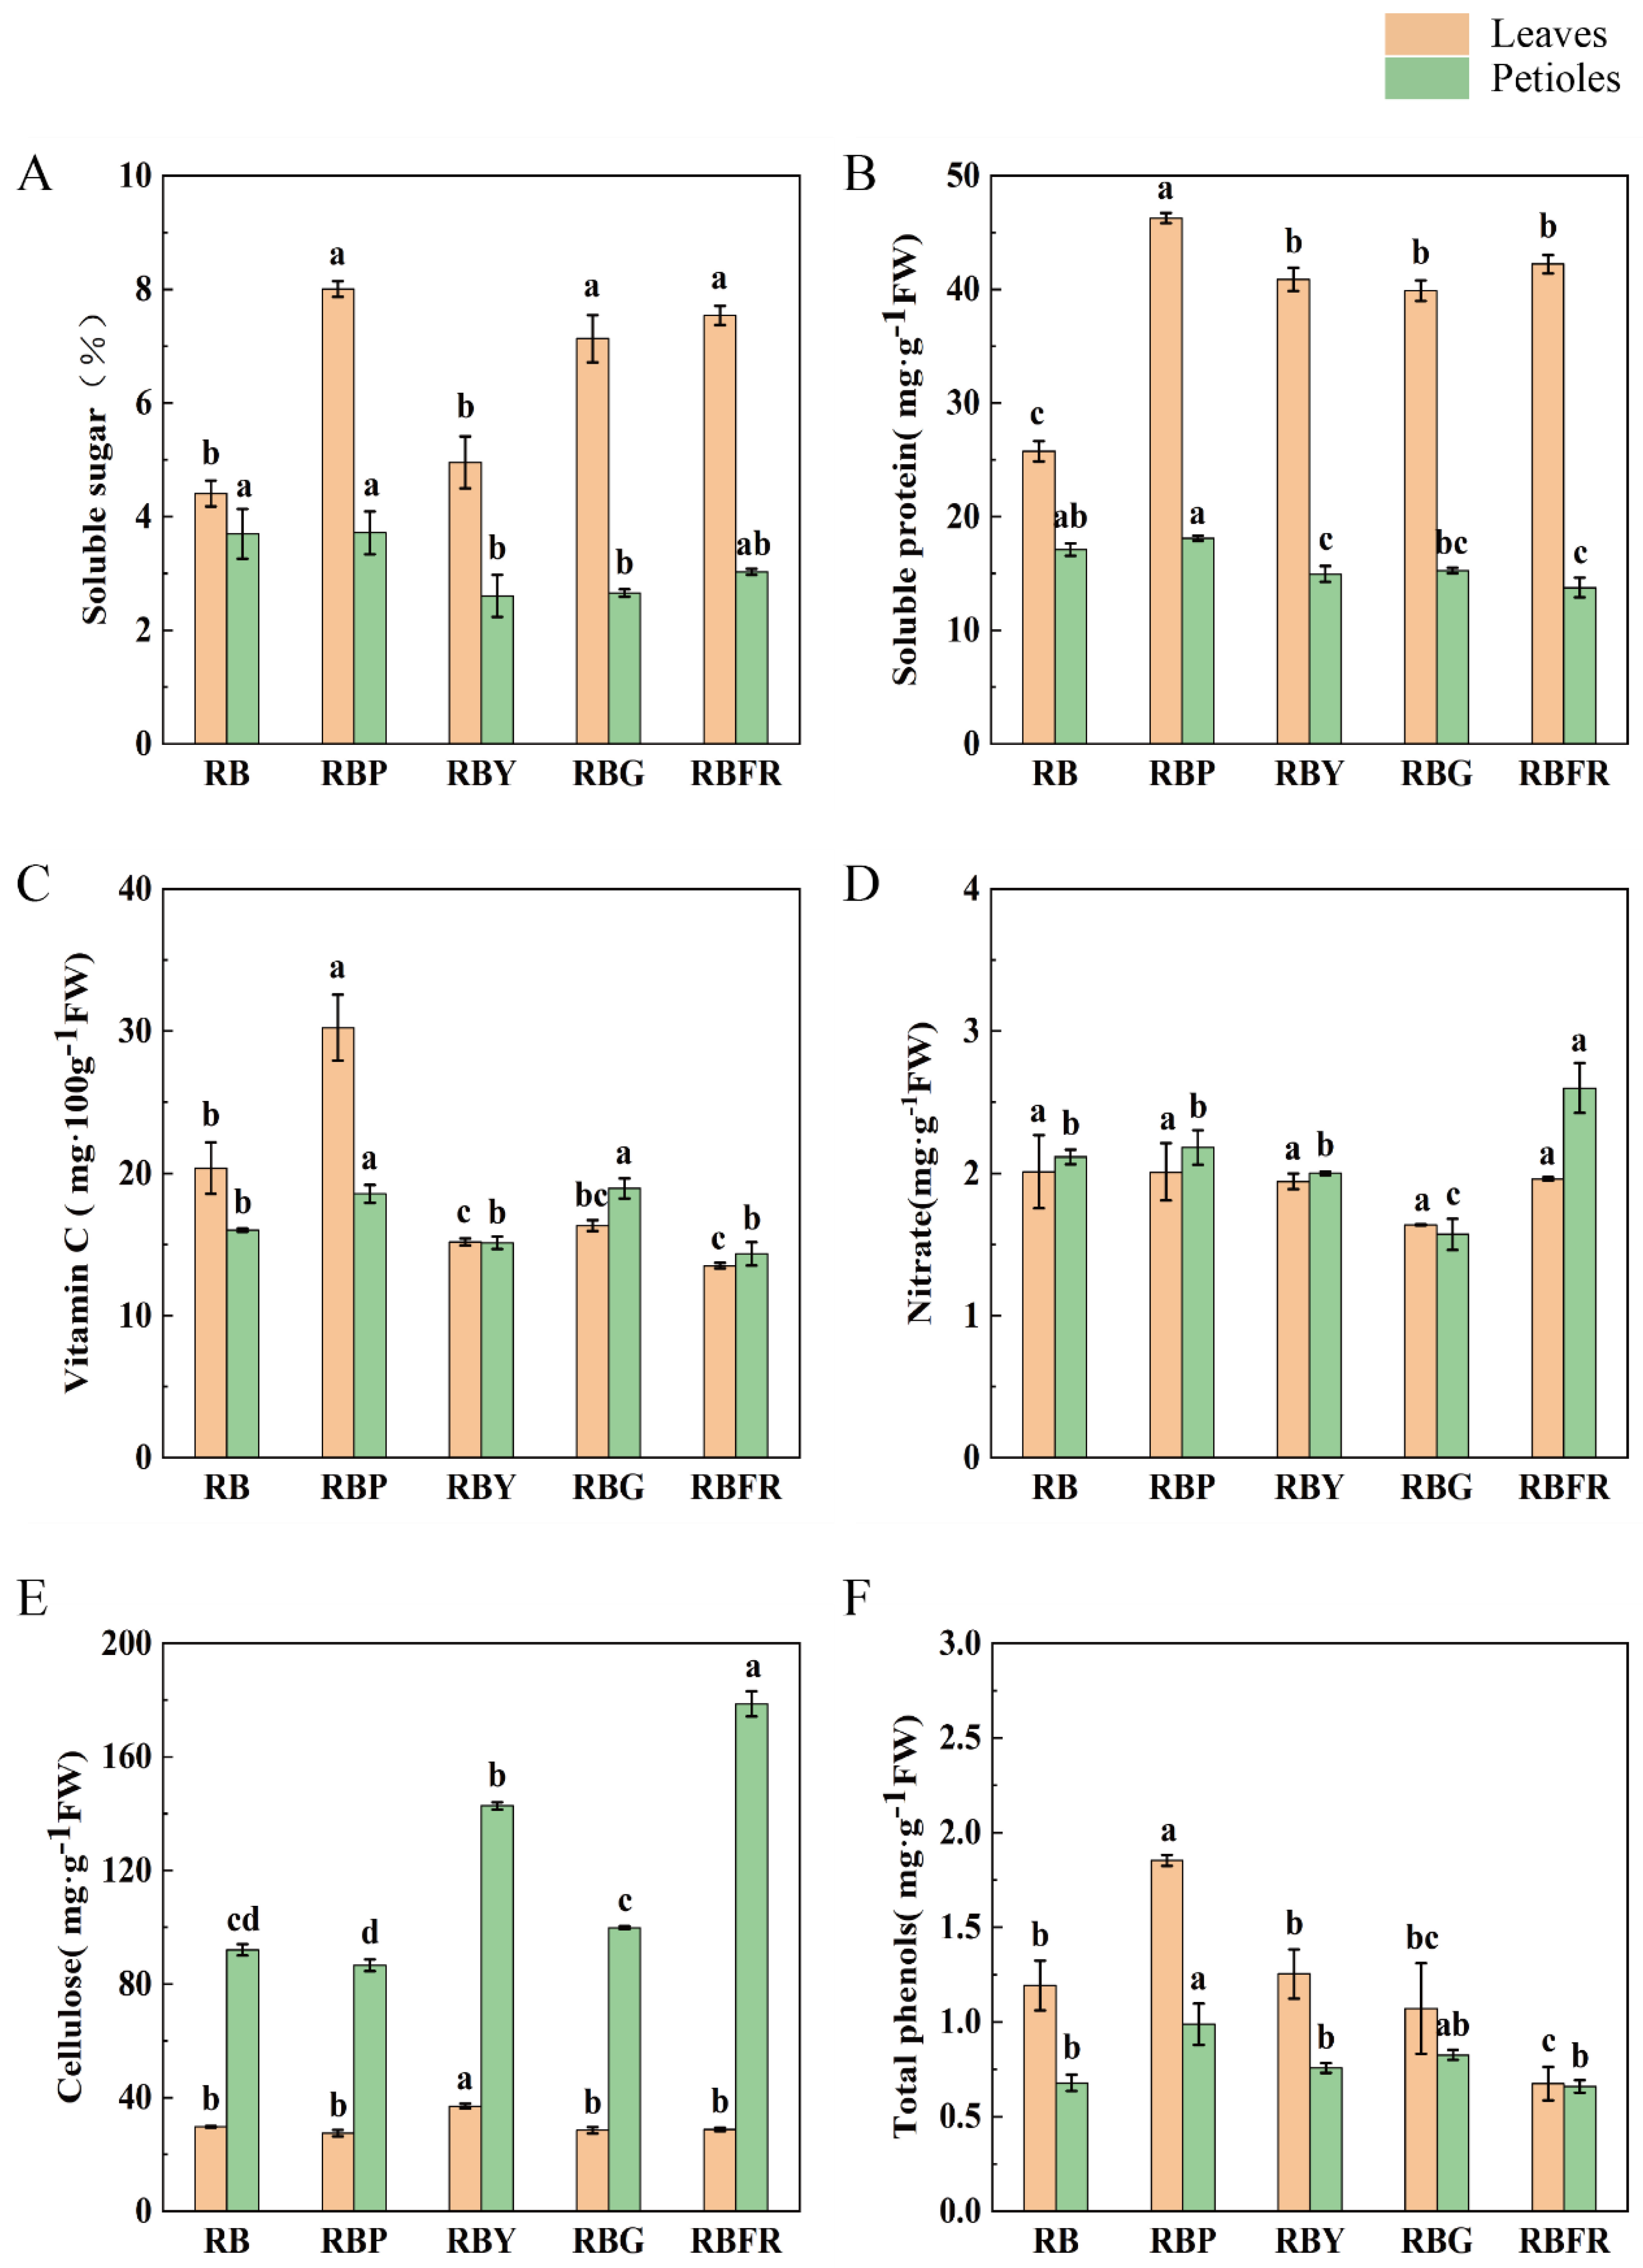
3.3. The Effect of LED Combined Light on the Nutritional Quality of Celery

Figure 5 shows nutritional quality of celery under different light quality. As seen in Figure 5, different LED combinations of light sources had different effects on nitrate, soluble sugar, soluble protein, vitamin C, cellulose, and total phenol content of celery leaves and petioles (Figure 5).
Compared with RB treatments, the soluble sugar content of celery leaves was significantly increased under RBG, RBFR, and RBP, among which was markedly increased by 81.66% under RBP treatment. Compared with RB, adding appropriate amounts of yellow and green light, it was significantly reduced in celery petioles (Figure 5A).
All other treatments helped to increase the soluble protein content of celery leaves compared to RB, and it was significantly reduced in celery petioles under RBY and RBFR treatments compared to RB, whereas it was significantly higher in leaves and petioles under RBP treatment than the other treatments, compared with RB, increasing by 79.59% and 5.84%, respectively (Figure 5B).
Compared with RB, the Vc content of celery leaves and petioles under RBP treatment increased by 48.47% and 15.97%, respectively, and compared with RB, the Vc content of celery leaves decreased under RBY, RBG, and RBFR treatments, while the Vc content of celery petioles was significantly increased by 18.40% under RBG treatment (Figure 5C).
Compared with RB, RBP combined light treatment reduced the nitrate content of celery leaves and petioles by 98.28% and 25.73%, respectively, while the nitrate content of celery petioles increased under RBFR combined light (Figure 5D).
The cellulose content of leaves was markedly increased by 24.70% under RBY treatment as compared with RB. Compared with RB, the cellulose content of celery petioles increased by 55.07% and 94.06% under RBY and RBFR treatments, respectively (Figure 5E).
Compared with RB, under RBP combined light, the total phenol content in leaves and petioles was markedly increased by 55.53% and 45.81%, respectively. Compared with RB, the total phenol content of celery leaves was significantly reduced under RBFR combined light treatment (Figure 5F).

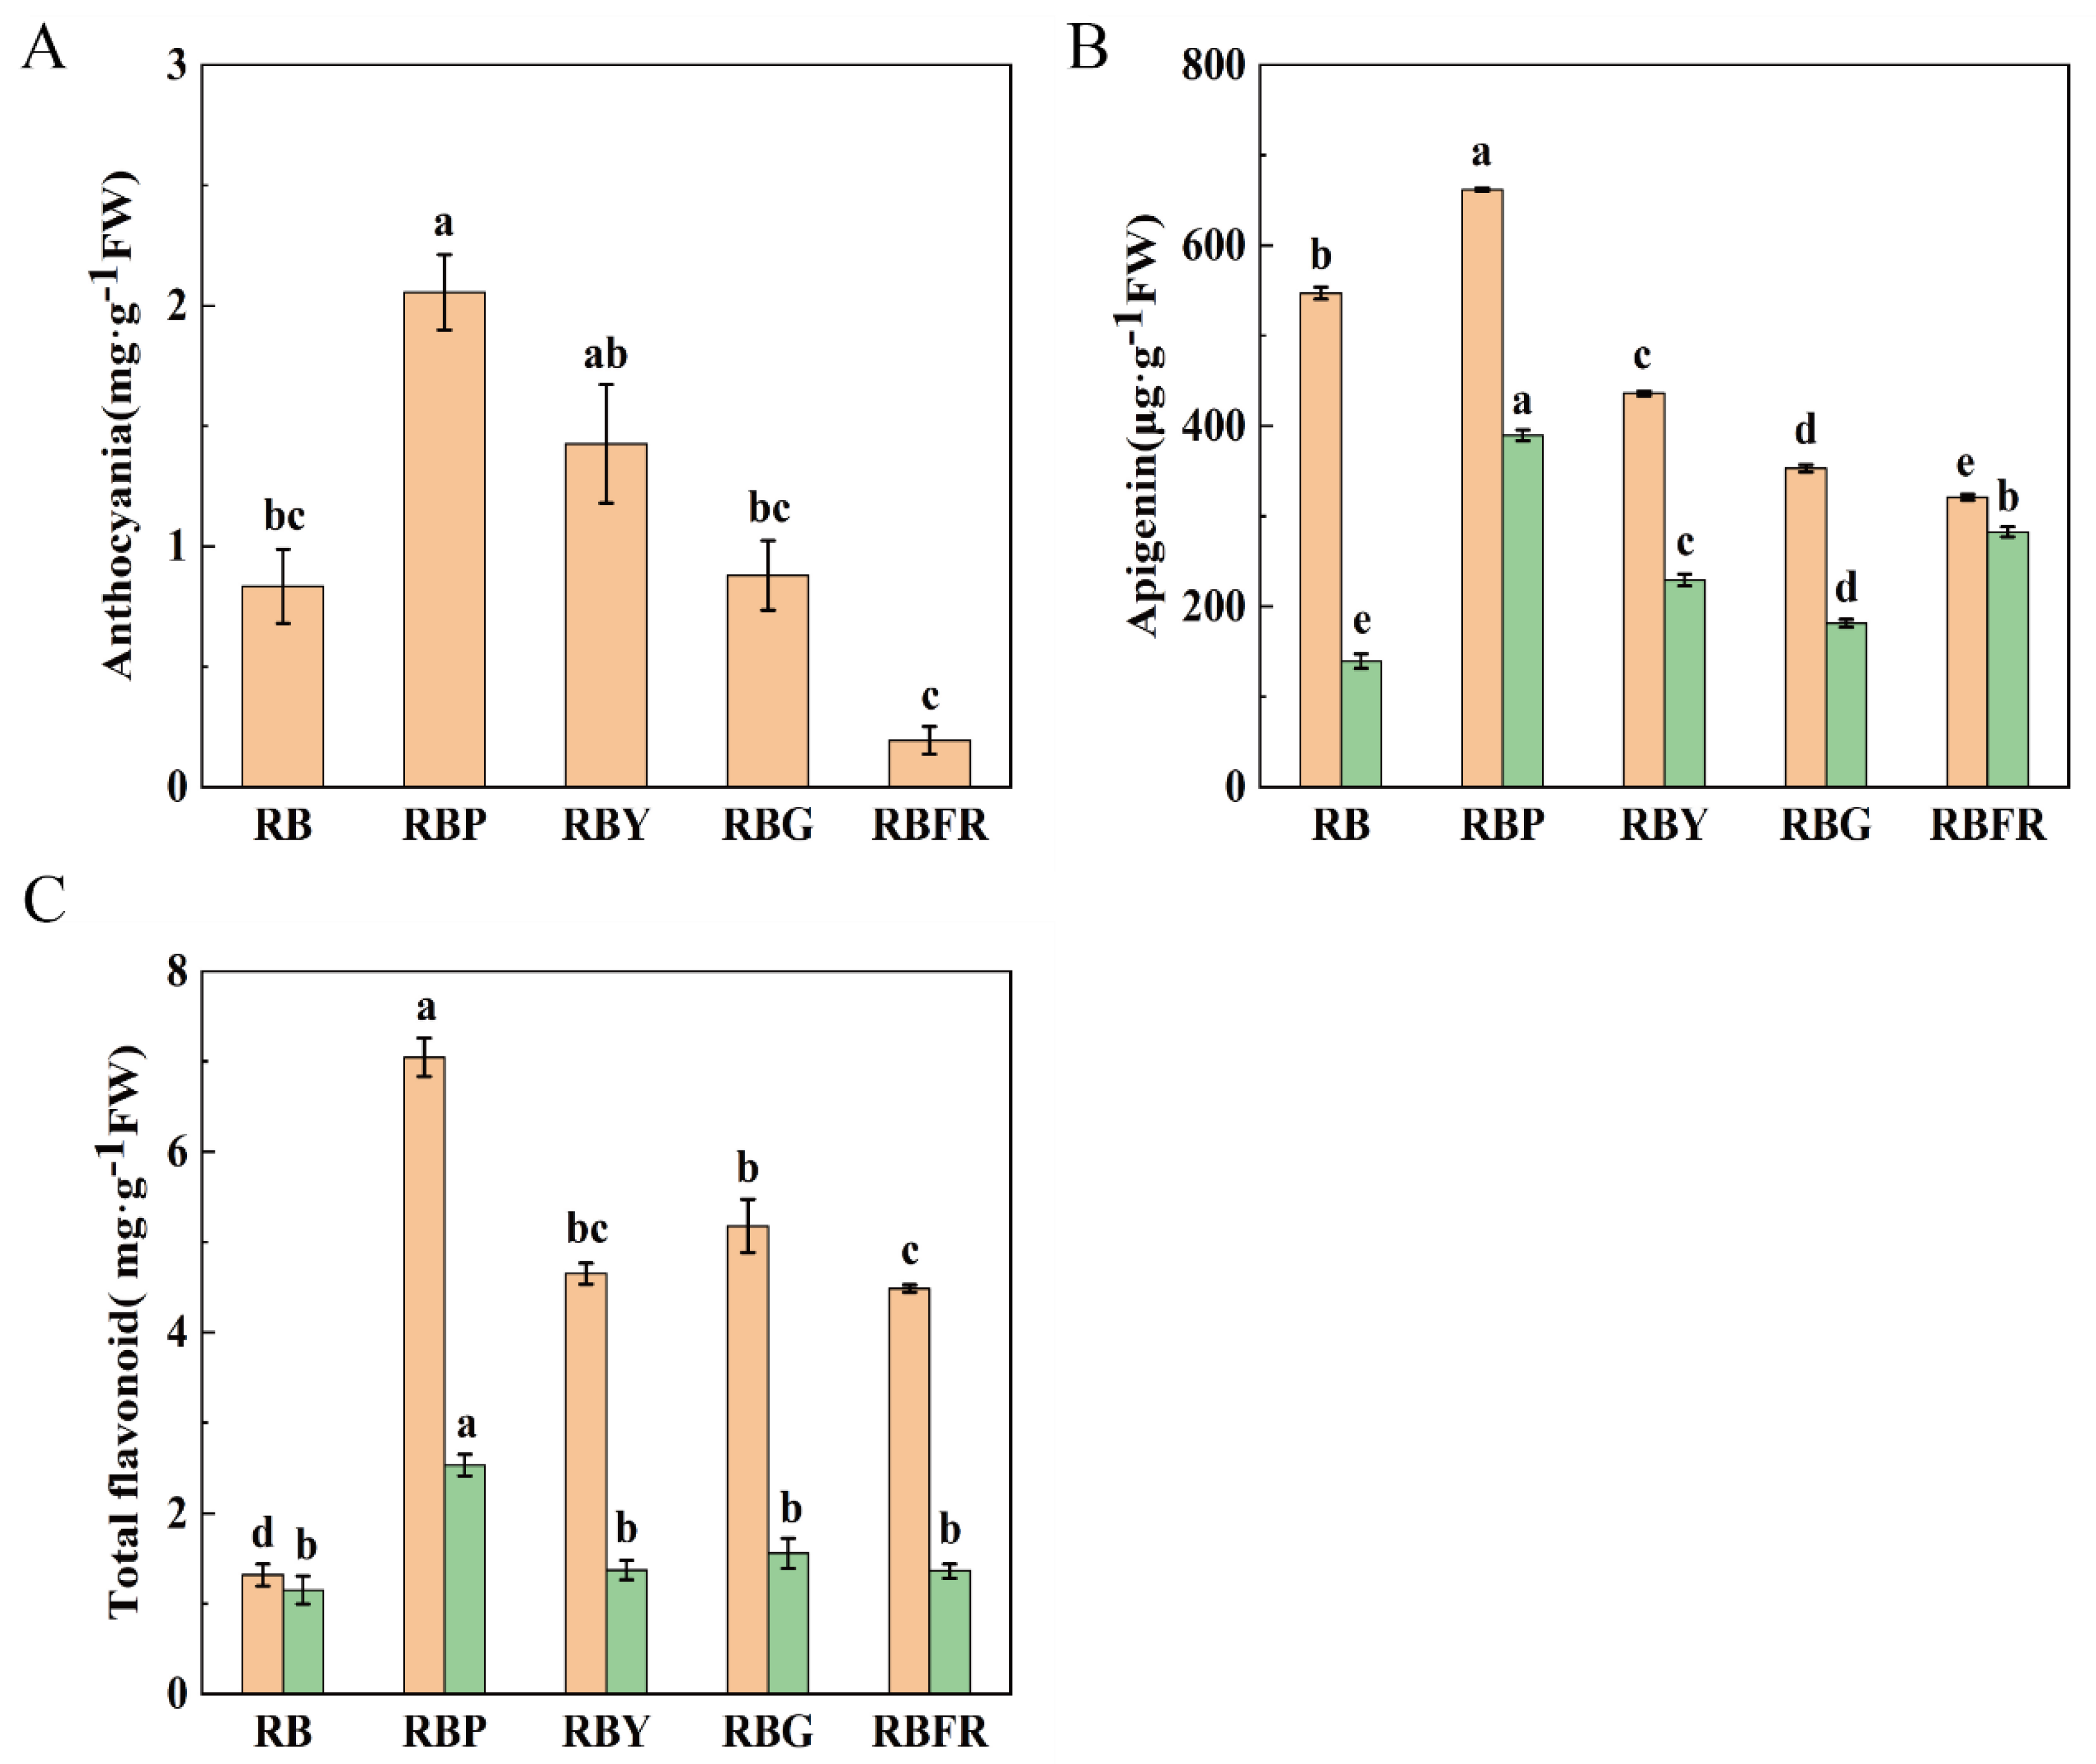
3.4. The Effect of LED Combined Light on Flavonoids in Celery

Figure 6 shows the effects of different light quality on flavonoids in celery. As can be seen in Figure 6, compared with RB, the anthocyanin content of celery petioles increased by 146.69% under RBP treatment, decreased by 76.66% under RBFR combined light treatment (Figure 6A).
The size order of apigenin content in celery leaves under various combinations of light treatments was RBP > RB > RBY > RBG > RBFR, and compared with RB, other combinations of light treatments increased the apigenin content in celery petioles, with RBP treatments significantly higher than the other treatments (Figure 6B).
Compared with RB, all combinations of light treatments were favorable for increasing the total flavonoid leaves and petioles, in which the total flavonoid content of celery leaves and petioles under the RBP was markedly higher than the other treatments, increased by 435.26% and 119.89%, respectively, compared with RB (Figure 6C).

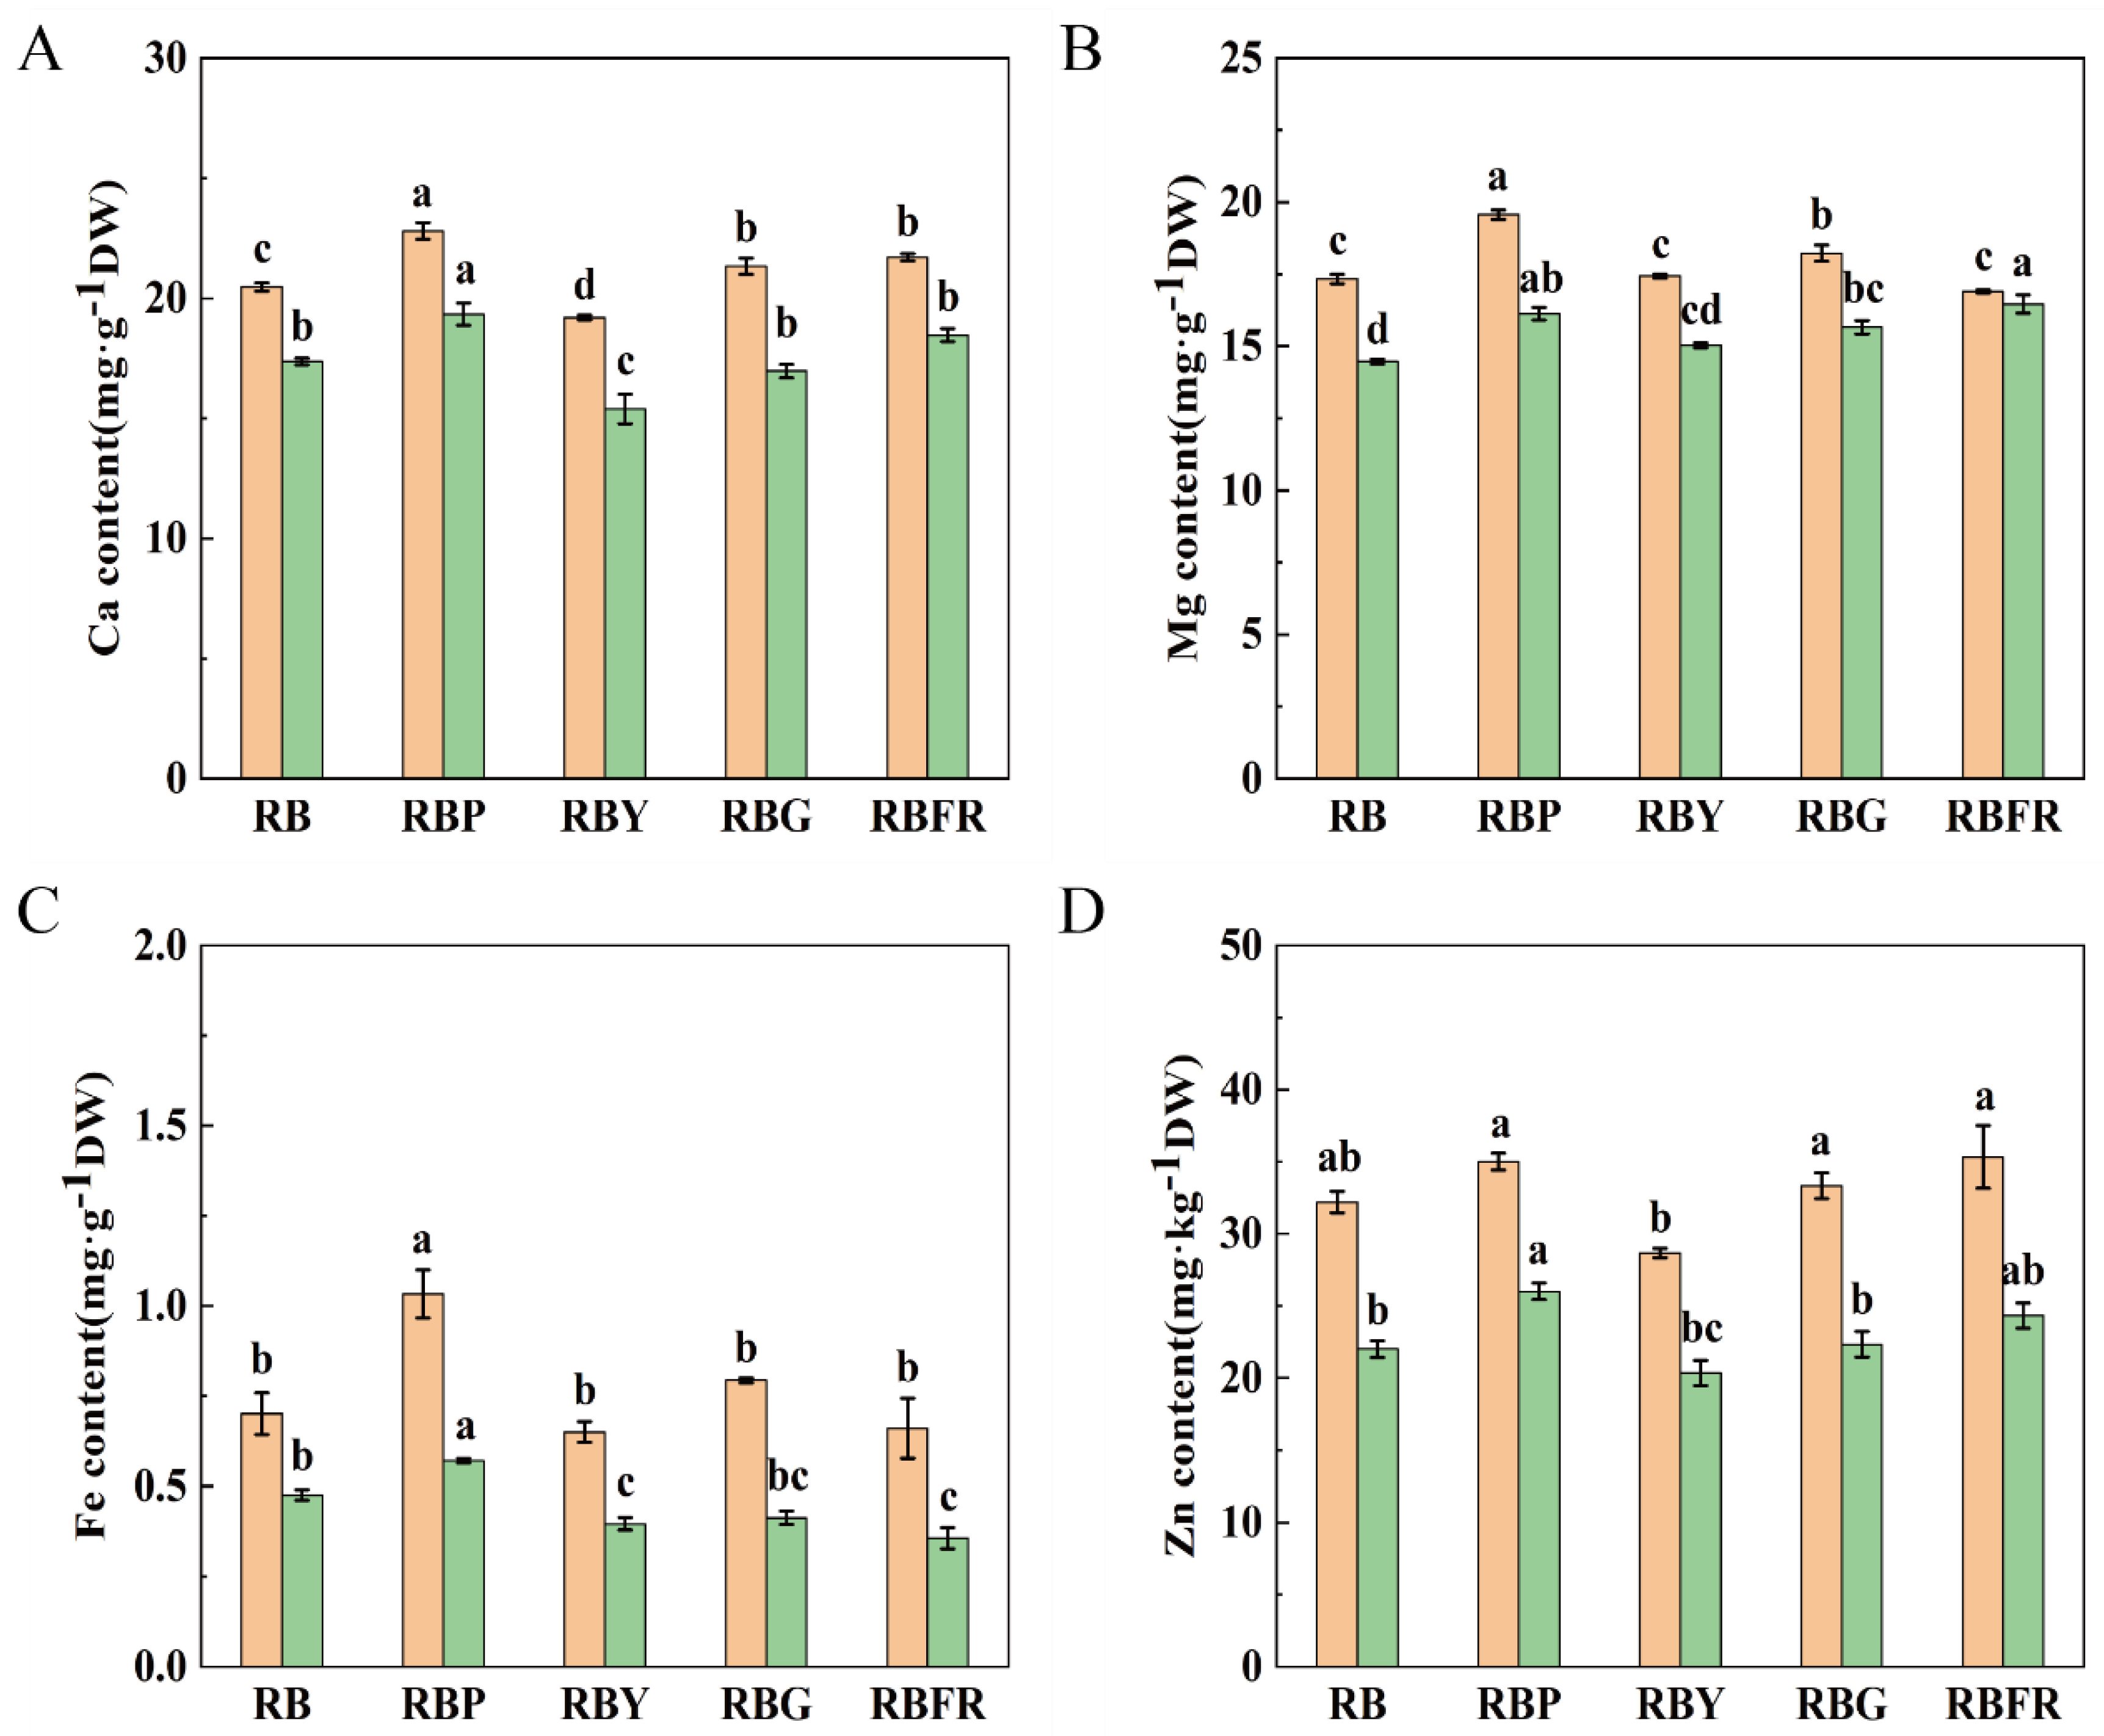
3.5. Effect of LED Combined Light on Mineral Elements of Celery

Figure 7 shows changes in mineral element content in celery under different light quality. As can be seen from Figure 7, in macronutrients (Ca Mg), compared with RB, calcium content in leaves and petioles significantly increased by 11.40% and 11.35%, respectively, under RBP, while was significantly decreased under RBY. Compared with RB, under RBG and RBFR, calcium content in celery leaves increased (Figure 7A).
Compared with RB, the magnesium content in leaves and petioles was markedly increased under RBP and RBG treatments, the highest magnesium content was 19.56 mg/g and 16.13 mg/g under RBP treatment, respectively, and compared with RB, the magnesium content in celery petioles was significantly increased under RBFR light treatment (Figure 7B).
In Fe and Zn, the Fe content in leaves and petioles was significantly increased by 8.69% and 18.18% under RBP treatment compared with RB. Compared with RB, the Fe content of celery petiole decreased significantly under RBFR treatment by 25.17% (Figure 7C).
Compared with RB, the zinc content of leaves and petioles increased under RBP and RBFR treatments and decreased under RBY and RBG light treatments without significant differences (Figure 7D).

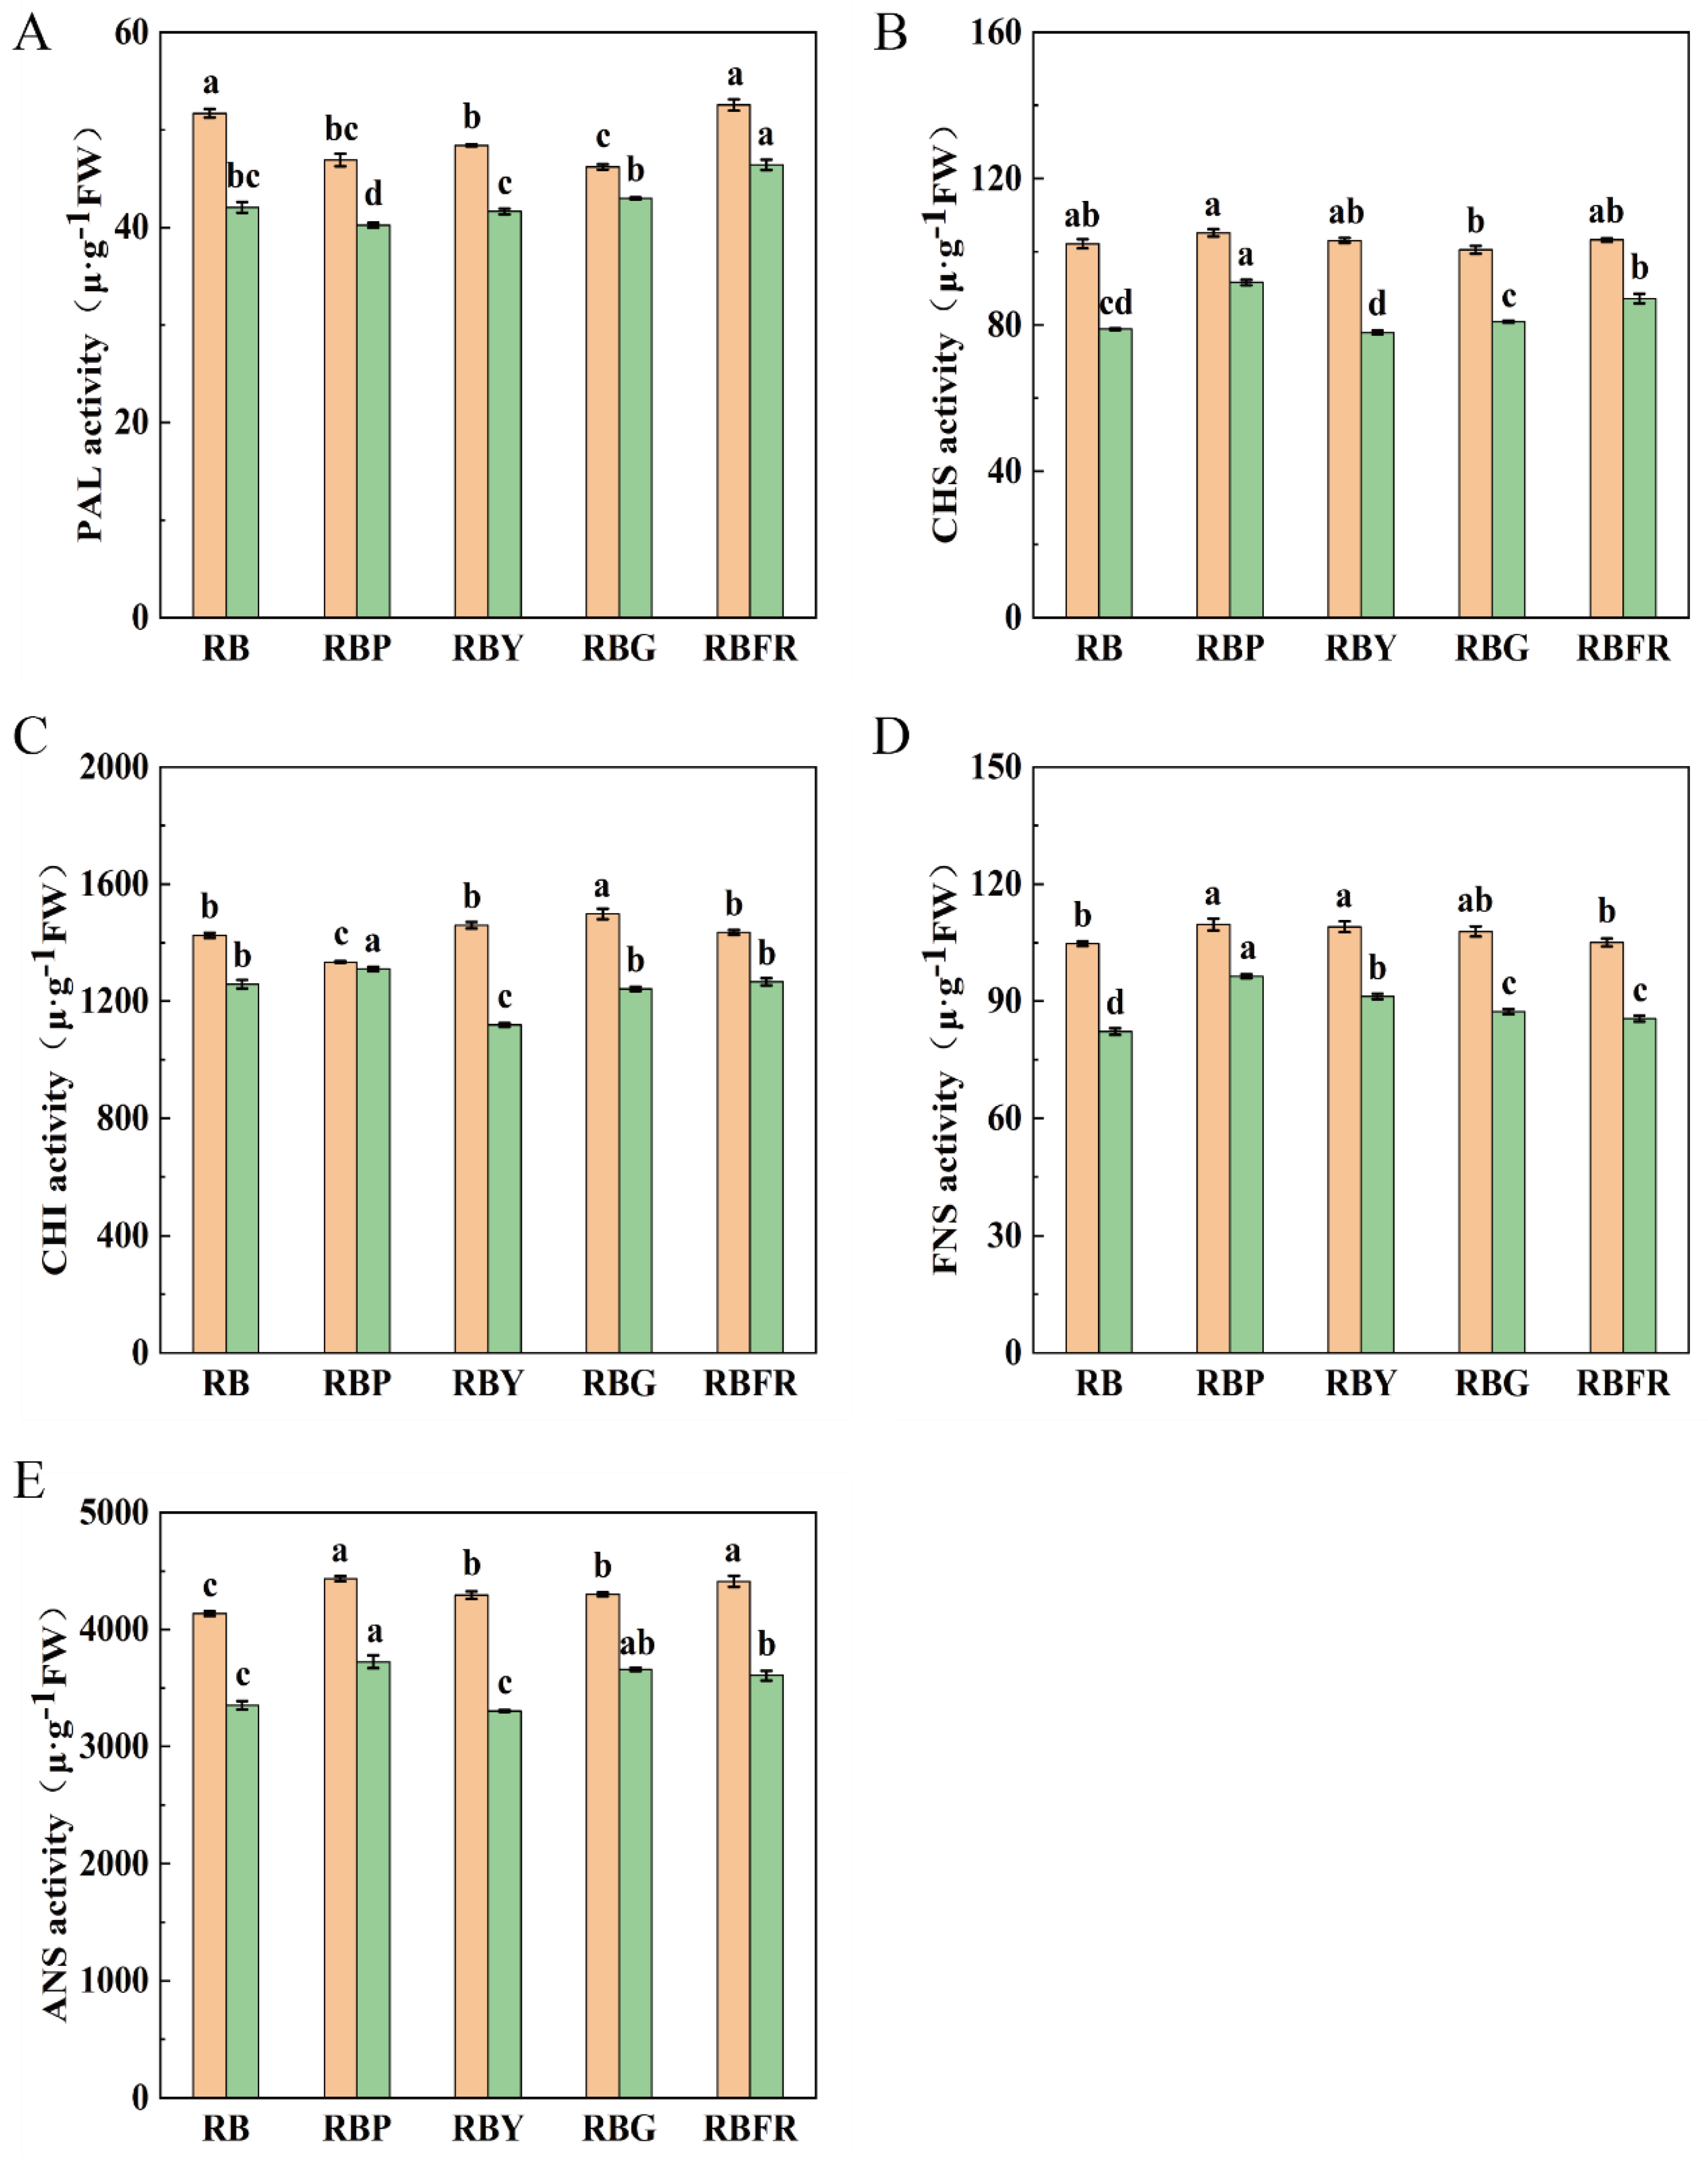
3.6. Flavonoid-Related Enzyme Activities

Figure 8 shows changes in enzyme activity related to flavonoid synthesis of celery under different light quality. As can be seen in Figure 8, the study analyzed the changes in the activities of apigenin and anthocyanin-related enzymes in celery leaves and petioles. The results showed that the activities of enzymes related to flavonoid compound synthesis were higher in both celery leaves than petioles. Compared to RB, the PAL activities of celery leaves and petioles were reduced under the combined light treatments of RBP and RBY, and it was markedly reduced under the RBG treatment, but the PAL activities of petioles were increased. Compared to RB, under RBFR combined light treatment, in leaves and petioles, it was increased by 1.65% and 10.34%, respectively (Figure 8A).
Compared to RB, under RBP and RBFR combined light treatments, the CHS activity in leaves and petioles increased by 2.91% and 16.04% and 1.03% and 1.05%, respectively (Figure 8B).
Except for RBP treatment, other treatments increased the CHI activity of celery leaves compared to RB, in which the CHI activity of celery leaves under RBG treatment was significantly higher than other treatments, increased by 5.11% compared to RB. The CHI activity in celery petioles was significantly reduced under RBY treatment, while the CHI activity in celery petioles under RBP treatment was markedly higher than other treatments, increased by 4.15%, compared to RB (Figure 8C).
Compared to RB, except for RBFR treatment, FNS activities of celery leaves and petioles were increased in all other treatments, with FNS activity of celery leaves under RBP being markedly higher than the other treatments, increased by 4.73% and 17.21%, respectively (Figure 8D).
Compared to RB, ANS activity increased in leaves and petioles under RBP and RBFR treatments, where RBP was markedly higher than the other treatments, by 7.17% and 11.08%, respectively, and ANS activity of celery leaves was significantly higher under RBY (Figure 8E).

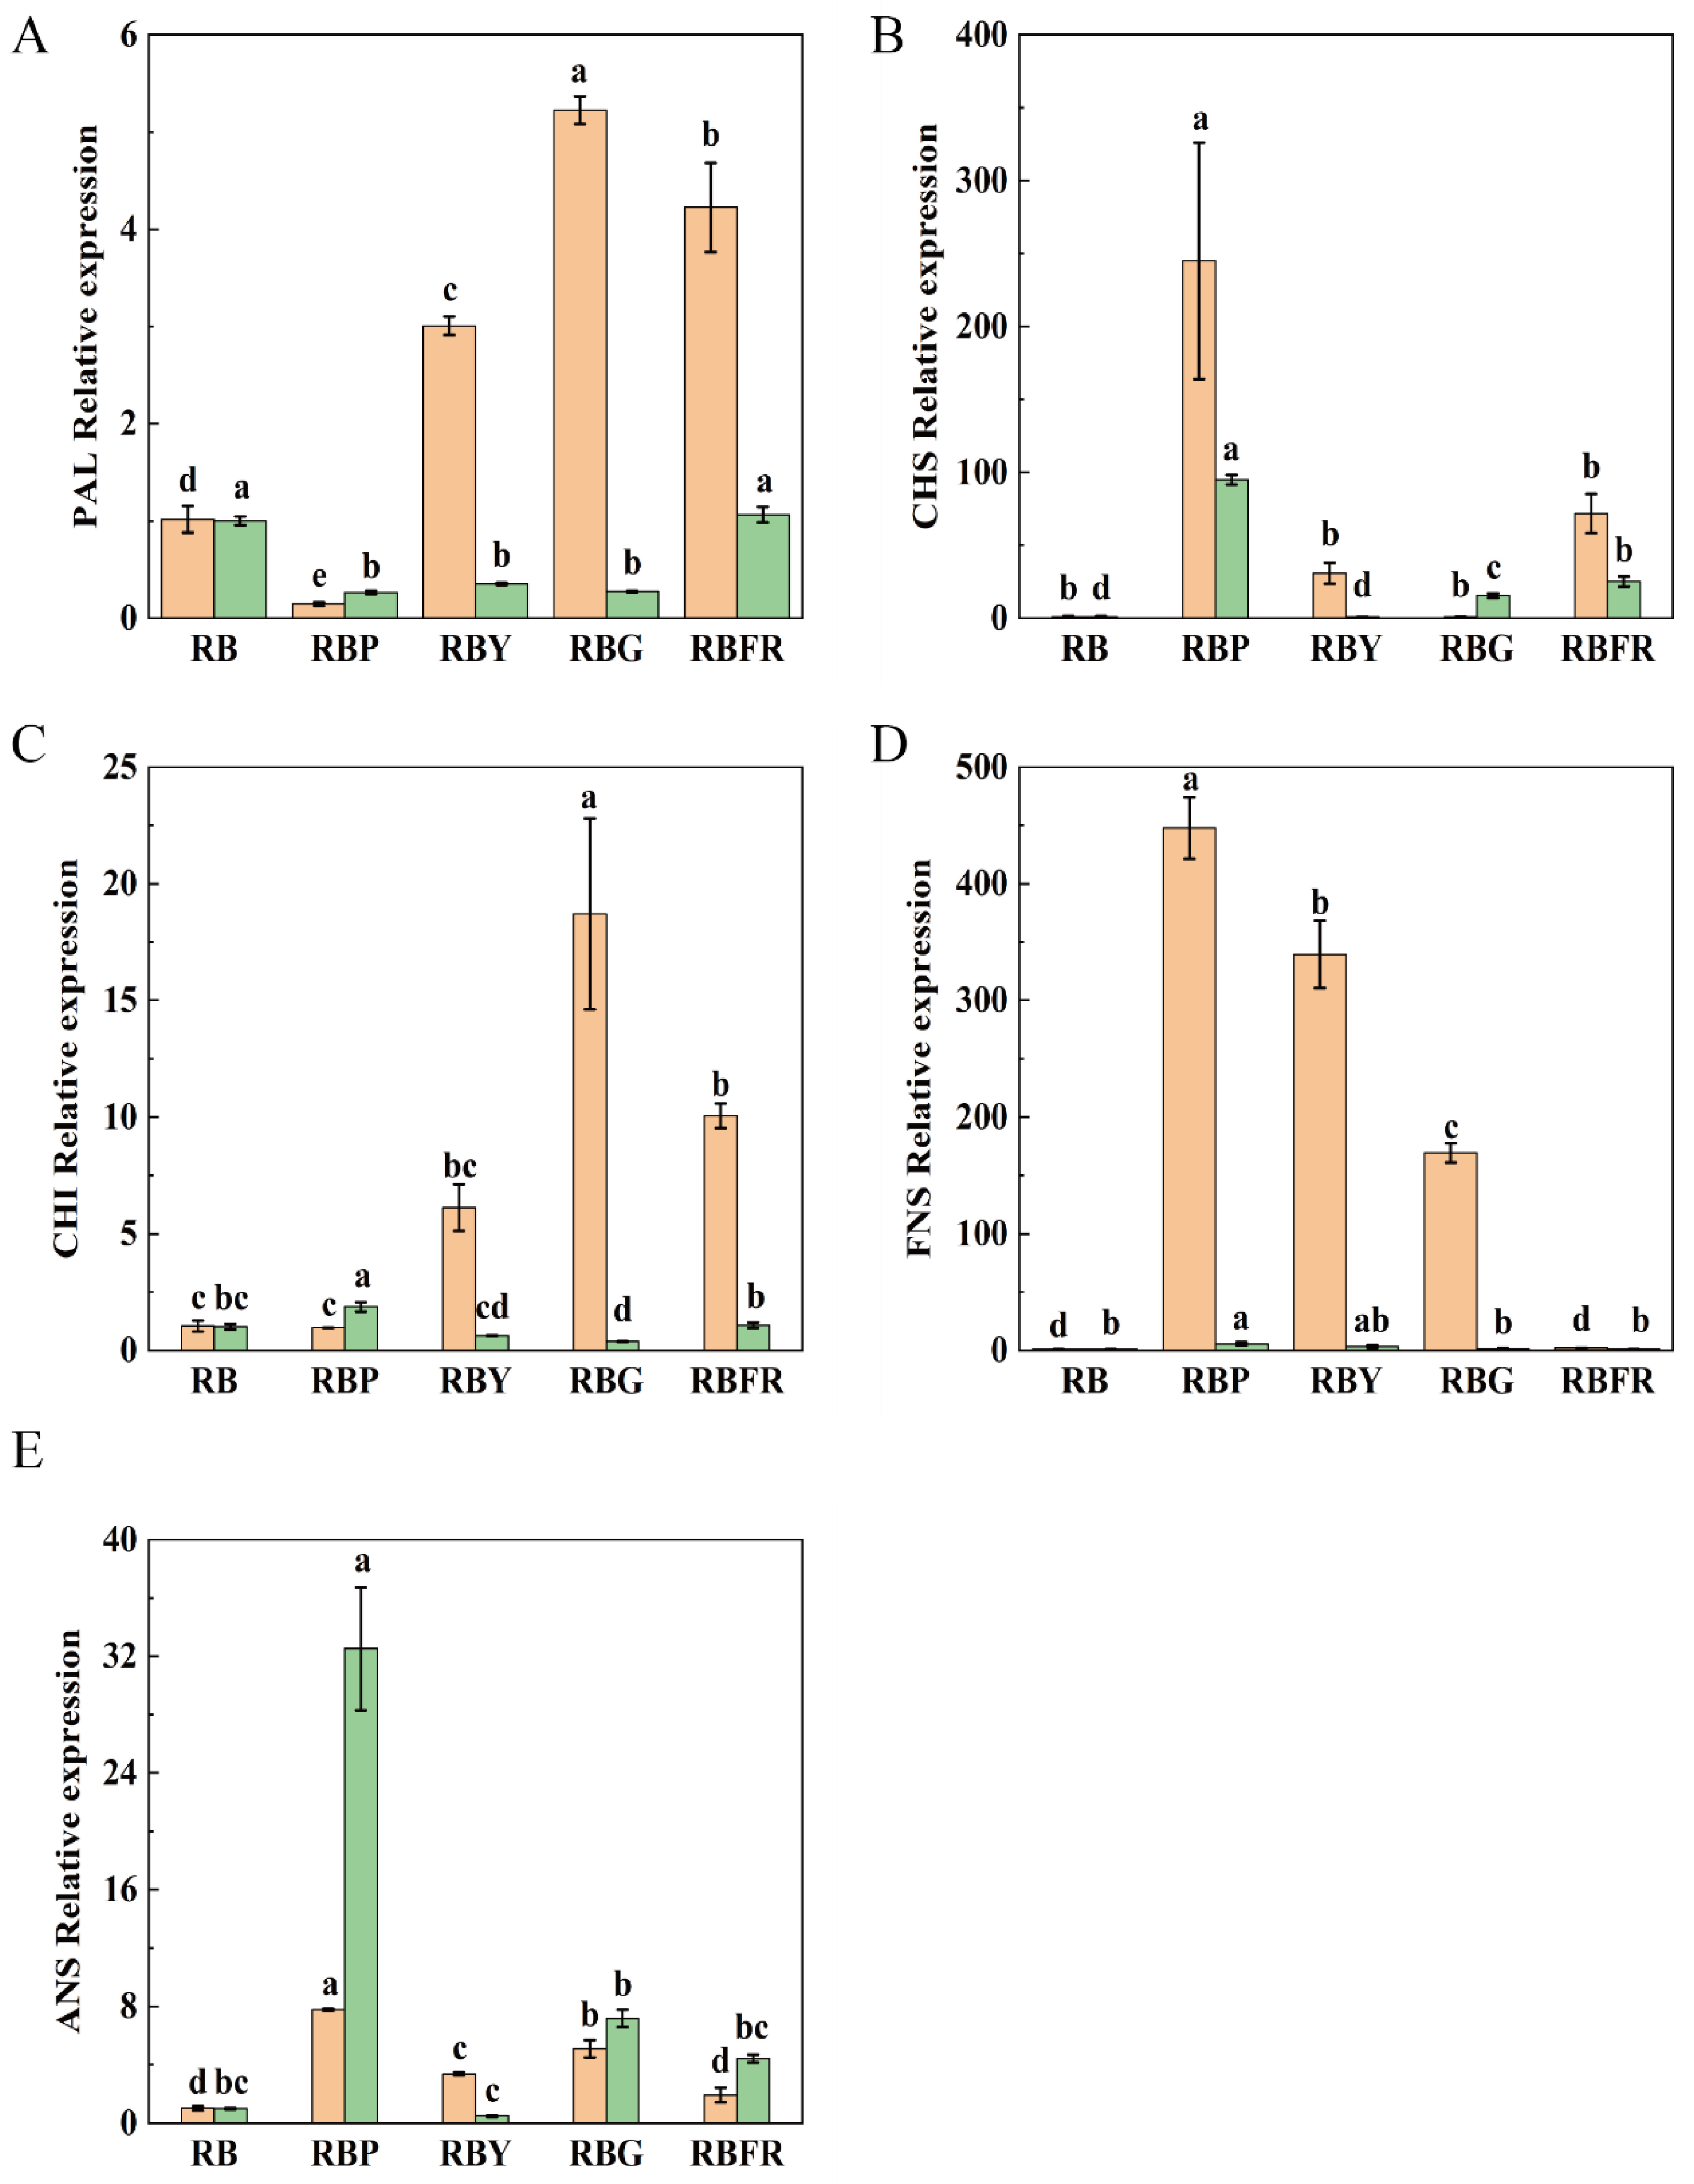
3.7. Expression Analysis of Key Flavonoid-Related Genes

Figure 9 shows effects of different light treatments on genes related to flavonoid synthesis in celery. As can be seen from Figure 9, compared with RB, PAL, and CHI were up-regulated in celery leaves under RBY, RBG, and RBFR light treatments, with high fold expression of PAL and CHI in celery leaves under RBG treatment, while PAL and CHI were down-regulated in celery petioles under RBG and RBY light treatments, compared with RB. Compared with RB, the expression of CHS and ANS was up-regulated in celery leaves and petioles under RBP and RBFR light treatments, and there was a high fold expression of CHS and ANS under RBP treatment, whereas the expression of CHS and ANS in celery petioles was down-regulated under RBY treatment, and the expression of ANS in celery leaves was up-regulated under RBG treatment. FNS expression was up-regulated in celery leaves under RBP, RBG, and RBY treatments compared with RB (Figure 9).

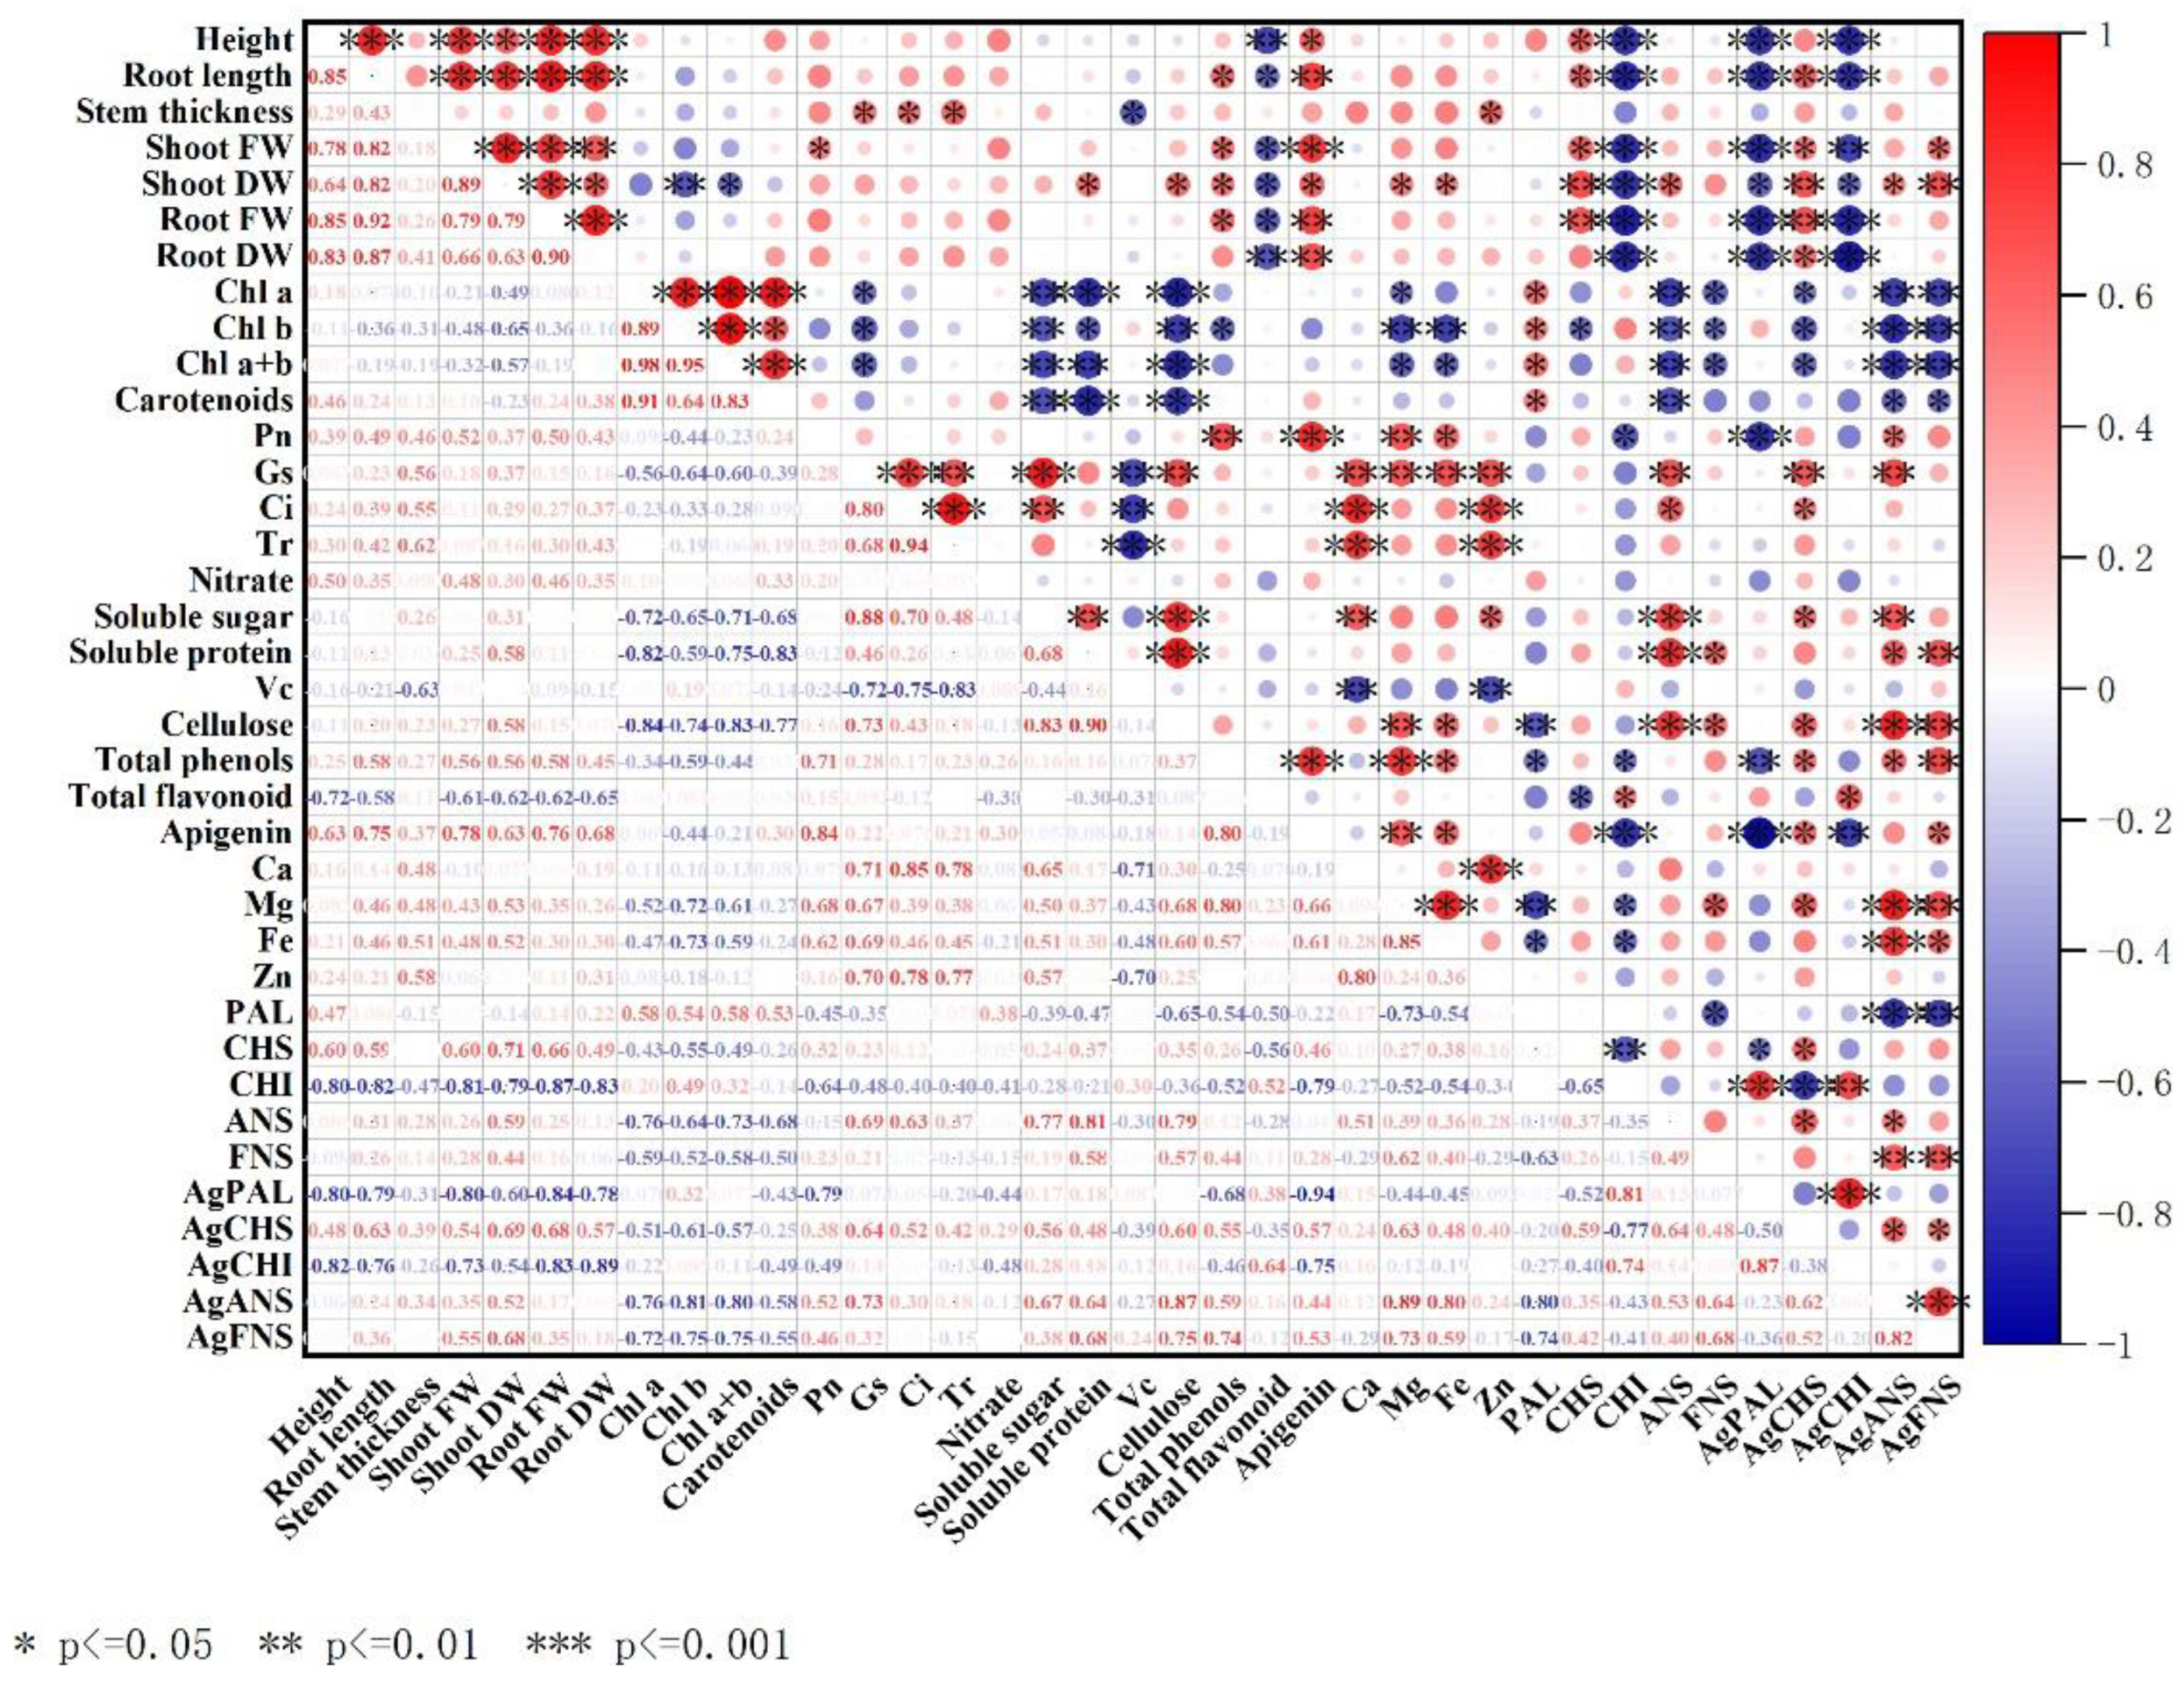
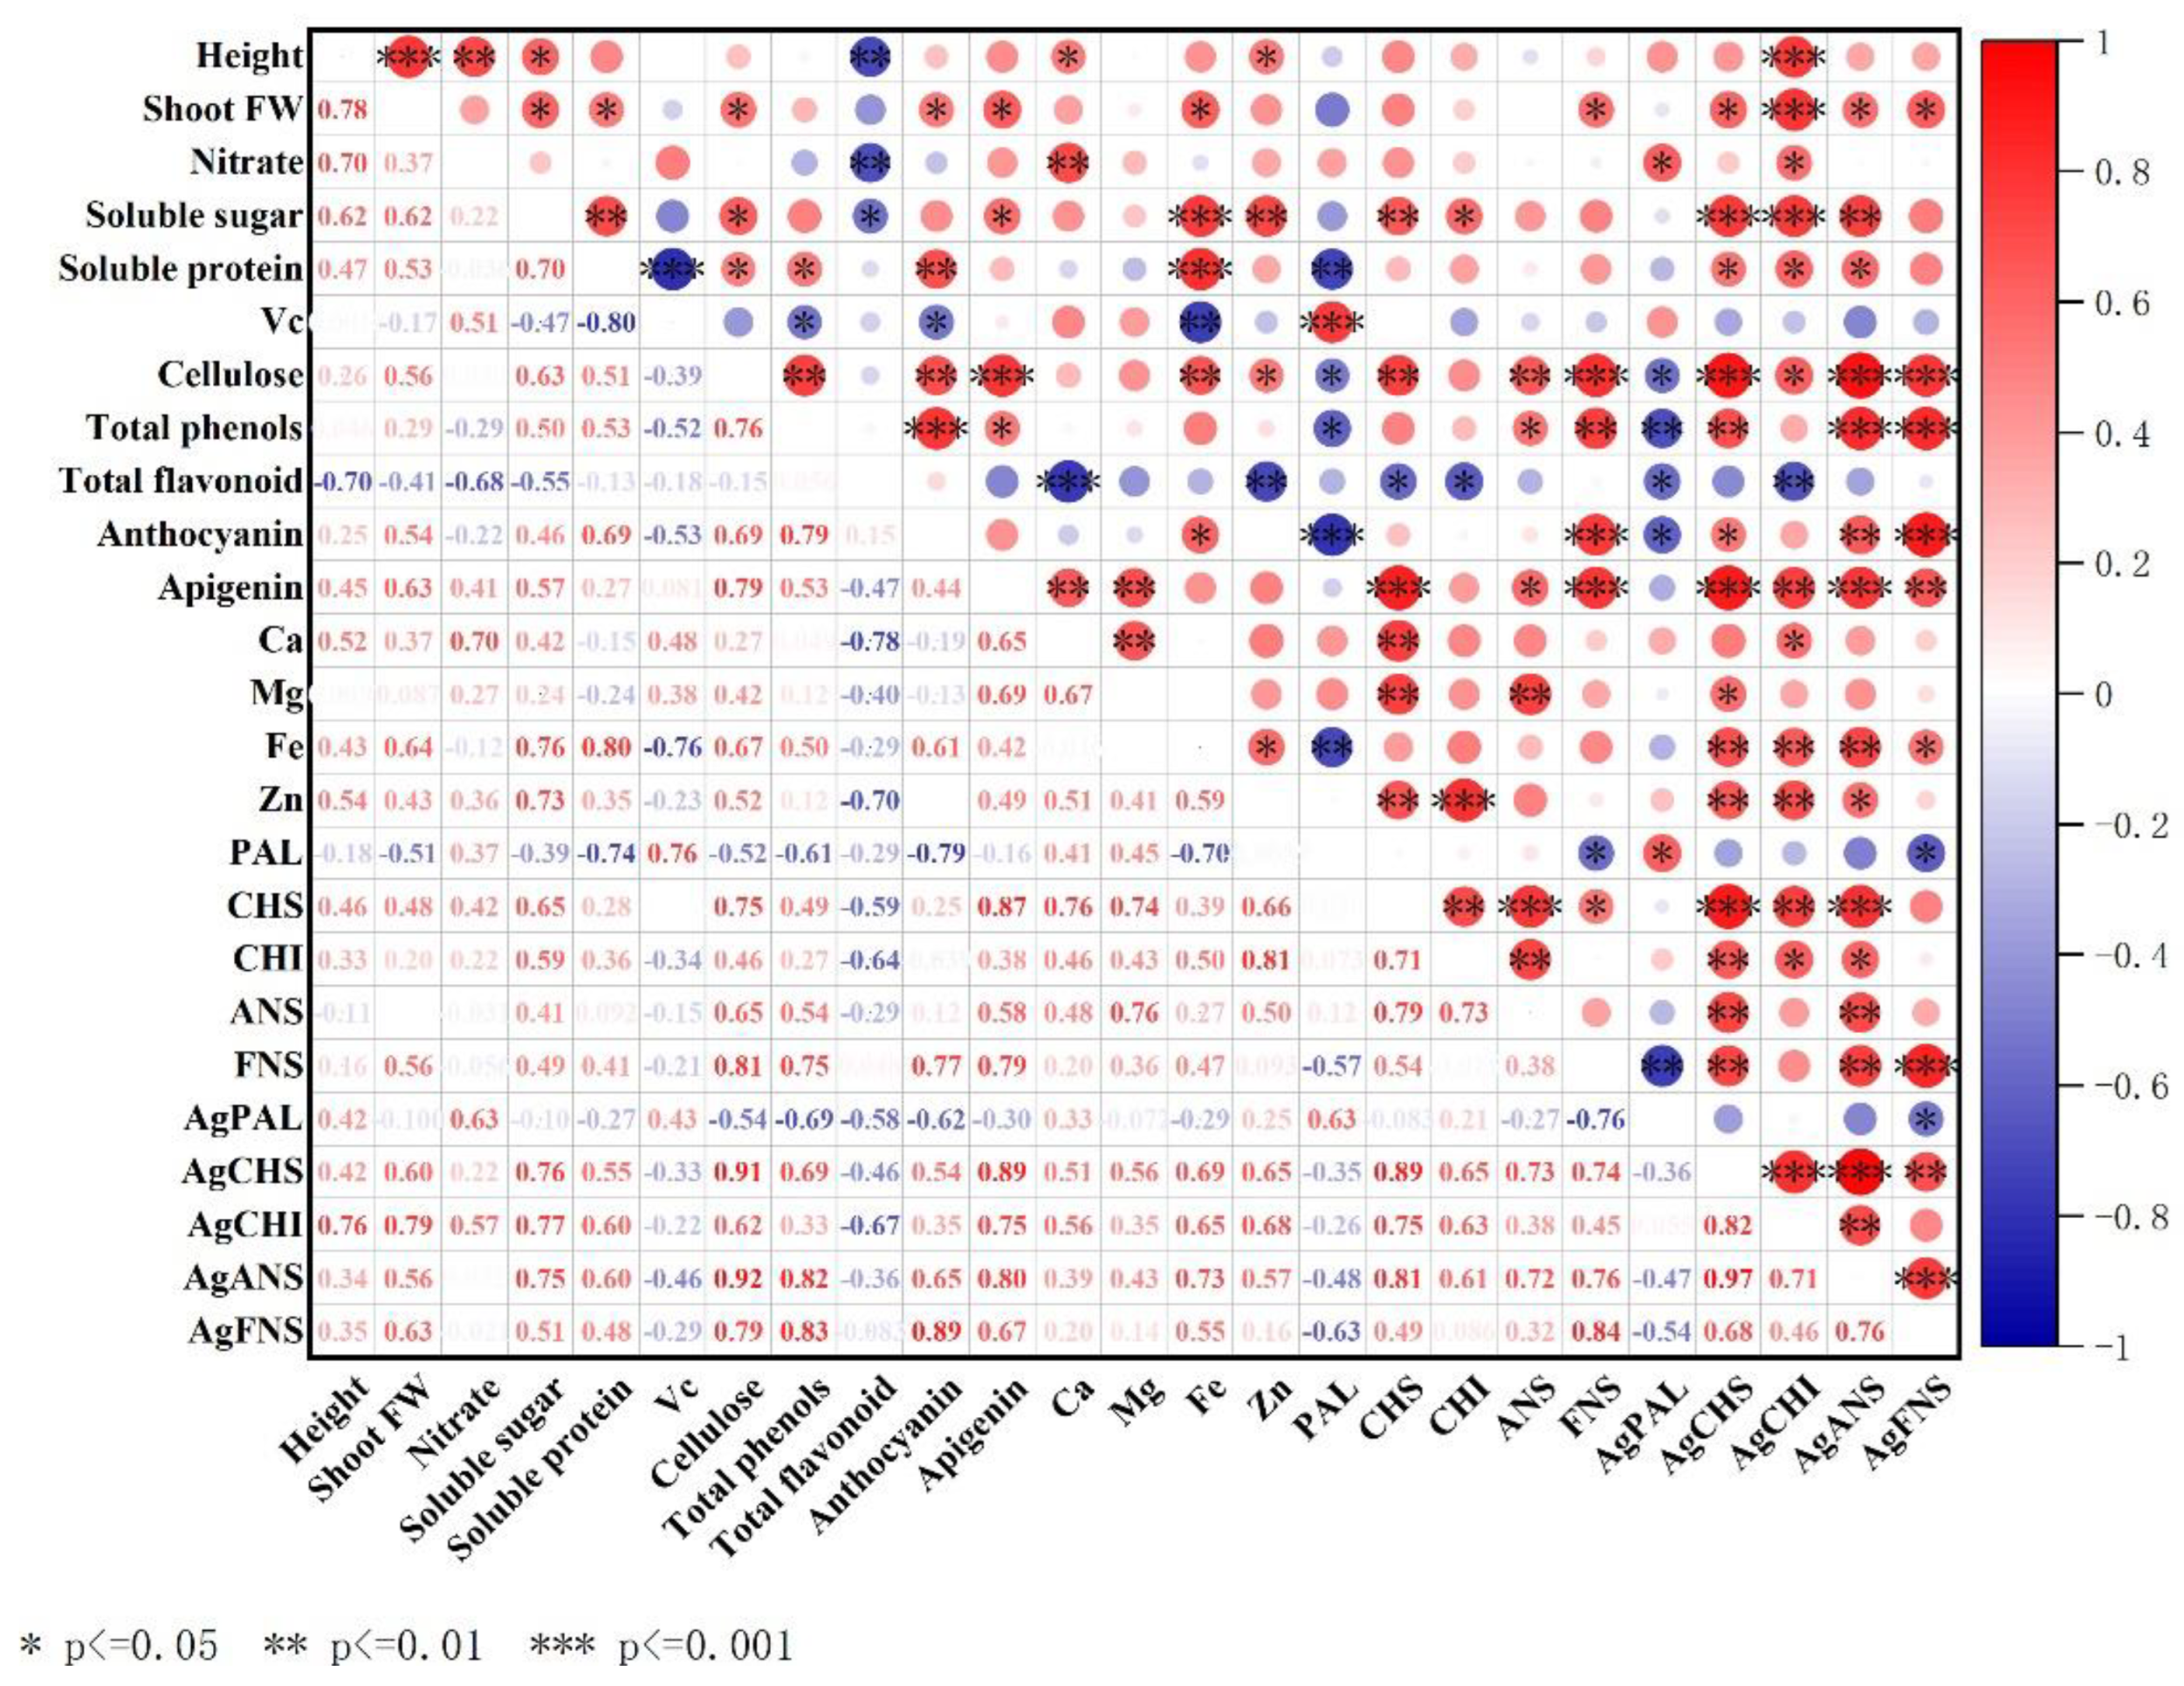
3.8. Correlation Analysis of Celery Leaves and Petioles

In order to understand deeply the relationship between different combinations of light treatments of leaves and petioles on the photosynthetic characteristics and nutritional quality variables of celery, a correlation analysis was carried out. Figure 10 shows correlation analysis of celery leaves. As seen in Figure 10, the results showed that plant height and above-ground fresh weight were significantly positively correlated with apigenin and CHS, and showed significant negative correlation with vitamin C, CHI, PAL, and CHI. Chlorophyll b showed significantly negatively correlated with soluble sugar and soluble protein. Flavonoids, total phenols, and apigenin were significantly positively correlated with Mg, Fe, CHS, and FNS (Figure 10).
Figure 11 shows correlation analysis of celery petioles. As seen in Figure 11, plant height and aboveground fresh weight showed significantly positively correlated with soluble sugars. Total phenols and total flavonoids showed significantly positively correlated with anthocyanins, apigenin, ANS, FNS, and CHS, and significantly negatively correlated with PAL. Vitamin C content was significantly negatively correlated with Ca, Zn, CHS, and CHI (Figure 11).

4. Discussion

4.1. Effects of Different LED Light Quality Combinations on Celery Growth

Light quality plays an important role in plant growth and development. Red light contributes to the development of photosynthetic mechanisms and starch accumulation in plants [55], while blue light is associated with chlorophyll synthesis and stomatal development [56]. Seedlings grown under red and blue light had higher leaf area and fresh weight than yellow and green light [57]. The RB is more beneficial for the growth of vegetables such as chili peppers [58], tomatoes [59], and spinach [60] than monochromatic light. We added a few purple, yellow, green, and FR to RB (3:1), and the experimental results showed that add the right amount of purple light on the basis of RB promoted celery growth, which increased the aboveground dry weight, underground fresh weight and root fresh weight of celery by 85.55%, 24.4%, and 20.35%, respectively, and the RBP was more favorable to celery growth compared with RB. Compared with RB, whether the cause of the increase in plant height under RBP treatment was a result of the combined action of purple and blue light, or purple light triggered an independent response, requires further investigation.

4.2. Effects of Different LED Light Quality Combinations on Celery Quality

Sugar is an important energy storage substance in tissues and major substrate for respiration, and light quality has an important regulatory role in photosynthetic carbon metabolism [61]. The addition of yellow light to RB light favored the increase in potato soluble matter [62], and some studies have found [19] that the addition of far-red and green light combinations to white light similarly increased lettuce soluble sugar content. We added a few purple, yellow, green, and far-red light to RB (3:1), and the experimental results showed that the soluble sugar content of celery petioles decreased significantly under RBG and RBY treatments compared to RB, which is consistent with the results of a previous study [63], the soluble sugar content of celery leaves and petioles was markedly increased under RBP combined light treatment compared to RB. It may be due to the fact that the RBP combination under light facilitates the promotion of photosynthesis and contributes to the synthesis of carbohydrates, resulting in increased soluble sugar content.
One of the key parameters to determine whether leafy vegetables are safe products is to test their nitrate content. Plant carbon and nitrogen metabolism is complex, and research suggests that high soluble sugar content may be key to supporting sustained nitrogen metabolism, thereby reducing nitrate accumulation [64,65,66,67,68]. The study found [69] that the nitrate content of lettuce could be reduced by increasing the activity and expression of nitrate assimilation-related genes, NR and NiR, under the RBG treatment, which is consistent with the results of our experiments. The nitrate content of celery petioles was significantly decreased under the RBG combined light treatment, compared with other treatments’ content was significantly decreased, which may be due to the influence of nitrogen metabolism-related enzyme activities under this light treatment.
Vitamin C plays an important role in plants and is one of the most prominent natural antioxidants [70,71] and is an essential compound for health promotion [72]. Research has shown that red light irradiation can effectively delay postharvest senescence of broccoli [73], while blue and purple lights lead to the highest vitamin C content in broccoli flower buds [74]. The results of this study showed that vitamin C content of celery leaves and petioles was markedly increased under RBP compared to RB and decreased under RBY and RBFR treatments. This indicated that RBP treatment helped to increase the accumulation of vitamin C in celery leaves and petioles.

4.3. Effects of Different LED Light Qualities on Plant Photosynthetic Properties

Light quality not only affects plant growth and development, but also internal physiological and chemical processes. Red and blue light have more studies in the synthesis of photosynthetic pigments in plant chloroplasts as well as photomorphogenesis, but the effects of purple and yellow light on the photosynthetic properties of plants have been less studied. It has been shown that under high white light intensity, additional green light promotes photosynthesis of leaves more effectively than red light and favors the accumulation of photosynthetic pigments [75]. The addition of green light to the light-quality component increases the chlorophyll content of perilla and grape leaves [76,77].
In this experiment, compared with RB, the decrease in photosynthetic pigment content of the plants under RBG treatment, the photosynthetic pigment content of the plants was elevated under RBP treatment, which could be attributed to the differences caused by different plant species, indicating that the appropriate light quality combination is beneficial for promoting photosynthesis in celery.

4.4. Effect of Different LED Light Quality Combinations on Mineral Elements in Celery

Mineral elements play an important role in plant growth and development [76]. In macronutrients (Ca Mg), compared with RB, calcium content in leaves and petioles was significantly increased by 11.40% and 11.35%, respectively, under RBP combined light treatment, while it was significantly decreased under RBY light treatment. Under RBG and RBFR, calcium content in celery leaves was increased.
Magnesium content was markedly increased under RBP and RBG treatments, the highest magnesium content of celery leaves and petioles was 19.56 mg/g and 16.13 mg/g under RBP treatment, respectively, and the RBFR markedly increased the magnesium content in celery petioles.
In Fe and Zn, compared with RB, the Fe content of celery leaves and petioles was significantly increased by 8.69% and 18.18% under RBP treatment. The Fe content of celery petioles significantly decreased under RBFR treatment by 25.17%. Zinc content of celery leaves and petioles increased under RBP and RBFR and decreased under RBY and RBG light treatments without significant differences.

4.5. Effects of Different LED Light Qualities on Flavonoid Compound Synthesis-Related Enzymes and Gene Expression

Total flavonoids and total phenols are secondary metabolites in plants and are indispensable antioxidants [78]. Apigenin and anthocyanins belong to flavonoids, and both anthocyanins and apigenin are equally powerful antioxidants. Most studies have shown that the total phenolic and total flavonoid content of plants increases significantly under blue and UV light [79,80], but there are also varietal and color differences. Short wavelength spectra had a significant effect on anthocyanin biosynthesis. It has been shown that RBG favors the increase in anthocyanin and total flavonoid content in basil [81] and cranberry [82], while decreasing with the increase in green light. In this study, compared to RB, RBP light treatments were favorable to increase the total phenolics and total flavonoids contents of celery leaves and petioles, and to promote the synthesis of anthocyanins in celery petioles, and the total phenolics and total flavonoids contents of celery leaves and petioles were the highest under the irradiation of RBP combined light. This may be due to the increase in the proportion of short-wave regions in the red-blue combined light. Meanwhile, the anthocyanin content of celery leaves was negligible, which might be related to the leaf color of celery.
Flavonoids have important physiological functions in plants, including antioxidant, antibacterial, and anti-cancer. Flavonoid synthase is a key enzyme in the synthesis of flavonoids, and the activity of flavonoid synthase is affected by a variety of factors, among which light quality is one of the important influencing factors [83].
The pathway of flavonoid synthesis is regulated by various enzymes such as PAL, CHS, CHI, FNS, and FLS. These enzymes are induced both directly and indirectly under light conditions, and a number of recent studies have shown that each plant usually takes up its maximum secondary metabolites independently according to specific light requirements. For example, the study [84] showed that red light promoted the expression of the flavonoid synthesis pathway genes PAL and CHS in Arabidopsis, thereby increasing flavonoid synthesis, whereas blue light inhibited the expression of these genes, leading to a decrease in flavonoids.
In this study, PAL activity was increased under RBFR treatment compared to RB, CHS and ANS activities were increased under RBP and RBFR in celery leaves and petioles, CHI activity of celery leaves under RBG was markedly higher, and FNS activity of celery leaves under RBP was markedly higher than the other treatments.

5. Conclusions

RBP treatment significantly improved the yield and quality of celery. Calcium content in leaves and petioles of celery was significantly increased by 11.40% and 11.35%, respectively, under RBP treatment. RBP treatment also reduced nitrate content. Nitrate content in celery leaves and petioles was reduced by 98.28% and 25.73%, respectively. The content of nitrate and cellulose in celery leaves was lower than that in petioles, and the content of other nutrients in leaves was higher than that in petioles. The activities of CHS, ANS and FNS in celery leaves and petioles were significantly increased under RBP treatment. The expressions of CHS, ANS, and FNS was upregulated in celery leaves and petioles under RBP treatment, and there was a high fold expression of CHS and ANS. The expression of CHS and ANS was downregulated in celery petioles under RBY treatment. Correlation analysis showed that RBP was the best light combination to improve the yield and quality of celery.

Author Contributions

K.L., formal analysis, writing—original draft; L.T., methodology, writing—original draft; Q.C., investigation, data curation; Y.L., methodology; L.S., conceptualization; S.C., conceptualization; Z.H., project administration, writing—review and editing; X.Z., writing—review and editing. All authors have read and agreed to the published version of the manuscript.

Funding

This study was supported by the Sichuan Luzhou expert workstation (2322339013).

Data Availability Statement

The original contributions presented in the study are included in the article. Further inquiries can be directed to the corresponding author.

Acknowledgments

The authors are thankful to the Sichuan Luzhou expert workstation (2322339013) for financial support.

Conflicts of Interest

The authors declare that the research was conducted in the absence of any commercial or financial relationships that could be construed as a potential conflict of interest.

References

  1. Kooti, W.; Daraei, N. A Review of the Antioxidant Activity of Celery (Apium graveolens L). J. Evid. Based Complement. Altern. Med. 2017, 22, 1029–1034. [Google Scholar] [CrossRef] [PubMed]
  2. Feng, K.; Hou, X.L.; Li, M.Y.; Jiang, Q.; Xu, Z.S.; Liu, J.X.; Xiong, A.S. CeleryDB: A genomic database for celery. Database 2018, 2018, bay070. [Google Scholar] [CrossRef]
  3. Sowbhagya, H.B. Chemistry, technology, and nutraceutical functions of celery (Apium graveolens L.): An overview. Crit. Rev. Food Sci. Nutr. 2014, 54, 389–398. [Google Scholar] [CrossRef] [PubMed]
  4. Dianat, M.; Veisi, A.; Ahangarpour, A.; Fathi Moghaddam, H. The effect of hydro-alcoholic celery (Apiumgraveolens) leaf extract on cardiovascular parameters and lipid profile in animal model of hypertension induced by fructose. Avicenna J. Phytomedicine 2015, 5, 203–209. [Google Scholar]
  5. Singh, M.; Nara, U.; Kaur, K.; Rani, N.; Jaswal, R. Genetic, genomic and biochemical insights of celery (Apium graveolens L.) in the era of molecular breeding. J. Appl. Res. Med. Aromat. Plants 2022, 31, 100420. [Google Scholar] [CrossRef]
  6. Jiang, L.; Liu, Z.G.; Cui, Y.L.; Shao, Y.; Tao, Y.D.; Mei, L.J. Apigenin from daily vegetable celery can accelerate bone defects healing. J. Funct. Foods 2019, 54, 412–421. [Google Scholar] [CrossRef]
  7. Tang, Y.K.; Mao, R.X.; Guo, S.S. Effects of LED spectra on growth, gas exchange, antioxidant activity and nutritional quality of vegetable species. Life Sci. Space Res. 2020, 26, 77–84. [Google Scholar] [CrossRef]
  8. Hammock, H.A.; Kopsell, D.A.; Sams, C.E. Application timing and duration of LED and HPS supplements differentially influence yield, nutrient bioaccumulation, and light use efficiency of greenhouse basil across seasons. Front. Plant Sci. 2023, 14, 1174823. [Google Scholar] [CrossRef]
  9. Sena, S.; Kumari, S.; Kumar, V.; Husen, A. Light emitting diode (LED) lights for the improvement of plant performance and production: A comprehensive review. Curr. Res. Biotechnol. 2024, 7, 100184. [Google Scholar] [CrossRef]
  10. Demotes-Mainard, S.; Péron, T.; Corot, A.; Bertheloot, J.; Gourrierec, J.L.; Pelleschi-Travier, S.; Crespel, L.; Morel, P.; Huché-Thélier, L.; Boumaza, R.; et al. Plant responses to red and far-red lights, applications in horticulture. Environ. Exp. Bot. 2016, 121, 4–21. [Google Scholar] [CrossRef]
  11. Bantis, F.; Smirnakou, S.; Ouzounis, T.; Koukounaras, A.; Ntagkas, N.; Radoglou, K. Current status and recent achievements in the field of horticulture with the use of light-emitting diodes (LEDs). Sci. Hortic. 2018, 235, 437–451. [Google Scholar] [CrossRef]
  12. Kohler, A.E.; Lopez, R.G. Duration of light-emitting diode (LED) supplemental lighting providing far-red radiation during seedling production influences subsequent time to flower of long-day annuals. Sci. Hortic. 2021, 281, 109956. [Google Scholar] [CrossRef]
  13. Jung, W.S.; Chung, I.M.; Hwang, M.H.; Kim, S.H.; Yu, C.Y.; Ghimire, B.K. Application of Light-Emitting Diodes for Improving the Nutritional Quality and Bioactive Compound Levels of Some Crops and Medicinal Plants. Molecules 2021, 26, 1477. [Google Scholar] [CrossRef]
  14. Demir, K.; Sarıkamış, G.; Çakırer Seyrek, G. Effect of LED lights on the growth, nutritional quality and glucosinolate content of broccoli, cabbage and radish microgreens. Food Chem. 2023, 401, 134088. [Google Scholar] [CrossRef] [PubMed]
  15. Hu, M.C.; Chen, Y.H.; Huang, L.H. A sustainable vegetable supply chain using plant factories in Taiwanese markets: A Nash–Cournot model. Int. J. Prod. Econ. 2014, 152, 49–56. [Google Scholar] [CrossRef]
  16. Zhou, Z.W.; Zhang, N.M.; Chen, J.Y.; Zhou, X.J.; Molokeev, M.S.; Guo, C.F. The Vis-NIR multicolor emitting phosphor Ba4Gd3Na3(PO4)6F2: Eu2+, Pr3+ for LED towards plant growth. J. Ind. Eng. Chem. 2018, 65, 411–417. [Google Scholar] [CrossRef]
  17. Sun, T.H.; Wang, P.; Rao, S.; Zhou, X.S.; Wrightstone, E.; Lu, S.; Yuan, H.; Yang, Y.; Fish, T.; Thannhauser, T.; et al. Co-chaperoning of chlorophyll and carotenoid biosynthesis by ORANGE family proteins in plants. Mol. Plant 2023, 16, 1048–1065. [Google Scholar] [CrossRef]
  18. Zou, H.C.; Li, C.Z.; Zhang, A.Y.; Zhang, X.P.; Chen, X.D.; Wang, F.Q.; Yan, Y.Y.; Zhang, S.A. Light environment control for reducing energy loss and increasing crop yield in plant factories. Sol. Energy 2024, 268, 112281. [Google Scholar] [CrossRef]
  19. He, R.; Zhang, Y.T.; Song, S.W.; Su, W.; Hao, Y.W.; Liu, H.C. UV-A and FR irradiation improves growth and nutritional properties of lettuce grown in an artificial light plant factory. Food Chem. 2020, 345, 128727. [Google Scholar] [CrossRef]
  20. Rodriguez-Concepcion, M.; Avalos, J.; Bonet, M.L.; Boronat, A.; Gomez-Gomez, L.; Hornero-Mendez, D.; Limon, M.C.; Meléndez-Martínez, A.J.; Olmedilla-Alonso, B.; Palou, A.; et al. A global perspective on carotenoids: Metabolism, biotechnology, and benefits for nutrition and health. Prog. Lipid Res. 2018, 70, 62–93. [Google Scholar] [CrossRef]
  21. Mitra, S.; Rauf, A.; Tareq, A.M.; Jahan, S.; Emran, T.B.; Shahriar, T.G.; Dhama, K.; Alhumaydhi, F.A.; Aljohani, A.S.M.; Rebezov, M.; et al. Potential health benefits of carotenoid lutein: An updated review. Food Chem. Toxicol. 2021, 154, 112328. [Google Scholar] [CrossRef] [PubMed]
  22. Swapnil, P.; Meena, M.; Singh, S.K.; Dhuldhaj, U.P.; Harish; Marwal, A. Vital roles of carotenoids in plants and humans to deteriorate stress with its structure, biosynthesis, metabolic engineering and functional aspects. Curr. Plant Biol. 2021, 26, 100203. [Google Scholar] [CrossRef]
  23. Zhang, R.X.; Zhang, N.N.; Wang, Y.X.; Khan, A.B.I.D.; Ma, S.; Bai, X.; Zeng, Q.; Pan, Q.M.; Li, B.H.; Zhang, L.G. Blue light induces leaf color change by modulating carotenoid metabolites in orange-head Chinese cabbage (Brassica rapa L. ssp. pekinensis). J. Integr. Agric. 2023, 22, 3296–3311. [Google Scholar] [CrossRef]
  24. Li, Q.; Kubota, C. Effects of supplemental light quality on growth and phytochemicals of baby leaf lettuce. Environ. Exp. Bot. 2009, 67, 59–64. [Google Scholar] [CrossRef]
  25. Monostori, I.; Heilmann, M.; Kocsy, G.; Rakszegi, M.; Ahres, M.; Altenbach, S.B.; Szalai, G.; Pál, M.; Toldi, D.; Simon-Sarkadi, L.; et al. LED Lighting—Modification of Growth, Metabolism, Yield and Flour Composition in Wheat by Spectral Quality and Intensity. Front. Plant Sci. 2018, 9, 605. [Google Scholar] [CrossRef]
  26. Johkan, M.; Shoji, K.; Goto, F.; Hahida, S.; Yoshihara, T. Effect of green light wavelength and intensity on photomorphogenesis and photosynthesis in Lactuca sativa. Environ. Exp. Bot. 2012, 75, 128–133. [Google Scholar] [CrossRef]
  27. Xie, C.Y.; Tang, J.; Xiao, J.X.; Geng, X.; Guo, L.P. Purple light-emitting diode (LED) lights controls chlorophyll degradation and enhances nutraceutical quality of postharvest broccoli florets. Sci. Hortic. 2022, 294, 110768. [Google Scholar] [CrossRef]
  28. Li, Y.; Xin, G.F.; Wei, M.; Shi, Q.H.; Yang, F.J.; Wang, X.F. Carbohydrate accumulation and sucrose metabolism responses in tomato seedling leaves when subjected to different light qualities. Sci. Hortic. 2017, 225, 490–497. [Google Scholar] [CrossRef]
  29. Shafiq, I.; Hussain, S.; Raza, M.A.; Iqbal, N.; Asghar, M.A.; Raza, A.; Fan, Y.F.; Mumtaz, M.; Shoaib, M.; Ansar, M.; et al. Crop photosynthetic response to light quality and light intensity. J. Integr. Agric. 2021, 20, 4–23. [Google Scholar] [CrossRef]
  30. Trouwborst, G.; Hogewoning, S.W.; Kooten, O.V.; Harbinson, J.; Ieperen, W.V. Plasticity of photosynthesis after the ‘red light syndrome’in cucumber. Environ. Exp. Bot. 2016, 121, 75–82. [Google Scholar] [CrossRef]
  31. Liu, M.X.; Xu, Z.G.; Yang, Y.; Feng, Y.J. Effects of different spectral lights on Oncidium PLBs induction, proliferation, and plant regeneration. Plant Cell, Tissue Organ Cult. 2011, 106, 1–10. [Google Scholar]
  32. Silva, T.D.; Batista, D.S.; Fortini, E.A.; Castro, K.M.; Felipe, S.H.S.; Fernandes, A.M.; Sousa, R.M.J.; Chagas, K.; Silva, J.V.S.D.; Correia, L.N.F.; et al. Blue and red light affects morphogenesis and 20-hydroxyecdisone content of in vitro Pfaffia glomerata accessions. J. Photochem. Photobiol. B 2020, 203, 111761. [Google Scholar] [CrossRef] [PubMed]
  33. Paradiso, R.; Proietti, S. Light-Quality Manipulation to Control Plant Growth and Photomorphogenesis in Greenhouse Horticulture: The State of the Art and the Opportunities of Modern LED Systems. J. Plant Growth Regul. 2022, 41, 742–780. [Google Scholar] [CrossRef]
  34. Arena, C.; Tsonev, T.; Doneva, D.; De Micco, V.; Michelozzi, M.; Brunetti, C.; Centritto, M.; Fineschi, S.; Velikova, V.; Loreto, F. The effect of light quality on growth, photosynthesis, leaf anatomy and volatile isoprenoids of a monoterpene-emitting herbaceous species (Solanum lycopersicum L.) and an isoprene-emitting tree (Platanus orientalis L.). Environ. Exp. Bot. 2016, 130, 122–132. [Google Scholar] [CrossRef]
  35. Kim, H.H.; Goins, G.D.; Wheeler, R.M.; Sager, J.C. Stomatal conductance of lettuce grown under or exposed to different light qualities. Ann. Bot. 2004, 94, 691–697. [Google Scholar] [CrossRef] [PubMed]
  36. Zhang, R.X.; He, Q.Q.; Pan, Q.M.; Feng, Y.Z.; Shi, Y.; Li, G.Z.; Zhang, Y.; Liu, Y.L.; Khan, A. Blue-green light treatment enhances the quality and nutritional value in postharvest Chinese cabbage (Brassica rapa L. ssp. pekinensis). Food Chem. X 2024, 24, 102004. [Google Scholar] [CrossRef]
  37. Liu, H.; Fu, Y.M.; Hu, D.W.; Yu, J.; Liu, H. Effect of green, yellow and purple radiation on biomass, photosynthesis, morphology and soluble sugar content of leafy lettuce via spectral wavebands “knock out”. Sci. Hortic. 2018, 236, 10–17. [Google Scholar] [CrossRef]
  38. Kołton, A.; Długosz-Grochowska, O.; Wojciechowska, R.; Czaja, M. Biosynthesis Regulation of Folates and Phenols in Plants. Sci. Hortic. 2021, 291, 110561. [Google Scholar] [CrossRef]
  39. Jaakola, L. New insights into the regulation of anthocyanin biosynthesis in fruits. Trends Plant Sci. 2013, 18, 477–483. [Google Scholar] [CrossRef]
  40. Samuolienė, G.; Sirtautas, R.; Brazaitytė, A.; Duchovskis, P. LED lighting and seasonality effects antioxidant properties of baby leaf lettuce. Food Chem. 2012, 134, 1494–1499. [Google Scholar] [CrossRef]
  41. Son, K.H.; Lee, J.H.; Oh, Y.; Kim, D.; Oh, M.M.; In, B.C. Growth and Bioactive Compound Synthesis in Cultivated Lettuce Subject to Light-quality Changes. HortScience 2017, 52, 584–591. [Google Scholar] [CrossRef]
  42. Liu, Y.; Fang, S.Z.; Yang, W.X.; Shang, X.L.; Fu, X.X. Light quality affects flavonoid production and related gene expression in Cyclocarya paliurus. J. Photochem. Photobiol. B. 2018, 179, 66–73. [Google Scholar] [CrossRef] [PubMed]
  43. Chen, X.L.; Wang, L.C.; Li, Y.L.; Yang, Q.C.; Guo, W.Z. Alternating red and blue irradiation affects carbohydrate accumulation and sucrose metabolism in butterhead lettuce. Sci. Hortic. 2022, 302, 111177. [Google Scholar] [CrossRef]
  44. Li, M.Y.; Li, J.; Xie, F.J.; Zhou, J.; Sun, Y.; Luo, Y.; Zhang, Y.; Chen, Q.; Wang, Y.; Lin, Y.X.; et al. Combined evaluation of agronomic and quality traits to explore heat germplasm in celery (Apium graveolens L.). Sci. Hortic. 2023, 317, 112039. [Google Scholar] [CrossRef]
  45. Li, H.Q.; Sun, H.; Li, M.Z. Prediction of soluble sugar content in cabbage by near infrared spectrometer. Spectrosc. Spectr. Anal. 2018, 38, 3058–3063. [Google Scholar]
  46. Cataldo, D.A.; Maroon, M.; Schrader, L.E.; Youngs, V.L. Communications in soil science and plant analysis rapid colorimetric determination of nitrate in plant tissue by nitration of salicylic acid. Commun. Soil Sci. Plant Anal. 1975, 6, 71–80. [Google Scholar] [CrossRef]
  47. Chen, G.; Mo, L.; Li, S.; Zhou, W.T.; Wang, H.; Liu, J.X.; Yang, C.M. Separation and determination of reduced vitamin C in polymerized hemoglobin-based oxygen carriers of the human placenta. Artif. Cells Nanomed. Biotechnol. 2015, 43, 152–156. [Google Scholar] [CrossRef]
  48. Antia, B.S.; Akpan, E.J.; Okon, P.A.; Umoren, I.U. Nutritive and anti-nutritive evaluation of sweet potatoes (Ipomoea batatas) leaves. Pakistan J. Nutr. 2006, 5, 166–168. [Google Scholar] [CrossRef]
  49. Singleton, V.L.; Orthofer, R.; Lamuela-Raventós, R.M. Analysis of total phenols and other oxidation substrates and antioxidants by means of Folin-Ciocalteu reagent. Methods Enzymol. 1999, 299, 152–178. [Google Scholar]
  50. Shin, Y.K.; Bhandari, S.R.; Jo, J.S.; Song, J.W.; Cho, M.C.; Yang, E.Y.; Lee, J.G. Rsponse to salt stress in lettuce: Changes in chlorophyll fluorescence parameters, phytochemical contents, and antioxidant activities. Agronomy 2020, 10, 1627. [Google Scholar] [CrossRef]
  51. Li, Y.Y.; Mao, K.; Zhao, C.; Zhao, X.Y.; Zhang, H.L.; Shu, H.Y.; Hao, Y.J. MdCOP1 ubiquitin E3 ligases interact with MdMYB1 to regulate light-induced anthocyanin biosynthesis and red fruit coloration in apple. Plant Physiol. 2012, 160, 1011–1022. [Google Scholar] [CrossRef]
  52. Tan, G.F.; Ma, J.; Zhang, X.Y.; Xu, Z.S.; Xiong, A.S. AgFNS overexpression increase apigenin and decrease anthocyanins in petioles of transgenic celery. Plant Sci. 2017, 263, 31–38. [Google Scholar] [CrossRef] [PubMed]
  53. Yan, J.; Yu, L.; Xu, S.; Gu, W.H.; Zhu, W.M. Apigenin accumulation and expression analysis of apigenin biosynthesis relative genes in celery. Sci. Hortic. 2014, 165, 218–224. [Google Scholar] [CrossRef]
  54. Xie, Y.D.; Su, L.H.; He, Z.Q.; Zhang, J.W.; Tang, Y. Selenium Inhibits Cadmium Absorption and Improves Yield and Quality of Cherry Tomato (Lycopersicon esculentum) Under Cadmium Stress. J. Soil Sci. Plant Nutr. 2021, 21, 1125–1133. [Google Scholar] [CrossRef]
  55. Johkan, M.; Shoji, K.; Goto, F.; Hashida, S.N.; Yoshihara, T. Blue light-emitting diode light irradiation of seedlings improves seedling quality and growth after transplanting in red leaf lettuce. HortScience 2010, 45, 1809–1814. [Google Scholar] [CrossRef]
  56. Bian, Z.H.; Yang, Q.C.; Liu, W.K. Effects of light quality on the accumulation of phytochemicals in vegetables produced in controlled environments: A review. J. Sci. Food Agric. 2015, 95, 869–877. [Google Scholar] [CrossRef] [PubMed]
  57. Su, N.; Wu, Q.; Shen, Z.G.; Xia, K.; Cui, J. Effects of light quality on the chloroplastic ultrastructure and photosynthetic characteristics of cucumber seedlings. Plant Growth Regul. 2014, 73, 227–235. [Google Scholar] [CrossRef]
  58. Kim, D.; Moon, T.; Kwon, S.; Hwang, I.; Son, J.E. Supplemental inter-lighting with additional far-red to red and blue light increases the growth and yield of greenhouse sweet peppers (Capsicum annuum L.) in winter. Hortic. Environ. Biotechnol. 2022, 64, 83–95. [Google Scholar] [CrossRef]
  59. Kaiser, E.; Ouzounis, T.; Giday, H.; Schipper, R.; Heuvelink, E.; Marcelis, L.F.M. Adding Blue to Red Supplemental Light Increases Biomass and Yield of Greenhouse-Grown Tomatoes, but Only to an Optimum. Front. Plant Sci. 2019, 9, 2002. [Google Scholar] [CrossRef]
  60. Gao, W.; He, D.X.; Ji, F.; Zhang, S.; Zheng, J.F. Effects of Daily Light Integral and LED Spectrum on Growth and Nutritional Quality of Hydroponic Spinach. Agronomy 2020, 10, 2–15. [Google Scholar] [CrossRef]
  61. Liu, H.; Wu, Z.Z.; Zhang, W.Z.; Wang, L.S.; Li, Z.M.; Liu, H. Synergistic effect between green light and nitrogen concentration on nitrate primary metabolism in lettuce (Lactuca sativa L.). Sci. Hortic. 2024, 13, 328. [Google Scholar] [CrossRef]
  62. Yan, Z.N.; He, D.X.; Niu, G.H.; Zhou, Q.; Qu, Y.H. Growth, nutritional quality, and energy use efficiency in two lettuce cultivars as influenced by white plus red versus red plus blue LEDs. Int. J. Agric. Biol. Eng. 2020, 13, 33–40. [Google Scholar] [CrossRef]
  63. Chen, Y.Q.; Liu, W.K. Substituting green light for partial red light promoted the growth and quality, and regulated the nitrogen metabolism of Medicago sativa grown under red-blue LEDs. Environ. Exp. Bot. 2024, 220, 105623. [Google Scholar] [CrossRef]
  64. Huner, N.P.; Öquist, G.; Sarhan, F. Energy balance and acclimation to light and cold. Trends Plant Sci. 1998, 3, 224–230. [Google Scholar] [CrossRef]
  65. Lillo, C. Light regulation of nitrate reductase in green leaves of higher plants. Physiol. Plant. 1994, 90, 616–620. [Google Scholar] [CrossRef]
  66. Cheng, C.L.; Acedo, G.N.; Cristinsin, M.; Conkling, M.A. Sucrose mimics the light induction of Arabidopsis nitrate reductase gene transcription. Proc. Natl. Acad. Sci. USA 1992, 89, 1861–1864. [Google Scholar] [CrossRef]
  67. Sivasankar, S.; Rothstein, S.; Oaks, A. Regulation of the Accumulation and Reduction of Nitrate by Nitrogen and Carbon Metabolites in Maize Seedlings. Plant Physiol. 1997, 114, 583–589. [Google Scholar] [CrossRef]
  68. Chen, R.; Wang, Z.W.; Liu, W.K.; Ding, Y.T.; Zhang, Q.S.; Wang, S.R. Side Lighting of Red, Blue and Green Spectral Combinations Altered the Growth, Yield and Quality of Lettuce (Lactuca sativa L. cv. “Yidali”) in Plant Factory. Plants 2023, 12, 4147. [Google Scholar] [CrossRef]
  69. Bian, Z.H.; Cheng, R.F.; Wang, Y.; Yang, Q.C.; Lu, C.G. Effect of green light on nitrate reduction and edible quality of hydroponically grown lettuce (Lactuca sativa L.) under short-term continuous light from red and blue light-emitting diodes. Environ. Exp. Bot. 2018, 153, 63–71. [Google Scholar] [CrossRef]
  70. Smirnoff, N. Chapter 4—Vitamin C: The Metabolism and Functions of Ascorbic Acid in Plants. Adv. Bot. Res. 2011, 59, 107–177. [Google Scholar]
  71. Geng, M.J.; Feng, X.M.; Wu, X.X.; Tan, X.Y.; Liu, Z.N.; Li, L.J.; Huang, Y.Y.; Teng, F.; Li, Y. Encapsulating vitamins C and E using food-grade soy protein isolate and pectin particles as carrier: Insights on the vitamin additive antioxidant effects. Food Chem. 2023, 418, 135955. [Google Scholar] [CrossRef]
  72. Qian, H.M.; Liu, T.Y.; Deng, M.D.; Miao, H.Y.; Cai, C.X.; Shen, W.S.; Wang, Q.M. Effects of light quality on main health-promoting compounds and antioxidant capacity of Chinese kale sprouts. Food Chem. 2016, 196, 1232–1238. [Google Scholar] [CrossRef] [PubMed]
  73. Ma, G.; Zhang, L.C.; Setiawan, C.K.; Yamawaki, K.; Asai, T.; Nishikawa, F.; Maezawa, S.; Sato, H.; Kanemitsu, N.; Kato, M. Effect of red and blue LED light irradiation on ascorbate content and expression of genes related to ascorbate metabolism in postharvest broccoli. Postharvest Biol. Technol. 2014, 94, 97–103. [Google Scholar] [CrossRef]
  74. Zhuang, L.; Huang, G.Q.; Li, X.D.; Xiao, J.X.; Guo, L.P. Effect of different LED lights on aliphatic glucosinolates metabolism and biochemical characteristics in broccoli sprout. Food Res. Int. 2022, 154, 111015. [Google Scholar] [CrossRef] [PubMed]
  75. Nguyen, T.P.D.; Jang, D.C.; Tran, T.T.H.; Nguyen, Q.T.; Kim, I.S.; Hoang, T.L.H.; Vu, N.T. Influence of Green Light Added with Red and Blue LEDs on the Growth, Leaf Microstructure and Quality of Spinach (Spinacia oleracea L.). Agronomy 2021, 11, 1724. [Google Scholar] [CrossRef]
  76. Dong, T.Y.; Zhang, P.A.; Hakeem, A.; Liu, Z.J.; Su, L.Y.; Ren, Y.H.; Fang, J.G. Integrated transcriptome and metabolome analysis reveals the physiological and molecular mechanisms of grape seedlings in response to red, green, blue, and white LED light qualities. Environ. Exp. Bot. 2023, 213, 105441. [Google Scholar] [CrossRef]
  77. Lin, K.H.; Huang, M.Y.; Hsu, M.H. Morphological and physiological response in green and purple basil plants (Ocimum basilicum) under different proportions of red, green, and blue LED lightings. Sci. Hortic. 2021, 275, 109677. [Google Scholar] [CrossRef]
  78. Shen, N.; Wang, T.F.; Gan, Q.; Liu, S.; Wang, L.; Jin, B. Plant flavonoids: Classification, distribution, biosynthesis, and antioxidant activity. Food Chem. 2022, 383, 132531. [Google Scholar] [CrossRef]
  79. Pérez-Ambrocio, A.; Guerrero-Beltrán, J.A.; Aparicio-Fernández, X.; Ávila-Sosa, R.; Hernández-Carranza, P.; Cid-Pérez, S.; Ochoa-Velasco, C.E. Effect of blue and ultraviolet-C light irradiation on bioactive compounds and antioxidant capacity of habanero pepper (Capsicum chinense) during refrigeration storage. Postharvest Biol. Technol. 2018, 135, 19–26. [Google Scholar] [CrossRef]
  80. Kong, Y.; Schiestel, K.; Zheng, Y.B. Pure blue light effects on growth and morphology are slightly changed by adding low-level UVA or far-red light: A comparison with red light in four microgreen species. Environ. Exp. Bot. 2019, 157, 58–68. [Google Scholar] [CrossRef]
  81. Dou, H.J.; Niu, G.H.; Gu, M.M. Photosynthesis, Morphology, Yield, and Phytochemical Accumulation in Basil Plants Influenced by Substituting Green Light for Partial Red and/or Blue Light. HortScience 2019, 54, 1769–1776. [Google Scholar] [CrossRef]
  82. Oh, H.E.; Yoon, A.; Park, Y.G. Red Light Enhances the Antioxidant Properties and Growth of Rubus hongnoensis. Plants 2021, 10, 2589. [Google Scholar] [CrossRef] [PubMed]
  83. Ma, Z.H.; Li, W.F.; Mao, J.; Li, W.; Zuo, C.W.; Zhao, X.; Dawuda, M.M.; Shi, X.Y.; Chen, B.H. Synthesis of light-inducible and light-independent anthocyanins regulated by specific genes in grape ‘Marselan’ (V. vinifera L.). PeerJ 2019, 7, e6521. [Google Scholar] [CrossRef] [PubMed]
  84. Zhang, X.H.; Zheng, X.T.; Sun, B.Y.; Peng, C.L.; Chow, W.S. Over-expression of the CHS gene enhances resistance of Arabidopsis leaves to high light. Environ. Exp. Bot. 2018, 154, 33–43. [Google Scholar] [CrossRef]
Figure 1. Relative spectra of different LED light quality treatments. Red light (R), blue light (B), purple light (P), yellow light (Y), green light (G), far-red light (FR).
Horticulturae 11 00524 g001
Figure 2. Influence of different LED combination light sources on celery growth. RB (Red-blue light, 3:1, control), RBP (red-blue-purple light, 3:1:1), RBG (red-blue-green light, 3:1:1), RBY (red-blue-yellow light, 3:1:1), and RBFR (red-blue-far-red light, 3:1:1). The celery was treated for 45 days. The mean ± SE are shown (n ≥ 3). Different letters indicate significant difference among the treatments (p < 0.05).
Horticulturae 11 00524 g002
Figure 3. Effects of celery treated with different light quality on photosynthetic pigments. Celery leaves. (A) Chlorophyll a, (B) chlorophyll b, (C) total chlorophyll, (D) carotenoids. The mean ± SE are shown (n ≥ 3). Different letters indicate significant difference among the treatments (p < 0.05).
Horticulturae 11 00524 g003
Figure 4. Effects of different light quality treatments on gas exchange parameters of celery. (A) Net photosynthetic rate (Pn), (B) intercellular CO2 concentration (Ci), (C) stomatal conductance (Gs), (D) transpiration rate (Tr). The mean ± SE are shown (n ≥ 3). Different letters indicate significant difference among the treatments (p < 0.05).
Horticulturae 11 00524 g004
Figure 5. Nutritional quality of celery under different light quality. (A) Soluble sugar, (B) soluble protein, (C) vitamin C, (D) nitrate, (E) cellulose, (F) total phenolics. Different letters indicate significant difference among the treatments (p < 0.05).
Horticulturae 11 00524 g005
Figure 6. Effects of different light quality on flavonoids in celery. (A) anthocyanin, (B) apigenin, and (C) total flavonoids. The mean ± SE are shown (n ≥ 3). Different letters indicate significant difference among the treatments (p < 0.05).
Horticulturae 11 00524 g006
Figure 7. Changes in mineral element content in celery under different light quality. (A) Ca, (B) Mg, (C) Fe, (D) Zn. The mean ± SE are shown (n ≥ 3). Different letters indicate significant difference among the treatments (p < 0.05).
Horticulturae 11 00524 g007
Figure 8. Changes in enzyme activity related to flavonoid synthesis of celery under different light quality. (A) Phenylalanine deaminase PAL, (B) chalcone synthase CHS, (C) chalcone isomerase CHI, (D) flavonoid synthase FNS, (E) anthocyanin synthase ANS. The mean ± SE are shown (n ≥ 3). Different letters indicate significant difference among the treatments (p < 0.05).
Horticulturae 11 00524 g008
Figure 9. Effects of different light treatments on genes related to flavonoid synthesis in celery. (A) Phenylalanine deaminase PAL, (B) chalcone synthase CHS, (C) chalcone isomerase CHI, (D) flavonoid synthase FNS, (E) anthocyanin synthase ANS. The mean ± SE are shown (n ≥ 3). Different letters indicate significant difference among the treatments (p < 0.05).
Horticulturae 11 00524 g009
Figure 10. Correlation analysis of celery leaves.
Horticulturae 11 00524 g010
Figure 11. Correlation analysis of celery petioles.
Horticulturae 11 00524 g011
Table 1. List of primer sequences used for qRT-PCR analysis.
Primer NamesForward Primer (5′–3′)Reverse Primer (5′–3′)
AgACTINCTTCCTGCCATATATGATTGGGCCAGCACCTCGATCTTCATG
AgPALTGATGCAGGGGAAGCCTGAATTTATGAGGACCAAGCCACTGAGGAGAT
AgCHSGGGCCTTACCTTCCATCTTCTTAAGGTCGCTCGCATTTTTTCTTCCTT
AgCHICACTTGTCATTCCTTCTTCCTTGCAACTGGTCTGCCGTCTTGCCCTTC
AgFNSAAGGCGGCTTTACTATCTCCACTCCACCTAGCACCATTAACTTCTCAC
AgANSCTCTTTCCTCCTCGTACCTTTGCTCTTCGGTGTTCTTATGTTCCCCTG
Table 2. Effects of different light quality on celery growth indexes.
TreatmentShoot FW (g)Shoot DW (g)Root FW (g)Root DW (g)Stem Thickness (mm)
RB29.71 ± 0.095 b2.15 ± 0.010 cd11.93 ± 0.491 b1.39 ± 0.043 ab13.54 ± 0.214 ab
RBP36.96 ± 1.949 a3.98 ± 0.227 a14.35 ± 0.848 a1.57 ± 0.065 a15.17 ± 0.110 a
RBY30.72 ± 1.081 b2.93 ± 0.103 b11.09 ± 0.107 b1.19 ± 0.026 bc11.37 ± 1.892 b
RBG21.32 ± 1.139 c1.65 ± 0.153 d7.49 ± 0.388 c0.89 ± 0.160 c13.21 ± 0.703 ab
RBFR27.54 ± 1.372 b2.66 ± 0.199 bc11.08 ± 0.595 b1.28 ± 0.086 ab13.22 ± 0.464 ab
Note: Different letters in the same column indicate significant differences at p < 0.05 level.
Disclaimer/Publisher’s Note: The statements, opinions and data contained in all publications are solely those of the individual author(s) and contributor(s) and not of MDPI and/or the editor(s). MDPI and/or the editor(s) disclaim responsibility for any injury to people or property resulting from any ideas, methods, instructions or products referred to in the content.

