
Seasonality in Apple Leaf Molybdenum Contents During the Growing Season and Stages of Greatest Need in This Nutrient
 ,
,
Abstract
1. Introduction
2. Materials and Methods
3. Results
4. Discussion
5. Conclusions
Author Contributions
Funding
Data Availability Statement
Conflicts of Interest
References
- Ge, S.; Zhu, Z.; Peng, L.; Chen, Q.; Jiang, Y. Soil Nutrient Status and Leaf Nutrient Diagnosis in the Main Apple Producing Regions in China. Hortic. Plant J. 2018, 4, 89–93. [Google Scholar] [CrossRef]
- Storwukenticomedia.blob.core.windows.net Plant-Analysis-Handbook-Iv_2.Pdf. Available online: https://storwukenticomedia.blob.core.windows.net/media/wfu/media/images/plant-analysis-handbook-iv_2.pdf (accessed on 3 August 2024).
- Tserling, V.V. Agricultural Crop Nutrition Diagnosis; Agropromizdat: Moscow, USSR, 1990; pp. 165–166. (In Russian) [Google Scholar]
- Rogers, B.L.; Batjer, L.P.; Thompson, A.H. Seasonal trend of several nutrient elements in Delicious apple leaves expressed on a per cent and unit area basis. Proc. Am. Soc. Hort. Sci. 1953, 61, 1–5. [Google Scholar]
- Chuntanaparb, N.; Cummings, G. Seasonal trends in concentration of nitrogen, phosphorus potassium, calcium, and magnesium in leaf portions of apple, blueberry, grape, and peach. J. Am. Soc. Hort. Sci. 1980, 105, 933–935. [Google Scholar] [CrossRef]
- Hilmelrich, D.G.; Walker, C.E. Seasonal trends of calcium, magnesium, and potassium fractions in apple leaf and fruit tissues. J. Am. Soc. Hort. Sci. 1982, 107, 1078–1080. [Google Scholar]
- Nurzynski, J.; Kepta, M.; Komosa, A.; Kozera, G. Seasonal changes of N, P, K, Ca and Mg content in apple tree leaves during vegetation period. Acta Hortic. 1990, 274, 365–373. [Google Scholar] [CrossRef]
- Nachtigall, G.R.; Dechen, A.R. Seasonality of Nutrients in Leaves and Fruits of Apple Trees. Sci. Agric. 2006, 63, 493–501. [Google Scholar] [CrossRef]
- Schansker, G.; Ohnishi, M.; Furutani, R.; Miyake, C. Identification of Twelve Different Mineral Deficiencies in Hydroponically Grown Sunflower Plants on the Basis of Short Measurements of the Fluorescence and P700 Oxidation/Reduction Kinetics. Front. Plant Sci. 2022, 13, 894607. [Google Scholar] [CrossRef]
- Moussa, M.G.; Hu, C.; Elyamine, A.M.; Ismael, M.A.; Rana, M.S.; Imran, M.; Syaifudin, M.; Tan, Q.; Marty, C.; Sun, X. Molybdenum-Induced Effects on Nitrogen Uptake Efficiency and Recovery in Wheat (Triticum aestivum L.) Using 15N-Labeled Nitrogen with Different N Forms and Rates. J. Plant Nutr. Soil Sci. 2021, 184, 613–621. [Google Scholar] [CrossRef]
- Hänsch, R.; Mendel, R.R. Physiological Functions of Mineral Micronutrients (Cu, Zn, Mn, Fe, Ni, Mo, B, Cl). Curr. Opin. Plant Biol. 2009, 12, 259–266. [Google Scholar] [CrossRef]
- Rana, M.S.; Bhantana, P.; Imran, M.; Saleem, M.H.; Moussa, M.G.; Khan, Z.; Khan, I.; Alam, M.; Abbas, M.; Binyamin, R.; et al. Molybdenum Potential Vital Role in Plants Metabolism for Optimizing the Growth and Development. Ann. Environ. Sci. Toxic. 2020, 4, 032–044. [Google Scholar] [CrossRef]
- Schwarz, G.; Mendel, R.R. Molybdenum Cofactor Biosynthesis and Molybdenum Enzymes. Annu. Rev. Plant. Biol. 2006, 57, 623–647. [Google Scholar] [CrossRef] [PubMed]
- Yesbergenova, Z.; Yang, G.; Oron, E.; Soffer, D.; Fluhr, R.; Sagi, M. The Plant Mo-Hydroxylases Aldehyde Oxidase and Xanthine Dehydrogenase Have Distinct Reactive Oxygen Species Signatures and Are Induced by Drought and Abscisic Acid. Plant J. 2005, 42, 862–876. [Google Scholar] [CrossRef] [PubMed]
- Kaiser, B.N.; Gridley, K.L.; Brady, J.N.; Phillips, T.; Tyerman, S.D. The Role of Molybdenum in Agricultural Plant Production. Ann. Bot. 2005, 96, 745–754. [Google Scholar] [CrossRef]
- Kuper, J.; Llamas, A.; Hecht, H.-J.; Mendel, R.R.; Schwarz, G. Structure of the Molybdopterin-Bound Cnx1G Domain Links Molybdenum and Copper Metabolism. Nature 2004, 430, 803–806. [Google Scholar] [CrossRef]
- Tsapps.nist.gov. Available online: https://tsapps.nist.gov/srmext/certificates/1515.pdf (accessed on 7 October 2024).
- Eaton, G.W.; Robinson, M.A. Interstock effects upon apple leaf and fruit mineral content. Can. J. Plant Sci. 1977, 57, 227–234. [Google Scholar] [CrossRef]
- Kristensen, M.; Ostergaard, L.F.; Halekoh, U.; Jorgensen, H.; Lauridsen, C.; Brandt, K.; Bügel, S. Effect of plant cultivation methods on content of major and trace elements in foodstuffs and retention in rats. J. Sci. Food Agric. 2008, 88, 2161–2172. [Google Scholar] [CrossRef]
- Wołejko, E.; Łozowicka, B.; Kaczyński, P.; Konecki, R.; Grobela, M. The Influence of Chemical Protection on the Content of Heavy Metals in Wheat (Triticum aestivum L.) Growing on the Soil Enriched with Granular Sludge. Environ. Monit. Assess. 2017, 189, 424. [Google Scholar] [CrossRef]
- Tromp, J. The Effect of Temperature on Growth and Mineral Nutrition of Fruits of Apple, with Special Reference to Calcium. Physiol. Plant. 1975, 33, 87–93. [Google Scholar] [CrossRef]
- Wójcik, P. Effects of molybdenum sprays on the growth, yield and fruit quality of ‘Red Jonaprince’ apple trees. Sci. Hortic. 2020, 271, 109422. [Google Scholar] [CrossRef]
- Cruz, A.F.; de Almeida, G.M.; Wadt, P.G.S.; de Pires, M.C.; Ramos, M.L.G. Seasonal Variation of Plant Mineral Nutrition in Fruit Trees. Braz. Arch. Biol. Technol. 2019, 62, e19180340. [Google Scholar] [CrossRef]
- Kangueehi, G.N. Nutrient Requirement and Distribution of Intensively Grown ‘Brookfield Gala’ Apple Trees. Master’s Thesis, University of Stellenbosch, Stellenbosch, South Africa, March 2008. [Google Scholar]
- Bleiholder, H.; Weber, E.; Feller, C.; Hess, M.; Wicke, H.; Meier, U.; van den Boom, T.; Lancashire, P.D.; Buhr, L.; Hack, H.; et al. Growth Stages of Mono- and Dicotyledonous Plants, BBCH Monograph, 2nd ed.; Meier, U., Ed.; Federal Biological Research 521 Centre for Agriculture and Forestry: Bonn, Germany, 2001; 158p. [Google Scholar]
- Mineev, V.G.; Sychev, V.G.; Amelyanchik, O.A.; Bolsheva, T.N.; Gomonova, N.F.; Durynina, E.P.; Egorov, V.S.; Egorova, E.V.; Edemskaya, N.L.; Karpova, E.A.; et al. Educational Aid on Agricultural Chemistry, 2nd ed.; Publishing House of Lomonosov Moscow State University: Moskow, Russia, 2001; 688p. (In Russian) [Google Scholar]
- Pupyshev, A.A. Atomic Absorption Spectral Analysis; Technosphera: Moscow, Russia, 2009; 784p. (In Russian) [Google Scholar]
- Feed Additives Based on Inorganic and Organic Compounds of Trace Elements. The Method of Measuring the Mass Fraction of Iron, Manganese, Zinc, Cobalt, Copper, Molybdenum and Selenium by Atomic Absorption Spectroscopy Using an Atomic Absorption Spectrometer with Electrothermal Atomization Modifications MGA–915, MGA-915M, MGA-915MD; M 04-70-2011; FR.1.312012.11854; Lumex, Moscow, Russia, 2011; 27p. (In Russian). Available online: https://www.lumex.ru/files/MVI_RU_20250306.pdf (accessed on 17 March 2020).
- Dospekhov, B.A. Methodology of Field Experience; Agropromizdat: Moscow, Russia, 1985; 351p. (In Russian) [Google Scholar]
- Gonchar-Zaykin, P.P.; Chertov, V.G. Excel add-in for statistical assessment and analysis of the results of field and laboratory experiments. In Rational Environmental Management and Agricultural Production in the Southern Regions of the Russian Federation: Proсeedings of the Caspian Research Institute of Arid Agriculture; Sovremennye Tetradi: Moscow, Russia, 2003; pp. 559–564. (In Russian) [Google Scholar]
- Sharma, R. Mapping of Leaf Nutrient Status of Apple (Malus Domestica Borkh.) Plantations in Northwestern Himalayas. Int. J. Chem. Stud. 2018, 6, 866–871. [Google Scholar]
- Schwartz, S.H.; Leon-Kloosterziel, K.M.; Koornneef, M.; Zeevaart, J.A.D. Biochemical Characterization of the Aba2 and Aba3 Mutants in Arabidopsis thaliana. Plant Physiol. 1997, 114, 161–166. [Google Scholar] [CrossRef]
- Zhang, J.; Liu, S.; Liu, C.-B.; Zhang, M.; Fu, X.-Q.; Wang, Y.-L.; Song, T.; Chao, Z.-F.; Han, M.-L.; Tian, Z.; et al. Natural Variants of Molybdate Transporters Contribute to Yield Traits of Soybean by Affecting Auxin Synthesis. Curr. Biol. 2023, 33, 5355–5367.e5. [Google Scholar] [CrossRef]
- Mishra, S.; Spaccarotella, K.; Gido, J.; Samanta, I.; Chowdhary, G. Effects of Heat Stress on Plant-Nutrient Relations: An Update on Nutrient Uptake, Transport, and Assimilation. Int. J. Mol. Sci. 2023, 24, 15670. [Google Scholar] [CrossRef] [PubMed]
- Smith, G.S.; Clark, C.; Henderson, H.V. Seasonal accumulation of mineral nutrients by kiwifruit i. leaves. New Phytol. 1987, 106, 81–100. [Google Scholar] [CrossRef]
- Stoller Enterprises. Available online: https://stollerenterprises.ca/wp-content/uploads/2019/05/stoller-enterprises-crop-health-guide.pdf (accessed on 23 April 2025).
- Nanda, K.K.; Anand, V.K. Seasonal Changes in Auxin Effects on Rooting of Stem Cuttings of Populus nigra and its Relationship with Mobilization of Starch. Physiol. Plant. 1970, 23, 99–107. [Google Scholar] [CrossRef]
- Guo, L.; Luo, X.; Li, M. Mechanism of fertilization-induced auxin synthesis in the endosperm for seed and fruit development. Nat. Commun. 2022, 13, 3985. [Google Scholar] [CrossRef]
- Starkus, A.; Morkūnaitė-Haimi, Š.; Gurskas, T.; Misiukevičius, E.; Stanys, V.; Frercks, B. The Biological and Genetic Mechanisms of Fruit Drop in Apple Tree (Malus × domestica Borkh.). Horticulturae 2024, 10, 987. [Google Scholar] [CrossRef]
- Devoghalaere, F.; Doucen, T.; Guitton, B.; Keeling, J.; Payne, W.; Ling, T.J.; Ross, J.J.; Hallett, I.C.; Gunaseelan, K.; Dayatilake, G.A.; et al. A genomics approach to understanding the role of auxin in apple (Malus domestica) fruit size control. BMC Plant Biol. 2012, 12, 7. [Google Scholar] [CrossRef]
- Song, C.; Zhang, D.; Zhang, J.; Zheng, L.; Zhao, C.; Ma, J.; An, N.; Han, M. Expression analysis of key auxin synthesis, transport, and metabolism genes in different young dwarfing apple trees. Acta Physiol. Plant. 2016, 38, 43. [Google Scholar] [CrossRef]
- Balík, J.; Pavlíková, D.; Tlustoš, P.; Sýkora, K.; Černý, J. The fluctuation of molybdenum content in oilseed rape plants after the application of nitrogen and sulphur fertilizers. Plant Soil Environ. 2006, 52, 301–307. [Google Scholar] [CrossRef]
- Baxter, I.; Muthukumar, B.; Park, H.C.; Buchner, P.; Lahner, B.; Danku, J.; Zhao, K.; Lee, J.; Hawkesford, M.J.; Guerinot, M.L.; et al. Variation in molybdenum content across broadly distributed populations of Arabidopsis thaliana is controlled by a mitochondrial molybdenum transporter (MOT1). PLoS Genet. 2008, 4, e1000004. [Google Scholar] [CrossRef]
- Heckathorn, S.A.; Giri, A.; Mishra, S.; Bista, D. Heat Stress and Roots. In Climate Change and Plant Abiotic Stress Tolerance; Tuteja, N., Gill, S.S., Eds.; Wiley-VCH Verlag Gmbh & Co. KGaA: Weinheim, Germany, 2014; pp. 109–136. [Google Scholar] [CrossRef]
- Giri, A.; Heckathorn, S.; Mishra, S.; Krause, C. Heat Stress Decreases Levels of Nutrient-Uptake and -Assimilation Proteins in Tomato Roots. Plants 2017, 6, 6. [Google Scholar] [CrossRef]
- Nacry, P.; Bouguyon, E.; Gojon, A. Nitrogen Acquisition by Roots: Physiological and Developmental Mechanisms Ensuring Plant Adaptation to a Fluctuating Resource. Plant Soil 2013, 370, 1–29. [Google Scholar] [CrossRef]
- Ludewig, U.; Neuhäuser, B.; Dynowski, M. Molecular Mechanisms of Ammonium Transport and Accumulation in Plants. FEBS Lett. 2007, 581, 2301–2308. [Google Scholar] [CrossRef] [PubMed]
- López-Arredondo, D.L.; Leyva-González, M.A.; González-Morales, S.I.; López-Bucio, J.; Herrera-Estrella, L. Phosphate nutrition: Improving low-phosphate tolerance in crops. Annu. Rev. Plant Biol. 2014, 65, 95–123. [Google Scholar] [CrossRef]
- Kim, S.A.; Guerinot, M.L. Mining Iron: Iron Uptake and Transport in Plants. FEBS Lett. 2007, 581, 2273–2280. [Google Scholar] [CrossRef]
- Takano, J.; Miwa, K.; Yuan, L.; von Wirén, N.; Fujiwara, T. Endocytosis and Degradation of BOR1, a Boron Transporter of Arabidopsis thaliana, Regulated by Boron Availability. Proc. Nat. Acad. Sci. USA 2005, 102, 12276–12281. [Google Scholar] [CrossRef]
- Wysokinski, A.; Lozak, I.; Kuziemska, B. The Dynamics of Molybdenum, Boron, and Iron Uptake, Translocation and Accumulation by Pea (Pisum sativum L.). Agronomy 2022, 12, 935. [Google Scholar] [CrossRef]
- Moraghan, J.T.; Mascagni, H.J. Environmental and Soil Factors Affecting Micronutrient Deficiencies and Toxicities. In Micronutrients in Agriculture, 2nd ed.; Mortvedt, J.J., Ed.; American Society of Agronomy: Madison, WI, USA, 1991; Volume 4, pp. 371–425. [Google Scholar] [CrossRef]
- Lawson-Wood, K.; Jaafar, M.; Felipe-Sotelo, M.; Ward, N.I. Investigation of the Uptake of Molybdenum by Plants from Argentinean Groundwater. Environ. Sci. Pollut. Res. 2021, 28, 48929–48941. [Google Scholar] [CrossRef]


| Soil Layers, cm | N Hydrolyzable mg kg−1 | Р Bioavailable mg kg−1 | К Exchangeable mg kg−1 | Ca Exchangeable mg kg−1 | pHkCl |
|---|---|---|---|---|---|
| 0–20 | 154.3 | 169.4 | 143.2 | 3973 | 6.18 |
| 21–40 | 132.0 | 157.1 | 122.5 | 3801 | 6.48 |
| 41–60 | 102.8 | 94.5 | 98.8 | 3776 | 6.09 |
| 61–80 | 72.6 | 81.4 | 104.0 | 3868 | 6.26 |
| Mouse-Ear Stage: Green Leaf Tips 10 mm Above the Bud Scales | Pink Bud Stage: Flower Petals Elongating; Sepals Slightly Open; Petals Just Visible | Beginning of Flowering: About 10% of Flowers Open | Flowers Fading: Majority of Petals Fallen | Fruit Size up to 20 mm | Fruit Diameter up to 40 mm | Fruit About Half Final Size | Fruit About 60% Final Size | Fruit About 70% Final Size | Fruit About 80% Final Size | Beginning of * Ripening: First Appearance of Cultivar- Specific Color |
|---|---|---|---|---|---|---|---|---|---|---|
| 10 | 57 | 61 | 67 | 72 | 74 | 75 | 76 | 77 | 78 | 81 ** |
| 2020 | ||||||||||
| Biostim Growth | Biostim Growth | Ultramag Chelate | Ultramag Potassium | Ultramag Potassium | Ultramag Potassium | Ultramag *** | Ultramag Calcium | Without any **** treatments | ||
| 1.5 L ha−1 | 1.5 L ha−1 | Zn-15 1.0 kg ha−1 | 3.0 l ha−1 | 3.0 L ha−1 | 3.0 L ha−1 | Calcium | 3.0 L ha−1/ | |||
| Ultramag Boron | Ultramag Boron | Ultramag Calcium | Ultramag Calcium | Ultramag Calcium | 3.0 L ha−1/ | 0.015 g L−1 | ||||
| 1.0 L ha−1 | 1.0 L ha−1 | 3.0 L ha−1/0.015 g L−1 | 3.0 L ha−1/0.015 g L−1 | 3.0 L ha−1/0.015 g L−1 | 0.015 g L−1 | |||||
| Ultramag Chelate | Biostim Universal | |||||||||
| Zn-15 1.0 kg ha−1 | 1.5 L ha−1 | |||||||||
| 10.04 | 29.04 | 07.05 | 22.05 | 07.06 | 17.06 | 27.06 | 06.07 | 16.07 | 27.07 | |
| 2021 | ||||||||||
| Ultramag Boron | Ultramag Boron | MicroFid Zinc | Ultramag Potassium | Ultramag Potassium | Ultramag Calcium | MicroFid Zinc | Ultramag Calcium | |||
| 1.0 L ha−1 | 1.0 L ha−1 | 1.0 L ha−1 | 3.0 L ha−1 | 3.0 L ha−1 | 3.0 L ha−1/0.015 g L−1 | 1.0 L ha−1 | 3.0 L ha−1/ | |||
| MicroFid Zinc | Ultramag Calcium | Ultramag Calcium | Igida 1.5 L ha−1 | 0.015 g L−1 | ||||||
| 1.0 L ha−1 | 3.0 L ha−1/0.015 g L−1 | 3.0 L ha−1/0.015 g L−1 | ||||||||
| Igida 1.5 L ha−1 | MicroFid Boron | |||||||||
| 1.0 L ha−1 | ||||||||||
| 25.04 | 06.05 | 14.05 | 22.05 | 01.06 | 09.06 | 18.06 | 08.07 | 15.07 | 30.07 | 13.08 |
| 2022 | ||||||||||
| Biostim Growth | Biostim Growth | Ultramag Calcium | Ultramag Calcium | Ultramag Calcium | Ultramag Calcium | Ultramag Calcium | Ultramag | Ultramag Calcium | SC2020 | |
| 1.0 L ha−1 | 1.5 L ha−1 | 3.0 L ha−1 | 3.0 L ha−1/0.015 g L−1 | 3.0 L ha−1/0.015 g L−1 | 3.0 L ha−1/0.015 g L−1 | 3.0 L ha−1/0.015 g L−1 | Calcium | 3.0 L ha−1/ | 1.5 L ha−1 | |
| Ultramag Boron | Ultramag Boron | /0.015 g L−1 | AKh-576-23 | Ultramag Potassium | Ultramag Potassium | 3.0 L ha−1/ | 0.015 g L−1 | |||
| 1.0 L ha−1 | 1.0 L ha−1 | AKh-576-23 | 2.0 L ha−1/0.6 g L−1 | 3.0 L ha−1 | 3.0 L ha−1 | 0.015 g L−1 | ||||
| Ultramag Calcium | 2.0 L ha−1/0.6 g L−1 | Ultramag Potassium | Biostim Growth | AKh-577-23 | ||||||
| 3.0 L ha−1/0,015 g L−1 | 3.0 L ha−1 | 1.0 L ha−1 | 2.0 L ha−1/0.5 g L−1 | |||||||
| AKh-576-23 | AKh-576-23 | |||||||||
| 2.0 L ha−1/0.6 g L−1 | 2.0 L ha−1/0.6 g L−1 | |||||||||
| 22.04 | 03.05 | 16.05 | 29.05 | 13.06 | 24.06 | 04.07 | 16.07 | 24.07 | 05.08 | 15.08 |
| 2023 | ||||||||||
| Ultramag Super | Ultramag Phosphorus | Biostim Universal | Ultramag | AKh-576-23 | Biostim Universal | AKh-577-23 | AKh-576-23 | Ultramag | SC2020 | SC2020 |
| Zinc-700 | Super | 2.0 L ha−1 | Calcium Active | 2.0 L ha−1/0.6 g L−1 | 3.0 L ha−1 | 2.0 L ha−1/0.5 g L−1 | 1.0 L ha−1/0.6 g L−1 | Calcium | L ha−1 | L ha−1 |
| 1.0 L ha−1 | 1.5 L ha−1 | Ultramag Boron | 3.0 L ha−1 | Ultramag Calcium | Ultramag Calcium | Ultramag Calcium | Ultramag Calcium | 3.0 L ha−1/ | ||
| Ultramag Helat | Ultramag Boron | 1.0 L ha−1 | 3.0 L ha−1/0.015 g L−1 | 3.0 L ha−1/0.015 g L−1 | 3.0 L ha−1/0.015 g L−1 | 3.0 L ha−1/0.015 g L−1 | 0.015 g L−1 | |||
| Fe-13 | 1.0 L ha−1 | Ultramag Super | Ultramag Potassium | Ultramag Potassium 3.0 L | ||||||
| 1.0 kg ha−1 | AKh-576-23 | Sulfur-900 | 3.0 L ha−1 | ha−1 | ||||||
| 1.5 L ha−1/0.6 g L−1 | 1.0 L ha−1 | |||||||||
| 26.04 | 08.05 | 20.05 | 27.05 | 07.06. | 16.06 | 29.06 | 06.07 | 19.07 | 31.07 | 15.08 |
| Agrochemicals | N | Р2О5 | К2О | CаО | MgO | SO3 | B | Cu | Fe | Mn | Mo | Na | Si | Zn | Amino Acids of Plant Origin |
|---|---|---|---|---|---|---|---|---|---|---|---|---|---|---|---|
| Biostim Growth | 4.0 | 10.0 | 2.0 | 1.0 | 0.1 | 0.4 | 0.2 | 0.2 | 4.0 | ||||||
| Biostim Universal | 6.0 | 1.3 | 5.0 | 10.0 | |||||||||||
| Igida | 4.0 | 3.0 | 7.0 | 4.7 | 27.0 | 10.0 | |||||||||
| MicroFid Zinc | 1.0 | 0.7 | 0.3 | 10.5 | 0.05 | 0.05 | 0.02 | 4.5 | 3.6 | 11 | |||||
| SC2020 | 10.0 | ||||||||||||||
| Ultramag Boron | 11.0 | ||||||||||||||
| Ultramag Calcium | 10.0 | 17.0 | 0.8 | 0.05 | 0.02 | 0.001 | 0.02 | ||||||||
| Ultramag Calcium Active | 10.0 | ||||||||||||||
| Ultramag Chelate Fe-13 | 13.0 | ||||||||||||||
| Ultramag Phosphorus Super | 6.4 | 35.0 | 4.0 | 2.5 | |||||||||||
| Ultramag Potassium | 2.6 | 22.0 | |||||||||||||
| Ultramag Super Sulfur-900 | 5.0 | 70.0 | |||||||||||||
| Ultramag Super Zinc-700 | 1.5 | 40.0 | |||||||||||||
| AKh-576-23 | 4.6 | 4.0 | 0.5 | 0.05 | 1.0 | 4.0 | 0.05 | 3.0 | |||||||
| AKh-577-23 | 2.0 | 10.0 | 5.0 | 0.7 | 2.0 | 0.04 |
| Mouse-Ear Stage: Green Leaf Tips 10 mm Above the Bud Scales | Pink Bud Stage: Flower Petals Elongating; Sepals Slightly Open; Petals Just Visible | Beginning of Flowering: About 10% of Flowers Open | Flowers Fading: Majority of Petals Fallen | Fruit Size up to 20 mm | Fruit Diameter up to 40 mm | Fruit About Half Final Size | Fruit About 60% Final Size | Fruit About 70% Final Size | Fruit About 80% Final Size | Beginning of Ripening: First Appearance of Cultivar-Specific Color |
|---|---|---|---|---|---|---|---|---|---|---|
| 10 | 57 | 61 | 67 | 72 | 74 | 75 | 76 | 77 | 78 | 81 |
| 2020 | ||||||||||
| 10.04. 9.1 °C 72% | 29.04. 14.5 °C 51% | 07.05. 16.9 °C 76% | 22.05. 10.5 °C 63% | 07.06. 19.1 °C 82% | 17.06. 22.3 °C 49% | 27.06. 19.9 °C 71% | 06.07. 23.1 °C 80% | 16.07. 15.8 °C 77% | 27.07. 21.4 °C 49% | Without any treatments |
| 2021 | ||||||||||
| 25.04. 8.9 °C 78% | 06.05. 15.0 °C 47% | 14.05. 20.4 °C 64% | 22.05. 17.3 °C 56% | 01.06. 12.7 °C 83% | 09.06. 18.1 °C 86% | 18.06. 20.7 °C 52% | 08.07. 23.4 °C 51% | 15.07. 24.1 °C 54% | 30.07. 21.9 °C 77% | 13.08 20.0 °C 79% |
| 2022 | ||||||||||
| 22.04. 9.1 °C 90% | 03.05. 13.9 °C 48% | 16.05. 10.8 °C 79% | 29.05. 14.3 °C 66% | 13.06. 19.1 °C 67% | 24.06. 20.8 °C 64% | 04.07. 22.7 °C 59% | 16.07. 20.7 °C 71% | 24.07. 23.1 °C 78% | 05.08. 24.6 °C 64% | 15.08. 23.1 °C 62% |
| 2023 | ||||||||||
| 26.04. 12.4 °C 85% | 08.05. 9.9 °C 44% | 20.05. 15.2 °C 62% | 27.05. 20.8 °C 68% | 07.06. 17.6 °C 57% | 16.06. 19.9 °C 62% | 29.06. 16.1 °C 94% | 06.07. 22.4 °C 85% | 19.07. 18.1 °C 72% | 31.07. 20.5 °C 68% | 15.08. 22.4 °C 74% |
| Value | 2020 | 2021 | 2022 | 2013 | ||||
|---|---|---|---|---|---|---|---|---|
| Cont | Ff | Cont | Ff | Cont | Ff | Cont | Ff | |
| Minimum | 0.334 | 0.329 | 0.056 | 0.063 | 0.525 | 0.684 | 0.113 | 0.228 |
| Maximum | 1.117 | 1.623 | 0.182 | 0.258 | 1.495 | 1.672 | 0.938 | 1.357 |
| Average | 0.635 | 0.975 | 0.109 | 0.160 | 0.913 | 1.049 | 0.514 | 0.805 |
| LSD05 | 0.087 | 0.042 | 0.113 | 0.099 | ||||
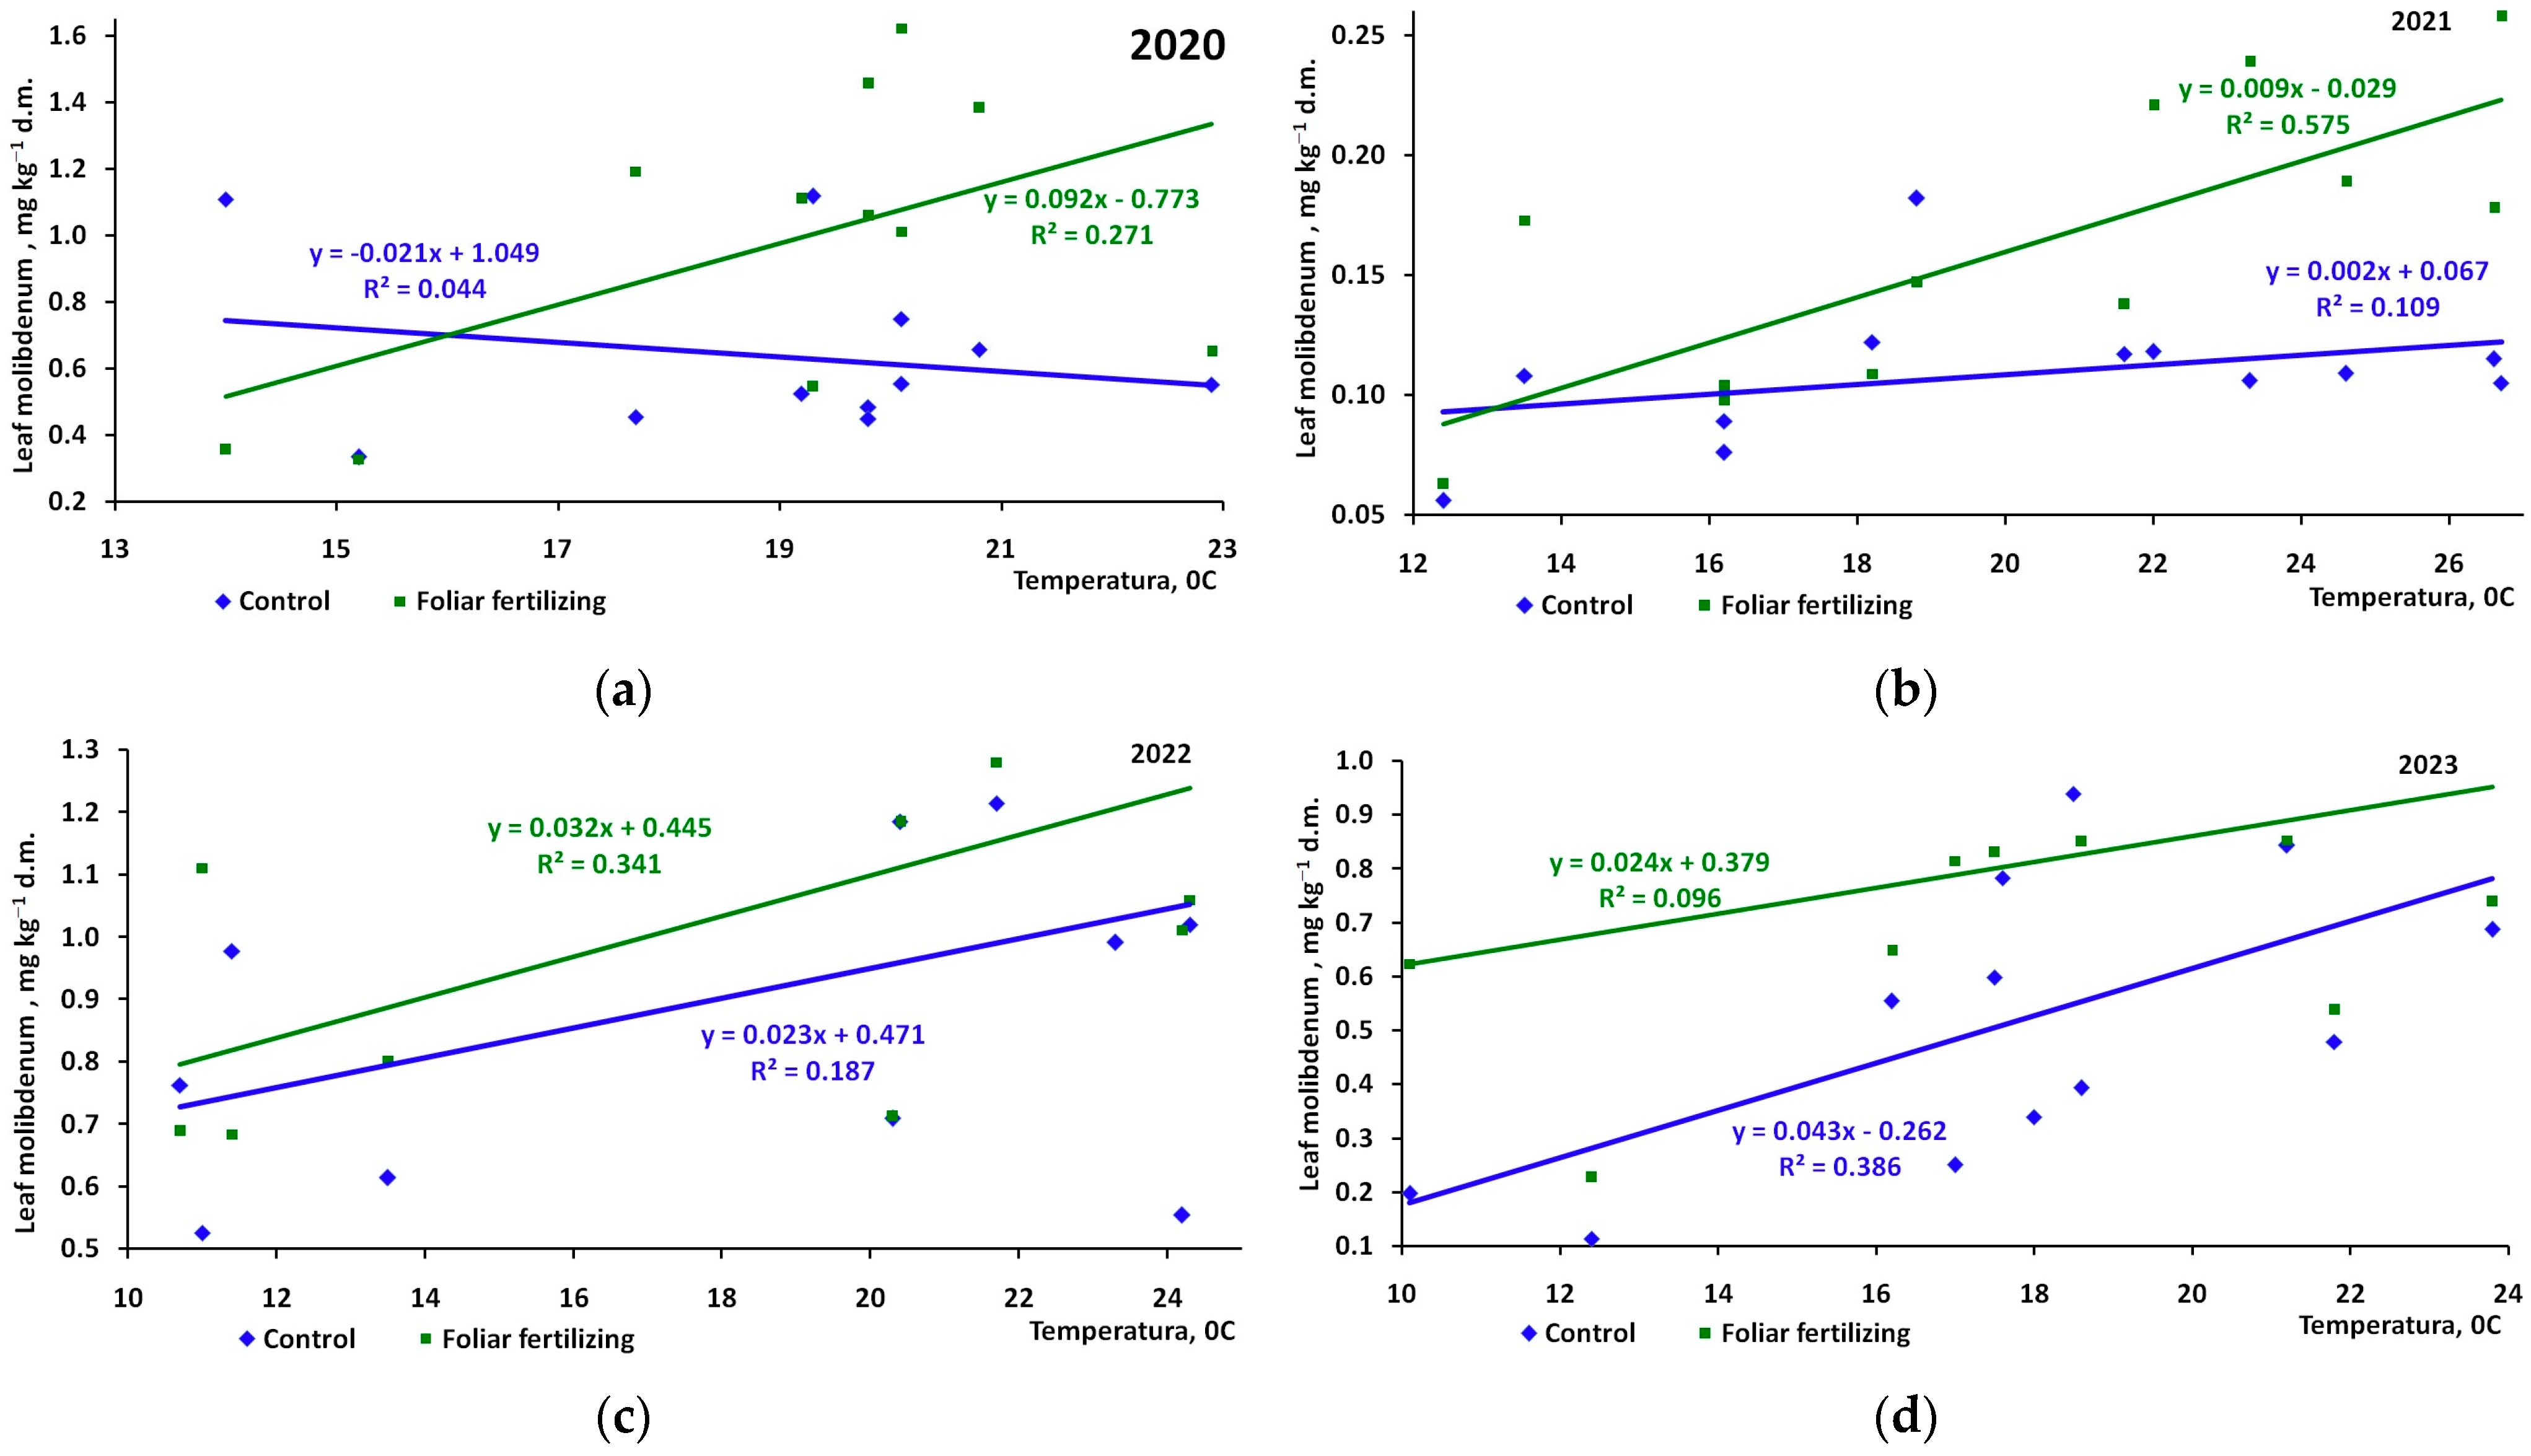
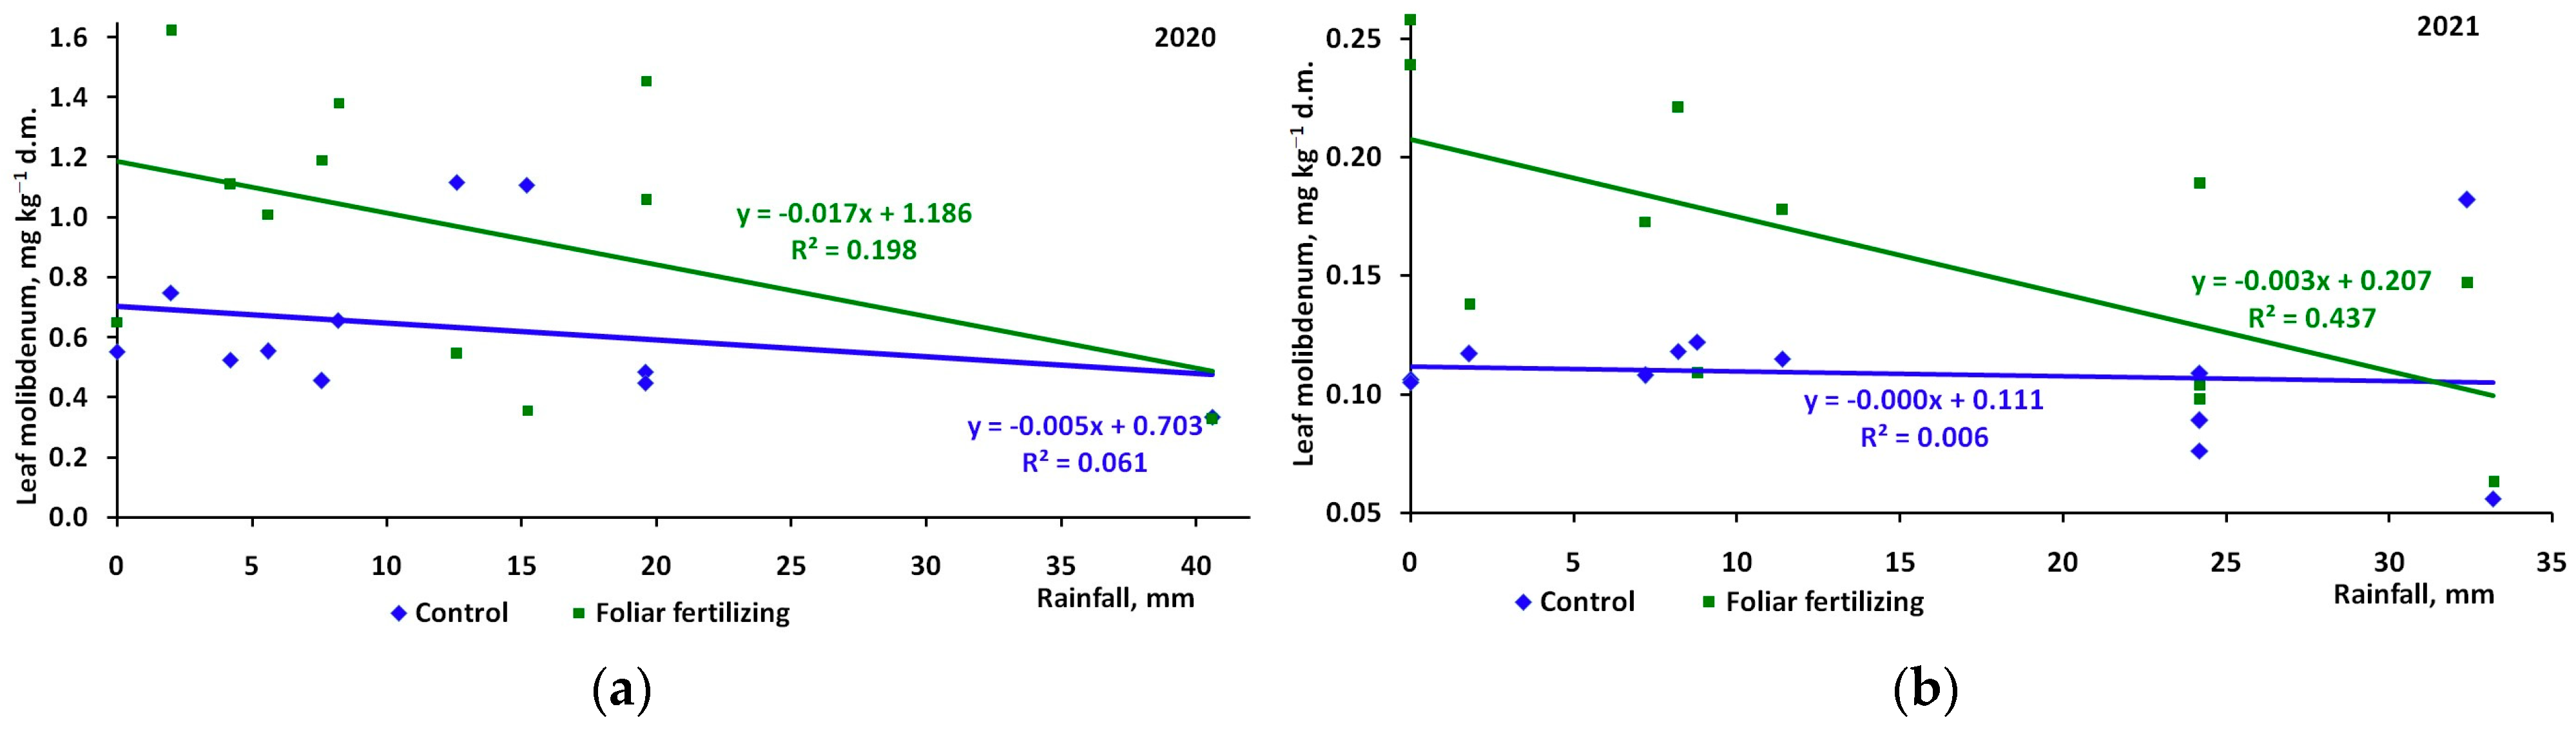
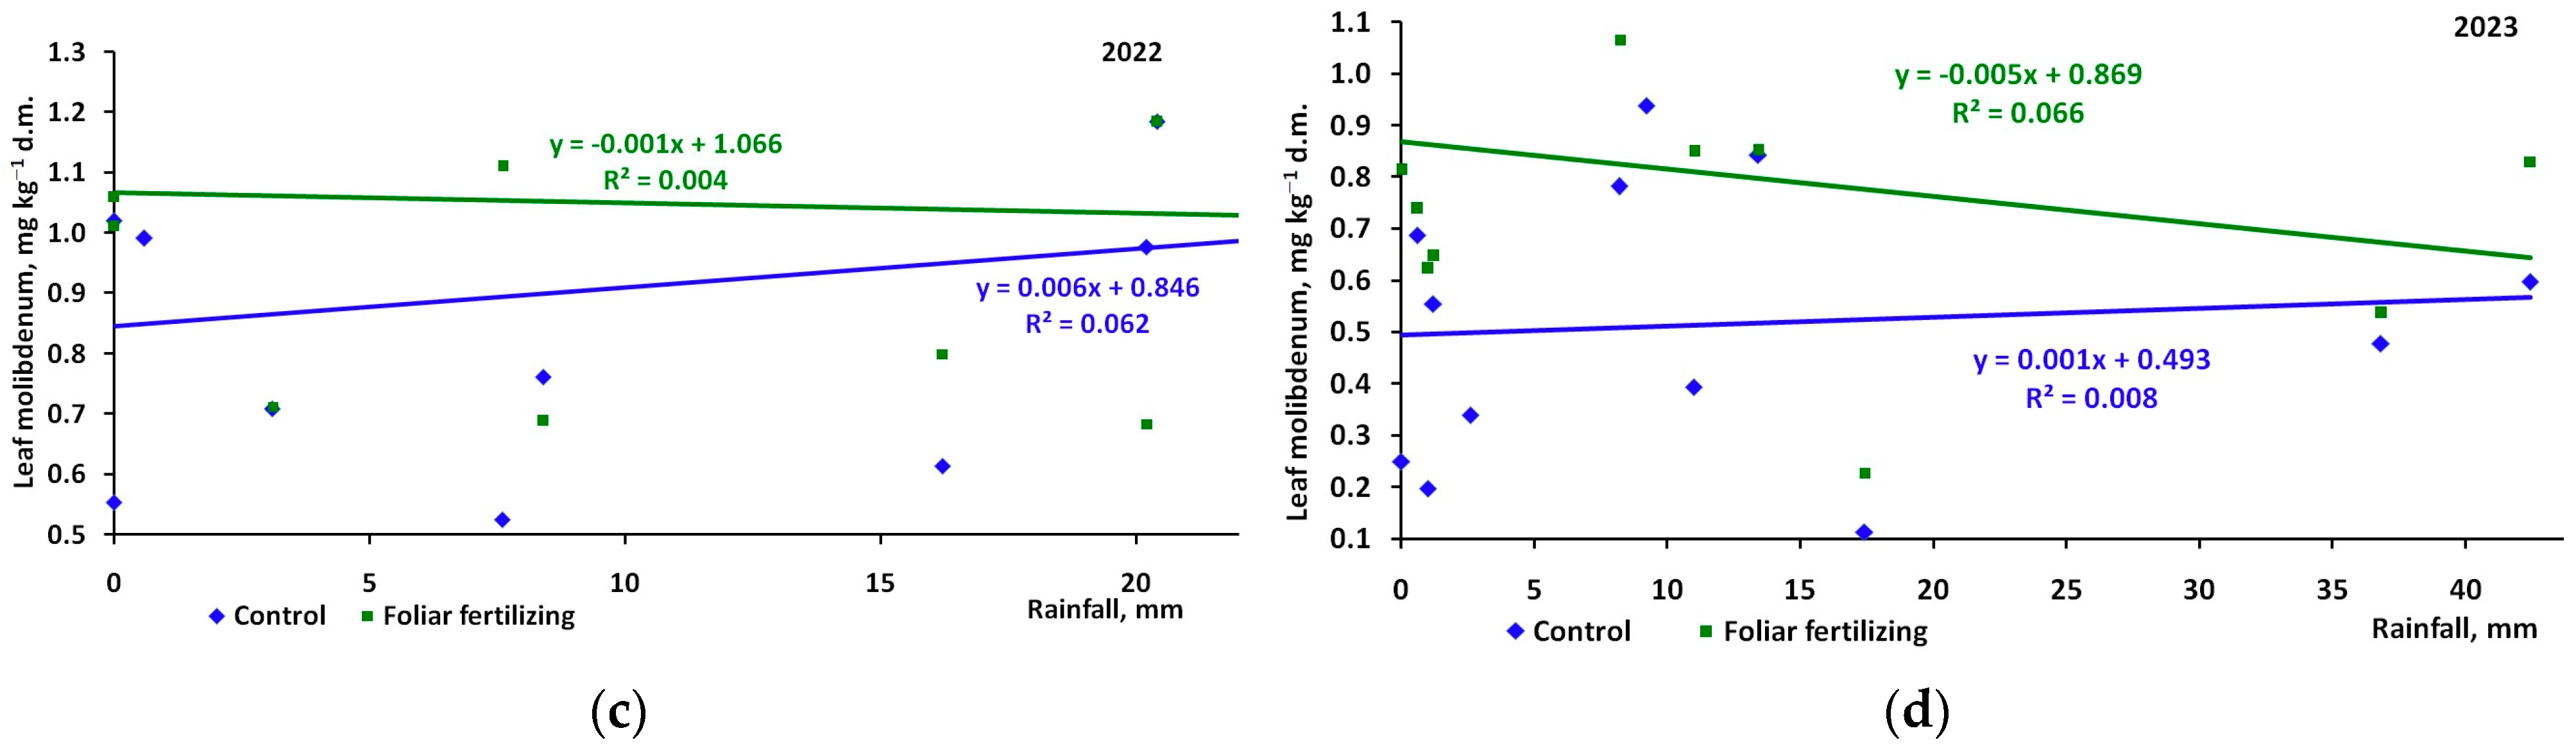
| Treatments | 2020 | 2021 | 2022 | 2023 |
|---|---|---|---|---|
| Average daily air temperature for a ten-day period | ||||
| Control | −0.211 | 0.330 | 0.480 | 0.622 |
| Foliar fertilizer | 0.521 | 0.758 | 0.474 | 0.310 |
| Average daily air humidity for a ten-day period | ||||
| Control | 0.43 | −0.365 | 0.335 | 0.363 |
| Foliar fertilizer | −0.27 | −0.522 | 0.136 | -0.375 |
| Total precipitation over a ten-day period | ||||
| Control | −0.248 | -0.083 | 0.249 | 0.091 |
| Foliar fertilizer | −0.445 | −0.661 | −0.065 | −0.257 |
Disclaimer/Publisher’s Note: The statements, opinions and data contained in all publications are solely those of the individual author(s) and contributor(s) and not of MDPI and/or the editor(s). MDPI and/or the editor(s) disclaim responsibility for any injury to people or property resulting from any ideas, methods, instructions or products referred to in the content. |
© 2025 by the authors. Licensee MDPI, Basel, Switzerland. This article is an open access article distributed under the terms and conditions of the Creative Commons Attribution (CC BY) license (https://creativecommons.org/licenses/by/4.0/).
Share and Cite
Kuzin, A.I.; Koushner, A.V.; Stepantsova, L.V.; Gritsenko, A.V. Seasonality in Apple Leaf Molybdenum Contents During the Growing Season and Stages of Greatest Need in This Nutrient. Horticulturae 2025, 11, 510. https://doi.org/10.3390/horticulturae11050510
Kuzin AI, Koushner AV, Stepantsova LV, Gritsenko AV. Seasonality in Apple Leaf Molybdenum Contents During the Growing Season and Stages of Greatest Need in This Nutrient. Horticulturae. 2025; 11(5):510. https://doi.org/10.3390/horticulturae11050510
Chicago/Turabian StyleKuzin, Andrei I., Alexey V. Koushner, Ludmila V. Stepantsova, and Andrei V. Gritsenko. 2025. "Seasonality in Apple Leaf Molybdenum Contents During the Growing Season and Stages of Greatest Need in This Nutrient" Horticulturae 11, no. 5: 510. https://doi.org/10.3390/horticulturae11050510
APA StyleKuzin, A. I., Koushner, A. V., Stepantsova, L. V., & Gritsenko, A. V. (2025). Seasonality in Apple Leaf Molybdenum Contents During the Growing Season and Stages of Greatest Need in This Nutrient. Horticulturae, 11(5), 510. https://doi.org/10.3390/horticulturae11050510