Article

Response to Sensor-Based Fertigation of Nagpur Mandarin (Citrus reticulata Blanco) in Vertisol of Central India

1
Indian Council of Agricultural Research, Central Citrus Research Institute, Nagpur 440033, Maharashtra, India
2
Hellenic Agricultural Organization—DIMITRA (ELGO—DIMITRA), Institute of Olive Tree, Subtropical Plants and Viticulture, 73134 Chania, Greece
*
Authors to whom correspondence should be addressed.
Horticulturae 2025, 11(5), 508; https://doi.org/10.3390/horticulturae11050508
Submission received: 13 March 2025 / Revised: 4 May 2025 / Accepted: 6 May 2025 / Published: 8 May 2025
(This article belongs to the Special Issue Orchard Management: Strategies for Yield and Quality)

Abstract

:
In citriculture, inputs like water and fertilizer are applied through traditional basin methods, thereby incurring reduced use-efficiency. The response of conventional crop coefficient-based fertigation scheduling continues to be inconsistent and complex in its field implementation, thereby necessitating the intervention of sensor-based (Internet of Things; IoT) technology for fertigation scheduling on a real-time basis. The study aimed to investigate fertigation scheduling involving four levels of irrigation, viz., I1 (100% evapotranspiration (ET) as the conventional practice), I2 (15% volumetric moisture content (VMC)), I3 (20% VMC), and I4 (25% VMC), as the main treatments and three levels of recommended doses of fertigation, achieved by reappropriating different nutrients across phenologically defined critical growth stages, viz., F1, F2, and F3 (conventional fertilization practice), as sub-treatments, which were evaluated through a split-plot design over two harvesting seasons in 2021–2023. Nagpur mandarin (Citrus reticulata Blanco) was used as the test crop, which was raised on Indian Vertisol facing multiple nutrient constraints. Maximum values for physiological growth parameters (plant height, canopy area, canopy volume, and relative leaf water content (RLWC)) and fruit yield (characterized by 9% and 5%, respectively, higher A-grade-sized fruits with the I4 and F1 treatments over corresponding conventional practices, viz., I1 and F3) were observed with the I4 irrigation treatment in combination with the F1 fertilizer treatment (I4F1). Likewise, fruit quality parameters, viz., juice content, TSS, TSS: acid ratio, and fruit diameter, registered significantly higher with the I4F1 treatment, featuring the application of B at the new-leaf initiation stage (NLI) and Zn across the crop development (CD), color break (CB), and crop harvesting (CH) growth stages, which resulted in a higher leaf nutrient composition. Treatment I4F1 conserved 20–30% more water and 65–87% more nutrients than the I1F3 treatment (conventional practice) by reducing the rate of evaporation loss of water, thereby elevating the plant’s available nutrient supply within the root zone. Our study suggests that I4F1 is the best combination of sensor-based (IoT) irrigation and fertilization for optimizing the quality production of Nagpur mandarin, ensuring higher water productivity (WP) and nutrient-use-efficiency (NUE) coupled with the improved nutritional quality of the fruit.

1. Introduction

Citrus (Citrus reticulata Blanco) is globally considered a premium fruit crop, and for the future growth of the citrus industry, not only a simple increase in yield but also the production pattern, coupled with input-use efficiency, have to be viewed as major challenging tasks in the light of many newly emerging problems [1,2,3,4]. Nagpur mandarin, popularly known as Nagpur Santra across India, is the most important commercial fruit crop in Central India, being grown over an area of 4.66 × 10⁵ ha with a total production of 6.64 × 10⁶ tons and a productivity of 13.71 tons ha−1. This is substantially lower than the 25–30 tons ha−1 obtained in advanced citrus-growing countries, which could be due to differences in the efficient use of inputs [5], and the application of water and fertilizers in the appropriate amounts at the proper time as two driving factors [6,7,8]. In India, inputs like fertilizers and water are applied through the traditional basin method, resulting in great losses of these important inputs [8,9,10], which are further aggravated by shrinking land resources, a shortage of water, and high labor and input costs [11,12,13,14].
In conventional water management, the crop evapotranspiration-based computation of ETr and Kc is highly technical and labor-intensive, with inconsistent outcomes [15,16,17]. However, increasing automation in micro-irrigation systems along with better delivery mechanisms for nutrients have started making serious inroads toward addressing these issues [18,19,20]. Also, in commercial citriculture, there is a big question mark over the effectiveness of manually operated drip irrigation in the long run, paving the way for automatic-controller-based micro-irrigation for citrus crops over the world [21].
In the conventional sensor-based approach, irrigation scheduling is based on the soil moisture status, which is accessed through capacitance methods [22,23,24] that take into account the replacement of water lost by the plant versus the water absorbed and evaporation losses from the root zone. In such automated operations, in addition to time saving and the removal of human error, adjusting the dynamics of available soil moisture levels is quite precision-based, thereby maximizing the net profits [25,26,27]. Automating citrus irrigation allows growers to apply the right amount of water at the right growth stage and in right place [28,29,30,31].
Conversely, fertigation is one of the major management interventions for maximizing crop production, with a preference for high-frequency fertigation over less-frequent fertigation [32,33]. Achieving better effectiveness in fertigation management requires matching knowledge of the soil fertility status and nutrient uptake pattern to the crop phenology, which is by no means a simple and straightforward exercise. Soil properties, crop characteristics, and growing conditions further affect nutrient uptake [34]. The current citrus production scenario is marked by low productivity coupled with reduced orchard life, low water-use efficiency (WUE), and low NUE, and the fruit quality features a fruit size distribution that leans toward smaller B-and C-grade-sized fruits over A-grade-sized fruits. The absolute absence of any information on the requirement for different types of nutrients across phenological growth stages further lowers the fertigation management performance to below par, regardless of whether conventional fertigation or sensor-based automated fertigation is adopted. Incidentally, the complex operational technicality, poorly trained manpower, and high initial cost of sensor-based fertigation collectively make this method of fertigation the least preferred choice, especially in the Asian citrus industry, including in India [35]. With this background information, our attempt to bridge the two important gaps in fertigation using sensor-based technology (optimum irrigation and type of nutrients as per crop phenology) aims to achieve the following two objectives: (i) to determine the response to sensor-based fertigation treatments on WP and NUE in Nagpur mandarin; and (ii) to optimize sensor-based irrigation and fertilization scheduling for the quality production of Nagpur mandarin.

2. Materials and Methods

2.1. Site Description, Meteorological Data, Cultivation Practices and Experimental Design

The study was conducted in an 11-year-old Nagpur mandarin orchard at a research farm located at the Indian Council of Agricultural Research—Central Citrus Research Institute, Nagpur, India (21°08′48.2″ N latitude and 79°03′1.2″ east longitude, altitude 346 m above mean sea level; Figure 1) over the two harvesting seasons of 2021–2022 and 2022–2023.
Daily climatic data was measured from a manually operated weather station located at the research farm. The average monthly maximum (26.00–46.60 °C) and minimum temperature (12.10–27.10 °C), wind speed (1.30–7.50 kmhr−1), relative humidity (25.00–95.00%), rainfall (377.60 mm), and evaporation (1.77–12.17 mm) were observed to show a wide variation during the period associated with the experiment (January 2021 to December 2023). Cooler December temperatures (26.04 °C maximum and 11.09 °C minimum, coupled with 61.21% relative humidity) compared with those in November (27.88 °C maximum and 15.13 °C minimum with 69.41% relative humidity) induced significant stress in plants under no irrigation. On the other hand, rising temperatures, humidity, and sunshine during the January–February period encouraged the appearance of new flush and fruit set. In contrast, in April–May, the fruit development phase experienced extreme temperatures (up to 47.8 °C), high evaporation rates, and low humidity, slowing the growth. Later on, substantial June rainfall reduced the temperatures, thereby accelerating the fruit development. The initial growth phase (January–February) witnessed rising maximum temperatures (30.34–33.24 °C), lower minimum temperatures (10.11–12.33 °C), high relative humidity (68.58–70.85%), and extended sunshine (8.72–10.08 h), which supported vegetative growth and floral induction. Minimal January rainfall (15.10 mm) further aided this early growth. Substantial rainfall in July (563 mm), September (363 mm), and August (256 mm) supported gradual fruit development. Cooler September–October conditions (19.12–30.78 °C temperatures and 2.41–3.25 mmday−1 evaporation) promoted fruit maturity, with the color-break stage associated with moderate temperatures (10.11–42.41 °C) and humidity (40.25–85.7) for final peel-color changes. These characteristic features from the climate data show the strong association of specific environmental conditions with the phenology of Nagpur mandarin, thereby underlining the importance of tailoring the crop-based irrigation and fertigation strategy. Water stress during the initial months should be carefully monitored to stimulate flowering, followed by hot and dry conditions for early vegetative growth. High rainfall during development supports fruit formation, while humid conditions in the maturity stage aid in fruit ripening. Finally, the cool and dry weather during October facilitates the onset of optimal harvesting conditions. Understanding these weather patterns allows proper decision-making in managing crops of Nagpur mandarin (Figure 2).
At the experimental site, single (online lateral) with ring-type (inline lateral) and double online lateral drip irrigation systems (Jain Irrigation System Ltd., Jalgaon, India) were installed and integrated with a fertigation unit setup (Jain Irrigation System Ltd., Jalgaon, India) for precise water and nutrient management. The capacitive soil moisture and pH sensors (Einnovation Technologies Pvt. Ltd., Pune, India) were installed to monitor soil moisture conditions on a real-time basis, which were supported by temperature sensors (Einnovation Technologies Pvt. Ltd., Pune, India) for recording the ambient and soil temperatures. A voltage-conversion module was also installed for consistent power supply to the system components (SPARTAN-3 FPGA series of routers and gateways), while a high-capacity rechargeable battery powered the setup efficiently. An ARM7 micro-controller (Einnovation Technologies Pvt. Ltd., Pune, India) facilitated the control and processing of sensor data, with a router and gateway enabling seamless communication across devices. The system was further equipped with a solar panel setup (Local Firm) for sustainable energy generation, ensuring uninterrupted operation. Bermad valves (Turbo-IR-S016-SN-19-4222 Q3-35 T6 = 50 H DP 25 U10 D5) were installed for precise water flow control, and a motorized valve (CTF mini motorized valve series CTF-001; Mode CR03; Power—Max 18 W and Pressure—1.6 Mpa) helped to track the irrigation volumes accurately.
An automatic weather station was installed to monitor the weather parameters to optimize the irrigation and fertigation treatments. An experiment using 11-year-old Nagpur mandarin plants having a plant-to-plant and row-to-row plant spacing of 6.0 × 6.0 m was laid out with four levels of irrigation treatments, viz., I1 (100% ET as the conventional practice), I2 (15% VMC), I3 (20% VMC), and I4 (25% VMC), as the main treatments and three levels of recommended doses of fertigation-based fertilizers, achieved by adjusting the metabolic requirements of different nutrients across phenologically defined critical growth stages, viz., F1, F2, and F3 (conventional fertilization practice), as sub-treatments under a split-plot design over two harvesting seasons in 2021–2023, with four replications using 48 experimental units (Table 1). The experimental soil was taxonomically classified as Typic Haplustert (Vertisol), which was characterized as having a high clay content (42.3%) and shrink–swell properties, and which formed deep and wide cracks when dry, according to the World Reference Base of Soil Resources [36]. The soil was diagnosed as having a sub-optimal supply of multiple nutrients, viz., N, P, Fe, Mn, Zn, and B.
The experimental trees were maintained under uniform cultural and other management practices.

2.2. Fertigation Scheduling

A sensor-based (IoT) fertigation system using the venturi principle was employed to deliver a precise amount of water and nutrients. The first irrigation was provided in the last week of December to replenish the soil moisture depleted during the stress period. The fertigation frequency was scheduled for the 2nd and 16th day of each month from February to June and from September to October, excluding July, August, and September, which coincided with the peak rainy days. The recommended nutrient doses (600 N: 400 P2O5: 200 K2O: 50 Boric acid: 100 FeSO4: 100 MnSO4: 100 ZnSO4, gtree−1) were applied as liquid fertilizers at critical phenological growth stages following the proposed schedule (Table 1). The application of specific fertilizers included urea (46:0:0), urea phosphate (18:44:0), potassium sulfate (0:0:50), ferrous sulfate heptahydrate (20% Fe), manganese sulfate monohydrate (32% Mn), zinc sulfate heptahydrate (21% Zn), and boric acid (17.5%). The nutrient solution was prepared and injected into the sensor-based irrigation network, ensuring precise and efficient nutrient delivery to the plants under actual field conditions.

2.3. Irrigation Water Quality and Soil Properties

The irrigation water used in the experiment showed an electrical conductivity of 1.98 dS m−1, a residual sodium carbonate level of 1.2 meqL−1, and a sodium adsorption ratio of 1.22, Cl−1 3.60 meqL−1, Ca2+ 5.18 meqL−1, and Mg2+ 2.30 meqL−1, all of which met the FAO guidelines for agricultural use and were classified as Class 2, meaning that it was suitable for irrigating citrus. The soil was clayey in texture (33.5% sand, 24.2% silt, and 42.3% clay), with a of pH 8.15, an EC of 0.48 dSm−1, and a cation-exchange capacity of 35.5 cmol kg−1. Key soil properties included the volumetric soil moisture content (VMC) at field capacity (FC) and the permanent wilting point (PWP), which were 34.35% and 14.85%, respectively, determined by using the pressure-plate method. The fertility status of the experimental soil within the top 0–15 cm of soil (more than 80% of the feeder roots were concentrated within this rooting depth) was characterized (mgkg−1) as comprising 138.4 KMnO4-N, 14.3 Olsen-P, 160.8 NH4OAc-K, 17.2 DTPA-Fe, 14.5 DTPA-Mn, 2.30 DTPA-Cu, and 0.81 DTPA-Zn.

2.4. Irrigation Setup for Sensor-Based (IoT) Fertigation

A ring-type drip irrigation system, along with a fertigation unit, was installed near the experimental site. A single ring-type inline lateral line placed 50 cm away from the main trunk was used for each unit, featuring a discharge rate of 2 Lhr−1 using irrigation water sourced from an open farm pond. The system utilized pressure-compensating drippers spaced at 50 cm intervals along the lateral lines, with the drip irrigation system operating at an optimal pressure of 1.0 kgcm−2. The inline and online lateral lines were made of LLDPE material with a diameter of 16 mm. Each plant was irrigated at a flow rate of 22 Lhr−1 (lph). The ETNM and irrigation time (IT) were estimated using the reference crop evapotranspiration (ETr), which was calculated daily using the Penman–Monteiths formula; the crop coefficient (Kc,); the area occupied by each tree (A); and the wetted area (WA) using various equations (Table 2). The VMC measurements for each treatment were taken before and after irrigation by the gravimetric method. The AMC was determined for three depth intervals: 0–15 cm, 15–45 cm, and 45–90 cm. The soil moisture value measured by the gravimetric method was then multiplied by the bulk density to convert it into the volumetric soil moisture.
In the current sensor-based fertigation system (Figure 3), capacitive-type wireless soil moisture sensors having a fast response time, high accuracy, and a wide range were integrated with a micro-controller carrying a 16-bit processor. This micro-controller contained program memory and data memory (RAM) for storing operational data, digital and analog I/O ports for interfacing with sensors and actuators, a ZigBee module for wireless communication, and a router that collectively extended the network range and ensured reliable data transmission across the field, relaying sensor data to the micro-controller and command data from the graphical user interface (GUI) to the drip irrigation system. The micro-controller processed input data from the capacitive-type soil moisture and pH sensors and transferred the information to a ZigBee module located at the sensing unit. At the main station, another ZigBee module received the sensory data and later displayed these on a graphical user interface (GUI) on a computer. The GUI provided complete control over the entire fertigation system, allowing users to initiate or stop the irrigation and fertigation processes directly from the interface. The soil moisture sensor managed the valve of the water tank, preventing excess water application to the plants. Meanwhile, the soil pH sensor controlled the valve of the venturi injector, ensuring that the soil pH remained within the optimal range of 5.5 to 7.5.
Having precise control over the water and fertilizer application helped to conserve resources and prevented the overuse of fertilizers. The sensory data received at the main station were successfully transmitted from the sensing unit, with all the relevant information displayed on a Visual Basic (VB)-based GUI. This interface allowed users to monitor and manage the fertigation system effectively. By leveraging the irrigation and fertilizer data tailored to the various phenological growth stages of Nagpur mandarin, the sensor-based fertigation schedule ensured that each part of the orchard received the precise amount of water and nutrients needed, thereby optimizing the inputs. Hence, water and fertilizer were delivered through the developed micro-controller using the ZigBee modules, the soil moisture sensor network, and the micro-irrigation system.

2.5. Observations of Key Growth Parameters

The growth-contributing parameters were measured to evaluate the response in terms of plant growth. The stock girth (stem diameter at 0.01 m above the bud union), canopy diameter (canopy spread through north–south and east–west directions), plant height (distance from the ground surface to the top of the plant crown), and stem height (distance from ground surface to the base of first branch) were recorded using a metric tape for accuracy. The canopy volume was calculated using the formula developed by Obreza [40] and the procedure adopted by Panigrahi [41], i.e., Vc = 0.5238 HW2, where Vc represents the canopy volume (m3); H is the difference between the tree height and the stem height (m); and W is the mean canopy width measured in the north–south and east–west directions (m).

2.6. Fruit Yield and Fruit Analysis

The fruit weight (g) and number of fruits tree−1 were recorded for each treatment, and the mean yield tree−1 was calculated. The total yield (tons ha−1) was then computed based on the yield tree−1, considering a planting density of 278 trees ha−1. Weekly fruit growth measurements were made using a digital slide caliper. Ten random fruits per plant were tagged immediately after fruit set (mid-April) from four plants per treatment. The fruit height and diameter were measured weekly. The rate of fruit growth (FGR), expressed in mmday−1, was calculated using the following formula [42]: F G R = ( I n   D 2 I n   D 1 ) ( T 2 T 1 ) , where D2 is the final mean diameter (mean of the polar and equatorial diameters); D1 is the initial mean diameter (mean of the polar and equatorial diameters); and (T2−T1) is the difference in time (7 days). The fruit quality parameters, viz., fruit length (mm), fruit diameter (mm), fruit axis diameter (mm), rind thickness (mm), number of segments, juice content (%), TSS (°Brix), acidity (%), and TSS: acid ratio, were recorded following standard procedures [43,44]. Observations of the fruit size distribution, based on the percentage of graded fruits, were recorded based on the analysis of 200 fruit samples per treatment. The diameters of fruit samples from each treatment were measured using a Vernier caliper (0.01 mm accuracy). The fruits were graded into size categories (A-grade: more than 80 mm; B-grade: 70–80 mm; C-grade: less than 70 mm), and percentage distribution studies were carried out.

2.7. Determination of Leaf and Fruit Nutrient Composition

2.7.1. Sample Collection and Preparation

Three- to five-month-old Nagpur mandarin leaves (the 3rd and 4th leaves from the top of the non-fruiting terminals) were collected from a height of 1.5 m from the ground surrounding the plant canopy at the end of October, following the methods described by Srivastava et al. [45]. The collected leaf samples were thoroughly washed [46], initially air-dried in the shade, and then oven-dried at 65 °C to a constant weight. The dried leaves were ground to obtain homogeneous samples for acid digestion. Similarly, ten mature, fresh, and undamaged fruit samples were randomly selected from trees within each treatment. The fruit samples were thoroughly washed with distilled water to remove dirt, air-dried, and then oven-dried at 65 °C to a constant weight. Finally, the ready leaf and fruit samples were subjected to acid digestion.

2.7.2. Digestion and Analysis

Both the leaf and fruit samples were digested using a di-acid mixture (two parts HNO₃ and one part H2SO4) until clear digests were obtained. The digested samples were subjected to an analysis of their macronutrients, viz., P (colorimetrically using Spectronic 21D; USA), K (flame photometrically using the 392 Dual Channel; Systronic, New Delhi, India), and Ca and Mg (titrimetrically by versene titration), and micronutrients, viz., Fe, Mn, Cu, and Zn (using an atomic absorption spectrophotometer; GBC-908; Melbourne, Australia) following standard recommended procedures [47,48]. Nitrogen was directly measured using powdered leaf and fruit samples using an Auto-N Analyzer (Perkin Elmer 2410 Series, Springfield, IL, USA).

2.8. Statistical Analysis

The data were analyzed statistically using analysis of variance (ANOVA). The F-test was employed to assess the significance of the treatments at the 5% significance level. Principle component analysis (PCA) and the development of regression equations for the prediction of fruit yield were performed using IBM-SPSS statistical software (version 27). The multivariate analysis, including the correlation matrix (using PROC CORR), and PCA (using PROC PRINCOMP procedure) were also performed using different software. Data for different years were tested and the treatment means were compared using t-tests.

3. Results and Discussion

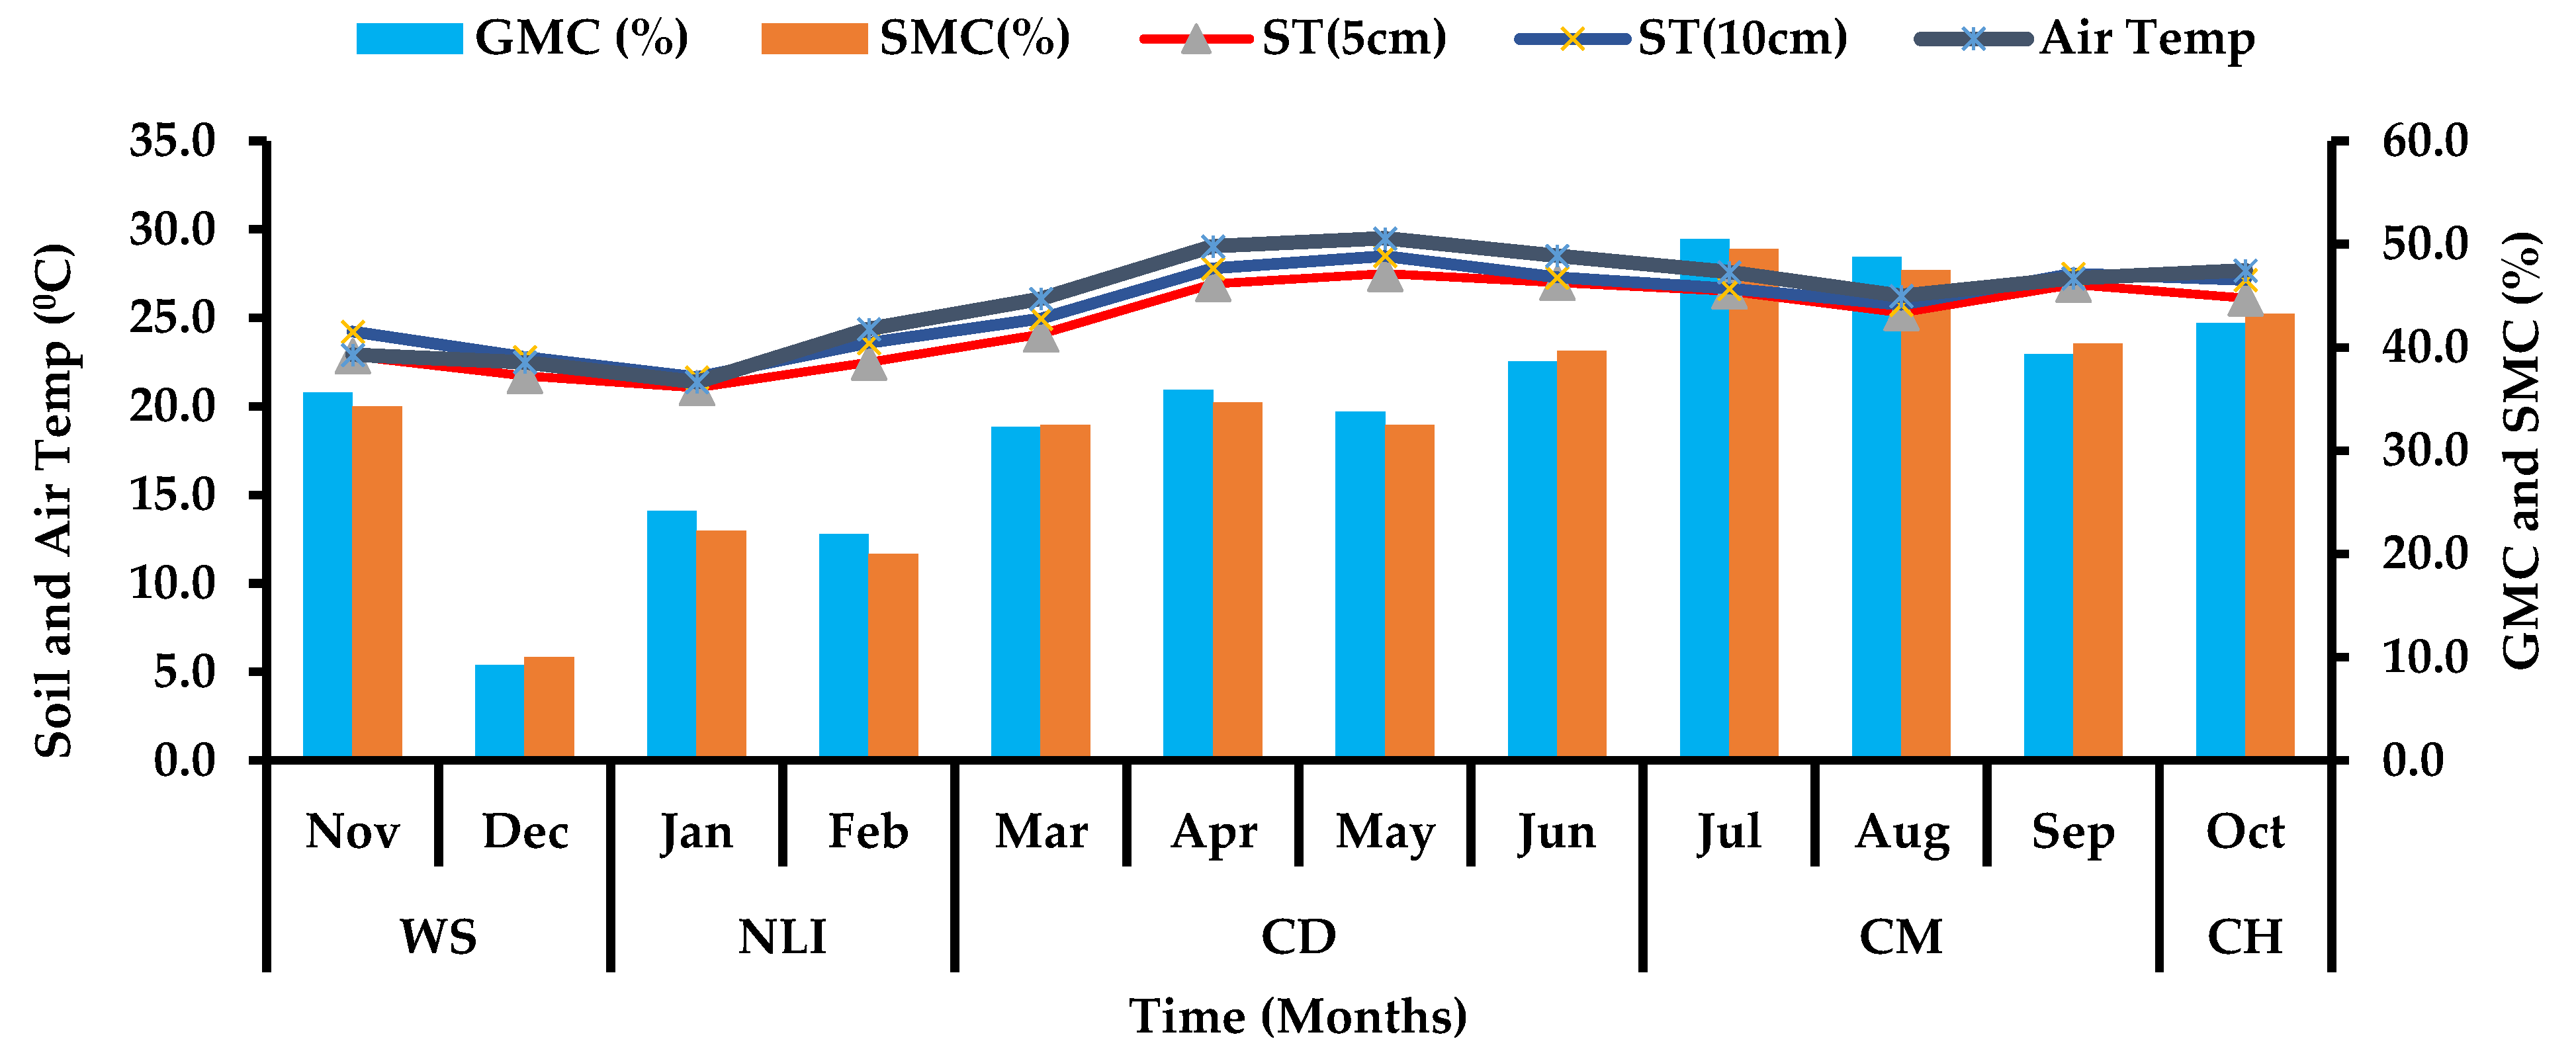
3.1. Dynamics of Crop Phenology and Distribution of Soil Moisture

The phenological stages of Nagpur mandarin (Figure 3) included the WS, NLI, CD, CM, and CH, characterized by the specific growth cycle of Nagpur mandarin. This information captured the plant’s developmental trajectory, which aligned closely across the two harvesting seasons of 2021–2023. During the water-stress period spanning over 50 days in November–December, 30–50% leaves of the plants fell down, marking the onset of optimum stress to the plants, and following resumption of irrigation, the formation of new leaves was initiated, followed by flowering and fruiting, which took place over 60 days from January to February in both years, a period characterized by cool and mild weather conducive to leaf-bud formation. Following the initiation phase, the crop development stage occurred from March to June, lasting approximately 120 days. The crop maturity stage extended from July to September over a 60-day period. During this phase, the canopy reaches its maximum functional capacity, and the focus shifted from vegetative growth to fruit enlargement and ripening, which lasted up until mid-October. The final phase coincided with the harvesting stage, encompassing approximately 60 days from the onset of maturity to harvest during mid-October–November. Timely harvesting in this window is crucial for capturing the best quality fruit, characterized by balanced peel color, and ratio of TSS and acidity, in addition of fruit size distribution. These phenological stages highlighted the consistency in the annual growth rhythm of Nagpur mandarin across the two harvesting seasons. Each stage aligned well with the specific environmental conditions necessary to optimize growth and fruit quality. Understanding these stages will facilitate scheduling irrigation and nutrient applications.
The comparison of soil moisture content (SMC), measured by capacitive-type soil moisture sensors, and the gravimetric moisture content (GMC) across different phenological stages (Figure 4) showed a contrasting difference. During the WS period in the months of November–December, GMC values were significantly higher (35.25%) than those of SM (10.00%), indicating the under-estimation of soil moisture through the sensors under dry soil conditions. As the soil moisture recovered during the NLI stage (January–February), the GMC was observed to be only marginally higher (22.25%) than the SMC (20.00%), suggesting the better utility of SMC under optimum soil moisture conditions. With further advancement in the plant growth stage to CD (March–May), the gap between the GMC (34.65%) and the SMC (32.50%) narrowed, reaffirming the utility of the SMC over the GMC. During the CM stage in the monsoon months (June–August), the GMC and SMC showed the highest agreement, with both methods capturing peak moisture levels (45.49%) in July [49,50,51]. Hence, GMC proved to be more useful than GMC under moist soil conditions and vice-versa under dry soil moisture conditions.

3.2. Plant Growth Characteristics in Response to Fertigation Scheduling

The I4 treatment exhibited the highest values for the plant growth parameters (Table 3) (viz., plant height, stem diameter, and canopy volume), significantly outperforming the other treatments (p ≤ 0.05). The improved RLWC under the I4 treatment indicated better water uptake and physiological efficiency, contributing to enhanced vegetative growth. In contrast, the I1 treatment consistently recorded the lowest growth metrics. Earlier studies by Panigrahi and Srivastava [11] indicated greater plant growth of Nagpur mandarin due to an increase in the leaf photosynthesis rate and the higher partitioning of photosynthates toward vegetative development of the plants. Amongst the different fertilization strategies, F1 produced the highest plant height, stem diameter, and canopy volume, along with the highest RLWC, underscoring the importance of optimal fertigation in ensuring balanced water and nutrient availability, which is mandatory for plant growth and development. In contrast, F3 resulted in the lowest growth and physiological parameters, indicating the ineffectiveness of lower fertigation levels. These observations further indicate the necessity of including B during the NLI growth stage and Zn across all the three growth stages of CD, CM, and CH. Such a crop growth response in nutrient partitioning provides further rationalization in nutrient use without affecting the net RDF requirement of the crop.

3.3. Sensor-Based (IoT) Fertigation and Fruit Quality Parameters

The fruit quality parameters, viz., juice content, total soluble solids (TSS), acidity, TSS: acid ratio, and fruit diameter (Table 4), varied significantly across the irrigation and fertilization treatments (p ≤ 0.05). Treatment I4 as an irrigation treatment and F1 from among the fertilization treatments recorded the highest fruit quality parameters coupled with the greatest fruit diameter. These results indicated that the combination of I4 and F1 was the most effective treatment combination, providing optimal moisture along with optimized nutrient availability, thereby supporting improved metabolic activity and, consequently, fruit development.
Earlier studies reported that the water deficit created by sensor-based irrigation within the plant root zone was associated with increased fruit firmness coupled with improved fruit quality, especially toward the CH growth stage [52].

3.4. Effect of Sensor-Based Ferigation Scheduling Treatments on Yield Attributes and WP

The fruit yield attributes, viz., number of fruits tree−1, fruit weight, total yield, and WP (Table 5), varied significantly amongst the irrigation and fertigation treatments (p ≤ 0.05). The I4 treatment from amongst the irrigation treatments and F1 from amongst the fertilization treatments recorded the highest values for all the yield-attributing parameters, outperforming all the other treatments.
These results suggest that the optimal irrigation provided by I4 facilitated higher fruit set, growth, and water-use efficiency by maintaining adequate soil moisture levels throughout the growth cycle. In contrast, I1 exhibited the lowest yield attributes, including the number of fruits per tree (611.00), fruit weight (158.43 g), yield (96.98 kg/tree), and WP (2.98 kg/m3). These findings indicate that inadequate irrigation under I1 created water stress, negatively impacting fruit development and water productivity.
Sensor-based fertigation treatments also significantly influenced the yield and water productivity. The F1 treatment recorded the highest performance, with 750.75 fruits per tree, a fruit weight of 176.79 g, a yield of (133.43 kg/tree), and the highest water productivity (5.69 kg/m3). The enhanced performance under F1 can be attributed to the balanced and timely supply of nutrients, which supported optimal physiological and metabolic processes essential for fruit growth and yield. F3, on the other hand, showed the lowest values across all parameters, including 697.37 fruits per tree, a fruit weight of 158.91 g, a yield of 110.52 kg/tree, and WP of 4.74 kg/m3. The limited nutrient availability in F3 likely constrained the plant’s ability to achieve its full growth and yield potential.

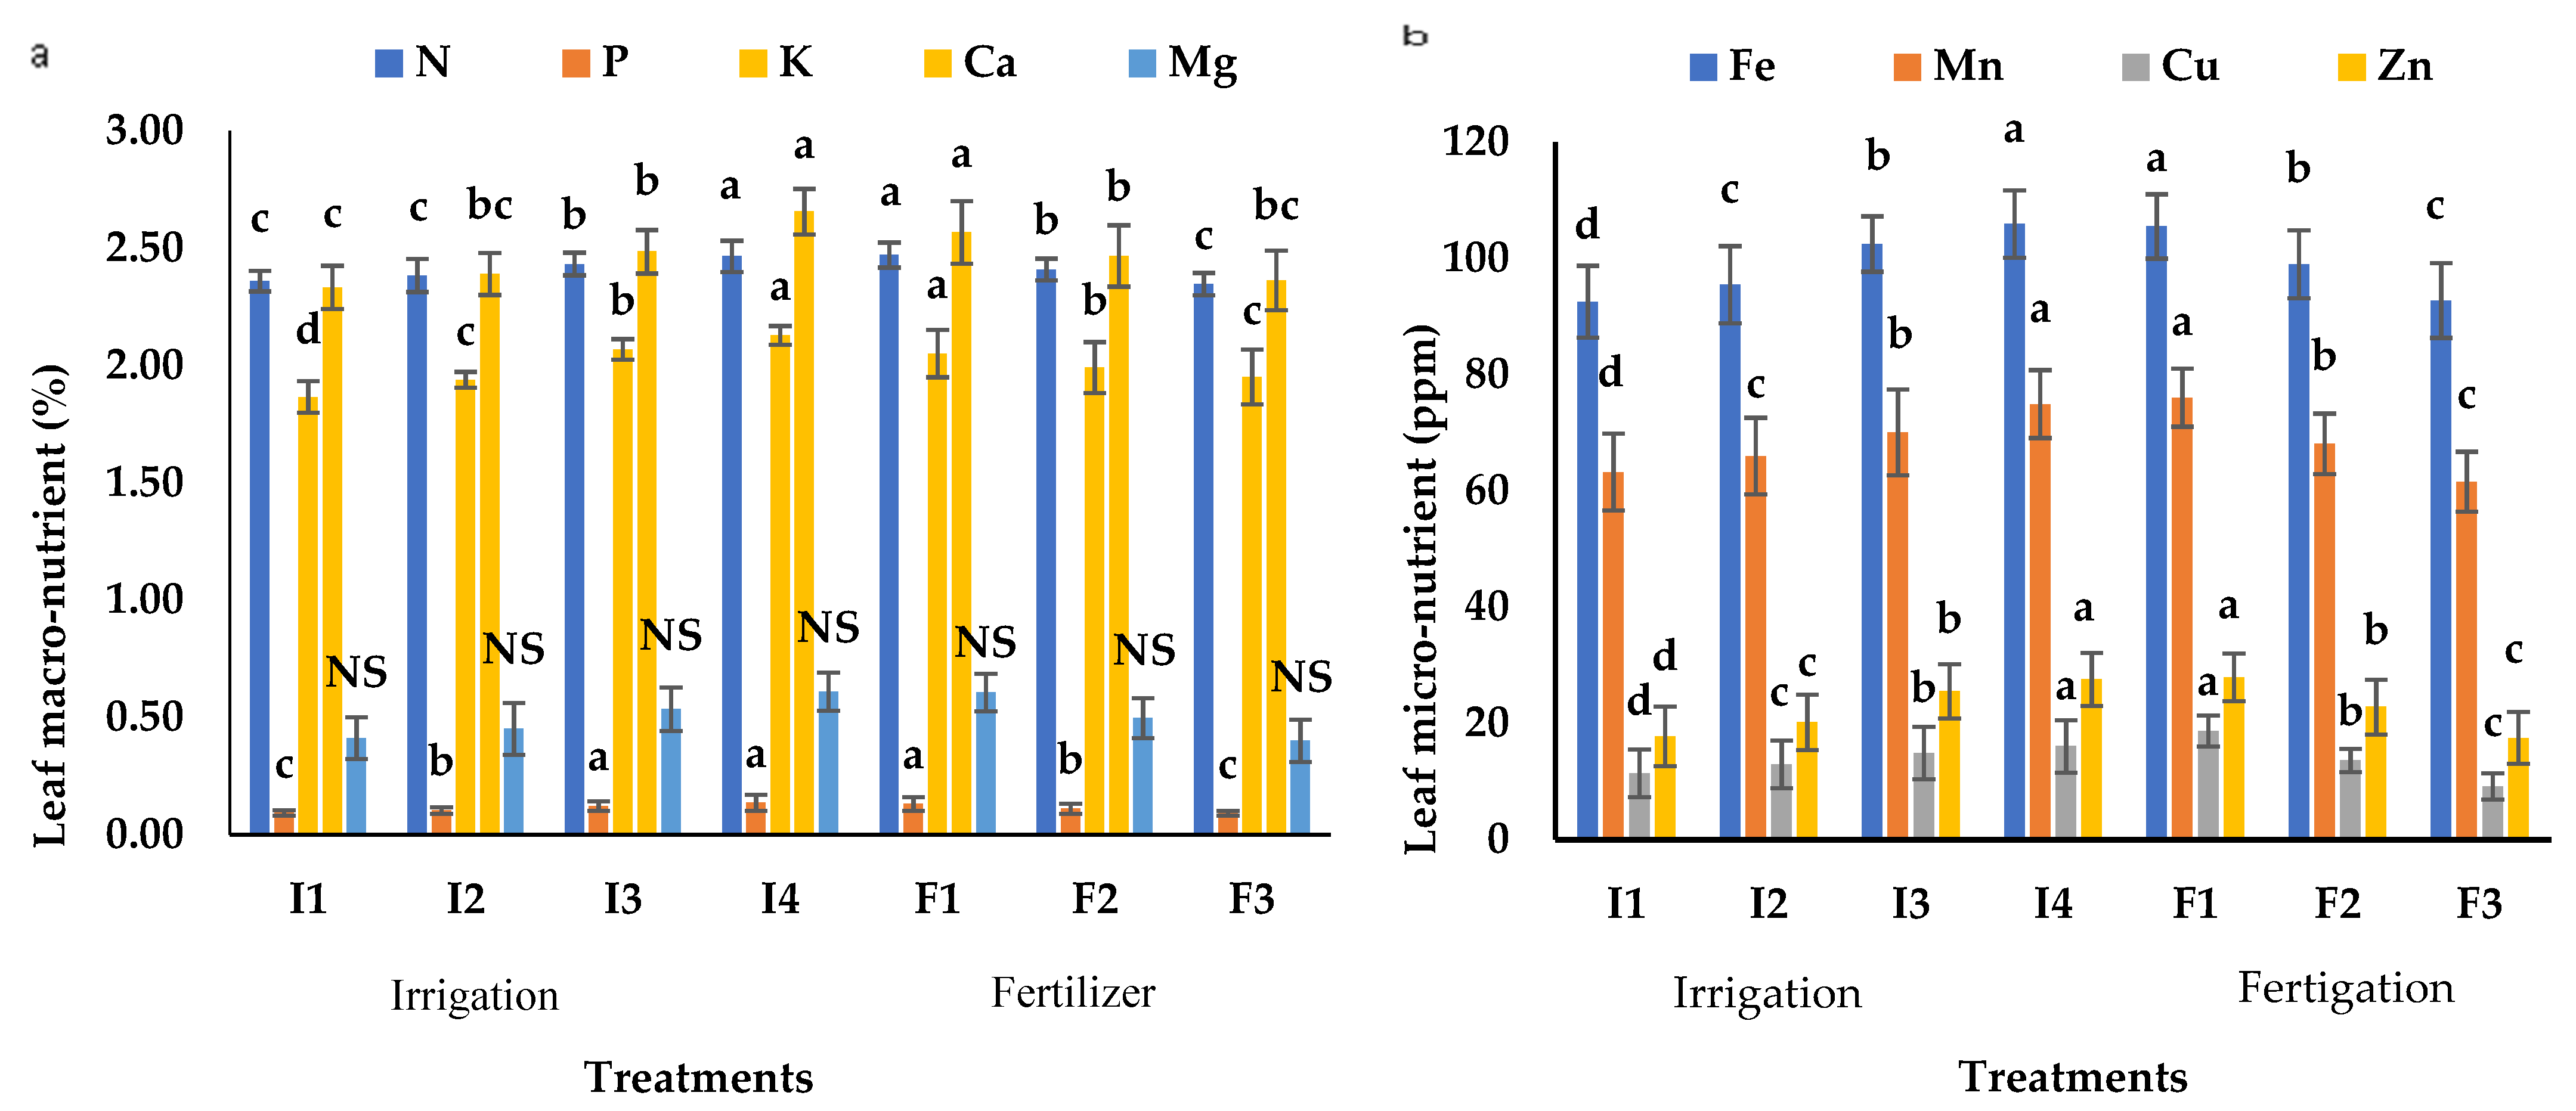
3.5. Response of Sensor-Based (IoT) Fertigation on Leaf Nutrient Composition

Leaf nutrient composition showed a significant response to sensor-based drip irrigation and fertigation treatments (Figure 5a). For the major macronutrients, viz., N, P, and K, the I4 and F1 treatments showed significantly higher values over I2–I3 and F2–F3, respectively, supporting the fact that the optimum delivery of water is necessary for improved NUE. Also, conventional methods of both irrigation (I1) and fertilization (F3) proved inferior to sensor-based application treatments. Secondary nutrients, such as Ca and Mg, also showed significantly higher accumulation under I4 (2.26 and 1.69%) and F1 (2.13 and 1.78%) treatments compared with their conventional irrigation practices of their counterparts, I1 (1.79 and 1.61%) and F3 (1.96 and 1.60%), lending strong support in favor of sensor-based fertigation for optimizing the use-efficiency of applied fertilizers.
All the four micronutrients, viz., Fe, M, Cu, and Zn, responded significantly to sensor-based irrigation and fertilization treatments (Figure 6b). The highest values of leaf Fe and Mn were observed with the I4 irrigation treatment (106.2 and 67.4 ppm) and the F1 fertilization treatment (107.43 and 78.36 ppm), signifying their improved availability with adequate soil moisture supply (Figure 5b). Conversely, treatments I1 and I2 demonstrated significantly lower Fe and Mn levels, reflecting their reduced uptake under water stress. Leaf Cu and Zn concentrations were less variable across treatments but still recorded significantly higher levels under optimal fertigation conditions (F1 and F2 compared with F3 as conventional practice). The results emphasized the role of striking a balance between irrigation and fertigation in enhancing nutrient availability and productivity for Nagpur mandarin. Such improvements in the leaf nutrient composition is anticipated to have direct implications on the fruit nutrient composition.

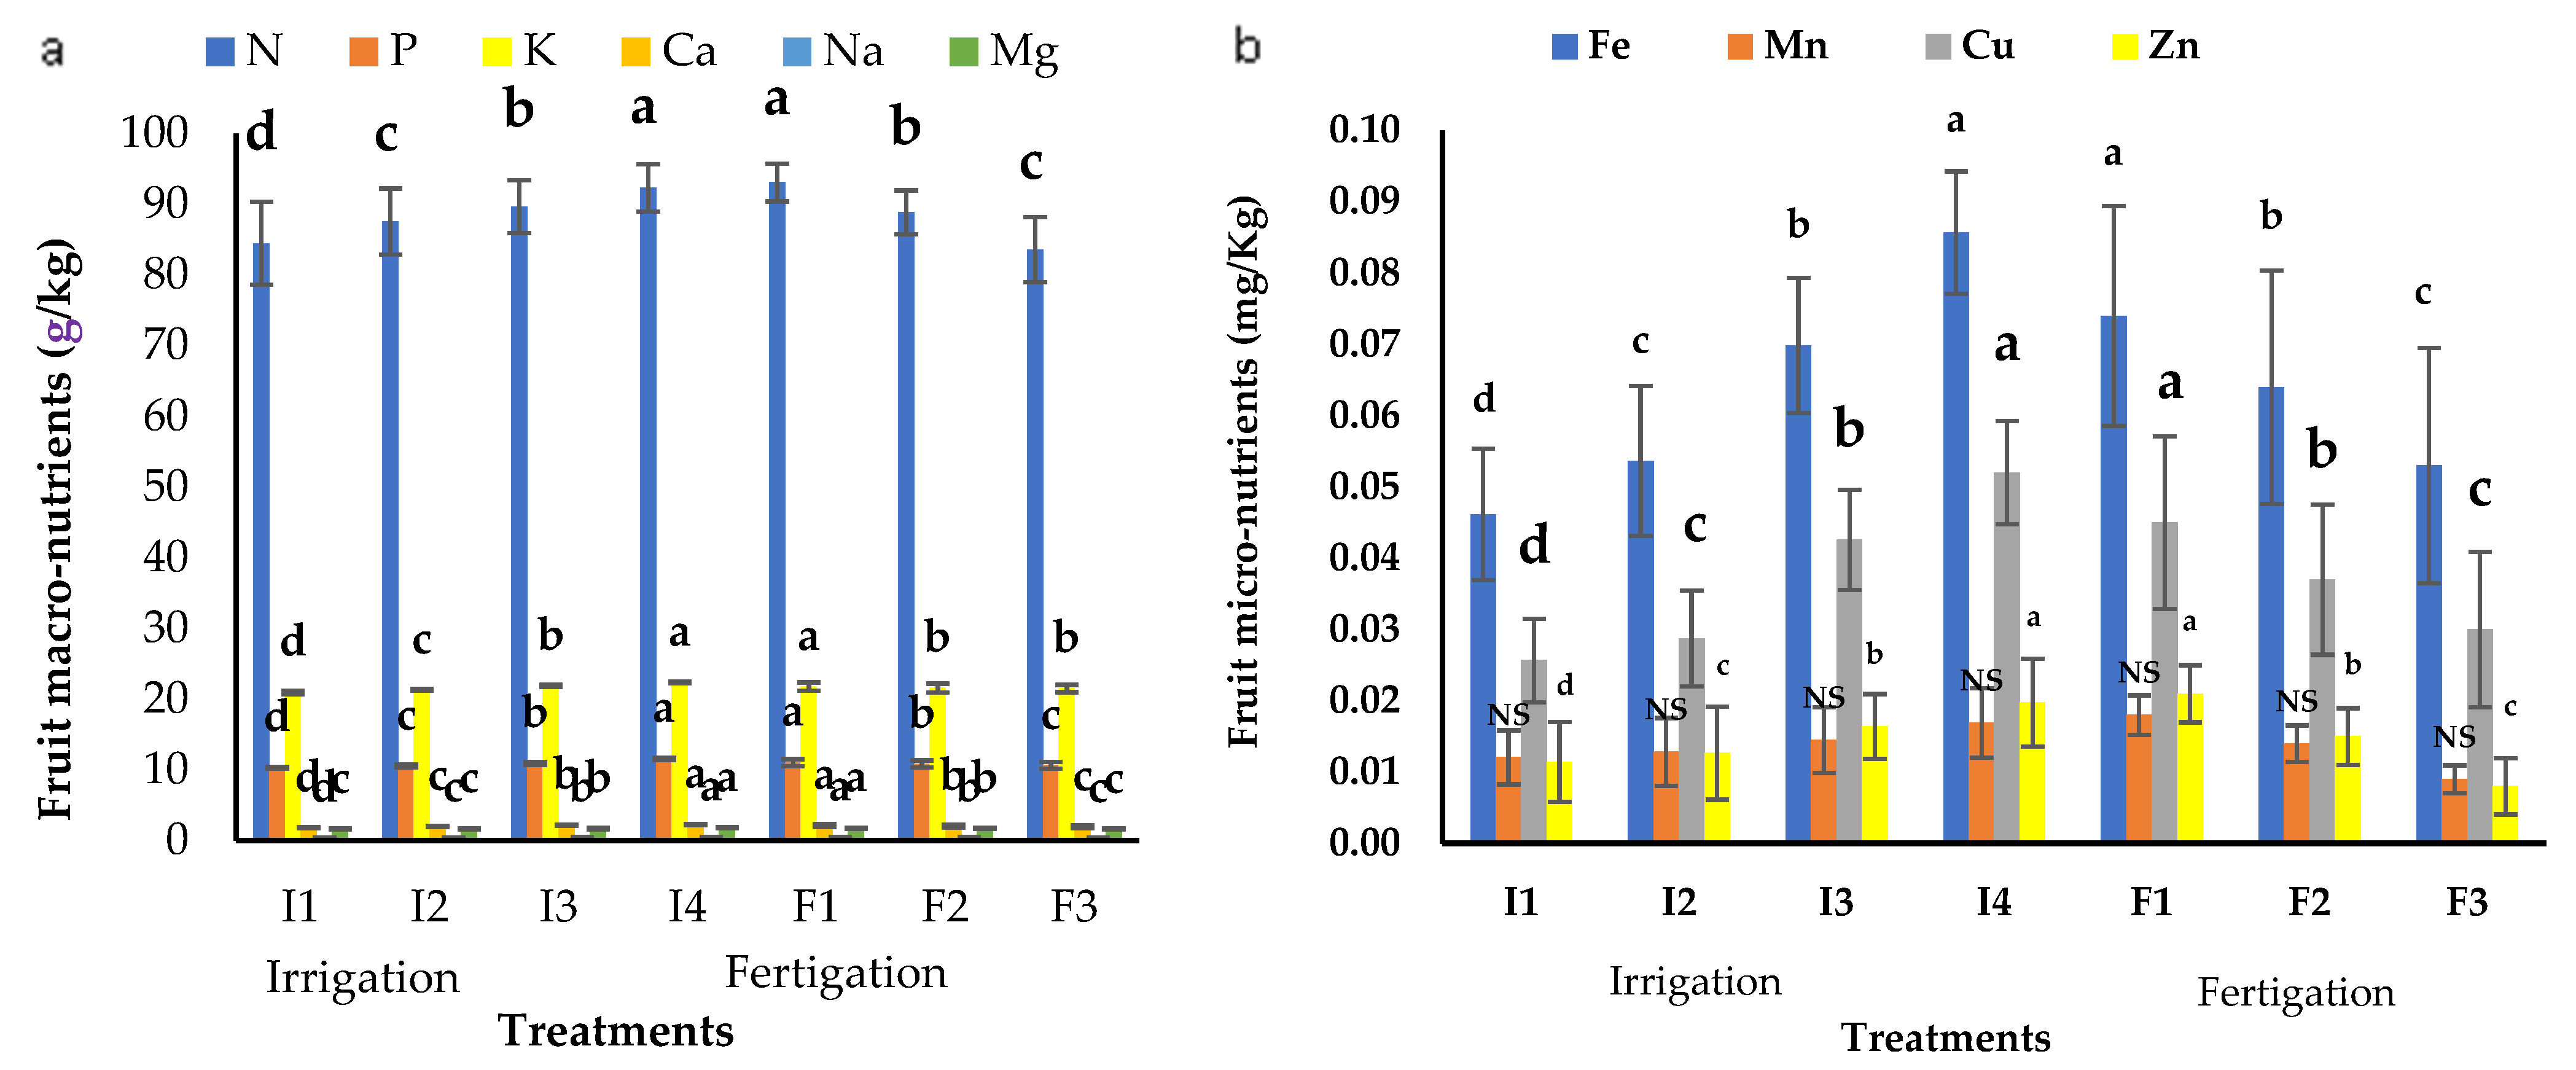
3.6. Sensor-Based Fertigation Scheduling Treatments and Fruit Nutrient Composition

Fruits are considered a strong nutrient sink, which relates directly with their nutritional quality. A direct relation between leaf nutrient concentration and fruit nutrient composition is an indicator of balanced fertilization. The effect of sensor-based irrigation and fertigation treatments showed a significant effect on the fruit macronutrient composition (Figure 6a). The treatments further showed significant differences (p < 0.05) in nutrient concentrations between the irrigation and fertigation treatments.
Among the irrigation treatments, I4 recorded the highest concentrations of N, P, and K, which were significantly higher compared with those under the other irrigation treatments, viz., I1, I2, and I3. The superior performance by I4 was attributed to optimum moisture availability, which is necessary for maintaining adequate nutrient-supply levels and the subsequent efficient nutrient uptake by the plant root to ensure their accumulation in the fruits. In contrast, treatment I1 under-performed, showing the lowest values for all the macronutrients, suggesting that water stress is a strong barrier to nutrient uptake and their onward translocation. Meanwhile, amongst the fertigation treatments, F1 registered the highest macronutrient concentration, particularly for N, K, and Ca, followed by F2 and F3 in decreasing order of significance. The superiority of F1 over other fertilization treatments like F2 or F3 lies in the addition of B at the NLI stage and Zn during the CD, CM, and CH stages of the crop, providing strong clues for the existence of a dynamic balance in the stoichiometric relations between nutrients. Notably, the concentrations of Na and Mg were consistent across the different treatments, but they remained relatively lower compared with those of other nutrients, reflecting their minor role in fruit nutrient composition. On the other hand, significant variation was invariably observed with respect to fruit Fe and Cu contents across the irrigation and fertigation treatments (Figure 6b), while Mn and Zn showed non-significant responses. Amongst the irrigation treatments, I4 recorded the highest Fe content (0.080 mgkg−1), which was significantly higher than that under the I1 and I2 treatments; this was likely due to its better soil moisture conditions, thereby enhancing nutrient availability and further uptake by the plant. In contrast, the lowest Fe content (0.040 mgkg−1) was observed with I1 due to water stress converting iron into higher-valency ferric forms, which are not available for plant uptake. Similar trends were observed for the Cu content, with I4 exhibiting significantly higher values (0.032 mgkg−1) compared with the other irrigation treatments. The improved Cu accumulation by fruits under the I4 treatment could be linked to optimal soil moisture facilitating Cu solubility and root absorption.
In the fertigation treatments, the Fe and Cu content showed noticeable variations, with F1 and F3 performing at par with I4 with respect to the Fe content in fruits. However, the Cu content exhibited marginal improvements with the F2 treatment compared with the other fertigation treatments, although the differences remained statistically significant. On the other hand, Mn and Zn content across all the treatments, both for irrigation (I1–I4) and fertigation (F1–F3), exhibited non-significant differences. These initial observations hinted that fruits are perhaps a poorer indicator of Mn and Zn accumulation in Nagpur mandarin. Such outcomes for the fruit nutrient composition reaffirm the importance of fine-tuning irrigation and fertigation schedules to achieve a balance between nutrient delivery options and the nutrient accumulation pattern in fruits to obtain a better nutritional quality of citrus fruits coupled with uncompromised fruit yields.

3.7. Sensor-Based Fertigation Scheduling Treatments and Distribution of Fruit Size

The distribution of fruit size demonstrates the market value of the yield response. The irrigation and fertigation treatments in our study showed a pronounced effect on the size distribution of Nagpur mandarin fruits. Amongst the irrigation treatments, the I4 treatment registered 9% more A-grade fruits, 10% more B-grade fruits, and 19% fewer C-grade fruits over I1 as the conventional irrigation practice. Likewise, fertilization treatment effectively promoted the development of larger fruit sizes and reduced the proportion of undersized fruits (C-grade) (Figure 7). The F1 fertilization treatment produced the best response by far with regard to the fruit size distribution, which is also well supported by the fruit yield. The F1 treatment showed 5% more A-grade-sized fruits, 9% more B-grade-sized fruits, and 14% fewer C-grade-sized fruits over the conventional F3 fertilization practice. These findings highlight the superiority of I4 as an irrigation treatment and F1 as a fertigation treatment over other counterpart treatments in improving the proportionate distribution of A-grade fruit size over C-grade fruit size coupled with fruit quality parameters.

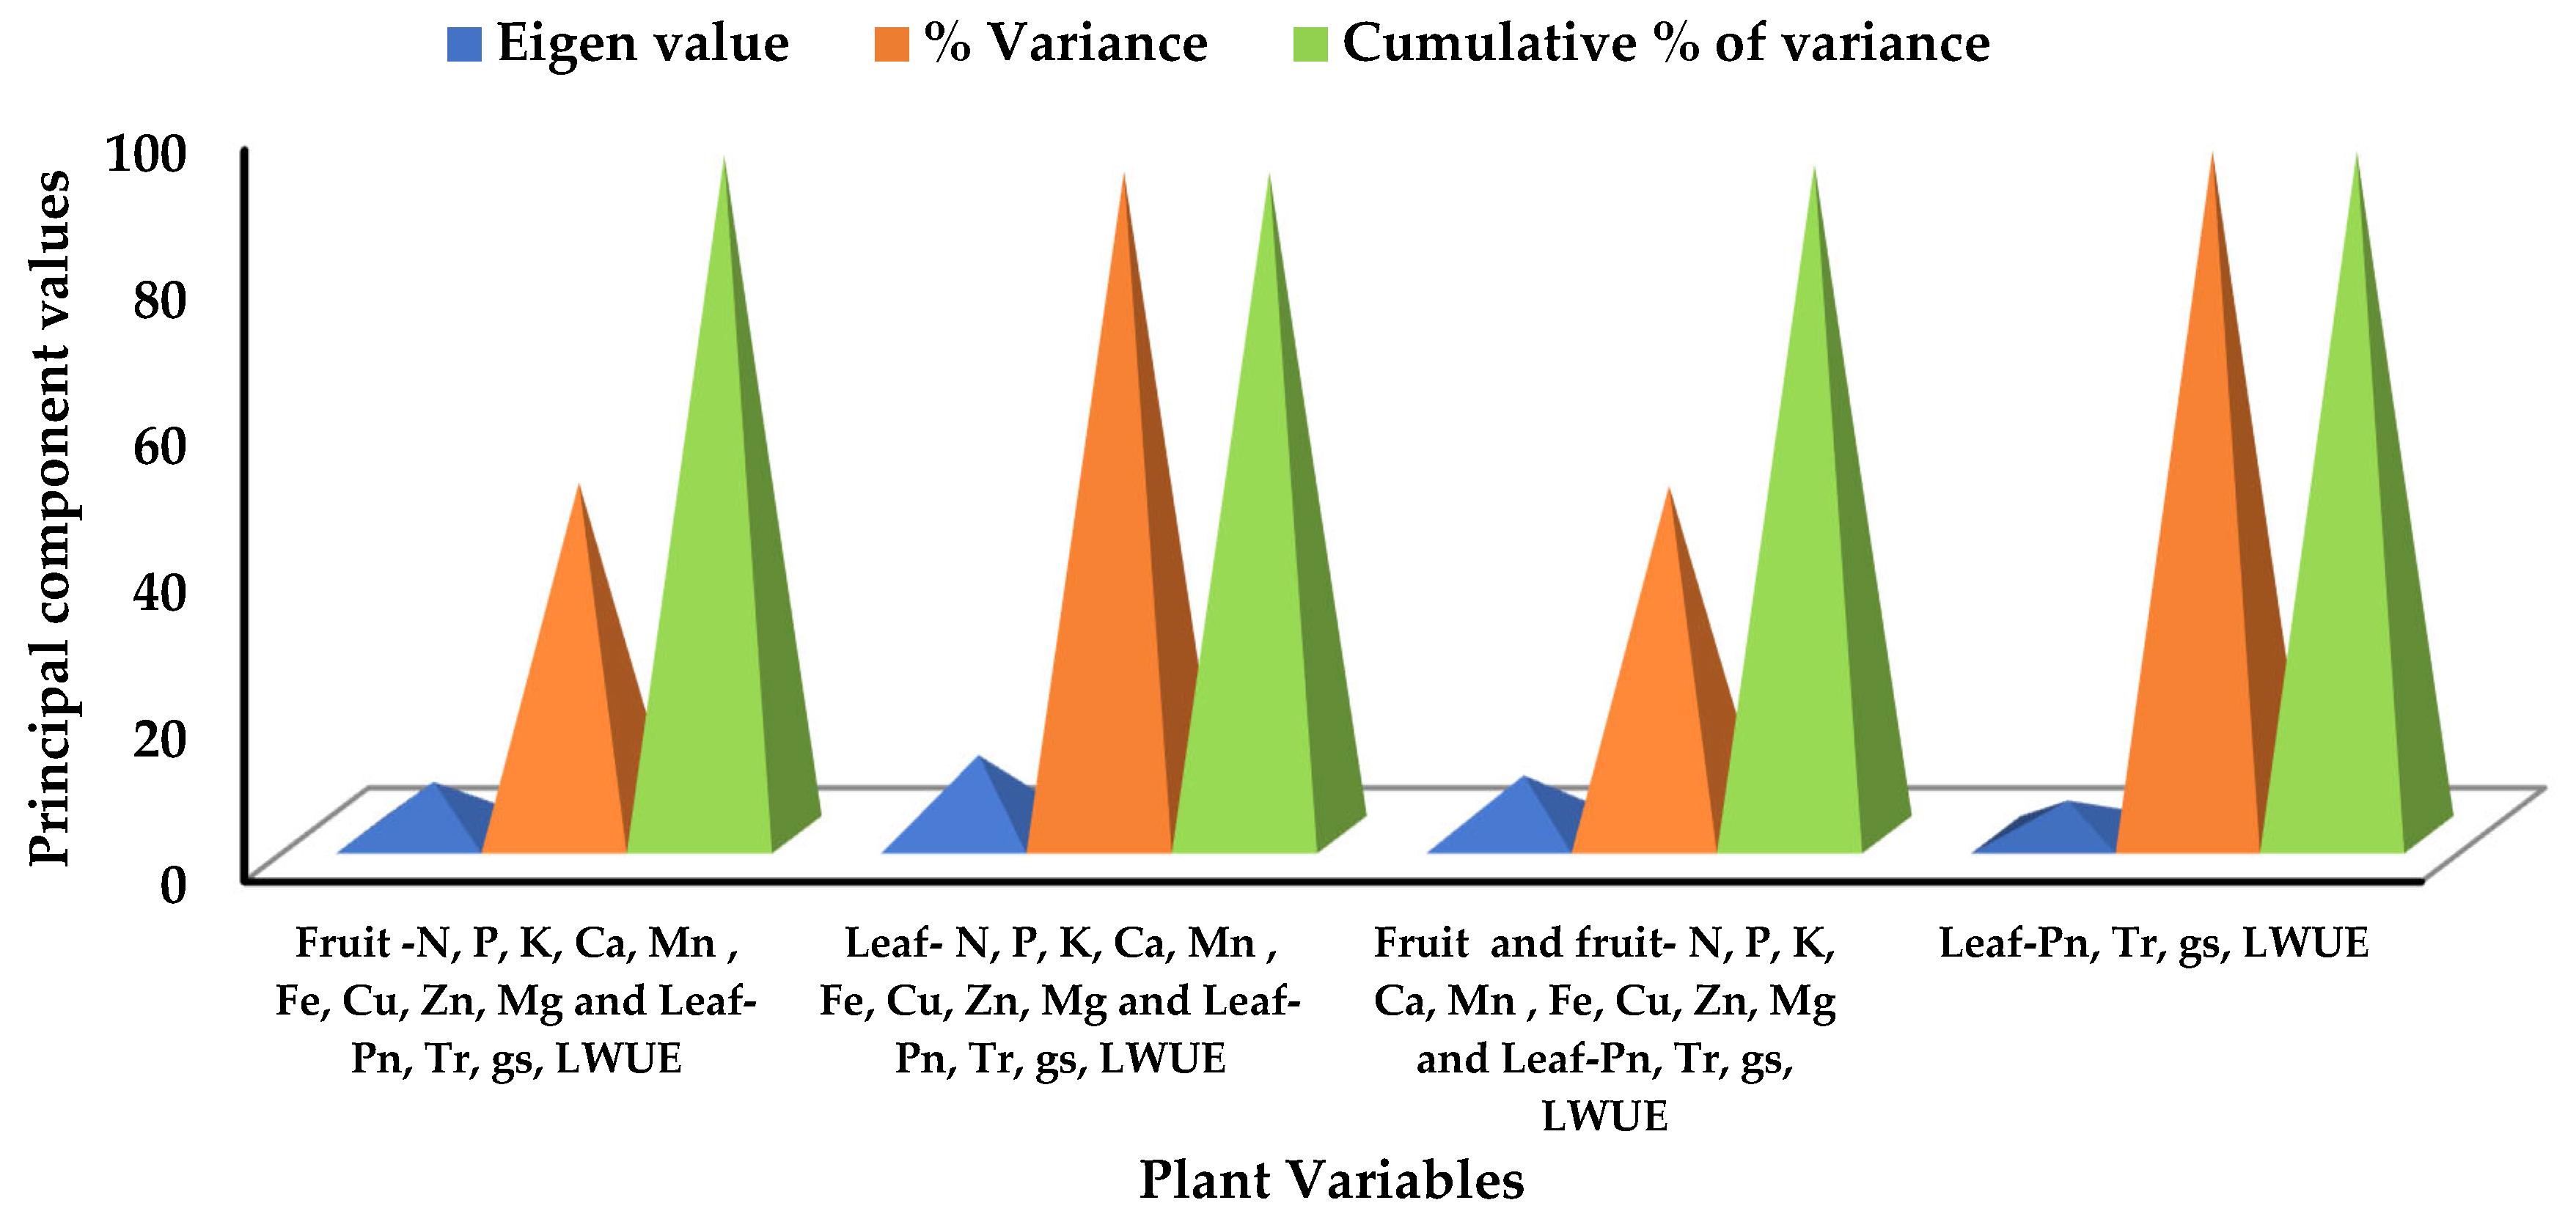
3.8. Correlation Between Fruit Yield and Other Plant-Based Variables

Yield (tons ha−1) showed strong positive correlations with WP (r = 0.94, p = 0.01), CV (r = 0.91, p = 0.01), leaf N (r = 0.85, p = 0.01), and Pn (r = 0.94, p = 0.01), indicating the impact of optimized fertigation on crop productivity (Figure 8). Leaf macronutrients, viz., P and K, correlated positively with fruit P (r = 0.89, p = 0.01) and K (r = 0.92, p = 0.01) concentrations, suggesting that both the nutrient sinks operated in tandem. Likewise, the RLWC was highly correlated with physiological traits like Tr (r = 0.87; p = 0.01), gs (r = 0.92; p = 0.01), and LWUE (r = 0.92; p = 0.01), showcasing the role of effective water management in the physiology of plant nutrition. Fruit micronutrients such as Fe, Mn, and Zn correlated significantly with leaf Fe (r = 0.93, p = 0.01), Mn (r = 0.96, p = 0.01), and Zn (r = 0.91, p = 0.01) content, emphasizing the importance of balanced nutrient application to ensure a balance in the nutrient supply between the leaf as the nutrient source and the fruit as the nutrient sink. These findings reinforce the efficiency of sensor-based fertigation in improving resource-use efficiency, fruit yield, and fruit quality. The other detailed correlation values provide useful insights for further enhancing the fertigation strategies.
The strong relationship of fruit yield with Tr and gs was earlier observed by Dzikiti et al. [53] in citrus under micro-irrigation. The PCA provided significant insights into the factors influencing the physiological and nutritional traits of Nagpur mandarin. The analysis efficiently reduced the dataset’s complexity, with eigenvalues and variance percentages highlighting the most critical components. The second PCA component for the leaf nutrient status (N, P, K, Ca, Mn, Fe, Cu, Zn, Mg) and physiological parameters (Pn, Tr, gs, and LWUE) exhibited the highest eigenvalue (10.88) and accounted for 90.62% of the total variance (Figure 9). These observations highlight the critical role of plant nutrition and plant physiological traits in influencing crop performance. The first PCA component, combining fruit nutrient content and leaf physiological traits, explained 48.19% of the total variance with an eigenvalue of 7.23, indicating the importance of these traits in fruit development and overall productivity. The third PCA component, integrating both fruit and leaf traits, accounted for 47.75% of the variance, further emphasizing the interconnection between these variables. Interestingly, the fourth PCA component, which focused solely on leaf physiological traits, captured 93.43% of the cumulative variance despite showing the lowest eigenvalue (4.67). These observations indicate that parameters such as Pn, Tr, gs, and LWUE are highly influential in determining crop productivity and efficient photosynthate partitioning. The high cumulative variance across components, ranging from 90.62% to 93.43%, validated the robustness of the PCA in capturing the variability within the dataset and identifying the key drivers of growth, yield, and quality in Nagpur mandarin.
The dominance of leaf physiological traits and nutrient status suggested their significant role in optimizing photosynthesis, WUE, and nutrient uptake, all of which were critical in enhancing the fruit quality and yield. Furthermore, the combined analysis of fruit and leaf traits highlighted their synergistic impact on overall crop performance. These findings emphasize the need for precise and targeted nutrient and irrigation management practices. Sensor-based fertigation strategies tailored to address plant nutrient deficiencies and to optimize physiological functions significantly improved productivity and fruit quality while ensuring sustainable resource use. The PCA results thus provide a scientific basis for developing precision citriculture techniques that enhance the WP, nutritional density, and marketable yield in Nagpur mandarin cultivation (Figure 9).

3.9. Improvements in WUE and NUE

WUE and NUE are two important indicators of the fertigation response. Significant improvements in the WP and NUE, respectively, were observed with the irrigation and fertigation treatments. Among the irrigation treatments, I4 demonstrated the highest WUE (5.67 kg·m−3), significantly outperforming the other treatments and showcasing the effectiveness of optimized water application in the maximizing yield per unit of water consumed. Similarly, among the fertigation treatments, F1 recorded the highest WUE (5.69 kg·m−3), followed by F2 (5.22 kg·m−3) and F3 (4.74 kg·m−3). The superior performance of treatments I4 and F1 reflected the precise and efficient delivery of water and nutrients, ensuring optimal uptake and utilization by the plants. This enhanced resource efficiency not only improved the fruit set, fruit size, and overall yield but also kept the loss of water and nutrients to a bare minimum. These findings re-emphasize the multiple benefits of integrating irrigation and fertilization strategies to improve both WUE and NUE, thereby ensuring sustainable and resource-efficient citrus cultivation in water-limited environments.

4. Conclusions

This study demonstrated the effectiveness of micro-controller-based fertigation systems (IoT) in producing quality fruits of Nagpur mandarin on Vertisol by outperforming both conventional irrigation and fertilization methods. These findings further highlight the importance of integrating sensor technologies with fertigation in the rationalized use of costly inputs like water and fertilizers. Further studies on relative nutrient absorption rates and the net accumulation rate of nutrients in organogenesis will support the development of more efficient fertilization strategies tailored to plant developmental stages. The introduction of multi-sensor systems to be able to monitor soil moisture, nutrient flow, and weather variations on a real-time basis will be a step forward toward developing more advanced citrus production techniques.

Author Contributions

Conceptualization, D.M. and A.K.S.; methodology, D.M. and A.K.S.; resources, D.M. and A.K.S.; data curation, D.M., A.K.S., A.U., C.P. and V.Z.; writing—original draft preparation, D.M., A.K.S., A.U., C.P. and V.Z.; writing—review and editing, D.M., A.K.S. and V.Z.; visualization, D.M. and A.K.S.; supervision, D.M. and A.K.S.; project administration, D.M. and A.K.S.; funding acquisition, D.M. and A.K.S. All authors have read and agreed to the published version of the manuscript.

Funding

This research was funded by the Anusandhan National Research Foundation through DST-SERB, New Delhi.

Data Availability Statement

Data are contained within the article. The original contributions presented in the study are included in the article, and further inquiries can be directed to the corresponding author.

Acknowledgments

The authors express their appreciation to DST-SERB, New Delhi, and ICAR-CCRI, Nagpur, for their full support of the project. It is necessary to thank the highly skilled Dhanraj Gadage for their valuable help and support.

Conflicts of Interest

The authors declare no conflicts of interest.

References

  1. Huchche, A.; Srivastava, A.; Ram, L.; Singh, S. Statistical Basis of Production Sustainability of Citrus Orchards. Trop. Agric. Trinidad 2013, 90, 217–222. [Google Scholar]
  2. Kourgialas, N.N.; Karatzas, G.P. A Modeling Approach for Agricultural Water Management in Citrus Orchards: Cost-Effective Irrigation Scheduling and Agrochemical Transport Simulation. Environ. Monit. Assess. 2015, 187, 462. [Google Scholar] [CrossRef] [PubMed]
  3. Indian Council of Agricultural Research—Central Citrus Research Institute (ICAR—CCRI). Vision—2050; Indian Council of Agricultural Research: New Dehli, India, 2015; p. 40. [Google Scholar]
  4. Kumar, D.; Bhattacharyya, S.; Ghosh, D. Assessing the Export Potential of Nagpur Mandarin: The Promising Citrus Fruit of Central India. Curr. Sci. 2023, 124, 782–784. [Google Scholar]
  5. Government of India NHB (National Horticulture Board). Ministry of Agricultural and Farmer Welfare; Government of India NHB (National Horticulture Board): New Delhi, India, 2020. [Google Scholar]
  6. Shirgure, P. Micro-Irrigation Systems, Automation and Fertigation in Citrus. Sci. J. Rev. 2012, 1, 156–169. [Google Scholar]
  7. Carr, M.K.V. The Water Relations and Irrigation Requirements of Citrus (Citrus SPP.): A Review. Exp. Agric. 2012, 48, 347–377. [Google Scholar] [CrossRef]
  8. Ladaniya, M.; Marathe, R.A.; Murkute, A.; Huchche, A.; Das, A.; George, A.; Kolwadkar, J. Response of Nagpur Mandarin (Citrus Reticulata Blanco) to High Density Planting Systems. Sci. Rep. 2021, 11, 10845. [Google Scholar] [CrossRef]
  9. Anonymous Indian Horticulture Database; National Horticulture Board: New Delhi, India, 2019.
  10. Kumar, S.; Kumawat, P.; Choudhary, K. Irrigation Scheduling and Fertigation in Citrus Fruit Crops. Chem. Sci. Rev. Lett. 2020, 9, 418–420. [Google Scholar]
  11. Panigrahi, P.; Srivastava, A. Water and Nutrient Management Effects on Water Use and Yield of Drip-Irrigated Citrus in Vertisol under a Sub-Humid Region. J. Integr. Agric. 2017, 16, 1184–1194. [Google Scholar] [CrossRef]
  12. Srivastava, A.K.; Singh, S. Citrus Decline: Soil Fertility and Plant Nutrition. J. Plant Nutr. 2009, 32, 197–245. [Google Scholar] [CrossRef]
  13. Srivastava, A.K. Nutrient Management in Nagpur Mandarin: Frontier Developments. Sci. J. Agric. 2013, 2. [Google Scholar]
  14. Ayyappan, S. NRCC Vision—2030; National Centre for Citrus Research: Nagpur, India, 2011. [Google Scholar]
  15. Panigrahi, P.; Sharma, R.K.; Hasan, M.; Parihar, S. Deficit Irrigation Scheduling and Yield Prediction of ‘Kinnow’ Mandarin (Citrus Reticulate Blanco) in a Semiarid Region. Agric. Water Manag. 2014, 140, 48–60. [Google Scholar] [CrossRef]
  16. Zhang, X.; Zhang, J.; Li, L.; Zhang, Y.; Yang, G. Monitoring Citrus Soil Moisture and Nutrients Using an IoT Based System. Sensors 2017, 17, 447. [Google Scholar] [CrossRef]
  17. Allen, R.G.; Pereira, L.S.; Raes, D.; Smith, M. Crop Evapotranspiration, Guideline for Computing Crop Water Requirements. Irrig. Drain. 1998, 56, D05109. [Google Scholar]
  18. Boopathy, S.; Premkumar, P.; Ramkumar, N.; Govindaraju, P.K.P. Implementation of Automatic Fertigation System by Measuring the Plant Parameters. Int. J. Eng. Res. Technol. 2014, 3. [Google Scholar]
  19. Ghadge, K.M.; Ghadge, H.K.; Seeman, V. Fertigation System to Conserve Water and Fertilizers Using Wireless Sensor Network. Int. J. Eng. Res. Comput. Sci. Eng. 2018, 5, 20–25. [Google Scholar]
  20. Visconti, P.; De Fazio, R.; Primiceri, P.; Cafagna, D.; Strazzella, S.; Giannoccaro, N.I. A Solar-Powered Fertigation System Based on Low-Cost Wireless Sensor Network Remotely Controlled by Farmer for Irrigation Cycles and Crops Growth Optimization. Int. J. Electron. Telecommun. 2020, 66, 59–68. [Google Scholar] [CrossRef]
  21. Basterrechea, D.A.; Parra, L.; Botella-Campos, M.; Lloret, J.; Mauri, P.V. New Sensor Based on Magnetic Fields for Monitoring the Concentration of Organic Fertilisers in Fertigation Systems. Appl. Sci. 2020, 10, 7222. [Google Scholar] [CrossRef]
  22. Domínguez-Niño, J.M.; Oliver-Manera, J.; Girona, J.; Casadesús, J. Differential Irrigation Scheduling by an Automated Algorithm of Water Balance Tuned by Capacitance-Type Soil Moisture Sensors. Agric. Water Manag. 2020, 228, 105880. [Google Scholar] [CrossRef]
  23. Adla, S.; Rai, N.K.; Karumanchi, S.H.; Tripathi, S.; Disse, M.; Pande, S. Laboratory Calibration and Performance Evaluation of Low-Cost Capacitive and Very Low-Cost Resistive Soil Moisture Sensors. Sensors 2020, 20, 363. [Google Scholar] [CrossRef]
  24. Vories, E.; Sudduth, K. Determining Sensor-Based Field Capacity for Irrigation Scheduling. Agric. Water Manag. 2021, 250, 106860. [Google Scholar] [CrossRef]
  25. Boman, B.J.; Smith, S.; Tullos, B. Control and Automation in Citrus Microirrigation Systems; University of Florida: Gainesville, FL, USA, 2006. [Google Scholar]
  26. Panigrahi, P.; Raychaudhuri, S.; Thakur, A.; Nayak, A.K.; Sahu, P.; Ambast, S.K. Automatic Drip Irrigation Scheduling Effects on Yield and Water Productivity of Banana. Sci. Hortic. 2019, 257, 108677. [Google Scholar] [CrossRef]
  27. Cardenas-Laichaca, B. Sensor Based Automation of Irrigation of Bermuda Grass. Ph.D. Thesis, University of Florida, Gainesville, FL, USA, 2006. [Google Scholar]
  28. Vij, A.; Singh, V.; Jain, A.; Bajaj, S.; Bassi, A.; Sharma, A. IoT and Machine Learning Approaches for Automation of Farm Irrigation System. Procedia Comput. Sci. 2020, 167, 1250–1257. [Google Scholar] [CrossRef]
  29. Li, D.; Hendricks Franssen, H.-J.; Han, X.; Jiménez-Bello, M.A.; Martínez Alzamora, F.; Vereecken, H. Evaluation of an Operational Real-Time Irrigation Scheduling Scheme for Drip Irrigated Citrus Fields in Picassent, Spain. Agric. Water Manag. 2018, 208, 465–477. [Google Scholar] [CrossRef]
  30. Swamy, K.D.; Rajesh, G.; Jaya Krishna Pooja, M.; Rama Krishna, A. Micro-controller Based Drip Irrigation System. Int. J. Emerg. Sci. Eng. 2013, 1, 1–4. [Google Scholar]
  31. Rajakumar, D.; Ramah, K.; Rathika, S.; Thiyagarajan, G. Automation in Micro-Irrigatio. Sci. Tech Entrep. 2008, 1–8. [Google Scholar]
  32. Shirgure, P. Citrus Fertigation—A Technology of Water and Fertilizers Saving. Sci. J. Crop Sci. 2013, 2, 56–66. [Google Scholar]
  33. Hendre, P.; Ranpise, S.; Pawar, P. Effect of Different Irrigation and Fertigation Levels on Fruit Quality Parameters in Sweet Orange (Citrus sinensis L. Osbeck) Cv. Phule Mosambi PD Hendre, SA Ranpise and PS Pawar. J. Pharmacogn. Phytochem. 2020, 9, 503–507. [Google Scholar]
  34. Srivastava, A.K.; Shirgure, P.S.; Singh, S. Differential Fertigation Response of Nagpur Mandarin (Citrus Reticulata Blanco) on an Alkaline Inceptisol under the Sub-Humid Tropical Climate of Central India. Trop. Agric. 2003, 80, 97–104. [Google Scholar]
  35. Pawar, P.S.; Dalal, D.K.; Bhite, D.R. Identification of Critical Stages of Water Requirement in Acid Lime (Citrus Aurantifolia Swingle) under Westyern Maharashtra Cv. Phule Sharbati. Pharma Innov. J. 2020, 9, 104–107. [Google Scholar]
  36. IUSS Working Group WRB. World Reference Based for Soil Resources, International Soil Classification System for Naming Soils and Creating Legends for Soil Maps, 4th ed.; International Union of Soil Sciences (IUSS): Vienna, Austria, 2022. [Google Scholar]
  37. Meshram, D.T.; Gorantiwar, S.D.; Singh, N.V.; Babu, K.D. Response of Micro-Irrigation Systems on growth, yield and WUE of Pomegranate (Punica granatum L.) in Semi-Arid Regions of India. Sci. Horti. 2019, 246, 686–692. [Google Scholar] [CrossRef]
  38. Ayars, J.E.; Johnsons, R.S.; Phene, C.J.; Trout, T.J.; Clark, D.A.; Mead, R.M. Water use by drip irrigated late season Peaches. Irr. Sci. 2003, 22, 187–194. [Google Scholar] [CrossRef]
  39. Srivastavaa, A.K.; Malhotra, S.K. Nutrient use efficiency in perennial fruit crop—A review. J. Plant Nutri. 2017, 40, 1928–1953. [Google Scholar] [CrossRef]
  40. Obreza, T.A. Young “Hamlin” Orange Tree Fertilizer Response in Southwest Florida. Proc. Fla. State Hort. Soc. 1990, 103, 12–16. [Google Scholar]
  41. Panigrahi, P. Integrated irrigation and drainage management foor citrus orchards in Vertisols. Irri. Drain. 2014, 63, 621–627. [Google Scholar] [CrossRef]
  42. Pérez-Pérez, J.; Romero, P.; Navarro, J.; Botía, P. Response of Sweet Orange Cv ‘Lane Late’ to Deficit-Irrigation Strategy in Two Rootstocks. II: Flowering, Fruit Growth, Yield and Fruit Quality. Irrig. Sci. 2008, 26, 519–529. [Google Scholar] [CrossRef]
  43. Ranganna, S. Hand Book of Analysis and Quality Control for Fruits and Vegetable Products, 7th ed.; Tata McGraw Hill Book Co.: New Delhi, India, 2001; pp. 594–625. [Google Scholar]
  44. Yiling, J.; Shuozhen, Z.; Haitao, J.; Yuwen, W.; Yamin, J.; Hua, Z.; Hua, Z.; Yuying, J.; Wenqiang, L.; Li-Song, C.; et al. Fruit quality assessment based on mineral elements and juice properties in nine citrus cultivar. Front Plants Sci. 2023, 14, 1280495. [Google Scholar] [CrossRef]
  45. Srivastava, A.; Kohli, R.; Huchche, A. Relationship of Leaf K and Forms of Soil K at Different Growth Stages of Nagpur Mandarin. J. Indian Soc. Soil Sci. 1998, 46, 245–248. [Google Scholar]
  46. Bhargava, B.S. Leaf Analysis for Nutrient Diagnosis, Recommendation and Management in Fruits Crops. J. Indian Soc. Soil Sci. 2002, 50, 352–373. [Google Scholar]
  47. Association of Official Analytical Chemists (AOAC). Official Method of Analysis, 16th ed.; Williams S: San Francisco, CA, USA, 1995. [Google Scholar]
  48. Panigrahi, P.; Srivasthava, A.K.; Huchche, A.D. Effect of drip irrigation regimes and basin irrigation on Nagpur mandarin agronomical, physiological performance. Agric. Water Manag. 2012, 104, 79–88. [Google Scholar] [CrossRef]
  49. Mittelbach, H.; Lehnar, I.; Seneviratne, S.I. Comparison of four soil moisture sensor type under firld condition in Switzerland. J. Hydrol. 2012, 430, 39–49. [Google Scholar] [CrossRef]
  50. Verma, S.; Pahuja, R. Recalibration and performance comparison of soil moisture sensors using regression and neural network characteristics model. Mater. Today Proceeding 2021, 45, 4852–4861. [Google Scholar] [CrossRef]
  51. Abdelmoneim, A.A.; Al Kalaany, C.M.; Khadra, R.; Derardja, B.; Dragonetti, G. Calibration of Low-Cost Capaci tive Soil Moisture Sensors for Irrigation Management Applications. Sensors 2025, 25, 343. [Google Scholar] [CrossRef] [PubMed]
  52. Chen, F.; Cui, N.; Jiang, S.; Li, H.; Wang, Y.; Gong, D.; Hu, X.; Zhao, L.; Liu, C.; Qiu, R. Effects of water deficit at different growth stages under drip irrigation on fruit quality of citrus in humid areas of South China. Agric. Water Manag. 2022, 262, 107407. [Google Scholar] [CrossRef]
  53. Dzikiti, S.; Verreynne, S.J.; Stuckens, J.; Strever, A.; Verstraeten, W.W.; Swennen, R.; Theron, K.I.; Coppin, P. Seasonal variation in canopy reflectance and its application to determine the water status and water use by citrus trees in the Western Cape, South Africa. Agric. Fore. Eco. 2011, 151, 1035–1044. [Google Scholar] [CrossRef]
Figure 1. Location map and block diagram of the soil moisture sensor setup at the experimental site.
Horticulturae 11 00508 g001
Figure 2. Weather parameters during the experiment in the 2021–2023 period at various phenological stages of Nagpur mandarin. Abbreviations: WS—wind speed; SShr—sunshine hours; Epan—pan evaporation; Rh—relative humidity; Tmax—maximum temperature; Tmin—minimum temperature; WS—water stress; NLI—new-leaf initiation; CD—crop development; CM—crop maturity; CH—crop harvesting.
Horticulturae 11 00508 g002
Figure 3. Wetted area (%), Kc (fraction), and ETr (mm) across the crop phenological growth stages during the harvesting seasons of 2021–2023. Abbreviations: WS—water stress; NLI—new-leaf initiation; CD—crop development; CM—crop maturity; CH—crop harvesting.
Horticulturae 11 00508 g003
Figure 4. Moisture content (%) and soil and air temperature (°C) at various critical stages for Nagpur mandarin during the harvesting seasons of 2021–2023. Abbreviations: GMC—gravimetric moisture content; SMC—sensor moisture content; ST—soil temperature; WS—water stress; NLI—new-leaf initiation; CD—crop development; CM—crop maturity; CH—crop harvesting.
Horticulturae 11 00508 g004
Figure 5. (a,b). Effect of sensor-based irrigation and fertilization treatments on leaf macronutrient (N, P, K, Ca, and Mg) and micronutrient (Fe, Mn, Cu, and Zn) concentrations (based on the means of two harvesting seasons). Abbreviations: nitrogen (N), phosphorus (P), potassium (K), calcium (Ca), magnesium (Mg), iron (Fe), manganese (Mn), copper (Cu), and zinc (Zn). Different alphabets show the level of significance between treatments (a, b, c, and d means treatment with a alphabet is most significant followed b, c, and d in decreasing order of significance).
Horticulturae 11 00508 g005
Figure 6. (a,b) Effect of sensor-based irrigation and fertilization treatments on the macronutrient (N, P, K, Ca, Na, and Mg) and micronutrient (Fe, Mn, Cu, and Zn) composition of fruits (based on the means of two harvesting seasons). Abbreviations: nitrogen (N), phosphorus (P), potassium (K), calcium (Ca), sodium (Na), magnesium (Mg), iron (Fe), manganese (Mn), copper (Cu), and zinc (Zn). Different alphabets show the level of significance between treatments (a, b, c, and d means treatment with a alphabet is most significant followed b, c, and d in decreasing order of significance).
Horticulturae 11 00508 g006
Figure 7. Effect of sensor-based (IoT) fertigation scheduling treatments on the fruit size distribution of Nagpur mandarin fruits using the average of the two harvesting seasons in 2021–2023.
Horticulturae 11 00508 g007
Figure 8. Correlation matrix (Pearson’s correlation analysis) for plant-based observations under AMC treatments based on the average of two harvesting season.
Horticulturae 11 00508 g008
Figure 9. Distribution of principal components (PCs) for plant-based variables with eigenvalues under various sensor-based (IoT) fertigation treatments in EFGP.
Horticulturae 11 00508 g009
Table 1. Schedules of irrigation and fertilization featuring details of the main treatments (irrigation) and sub-treatments (fertilizers) according to the critical growth stages of Nagpur mandarin.
Stages/TreatmentsNLI (Flowering
/Fruiting)
Crop Development (Marble Stone Size and Fruit Development)MaturityHarvesting
Main treatments (Irrigation)
I1100% * ETNM100% * ETNM100% * ETNM100% * ETNM
I215% * VMC25% * VMC35% * VMC45% * VMC
I320% * VMC30% * VMC40% * VMC40% * VMC
I425% * VMC35% * VMC45% * VMC35% * VMC
Sub-treatments (Fertilizer)
F1N, P, K, BN, P, K, Fe, Mn, ZnK, Fe, Mn, ZnP, K, Zn
F2N, P, KN, P, K, Fe, MnFe, Mn, Zn, BP, Zn
F3N, K, BN, P, K, Fe, ZnK, Fe, MnP, K
* Abbreviations: NLI—new-leaf initiation; ETNM—evapotranspiration; VMC—volumetric moisture content; N—nitrogen; P—potassium; K—phosphorus; B—boron; Fe—iron; Mn—manganese; Zn—zinc; RDF: 600 N: 400 P2O5: 200 K2O: 50 Boric acid:100 FeSO4:100 MnSO4:100 ZnSO4, gkg−1tree−1 (166.0 N:11.2 P2O5 55.4 K2O: 13.9 Boric acid: 27.8 FeSO4: 27.8 MnSO4: 27.8 ZnSO4, kgha−1).
Table 2. Methods followed in measuring the various variations.
FormulasNotationsReferences
E T N M = E T r × K c × A × W A I E ETNM—water requirement (Ld−1t−1); ETr—reference crop evapotranspiration (mm); Kc—crop coefficient (fraction); WA—wetted area (fraction); A—area occupied by each tree (m2); IE—irrigation efficiency of the drip irrigation system (fraction).[37]
I T = W R D C IT—irrigation time (hr); WR—water requirement (Ld−1t−1); DC—dripper discharge capacity (Lhr−1).[37]
E T r = 0.408 R n G + γ 900 T + 273 u 2 e s e a + γ 1 + 0.34 u 2 ETr —reference crop evapotranspiration (mmday−1); G—soil heat flux density (MJm−2 day−1); Rn—net radiation (MJm−2 day−1); T—mean daily air temperature (°C); γ—psychometric constant (kPa°C−1); ∆—slope of saturation vapor pressure function (kPa°C−1); es—saturation vapor pressure at air temperature T (kPa); ea—actual vapor pressure at dew-point temperature, (kPa); u2—average daily wind speed at the 2 m height (msec−1).[17]
A = P P × R R spacingA—area occupied by each tree (m2); P—plant-to-plant (m) spacing; RR—row-to-row spacing (m).[37]
W A = S A A SA—shaded area (m2); A—area occupied by each tree (m2).[37]
K c = 0.014 x + 0.08 Kc—crop coefficient; x—percentage of shaded area (%)[38]
θ v = θ 1 θ 2 × S i × R e W d t θ v —volumetric water content (%); n—number of layers to depth of the effective root zone; ΔSi—thickness of each layer (mm); θ1 and θ2—volumetric content of the first and second date of sampling (m3 m−3); Re—effective rainfall (mm); Wd—drainage from the root sample (mm).[11]
N U E = F Y U F Y T NUE—nutrient-use efficiency (%); FYU—fruit yield in untreated plot (kgha−1); FYT—fruit yield in treated plot (kgha−1)[39]
W P = Y W R WP—water productivity (kgha−1); Y—yield (kgtree−1); WR—water requirement of Nagpur mandarin (Ld−1t−1).[11]
Table 3. Effect of sensor-based (IoT) fertigation scheduling treatments on plant growth parameters of Nagpur mandarin (means of two harvesting seasons).
TreatmentsPlant Height (m)Stem Dia. (m)Canopy Spread(m)Canopy Area (m2)Canopy Volume (m3)RLWC
(%)
N-SE-W
Irrigation
I14.09 ± 0.21 c0.52 ± 0.052 d3.94 ± 0.15 d4.17 ± 0.15 d4.05 ± 0.14 d35.28 ± 4.12 d85.27 ± 5.31 d
I24.32 ± 0.32 b0.55 ± 0.050 c4.18 ± 0.09 c4.29 ± 0.11 c4.24 ± 0.10 c40.70 ± 4.72 c87.68 ± 4.61 c
I34.43 ± 0.26 b0.60 ± 0.039 b4.30 ± 0.07 b4.37 ± 0.06 b4.34 ± 0.06 b43.68 ± 3.74 b90.26 ± 4.52 b
I44.56 ± 0.13 a0.63 ± 0.036 a4.48 ± 0.08 a4.53 ± 0.07 a4.50 ± 0.08 a48.12 ± 2.63 a92.44 ± 4.81 a
Fertilization
F14.59 ± 0.19 a0.62 ± 0.044 a4.32 ± 0.16 a4.44 ± 0.12 a4.38 ± 0.13 a46.30 ± 4.38 a93.89 ± 3.04 a
F24.36 ± 0.18 b0.57 ± 0.047 b4.22 ± 0.23 b4.34 ± 0.13 b4.27 ± 0.17 b42.06 ± 4.95 b89.24 ± 3.39 b
F34.08 ± 0.24 c0.53 ± 0.057 c4.13 ± 0.24 c4.24 ± 0.19 c4.18 ± 0.21 c37.70 ± 5.80 c83.61 ± 3.72 c
Means ± std.dev. followed by different letters within the columns are significantly different at p ≤ 0.05 according to the Tukey test.
Table 4. Effect of sensor-based (IoT) treatments of fertigation scheduling on fruit quality parameters (means of two harvesting seasons).
TreatmentsJuice Content (%)TSS
(°Brix)
Acidity
(%)
TSS:
Acid Ratio
Fruit Dia.
(mm)
No. of Seg. Fruit−1
Irrigation
I135.18 ± 4.19 c9.52 ± 0.62 d0.81 ± 0.07 a11.87 ± 1.77 d66.82 ± 5.19 c10.41 ± 0.47 a
I236.89 ± 4.04 c9.97 ± 0.15 c0.80 ± 0.11 a12.56 ± 2.09 c68.71 ± 6.10 bc10.50 ± 0.52 a
I339.98 ± 5.32 b10.34 ± 0.14 b0.73 ± 0.08 b14.31 ± 1.79 b70.04 ± 6.85 b10.58 ± 0.51 a
I442.66 ± 4.88 a10.61 ± 0.17 a0.66 ± 0.06 c16.32 ± 1.64 a73.65 ± 6.28 a10.67 ± 0.86 a
Fertilization
F143.72 ± 3.84 a10.38 ± 0.30 a0.66 ± 0.05 c15.89 ± 1.70 a76.44 ± 3.76 a11.00 ± 0.63 a
F238.27 ± 4.02 b10.13 ± 0.44 b0.76 ± 0.09 b13.44 ± 2.15 b69.87 ± 3.21 b10.53 ± 0.46 b
F334.04 ± 2.88 c9.81 ± 0.64 c0.83 ± 0.08 a11.96 ± 1.82 c63.10 ± 3.30 c10.09 ± 0.27 c
Means ± std.dev. followed by different letters within the columns are significantly different at p ≤ 0.05 according to the Tukey test.
Table 5. Effect of sensor-based (IoT) fertigation scheduling treatments on the yield attributes, WP, and NUE of Nagpur mandarin (means of two harvesting seasons).
TreatmentsNos. of Fruits Tree−1Fruit Weight (gm)Yield
(kgtree−1)
WU
(m3)
WP
(kgm−3)
NUE
(%)
Irrigation
I1611.00 ± 24.89 d158.43 ± 7.92 d96.98 ± 8.71 d32.50±2.98 ± 0.26 dControl
I2674.83 ± 28.41 c163.29 ± 7.80 c110.40 ± 9.86 c22.19±4.98 ± 0.44 c87.84 ± 0.25
I3769.75 ± 22.05 b171.87 ± 8.67 b132.47 ± 10.43 b24.30±5.45 ± 0.43 b73.20 ± 0.48
I4839.00 ± 22.25 a178.92 ± 8.18 a150.28 ± 10.72 a26.50±5.67 ± 0.40 a64.53 ± 0.73
Fertilization
F1750.75 ± 88.64 a176.79 ± 8.71 a133.43 ± 22.14 a23.30±5.69 ± 0.38 a87.84 ± 0.27
F2722.81 ± 91.08 b168.70 ± 8.66 b122.65 ± 21.53 b23.30±5.22 ± 0.39 b79.07 ± 0.45
F3697.37 ± 92.17 c158.91 ± 8.44 c110.52 ± 20.40 c23.30±4.74 ± 0.40 c87.77 ± 0.71
Abbreviations: WU—water use (m3); WP—water productivity (kgm−3); NUE—nutrient-use efficiency. Means ± std.dev. followed by different letters within the columns are significantly different at p ≤ 0.05 according to the Tukey test.
Disclaimer/Publisher’s Note: The statements, opinions and data contained in all publications are solely those of the individual author(s) and contributor(s) and not of MDPI and/or the editor(s). MDPI and/or the editor(s) disclaim responsibility for any injury to people or property resulting from any ideas, methods, instructions or products referred to in the content.

