1. Introduction
Fruit quality is influenced by numerous external environmental factors throughout growth and development. Among these factors, light is one of the most critical, not only for photosynthesis, germination, stomatal conductance, signaling pathways, metabolism, and protoplast volume in plants, but also for its significant impact on various aspects of growth, development, and physiological functions [
1,
2,
3].
The regulation of internal fruit quality by light exposure is primarily associated with its modulation of photosynthesis, which subsequently impacts the accumulation of primary metabolites within the fruit. Variations in light intensity, light quality, and photoperiod affect the synthesis of photosynthetic products in leaves, which subsequently influences the accumulation of these products in the fruit, thereby affecting its quality. Shading on the canopy of grapes suppresses sugar loading and increases acid content in the fruit berries [
4]. Photosynthetic indicators, such as leaf stomata, the number of stomata, and the longitudinal and transverse diameters of stomata, improved under red and blue light qualities compared to white light [
1]. In addition, photoperiod has a significant impact on the quality of fruits. Continuous lighting on everbearing strawberries resulted in better yield, total soluble solids (TSS), and crop productivity compared to 16 h photoperiods.
Light also significantly impacts the formation of secondary metabolites in fruits. It can trigger changes in the expression of genes encoding the biosynthetic enzymes, enzyme activities, and overall metabolic fluxes, leading to alterations in the final composition and accumulation of secondary compounds [
5]. One of the most well-documented effects of light on secondary metabolites is the enhancement of the biosynthesis and accumulation of phenolic compounds. The exposure of fruits to sunlight or artificial light can stimulate the activity of enzymes involved in the phenylpropanoid and flavonoid biosynthetic pathways, such as anthocyanins [
6]. It is well known that blue light is effective in enhancing anthocyanin biosynthesis in many fruits [
7], and red light usually cannot increase anthocyanin biosynthesis [
8], while strawberries covered with red and yellow light quality selection plastic film show greater anthocyanin accumulation [
9]. In addition to visible radiation, non-visible radiation (far-red and ultraviolet radiation) is also an important factor affecting coloration. The supplementation of ultraviolet-B radiation can enhance the accumulation of anthocyanin in apple skin [
10]. Adjusting the duration of light exposure within a photoperiod can also regulate anthocyanin accumulation. It is generally accepted that extending light exposure time can enhance anthocyanin synthesis [
11]. An appropriate photoperiod environment aids in increasing the total phenolic content in plants, thereby assisting in the removal of excessive intracellular oxygen free radicals [
12]. Light also plays a significant role in the overall accumulation of aromatic compounds in fruits and affects the typical growth forms of plants. However, too much light can hinder the formation and accumulation of certain aromatic compounds in fruits. For instance, exposure treatments have shown no significant impact on ester levels in grapes but have greatly enhanced terpene content [
13]. Additionally, light regulates the biosynthesis and accumulation of monoterpenes during grape development by influencing the expression of key genes involved in the terpene synthesis pathway [
14,
15].
Plants possess a sophisticated photosensory system involving at least four groups of photoreceptors—phytochromes (red/far-red light), cryptochromes and phototropins (UV-A/blue light), and UVR8 (UV-B)—that detect irradiance, spectral composition, direction, and timing of sunlight. Leaf pigments absorb UV and photosynthetically active radiation (especially in the red and blue wavelengths), while far-red and green light are transmitted or reflected. This allows plants to sense shading through changes in the red-to-far-red (R:FR) ratio and blue light attenuation [
16]. These photoreceptors trigger signaling cascades that lead to transcriptional and post-transcriptional changes, with ELONGATED HYPOCOTYL 5 (HY5) acting as a key downstream regulator that controls light-responsive gene expression involved in seedling development and pigment biosynthesis [
17]. The E3 ubiquitin ligase COP1 represses photomorphogenesis in darkness by targeting factors like HY5 for degradation, but it is inhibited by light, which enables plant adaptation to light environments through the stabilization of positive regulators of development [
18].
In contemporary production practices, producers often manipulate light density and quality by using films of various colors or by artificially supplementing (or reducing) specific colors of light to enhance fruit quality. For instance, to address the issue of poor coloration in fruits located in the lower canopy, reflective films are typically employed during the fruit maturation period to enhance light availability and promote coloration. After applying different colored films to citrus, it was observed that fruits under the shading green 60% treatment had better quality [
19]. The artificial supplementation of UV-B radiation promotes fruit ripening and modifies stage-specific anthocyanin metabolism in highbush blueberries [
20].
However, the results regarding the effects of such light treatment on fruit development and quality are actually a comprehensive effect composed of two parts. One part is the effect of light on the leaves and other vegetative organs, which in turn affects the fruit. The other part is the direct effect of light on the fruit itself. For the former, there have been many research reports, and the related mechanisms are relatively clear [
21,
22,
23]. However, for the latter, i.e., the direct effect of light on the fruit itself, relevant research is limited, and current research has mainly focused on the effects of bagging and other cultivation measures on fruit quality [
24]. To further elucidate the mechanism of the direct effect of light on the fruit itself, this study used a self-made device to provide fruit-specific light irradiation to grape berries. This device can provide the fruit with a precisely controllable light environment, enabling light treatment independent of the vegetative organs and providing important technical support for related mechanism research.
In this study, we developed a device that allows for fruit-specific light treatment of preharvest grape fruits, enabling precise control over light exposure for the fruit. Using the grape variety ‘Zaotian’, we conducted preharvest light treatment, assessed fruit quality, and performed RNA sequencing and metabolomics analyses to elucidate the effects of fruit-specific light treatment on fruit quality development. The results of this research will advance our understanding of light-dependent fruit development and quality formation mechanisms, providing technical support for the precise regulation of fruit quality through light.
3. Results
3.1. Development of a Device for Fruit-Specific Light Treatment of Preharvest Grapes
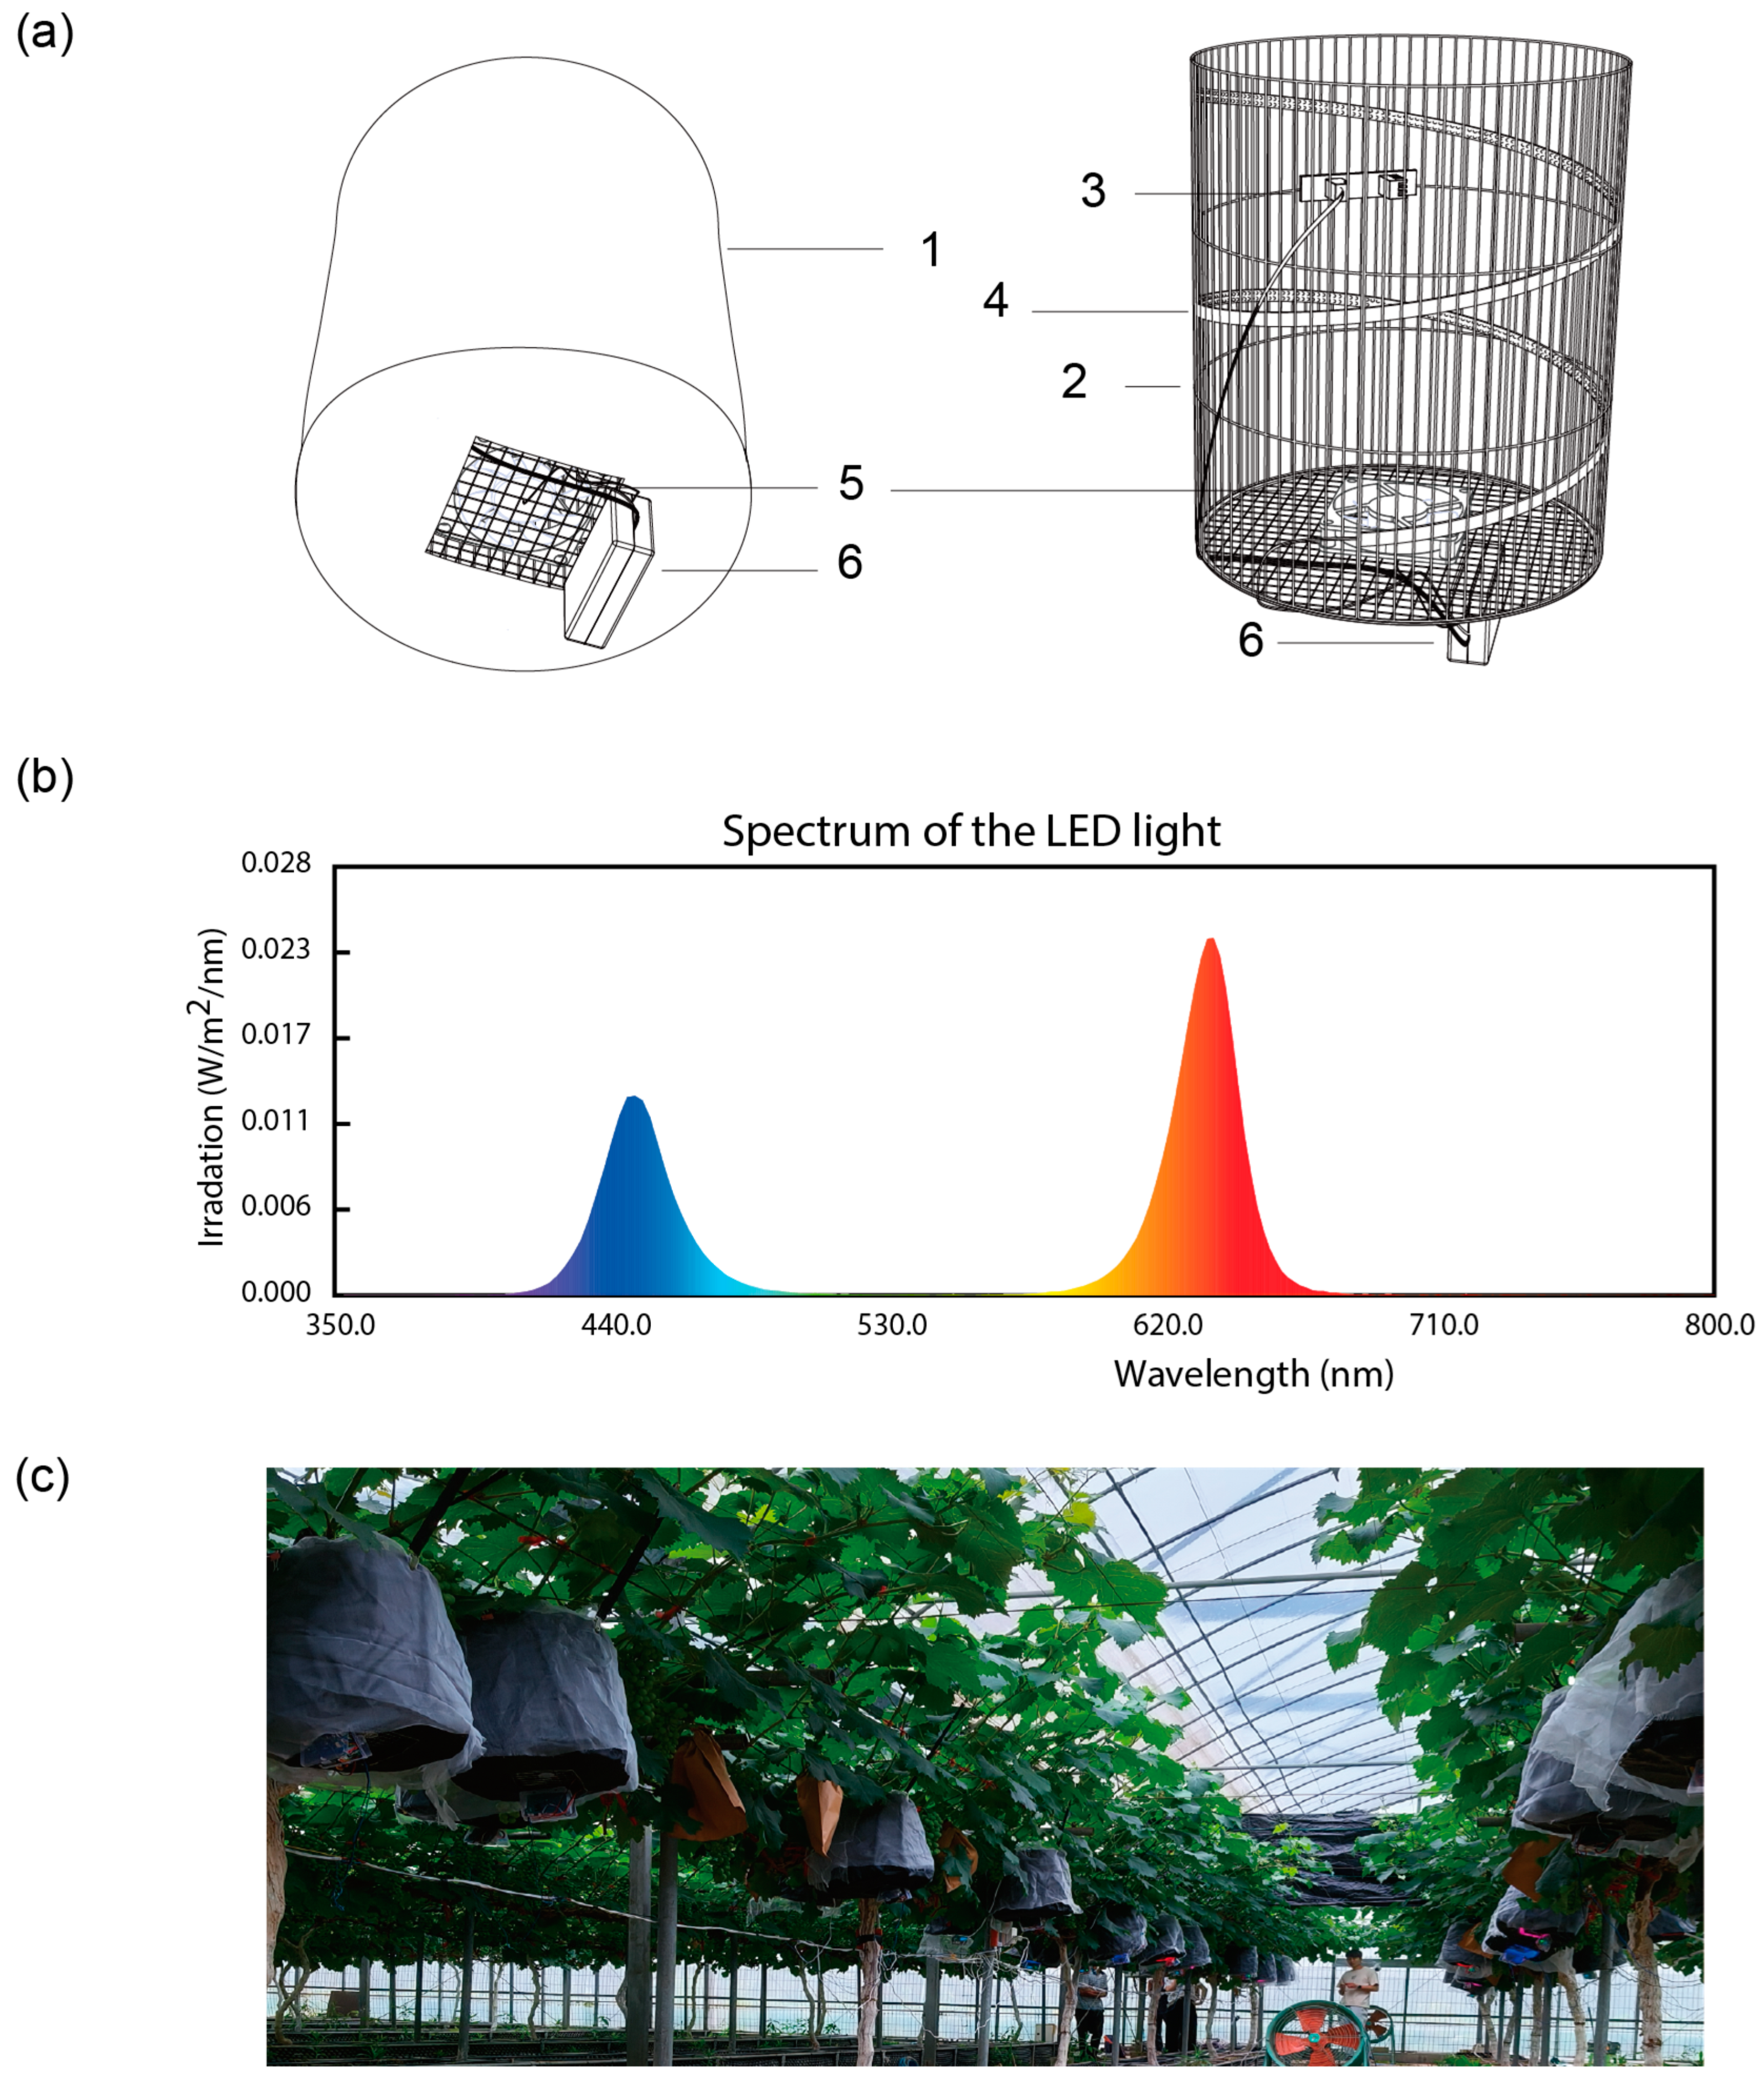
To implement fruit-specific light treatment independent of the vegetative organs, we developed a specialized lighting system (
Figure 1). This device creates a dark chamber around the grape fruits to exclude the influence of natural light and provides the grape fruits with a precise and controllable light environment by setting up light sources with the required light quality, light intensity, and light period, which are controlled by a digital controller, within the dark room. We installed fans for each lighting device to promote air circulation within the device, maintaining environmental conditions as close as possible to those outside. Additionally, large fans were placed in the experimental area to further ensure consistent environmental conditions among different treatments. We also set up sensors to continuously record temperature and humidity under each treatment. Our data collection revealed that temperature and humidity levels were very similar (
Figure S1; the raw data can be found in
Supplementary Table S2). This consistency suggests that the observed metabolic changes in the experiment are primarily attributable to the light treatment rather than differences in other environmental conditions. The illumination data under natural light conditions was also recorded to clearly understand the lighting conditions during the experiment (
Figure S1; the raw data can be found in
Supplementary Table S2).
3.2. Effects of Different Light Conditions on Grape Fruit Quality
To investigate the impact of light on fruit quality, light treatments began on May 26, approximately 30 days after flowering. Dark treatment (D) by bagging was used as a control, while grapes were subjected to natural light (N) and artificial mixed light (A) treatments, with samples taken at three stages (D1, D2, and D3). The fruit quality analysis results indicated significant differences among treatments on June 13th (D1). As shown in
Figure 2, bagged fruits exhibited markedly lower chlorophyll accumulation compared to the other two treatments, whereas fruits under artificial mixed light conditions accumulated a substantial amount of chlorophyll. At this time, the horizontal diameter and weight of the bagged fruit berries were lower than those of the fruits exposed to light, although there were no significant differences in fruit firmness. By July 9th (D2), the grapes had entered the veraison stage. The results showed that the number of colored fruits in bagged fruits was less than in the other two treatments. Under light conditions, fruits accumulated more chlorophyll, and the number of colored fruits was similar between the two light treatments. At this stage, there were no significant differences in the vertical diameter, horizontal diameter, berry weight, and firmness among the different treatments. By July 27th (D3), the fruits of the natural light treatment had reached maturity, and the number of colored berries in bagged fruits remained lower than in the other two treatments. The chlorophyll content in fruits exposed to natural light had nearly faded, showing levels similar to those of bagged fruits. In contrast, while the chlorophyll content in fruits under artificial mixed light decreased compared to earlier stages, it remained significantly higher than in the other two treatments. For the second and third sampling dates, TSS was measured (
Figure 2g). The results indicated that at the veraison stage (D2), the TSS of fruits under natural and artificial mixed light was higher than that of bagged fruits, with no significant difference between the two lighting treatments. However, in the maturation stage, although the TSS of fruits under natural light remained higher than that of bagged fruits, the TSS of the fruits under artificial mixed light did not show a significant difference from that of bagged fruits. These findings demonstrate that different light conditions significantly influence grape fruit quality. The dark environment created by bagging reduced chlorophyll accumulation in the skin, affected the veraison of the grapes, and lowered the TSS content of mature fruits. Conversely, the artificial mixed light treatment increased chlorophyll content in the skin and elevated TSS levels during the early coloring stage. However, compared to natural light, the degradation rate of chlorophyll was slower in the maturation stage, resulting in lower TSS content and less colored berries, suggesting that artificial mixed light may delay the maturation of grape berries.
3.3. Effects of Different Light Treatments on the Transcriptome of Grape Berries
To investigate the impact of various light treatments on the transcriptome of grape berries, we conducted transcriptomic analysis on the aforementioned grape samples. As there are significant differences between the colored and uncolored berries, and due to the uneven veraison of this grape variety at the experimental site, we selected uncolored berries for subsequent multi-omics analysis to ensure that the results were comparable. Differential expressed gene (DEG) analysis was performed pairwise among the three light treatments at each sampling date. The results showed that the first sampling date yielded the highest number of DEGs, with over 1500 genes exhibiting differential expression among the treatments. As the fruits matured, the number of differentially expressed genes gradually decreased; particularly during the third sampling, only ~200 DEGs were identified among the different treatments (
Figure 3a). This decline may be attributed to the reduced responsiveness of the fruits to light during the maturation stage.
Given that the highest number of differentially expressed genes occurred during the early development stage, we compared the transcriptomic analysis data from the first sampling date (D1) to identify DEGs between N/D and A/D, focusing on common upregulated/downregulated genes (
Figure 3b). The results indicated that compared to dark conditions, 1135 genes were upregulated and 823 genes were downregulated under natural light, while 1258 genes were upregulated and 1353 genes were downregulated under artificial mixed light. KEGG enrichment analysis of 597 upregulated genes common to both natural and artificial mixed light conditions showed that these genes were significantly enriched in pathways related to photosynthesis and carbon fixation (
Figure 3c), suggesting that light exposure promotes photosynthesis and carbon fixation in the fruits. In addition, while the commonly upregulated genes at the veraison stage were enriched in the photosynthesis pathway, those at the maturation stage were not.
We further screened for carbohydrate metabolism-related genes among the commonly upregulated genes in both light treatments and displayed their expression levels in a heatmap (
Figure 3d). The results showed that on June 13th (D1), the expression levels of these genes were significantly higher in both natural light and artificial mixed light treatments compared to bagged fruits. However, as the fruits progressed into the veraison and maturation stages, the differences in expression levels gradually diminished, with nearly no differences observed at maturity.
These findings indicate that, compared to darkness, light exposure enhances photosynthesis and carbohydrate accumulation within the fruit, with this effect being most pronounced during the early to mid-development stages and diminishing in the later stages of fruit development. The results align with the measurements of chlorophyll content in the fruits, suggesting that the higher chlorophyll content prior to color change also contributes to the accumulation of photosynthetic products.
3.4. Effects of Light on Light-Responsive Genes in Grape Berries
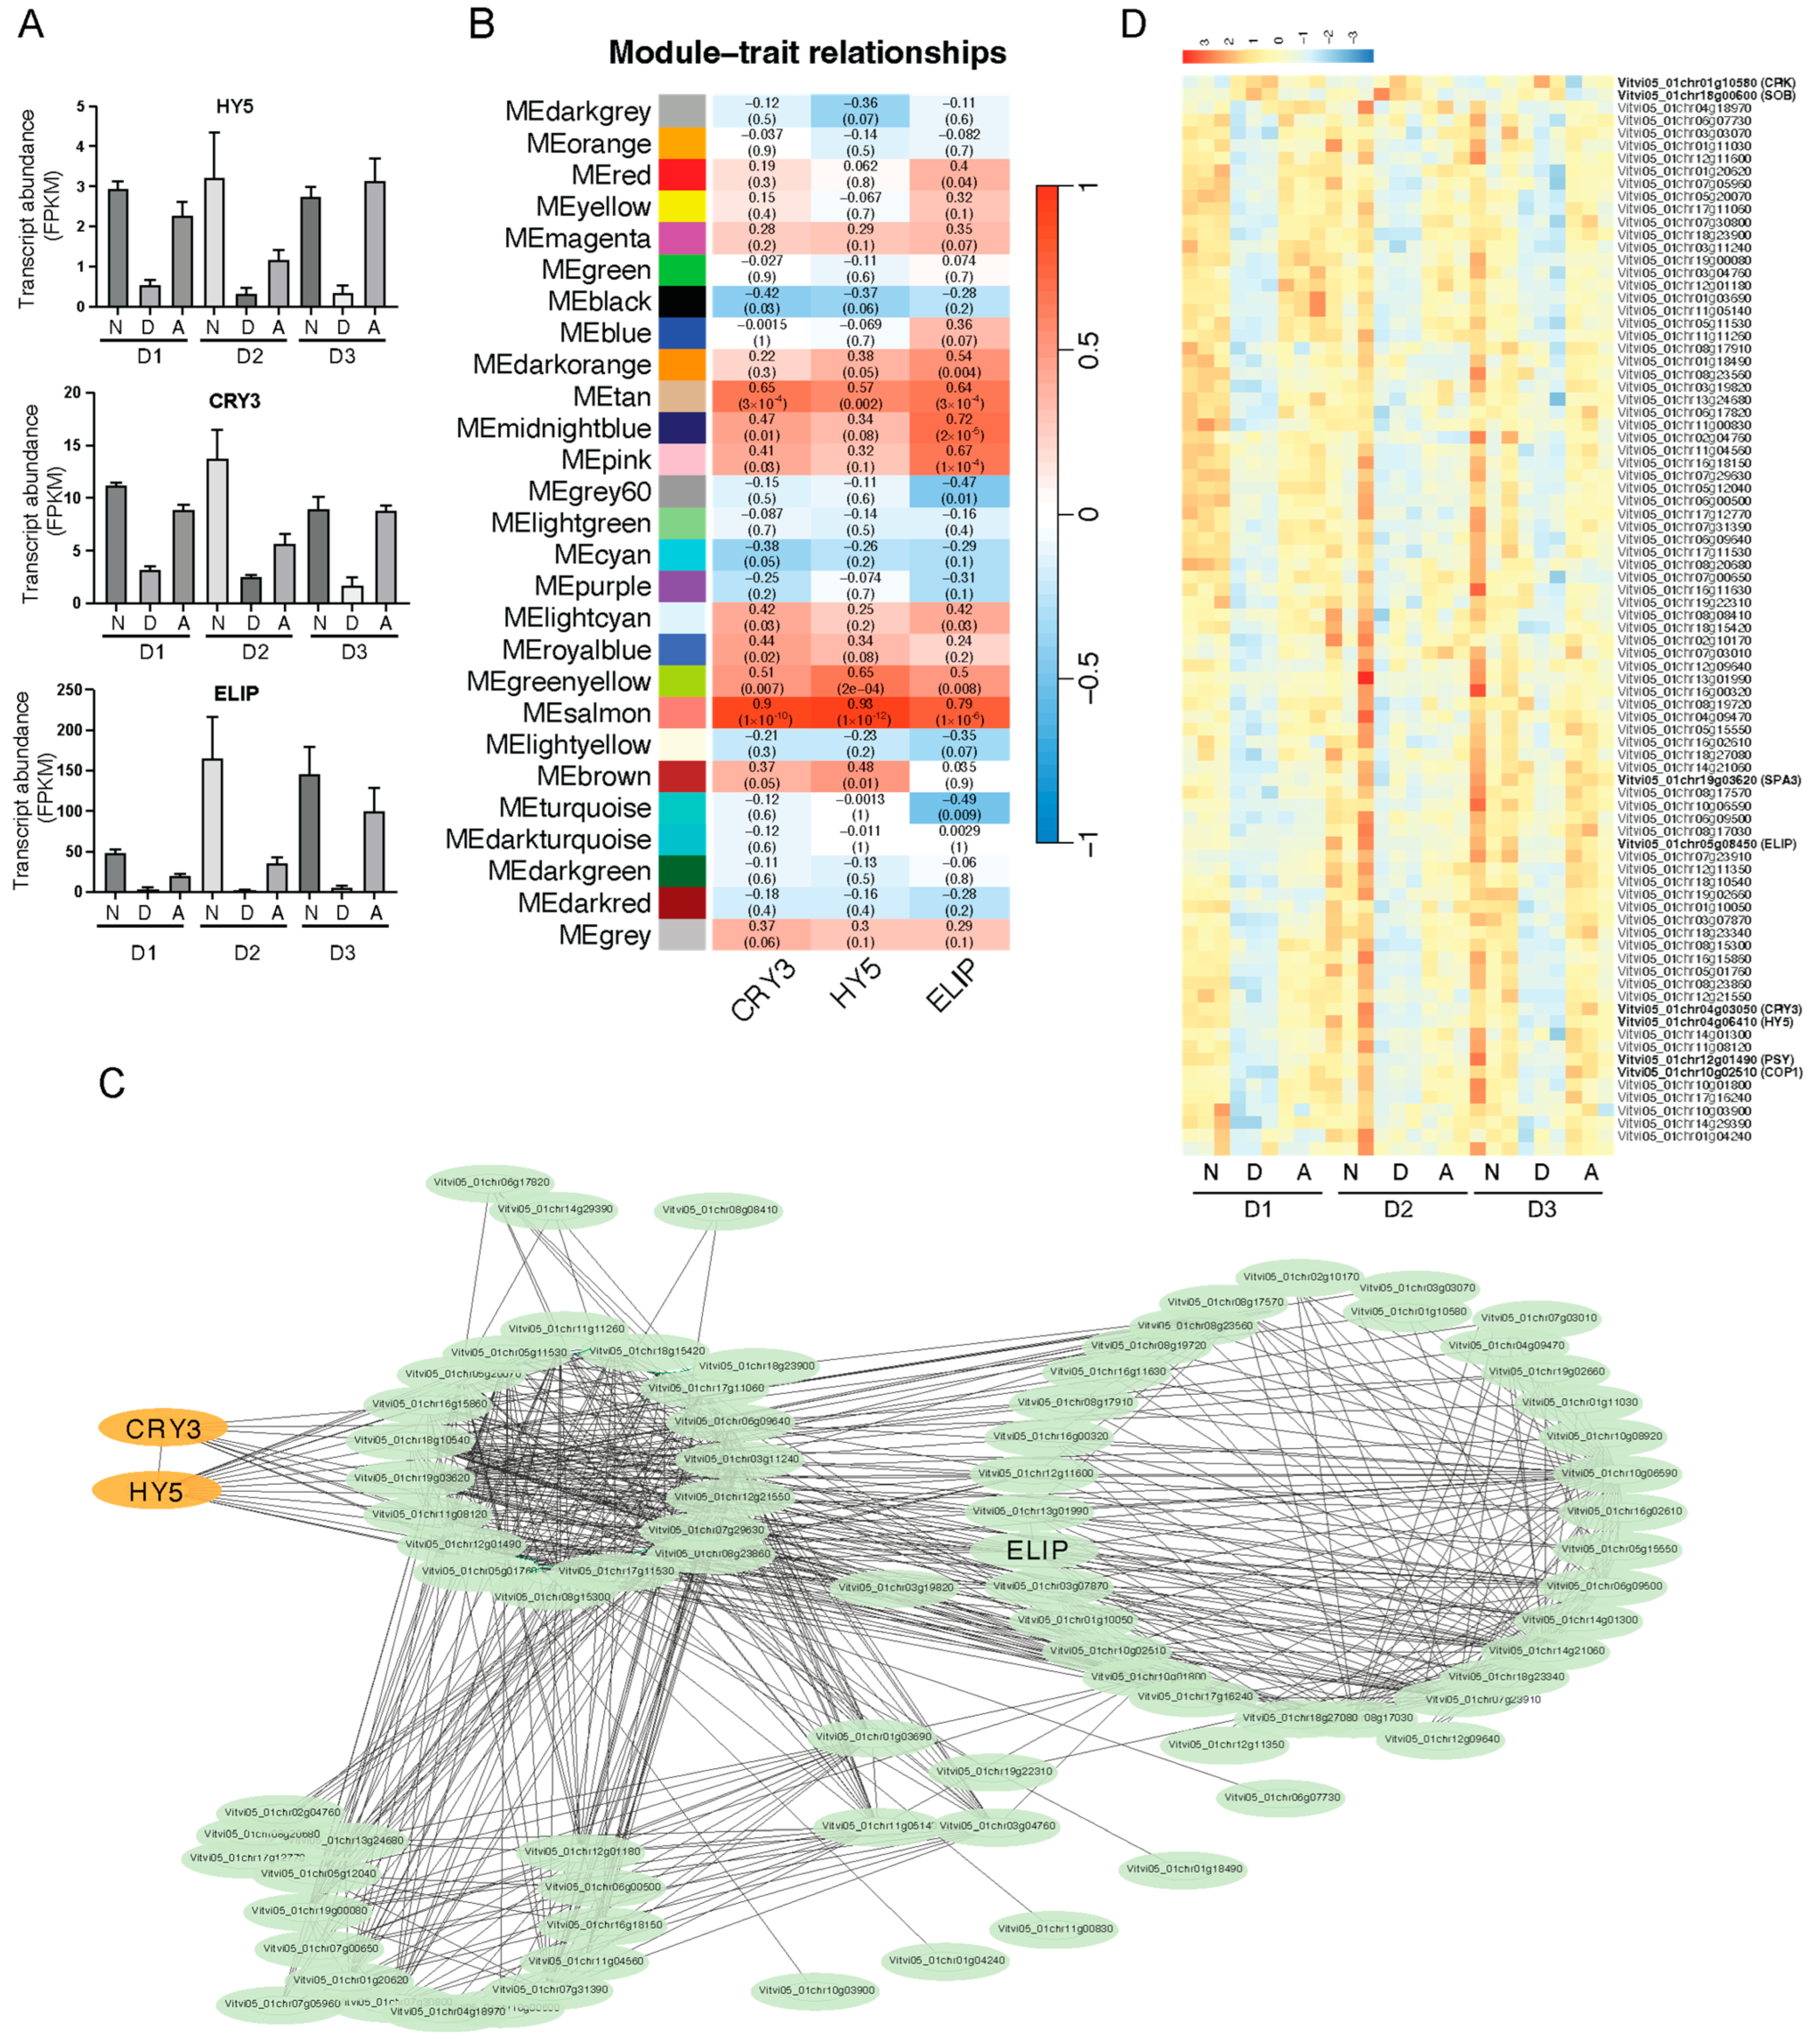
Among the commonly upregulated genes identified under light treatment, we discovered several light-responsive genes, including the blue light receptor CRY3, the bZIP transcription factor HY5, and the early light-induced protein ELIP (
Figure 4A). To further explore the potential regulatory patterns of light signaling and hormone signaling in response to light treatment on fruit, we performed Weighted Gene Co-expression Network Analysis (WGCNA) using the expression patterns of these genes as trait data. The results revealed that the genes in grape fruits could be divided into 27 modules based on their expression patterns. Notably, CRY3, HY5, and ELIP showed the highest correlation with the salmon module (
Figure 4B). We further analyzed the genes in the salmon module that were closely related to the expression of HY5 and CRY3.
We conducted a correlation analysis of the expression patterns of genes within the salmon module and created a network diagram, from which we identified primary and secondary coexpressed genes associated with HY5 and CRY3, totaling 84 genes (
Figure 4C). The expression of these genes closely mirrored the expression patterns of HY5 and CRY3, with the majority exhibiting low expression levels under dark conditions and high expression levels under light conditions (
Figure 4D). Some significant genes included Vitvi05_01chr10g02510 (COP1), Vitvi05_01chr19g03620 (SPA3), and Vitvi05_01chr12g01490 (PSY), which have been proven to be regulated by light in other plants [
35,
36]. Conversely, a few genes displayed expression patterns that were opposite to HY5, showing high expression under dark conditions, such as Vitvi05_01chr18g00600 (SUPPRESSOR OF PHYB, SOB) and Vitvi05_01chr01g10580 (cysteine-rich receptor-like protein kinase, CRK) (
Figure 4D). Although these genes were not enriched in any specific metabolic pathways in the KEGG analysis, they are involved in important biological processes, such as circadian rhythm, metabolism of terpenoids and polyketides, and carotenoid biosynthesis (
Supplementary Data S6). Thus, these genes also play a crucial role in directly responding to light and regulating fruit development and quality.
It is noteworthy that unlike the phenomenon of differential expression of photosynthesis-related genes, which disappears during the fruit maturation phase, the differential expression of HY5 and its coexpressed genes shows no significant changes during the entire development stages (
Figure 4A,D). This indicates that different light treatments directly affect the biological changes mediated by the light signaling pathway, contributing to the formation of fruit quality throughout the fruit development process.
3.5. Effects of Different Light Treatments on the Metabolome of Grape Berries
To further investigate the impact of different light treatments on grape fruit quality, we conducted a non-targeted metabolomics analysis on the grape fruits. A total of 977 metabolites were identified, which could be classified into 20 major categories. However, since there was only one metabolite in the ’Organosulfur compounds’ category, we excluded it from further statistical analysis. The remaining 19 categories were then analyzed by conducting pairwise comparisons of samples subjected to three different light treatments (
Figure 5). We selected metabolites with
p < 0.05 and log2FC > 1 for further analysis across three distinct developmental periods. To mitigate potential random variations, only metabolites that appeared multiple times within the same category were included in the analysis. Additionally, due to the limited number of metabolites exhibiting significant downregulation across the three comparisons, those with log2FC < −1 were excluded from subsequent analyses.
The metabolites demonstrating differential abundance were primarily categorized into two major groups: primary metabolites, including amino acids, organic acids, carbohydrates, and lipids (illustrated in
Figure 5 using cool colors such as blue, green, and gray), and secondary metabolites, including flavonoids, phenolic acids, and terpenoids (illustrated using warm colors such as orange, yellow, and pink). As depicted in
Figure 5, significant differences were observed in both N/D and A/D across all three periods, while A/N exhibited differences solely during the maturation period (D3).
During the D1 period, both light treatments (N for natural light and A for artificial mixed light) demonstrated positive regulatory effects on the accumulation of organic acids, lipids, and flavonoids compared to the bagging treatment, primarily influencing primary metabolites. As fruit development progressed, the promotional effect of light on secondary metabolites became increasingly pronounced. Notably, during the D2 and D3 periods, significant differences were observed not only in flavonoids but also in phenolic acids, terpenoids, alkaloids, organoheterocyclic compounds, and phenylpropanoids. Furthermore, the data indicated that both light treatments positively regulated carbohydrate accumulation. Additionally, compared to the natural light treatment, the artificial mixed light treatment exhibited a stronger promotional effect on lipid accumulation, with significant differences consistently observed across various developmental stages.
In conclusion, fruit-specific light treatments effectively enhance the accumulation of various metabolites during grape fruit development. In the early developmental stage, this promotional effect is primarily evident in primary metabolites. As the fruit matures, the enhancement of secondary metabolites due to light exposure becomes increasingly significant. During the maturation period, the artificial mixed light treatment demonstrates a more pronounced effect on the accumulation of secondary metabolites compared to natural light treatment.
3.6. Correlation Analysis of Typical Metabolites and Transcriptome
To explore the relationship between important metabolites and transcripts, we selected key metabolites and conducted WGCNA using the transcriptome data. WGCNA clustered the genes into 27 modules (
Supplementary Data S3). The analysis revealed strong correlations between four primary sugar compounds and several modules, including ’blue’, ’midnight blue’, ’pink’, and ’yellow’. Additionally, abscisic acid (ABA) and ethylene precursors, such as 1-aminocyclopropane-1-carboxylic acid (ACC), showed high correlations with the pink, blue, and magenta modules, while indole-3-butyric acid (IBA) was significantly correlated with the ’dark turquoise’ module. Notably, two organic acids and methyl indole-3-acetate did not exhibit high correlations with any modules (
Figure 6A).
We further focused on genes with expression levels that showed a correlation above 0.8 with the contents of these metabolites. A heatmap analysis indicated that genes positively correlated with sucrose (
Figure 6B) and sorbitol (
Figure 6C) exhibited low expression during the early fruit development stage, while their expression increased significantly during the veraison and maturation phases. This observation aligns with the higher sugar content found in mature fruits. Among these genes, VvMYB113 was notable; it is a positive regulator of light-induced flavonoid biosynthesis and can be activated by higher sucrose levels [
37].
Moreover, genes with high expression correlations with ABA and the ethylene ACC also demonstrated higher expression levels during the veraison and maturation stages (
Figure 6D,E). This finding is consistent with the known roles of ABA and ethylene in the maturation process. In addition, genes such as Vitvi05_01chr18g05910 (PP2C) and Vitvi05_01chr02g10020 (amylase)—which are involved in sugar accumulation and hormone signaling—exhibited similar expression trends, suggesting they play essential roles in the regulation of these processes. For methyl indole-3-acetate, although there are no highly correlated modules, the expressions of some genes were also correlated with its contents (
Figure 6F).
3.7. Identification of the Metabolites and Transcripts Related to the Red–Blue Light Treatment
To further identify the DEGs and their associated metabolites that are specifically regulated by artificial mixed light, we focused on comparing natural light treatment with artificial mixed light treatment based on the differential expression analysis presented in
Figure 3.
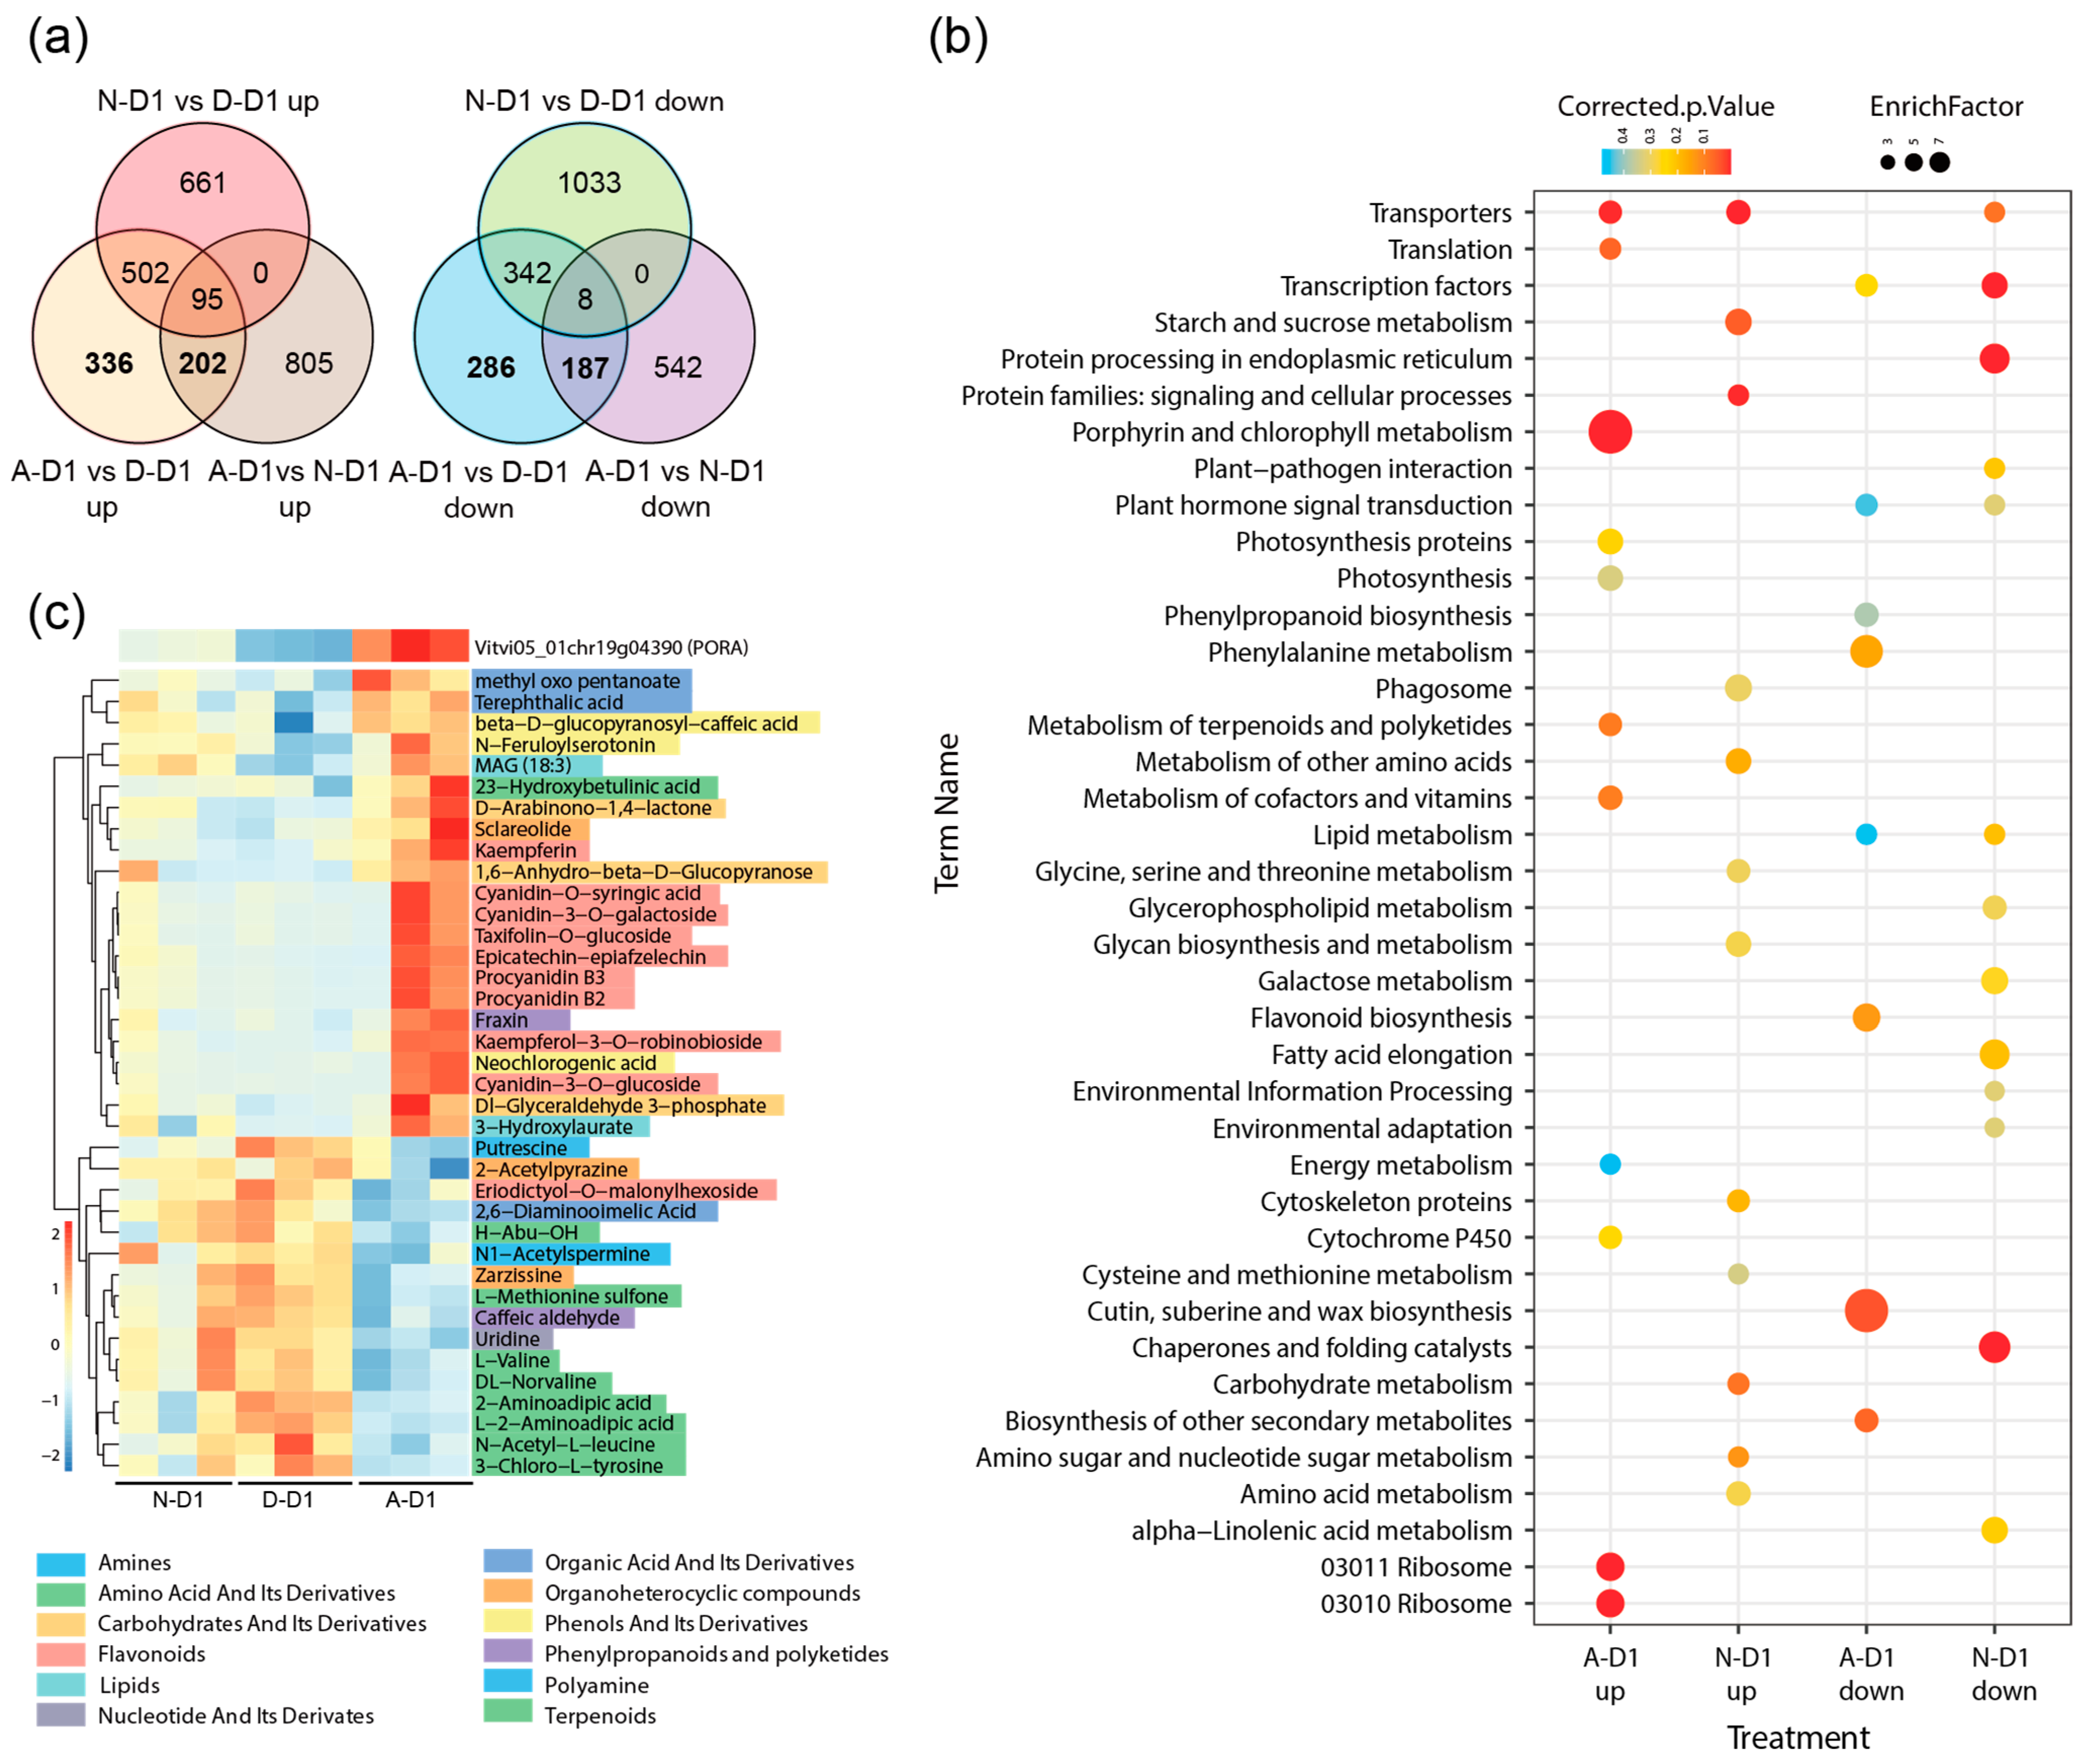
Since the first sampling date (D1) yielded the highest number of DEGs, we began by comparing the differentially expressed genes between N/D and A/D samples from D1 to pinpoint genes that were either upregulated or downregulated specifically in the artificial mixed light condition. By further comparing these with the DEG genes from N/A, we identified genes that were specifically regulated by artificial mixed light (
Figure 7a).
KEGG analysis of these DEGs indicated that genes upregulated under artificial mixed light were primarily enriched in pathways related to porphyrin and chlorophyll metabolism, consistent with the increase in chlorophyll synthesis observed in artificial mixed light conditions. On the other hand, genes downregulated under artificial mixed light were enriched in pathways involved in cutin, suberine, and wax biosynthesis (
Figure 7b).
From the upregulated genes under artificial mixed light, we selected the gene Vitvi05_01chr19g04390, which encodes a protochlorophyllide reductase, showing a typical light-dependent expression pattern. We conducted a correlation analysis between this gene and the metabolome data, focusing on metabolites with a correlation coefficient higher than 0.8. The heatmap results revealed that the types of flavonoids, such as procyanidin B2 and procyanidin B3, accounted for the highest proportion among the metabolites with higher accumulation (
Figure 7c). Additionally, several other metabolites within categories such as ’carbohydrates and organic acids’ were also found to have increased levels following artificial mixed light treatment. However, the artificial mixed light treatment did not significantly affect the levels of glucose, fructose, or malic acid (
Supplementary Data S4).
3.8. qRT-PCR Confirmation of Differentially Expressed Genes
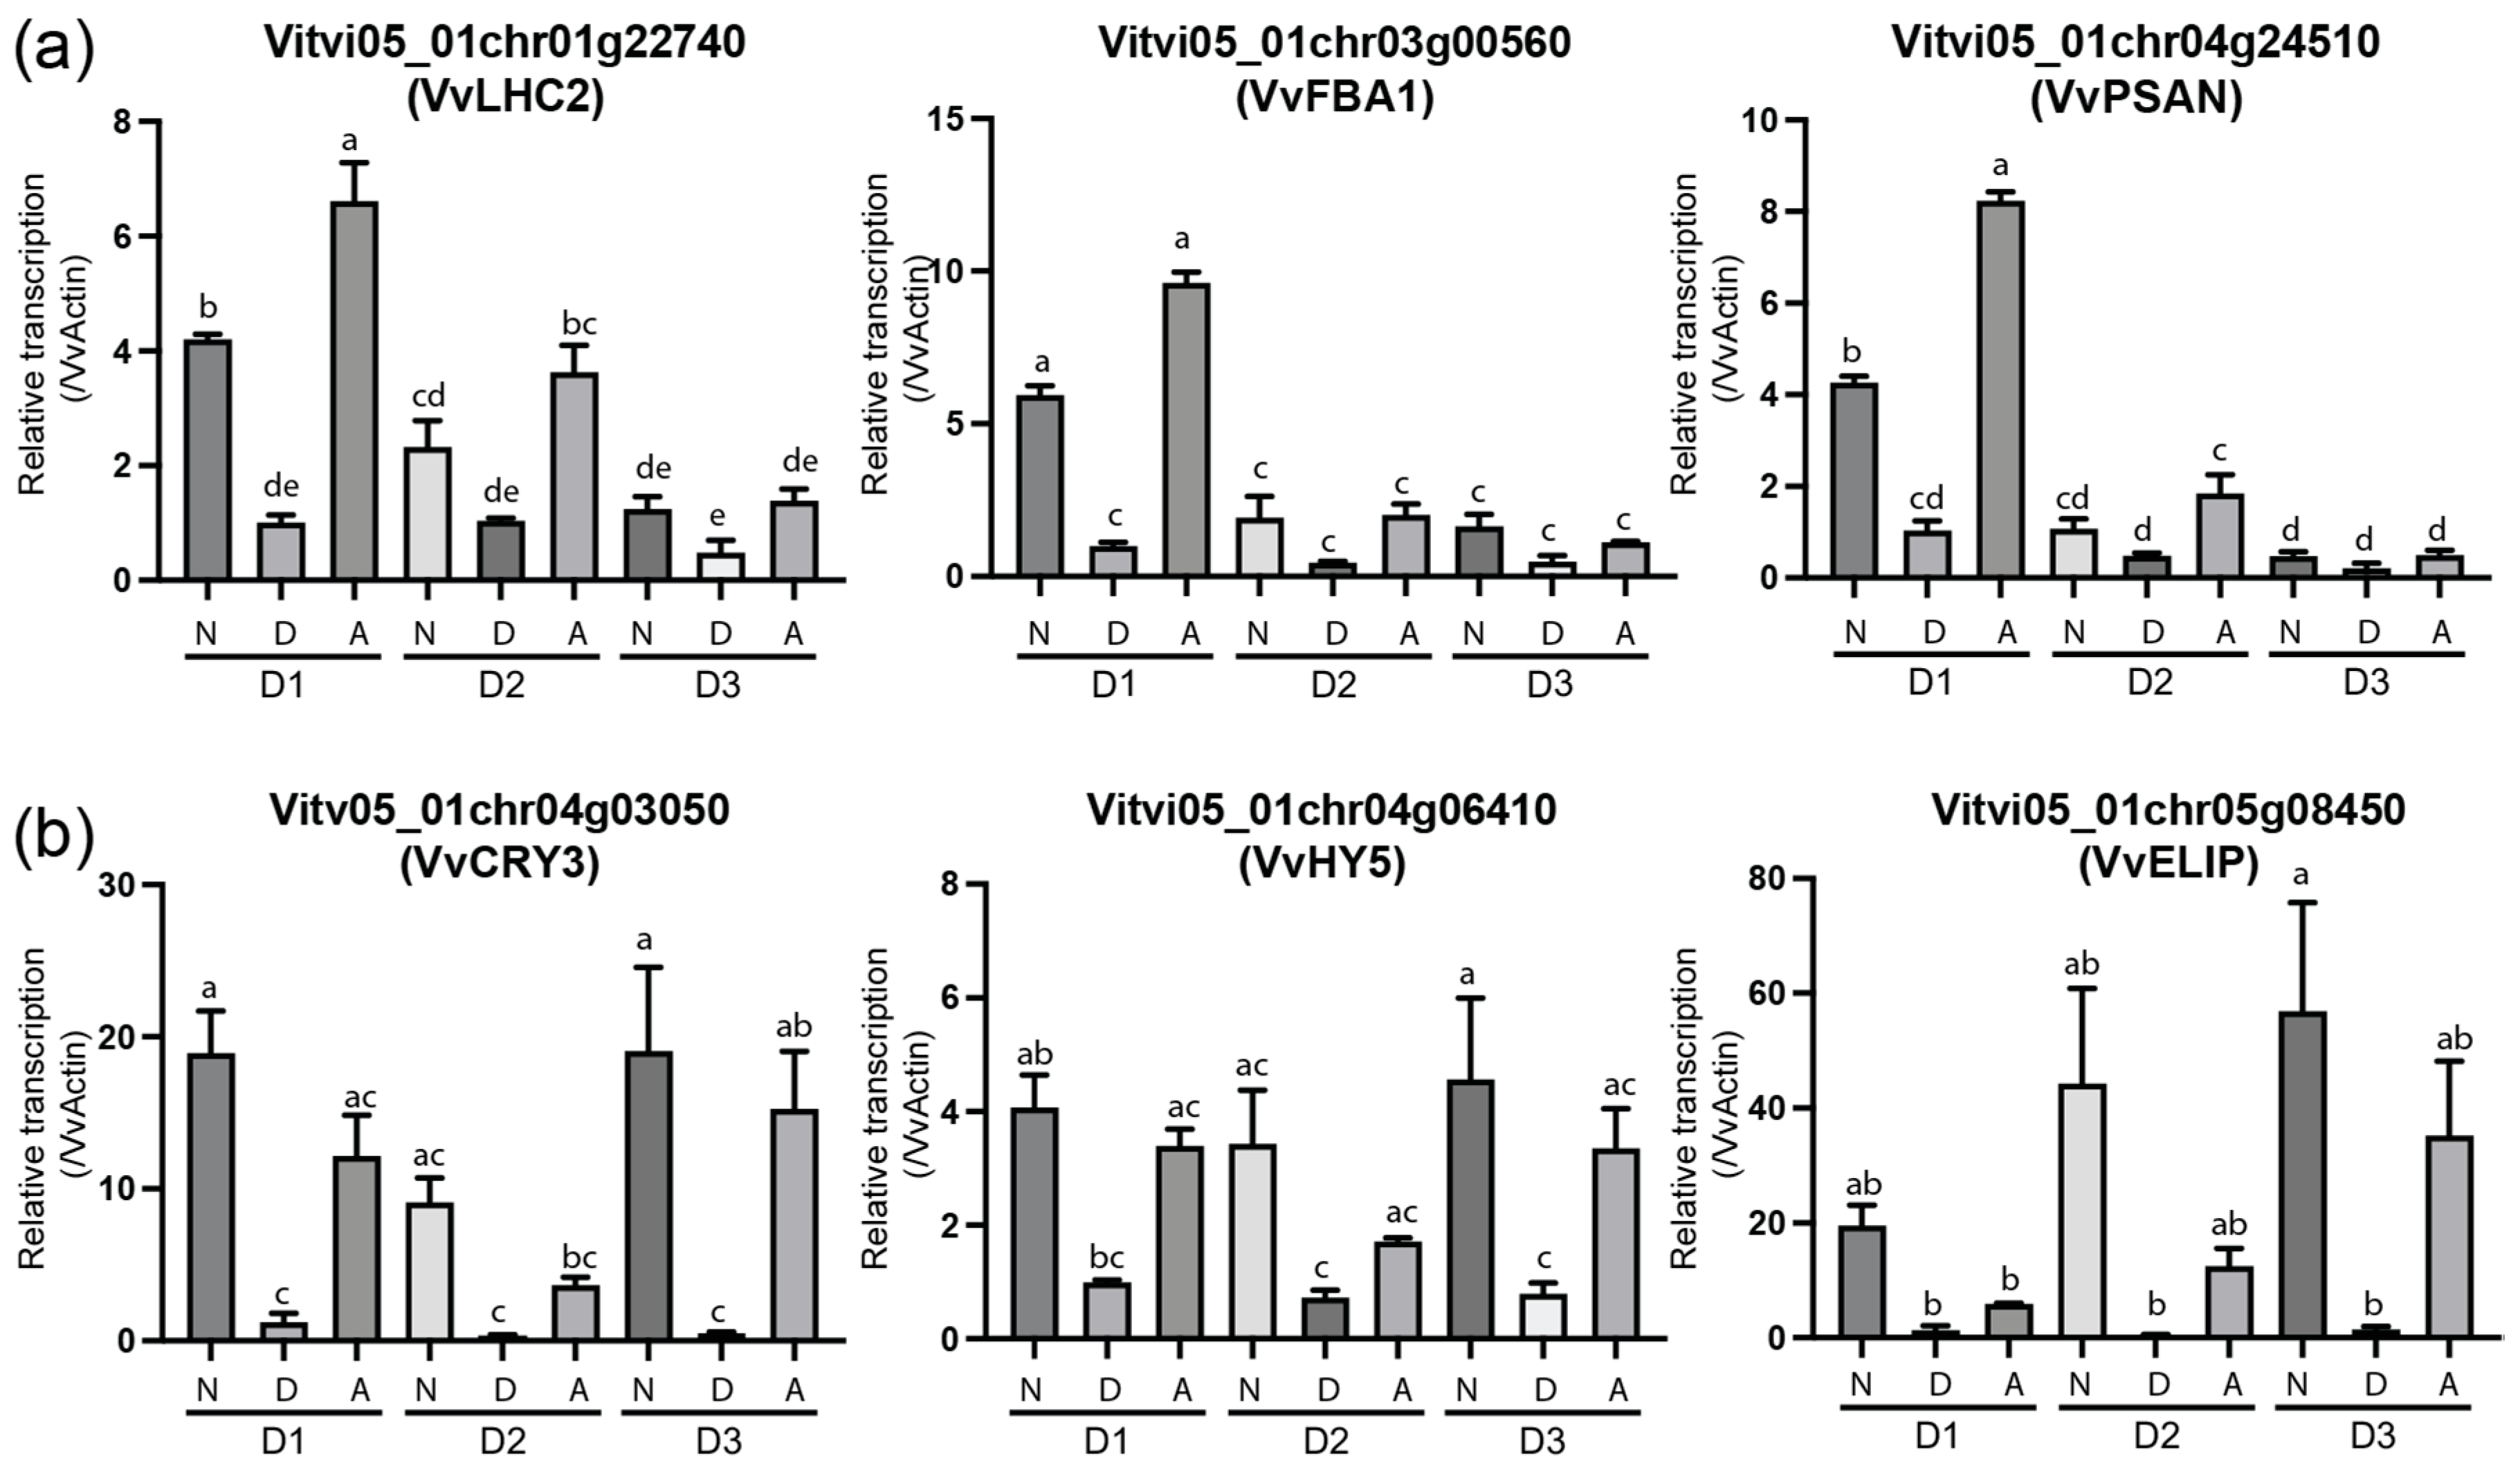
To confirm the expression patterns of DEG genes, we selected some genes with typical expression patterns and carried out qRT-PCR. The results clearly showed that the photosynthesis-related gene,
Vitvi05_01chr01g22740 (
photosystem I light harvesting complex gene 2,
LHC2),
Vitvi05_01chr03g00560 (
FRUCTOSE-BISPHOSPHATE ALDOLASE 1,
FBA1), and
Vitvi05_01chr04g24510 (
PSAN), were highly expressed during fruit development but dramatically decreased during fruit maturation, coinciding with the degradation of chlorophyll in the fruit peel (
Figure 8a), while the light-responsive genes,
Vitv05_01chr04g03050 (
CRY3),
Vitvi05_01chr04g06410 (
HY5), and
Vitvi05_01chr05g08450 (
ELIP), were differentially expressed under different light treatment conditions and were not obviously affected by the fruit development stage (
Figure 8b).
4. Discussion
Light primarily influences the formation of fruit quality by affecting leaf photosynthesis and the transport of assimilates [
22]. However, the phenomenon of reduced sugar content and deteriorated flavor in bagged fruits also indicates that insufficient light exposure on the fruit itself can affect its quality [
38]. For a long time, research has involved the simultaneous light treatment of both the fruit and the vine [
1] or used techniques such as bagging to regulate light for the fruit [
39]. This has resulted in a lack of studies focusing on fruit-specific light treatment, making it difficult to determine how much the changes in fruit quality after light treatment are specifically due to the effects of light on the fruit itself. This study developed a device for fruit-specific light treatment (
Figure 1), allowing for control over different light qualities, intensities, and photoperiods, thereby providing important technical support for further research on regulating light to enhance fruit quality.
4.1. Effects of Light Exposure on Grape Fruit Quality
This study employed natural light and artificial mixed light treatments on grape fruits, with bagged fruits serving as a control, to investigate the impact of light exposure on fruit quality. The results indicated that, compared to bagged fruits, exposure to light significantly increased the accumulation of TSS in the fruit and, to some extent, influenced fruit firmness (
Figure 2), with variations observed in sugar and acid accumulation (
Supplementary Data S4).
However, the effects of light on photosynthesis were primarily evident prior to veraison. Once the fruits entered the veraison phase, the differences in the expression of photosynthesis-related genes among the various treatments gradually diminished. Particularly during the fruit maturation stage, the expression levels of early differentially expressed photosynthesis-related genes declined significantly (
Figure 3). Metabolomic analysis also revealed that fruit-specific light treatment effectively promotes the accumulation of various metabolites during grapefruit development. In the early stage, the accumulation of metabolites, such as organic acids, lipids, carbohydrates, and flavonoids, can be observed simultaneously, while the promotional effect of light on secondary metabolites becomes more pronounced in the later stages. Although some chlorophyll remained undegraded in the skin of fruits treated with artificial mixed light during the maturation period, the expression of photosynthesis-related genes exhibited minimal differences compared to those under natural light or darkness (bagging treatment), in which chlorophyll had largely degraded. This observation suggests that the influence of light on fruit quality through photosynthesis is more pronounced in the early stages of fruit development but becomes less significant as maturation progresses.
4.2. Effects of Different Light Treatments on Fruit Quality
The influence of varying light conditions on grape fruit quality has been extensively studied, particularly with the increasing application of red–blue light supplementation in grape production [
1]. Compared to natural light, red–blue light effectively regulates the morphology and structure of stomata and significantly affects the intensity of photosynthesis in leaves [
40,
41]. Additionally, this light supplementation influences the levels of photosynthetic pigments, such as chlorophyll, thereby enhancing the overall photosynthetic activity of the leaves and leading to the increased synthesis of photosynthetic products [
42]. This, in turn, can enhance fruit quality [
1].
Unlike previous studies that applied light treatment to entire grapevines, this study employed a fruit-specific light treatment approach to demonstrate that fruits can directly respond to light without the mediation of nutrient-translocating organs, revealing a novel pathway influencing fruit quality. Our findings demonstrated that fruit-specific red–blue light treatment significantly increased the accumulation of chlorophyll and certain flavonoids (
Figure 2 and
Figure 7c), potentially enhancing photosynthetic capability. Both natural light and red–blue light treatments resulted in greater sucrose accumulation than the bagged treatment, with natural light yielding the highest levels (
Figure 6B), consistent with the TSS results (
Figure 2). Notably, red–blue light treatment led to higher chlorophyll accumulation throughout fruit development (
Figure 2) but lower sucrose accumulation than that of the natural light treatment (
Figure 6B). One possible explanation for this observation is that red–blue light treatment may have delayed fruit maturation [
43], as evidenced by the fact that chlorophyll had not fully degraded in fruits exposed to red–blue light by the time that the samples under natural light reached full maturity. These fruits might accumulate more carbohydrates alongside the degradation of chlorophyll, although corresponding samples were not analyzed in this study. This hypothesis requires further investigation.
Furthermore, the grape variety used in this study, ‘Zaotian’, exhibited a low coloration rate under natural light conditions (
Figure 2a). Interestingly, even under red–blue light, which is thought to enhance anthocyanin accumulation [
1], the percentage of colored grape berries was even lower than that under natural light. However, even in darkness, a few berries still exhibited coloration (
Figure 2a). These results indicate that, unlike the fruits of apples and pears [
6,
10], the coloration of grape berries is not solely dependent on light exposure, and anthocyanin can also accumulate under dark conditions. Considering that light treatment can enhance anthocyanin accumulation in colored berries [
44], the trigger of fruit coloration appears to be influenced by both internal factors and light exposure, and the effects of light are much stronger than those of internal factors. However, the detailed mechanism requires further analysis. In addition, although there are reports showing that red–blue light can significantly enhance berry coloration [
45], our results showed that fruit-specific light exposure did not lead to a greater accumulation of anthocyanin, probably due to delayed chlorophyll degradation and maturation, which requires further investigation.
We also found that during the early stages of fruit development, red–blue light treatment led to a greater accumulation of flavonoids (
Figure 7c) and chlorophyll (
Figure 2) than natural light treatment. However, no over-accumulation of photosynthesis-related substances was observed (
Supplementary Data S4). KEGG analysis indicated that the genes upregulated by red–blue light did not show significant enrichment in photosynthesis-related genes; rather, only genes associated with chlorophyll metabolism were highly enriched (
Figure 7b). Nevertheless, among the upregulated photosynthesis-related genes in both treatments, expression levels under red–blue light conditions were significantly higher (
Figure 3). These differences may be attributed to our data analysis methods. Although red–blue light treatment has the potential to accumulate more photosynthetic products or other metabolic compounds compared to natural light, this increased accumulation may not have reached the detection threshold of our analytical methods, thus failing to be reflected in the results.
In addition, we observed increased levels of lipids in grapes under artificial light, while the expression of cutin, suberin, and wax biosynthesis genes was monitored in the same fruits (
Figure 7b). This conflict can be explained by the accumulation dynamics of wax. The biosynthesis and deposition of wax and related lipids are indeed stimulated by light, but this stimulation is often transient and density-limited. For instance, reviewers such as Shepherd and Griffiths [
46] have shown that wax deposition rates spike rapidly upon initial light exposure—for example, wax deposition in barley leaves increased 7.5-fold within 24 h after shifting from dark to light, then gradually declined to a steady-state level similar to that in light-grown plants [
47]. This suggests that after an early peak in lipid accumulation following light exposure, the biosynthesis genes may be downregulated as the wax layer reaches a saturation point. Therefore, the reduced gene expression we observed likely reflects this feedback regulation during the later stages, consistent with the stabilized wax accumulation under prolonged artificial light.
In summary, our findings indicated that light-sensitive substances, such as flavonoids, were significantly induced under red–blue light compared to natural light treatment, suggesting that the accumulation of these substances is regulated by light quality. Future studies should focus on the direct effects of different light qualities on the formation of fruit quality.
4.3. The Dynamic Change in the Effect of Different Light Treatments on the Formation of Fruit Quality
Our results indicate that the increased transcription levels of photosynthesis-related genes in fruits exposed to direct light treatments are most pronounced during the early stages of development but become less significant as maturation progresses (
Figure 3). However, light-responsive genes, such as HY5 and its downstream genes, are significantly affected by light exposure throughout the entire fruit development process (
Figure 4). These genes play a crucial role in the synthesis of secondary metabolites, which greatly influence the flavor and nutritional quality of the fruits [
5]. Therefore, in practical production, the application of early supplementary lighting for grapes can enhance the accumulation of photosynthetic products. Additionally, providing supplementary lighting throughout the entire fruit development period can promote the formation of other quality attributes that depend on the accumulation of secondary metabolites.
5. Conclusions
A device for fruit-specific light treatment has been invented, enabling precise light exposure for developing fruits without altering the light conditions of the vegetative organs. The integration of metabolomics and transcriptomics reveals that light can directly affect the growth and development of fruits and the formation of quality, independent of the vegetative organs. Our findings reveal distinct regulatory patterns for primary and secondary metabolites during maturation. Direct light exposure activates primary metabolites and photosynthetic gene expression, although this effect diminishes as the fruit matures. Conversely, light enhances secondary metabolites, such as flavonoids, and their associated gene expressions, maintaining consistent activation throughout development and leading to higher accumulation during maturation. This study provides the first transcriptomic and metabolomic characterization of grape berries exposed to fruit-specific light treatment, advancing our understanding of light-dependent fruit development and quality formation mechanisms.
Additionally, the light treatments used in this study employed red and blue light, which have been reported to be effective for supplementing light in vegetative organs like leaves. However, for fruits, further analysis of light quality is needed to determine which monochromatic light or combination is the most effective.


