Article

Impact of Temperature on Growth, Photosynthetic Efficiency, Yield, and Functional Components of Bud-Leaves and Flowers in Edible Chrysanthemum (Chrysanthemum morifolium Ramat)

1
Department of Horticulture and Landscape Architecture, National Taiwan University, Taipei 106319, Taiwan
2
Tea and Beverage Research Station, Ministry of Agriculture, Taoyuan 326011, Taiwan
3
Plant Technology Research Center, Agricultural Technology Research Institute, Hsinchu 300110, Taiwan
*
Authors to whom correspondence should be addressed.
Horticulturae 2025, 11(5), 448; https://doi.org/10.3390/horticulturae11050448
Submission received: 25 March 2025 / Revised: 13 April 2025 / Accepted: 18 April 2025 / Published: 22 April 2025
(This article belongs to the Section Floriculture, Nursery and Landscape, and Turf)

Abstract

:
Edible chrysanthemum (Chrysanthemum morifolium Ramat.), widely consumed in Asia, is rich in bioactive compounds such as polyphenols, flavonoids, and amino acids. Optimizing cultivation temperature is critical for maximizing both yield and quality, especially under the challenges posed by climate change. This study evaluated the growth performance, photosynthetic characteristics, and metabolite accumulation of the ‘Taiwan Hangju No. 1’ variety under five day/night temperature regimes (15/13 °C, 20/15 °C, 25/20 °C, 30/25 °C, and 35/30 °C) over a 220-day period in an artificial climate greenhouse. The 25/20 °C regime promoted the best overall growth, with the highest yields of bud-leaves and flowers, and supported the highest net photosynthetic rate, indicating optimal carbon assimilation under moderate temperatures. In contrast, stomatal conductance, respiration rate, and transpiration rate increased with temperature, peaking at 35/30 °C. Water use efficiency was greatest at 15/13 °C. Bioactive compound accumulation exhibited complex and organ-specific responses to temperature. The concentration of polyphenols, luteolin, and caffeoylquinic acid derivatives (CQAs) increased with temperature in both bud-leaves and flowers, free amino acids decreased in bud-leaves with rising temperature, reaching a peak at 15/13 °C, and flavonoid concentration peaked at 35/30 °C. In flowers, free amino acids accumulated most at 20/15 °C, and flavonoids peaked at 25/20 °C. The differing yields of bud-leaves and flowers under various temperature conditions contributed to variation in the total content of functional compounds. Except for free amino acids, the total of other functional compounds in bud-leaves was highest at 30/25 °C. The total content of all functional compounds in flowers was highest at 25/20 °C. This study demonstrated that 25/20 °C provides the best balance between growth, photosynthetic efficiency, and accumulation of key bioactive compounds and is therefore recommended as the optimal cultivation temperature for ‘Taiwan Hangju No. 1’. These findings reveal temperature-dependent and organ-specific metabolic adjustments, suggesting that moderate warming may enhance crop quality if managed carefully. The results provide a scientific basis for climate-adaptive cultivation strategies of edible chrysanthemums in subtropical regions.

1. Introduction

Chrysanthemums (Chrysanthemum morifolium Ramat.) are recognized globally as one of the 30 most economically valuable “Medicine-food homology” plants due to their remarkable cultural significance and health-promoting properties [1]. Its use as a herbal tea dates back over 3000 years [2]. In 2022, the global chrysanthemum tea market reached USD 153.1 million, with an estimated annual production of approximately 2156.1 tons. The market is projected to grow by over 50% by 2030, reaching USD 217 million. The Asia-Pacific region accounts for 39.8% of this market, with major consumer countries including China, South Korea, Singapore, and Japan [3,4]. Beyond its use in tea and traditional medicine, edible chrysanthemums are also commonly processed into vegetables and confections. In China, edible chrysanthemums are classified into types such as Huai Ju, Chu Ju, Hang Ju, Bo Ju, and Gong Ju based on production region and processing methods [5]. In Taiwan, ‘Hang Ju’ is the primary cultivated variety, predominantly grown in Miaoli and Taitung counties. The main edible part of ‘Hang Ju’ is the capitulum, which is rich in various functional compounds such as flavonoids, essential oils, chlorogenic acid, carotenoids, amino acids, and trace elements [6,7,8]. Recent studies have also shown that its leaves can be processed into tea and contain high levels of total flavonoids, chlorogenic acid, and lutein [9,10,11,12]. Both flowers and leaves of ‘Hang Ju’ exhibit significant biological activities, including antioxidant, antibacterial, antiviral, anti-inflammatory, antitumor, and immunomodulatory properties [13,14,15,16,17,18,19].
Among environmental factors, temperature plays a pivotal role in regulating plant physiology and the accumulation of secondary metabolites. High temperatures can inhibit photosynthesis, particularly affecting photosystem II (PSII), which is highly heat-sensitive. Heat stress can damage PSII structure and function, reduce Rubisco enzyme activity, and lower carbon fixation efficiency. Furthermore, elevated temperatures promote the accumulation of reactive oxygen species (ROS), causing further damage to the photosynthetic system [20]. Leaf respiration is also impaired under high-temperature conditions due to possible proton leakage that reduces ATP synthesis efficiency or weakened cytochrome c oxidase activity that exacerbates ROS production [21]. The impact of temperature on secondary metabolite biosynthesis varies significantly among species. For instance, in ‘Hypericum perforatum’, hypericin type compounds increase under high temperatures (35 °C) [22], while in ‘Catharanthus roseus’, vindoline and catharanthine levels rise at 40 °C [23]. In contrast, anthocyanin synthesis in many plants, such as petunia, citrus, and rose, is enhanced under low temperatures but suppressed under heat stress [24].
Although previous studies have examined the influence of temperature on flowering and growth in ornamental chrysanthemum cultivars [25], these varieties are primarily bred for aesthetic traits and differ considerably from edible types like ‘Hang Ju’ in terms of breeding goals and cultivation practices. To date, systematic investigations on the physiological performance and functional metabolite dynamics of edible chrysanthemums under different temperature regimes remain scarce, particularly for the widely grown ‘Taiwan HangJu No. 1’ cultivar. Moreover, compounds such as anthocyanins, flavonoids, and chlorogenic acid are known to be highly responsive to ambient temperature [26,27,28]. However, the patterns of response may differ between edible and ornamental chrysanthemum cultivars. Thus, understanding how ‘C. mori-folium’ cv. ‘Taiwan HangJu No. 1’ performs under varying temperature conditions is essential for improving cultivation strategies and assessing its environmental adaptability. This study aims to evaluate the growth, flowering traits, and accumulation of functional compounds in Taiwan HangJu No. 1 ‘C. morifolium’ under five temperature regimes designed to simulate the typical temperature ranges (13–32 °C) observed in major production areas such as Miaoli and Taitung County. The findings are expected to provide practical insights for temperature-based cultivation management and scheduling under future climate change scenarios.

2. Materials and Methods

2.1. Temperature Treatments and Measurement

2.1.1. Experimental Site and Treatments

On 13 June 2019, potted seedlings of Taiwan Hangju No. 1 (Chrysanthemum morifolium) with an average plant height of 12.5 ± 1.9 cm and a crown width of 17.4 ± 1.8 cm were transplanted individually into 6-inch plastic pots. Each pot was filled with a substrate mixture of red soil, rice husk, and peat in a 1:1:1 volume ratio. A total of 150 plants were used in the experiment.
All pots were transferred into a naturally lit (sunlight intensity 89~115%) artificial climate greenhouse located at National Taiwan University (latitude 25.0163, longitude 121.5411). The greenhouse allowed 89–115% of natural light and maintained a relative humidity between 55% and 95%. Environmental conditions aside from temperature were kept constant across all treatment chambers to ensure standardization. Manual irrigation was applied as needed to maintain consistent soil moisture across treatments.
Five day/night temperature regimes (15/13 °C, 20/15 °C, 25/20 °C, 30/25 °C, and 35/30 °C) were established using separate temperature-controlled chambers within the greenhouse. These temperature settings were selected based on historical average temperatures recorded in major chrysanthemum production regions in Taiwan (e.g., Miaoli and Taitung), where day/night temperatures typically range between 13 °C and 32 °C with a diurnal variation of approximately 5 °C. These regimes were chosen to simulate both current and anticipated field conditions under climate variability, with the expectation of observing differential impacts on plant growth and metabolite accumulation.
Each temperature treatment consisted of 30 pots, arranged in three replicates of 10 pots each. Subplots measured 70 cm × 50 cm, and plant spacing within each plot was maintained at 18 cm to ensure adequate air circulation and light penetration. The treatments were maintained until 21 January 2020.
Fertilization was carried out monthly. From June to August, each plant received 10 g/pot of Taiwan Fertilizer No. 1 (20-5-10), and from September to January, 15 g/pot of Taiwan Fertilizer No. 43 (15-15-15) was applied. Pest and disease management was conducted using non-chemical methods, such as manual removal and physical barriers. No chemical pesticides or fungicides were used throughout the experiment.

2.1.2. Measurement of Parameters

Growth and Development

Plant height and crown width were measured every 20 days using a standard measuring tape. Mortality was visually assessed, and the survival rate was calculated as the number of surviving pots divided by the total number of pots. The flower-bud development rate was defined as the percentage of pots with visibly developed buds (Figure 1a). A common cultural practice in edible chrysanthemum cultivation—pinching—was employed in this experiment. When branches exceeded 15 cm in length, the apical 5 cm was manually pinched. This was conducted periodically until 1 September, in accordance with local agricultural practices, where pinching is typically stopped in late August to early September to promote flowering. Flowers were harvested at stages 4 and 5 (Figure 1b), based on their phenological development.

Yield and Biomass

Removed bud-leaves and harvested flowers were oven-dried at 50 °C until a constant weight to determine fresh and dry biomass. All samples were stored at −20 °C for subsequent biochemical analysis.

Photosynthetic Parameters

Between 12 August and 26 August 2019, from 9:00 to 11:00 AM, the LI-6800 portable photosynthesis system (LI-COR, Lincoln, NE, USA) was used to measure the net photosynthetic rate (A), stomatal conductance (gsw), and transpiration rate (E) on the 5th to 7th fully expanded leaves from the apex. The leaf chamber was set to a photosynthetic photon flux density (PPFD) of 1200 μmol m−2 s−1, a temperature of 25 °C, and a relative humidity of 85%. Additionally, the respiration rate (R) was determined under 0 μmol m−2 s−1 photosynthetic photon flux density (PPFD). For each treatment, five plants were measured with one leaf per plant.

2.1.3. Preparation of Extraction Solutions

For every 10 plants, the bud-leaves and flowers were pooled to form one replicate (with a total of three replicates). The samples were homogenized into a powder and then stored at −20 °C until further analysis. For each replicate, 0.5 g of sample was weighed and extracted with 45 mL of boiling water (100 °C) for 5 min. After cooling, the extract was filtered and diluted to a final volume of 50 mL. The extraction solutions for total polyphenols, free amino acids, flavonoids, and affeoylquinic acid were prepared and analyzed.

2.2. Analysis of Functional Components

2.2.1. Polyphenols

The total polyphenol concentration was determined according to Iwasa [29] with a few modifications. An aliquot of 1 mL of the diluted filtrate was mixed with 1 mL of Ferrous Tartrate Solution and 3 mL of potassium sodium phosphate buffer. After color development, the absorbance was measured at 540 nm using a spectrophotometer (Bio Tek Epoch2, Santa Clara, CA, USA). A standard curve was prepared using Ethyl gallate, and the total polyphenol concentration was multiplied by 1.5 to obtain the total polyphenol value and expressed as a percentage of dry weight.

2.2.2. Free Amino Acids

The determination method was based on Ikegaya et al. [30]. A 15 mL aliquot of the sample extract was mixed with 0.15 g of poly(vinylpolypyrrolidone) (PVPP) and shaken for 30 min for complete reaction, followed by filtration. A theanine standard curve was prepared, along with 2 M acetate buffer (pH 5.2), 0.2% SnCl2 solution, and 3% ninhydrin solution. A 1 mL aliquot of the standard or sample solution was sequentially mixed with 0.5 mL of SnCl2 solution and 0.5 mL of ninhydrin solution. The mixture was heated in a 100 °C water bath for 15 min, cooled to room temperature, and diluted with 10 mL of 50% ethanol. The absorbance was measured at 570 nm using a spectrophotometer (Bio Tek Epoch2, Santa Clara, CA, USA) to determine the total free amino acid content.

2.2.3. Flavonoids

The determination method was adapted from Li et al. [31]. A quercetin standard curve was prepared, and 1 mL of standard or sample solution was analyzed using a spectrophotometer (Bio Tek Epoch2, USA) at 359 nm to quantify the total flavonoid content.

2.2.4. Affeoylquinic Acid (CQAs)

The HPLC conditions were based on minor modifications of the Chinese National Standard CNS 15022 ‘Food Inspection Method—Determination of Catechins’ (N6384). [32]. The column used was a Merck CART 250-4 PUROSPHER STAR RP-18(E) 5 μm; Eluent A consisted of 0.1% formic acid, and Eluent B was acetonitrile. The flow rate was set at 1 mL/min; detection was carried out using an 1260 DAD detector (Agilent, Santa Clara, CA, USA) at 280 nm, with an injection volume of 10 μL. Identification of affeoylquinic acid was performed by comparing retention times with those of the standard, and quantification was achieved via calibration curves.

2.2.5. Luteolin

According to the revised chrysanthemum test method of the third edition of the Taiwan Chinese Pharmacopoeia [33], 0.1 g of sample was extracted with 10 mL of 50% methanol containing 0.1% formic acid. The mixture was shaken for 10 min and then filtered through a 0.22 μm PTFE filter. The Luteolin extraction solutions were analyzed by HPLC-DAD (Agilent Technologies, 1290 Infinity II, Santa Clara, CA, USA) on a Poroshell 120 EC18 column (2.7 µm, 150 × 4.6 mm, Agilent, USA). The injection volume was 10 µL. The mobile phase consisted of solvent A (1% phosphoric acid solution) and solvent B (acetonitrile) with a flow rate of 0.5 mL/min. The gradient program (at 40 °C) was as follows: started at 98% solvent A; hold for 0.2 min at 98% A and 2% B; linearly changed to 35% A and 65% B over 6 min; linearly changed to 0% A and 100% B over 12.5 min; hold at 0% A and 100% B until 18.5 min; then rapidly reverted to 98% A and 2% B (over 0.01 min); and hold until 23.5 min. Luteolin was monitored at 348 and 327 nm.

2.2.6. Lutein

According to the test method for lutein in food announced by the Ministry of Health and Welfare [34], 1 g of sample was placed in a saponification flask with 300 mg of BHT and 10 mL of 50% acetone solution, then sonicated for 5 min. Next, 30 mL of 10% potassium hydroxide in ethanol was added, and the mixture was incubated in a 50 °C water bath for 30 min. After cooling, the mixture was extracted with an ether: n-hexane (1:1, v/v) solution containing 0.2% BHT using a separatory funnel. The upper layer was concentrated under reduced pressure at 40 °C until nearly dry. The residue was then dissolved in methanol containing 0.2% BHT and made up to 10 mL. The extract was filtered through a 0.22 µm nylon filter and analyzed by HPLC-DAD (Agilent Technologies, 1290 Infinity II, USA) using an RP-Amide column (5 µm, 150 × 6.4 mm, Ascentis, Bellefonte, PA, USA). The injection volume was 1 µL, and the mobile phase was acetonitrile with a flow rate of 1 mL/min. The gradient program (at 40 °C) began with 100% acetonitrile for 25 min. Lutein was monitored at 455 nm.

2.3. Data Analysis

Data were analyzed using SAS EG 7.1 software for analysis of variance (ANOVA) and Fisher’s Least Significant Difference (LSD) test for multiple comparisons. For plant height, plant width, pot survival rate, and bud development rate (number of pots with visible buds divided by total pots), 30 observations were recorded per treatment. For functional component analysis, three replicates were prepared from the homogenized samples.

3. Results

This section may be divided by subheadings. It should provide a concise and precise description of the experimental results, their interpretation, as well as the experimental conclusions that can be drawn.

3.1. Effects of Temperature on the Growth of Taiwan Hangju No. 1

Potted plants of Taiwan Hangju No. 1 (average plant height 12.47 ± 1.87 cm; width 17.4 ± 1.8 cm) were placed under different day/night temperature regimes. As shown in Table 1, plant height and width were significantly affected by the temperature treatments. Under the 15/13 °C treatment, both plant height and width were markedly lower, with slow growth over time. In the 25/20 °C treatment, the plants were 68.02 ± 5.82 cm high and 37.83 ± 5.42 cm wide at 220 days, showing that this temperature range is best for Hangju vegetative development. Conversely, the 35/30 °C treatment severely inhibited growth; at 220 days, the plant height was only 35.40 ± 6.83 cm and the survival rate dropped to 68.75%, demonstrating the negative impact of high temperatures on Hangju growth. All treatments initially maintained high survival rates; however, with time, the survival rates in the 30/25 °C and 35/30 °C groups declined significantly, especially the 35/30 °C treatment, where survival was only 68.75% at 220 days, indicating that high temperatures lead to increased plant mortality.
Between 3 July and 1 September 2019, bud–leaf was pinched on four occasions (Table 2). The 25/20 °C treatment yielded the highest total bud–leaf number, fresh weight, and dry weight (385 buds, 1044.50 g fresh weight, and 150.21 g dry weight), suggesting that this temperature is optimal for bud–leaf development. Although the 30/25 °C treatment produced the highest number of buds per pot, the dry weight per bud was lower (0.29 g), implying that high temperature promotes bud quantity but with less individual development. In contrast, the 15/13 °C treatment, while yielding a higher single bud dry weight (1.18 g), resulted in significantly lower total bud numbers and fresh weight (74 buds and 651.74 g, respectively), indicating that low temperatures restrict overall bud–leaf growth. It was also found that the 35/30 °C group had fewer buds and less fresh weight than the 25/20 °C group, implying that high temperature had negative impacts on vegetative yield. Regression analysis using SAS EG software revealed a quadratic relationship between the total bud–leaf dry weight and temperature (Figure 2), with the following equation:
Y = −0.7457X2 + 33.971X − 238.76 (R2 = 0.9717, p < 0.05)
suggesting that maximum bud–leaf dry weight is achieved at approximately 22.8 °C.

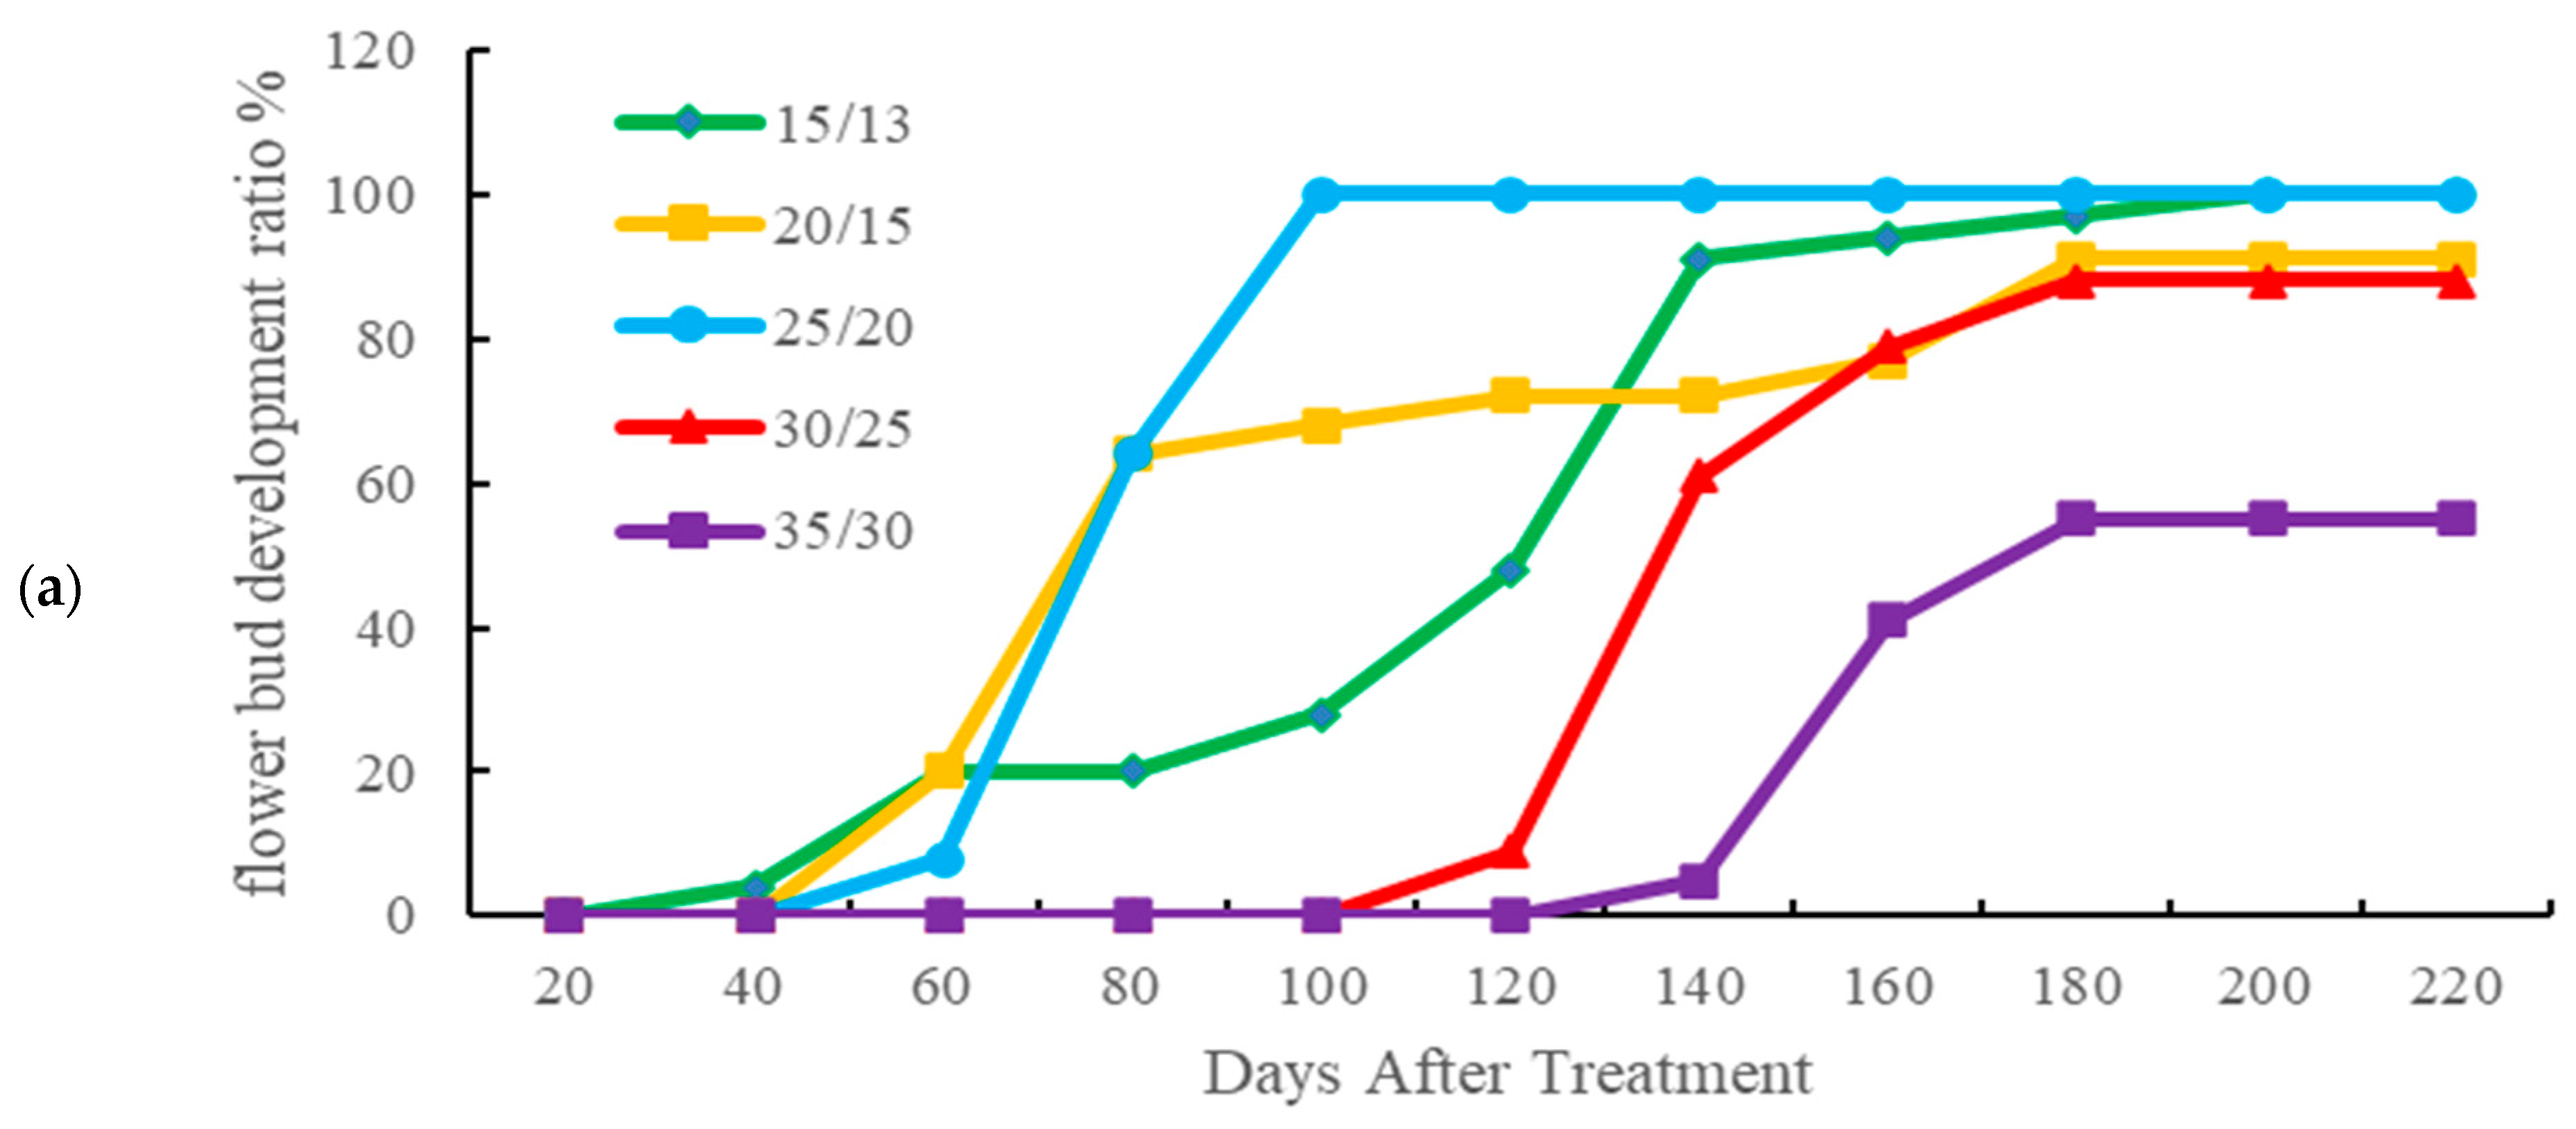
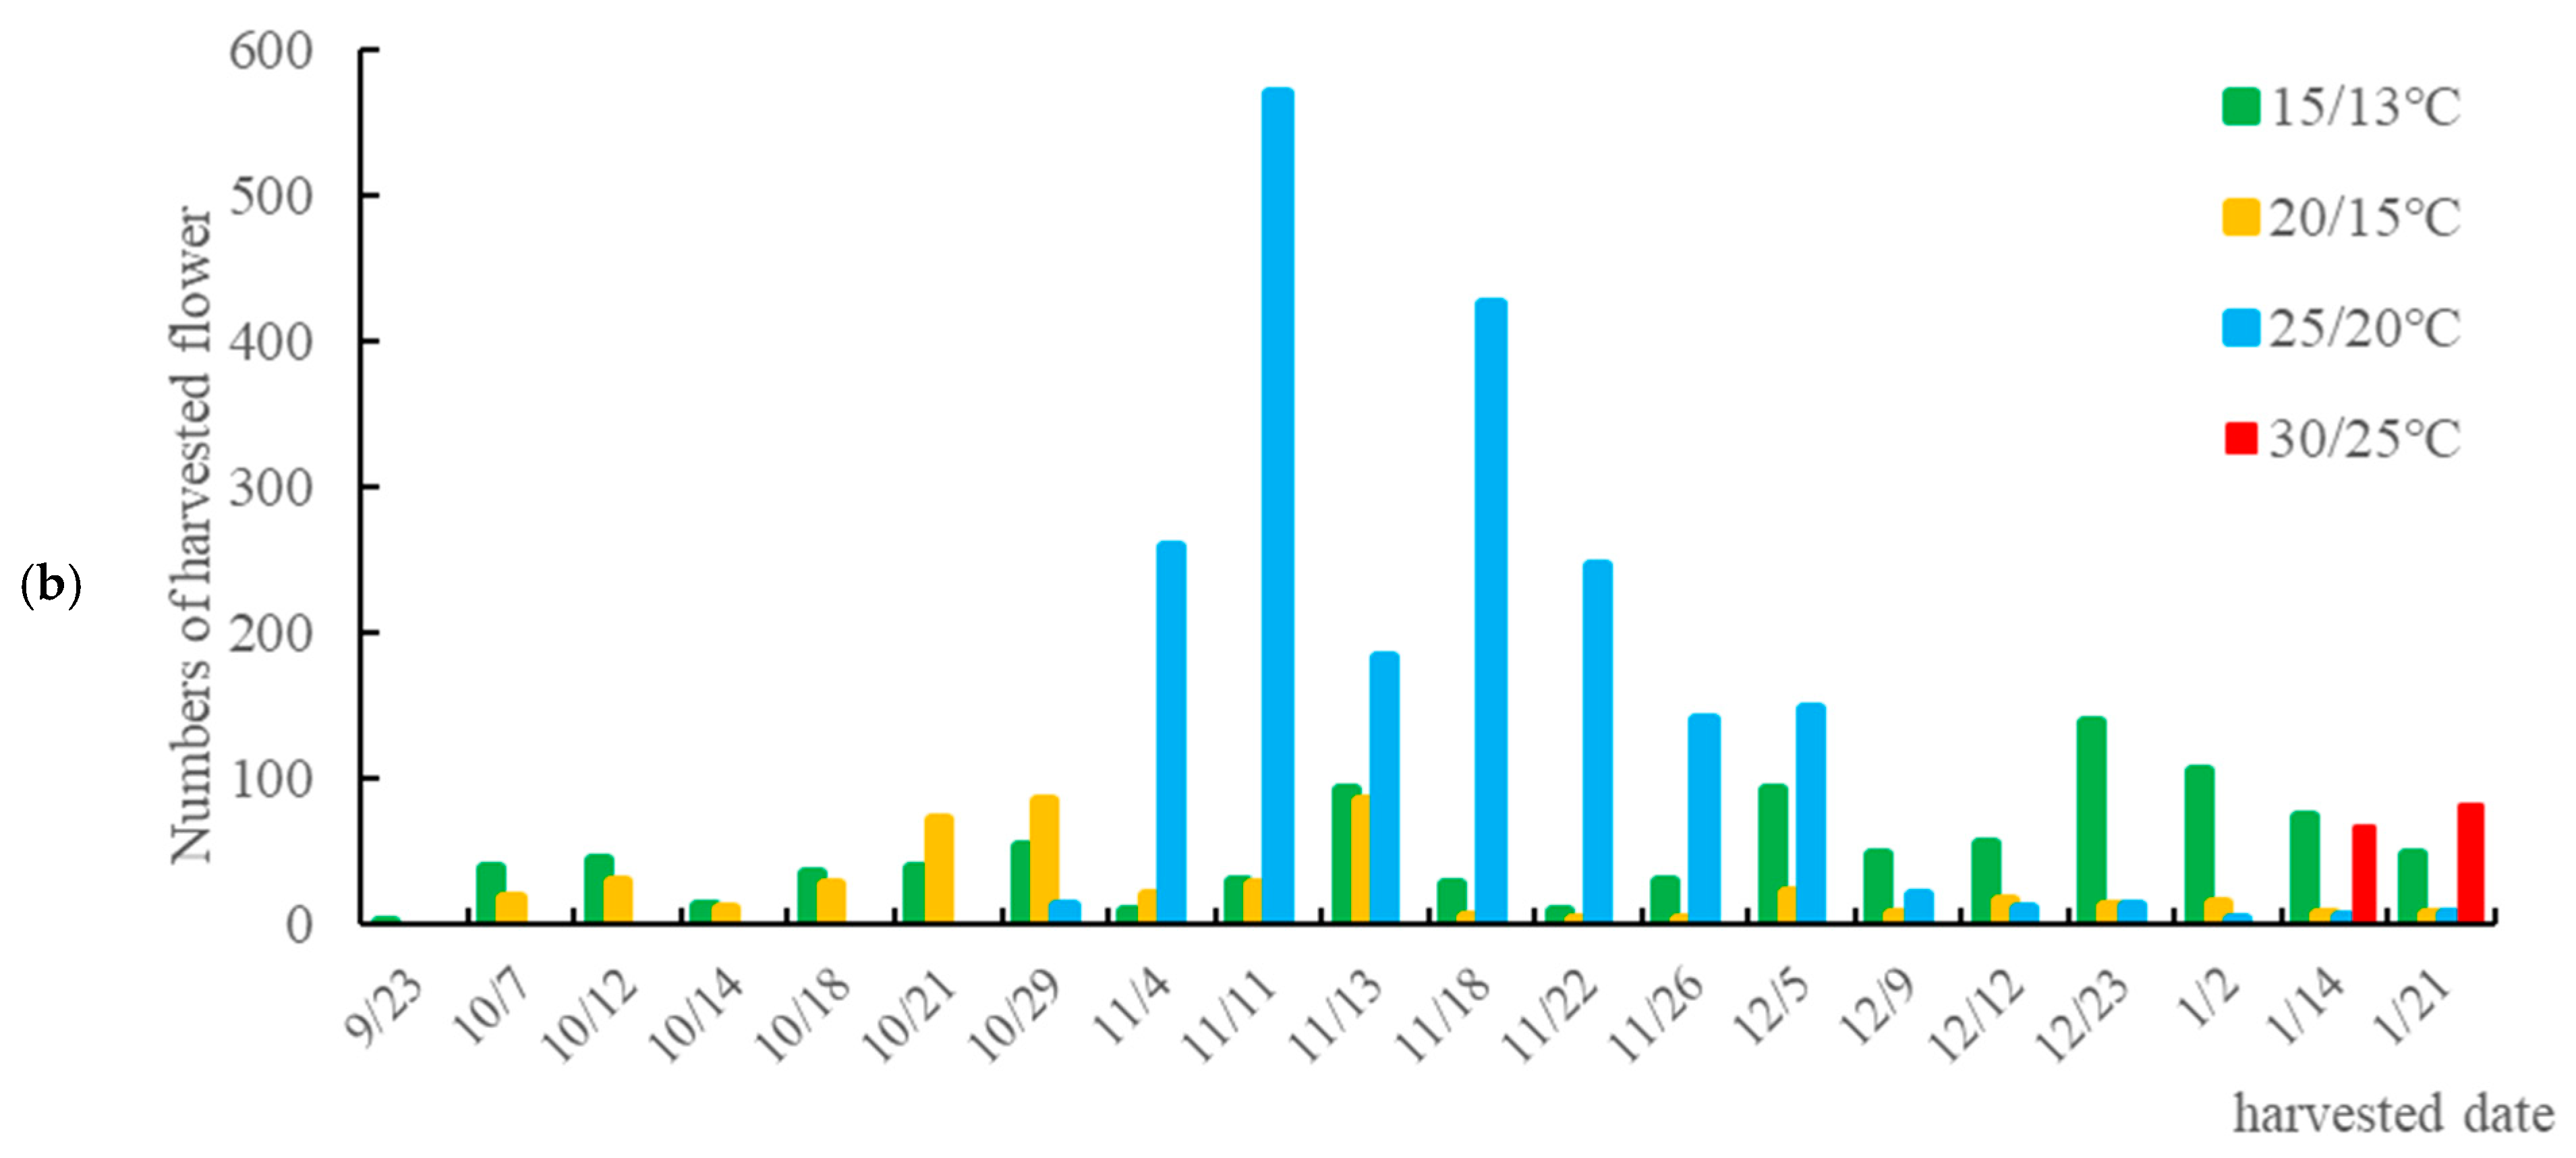
3.2. Effects of Temperature on the Reproductive Growth of Taiwan Hangju No. 1

Figure 3a, the effects of temperature on the development of flower buds. Under the 15/13 °C treatment, flower buds appeared earliest, with a 4% flower bud development rate observed at 40 days (23 July); however, full bud development (100%) was not achieved until 200 days (30 December). Under the 20/15 °C treatment, a 20% flower bud development rate was observed at 60 days but only 91% of the pots developed buds by the end of the experiment. Despite not seeing buds at the earliest, the 25/20 °C treatment reached full bud development by 100 days (21 September). In contrast, flower bud development rate under the 30/25 °C treatment was delayed until 120 days (11 October), and in the 35/30 °C treatment, flower buds were observed only at 140 days (31 October); a maximum development rate of just 55% indicated that high temperature significantly inhibited reproductive growth.
The effect of temperature on flower yield is shown in Figure 3b. The distribution of flower harvest numbers varied considerably among treatments. The 25/20 °C treatment, with a harvest period of 78 days from bud appearance to collection, produced the highest number of flowers, with a peak at mid-harvest (11 November) and a concentration of harvests in November, indicating that this temperature favors steady flower development. The 15/13 °C treatment had a shorter interval of 62 days, resulting in a more dispersed harvest period and lower yield; the 20/15 °C treatment took 56 days from the appearance of flower buds to harvest, also resulting in a dispersed harvest period; and the 30/25 °C treatment yielded very few flowers (a total of 148), while the 35/30 °C treatment produced no flowers (Table 3). These results further confirm that high temperatures adversely affect flowering. The 25/20 °C treatment had the most flowers and the highest dry weight (2049 flowers and 281.83 g dry weight), followed by the 15/13 °C group with 988 flowers and 127.18 g dry weight. The 20/15 °C group, on the other hand, only produced 479 flowers and 53.25 g dry weight. The 30/25 °C treatment yielded minimal flowers (148 flowers, 14.22 g dry weight), and the 35/30 °C group produced no flowers.

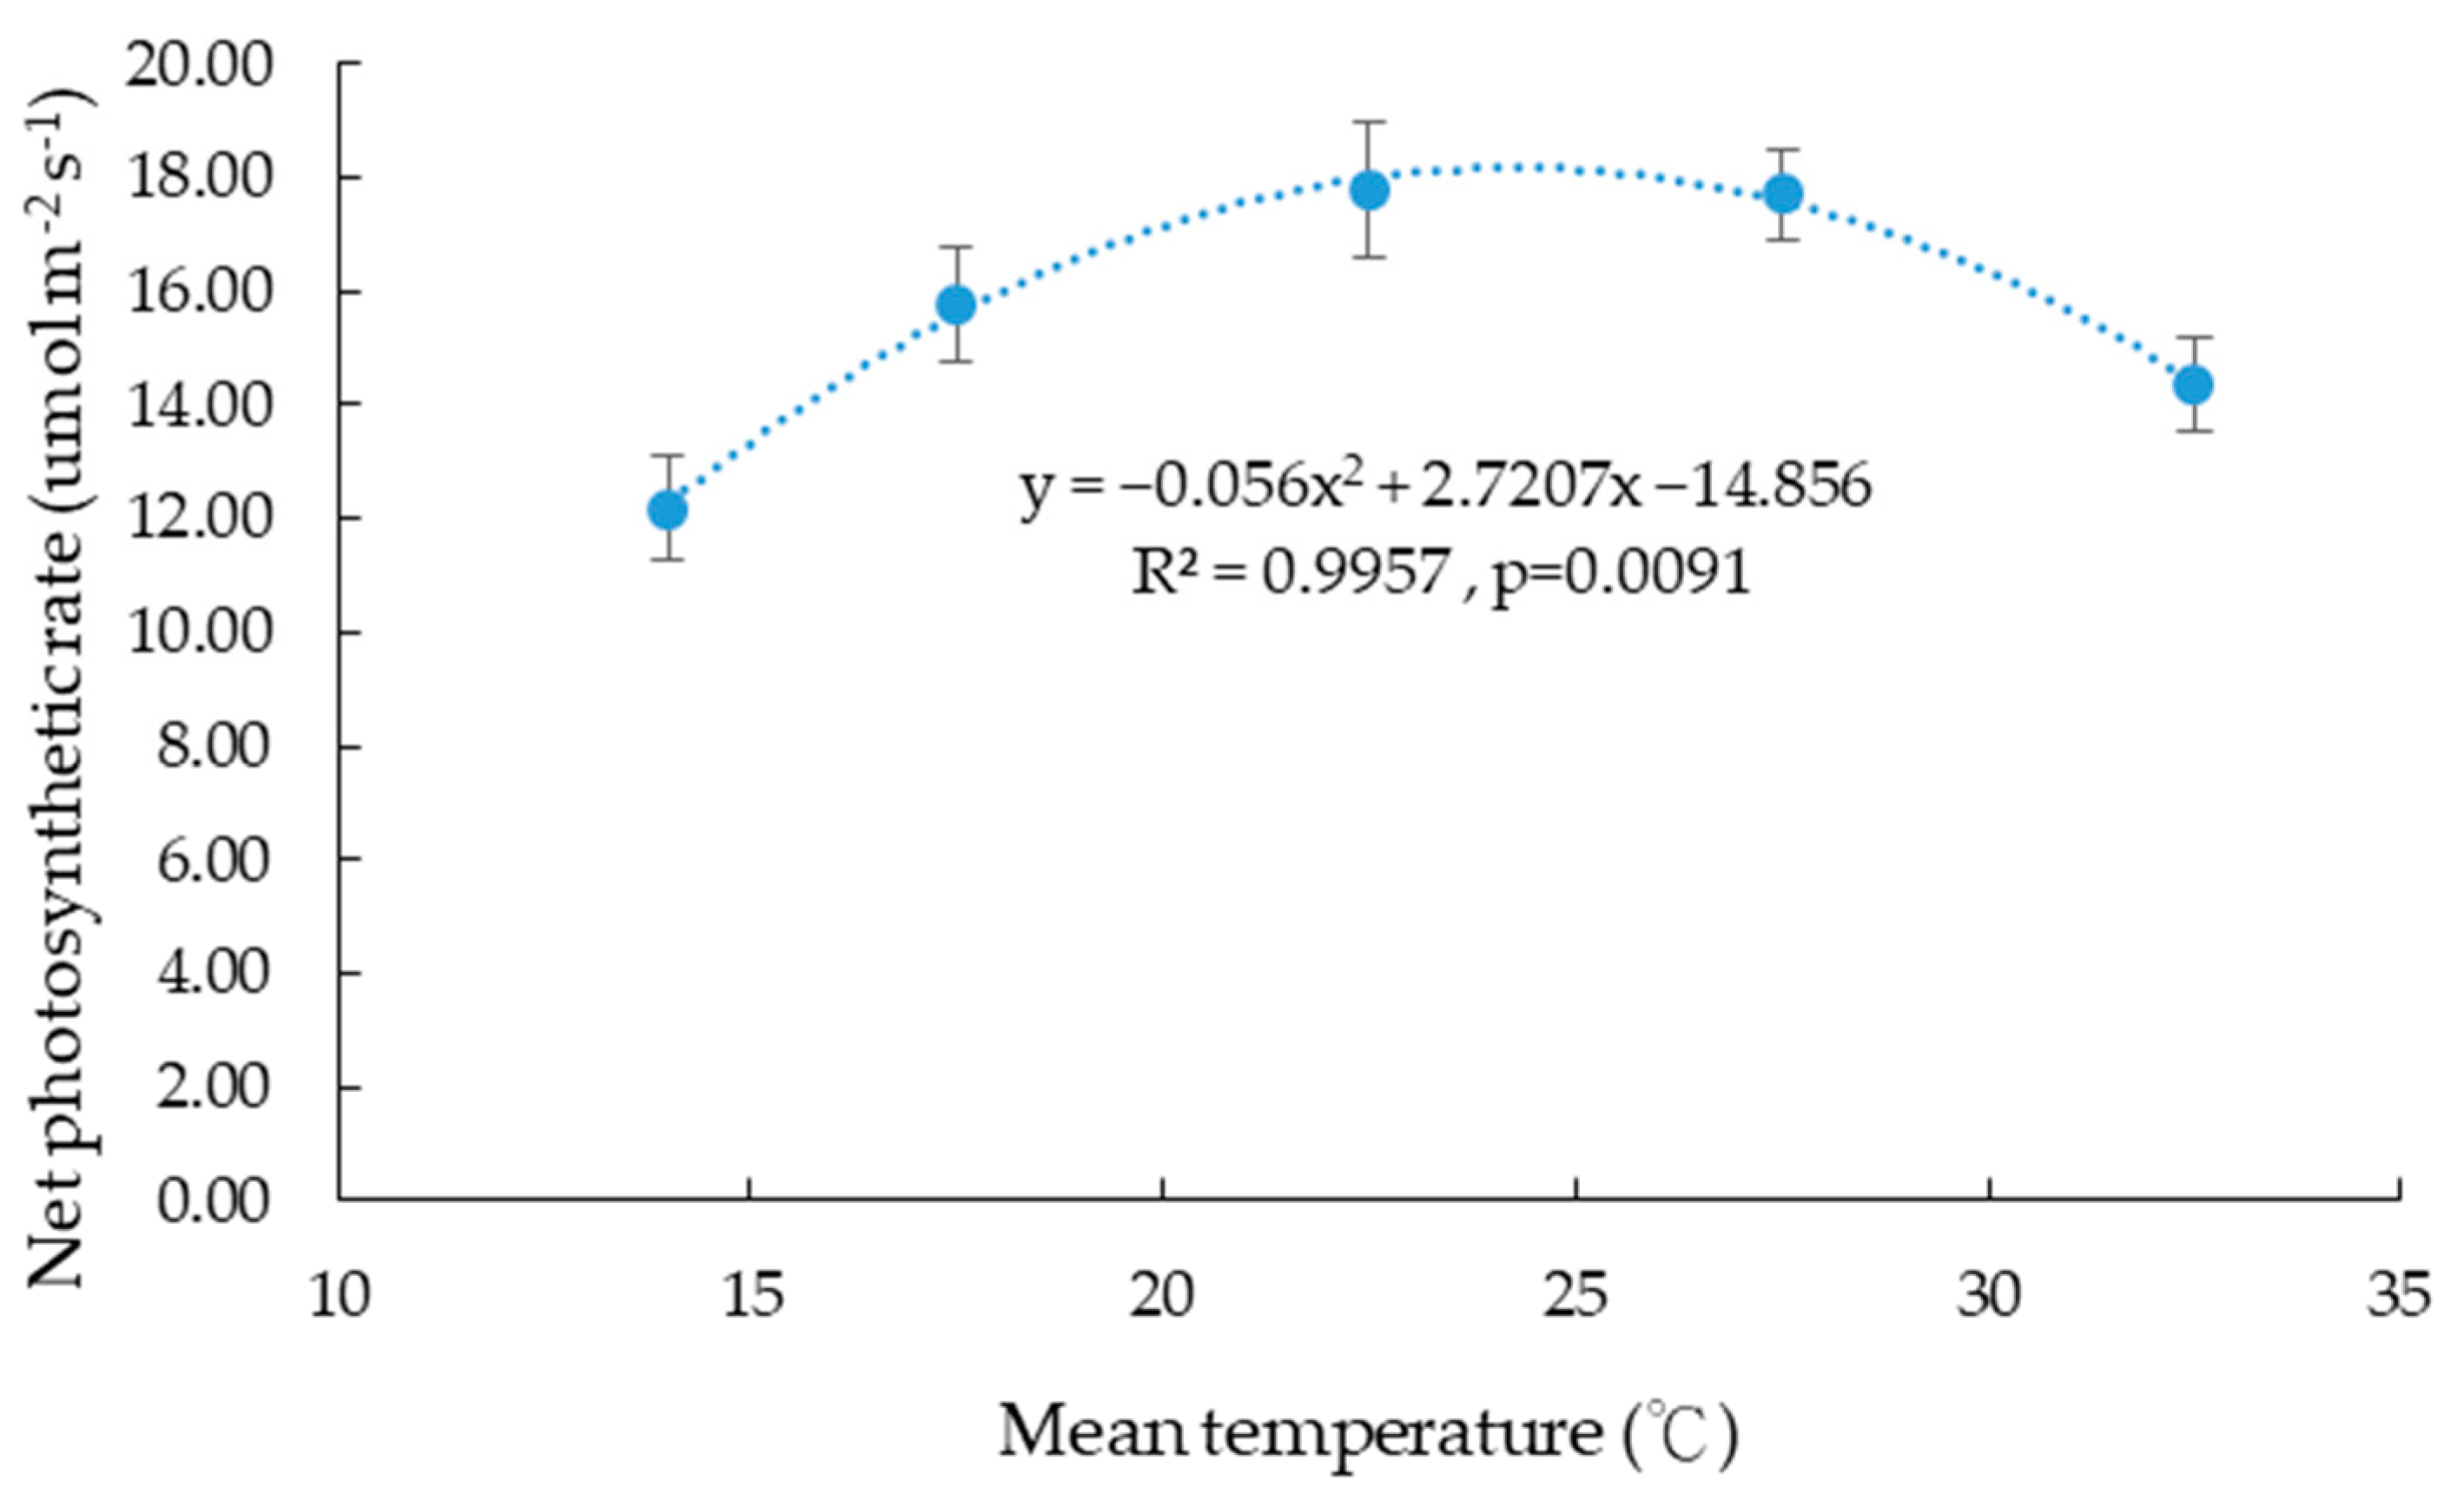
3.3. Effects of Temperature on Photosynthesis

The photosynthetic performance of Taiwan Hangju No. 1 under different temperature treatments during the vegetative phase is presented in Table 4. Regarding the net photosynthetic rate (A), the 25/20 °C and 30/25 °C treatments recorded the highest values (17.79 ± 1.17 and 17.72 ± 0.79 µmol m−2 s−1, respectively), which were significantly higher than those in the other temperature groups, suggesting that moderate temperatures favor photosynthetic efficiency. In contrast, the 15/13 °C treatment recorded the lowest net photosynthetic rate (12.19 ± 0.91 µmol m−2 s−1). Regression analysis indicated a quadratic relationship between net photosynthetic rate and temperature (Figure 4), described by the following equation:
Y = −0.056X2 + 2.7207X − 14.856 (R2 = 0.9957, p < 0.01)
implying that the maximum net photosynthetic rate is attained at approximately 24.3 °C.
The respiration rate (R) increased with temperature, with the highest value recorded under the 35/30 °C treatment (−2.21 ± 0.39 µmol m−2 s−1), significantly higher than in other groups. The 15/13 °C treatment exhibited the lowest respiration rate (−0.57 ± 0.14 µmol m−2 s−1), while the 20/15 °C, 25/20 °C, and 30/25 °C treatments showed no significant differences. Stomatal conductance (gsw) increased with temperature, reaching a maximum of 1.43 ± 0.77 mol m−2 s−1 under the 35/30 °C treatment (p < 0.05), whereas the 15/13 °C treatment recorded the lowest gsw (0.34 ± 0.07 mol m−2 s−1). Similarly, transpiration rate (E) increased with temperature, peaking at 4.05 ± 0.91 mmol m−2 s−1 under the 35/30 °C treatment, indicating that high temperatures promote water loss. In contrast, water use efficiency (WUE) was highest under the 15/13 °C treatment (10.93 ± 3.95) and decreased significantly with rising temperature, reaching its lowest value (3.85 ± 0.86) under the 35/30 °C treatment, reflecting increased water consumption and reduced photosynthetic efficiency at high temperatures.

3.4. Concentration and Content of Functional Compounds in Chrysanthemum morifolium Bud-Leaves

3.4.1. The Concentration of Functional Compounds in Bud-Leaves

The concentration of functional compounds in the bud-leaves of Chrysanthemum morifolium ‘Taiwan Hangju No. 1’ under different day/night temperature treatments is shown in Table 5. The analyzed compounds include total polyphenols, free amino acids, flavonoids, luteolin, lutein, and affeoylquinic acid (CQAs).
The total polyphenols concentration increased significantly with rising temperatures, reaching the highest level at 35/30 °C (19.33 ± 6.64 mg/g), which was significantly higher than that at 15/13 °C (10.98 ± 1.79 mg/g). The free amino acid concentration was highest under 15/13 °C (69.49 ± 6.62 mg/g) treatment, significantly higher than other temperature treatments. The lowest concentration was observed at 35/30 °C (25.21 ± 1.56 mg/g). The decreasing trend of free amino acid concentration with increasing temperature suggests that low temperatures may promote nitrogen metabolism and amino acid synthesis. The total flavonoid concentration also increased with temperature, reaching the highest value at 35/30 °C (18.34 ± 6.26 mg/g), significantly higher than that at 15/13 °C (12.31 ± 1.41 mg/g). Luteolin concentration showed a similar increasing trend with temperature, with the highest concentration observed at 35/30 °C (88.00 ± 0.90 μg/g), significantly exceeding the 15/13 °C treatment (62.00 ± 0.10 μg/g). The lutein concentration peaked at 20/15 °C (880.50 ± 13.80 μg/g), followed by 35/30 °C (865.50 ± 7.00 μg/g). The lowest lutein concentration was observed at 15/13 °C (797.60 ± 19.10 μg/g), indicating that low-temperature conditions are unfavorable for lutein accumulation.
This study analyzed six affeoylquinic acid derivatives: chlorogenic acid (3-CQA), cryptochlorogenic acid (4-CQA), neochlorogenic acid (5-CQA), and three isochlorogenic acids, namely 3,4-di-O-caffeoylquinic acid (3,4-CQA), 3,5-di-O-caffeoylquinic acid (3,5-CQA), and 4,5-di-O-caffeoylquinic acid (4,5-CQA). The total affeoylquinic acid concentration increased with temperature, reaching the highest levels at 35/30 °C (61.83 ± 25.86 mg/g). Among these derivatives, 3-CQA and 3,5-CQA were the predominant forms, collectively accounting for more than 90% of the total CQAs concentration in the bud-leaves. According to the above results, high-temperature treatment (35/30 °C) promoted the accumulation of total polyphenols, Flavonoids, luteolin, and affeoylquinic acid; and low-temperature treatment (15/13 °C) enhanced free amino acid accumulation. These results indicate that temperature significantly influences the accumulation of functional compounds in ‘Chrysanthemum morifolium’ bud-leaves.

3.4.2. The Content of Functional Compounds in Bud-Leaves

The content of each functional compound was determined by multiplying its concentration by the dry weight of the harvested bud-leaves. The calculated results are shown in Table 6. The total polyphenols content was highest in the 30/25 °C treatment group, reaching 1481.67 ± 420.80 mg, significantly higher than in other temperature treatments. The total free amino acid content was highest in the 15/13 °C treatment group, reaching 3357.36 ± 639.67 mg, and decreased as temperature increased. The total flavonoid content was highest in the 30/25 °C treatment group, reaching 1436.91 ± 434.98 mg. The total luteolin content also peaked at 30/25 °C, reaching 6.39 ± 1.07 mg, significantly higher than in other temperature treatments. The total lutein content was highest in the 30/25 °C treatment (79.30 ± 2.14 mg), significantly higher than in other temperature treatments. The total content of individual affeoylquinic acid and total affeoylquinic acid derivatives was also highest in the 30/25 °C treatment, reaching 4663.66 ± 1670.75 mg. In conclusion, the 30/25 °C treatment resulted in the highest total content of polyphenols, flavonoids, luteolin, and both individual and total CQAs, while free amino acids accumulated most at the lowest temperature of 15/13 °C.

3.5. Concentration and Content of Functional Compounds in Chrysanthemum morifolium ‘Taiwan Hangju No. 1’ Flowers

Since the flowers in the highest temperature treatment (35/30 °C) did not reach the harvest standard by the end of the experiment, no flowers were collected from this treatment. Therefore, the functional compounds were analyzed in flowers from the other four temperature treatments, comparing their concentrations and contents.

3.5.1. The Concentration of Functional Compounds in Flowers

Table 7 shows the changes in the concentration of functional compounds in Chrysanthemum morifolium ‘Taiwan Hangju No. 1’ flowers under different temperature treatments. The total polyphenols concentration increased with temperature, reaching the highest concentration at 30/25 °C (19.98 ± 0.04 mg/g), which was significantly higher than that under lower temperature treatments. The free amino acid concentration showed an opposite trend to total polyphenols, reaching the highest level at 20/15 °C (64.81 ± 1.68 mg/g), while higher temperature treatments (25/20 °C and 30/25 °C) significantly reduced the free amino acid content. The total flavonoid concentration did not show a clear trend with temperature variation, but the highest concentration was observed in the 25/20 °C treatment (18.13 ± 0.07 mg/g), significantly higher than other treatments. The luteolin concentration increased significantly with temperature, reaching its highest level at 30/25 °C (80.18 ± 1.04 μg/g). In contrast, the lutein concentration was highest at 20/15 °C (77.43 ± 0.84 μg/g) and decreased at higher temperatures. Affeoylquinic acid derivative (3-CQA, 4-CQA, 5-CQA, 3,4-CQA, and 3,5-CQA) concentrations significantly increased with temperature, with the total CQAs concentration reaching its highest at 30/25 °C (8.73 ± 1.90 mg/g). The results indicate that 3-CQA and 3,5-CQA accounted for over 90% of the total CQA, while 4,5-CQA was not detected.
According to the above results, the concentration of functional compounds that increased with temperature included total polyphenols, luteolin, and affeoylquinic acid derivatives (CQAs), showing a trend similar to that observed in bud-leaves. However, total free amino acids and total flavonoids concentrations exhibited different patterns from those in bud-leaves. The highest free amino acid and lutein concentration was recorded at 20/15 °C, while the highest total flavonoids concentration was observed at 25/20 °C.

3.5.2. The Content of Functional Compounds in Flowers

Table 8 showed the changes in the total content of functional compounds in Chrysanthemum morifolium ‘Taiwan Hangju No. 1’ flowers under different temperature treatments. The total content of functional compounds in flowers was influenced by the harvested yield, with temperature significantly affecting the total amounts of polyphenols, free amino acids, flavonoids, luteolin, lutein, and affeoylquinic acid derivatives (CQAs). The highest total content of these functional compounds was recorded in the 25/20 °C treatment, primarily due to the highest flower yield observed at this temperature condition.

4. Discussion

4.1. Effects of Temperature on the Vegetative Growth of Taiwan Hangju No. 1

Temperature is an important environmental factor influencing the growth, development, and flowering of chrysanthemums. The optimal temperature range for chrysanthemum growth is 15–25 °C [25]. During the vegetative phase of potted chrysanthemums, when temperatures are high and the average daily sunshine duration is long, the dry weight and nutrient uptake of the plant begin to increase rapidly within two weeks after planting. In contrast, when the temperature is low and the daily sunshine duration is short, the increase in dry weight and nutrient uptake is delayed until about five weeks after planting, resulting in a longer vegetative growth period [35]. Echinacea purpurea leaf formation was slow under a 15/13 °C treatment, whereas increasing the temperature to 30/25 °C accelerated leaf formation. However, under high-temperature treatments (35/30 °C and 30/25 °C), the plants tended to form clusters with limited stem elongation and reduced total dry weight [36]. The present study indicates that Taiwan Hangju No. 1 exhibits considerable adaptability to temperature. Under the lowest temperature treatment (15/13 °C), high survival rates were maintained, but the 35/30 °C treatment led to increased mortality and reduced plant height. High temperatures have an inhibitory effect on the growth of Chrysanthemum morifolium, whereas low temperatures tend to slow down its development. This phenomenon may be associated with the suppression of photosynthetic activity and the enhancement of respiratory processes, ultimately leading to growth inhibition. The 25/20 °C treatment was found to be optimal for both growth and bud–leaves yield, as both excessively high and low temperatures inhibited plant growth and bud–leaves production, underscoring the critical role of temperature during vegetative development.

4.2. Effects of Temperature on the Flowering of Taiwan Hangju No. 1

Chrysanthemums are short-day plants, and most ornamental chrysanthemum cultivars flower naturally during autumn and winter as the day length gradually shortens. In addition to the photoperiodic response, flowering in chrysanthemums is also affected by temperature [37]. Chrysanthemums prefer bright, cool, and well-ventilated conditions; for instance, autumn chrysanthemum flower bud differentiation typically requires a night temperature of 15–16 °C, while temperatures exceeding 28 °C delay flowering and diminish flower quality [38]. In low-altitude production areas, Hangju flowers generally reach harvest standards approximately 2.5 months after flower buds are visible. This finding is consistent with our results under the 25/20 °C treatment, where the interval from visible flower bud to harvest was 78 days. Although low-temperature treatments can induce earlier flower bud development and earlier harvest, they also result in a more dispersed flowering period and lower flower yields. Moreover, both the visible flower bud date and the duration from visible flower bud to harvest are prolonged with increasing temperature. Our results demonstrate that temperature significantly affects flower bud development, the interval from visible flower bud to harvest, the uniformity of the harvest, and overall yield. The 25/20 °C treatment group exhibited the highest flower yield with a concentrated harvest period, indicating that a warm environment is more conducive to bud development. In contrast, the 35/30 °C treatment group did not show visible buds until 140 days after treatment, highlighting that high temperatures severely suppress reproductive growth.
In Hangju, low temperatures promote floral development, while moderate temperatures (25/20 °C, day/night) enhance flowering. In contrast, slightly higher temperatures (30/25 °C) delay floral bud development, and high temperatures (35/30 °C) severely inhibit reproductive growth. These findings indicate that C. morifolium is a low-temperature-sensitive cultivar. According to Lyu et al. 2022, in low-temperature-sensitive chrysanthemums, the expression of CmMAF2 was directly induced by CmC3H1. CmMAF2 then directly targeted CmGA20ox1, elevating bioactive GA levels and in turn activating CmLFY expression, ultimately resulting in flowering [39].

4.3. Effects of Temperature on Photosynthesis of Taiwan Hangju No. 1

Temperature is one of the most critical factors affecting photosynthesis, a process considered to be the most temperature-sensitive within the plant. It limits plant productivity and determines the native distribution of species [40,41,42]. An appropriate temperature enhances the photosynthetic efficiency of chrysanthemums, promoting healthy growth and improving flower quality. Both excessively high and low temperatures inhibit photosynthesis, thereby affecting plant growth and development. Moreover, increasing temperature accelerates respiration; if the temperature exceeds the optimum range, the net photosynthetic rate may decline, ultimately affecting plant growth and yield. In this study, the net photosynthetic rate exhibited a quadratic relationship with temperature, with the optimum estimated at approximately 24.3 °C. Wang et al. (2009) also reported that the light saturation point of Hangbaiju was around 1217 μmol m−2 s−1 and predicted an optimal growth temperature between 23 and 26 °C based on net photosynthesis [43]. Furthermore, Zhou et al. (2023) found that with increasing temperature, parameters such as apparent quantum efficiency (AQE), maximum net photosynthetic rate (Pn-max), net photosynthetic rate (Pn), transpiration rate (Tr), water use efficiency (WUE), maximal recorded fluorescence intensity (Fm), PSII maximal photochemical efficiency (Fv/Fm), absorption flux per cross section (ABS/CSm), trapped energy flux per cross section (TRo/CSm), and electron transport flux per cross section (ETo/CSm) significantly decreased. In contrast, the minimal recorded fluorescence intensity (Fo), fluorescence intensity at the J-point of the OJIP curve (Fj), and nonphotochemical quenching per cross section (DIo/CSm) significantly increased. Among these factors, temperature was found to be the most influential on net photosynthesis (Pn), followed by relative humidity (RH) [44]. Sun et al. (2008) observed that under a day/night temperature of 33/28 °C, the net photosynthetic rate of ‘henma’ cut chrysanthemum gradually decreased, and stomatal conductance significantly declined after 5 days [38]. The results of this study indicate that high-temperature treatment at 35/30 °C increased the stomatal conductance, transpiration rate, and respiration in ‘Taiwan Hangju No. 1’. This response is likely associated with the plant’s cooling regulation mechanism to adapt to heat stress, as well as the enhancement of enzyme activity and metabolic rates, providing the necessary energy for cell repair and growth under stress conditions. At 25/20 °C, we observed the highest photosynthetic efficiency and water use efficiency, which likely accounts for the differences in bud and leaf yield. We also recommend this temperature condition as the optimal environment for cultivation. In contrast, both extremely low and high temperatures had adverse effects on photosynthesis.

4.4. Effects of Temperature on the Concentration and Content of Functional Components in Chrysanthemum morifolium

Environmental factors significantly influence crop growth, not only affecting yield but also altering the concentration of functional components due to climatic factors such as temperature, sunlight, and precipitation. ‘Chrysanthemum morifolium’ is both a medicinal and edible crop, where not only the yield but also the quality of functional components is highly valued. The differences in the content of functional components among chrysanthemum flowers from various production regions have been previously reported [45]. Liang et al. (2007) demonstrated that meteorological factors influence the formation of primary metabolites in ‘Chrysanthemum morifolium’ flowers and have a considerable impact on secondary metabolite accumulation. The study also indicated that the total sunshine duration per year and soil temperature at 10 cm depth were the key meteorological factors affecting the total flavonoids and affeoylquinic acid content in ‘Chrysanthemum morifolium’ flowers [46]. The results of this study indicate that higher temperatures promote the accumulation of phenolic compounds, including total polyphenols, total flavonoids, Luteolin, and chlorogenic acid derivatives. This finding is consistent with previous reports on Anoectochilus roxburghii, in which the contents of flavonoids such as quercetin, tricetin, isorhamnetin, scutellarein, and 4′,7-isoflavandiol increased under short-term heat stress (35/30 °C), as revealed by integrated metabolomic, transcriptomic, and biochemical analyses [47]. Similar results were observed in Auricularia heimuer, an edible fungus, where high temperatures (30 °C and 35 °C) significantly enhanced the accumulation of phenolic compounds and flavonoids, as demonstrated by a multi-omics analysis [48]. The accumulation of these secondary metabolites may be associated with the activation of the antioxidant defense system under high-temperature-induced oxidative stress. In chrysanthemum, elevated temperatures can lead to excessive production of reactive oxygen species (ROS), which in turn trigger the synthesis of phenolic compounds with antioxidant properties to mitigate oxidative damage. This mechanism is consistent with previous studies, which have shown that warming intensifies oxidative stress and stimulates the accumulation of defensive metabolites in leaves and fine roots [49].
Gargallo-Garriga et al. (2015) reported that different plant organs exhibit varying sensitivities to temperature, which can lead to differences in both the composition and activity of antioxidant systems among organs. As a result, plant organs may respond differently to high-temperature stress [50]. In the present study, the highest concentrations of flavonoids and free amino acids accumulated at different temperatures in young leaves and flowers, further indicating that distinct plant organs exhibit differential responses to temperature variations.
The yield differences between bud-leaves and flowers contributed to the variation in the content of functional compounds. Except for free amino acids, the highest accumulation of functional components in young leaves was observed at 30/25 °C, whereas the total content of functional compounds in flowers was significantly higher at 25/20 °C compared to other treatments. These results suggest that different plant organs adopt distinct metabolic strategies in response to varying temperatures. The organ-specific accumulation patterns of functional compounds under temperature regulation highlight the importance of optimizing cultivation practices to improve the quality of Chrysanthemum morifolium. Furthermore, the findings demonstrate that cultivation temperature significantly influences the concentration of individual functional compounds. In addition, temperature-induced differences in vegetative growth also contributed to the observed variations in the accumulation of these compounds.
The findings of this study identified the optimal temperature conditions for the production of Chrysanthemum morifolium ‘Taiwan Hangju No1’, offering valuable insights for early adaptation strategies in response to global warming. These results can guide the selection and adjustment of suitable cultivation regions. Moreover, they serve as a practical reference for setting temperature conditions in greenhouse production systems. For instance, maintaining a day/night temperature around 25/20 °C can lead to a more synchronized flowering period, improving the efficiency of labor and drying processes, while also maximizing yield and the accumulation of key functional compounds such as flavonoids. For industries focused on the production of high-value plant-derived functional ingredients, this study provides concrete recommendations for environmental regulation, contributing to improved product quality and enhanced market competitiveness.
However, this study was conducted within a limited temperature range and did not encompass a broader spectrum of day/night temperature differences, which may have restricted a more comprehensive understanding of plant responses to environmental factors. Additionally, the absence of physiological indicators such as chlorophyll fluorescence and plant hormone concentrations limits the mechanistic interpretation of the findings. Future studies integrating transcriptomic or metabolomic analyses are recommended to more clearly elucidate the underlying mechanisms by which temperature regulates plant physiology and metabolism.

5. Conclusions

This study identifies 25/20 °C as the optimal temperature regime for the cultivation of Chrysanthemum morifolium cv. ‘Taiwan Hangju No. 1’, maximizing vegetative growth, flowering uniformity, and the accumulation of key bioactive compounds. The findings demonstrate that temperature not only governs growth and reproductive timing but also drives complex organ-specific metabolic responses. This research provides new insights into how temperature influences the synthesis and allocation of secondary metabolites in edible chrysanthemums, with direct implications for climate-resilient crop management. The study offers actionable recommendations for greenhouse producers and functional ingredient industries, contributing to the sustainable production of high-quality medicinal and edible chrysanthemums in subtropical and temperate regions.

Author Contributions

Conceptualization, methodology, investigation, formal analysis, writing—original draft preparation, C.-F.L.; investigation, Y.-J.C. and C.-C.K.; investigation, writing—review and editing, P.-A.C.; resources, supervision, I.-Z.C.; writing—review and editing, T.-C.S., K.-H.C., Y.-S.C. and C.-H.C. All authors have read and agreed to the published version of the manuscript.

Funding

This research was funded by the Tea and Beverage Research Station of Taiwan (108AS-7.7.4-TS-T1).

Data Availability Statement

The data are contained within the article.

Acknowledgments

The authors thank the Tea and Beverage Research Station (TBRS) for providing the analysis equipment.

Conflicts of Interest

The authors declare no conflicts of interest.

References

  1. Xu, H.H.; Wu, M.; Wei, W.G.; Ren, W.K.; Zheng, Z.A. Chrysanthemum morifolium Ramat. as a traditional tea material: Unraveling the influence of kill-green process on drying characteristics, phytochemical compounds, and volatile profile. Food Res. Int. 2025, 200, 115478. [Google Scholar] [CrossRef] [PubMed]
  2. Ding, Y.F.; Cheng, R.A.; Li, Y.; Jiang, D.L.; Zhao, H.S.; Wu, X.F.; Shu, Y.C.; Lu, T.L.; Jin, C.S.; Wu, D.L.; et al. Effects of stir-frying on chemical profile, sensory quality and antioxidant activity of Chrysanthemi Flos: A metabolomics and sensory study. Food Res. Int. 2025, 200, 115391. [Google Scholar] [CrossRef] [PubMed]
  3. Allied Market Research. 2023. Chrysanthemum Tea Market. Available online: https://www.alliedmarketresearch.com/chrysanthemum-tea-market-A110757 (accessed on 7 April 2025).
  4. KBV Research. 2023. Global Chrysanthemum Tea Market Report. Available online: https://www.kbvresearch.com/chrysanthemum-tea-market/ (accessed on 7 April 2025).
  5. Li, J.M.; Li, H.Q.; Hu, S.X. Investigation on types of Chrysanthemum morifolium. China Mod. Med. 2016, 6, 93–96. [Google Scholar]
  6. Zhang, J.; Qian, D.W.; Li, Y.B.; Yin, Z.Q. Chemical Constituents from Chrysanthemum morifolium Ramat. Nat. Prod. Res. Dev. 2006, 1, 71–73. [Google Scholar]
  7. Chang, W.Y. Studies on Health Components of Chrysanthemum morifolium. Master’s Thesis, Department of Food Science, Tunghai University, Taichung, Taiwan, 2007. [Google Scholar]
  8. Wang, T.; Shen, X.G.; Guo, Q.S.; Zhou, J.S.; Mao, P.F.; Shen, Z.G. Comparison of major bioactive components from leaves of Chrysanthemum morifolium. China J. Chin. Mater. Medica 2015, 40, 1670–1674. [Google Scholar]
  9. Wang, C.S. Chemical Composition of Chrysanthemum morifolium Ramat Leaves and Eye-Care Product Development. Master’s Thesis, Graduate Institute of Food Science, Yuanpei University of Medical Technology, Hsinchu, Taiwan, 2018. [Google Scholar]
  10. Zhu, L.; Guo, J.M.; Yang, N.Y.; Qian, D.W.; Nie, H.; Su, S.L.; Ouyang, Z.; Duan, J.A. Distribution and dynamic changes of chemical constituentes from non-medicial parts of Chrysanthemum morifolium. Chin. Tradit. Herb. Drugs. 2014, 45, 425–431. [Google Scholar]
  11. Liu, C.F.; Guo, C.C. Taiwan Hang Ju No. 1 (Snow) Flower Tea and Leaf Tea health ingredients. Tea Newsl. 2017, 100, 11–14. [Google Scholar]
  12. Liu, C.F. Chrysanthemum morifolium Ramat Leaf Tea Processing Technology. Taiwan. Agri. Techno Mart. 2015, 124. Available online: https://tatm.moa.gov.tw/Home/EPaperNewsTempShowHistory.aspx?type=1&typecode=2&etmno=434 (accessed on 24 November 2024).
  13. Zhang, Q.H.; Zhang, L. Research Advance in Chemical Composition and Pharmacological Action of Chrysanthemum morifolium. Food Drug. 2007, 2, 60–63. [Google Scholar]
  14. Lo, Y.F.; Chang, D.L.; Chen, L.G.; Wang, C.C. Studies on the Antibiotic Activity and Bio-Activity of Anti-Inflammation of Several Endemic Medicinal Plants. Seed Nurs. 2009, 4, 13–26. [Google Scholar]
  15. Qu, L.; Wang, T.; Dong, Y.Z.; Zhang, J.H.; Zhang, Y. Research progress on chemical constituents of Chrysanthemum morifoliuin and their pharmacologic activities. Drug Eval. Res. 2015, 1, 98–104. [Google Scholar]
  16. Zheng, C.; Dong, Q.; Chen, H.; Cong, Q.; Ding, K. Structural characterization of a polysaccharide from Chrysanthemum morifolium flowers and its antioxidant activity. Carbohydr. Polym. 2015, 130, 113–121. [Google Scholar] [CrossRef]
  17. Chen, D.Y. CMFE (Chrysanthemum morifolium Flower Extract) Prevents Retinal Ganglia Cell and Ischemic Damages in an AOH (Acute Ocular Hypertension) Glaucoma Mouse Model. Master’s Thesis, Department of Mdeical Laboratory and Biotechnology, Chung Shan Medical University, Taichung, Taiwan, 2017. [Google Scholar]
  18. Wang, D.S.; Huang, Y.M.; Shi, Y. Research Progress on Chemical Constituent and Pharmacological Action of Chrysanthemum. J. Anhui Agric. Sci. 2018, 23, 9–17. [Google Scholar]
  19. Ai, Y.T. Effect of Chrysanthemum morifolium Ramat. Leaf Extract on Dry Eye. Master’s Thesis, Department of Medical Laboratory and Biotechnology, Chung Shan Medical University, Taichung, Taiwan, 2023. [Google Scholar]
  20. Mathur, S.; Agrawal, D.; Jajoo, A. Photosynthesis: Response to high temperature stress. J. Photochem. Photobiol. B Biol. 2014, 137, 116–126. [Google Scholar] [CrossRef]
  21. Scafaro, A.P.; Fan, Y.; Posch, B.C.; Garcia, A.; Coast, O.; Atkin, O.K. Responses of leaf respiration to heatwaves. Plant Cell Environ. 2021, 7, 2090–2101. [Google Scholar] [CrossRef]
  22. Zobayed, S.M.A.; Afreen, F.; Kozai, T. Temperature stress can alter the photosynthetic efficiency and secondary metabolite concentrations in St. John’s Wort. Plant Physiol. Biochem. 2005, 10, 977–984. [Google Scholar] [CrossRef] [PubMed]
  23. Tang, Z.H.; Jiao, Y.; Zhang, X.K.; Zu, Y.G.; Gao, Y.; Sun, Y.F.; Yang, L.; Zhao, X.J. Effect of high temperature on life cycle forms and physiological metabolisms of Catharanthus roseus. Acta Ecol. Sin. 2006, 11, 3641–3646. [Google Scholar]
  24. Yang, L.; Wen, K.S.; Ruan, X.; Zhao, Y.X.; Wei, F.; Wang, Q. Response of Plant Secondary Metabolites to Environmental Factors. Molecules 2018, 4, 762. [Google Scholar] [CrossRef]
  25. Sheu, C.S. Chrysanthemum Breeding. In Proceedings of the Symposium on Achievements of Floriculture Research Team of Councial of Agriculture in 2011; Taiwan Agricultural Research Institute, COA: Taichung, Taiwan, 2012; pp. 61–70. [Google Scholar]
  26. Li, Z.M.; Zhou, H.G.; Chen, Y.; Chen, M.Y.; Yao, Y.T.; Luo, H.H.; Wu, Q.; Wang, F.L.; Zhou, Y.W. Analysis of Transcriptional and Metabolic Differences in the Petal Color Change Response to High-Temperature Stress in Various Chrysanthemum Genotypes. Agronomy 2024, 12, 2863. [Google Scholar] [CrossRef]
  27. Wu, D.; Wu, Y.X.; Gao, R.Q.; Zhang, Y.H.; Zheng, R.Y.; Fang, M.H.; Li, Y.H.; Zhang, Y.; Guan, L.; Gao, Y.Q. Integrated Metabolomics and Transcriptomics Reveal the Key Role of Flavonoids in the Cold Tolerance of Chrysanthemum. Int. J. Mol. Sci. 2024, 14, 7589. [Google Scholar] [CrossRef]
  28. Uranishi, R.; Aedla, R.; Alsaadi, D.H.M.; Wang, D.X.; Kusakari, K.; Osaki, H.; Sugimura, K.; Watanabe, T. Evaluation of Environmental Factor Effects on the Polyphenol and Flavonoid Content in the Leaves of Chrysanthemum indicum L. and Its Habitat Suitability Prediction Mapping. Molecules 2024, 5, 927. [Google Scholar] [CrossRef] [PubMed]
  29. Iwasa, K. Methods of chemical analysis of green tea. Jpn. Agric. R. Q. 1975, 3, 161–164. [Google Scholar]
  30. Ikegaya, K.; Masuda, M. A New Simple Determination Method of Total Amino Acids in Tea. Natl. R. Ins. Tea 1986, 63, 35–36. [Google Scholar] [CrossRef]
  31. Li, Y.; Ling, W.Z.; Ye, Y.; Li, M.D.; Lan, F.C.; Xiao, A.L.; Zheng, K.W.; Huang, G.C.; Huang, Y. Study on the Determination of Flavonoids in Eugenia caryophyllata Thunb. by VIS UV Spectrophotometry. Lishizhen Med. Mater. Medica R. 2007, 2, 271–272. [Google Scholar]
  32. Chinese National Standards-Taiwan (CNS15022 N6384); Method of Test for Catechins Content in Foods. Bureau of Standards, Metrology and Inspection, Ministry of Economic Affairs: Taipei, Taiwan, 2006.
  33. List of Editorial Members of Taiwan Herbal Pharmacopeia. Chrysanthemi Flos. In Taiwan Herbal Pharmacopeia, 3rd ed.; Ministry of Health and Welfare Taiwan (MOHW): Taipei, Taiwan, 2019; pp. 348–350. [Google Scholar]
  34. Available online: https://www.fda.gov.tw/upload/133/Content/2012110809292523102.pdf (accessed on 10 September 2019).
  35. Lo, C.S.; Wang, F.N. Effects of Transplanting Time on the Plant Growth and Nutrient Uptake of Potted Chrysanthemum. Bull. Taoyuan Dist. Agric. R. Ext. Stn. 2000, 41, 27–50. [Google Scholar]
  36. Sin, Y. Cultivation and Regulation of Flowering in Echinacea purpurea. Master’s Thesis, Department of Horticulture and Landscape Architecture College of Bioresources and Agriculture, National Taiwan University, Taipei, Taiwan, 2017. [Google Scholar]
  37. Zhang, Q.L.; Li, J.Z.; Wang, Z.M.; Dai, S.L. Research progress on the genetic regulatory mechanism of flowering in Chrysanthemum. Plant Sci. J. 2023, 6, 768–780. [Google Scholar]
  38. Sun, X.Z.; Zheng, C.S.; Wang, X.F. Effects of high temperature stress on photosynthesis and chlorophyll fluorescence of cut flower chrysanthemum (Dendranthema grandiflora ‘Jinba’). Chin. J. Appl. Ecol. 2008, 10, 2149–2154. [Google Scholar]
  39. Lyu, J.; Aiwaili, P.; Gu, Z.; Xu, Y.; Zhang, Y.; Wang, Z.; Huang, H.; Zeng, R.; Ma, C.; Gao, J.; et al. Chrysanthemum MAF2 regulates flowering by repressing gibberellin biosynthesis in response to low temperature. Plant J. 2022, 112, 1159–1175. [Google Scholar] [CrossRef]
  40. Yang, S.B.; Xu, S.S.; Jiang, X.D.; Shi, C.L.; Wang, Y.P.; Shen, S.H. Correcting the Response of Maximum Leaf Photosynthetic Rate to Temperatures in Crop Models. Acta Agron. Sin. 2018, 5, 750–761. [Google Scholar] [CrossRef]
  41. Kuo, Y.L.; Lin, T.Y.; Yang, Y.Y.; Chen, H.L.; Yang, C.K.; Yu, S.Y. Photosynthetic characteristics and shade tolerance of 440 native woody species in Taiwan. Taiwan. J. Sci. 2021, 3, 189–220. [Google Scholar]
  42. Woodward, E.I.; Williams, B.G. Climate and Plant Distribution at Global and Local Scales. Vegetatio 1987, 69, 189–197. [Google Scholar] [CrossRef]
  43. Wang, K.C.; Zhang, Y.; Chen, X.; Guo, Q.H.; Huang, Y. Comparison of photosynthetic characteristics between white and yellow cultivated species in Chrysanthemum morifolium Ramat. J. Nanjing Agric. Univ. 2009, 2, 151–155. [Google Scholar]
  44. Zhou, J.; Jiang, X.; Agathokleous, E.; Lu, X.; Yang, Z.; Li, R. High temperature inhibits photosynthesis of chrysanthemum (Chrysanthemum morifolium Ramat.) seedlings more than relative humidity. Front. Plant Sci. 2023, 14, 1272013. [Google Scholar] [CrossRef] [PubMed]
  45. Ding, H.C.; Zhang, H.F. Simultaneous Determination of Two Organic Acids and Two Flavones in Hangzhou White Chrysanthemum by HPLC. China Pharm. 2015, 9, 1578–1580. [Google Scholar]
  46. Liang, Y.N.; Guo, Q.S.; Zhang, Z.Y.; Wang, T.Y.; Wang, T. Effects of Climate Factors on Quality of Chrysanthemum morifolium Originated from Wenxian county. China J. Chin. Mater. Medica. 2007, 23, 2474–2477. [Google Scholar]
  47. Cui, M.; Liang, Z.Y.; Liu, Y.X.; Sun, Q.F.; Wu, D.; Luo, L.P.; Hao, Y.B. Flavonoid Profile of Anoectochilus roxburghii (Wall.) Lindl. Under Short-Term Heat Stress. Plant Physiol. Biochem. 2023, 201, 107896. [Google Scholar] [CrossRef]
  48. Lu, F.; Sun, X.; Dai, X.D.; Zhang, P.Q.; Ma, Y.P.; Xu, Y.F.; Wang, L.; Zhang, J.C. Integrated Multi-Omics Analysis to Investigate the Molecular Mechanisms Underlying the Response of Auricularia heimuer to High-Temperature Stress. J. Fungi 2025, 3, 167. [Google Scholar] [CrossRef]
  49. Du, X.L.; Huang, J.X.; Yang, Z.J.; Xiong, D.C. Effects of warming on oxidative damage and defense characteristics and their correlation in leaf and fine root of plants: A review. Chin. J. Plant Ecol. 2024, 2, 135–146. [Google Scholar] [CrossRef]
  50. Gargallo-Garriga, A.; Sardans, J.; Pérez-Trujillo, M.; Oravec, M.; Urban, O.; Jentsch, A.; Kreyling, J.; Beierkuhnlein, C.; Parella, T.; Peñuelas, J. Warming differentially influences the effects of drought on stoichiometry and metabolomics in shoots and roots. New Phytol. 2015, 3, 591–603. [Google Scholar] [CrossRef]
Figure 1. Floral development and blooming stages. (a) The flower bud development rate was recorded once the buds reached a macroscopically visible stage of development, as indicated by the arrow. The flower bud of Hangju develops to a visible stage, as indicated by the arrow. (b) Flower blooming was classified into five stages: Stage 1 (bud break), Stage 2 (unfolding of 1–3 layers of ray florets), Stage 3 (4–6 layers), Stage 4 (7–9 layers), and Stage 5 (10–12 layers). Flowers were harvested when they reached stages 4 or 52.2 Analysis of Functional Components.
Horticulturae 11 00448 g001
Figure 2. The relationship between mean temperature and total bud-leaves dry weight of potted Chrysanthemum morifolium plant.
Horticulturae 11 00448 g002
Figure 3. Flower development and harvesting. (a) Flower bud development rate (number of pots with flower buds/total number of pots) under different day/night temperature. The 15/13 °C treatment presented the fastest development of floral buds. (b) Number of flowers harvested per batch. In the 25/20 °C treatment, the most concentrated harvest peak was verified.
Horticulturae 11 00448 g003aHorticulturae 11 00448 g003b
Figure 4. The relationship between mean temperature and leaf net photosynthetic rate of potted Chrysanthemum morifolium. Bars indicate the standard error of the mean.
Horticulturae 11 00448 g004
Table 1. Growth performance of Chrysanthemum morifolium ‘Taiwan Hangju No. 1’ under different day/night temperatures.
Survey DateDays After TreatmentDay/Night Temp. (°C)Survival Rate (%)Plant Height (cm)Plant Width (cm)
7/32015/13100.0015.58 ± 5.11 c24.16 ± 3.08 b
20/15100.0018.29 ± 3.16 b24.02 ± 2.01 b
25/20100.0024.90 ± 3.83 a27.32 ± 2.78 a
30/25100.0025.10 ± 3.08 a26.74 ± 2.53 a
35/30100.0018.16 ± 2.68 b23.97 ± 2.30 b
7/234015/13100.0017.20 ± 5.40 c30.94 ± 3.06 b
20/1596.8819.90 ± 3.40 b32.30± 3.22 ab
25/20100.0027.90 ± 3.30 a33.24 ± 2.96 a
30/25100.0027.30 ± 3.30 a30.60 ± 5.20 bc
35/3087.5019.60 ± 2.30 b28.88 ± 2.30 c
8/126015/13100.0019.50 ± 8.00 d39.08 ± 4.38 a
20/1596.8828.10 ± 6.50 c35.88 ± 4.55 b
25/20100.0041.10 ± 6.30 a37.66 ± 3.86 ab
30/2581.2535.70 ± 4.40 b33.52 ± 4.01 c
35/3078.1320.10 ± 4.60 d27.44 ± 3.31 d
9/18015/13100.0023.30 ± 2.40 d37.16 ± 1.07 b
20/1596.8835.40 ± 1.80 c36.84 ± 0.80 b
25/20100.0047.90 ± 1.30 a41.16 ± 1.08 a
30/2581.2540.00 ± 0.80 b37.20 ± 0.94 b
35/3078.1325.60 ± 1.00 d29.16 ± 0.52 c
9/2110015/13100.0026.30 ± 13.30 c39.68 ± 4.18 b
20/1596.8840.40 ± 10.90 b37.30 ± 4.83 b
25/2096.8861.20 ± 7.50 a43.74 ± 6.76 a
30/2581.2542.90 ± 5.30 b38.02 ± 4.60 b
35/3078.1327.00 ± 3.90 c33.48 ± 3.26 c
10/1112015/13100.0030.50 ± 12.70 c37.88 ± 5.55 b
20/1596.8841.20 ± 10.70 b33.96 ± 3.79 c
25/2096.8866.50 ± 5.40 a41.24 ± 5.48 a
30/2575.0043.50 ± 6.90 b36.13 ± 5.54 bc
35/3068.7529.20 ± 3.90 c34.10 ± 3.08 c
10/3114015/13100.0037.20 ± 12.10 cd37.76 ± 4.29 b
20/1596.8841.30 ± 9.60 c34.70 ± 3.99 bc
25/2093.7567.30 ± 5.90 a49.96 ± 6.43 a
30/2575.0047.80 ± 8.10 b40.83 ± 8.36 b
35/3068.7533.00 ± 4.50 d39.30 ± 6.33 b
11/2016015/13100.0039.23 ± 8.10 c39.09 ± 5.90 b
20/1596.8839.44 ± 9.73 c35.53 ± 3.92 c
25/2093.7566.07 ± 6.04 a44.16 ± 6.80 a
30/2575.0048.38 ± 8.61 b44.79 ± 10.46 a
35/3068.7534.25 ± 5.16 d37.50 ± 7.01 bc
12/1018015/13100.0040.14 ± 8.24 c37.16 ± 3.73 b
20/1596.8840.61 ± 9.11 c32.81 ± 3.17 c
25/2093.7565.50 ± 7.10 a38.08 ± 6.01 b
30/2575.0050.13 ± 7.17 b41.14 ± 6.88 a
35/3068.7535.45 ± 5.44 d38.16 ± 5.73 ab
12/3020015/13100.0042.31 ± 6.51 c37.08 ± 8.16 a
20/1596.8840.58 ± 9.68 cd31.40 ± 2.80 b
25/2093.7565.33 ± 7.05 a39.05 ± 5.78 a
30/2575.0049.88 ± 12.99 b39.90 ± 10.56 a
35/3068.7536.84 ± 6.12 d39.66 ± 8.82 a
1/1922015/13100.0042.00 ± 6.34 c36.17 ± 3.50 b
20/1596.8840.37 ± 9.14 c30.11 ± 2.06 c
25/2093.7568.02 ± 5.82 a37.83 ± 5.42 b
30/2575.0049.83 ± 11.96 b44.75 ± 7.72 a
35/3068.7535.40 ± 6.83 d37.95 ± 10.26 b
n = 30, The significance level of the mean difference was 0.05. Different letters (a–d) in the same column are significantly different (p < 0.05, Fisher LSD).
Table 2. Total amount of bud-leaves harvested (pinched) during the vegetative growth period of Taiwan Hangju No. 1 after different day/night temperature.
Day/Night Temp. (°C)Total NumbersFresh Weight (g)Dry Weight (g)Numbers of Bud-Leaves/PotOne Bud-Leaves Dry Weight (g)
15/1374651.7487.042.471.18
20/15175888.81132.675.830.76
25/203851044.50150.2112.830.39
30/25432730.91124.6214.400.29
35/30246426.0480.618.200.33
Table 3. Flower harvest results under various temperature treatments during the 2019–2020 trial.
Day/Night Temp. (°C)First Harvest DateNumbers of HarvestTotal Numbers of FlowersTotal Fresh Weight (g)Total Dry Weight (g)
15/1323 September 201920988963.25127.18
20/157 October 201919479524.7353.25
25/2029 October 20191420492047.66281.83
30/2514 January 2020214881.7014.22
35/30
Table 4. Photosynthesis performance of Taiwan Hangju No. 1 under different day/night temperatures.
Day/Night
Temp. (°C)
A
(µmol m−2 s−1)
R
(µmol m−2 s−1)
gsw
(mol m−2 s−1)
E
(mmol m−2 s−1)
A/E
15/1312.19 ± 0.91 d−0.57 ± 0.14 a0.34 ± 0.07 b1.21 ± 0.32 d10.93 ± 3.95 a
20/1515.78 ± 1.02 b−1.30 ± 0.07 b0.54 ± 0.14 b2.31 ± 0.24 cd7.21 ± 0.97 b
25/2017.79 ± 1.17 a−1.39 ± 0.27 b0.52 ± 0.11 b2.45 ± 0.45 bc7.41 ± 1.00 b
30/2517.72 ± 0.79 a−1.50 ± 0.21 b0.47 ± 0.18 b3.39 ± 1.47 ab6.38 ± 2.22 b
35/3014.37 ± 0.80 c−2.21 ± 0.39 c1.43 ± 0.77 a4.05 ± 0.91 a3.85 ± 0.86 c
A, net photosynthetic rate; R, respiration rate; gsw, stomatal conductance; E, transpiration rate; A/E, Water use efficiency; n = 5. The significance level of the mean difference was 0.05. Different letters (a–d) in the same column are significantly different (p < 0.05, Fisher LSD).
Table 5. Differences in the concentrations of functional components in the bud-leaves of Taiwan Hangju No. 1 under different day/night temperatures.
Day/Night Temp. (°C)15/1320/1525/2030/2535/30
Polyphenols (mg/g)10.98 ± 1.79 c12.55 ± 2.26 bc15.33 ± 1.98 abc16.86 ± 3.53 ab19.33 ± 6.64 a
Free amino acids (mg/g)69.49 ± 6.62 a55.99 ± 9.98 b41.92 ± 3.21 c30.14 ± 3.43 d25.21 ± 1.56 e
Flavonoids (mg/g)12.31 ± 1.41 b13.07 ± 1.07 b14.34 ± 2.74 ab16.34 ± 3.75 ab18.34 ± 6.26 a
Luteolin (μg/g)62.00 ± 0.10 e66.50 ± 0.60 d70.60 ± 0.30 c83.10 ± 2.50 b88.00 ± 0.90 a
Lutein (μg/g)797.60 ± 19.10 c880.50 ± 13.80 a840.90 ± 15.60 b857.90 ± 13.60 ab865.50 ± 7.00 ab
3-CQA (mg/g)2.12 ± 3.01 c7.76 ± 10.42 c17.73 ± 1.58 b24.23 ± 6.53 ab29.04 ± 12.03 a
4-CQA (mg/g)0.00 ± 0.00 c0.00 ± 0.00 c0.98 ± 0.21 b2.19 ± 1.01 a2.79 ± 1.52 a
5-CQA (mg/g)0.31 ± 0.38 c0.37 ± 0.45 c0.86 ± 0.19 bc1.26 ± 0.49 ab1.74 ± 1.05 a
3,4-CQA (mg/g)0.33 ± 0.37 d0.87 ± 0.24 cd1.49 ± 0.62 bc2.08 ± 0.55 ab2.50 ± 0.78 a
3,5-CQA (mg/g)0.00 ± 0.00 b2.07 ± 2.77 b16.07 ± 7.48 a21.33 ± 6.49 a22.85 ± 9.43 a
4,5-CQA (mg/g)0.10 ± 0.18 b0.53 ± 0.7 b1.73 ± 0.41 ab1.82 ± 1.0 ab2.90 ± 1.35 a
total CQA (mg/g)2.86 ± 3.51 c11.60 ± 14.4 c38.85 ± 8.99 b52.92 ± 15.8 ab61.83 ± 25.86 a
n = 3, The significance level of the mean difference was 0.05. Different letters (a–e) in the same row are significantly different (p < 0.05, Fisher LSD).
Table 6. Total content of functional components in harvested bud-leaves of Taiwan Hangju No. 1 under different day/night temperatures.
Day/Night Temp. (°C) 15/1320/1525/2030/2535/30
Polyphenols(mg)519.37 ± 34.91 c686.41 ± 165.64 bc693.57 ± 54.08 bc1481.67 ± 420.80 a906.61 ± 76.13 b
Free amino acids3357.36 ± 639.67 a3005.69 ± 348.21 ab1900.43 ± 47.60 c2631.27 ± 500.97 b1371.62 ± 643.19 c
Flavonoids584.75 ± 15.89 c711.06 ± 100.98 bc646.89 ± 91.82 bc1436.91 ± 434.98 a861.89 ± 83.68 b
Luteolin3.13 ± 0.33 b3.36 ± 0.21 b3.11 ± 0.60 b6.39 ± 1.07 a5.46 ± 2.41 a
Lutein36.77 ± 5.36 b46.41 ± 0.82 b42.51 ± 5.56 b79.30 ± 2.14 a41.74 ± 19.25 b
3-CQA93.88 ± 130.80 d444.86 ± 597.70 cd807.27 ± 92.12 c2134.03 ± 714.77 a1327.64 ± 150.16 b
4-CQA0.00 ± 0.00 c0.00 ± 0.00 c44.39 ± 9.36 c195.40 ± 101.68 a121.61 ± 33.45 b
5-CQA14.97 ± 19.48 c21.18 ± 25.54 c38.96 ± 7.59 c111.53 ± 50.24 a73.57 ± 18.18 b
3,4-CQA14.34 ± 16.32 d47.64 ± 15.28 cd68.80 ± 31.73 c182.61 ± 57.51 a121.26 ± 36.67 b
3,5-CQA0.00 ± 0.00 c117.49 ± 159.78 c744.56 ± 375.90 b1877.33 ± 669.84 a1060.47 ± 304.18 b
4,5-CQA4.49 ± 7.67 d30.25 ± 39.32 cd78.64 ± 20.15 bc162.76 ± 97.42 a129.96 ± 15.39 ab
total CQAs127.69 ± 151.62 c661.41 ± 826.07 c1782.62 ± 490.61 b4663.66 ± 1670.75 a2834.51 ± 526.69 b
n = 3, The significance level of the mean difference was 0.05. Different letters (a–d) in the same row are significantly different (p < 0.05, Fisher LSD).
Table 7. Differences in component concentrations of Taiwan Hangju No. 1 flowers in different day/night temperatures.
Day/Night Temp. (°C)15/1320/1525/2030/25
Polyphenols (mg/g)10.76 ± 0.03 d11.86 ± 0.04 c16.48 ± 0.01 b19.98 ± 0.04 a
Free amino acids (mg/g)45.59 ± 0.99 b64.81 ± 1.68 a35.12 ± 0.18 c19.33 ± 0.12 d
Flavonoids (mg/g)14.08 ± 0.10 c13.09 ± 0.07 d18.13 ± 0.07 a16.25 ± 0.08 b
Luteolin (μg/g)50.59 ± 4.12 d61.92 ± 0.83 c70.15 ± 0.70 b80.18 ± 1.04 a
Lutein (μg/g)64.83 ± 3.21 b77.43 ± 0.84 a37.71 ± 0.59 c63.96 ± 0.77 b
3-CQA (mg/g)1.01 ± 0.23 d1.83 ± 0.22 c2.79 ± 0.16 b4.35 ± 0.61 a
4-CQA (mg/g)0.01 ± 0.02 c0.02 ± 0.03 c0.08 ± 0.03 b0.15 ± 0.02 a
5-CQA (mg/g)0.10 ± 0.00 d0.13 ± 0.01 c0.17 ± 0.01 b0.20 ± 0.01 a
3,4-CQA (mg/g)0.00 ± 0.00 b0.13 ± 0.05 b0.36 ± 0.08 a0.29 ± 0.14 a
3,5-CQA (mg/g)0.44 ± 0.06 c2.31 ± 0.33 b4.67 ± 0.52 a3.73 ± 1.12 a
4,5-CQA (mg/g)0.00 ± 0.00 a0.00 ± 0.00 a0.00 ± 0.00 a0.00 ± 0.00 a
total CQA (mg/g)1.57 ± 0.31 c4.40 ± 0.63 b8.07 ± 0.79 a8.73 ± 1.90 a
n = 3, The significance level of the mean difference was 0.05. Different letters (a–d) in the same row are significantly different (p < 0.05, Fisher LSD).
Table 8. Total content of functional components in Taiwan Hangju No. 1 flowers harvested on different days/night temperatures.
Day/Night Temp. (°C) 15/1320/1525/2030/25
Polyphenols(mg)1368.92 ± 3.80 b631.58 ± 2.16 c4644.39 ± 2.95 a284.09 ± 0.62 d
Free amino acids5797.77 ± 125.30 b3450.90 ± 89.28 c9896.37 ± 51.66 a274.85 ± 1.65 d
Flavonoids1790.17 ± 12.99 b696.98 ± 3.90 c5109.84 ± 18.85 a231.04 ± 1.09 d
Luteolin6.43 ± 0.52 b3.30 ± 0.04 c19.77 ± 0.20 a1.14 ± 0.01 d
Lutein8.24 ± 0.41 b4.12 ± 0.04 c10.63 ± 0.17 a0.91 ± 0.01 d
3-CQA128.65 ± 29.02 b97.20 ± 11.83 bc785.75 ± 44.73 a61.81 ± 8.68 c
4-CQA1.50 ± 2.60 b0.89 ± 1.54 b21.30 ± 9.74 a2.20 ± 0.33 b
5-CQA12.96 ± 0.27 b6.66 ± 0.49 c48.67 ± 2.73 a2.90 ± 0.18 d
3,4-CQA0.00 ± 0.00 b6.87 ± 2.57 b101.02 ± 22.99 a4.15 ± 1.99 b
3,5-CQA56.05 ± 8.26 b122.80 ± 17.57 b1316.98 ± 145.53 a53.10 ± 15.86 b
4,5-CQA0.00 ± 0.00 a0.00 ± 0.00 a0.00 ± 0.00 a0.00 ± 0.00 a
total CQA199.16 ± 39.08 c234.42 ± 33.49 b2273.71 ± 222.83 a124.16 ± 26.98 d
n = 3, The significance level of the mean difference was 0.05. Different letters (a–d) in the same row are significantly different (p < 0.05, Fisher LSD).
Disclaimer/Publisher’s Note: The statements, opinions and data contained in all publications are solely those of the individual author(s) and contributor(s) and not of MDPI and/or the editor(s). MDPI and/or the editor(s) disclaim responsibility for any injury to people or property resulting from any ideas, methods, instructions or products referred to in the content.

