Article

Impact of Different Shading Conditions on Processing Tomato Yield and Quality Under Organic Agrivoltaic Systems

1
Institute of BioEconomy-National Research Council (IBE-CNR), Via Giovanni Caproni 8, 50145 Florence, Italy
2
Chemical and Biological Department, University of Salerno, Via Giovanni Paolo II n. 132, 84084 Fisciano, Italy
3
REM Tec Srl, Via Cremona 62, 46041 Asola, Italy
4
Pharmacy Department, University of Salerno, Via Giovanni Paolo II n. 132, 84084 Fisciano, Italy
*
Author to whom correspondence should be addressed.
Horticulturae 2025, 11(3), 319; https://doi.org/10.3390/horticulturae11030319
Submission received: 7 February 2025 / Revised: 4 March 2025 / Accepted: 12 March 2025 / Published: 13 March 2025
(This article belongs to the Special Issue Productivity and Quality of Vegetable Crops under Climate Change)

Abstract

:
Agrivoltaics have emerged as a promising solution to mitigate climate change effects as well as competition for land use between food and energy production. While previous studies have demonstrated the potential of agrivoltaic systems to enhance land productivity, limited research has focused on their impact on specific crops, particularly in organic processing tomatoes. In the present study, a two-year experiment was conducted in northwest Italy to assess the suitability of the agrivoltaic system on processing tomato yield and quality in the organic farming system. In the first growing season, the transplanting of tomato was carried out under the following light conditions: internal control (A1)—inside the tracker rows obtained by removing PV panels; extended agrivoltaic panels—shaded condition with an increased ground coverage ratio (GCR) of 41% (A2); and external control (FL)—full-light conditions outside the tracker rows. The second year of experimentation involved the transplanting of tomato under the following light conditions: internal control (B1); dynamic shading conditions that consist of solar panels in a vertical position until full fruit set (B2); standard agrivoltaic trackers (GCR = 13%, shaded conditions) (B3); and external control (FL). In 2023, the results showed that A2 achieved a total yield of only 24.5% lower than FL, with a marketable yield reduction of just 6.5%, indicating its potential to maintain productivity under shaded conditions. In 2024, B2 management increased marketable yield by 80.6% compared to FL, although it also led to a 46.2% increase in fruit affected by blossom end rot. Moreover, B2 improved nitrogen agronomic efficiency and fruit water productivity by 6.4% while also reducing the incidence of rotten fruit. Our findings highlight that moderate coverage (A2 and B2) can sustain high marketable yields and improve nitrogen use efficiency in different growing seasons.

1. Introduction

An agrivoltaic system (AS) represents a key technology for reaching sustainable development goals by reducing the competition between lands used for food and electricity. AS presents several advantages over traditional ground-based photovoltaic systems (PSs), and by adopting a holistic approach, those advantages can cover three different macro-areas: energy, food, and water [1].
Competition for cropland allocation is not a new issue [2,3]. Indeed, the percentage of arable lands dedicated to bioenergy production or other industrial use has significantly increased in the last 20 years [4], especially in the most fertile lands [5]. The essence of this conflict lies in the alternative use of land, whether it is used to produce food or energy. Module management optimisation and installing photovoltaic (PV) panels above certain crops offer several advantages, including reduced leaf water loss, improved water-use efficiency, and better temperature control. The shade from the panels also helps in preserving soil moisture content, thus creating ideal conditions for plant growth [6,7]. However, the extent of these benefits and crop adaptability may vary greatly between heliophytic species, such as tomato, and sciophytic species, such as potato, which is a well-studied species in AS conditions [8].
In agrivoltaic systems, the modulation of light through partial shading can influence photosynthetic activity, mitigate excessive solar radiation, and improve water-use efficiency. This balance is particularly relevant for processing tomato cultivation, where optimising light conditions can reduce physiological stress and enhance yield and quality. Agrivoltaic systems have been investigated for their potential to optimise land use by integrating renewable energy production with agricultural activities. Several studies have reported the benefits of agrivoltaics on various crops, including increased water-use efficiency and temperature regulation in lettuce and spinach [9] and enhanced yield stability in wheat and clover, especially under hot and dry weather conditions [10]. Related to fresh market tomato production and water productivity in agrivoltaic systems, AL-agele et al. [11] observed that total crop yield was highest in the control fully irrigated areas and decreased as shading increased in the row of fully irrigated areas. A recent study [12] showed a lower number of tomato fruit produced grown under the photovoltaic panels, with an increased fruit size and water content under a normal water supply. In the same article [12], the Brix degrees of the tomato fruits grown under the panel were comparable to the fruits commercially available on the market grown in open-field sunlight.
In this context, the production of crops within AS is made under the shade of a PV array, and thus, light can be modulated, reducing the stress due to light intensity. The yield of crops in AS is difficult to predict. Indeed, a systematic assessment of how yields of different crops respond to varying levels of shading is still lacking [13]. According to a recent meta-analysis [14], a nonlinear relationship between yield and reduction in solar radiation (RSR) was found for all investigated crops, and most of these crops tolerate a reduction in the RSR up to 15%. The dual use of land offers multiple solutions for the AS and overall for the renewable energy sector in which this can be implemented with a reduced impact on agricultural production. However, one more question should be addressed: what shade for what crops? Let us fill the knowledge gap for better combinations of shading and crops.
Processing tomato is one of the world’s most important vegetables in terms of cultivation area, yield, and consumption [15]. The global production of processing tomato is concentrated in a small number of regions where climate change could have a notable impact on the future supply, and the projected environmental changes indicate that the main growing areas for processing tomato might change in the coming decades [16]. Processing tomato is grown in many countries due to its adaptability to a wide range of weather and soil conditions. However, the main production areas are in temperate zones; three countries, the United States, Italy (Puglia and Emilia-Romagna regions), and China, account for 65% of global production [16].
Many aspects of crop quality in AS will also need to be examined. With regard to fresh market tomato, a study showed that plant secondary metabolites such as carotenoids, ascorbic acid, and phenols increased with light intensity [17]. However, there has been no agreement in the literature on the real impact of shading on the quality of the fresh market tomato. For instance, El-Gizawy et al. [18] showed that, as light intensity increased, the proportion of titratable acid increased, but ascorbic acid and total soluble solids decreased. On the other hand, Nangare et al. [19] did not encounter any significant changes in the concentrations of the acids mentioned above. These results could be explained by the heterogeneity in climatic conditions and experimental settings. However, these results are only reported for fresh market tomato, and no information is available in the literature for processing tomato.
Among the crops cultivated in AS, processing tomato is of particular interest due to its economic relevance and sensitivity to light conditions.
In this regard, the present study hypothesises that moderate shading conditions in an agrivoltaic system can sustain high marketable yields while improving resource-use efficiency, such as nitrogen uptake and water productivity, without compromising key quality traits. Conversely, excessive shading may lead to yield reductions and alterations in fruit characteristics, such as colour, pH, and °Brix, which are essential for processing tomato quality.
Despite the increasing interest in agrivoltaics, research on the combined effects of shading on both yield and quality parameters in organic processing tomato remains limited. In particular, existing studies provide fragmented results on tomato productivity under AS conditions, and no specific information is available for organic cultivation.
In this framework, the present study aimed to evaluate the effects of different RSRs on the growth traits, yield, and quality parameters of organic processing tomato cultivated in an agrivoltaic system.

2. Materials and Methods
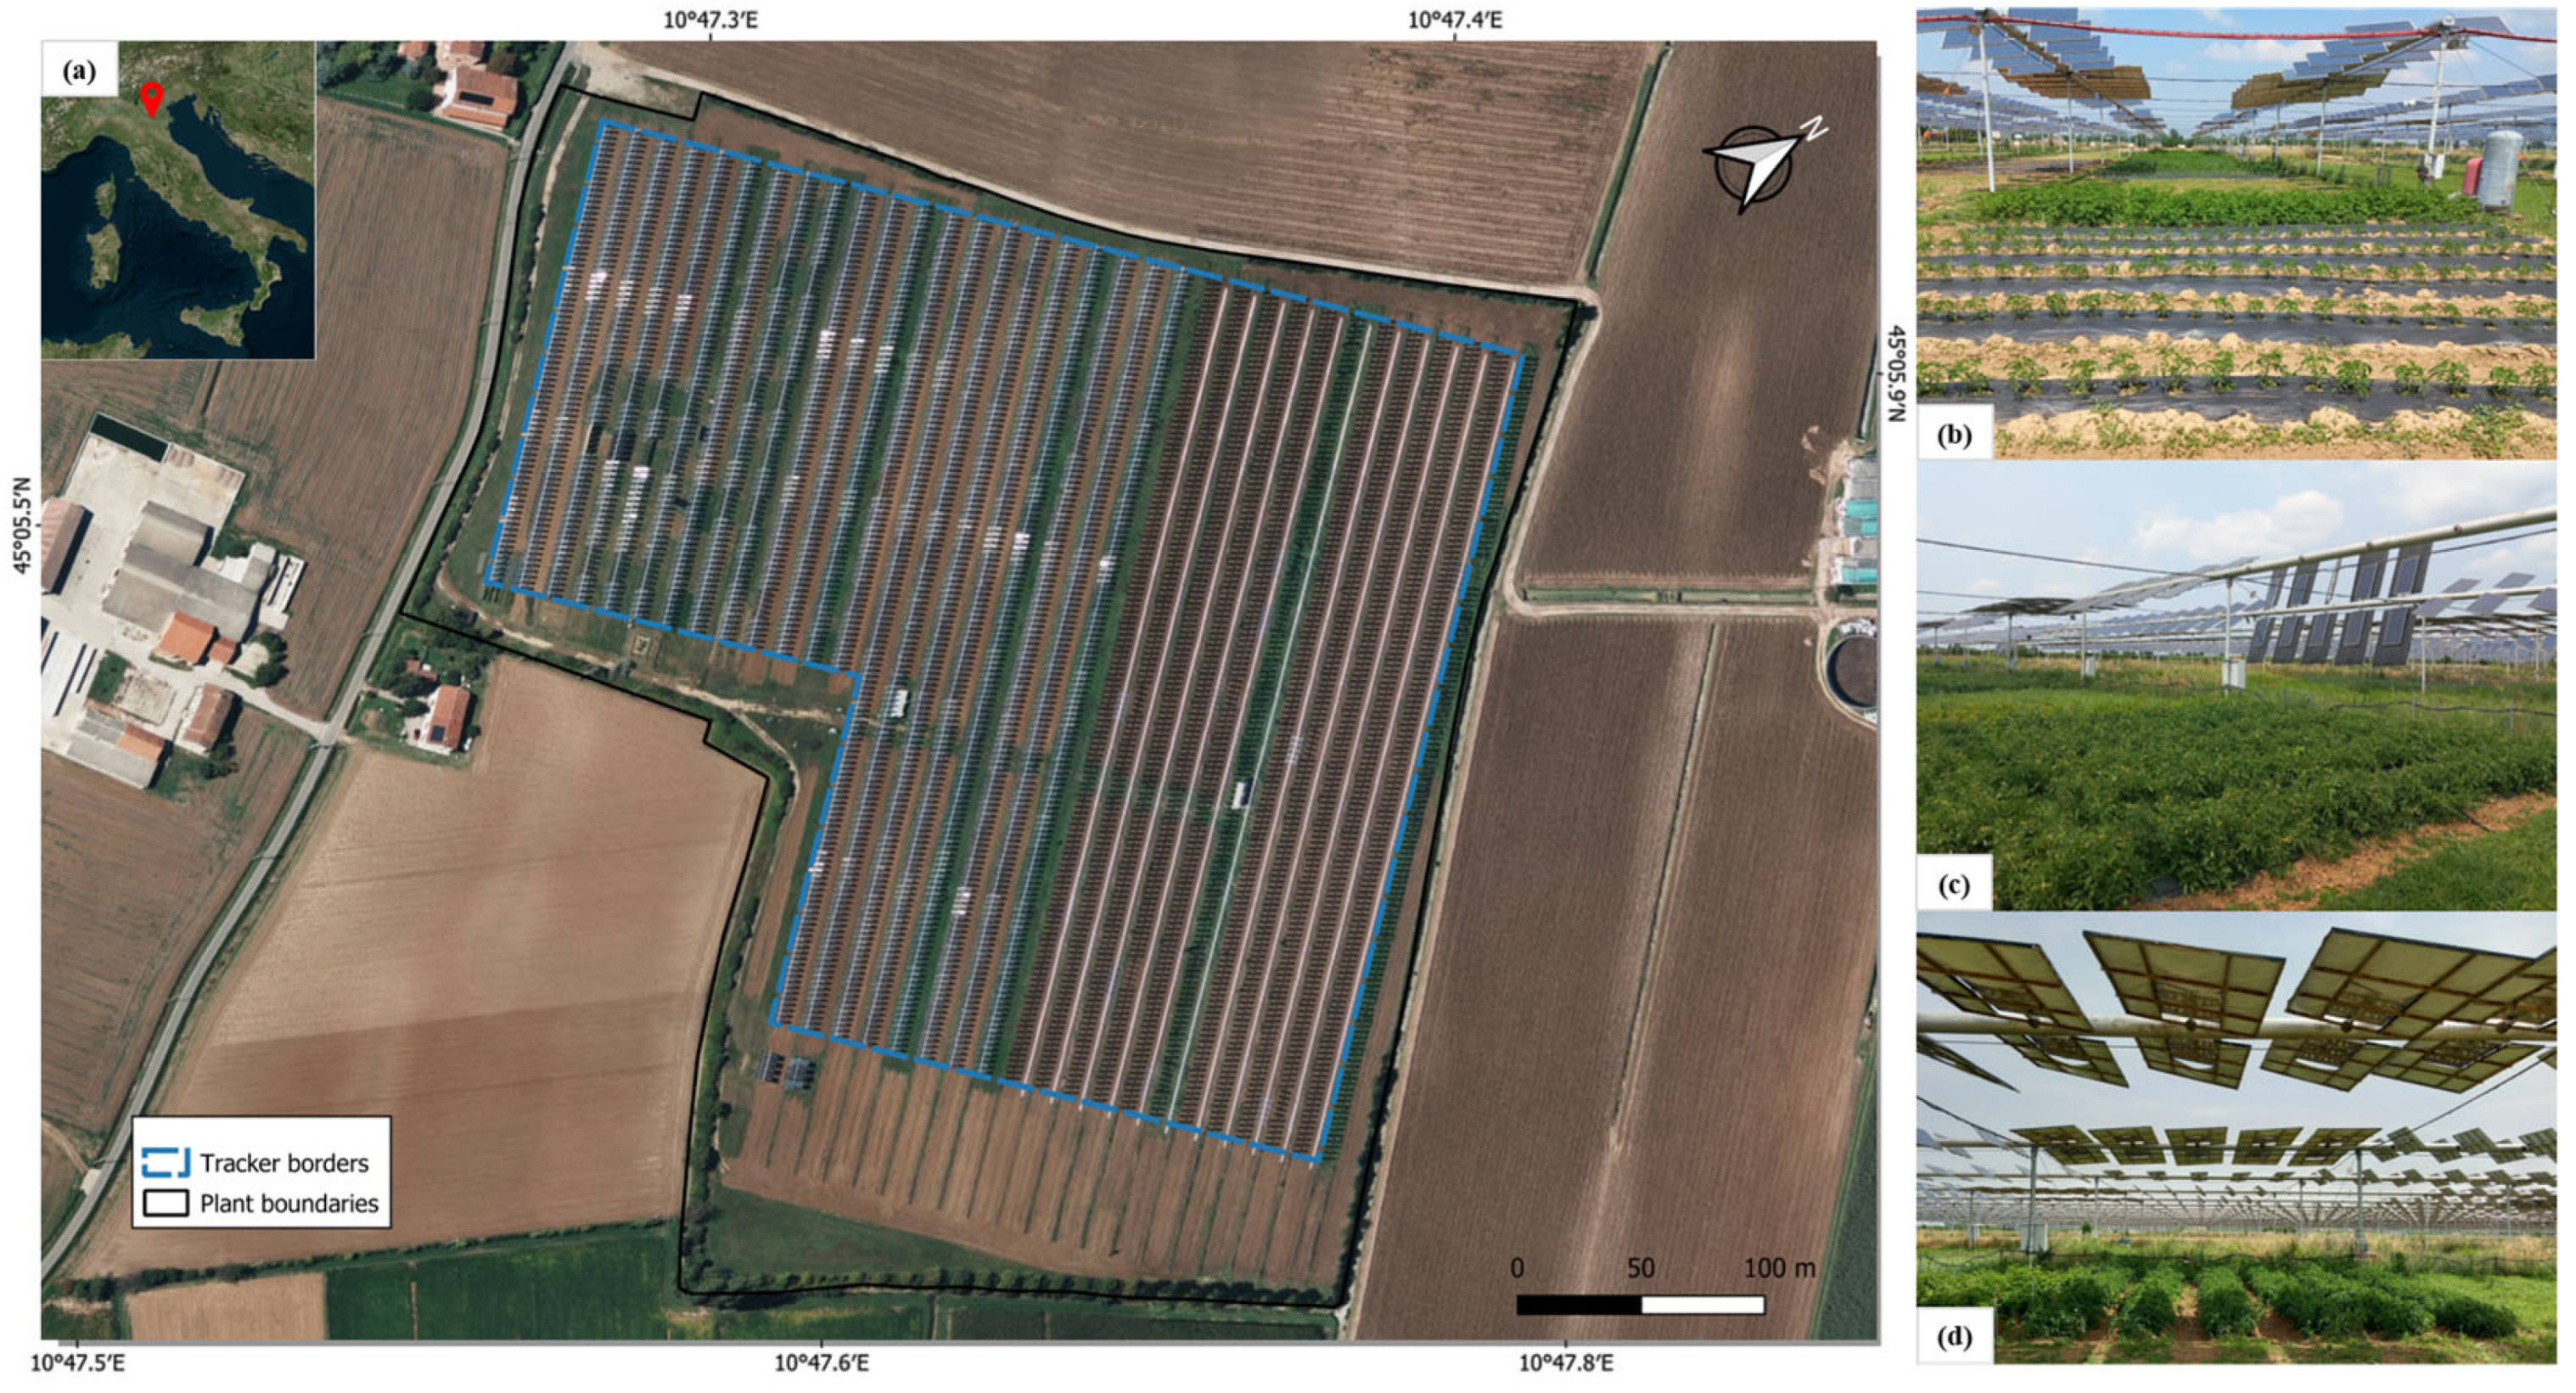
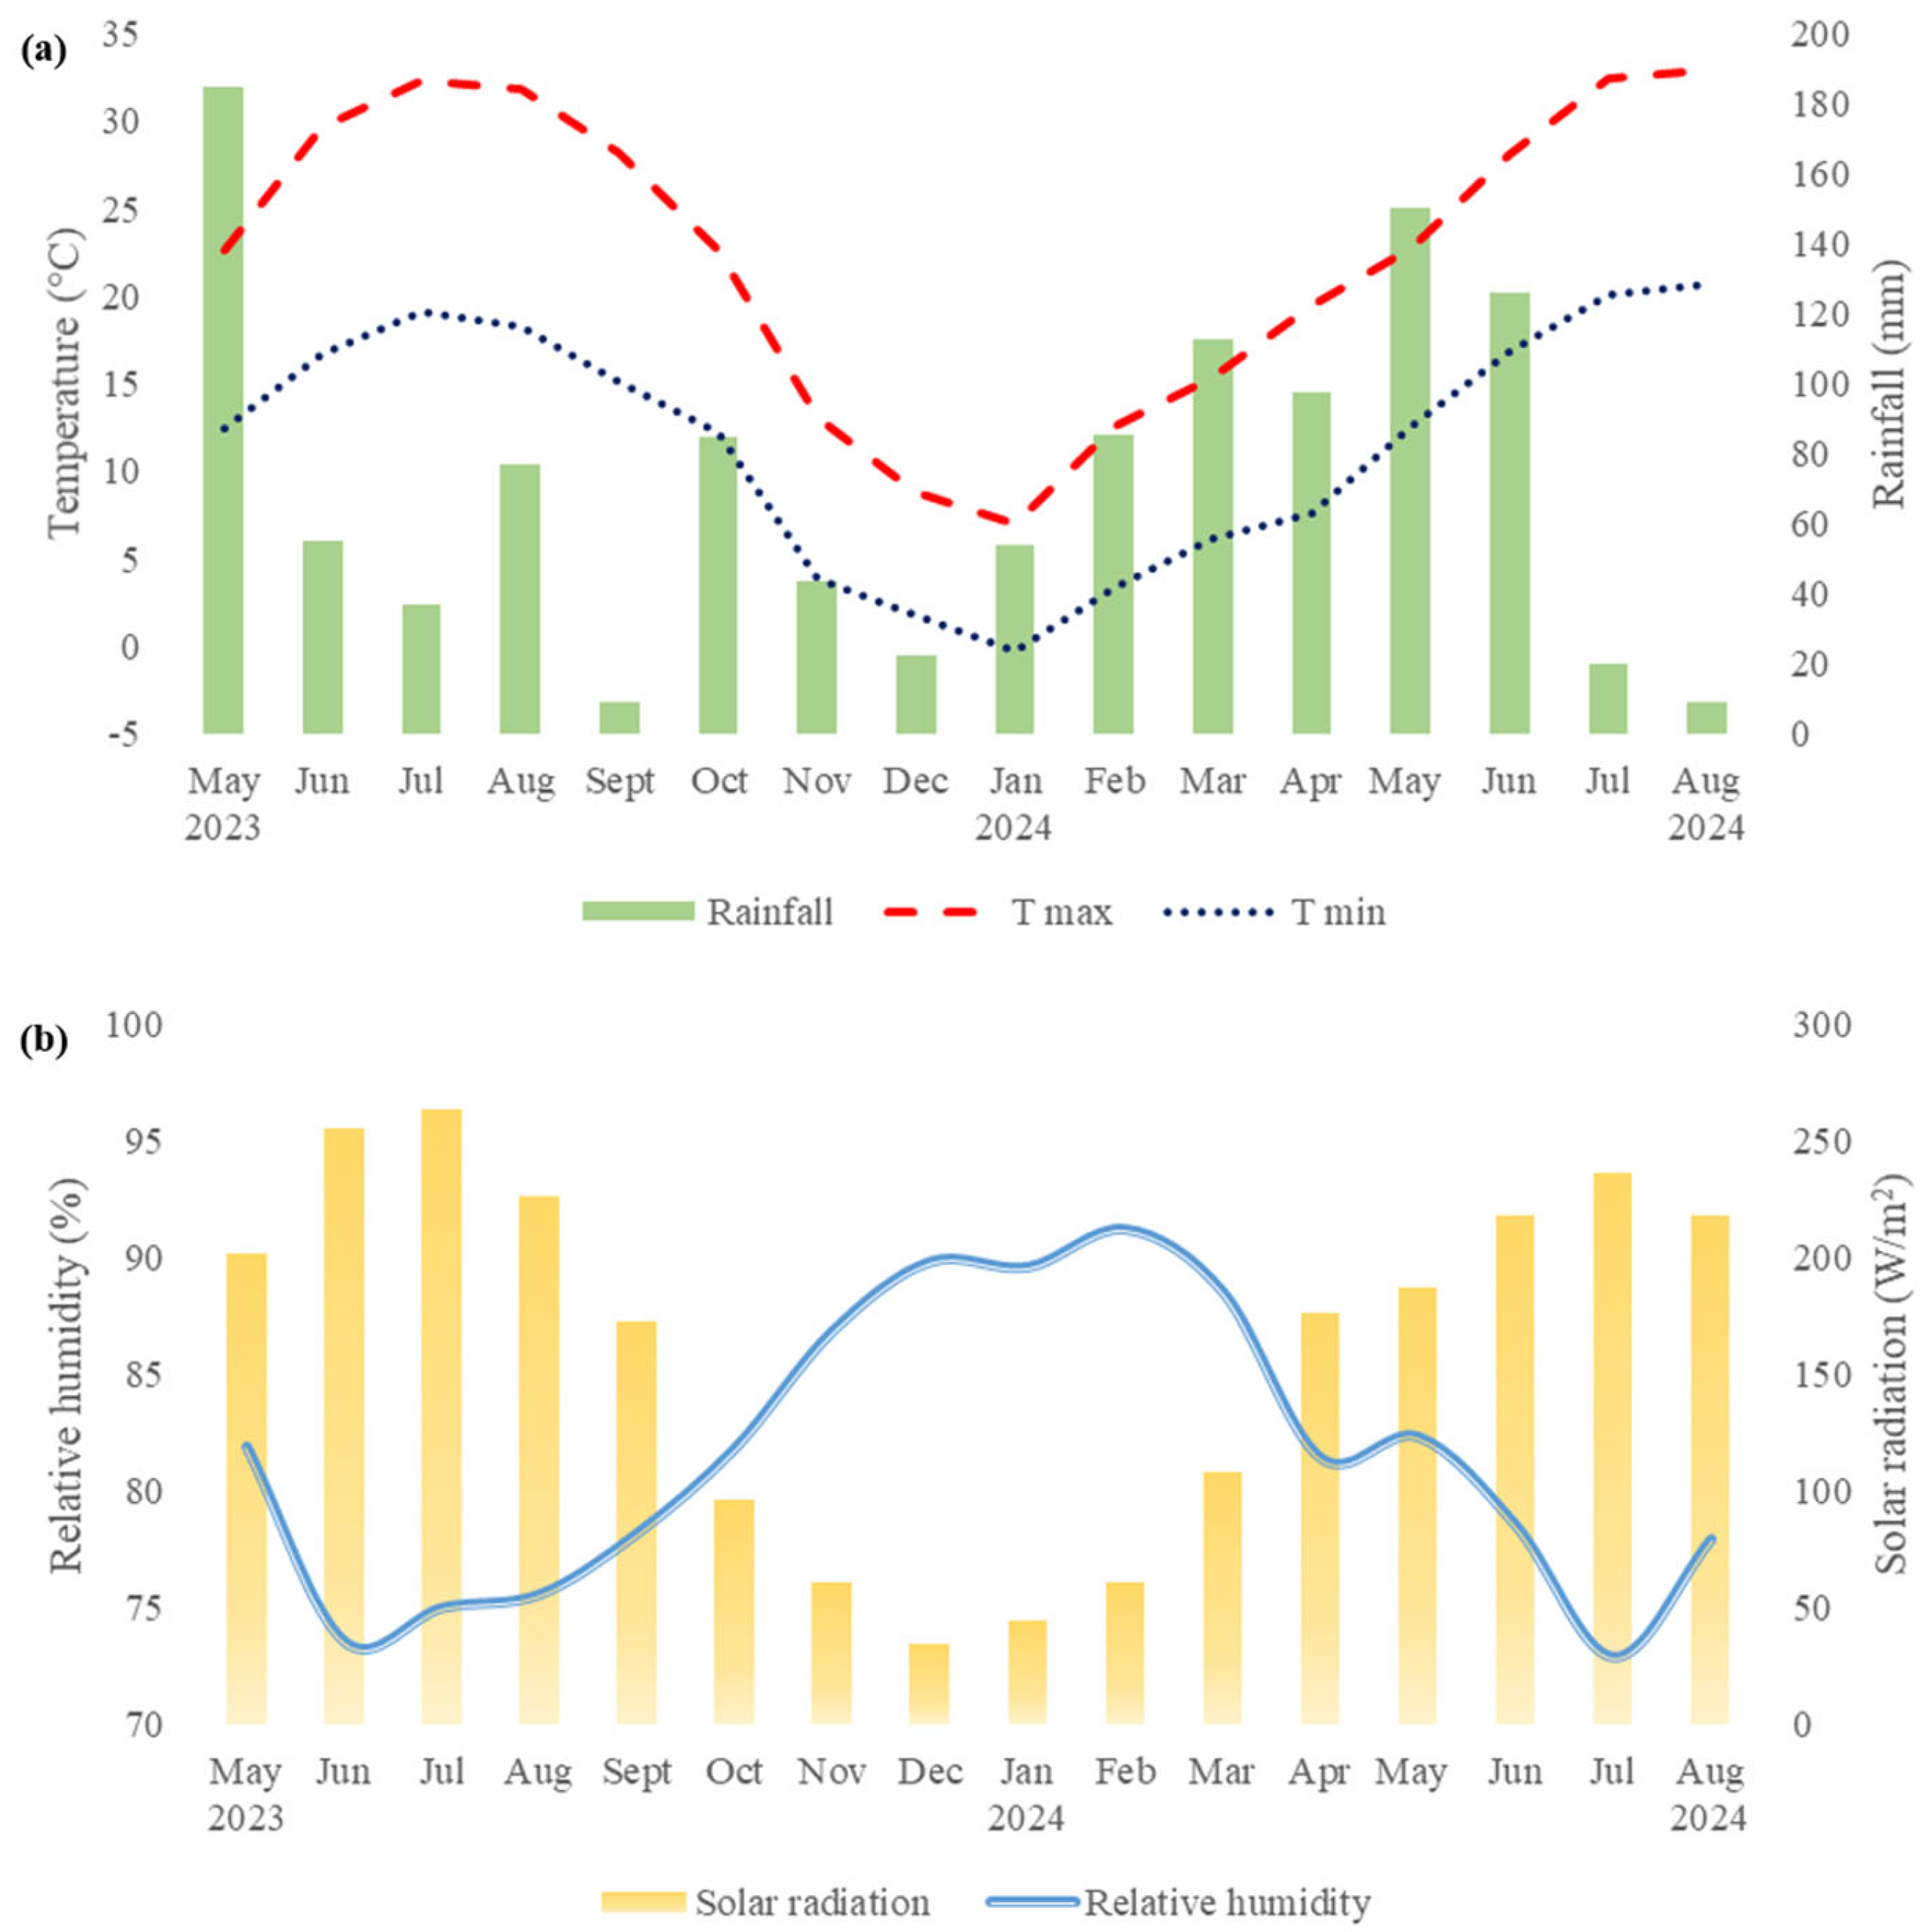
2.1. Study Area

The AS was installed in April 2011 in the north of Italy (Borgo Virgilio, Mantova 45°05′40″ N–10°47′30″ E) and had a total size of 11.42 ha, with a capacity of 2150 kWp (Figure 1).
According to the Köppen climate classification, this region falls under the Cfa category, which corresponds to a humid subtropical climate [20]. A total of 768 trackers (7680 solar panels) are installed with bi-axial technology (Poly 280 WP, Bisol Group, d.o.o. Latkova, Prebold, Slovenia). The total PV module area is 1.30 ha, so the ground coverage ratio (GCR)—defined as the area of solar panels/area of the land used for the AS—is 13%; the area of the land used for the AV system is the area below and between the solar panels. It also includes a border area around the system, whose width equals half the distance between the rows of panels [8]. The research was performed from May 2023 to August 2024 in two consecutive growing seasons. The weather conditions were typical of the continental climate. Temperature and rainfall data were collected from a weather station placed within the agrivoltaic plant (MeteoSense 4.0, Netsens s.r.l., Calenzano, Florence, Italy), recording a mean temperature of 15.9 and 16.1 °C and a total rainfall of 353.9 and 305.9 mm, for the first and second growing season, respectively (Figure 2). The field trials were carried out on silty sand soil with a pH measured in water of 8.5. The sand, silt, and clay contents were 500, 400, and 100 g kg−1, respectively, at 0–60 cm depth. The organic C was 1.1%, and the total N was 0.18%. Assimilable P and exchangeable K were 76.4 and 810 mg kg−1, respectively. The characteristics of the soil were all determined according to the methods described by MIPAF [21]. Considering different tomato experimental blocks within the AS for the two study years, in 2023, the previous crop was alfalfa, while in 2024, it was durum wheat.

2.2. Growth Condition and Experimental Design

Tomato (Heinz 1648) was transplanted on 9 May 2023 and 17 May 2024. A randomised complete block design was adopted with three replicates in both cropping cycles with a plant density of 2.22 plants m−2. Seedlings were transplanted at the fourth true leaf stage in a single mulched row using Mater-Bi® (Novamont S.p.A., Novara, Italy) (BMF-N) black-coloured film, 1 m large, 15 μm thick, and with a spacing distance of 0.3 m between plants and 1.50 m between rows. Each plot contained 27 plants per row distributed in 4 rows. All replicates were managed following the standard agronomic practices while weeds and pests were controlled according to the organic farming protocol (EU regulation and guidelines of the Lombardia region, Italy).
Irrigation was performed through a drip irrigation system using the ‘Irriframe’ decision support system (DSS), which is based on meteorological and soil moisture data. Three TEROS 10 soil water content sensors (METER, Pullman, WA, USA) were installed at 20 cm depth for each treatment at transplant. Recorded data were continuously supplied to the DSS to correct the actual soil moisture level in each irrigation treatment.
N–P–K supply was based on soil analysis, crop rotation, and crop nutrient requirements. Organic nitrogen fertilisers were applied after the calculation of N balance to reach the same quantity of total nitrogen (150 N kg ha−1) in both growing seasons, following the methodology described by Ronga et al. [22]
In the first growing season (2023), the transplanting of processing tomato was carried out under the following light conditions: internal control (A1)—full-light conditions inside the tracker rows obtained by removing PV panels; extended agrivoltaic panels—shaded condition with an increased GCR of 41% (A2); and external control (FL)—full-light conditions outside the tracker rows. The second year of experimentation (2024) involved the transplanting of processing tomato under the following light conditions: internal control (B1); dynamic shading conditions, i.e., solar panels in a vertical position until full fruit set (B2); standard agrivoltaic trackers (GCR = 13%, shaded conditions) (B3); and external control (FL).
A single harvest was carried out in each experimental block at the end of the growing seasons, i.e., between the end of August 2023 and 2024, when ripe fruits accounted for approximately 85% of the total harvestable fruit.

2.3. Ecophysiological Parameters and Tomato Yield and Quality

To evaluate the effects of different shading conditions, several parameters were measured and analysed. The data collection focused on four main categories: soil parameters, plant physiological traits, biomass production, and fruit quality characteristics.

2.3.1. Soil Parameters

Soil characteristics were monitored throughout the experimental period. The following parameters were recorded at six different points within each plot: volumetric water content (VWC, %), measured using a portable Fieldscout TDR 300 probe (Spectrum Technologies INC., Aurora, IL, USA) with 12 cm long electrodes; soil electrical conductivity (EC, dS m−1), determined with the same probe and soil temperature (°C) and measured at a 12 cm depth using the TDR 300 probe.

2.3.2. Plant Physiological Parameters

To assess the physiological response of plants to different shading conditions, the following parameters were measured: photosynthetic active radiation (PAR, µmol m−2 s−1), recorded using a RK200-02 Quantum PAR Sensor (RIKA Sensor, Yuhua District, Changsha, China) at monthly intervals; canopy temperature (°C), measured with a FLIR EXSERIES thermal imaging camera by pointing it at the leaves at a 1 cm distance; chlorophyll index, determined with a SPAD 502 Plus (Konica Minolta, Cinisello Balsamo, Milano, Italy) device; and the leaf area index (LAI), measured with an LI-3000A leaf area meter to assess leaf development under different shading treatments.

2.3.3. Biomass Production

Biomass accumulation was evaluated at three different time points during each growing season by harvesting six plants per plot. The following traits were measured: above-ground biomass, including fresh and dry weight (dried at 65 °C until constant weight) of leaves, stems, and fruits; below-ground biomass, including fresh and dry root weight and total plant biomass, calculated as the sum of all above- and below-ground biomass components.

2.3.4. Tomato Yield and Fruit Quality Parameters

At harvest, yield-related parameters and fruit quality traits were recorded: total yield (g plant−1) and marketable yield (g plant−1), based on fruit weight; average fruit weight (g fruit−1), determined by dividing total fruit weight by the number of fruits per plant; number of marketable and unmarketable fruits per plant, including the incidence of defects such as blossom end rot (BER), sunburn, and rotten fruits; nitrogen agronomic efficiency (NAE, g g−1) and fruit water productivity (FWP, g m−3), calculated following the methodology described by Ronga et al. [23]; pH, measured using a digital pH meter; total soluble solids (°Brix), recorded with a digital refractometer; and fruit colour, assessed using a CR-210 Chroma Meter (Minolta Corp., Osaka, Japan) equipped with a standard D65 illuminator.

2.4. Statistical Analysis

The different parameters retrieved each year were separately analysed by a one-way ANOVA, which was conducted to determine whether there were statistically significant differences among the treatments for the various measured parameters, followed by Duncan’s multiple range test (p < 0.05), which was then used as a post hoc test to identify which specific treatments differed from each other. R (version 4.2.3, R Foundation for Statistical Computing, Vienna, Austria) with the RStudio IDE (release 2023.06.0 + 421) packages tidyverse [24] and multcompView [25] were used.

3. Results

Figure 3a shows the development of the chlorophyll index (SPAD) during the 2023 growing season. In particular, FL (external control) showed statistically lower SPAD index values compared to the other treatments but highlighted a significant increase until 20 July, reaching the highest peak among the three treatments. A1 treatment (internal control) had the highest values until the end of June but showed a decrease from the beginning of July. Finally, the A2 treatment (41% GCR coverage) showed a more stable trend than the other two treatments, with values initially being intermediate and reaching a peak in mid-July, followed by a slight decrease.
Figure 3b shows the development of the leaf area index (LAI) during the first year of the trial (mean and bars with standard deviation). The values recorded at the beginning of July decreased for all treatments until 20 July, followed by a partial or complete recovery by the beginning of August. In particular, the FL treatment had the highest LAI until the end of July, and a similar value was highlighted by the A2 treatment, while A1 showed the lowest value. No differences were reported for the first and last dates of the survey.
Table 1 shows the soil parameters measured on 20 July 2023. Electrical conductivity and soil temperature were not significantly different between treatments. VWC showed the highest values in the A2 treatment; on the other hand, the A2 treatment showed the lowest value of canopy temperature (on average, about −5%). As shown in Table 1, most of the monitored parameters related to tomato biomass were higher in the FL treatment compared to the other ones; the FL and A2 treatments had the highest values for leaf fresh weight (LFW) and stem fresh weight (SFW).
Regarding the soil parameters monitored on 8 August 2023 (Table 2), VWC and soil temperature did not show any significant differences, while the EC was higher in the FL treatment. A2 treatment showed the lowest value of canopy temperature (−4%) compared to FL. As reported in Table 2, the plant parameters showed that FL treatment gained higher values of fruit fresh weight (FFW) (+99% and +82%) and fruit dry weight (FDW) (+42% and +49%) compared to the A1 and A2 treatments, respectively. The FL and the A2 treatments favoured an increase in SFW by 16% and 21%, respectively, compared to the A1 treatment. The latter, as well as the A2 treatment, highlighted higher values of root fresh weight (RFW) (+10%) and root dry weight (RDW) (+39%) compared to the FL treatment. The highest LFW was measured in the A2 treatment, i.e., +67% and +6% compared to FL and A1, respectively (Table 2).
Table 3 shows the results of the tomato biomass at harvest. The FL treatment had higher values of LFW and leaf dry weight (LDW) compared to the A1 treatment by +137% and +173%, respectively, and the A2 treatment by +63% and +88%, respectively. FL treatment showed the highest value of SFW, SDW, and RFW. Regarding the FFW, the highest value was reported in the FL and A2 treatments compared to A1. Treatments A2 and FL had the highest value of FDW. Concerning yield, the FL and A2 treatments favoured an increase in average fruit weight compared to the A1 treatment by +15% and +16%, respectively. The FL and A2 treatments also showed an increase in marketable yield compared to the A1 treatment by +45% and +35%, respectively. In addition, the FL treatment showed an increase in the total yield of +54% compared to the A1 treatment. Simultaneously, the FL treatment showed the highest value of unmarketable yield (weight of unripe fruits per plant) and, like the A2 treatment, favoured a higher nitrogen agronomic efficiency (NAE) and fruit water productivity (FWP).
As shown in Table 3, the FL and A2 treatments increased the number of rotten fruits compared to the A1 treatment. The latter, together with the FL treatment, favoured a significant increase in the number of blossom end rot (BER) fruits compared to the A2 treatment. The FL treatment had the highest value for sunburnt fruit, brightness index (L), and pH. A1 treatment gained the highest value for the fruit polar diameter. Finally, FL and A1 treatments highlighted the highest values for the red index (a) and °Brix, while the yellow index (b), the pulp thickness, and the equatorial diameter showed no differences between treatments.
Figure 4a shows the trend in the chlorophyll index (SPAD) during the growing season of 2024 (mean and s.d.). All treatments showed statistically significant differences during the period from June to July, with a marked reduction near the harvest. In general, the B1 treatment (internal control) exhibited high SPAD, and the highest value was in June. The FL treatment (external control) highlighted the lowest values of SPAD during the surveys conducted in July. B2 treatment (phenological window) initially showed the lowest value of SPAD, while the following measurements showed an increase, reaching the highest value on 17 July 2024. Finally, the B3 treatment (13% GCR coverage) had the highest value within the second measurement (1 July 2024) and, thereafter, similar values to the B1 and B2 treatments. Figure 4b shows the development of the leaf area index (LAI) during the second year of the trial. For all treatments, no differences were noted during the crop cycle.
Table 4 shows the soil parameters measured on 17 July 2024. The FL treatment showed the highest values of EC, soil, and canopy temperatures, with the latter having similar values to the B1 treatment. As reported in Table 4, FL treatment showed the highest value of LFW, followed by similar values of B1 and B2 treatments. LDW, SFW, SDW, RFW, and RDW were higher in the FL treatment than in the others, while FFW was the highest in the B1 treatment. On the other hand, FDW was the highest in FL and B2 treatments.
Regarding soil and canopy temperatures, monitored on 6 August 2024, FL and B1 treatments had the highest values (Table 5). EC and VWC did not differ between the investigated treatments. Table 5 shows the biomass parameters retrieved on 6 August. LFW, LDW, SFW, SDW, FFW, and FDW were higher in the B2 treatment compared to the others. Concerning the RFW and RDW, the B1 treatment favoured an increase of about 56% and 80%, respectively, compared to the average values of the other treatments under investigation.
Table 6 shows the results of the biomass parameters retrieved at harvest. LFW, LDW, SDW, FFW, RFW, and RDW were higher in the B2 treatment by 37%, 69%, 32%, 115%, and 39%, compared to FL, respectively. FL and B2 treatments showed the highest value of SFW. At harvest, the average fruit weight was the lowest in the FL treatment in the second year. The B2 treatment highlighted the highest value of marketable yield, total yield, and number of marketable fruits per plant, which increased by +81%, +75%, and +55%, respectively, compared to the FL treatment (Table 6). The NAE was also higher in the B2 treatment by 31% and 75% compared to the B3 and FL treatments, respectively. On the other hand, the B2 treatment had the highest FWP value, while the B2 treatment had the highest value of the unripe fruit weight (Table 6). Treatment B3 showed the lowest value of rotten fruits. The lowest value of the fruit equatorial diameter was reported for the FL treatment; on the other hand, FL treatment showed the highest value of fruit polar diameter. B2 treatment had the lowest values for fruit pulp thickness and yellow index. Regarding the parameters determining the fruit colour, the FL treatment showed the lowest value of the brightness index (L); on the other hand, FL showed the highest values of the red index (a). The pH was the highest in the B3 treatment, whereas °Brix did not show statistically significant differences among the treatments under investigation (Table 6).

4. Discussion

The integration of organic processing tomato production and AS is an innovative strategy in which agricultural production and renewable energy generation can coexist. The present study, conducted over two years, demonstrated significant potential in the production of organic processing tomato under AS. Our general results are in accordance with previous studies carried out on other crops and environments that highlight how agrivoltaics can enhance resource efficiency, contributing to a sustainable agricultural model [26], maximising the economic and environmental benefits of the system, and promoting innovative technologies.
In the first year of the trial (2023), A2 treatment showed a stable trend of SPAD values, suggesting that a GCR cover of 41% may have offered protection against environmental stresses while maintaining an optimal level of photosynthetic activity. This result is in line with that of Bellone et al. [27], who compared the performance of different agriphotovoltaic systems in a range of environments, highlighting the impact of shading on the light distribution and growth uniformity of processing tomatoes. A1 treatment showed the highest values of the SPAD index until the beginning of July, followed by a gradual decrease. This behaviour could be attributed to the partial shading, which initially favours photosynthesis but leads to possible long-term chlorophyll saturation and degradation, a phenomenon also observed in soft wheat under prolonged light stress [28]. These results are in line with Ronga et al. [22], who evaluated the biomass production and radiation utilisation efficiency of processing tomatoes grown in organic farming systems by monitoring SPAD. The LAI showed differences only on the 20th of July due to an incidence of late blight, which became more aggressive in the plot under the AS; however, this was followed by a complete recovery. In fact, A1 and A2 treatments reached values similar to FL, suggesting that moderate shading protects the leaf system from environmental abiotic stresses. This behaviour is also reported by Marenco and Reis [29], who demonstrated that plants respond to shading by increasing their leaf area to capture more light for photosynthesis. Regarding the soil parameters, despite the absence of significant differences in EC and soil temperature, A2 treatment (41% GCR coverage) showed a higher VWC, a result relevant to water management. A2 treatment with the 41% GCR coverage may have reduced soil evaporation, improving soil water retention, as shown by Reis et al. [30], which confirmed how shaded environments tend to be more humid and maintain higher soil moisture levels. In July 2023, A2 treatment (41% GCR coverage) showed significantly higher values for fresh and dry leaf weights than A1, suggesting a positive effect of the shading on vegetative development. These results indicate that the shaded plant is more prone to overcome environmental stresses like hot temperatures by promoting biomass accumulation. This is consistent with the results conducted by Dev et al. [31], who reported that plants might achieve higher biomass under specific shading conditions. In fact, they showed that plants grown under 25% and 50% of shade levels produced higher biomass compared to those under 75% and full sunlight.
At harvest, the A2 treatment showed the highest values of FFW and FDW compared to A1 and with similar values to FL. This result suggests that the 41% of coverage can not only improve the soil water content but also optimise photosynthesis, recording a stable value of SPAD, including two parameters involved in biomass production. This was also observed by Weselek et al. [32] on celery root, winter wheat, potato, and clover cultivated under the AS and in line with the results obtained by Ronga et al. [33], who evaluated the influence of organic management on the physiological behaviour of processing tomato cultivars. In the first year, FL and A2 treatments showed the highest values in terms of the number of fruit and marketable yield at harvest. Furthermore, NAE and FWP were significantly higher in the FL treatment, indicating better nutrient and water utilisation. Similar values were shown by the A2 treatment. FL (external control) and A2 (41% GCR coverage) treatments showed the highest number and weight of marketable fruits. However, FL treatment also showed an increase in the number of unripe fruits, as well as BER and sunburnt indicators, probably due to excessive sun exposure. A2 treatment (41% GCR coverage) seems to reduce these negative effects, particularly the fruit affected by BER, improving the overall crop quality. These results align with Maity et al. [34], who reported that AS affects the incidence of biotic and abiotic stresses in plants, particularly emphasising their impact on rotten fruit.
In the second year (2024), all treatments showed a similar SPAD trend apart from the B2 treatment, which had the lowest value in the second survey, while the FL treatment highlighted the lowest value during the measurements carried out in July. B2 treatment suggests that the phenological window may temporarily enhance photosynthesis, a result consistent with studies on phenological crop management strategies and shading conditions in different layouts of AS [35].
In 2024, treatments showed an increase in soil and canopy temperatures that was the highest in FL treatment due to the higher exposure to sunlight. However, the B2 treatment (phenological window) maintained a balance between soil water retention and soil temperature, demonstrating the effectiveness of the phenological window in mitigating the effects of thermal stresses. This is in line with the observations of Chauhan et al. [36], who emphasise the role of moderate shading in conserving soil moisture and reducing water stress.
During 2024, the FL treatment produced the highest values for LFW, LDW, SFW, SDW, RFW, and RDW, suggesting optimal conditions for overall plant biomass growth. However, treatment B2 demonstrated comparable results to FL for LFW, LDW, SFW, and SDW while achieving higher values for FFW and FDW, indicating the positive effectiveness of the tested phenological window. These results are in accordance with the data observed by Ronga et al. [37] in which biofertilizers promoted the soil resource-use efficiency of processing tomatoes grown in an organic cropping system. B3 treatment showed the lowest values in almost all parameters, indicating that permanent coverage may not have ensured adequate plant growth due to limited light availability. This limitation could potentially be mitigated by providing biofertilizers in AS to optimise growth under stress conditions.
In the second year, B2 treatment (phenological window) achieved the highest performance in terms of marketable and total yield, the number of marketable fruits, NAE, and FWP. These results suggest that the phenological window optimises nutrient use and productivity, thus improving crop yield. The B2 treatment (phenological window) also showed the highest values of unripe fruits and the lowest value of fruit pulp thickness. The B3 treatment (GCR coverage at 13%) significantly reduced rotten fruits. Fruit quality was influenced by the different treatments, with the FL (external control) showing the highest values for colour parameters such as the red index (a), lightness index (L), and fruit polar diameter. On the other hand, the B3 treatment (GCR coverage at 13%) showed the highest values of brightness index and fruit pH, and similar performances were reported for the B1 treatment. These results are consistent with the data of Ureña-Sánchez et al. [38], who showed quality variations in tomato fruits grown under partial shade conditions.
Our results demonstrate that the A2 (41% GCR) and B2 (phenological window) treatments achieved marketable yields comparable to full-light conditions while improving fruit quality. These findings are in line with Weselek et al. [9], who reported that agrivoltaic shading strategies can optimise light availability and reduce physiological stress, thereby improving crop resilience. The improved water-use efficiency observed in shaded treatments is consistent with the findings of Pataczek et al. [39], who demonstrated that agrivoltaic systems mitigate drought stress in wheat by reducing evapotranspiration and maintaining higher soil moisture levels. Similarly, Marrou et al. [10] showed that partial shading can improve soil water retention and overall plant water status, which aligns with our observation of increased fruit water productivity (FWP) in B2. Furthermore, our study found that shading conditions reduced the incidence of blossom end rot, particularly in A2 and B2 treatments. These results support the findings of Adeh et al. [6], who highlighted that agrivoltaic systems can create microclimates that mitigate extreme temperature fluctuations, thereby reducing stress-related disorders in fruiting crops. Additionally, the higher nitrogen agronomic efficiency (NAE) observed in the B2 treatment suggests that the phenological window may enhance nutrient uptake efficiency, a result comparable to those reported by Dinesh and Pearce [40] in their analysis of agrivoltaic systems on crop physiology.
These findings underscore the potential of agrivoltaic systems to improve both economic and environmental sustainability in organic processing tomato production.

5. Conclusions

This study demonstrates that agrivoltaic systems can be successfully integrated into organic processing tomato production with varying effects depending on shading conditions. The A2 treatment (41% GCR coverage) resulted in a total yield reduction of 24.5% compared to full-light conditions (FL), but with only a 6.5% decrease in marketable yield, indicating its potential for maintaining productivity under increased shaded conditions. In the second year, the B2 treatment (phenological window) significantly improved marketable yield by 80.6% compared to FL, highlighting its role in enhancing productivity. However, this condition also led to a 46.2% increase in blossom end rot, suggesting a trade-off between higher yields and potential fruit disorders. Additionally, B2 management improved both nitrogen agronomic efficiency (NAE) and fruit water productivity (FWP) by 6.4%. These findings highlight the importance of selecting the appropriate shading configuration to balance yield, fruit quality, and resource efficiency. A fundamental limitation of this study is the variation in the treatments tested over the two experimental years. The modification of the treatment (increased panels vs. phenological window) in the second year was carried out to have more information about the sustainability of an agrivoltaic site in terms of the production of energy and harvested fruits (quality and quantity). The present study provides insights into the potential trade-offs between productivity and fruit quality under different shading conditions, contributing to the optimisation of agrivoltaic management strategies. Further long-term research is needed to assess the effects of agrivoltaic shading on soil health, pest dynamics, and the economic feasibility of these systems. Addressing these aspects will help optimise agrivoltaic management strategies for sustainable agriculture.

Author Contributions

Conceptualisation, A.D.P.; methodology, A.D.P., R.D., M.S. and D.R.; software, A.D.S. and D.R.; validation, A.D.P., R.D., M.S., D.Z., A.D.S. and D.R.; formal analysis, A.D.S. and D.R.; investigation, A.D.P., R.D., M.S., G.M.L., D.Z. and A.G.; resources, D.R.; data curation, A.D.P., A.D.S. and D.R.; writing—original draft preparation, A.D.P., A.D.S. and D.R.; writing—review and editing, A.D.P., R.D., M.S., A.D.S. and D.R.; visualisation, A.D.P., R.D., M.S. and D.R.; supervision, A.D.P. and D.R.; project administration, A.D.P. This research received no external funding. All authors have read and agreed to the published version of the manuscript.

Funding

This research received no external funding.

Data Availability Statement

The raw data supporting the conclusions of this article will be made available by the authors on request.

Acknowledgments

The authors are grateful to the ‘Societa’ Agricola Crovetti Claudio e Mattia S.S.’ farm involved in this study (transplant and soil tillage).

Conflicts of Interest

Authors Davide Zanotti and Antonino Greco were employed by the company REM Tec Srl. The remaining authors declare that the research was conducted in the absence of any commercial or financial relationships that could be construed as a potential conflict of interest.

References

  1. Campana, P.E.; Stridh, B.; Amaducci, S.; Colauzzi, M. Optimisation of vertically mounted agrivoltaic systems. J. Clean. Prod. 2021, 325, 129091. [Google Scholar] [CrossRef]
  2. Johansson, D.J.A.; Azar, C.A. Scenario based analysis of land competition between food and bioenergy production in the US. Clim. Change 2007, 82, 267–329. [Google Scholar] [CrossRef]
  3. Nonhebel, S. Renewable energy and food supply: Will there be enough land? Renew. Sustain. Energy Rev. 2005, 9, 191–201. [Google Scholar] [CrossRef]
  4. Saleem, M. Possibility of utilizing agriculture biomass as a renewable and sustainable future energy source. Heliyon 2022, 8, e08905. [Google Scholar] [CrossRef]
  5. Foley, J.A.; Ramankutty, N.; Brauman, K.A.; Cassidy, E.S.; Gerber, J.S.; Johnston, M.; Mueller, N.D.; O’Connell, C.; Ray, D.K.; West, P.C.; et al. Solutions for a cultivated planet. Nature 2011, 478, 337–342. [Google Scholar] [CrossRef] [PubMed]
  6. Adeh, E.H.; Selker, J.S.; Higgins, C.W. Remarkable agrivoltaic influence on soil moisture, micrometeorology and water-use efficiency. PLoS ONE 2018, 13, e0203256. [Google Scholar] [CrossRef]
  7. Semeraro, T.; Scarano, A.; Curci, L.M.; Leggieri, A.; Lenucci, M.; Basset, A.; Santino, A.; Piro, G.; De Caroli, M. Shading effects in agrivoltaic systems can make the difference in boosting food security in climate change. Appl. Energy 2024, 358, 122565. [Google Scholar] [CrossRef]
  8. Busch, C.; Wydra, K. Life cycle assessment of an agrivoltaic system with conventional potato production. J. Renew. Sustain. Energy 2023, 15, 043501. [Google Scholar] [CrossRef]
  9. Weselek, A.; Bauerle, A.; Hartung, J.; Zikeli, S.; Lewandowski, I.; Högy, P. Agrivoltaic system impacts on microclimate and yield of different crops within an organic crop rotation in a temperate climate. Agron. Sustain. Dev. 2021, 41, 64. [Google Scholar] [CrossRef]
  10. Marrou, H.; Dufour, L.; Wery, J. How does a shelter of solar panels influence water flows in a soil–crop system? Eur. J. Agron. 2013, 50, 38–51. [Google Scholar] [CrossRef]
  11. AL-agele, H.A.; Proctor, K.; Murthy, G.; Higgins, C. A Case Study of Tomato (Solanum lycopersicon var. Legend) Production and Water Productivity in Agrivoltaic Systems. Sustainability 2021, 13, 2850. [Google Scholar] [CrossRef]
  12. Scarano, A.; Semeraro, T.; Calisi, A.; Aretano, R.; Rotolo, C.; Lenucci, M.S.; Santino, A.; Piro, G.; De Caroli, M. Effects of the Agrivoltaic System on Crop Production: The Case of Tomato (Solanum lycopersicum L.). Appl. Sci. 2024, 14, 3095. [Google Scholar] [CrossRef]
  13. Dupraz, C. Assessment of the ground coverage ratio of agrivoltaic systems as a proxy for potential crop productivity. Agrofor. Syst. 2024, 98, 2679–2696. [Google Scholar] [CrossRef]
  14. Laub, M.; Pataczek, L.; Feuerbacher, A.; Zikeli, S.; Hogy, P. Contrasting yield responses at varying levels of shade suggest different suitability of crops for dual land-use systems: A meta-analysis. Agron. Sustain. Dev. 2022, 42, 13. [Google Scholar] [CrossRef]
  15. World Processing Tomato Council (WPTC) WPTC Crop Update. Available online: https://www.tomatonews.com/en/wptc-crop-update-as-of-9-june-2024_2_2339.html (accessed on 10 January 2025).
  16. Cammarano, D.; Jamshidi, S.; Hoogenboom, G.; Ruane, A.C.; Niyogi, D.; Ronga, D. Processing Tomato Production Is Expected to Decrease by 2050 Due to the Projected Increase in Temperature. Nat. Food 2022, 3, 437–444. [Google Scholar] [CrossRef]
  17. Weselek, A.; Ehmann, A.; Zikeli, S.; Lewandowski, I.; Schindele, S.; Högy, P. Agrophotovoltaic systems: Applications, challenges, and opportunities. A review. Agron. Sustain. Dev. 2019, 39, 35. [Google Scholar] [CrossRef]
  18. El-Gizawy, A.M.; Abdallah, M.M.F.; Gomaa, H.M.; Mohamed, S.S. Effect of different shading levels on tomato plants. 2. Yield and fruit quality. Acta Hortic. 1993, 323, 349–354. [Google Scholar] [CrossRef]
  19. Nangare, D.D.; Singh, J.; Meena, V.S.; Bhushan, B.; Bhatnagar, P.R. Effect of green shade nets on yield and quality of tomato (Lycopersicon esculentum Mill) in semi-arid region of Punjab. Asian J. Adv. Basic. Appl. Sci. 2015, 1, 1–8. [Google Scholar]
  20. Peel, M.C.; Finlayson, B.L.; McMahon, T.A. Updated world map of the Köppen-Geiger climate classification. Hydrol. Earth Syst. Sci. 2007, 11, 1633–1644. [Google Scholar] [CrossRef]
  21. Ministero delle Politiche Agricole e Forestali (MIPAF). Approvazione dei “Metodi Ufficiali di Analisi Chimica del Suolo”. Decreto Ministeriale 13-09-99, Gazzetta Ufficiale Serie Generale n.248 del 21-10-1999, Supplemento Ordinario n. 185. 1999. Available online: http://www.gazzettaufficiale.it/eli/id/1999/10/21/099A8497/sg (accessed on 20 February 2025).
  22. Ronga, D.; Zaccardelli, M.; Lovelli, S.; Perrone, D.; Francia, E.; Milc, J.; Ulrici, A.; Pecchioni, N. Biomass production and dry matter partitioning of processing tomato under organic vs conventional cropping systems in a Mediterranean environment. Sci. Hortic. 2017, 224, 163–170. [Google Scholar] [CrossRef]
  23. Ronga, D.; Caradonia, F.; Vitti, A.; Francia, E. Agronomic Comparisons of Heirloom and Modern Processing Tomato Genotypes Cultivated in Organic and Conventional Farming Systems. Agronomy 2021, 11, 349. [Google Scholar] [CrossRef]
  24. Wickham, H.; Averick, M.; Bryan, J.; Chang, W.; McGowan, L.D.; François, R.; Grolemund, G.; Hayes, A.; Henry, L.; Hester, J.; et al. Welcome to the Tidyverse. J. Open Source Softw. 2019, 4, 1686. [Google Scholar] [CrossRef]
  25. Graves, S.; Piepho, H.-P.; Selzer, L. multcompView: Visualizations of Paired Comparisons. 2024. Available online: https://cran.r-project.org/web/packages/multcompView/index.html (accessed on 18 February 2025).
  26. Parkinson, S.; Hunt, J. Agrovoltaic systems: A dual approach to energy and food production. Environ. Sci. Technol. Lett. 2020, 7, 525–531. [Google Scholar] [CrossRef]
  27. Bellone, Y.; Croci, M.; Impollonia, G.; Zad, A.N.; Colauzzi, M.; Campana, P.E.; Amaducci, S. Simulation-Based Decision Support for Agrivoltaic Systems. Appl. Energy 2024, 369, 123490. [Google Scholar] [CrossRef]
  28. Dong, C.; Fu, Y.; Liu, G.; Liu, H. Low light intensity effects on the growth, photosynthetic characteristics, antioxidant capacity, yield and quality of wheat (Triticum aestivum L.) at different growth stages in BLSS. Adv. Space Res. 2014, 53, 1557–1566. [Google Scholar] [CrossRef]
  29. Marenco, R.; Reis, A.C.S. Shading as an environmental factor affecting the growth of Ischaemum rugosum. Rev. Bras. Fisiol. Veg. 1998, 10, 107–112. [Google Scholar]
  30. Reis, L.C.; Scalon, S.P.; Foresti, A.C.; Dresch, D.M.; Santos, C.C.; Lima, V.T. How does shading mitigates the water deficit in young Hymenaea courbaril L. plants? Front. Plant Sci. 2023, 14, 1235234. [Google Scholar] [CrossRef]
  31. Dev, R.; Singh, J.P.; Singh, T.; Dayal, D. Effect of shade levels on growth, and biomass production of cactus (Opuntiaficus-india (L.) Mill.). Int. J. Curr. Microbiol. Appl. Sci. 2018, 7, 3145–3153. [Google Scholar]
  32. Weselek, A.; Bauerle, A.; Zikeli, S.; Lewandowski, I.; Högy, P. Effects on crop development, yields and chemical composition of celeriac (Apium graveolens L. var. Rapaceum) cultivated underneath an agrivoltaic system. Agronomy 2021, 11, 733. [Google Scholar] [CrossRef]
  33. Ronga, D.; Lovelli, S.; Zaccardelli, M.; Perrone, D.; Ulrici, A.; Francia, E.; Pecchioni, N. Physiological responses of processing tomato in organic and conventional Mediterranean cropping systems. Sci. Hortic. 2015, 190, 161–172. [Google Scholar] [CrossRef]
  34. Maity, R.; Sudhakar, K.; Abdul Razak, A.; Karthick, A.; Barbulescu, D. Agrivoltaic: A strategic assessment using SWOT and TOWS matrix. Energies 2023, 16, 3313. [Google Scholar] [CrossRef]
  35. Zainali, S.; Lu, S.M.; Stridh, B.; Avelin, A.; Amaducci, S.; Colauzzi, M.; Campana, P.E. Direct and diffuse shading factors modelling for the most representative agrivoltaic system layouts. Appl. Energy 2023, 339, 120981. [Google Scholar] [CrossRef]
  36. Chauhan, P.M.; Kumar, S.; Patel, B.N.; Saravaiya, S.; Patel, N.B. Agrovoltaic: A novel technology for doubling the income of farmers. In Technologies and Sustainability of Protected Cultivation for Hi-Valued Vegetable Crops; Navsari Agricultural University: Gujarat, India, 2018; p. 215. Available online: https://www.researchgate.net/publication/326016018 (accessed on 18 February 2025).
  37. Ronga, D.; Biazzi, E.; Parati, K.; Carminati, D.; Carminati, E.; Tava, A. Microalgal Biostimulants and Biofertilisers in Crop Productions. Agronomy 2019, 9, 192. [Google Scholar] [CrossRef]
  38. Ureña-Sánchez, R.; Callejón-Ferre, Á.J.; Pérez-Alonso, J.; Carreño-Ortega, Á. Greenhouse tomato production with electricity generation by roof-mounted flexible solar panels. Sci. Agric. 2012, 69, 233–239. [Google Scholar] [CrossRef]
  39. Pataczek, L.; Weselek, A.; Otte, P.P.; Högy, P.; Lewandowski, I. Agrivoltaics mitigate drought effects in winter wheat. Physiol. Plant. 2023, 175, e14081. [Google Scholar] [CrossRef]
  40. Dinesh, H.; Pearce, J.M. The potential of agrivoltaic systems. Renew. Sustain. Energy Rev. 2016, 54, 299–308. [Google Scholar] [CrossRef]
Figure 1. Studied area. Picture of the area where the experiment was carried out (a). Pictures of processing tomato grown under an agrivoltaic system with a reduction in solar radiation: solar panel with standard agrivoltaic shading conditions (b); solar panels in a vertical position until full fruit set (c); solar panel with increased agrivoltaic shading conditions (d).
Horticulturae 11 00319 g001
Figure 2. Agrometeorological measurements recorded over the experimental period (May 2023–August 2024) and reported monthly: (a) mean minimum and maximum air temperature (T min and T max) and total rainfall; (b) mean air relative humidity and mean solar radiation.
Horticulturae 11 00319 g002
Figure 3. (a) Chlorophyll index (SPAD) trend during the 2023 growing season (mean and s.d.). (b) Leaf area index (LAI) trend during the 2023 growing season. FL: external control; A1: internal control; A2: 41% ground coverage ratio (GCR). Different letters indicate the statistically significant differences at p < 0.05.
Horticulturae 11 00319 g003
Figure 4. (a) Chlorophyll index (SPAD) trend during the 2024 growing season. (b) Leaf area index (LAI) trend during the 2024 growing season (mean and s.d.). FL: external control; B1: internal control; B2: phenological window; B3: 13% ground coverage ratio (GCR). Different letters indicate the statistically significant differences at p < 0.05.
Horticulturae 11 00319 g004
Table 1. Soil and plant parameters recorded during the second survey (20 July 2023).
TreatmentsFL A1 A2
EC (dS m−1)0.04 0.04 0.03
VWC (%)10.70b11.10b18.95a
Soil Temperature (°C)35.35 36.27 34.43
Canopy Temperature (°C)30.24a30.78a28.65b
LFW (g plant−1)406.40a203.70b325.50ab
LDW (g plant−1) 73.63a53.18b71.16a
SFW (g plant−1) 244.10a115.50b191.00a
SDW (g plant−1)43.92a27.50b35.67ab
FFW (g plant−1)1334.50a659.00b677.60b
FDW (g plant−1)95.16a66.33b55.80b
RFW (g plant−1)165.70a68.70b97.00b
RDW (g plant−1)62.32a35.41b31.00b
FL: external control; A1: internal control; A2: 41% GCR coverage; EC: electrical conductivity; VWC: volumetric water content; LFW: leaf fresh weight; LDW: leaf dry weight; SFW: stem fresh weight; SDW: stem dry weight; RFW: root fresh weight; RDW: root dry weight; FFW: fruit fresh weight; FDW: fruit dry weight. Different letters within each row indicate significant differences according to Duncan’s test (p ≤ 0.05).
Table 2. Soil and plant parameters recorded during the second survey (8 August 2023).
TreatmentsFL A1 A2
EC (dS m−1)0.11a0.09b0.08b
VWC (%)17.31 21.65 17.90
Soil Temperature (°C)33.41 34.80 34.77
Canopy Temperature (°C)40.24a41.21a38.56b
LFW (g plant−1)245.10b366.80ab411.10a
LDW (g plant−1)74.04 71.30 75.13
SFW (g plant−1)222.80a191.60ab232.60a
SDW (g plant−1)37.80 36.80 37.13
FFW (g plant−1)2232.00a1121.00b1571.00b
FDW (g plant−1)131.30a71.80b87.63b
RFW (g plant−1)130.10ab146.10a144.10a
RDW (g plant−1)39.98ab56.63a55.63a
FL: external control; A1: internal control; A2: 41% GCR coverage; EC: electrical conductivity; VWC: volumetric water content; LFW: leaf fresh weight; LDW: leaf dry weight; SFW: stem fresh weight; SDW: stem dry weight; RFW: root fresh weight; RDW: root dry weight; FFW: fruit fresh weight; FDW: fruit dry weight. Different letters within each row indicate significant differences according to Duncan’s test (p ≤ 0.05).
Table 3. Plant and fruit quality parameters recorded at harvest (24 August 2023).
TreatmentsFL A1 A2
LFW (g plant−1)457.60a192.70b280.20b
LDW (g plant−1)119.08a43.49c63.35b
SFW (g plant−1)455.80a217.70b304.40b
SDW (g plant−1)76.79a40.93b44.82b
FFW (g plant−1)1571.00a1052.00b1395.00a
FDW (g plant−1)66.87a55.35ab70.97a
RFW (g plant−1)133.78a60.11b62.07b
RDW (g plant−1)43.30a25.93b27.10b
Average fruit weight (g plant−1)77.31a66.93b77.96a
Marketable yield (g plant−1)1531.97a1054.75b1433.00a
Total yield2083.00a1245.00c1572.00b
Marketable fruits (number plant−1)18.16a13.78b17.33a
Unripe fruits (g plant−1)370.80a176.90b127.10b
NAE (g g−1)940.50a647.90b880.30a
FWP (g m−3)6440.00a4436.00c6027.00a
Rotten fruits (number plant−1)7.33a1.89b5.11a
Fruit affected by BER (number plant−1)5.83a5.22a0.78b
Sunburnt fruits (number plant−1)0.67a0.00b0.22ab
Equatorial diameter (mm)40.94 40.99 42.09
Polar diameter (mm)80.00ab80.94a75.49b
Pulp thickness (mm)11.23 10.14 10.41
L35.39a33.70b33.42b
a20.08a21.39a18.40b
b19.98 19.42 18.95
pH4.52a4.40b4.35b
°Brix5.39a5.67a4.97b
FL: external control; A1: internal control; A2: 41% GCR coverage; BER: blossom end rot; L: brightness index; a: red index; b: yellow index. Different letters within each row indicate significant differences according to Duncan’s test (p ≤ 0.05).
Table 4. Soil and plant parameters recorded during the first survey (17 July 2024).
TreatmentsFL B1 B2 B3
EC (dS m−1)0.14a0.09b0.03c0.07b
VWC (%)10.24 12.73 11.10 9.44
Soil Temperature (°C)44.88a41.90c43.37b42.53bc
Canopy Temperature (°C)34.73a35.78a31.83b31.36b
LFW (g plant−1)421.90a367.50ab368.50ab336.50b
LDW (g plant−1)104.48a60.00b56.75b53.00b
SFW (g plant−1)327.10a274.00b228.70c232.90c
SDW (g plant−1)82.98a40.00b32.50c33.80bc
FFW (g plant−1)680.50c1355.60a1052.10b616.20c
FDW (g plant−1)72.95a49.51ab60.40a28.00b
RFW (g plant−1)153.10a104.40b126.20b77.00c
RDW (g plant−1)95.65a55.67b53.50b39.00c
FL: external control; B1: internal control; B2: phenological window; B3: 13% GCR coverage; EC: electrical conductivity; VWC: volumetric water content; LFW: leaf fresh weight; LDW: leaf dry weight; SFW: stem fresh weight; SDW: stem dry weight; FFW: fruit fresh weight; FDW: fruit dry weight; RFW: root fresh weight; RDW: root dry weight. Different letters within each row indicate significant differences according to Duncan’s test (p ≤ 0.05).
Table 5. Soil and plant parameters recorded during the second survey (6 August 2024).
TreatmentsFL B1 B2 B3
EC (dS m−1)0.29 0.21 0.22 0.22
VWC (%)36.03 35.63 35.96 37.50
Soil Temperature (°C)35.16a35.00a34.22b34.25b
Canopy Temperature (°C)40.40a40.46a38.70b38.35b
LFW (g plant−1)532.70b409.60c709.20a344.4c
LDW (g plant−1)88.60b73.64c119.10a55.00d
SFW (g plant−1)442.40ab339.50bc484.30a275.10c
SDW (g plant−1)78.26ab64.13b83.20a42.00c
FFW (g plant−1)2356.00b2293.00b3619.00a1969.00b
FDW (g plant−1)170.00b157.30b251.60a139.40b
RFW (g plant−1)120.10b158.30a79.60c95.00c
RDW (g plant−1)53.60b86.05a40.35b52.00b
FL: external control; B1: internal control; B2: phenological window; B3: 13% GCR coverage; EC: electrical conductivity; VWC: volumetric water content; LFW: leaf fresh weight; LDW: leaf dry weight; SFW: stem fresh weight; SDW: stem dry weight; FFW: fruit fresh weight; FDW: fruit dry weight; RFW: root fresh weight; RDW: root dry weight. Different letters within each row indicate significant differences according to Duncan’s test (p ≤ 0.05).
Table 6. Plant and fruit quality parameters recorded at harvest (20 August 2024).
TreatmentsFL B1 B2 B3
LFW (g plant−1)515.60b347.30c705.40a408.20bc
LDW (g plant−1)81.60b86.50b137.60a94.60b
SFW (g plant−1)441.50a301.00b495.00a298.80b
SDW (g plant−1)77.64b80.53b102.25a82.50b
FFW (g plant−1)1902.00c2698.00b3551.00a2680.00b
FDW (g plant−1)206.00 179.90 236.70 186.20
RFW (g plant−1)58.03b69.52b124.77a68.75b
RDW (g plant−1)32.50b21.03bc45.33a19.00c
Average fruit weight (g plant−1)64.29b85.69a83.24a85.20a
Marketable yield (g plant−1)1657.00c2562.00b2992.00a2408.00b
Total yield (g plant−1)2157.40c2977.80b3778.10a2850.60b
Marketable fruits (g plant−1)26.01c34.48ab40.33a30.00bc
NAE (g g−1)203.60c314.70b369.60a308.40b
FWP (g m−3)6972.00c10,778.00b12,659.00a10,561.00b
Unripe fruits500.40b415.80b786.10a442.60b
Rotten fruits (number plant−1)3.50a0.67bc2.00b0.33c
Fruit affected by BER (number plant−1)2.51 2.01 3.67 4.50
Equatorial diameter (mm)44.20b49.51a48.32ab48.75a
Polar diameter (mm)67.75a65.44ab65.08ab62.99b
Pulp thickness (mm)6.57a6.94a5.07b7.40a
L41.55b44.72a43.43a43.34a
a23.29a21.17b20.31b21.13b
b20.24a19.05ab17.50b18.21ab
pH4.32b4.38ab4.35b4.47a
°Brix5.17 5.10 5.27 5.17
FL: external control; B1: internal control; B2: phenological window; B3: 13% GCR coverage; LFW: leaf fresh weight; LDW: leaf dry weight; SFW: stem fresh weight; SDW: stem dry weight; FFW: fruit fresh weight; FDW: fruit dry weight; RFW: root fresh weight; RDW: root dry weight; NAE: nitrogen agronomic efficiency; FWP: fruit water productivity; BER: blossom end rot; L: brightness index; a: red index; b: yellow index. Different letters within each row indicate significant differences according to Duncan’s test (p ≤ 0.05).
Disclaimer/Publisher’s Note: The statements, opinions and data contained in all publications are solely those of the individual author(s) and contributor(s) and not of MDPI and/or the editor(s). MDPI and/or the editor(s) disclaim responsibility for any injury to people or property resulting from any ideas, methods, instructions or products referred to in the content.

