Abstract
The size of leaves and fruits is a crucial agronomic and economic trait for fruit trees. The ‘Bartlett’ pear is a famous cultivar with succulent and delicious fruit and is cultivated globally. ‘Xiang shuomi’ is a bud sport of the ‘Bartlett’ pear, discovered in our breeding work, and exhibits enlarged leaves and fruits. However, the specific regulatory mechanism of this superior agronomic trait is still elusive. In this study, comprehensive transcriptome and metabolome analyses were performed to explore the differences in gene expression and metabolite accumulation between these two pear cultivars. The transcriptome analysis showed a total of 1279 differentially expressed genes (DEGs), with the flavonoid biosynthetic process being the most significant enriched biological process. Metabolome data indicated the detection of 412 differentially abundant metabolites (DAMs), with the metabolites of flavonoid biosynthesis being enriched significantly. The integrative transcriptomic and metabolomics analysis further confirmed the pivotal role of the flavonoid biosynthetic process in distinguishing the two cultivars. Importantly, the genes that encoded enzymes related to flavonoid biosynthesis, including CHS, CHI, HCT, LAR and CYP75B1, increased their expressions in the ‘Xiang shuomi’ pear. Correspondingly, the metabolites galangin, chlorogenic acid, luteolin and catechin were found to accumulate in the ‘Xiang shuomi’ pear. Overall, this research identified key pathways and genes influencing the fruit and leaf size of pears, providing fundamental information for the high-yield breeding of fruit trees.
1. Introduction
The size of plant organs is a pivotal agronomic trait that influences both plant yield and quality [1]. It is a particularly pivotal economic trait for cereal crops and horticultural plants. However, the process of organ development is intricate and well-regulated, so dissecting the complex network underlying the development of plant organs is of great significance [2]. Leaves act as the primary source organ in plants as the central organ for photosynthesis and directly contribute to plant yield and biomass [3,4]. Numerous studies and reports have focused on studying them. For instance, it has been reported that leaf growth is regulated by the protein complex PPD (PEAPOD) and KIX (Kinase-Inducible Domain Interacting) [5,6]. Further research in Arabidopsis showed that an F-box protein, AtSAP (Sterile Apetala), could interact with this complex, leading to its proteasomal degradation. Thus, transgenic plants overexpressing AtSAP exhibited enlarged leaves [7]. Subsequently, the PPD-KIX-SAP regulatory module was demonstrated to function in many eudicots, including soybean, pea, tomato, cucumber and Medicago truncatula [1,8,9,10].
GRFs (growth-regulating factors), a type of transcription factor, are famous for their functions in regulating the growth and development of a wide range of plant organs, such as in Arabidopsis, rice, maize, poplar, tobacco, grape, Chinese cabbage, Chinese pear and citrus [11,12,13,14,15,16,17]. Studies in Arabidopsis proved that the overexpression of AtGRF1 and AtGRF2 resulted in larger leaves, whereas the triple mutant Atgrf1/2/3 exhibited smaller leaves [18]. Conversely, maize with ZmGRF10 overexpression displayed reduced leaf size [19]. In poplar, PagGRF12a and PagGRF12b were proven to promote leaf growth and development, in contrast to PagGRF7a, which played an opposing effect [13]. Moreover, GIF (GRF interacting factor) can also influence leaf size by interacting with GRFs [20]. Except for transcriptional regulation, energy metabolism also plays an indispensable role in controlling plant organ size. NLG1 (Narrow Leaf and Slender Grain 1), a mitochondrial membrane protein, could regulate the development of leaves and grains through sustaining mitochondrial homeostasis [21]. Research on rice revealed that one prohibitin, NAL8 (Narrow Leaf 8), a regulator of photosynthesis and respiration, could affect leaf development [22].
Furthermore, the plant hormone auxin plays a crucial role in orchestrating the development of plant organs. In Arabidopsis, ARF2 (auxin response factor 2) was discovered to be the key regulator that controlled the expression of auxin-responsive genes, thereby repressing organ growth [23]. In rice, exogenous auxin has been shown to induce the expression of SMOS1 (Small Organ Size 1), which in turn leads to an increase in the size of plant organs [24]. Similarly, ARGOS (Auxin-Regulated Gene Involved in Organ Size) was found to be induced by auxin and could promote the growth of plant organs [25]. It is worth noting that all the aforementioned cases of enlarged leaves were accompanied by enlarged fruits. For instance, recent research on cucumbers found that CsRAXs (Regulators of Axillary Meristem) could induce the expression of CsUGT74E2 (auxin glucosyltransferase gene), regulating leaf size and fruiting ability negatively [26]. In rice, an E3 ubiquitin ligase named WLG (Width of Leaf and Grain) was identified to control grain and leaf size by mediating the stability of another E3 ligase, LARGE2, through the 26s proteasome system [27]. Therefore, the regulatory mechanisms governing the size of plant organs including leaves and fruits are complex and diverse. Many genes and pathways involved in these processes remain largely unexplored.
The pear (Pyrus spp.) is an economically significant fruit tree cultivated worldwide. Famous for their succulent texture, delicious taste and high nutritional value, pears are popular with many consumers [28]. Meanwhile, studies and the cultivation of new varieties are continuous and have been ongoing. The majority of pear research concentrates on two main aspects, the formation mechanisms of peel coloration (anthocyanin biosynthesis) and stone cells. Our previous study revealed that the red coloration in pear peels of ‘Red Bartlett’, a bud sport of ‘Bartlett’, was closely associated with anthocyanin biosynthesis and transport [29]. Similarly, the relative color fading of ‘Red Bartlett’ compared ‘Starkrimson’ at maturity was attributed to be due to enhanced anthocyanin degradation and reduced anthocyanin transport [30]. With the MBW (MYB-bHLH-WD40) complex being proposed to regulate anthocyanin synthesis in plants, many MYB genes (MYB114, PuMYB110a, PpMYB17, PyMYB10 and PuMYB123-like) in pears have been implicated in anthocyanin synthesis [31,32,33,34,35,36]. In contrast, research on the regulatory mechanisms of leaf and fruit size, which are also key agronomic traits in pears, is rare, with even less information on the related genes and pathways.
In this research, we used a bud sport of the ‘Bartlett’ pear named ‘Xiang shuomi’ pear, for which we obtained the plant variety rights certificate (CNA20201001221) in 2023. The ‘Bartlett’ pear, a cultivar of the European pear (Pyrus communis L.), has a wide distribution and important economic value [37]. Unlike the ‘Bartlett’ pear, its bud sport ‘Xiang shuomi’ exhibits superior agronomic traits with larger leaves and fruits. Meanwhile, the ‘Xiang shuomi’ pear is also different from the ‘Red Bartlett’ pear, which is a well-known bud sport of ‘Bartlett’ having beautiful peel coloration, maintaining the normal peel color. Although numerous studies have explored the genes and mechanisms responsible for the growth and development of leaves and fruits, most of them are based on crops and model plants, with seldom research on fruit trees. In this study, transcriptome and metabolome analyses of ‘Xiang shuomi’ and ‘Bartlett’ pears were performed to identify the DEGs and DAMs. The integrative analysis of the transcriptome and metabolome further elucidated the crucial role of the flavonoid biosynthetic process in driving the differences in the two cultivars. Moreover, the genes encoding key enzymes of flavonoid biosynthesis increased their expressions in ‘Xiang shuomi’. The findings offer novel avenues and gene targets for the breeding of high-yield pear cultivars.
2. Materials and Methods
2.1. Plant Material
‘Xiang shuomi’ is a bud sport mutation that originated from ‘Bartlett’, which was discovered during our long-term cultivation and study of pear germplasm resources. We collected leaves and fruits from both ‘Xiang shuomi’ and ‘Bartlett’ pear trees located in a pear orchard at the Yantai Academy of Agricultural Sciences in Yantai, Shandong Province. The leaves were collected on 10 August 2023 and the fruits were picked on 25 August 2023. The fresh weight of the ripe fruits and the dimensions of the leaves were measured soon after the fruits and leaves were picked up. In addition, a larger set of leaves was collected and frozen immediately in liquid nitrogen and stored at −80 °C for subsequent experiments. To ensure reliability, we utilized three biological replicates for RNA-seq and five for LC-MS/MS analysis. ‘Xiang shuomi’ and ‘Bartlett’ were designated as YB and MB in the transcriptome and metabolome studies, respectively.
2.2. RNA Isolation, Sequencing and DEG Analysis
The total RNA of each pear leaf sample was extracted by using the Trizol reagent (Invitrogen, Carlsbad, CA, USA) in accordance with the guidelines. The purity and quantification of the extracted RNA were assessed with a Nano Photometer®-N60 spectrophotometer (Thermo Scientific, Waltham, MA, USA). The integrity of the RNA was evaluated with an Agilent 2100 Bioanalyzer (Agilent Technologies, Santa Clara, CA, USA). Six libraries were constructed, and sequencing was performed with the Illumina Novaseq 6000 platform at OE Biotech Co., Ltd. (Shanghai, China). Initially, each sample produced an average of about 48.02 M raw reads. After moving out the low-quality reads, we acquired approximately 47.06 M clean reads per sample. Subsequently, these clean reads were mapped to the pear reference genome (http://peargenome.njau.edu.cn/, accessed on 13 November 2012) using HISAT2 [38]. The read counts and the FPKM (fragments per kilobase million) value for each transcript were measured and calculated with HTSeq-count [39,40]. Finally, to assess the biological replicates’ consistency, we conducted s PCA (Principal Component Analysis) with R software (v 3.2.0).
2.3. DEG Analysis
The differential gene expression analysis was performed by DESeq2, with the threshold for the significantly differential expression gene (DEG) analysis set at a q-value < 0.05 and a fold change >2 or <0.5 [41]. To visualize the expression profiles of genes across different samples and groups, a hierarchical cluster analysis was performed using R (v 3.2.0). Based on the hypergeometric distribution, a GO (Gene Ontology) enrichment analysis was used to identify the enriched terms with R (v 3.2.0). A GSEA (Gene Set Enrichment Analysis) was executed with GSEA software [42]. Firstly, a gene set was designated. Then, the genes within the gene set were ranked based on their degree of differential expression between two samples. Finally, this gene set was assessed as whether it was enriched within the ranking list.
2.4. Sample Processing and Metabolite Extraction and Detection
A total of 60 mg sample was introduced into a 1.5 mL centrifuge tube, with two small steel balls and 600 μL of methanol–water (7:3 v/v, with an internal standard concentration of 4 μg/mL). The samples were then ground into powder with a grinder (50 Hz, 2 min) after being precooled at −40 °C for 2 min. Following grinding, the samples were subjected to ultrasonic extraction for 30 min in an ice-water bath and then stored at −40 °C overnight. After centrifugation for 10 min (12,000 rpm, 4 °C), the supernatants (150 μL) of each sample were carefully collected, filtered through 0.22 μm microfilters and subsequently transferred to LC sample vials for LC-MS. Metabolic profiling was performed using an ACQUITY UPLC I-Class plus system (Waters Corporation, Milford, MA, USA) coupled with a Q-Exactive mass spectrometer equipped with a heated electrospray ionization (ESI) source. An ACQUITY UPLC HSS T3 column (1.8 μm, 2.1 mm × 100 mm) was utilized for both positive and negative ion modes. The binary gradient elution system was composed of (A) water (containing 0.1% formic acid, v/v) and (B) acetonitrile (containing 0.1% formic acid, v/v). The flow rate was 0.35 mL/min and the column temperature was 45 °C. All samples were kept at 10 °C, and the injection volume was 2 μL for each.
2.5. Metabolomics Data Preprocessing and Analysis
The raw metabolic data were processed with Progenesis QI v3.0 software for baseline filtering, peak identification, integral, retention time (RT) correction, peak alignment and normalization. Compound identification was achieved by correlating the RT, mass-to-charge ratio (M/z), secondary fragments and isotopic distribution and by referencing the database including the human metabolome database (HMDB), lipidmaps (v2.3), metlin and self-built (LuMet-Plant). Then, the extracted data were processed further, by removing all the peaks with missing values (ion intensity = 0) in more than 50% in groups, replacing the zero value by half of the minimum value and, filtrating the compounds according to their qualitative results. In addition, the compounds with identification scores below 36 were also excluded from the analysis.
A PCA was conducted to assess the distribution of all samples and to evaluate the stability of the analytical process. The Variable Importance of Projection (VIP) scores were used to evaluate the contribution of each metabolite to the classification and discrimination between groups. Student’s T-test was employed to evaluate the differences in metabolite levels between difference groups. Finally, the differential accumulated metabolites (DAMs) were identified with a threshold of VIP > 1.0 and p-value < 0.05. These DAMs were then subjected to a KEGG pathway enrichment analysis (http://www.genome.jp/kegg/, accessed on 1 December 1995). The data analysis was performed by Shanghai Luming biological technology Co., Ltd. (Shanghai, China).
2.6. Integrative Analysis of Transcriptome and Metabolome
The Spearman correlation algorithm was applied to investigate the correlation between the differentially expressed genes (q-value < 0.05 and FC > 2.0 or <0.5) and metabolites (p-value < 0.05 and |VIP| > 1.0). Meanwhile, the top 30 significantly enriched pathways were analyzed, and the common pathways identified in both the transcriptome and metabolome were mapped to KEGG with a defined significance threshold. The KEGG pathway mapping was obtained by aligning the differential genes and metabolites to the KEGG pathway database; thereby, the information of the common pathway was acquired.
2.7. Statistical Analysis
The values of fresh weight, leaf length and width were the mean values of fifty replicates. The data were further processed and analyzed with one-way ANOVA for significance analysis, and the statistical data were plotted into graphs using the GraphPad Prism 8 software.
3. Results
3.1. ‘Xiang Shuomi’ Possesses Enlarged Leaf and Fruit Size
‘Xiang shuomi’ is a novel pear cultivar that we have identified, registered with the variety right number CNA20201001221. Being a bud sport mutation of ‘Bartlett’, we conducted an analysis of its ripe fruits and leaves. As depicted in Figure 1, the bud mutation not only exhibited a larger fruit size (Figure 1a), which was a key sink organ, but also displayed an increase in leaf dimensions, which was the main source organ (Figure 1b). For simplicity, ‘Xiang shuomi’ and ‘Bartlett’ are referred to as YB and MB in the following. In line with the observed phenotypes, statistical data confirmed that the fresh fruit weight of the YB fruits was more than double that of MB (Figure 1c). Additionally, both the leaf length and width of YB were significantly greater than those of MB.
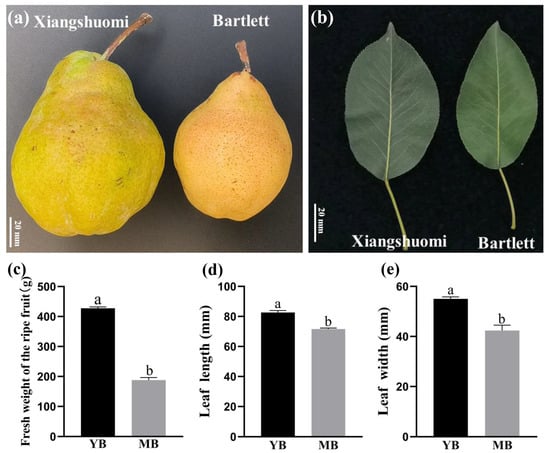
Figure 1.
Phenotypic characterization of ‘Xiang shuomi’ (YB) and ‘Bartlett’ pears (MB): (a) phenotype of ripe fruits; (b) phenotype of ripe leaves; (c–e) comparison between YB and MB in fresh weight of the ripe fruit (c), leaf length (d) and leaf width (e). Values are means ± SD, n = 50. The letters above the columns indicate significant differences among the groups at p < 0.05 through one-way ANOVA analysis.
3.2. Overview of RNA-seq and Gene Expression
Given the excellent agronomic trait of the bud sport mutation ‘Xiang shuomi’, we sought to explore the underlying mechanisms responsible for these characteristics. To this end, mature leaves of ‘Xiang shuomi’ (YB) and ‘Bartlett’ (MB) were collected for transcriptome sequencing, aiming at revealing the discrepant gene expression profiles between the two cultivars. We constructed six cDNA libraries, acquiring a total of 282.38 M clean reads and 41.89 G clean bases. The valid bases and Q30 for each library were all above 87.84% and 93.93%, respectively. Additionally, the GC content varied from 47.28% to 47.51% across all libraries. The overview of the sequencing data, listed in Table S1, confirmed that the sequencing results were of high quality and suitable for further analysis. Therefore, we analyzed the gene expression profiles in the samples in the following. The PCA distinguished the samples YB and MB clearly, with the three biological replicates of each group clustering closely (Figure 2a), indicating the high sensitivity and repeatability of our data. Subsequently, we analyzed the expression levels of all sequenced genes and screened the differentially expressed genes between YB and MB. A total of 1279 differentially expressed genes (DEGs) were found in the comparison of YB vs. MB, including 991 up-regulated and 288 down-regulated genes (Figure 2b).
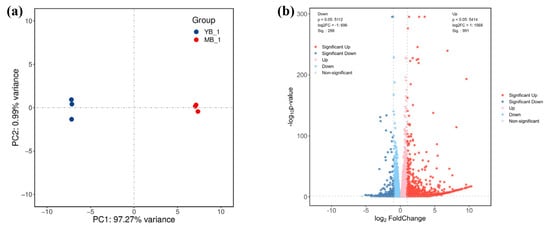
Figure 2.
PCA (Principal Component Analysis) and volcano plot of the differentially expressed genes (DEGs). (a) PCA plot of RNA-seq. Blue points denote the YB group and red points represent the MB group. (b) Volcano plot of the gene expression profiles in YB and MB; p < 0.05, log2FC < −1 or >1. Blue points are the down-regulated genes, red points are the up-regulated genes and gray points are the non-significant genes.
3.3. GO Enrichment Analysis of DEGs and GSEA of Flavonoid Biosynthesis
The GO enrichment analysis was employed to investigate the 991 up-regulated genes among the DEGs in the YB and MB comparison. The top ten significant terms in GO enrichment, categorized into BP (biological process), CC (cellular component) and MF (molecular function), are presented in Figure 3a. Notably, the flavonoid biosynthetic process, signal transduction and oxylipin biosynthetic process in BP; the extracellular region, mitochondrial oxoglutarate dehydrogenase complex and DNA replication factor A complex in CC; and the ADP binding, terpene synthase activity and heme binding in MF were enriched significantly. Among these, the top flavonoid biosynthetic process (GO: 0009813) of biological process was selected for further analysis with the GSEA (Gene Set Enrichment Analysis). The enrichment score (NES: 1.95, p < 0.001 and FDR: 0.002) and ranked metric results confirmed that this metabolic pathway was enriched, and many genes of this gene set increased their expression in the YB group (Figure 3b). The expression profiles of these up-regulated genes involved in flavonoid biosynthesis were visualized in a heat map (Figure 3c).
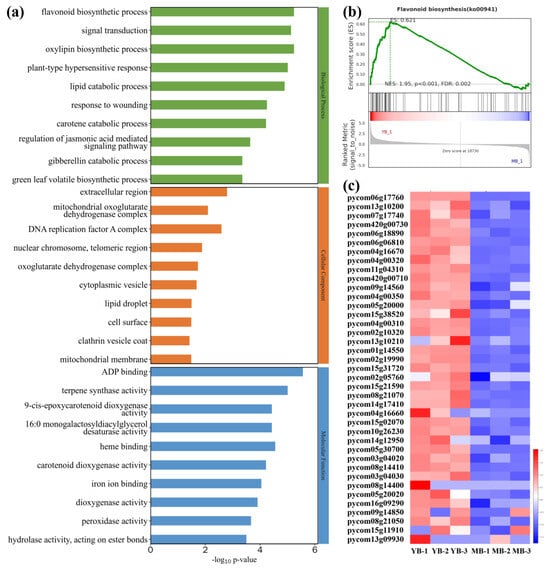
Figure 3.
GO enrichment bar chart of up-regulated DEGs and GSEA of flavonoid biosynthesis. (a) Top ten terms of biological process, cellular component and molecular function in GO enrichment. (b) Enrichment score distribution, gene distribution and ranked metric of flavonoid biosynthesis gene set. ES: enrichment score of this gene set, NES: normalized ES. When NES > 1, p < 0.05 and FDR < 0.25, the gene set is identified as enriched significantly. (c) The heat map of up-regulated gene expression in flavonoid biosynthesis. Blue stands for down-regulation and red stands for up-regulation. The darker color represents more significant changes in gene expression.
3.4. Profiles of Metabolomics and Differentially Abundant Metabolite (DAM) Analysis
To further elucidate the differences between YB and MB, we conducted a non-targeted metabolomics analysis using the LC-MS system. Consistent with the RNA-seq analysis, leaves from YB and MB were used in this study. The results showed that a total of 6545 metabolites were detected across all samples (Figure S1), and the two groups were obviously distinct based on the PCA analysis (Figure 4a). With clear separation and good repeatability among the five samples per group, we screened the DAMs between the two groups (YB vs. MB, with VIP > 1 and p < 0.05) (Figure 4b). This analysis identified a total of 412 DAMs, including 266 significant up-accumulated metabolites and 146 down-accumulated metabolites (Figure S2). The KEGG enrichment analysis indicated that these DAMs were enriched in thirty-seven pathways, mainly classified into biosynthesis of secondary metabolites (red arrow), amino acid metabolism (blue arrow) and carbohydrate metabolism (black arrow) (Figure S2). The top 20 enrichment pathways are displayed in Figure 4c, with the three most significantly enriched pathways being valine, leucine and isoleucine biosynthesis; flavone and flavonol biosynthesis; and flavonoid biosynthesis, respectively.
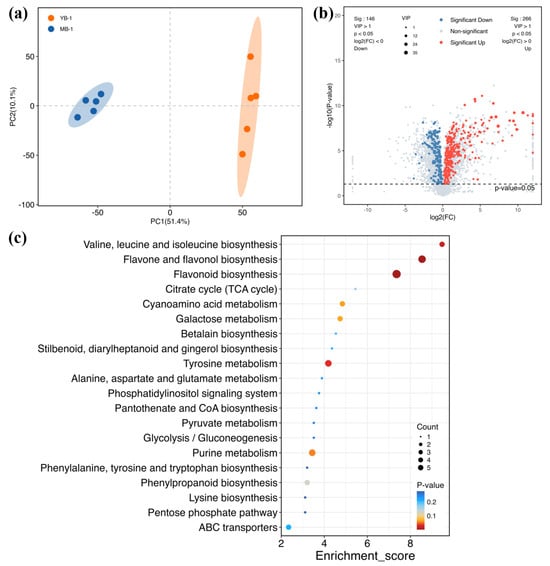
Figure 4.
Overview of the non-targeted metabolomics and DAM analyses. (a) PCA of metabolomics. Blue and red dots represent YB and MB groups, respectively. (b) Volcano of the DAMs for YB and MB. VIP > 1, p < 0.05 and log2(FC) > 0 or log2(FC) < 0. Blue points: significant down-regulated metabolites; red points: significant up-regulated metabolites; gray points: non-significant metabolites. (c) Top 20 KEGG terms of YB vs. MB. The color of the dot represents the different p-values, and the color scale from blue to red indicates that the p-value ranges from large to small. The size of the dot displays the number of DAMs.
3.5. Integrative Analysis of DEGs and DAMs
A conjoint analysis was performed to visualize the relationships between transcriptome and metabolome to identify the differences in genes and metabolic pathways between YB and MB. KEGG enrichment analysis was carried out to show the distribution patterns of the common pathways within both the transcriptome and metabolome. The result revealed that DAMs and DEGs were co-enriched in the flavonoid biosynthesis pathway (p-value < 0.05) (Figure 5). Notably, the phenylpropanoid biosynthesis pathway was enriched significantly in the transcriptome, whereas its enrichment in the metabolome was not sufficiently significant. On the contrary, the tyrosine metabolism pathway showed a significant enrichment in DAMs, but its DEGs did not display a significant enrichment. In particular, the flavonoid biosynthesis pathway displayed the most pronounced enrichment in DAMs, suggesting that this pathway may play an important role in the differences observed between YB and MB.
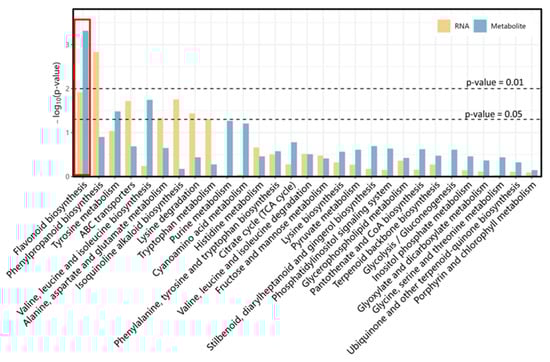
Figure 5.
Combined KEGG enrichment analysis of DEGs and DAMs. The orange column stands for DEGs and the blue column stands for DAMs. The pathway is considered to be co-enriched significantly with a p-value < 0.05.
3.6. The Identification of the Candidate Genes Involved in Regulating Fruit and Leaf Size
To further investigate the key genes and metabolites in flavonoid biosynthesis, we conducted a detailed analysis of the related genes and metabolites with this pathway. In comparison to MB, YB exhibited enhanced expression or anabolism of six genes encoding five crucial enzymes and four metabolites (Figure 6). Chalcone synthase (CHS), a significant and ubiquitous enzyme in plants, plays vital roles in the biosynthesis of flavonoid compounds [43]. Importantly, the expressions of two CHS genes (pycom420g00730 and pycom13g10200) were elevated obviously in YB compared to MB. Additionally, the gene of chalcone isomerase (CHI) (pycom07g17740) also showed increased expression in YB, facilitating the conversion of cinnamoyl-CoA to galangin, leading to increased accumulation of galangin in YB. The up-regulated expression of a gene coding for hikimate O-hydroxycinnamoyl transferase (HCT) (pycom09g14560) promoted the synthesis of chlorogenic acid. Furthermore, the up-regulation of genes encoding HCT, CHS, 5-O-(4-coumaroyl)-D-quinate 3′-monooxygenase (CYP75B1) (pycom06g17760) and leucoanthocyanidin reductase (LAR) (pycom06g18890) collectively contributed to the accumulation of luteolin and catechin. Consequently, the biosynthesis process of flavonoids was activated in YB.
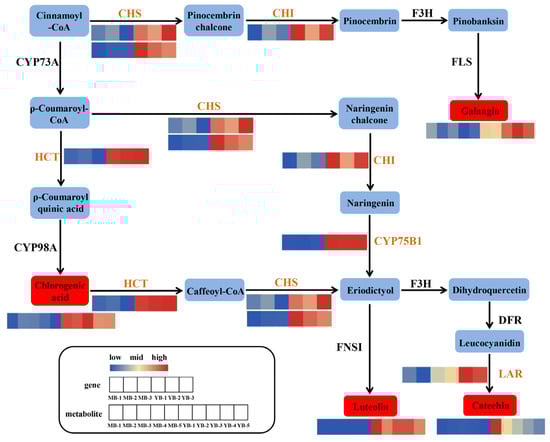
Figure 6.
The expression and accumulation profiles of DEGs and DAMs in the flavonoid biosynthesis pathway in YB and MB. The color scale from blue to red indicates the expression or accumulated levels of the corresponding genes or metabolites. CHS: chalcone synthase, CHI: chalcone isomerase, F3H: naringenin 3-dioxygenase, FLS: flavonol synthase, CYP73A: trans-cinnamate 4-monooxygenase, HCT: hikimate O-hydroxycinnamoyl transferase, CYP98A: 5-O-(4-coumaroyl)-D-quinate 3′-monooxygenase, CYP75B1: flavonoid 3′-monooxygenase, FNSI: flavone synthase I, DFR: bifunctional dihydroflavonol 4-reductase/flavanone 4-reductase, LAR: leucoanthocyanidin reductase.
4. Discussion
As is known, leaf and fruit size constitute two pivotal agronomic traits that are closely related to crop yield and economic value. As noted before, the leaf serves as the source organ of plant, directly contributing to fruit development [3,4]. Hence, plants with enlarged leaves often exhibit correspondingly enlarged fruits, which has been proven by numerous reports [23,24,25,26]. Furthermore, an optimal leaf width and a balanced ratio of leaf width to leaf length can augment photosynthetic efficiency and ultimately enhance yield [44]. Our findings revealed that, compared to the leaves of ‘Bartlett’, the leaves of ‘Xiang shuomi’ possessed enlarged leaf width and leaf length, as well as a suitable ratio of leaf width to leaf length (Figure 1). Thus, we speculated that ‘Xiang shuomi’ may possess heightened photosynthetic efficiency and produce bigger fruits. The ‘Xiang shuomi’ pear, a new cultivar arising from a bud mutation of the ‘Bartlett’ pear, should be a superior novel pear variety, suitable for wider propagation.
With the advancement of high-throughput technology, an increasing number of studies have employed transcriptomics, metabolomics and proteomics to unravel the candidate mechanisms and genes. Recently, the release and sharing of the pear proteome data fueled the investigation of woody plants at the protein level [45]. In our study, transcriptomics and metabolomics were also carried out, and the result revealed that there were 991 up-regulated and 288 down-regulated genes in YB compared to MB (Figure 2a). These DEGs contributed significantly to the enlarged leaves and fruit of ‘Xiang shuomi’. Actually, many genes involved in transcription factors, signal transduction, auxin synthesis and transport, cellulose synthesis, GA signaling and mitochondrial membrane proteins have been confirmed to regulate leaf and fruit size [21,23,26,46]. However, most of these studies have focused on grain crops or vegetables, with limited research on fruit trees. In line with previous studies, the GO enrichment analysis in this research showed that the DEGs related to energy metabolism, including the mitochondrial oxoglutarate dehydrogenase complex, oxoglutarate dehydrogenase complex, oxoglutarate dehydrogenase complex, ADP binding and mitochondrial membrane, were enriched. Additionally, some other DEGs involved in the signaling and metabolic pathway of phytohormones such as GA (gibberellin catabolic process), JA (regulation of JA-mediated signaling pathway) and ABA (9-cis-expoxycarotenoid dioxygenase activity) showed increased expressions in ‘Xiang shuomi’ (Figure 3a).
Different from previous studies, our research identified an enrichment of genes associated with the flavonoid biosynthetic process (Figure 3a), indicating the crucial role this process might play in regulating leaf and fruit size. This notion was further reinforced by the GSEA of flavonoid biosynthesis (Figure 3b), which demonstrated that most genes within this gene set showed up-regulated expression in ‘Xiang shuomi’ (Figure 3c). Subsequent metabolome analysis unveiled a significant enrichment of flavonoid biosynthesis at the metabolite level as well (Figure 4c). Moreover, it was the sole process co-enriched in an integrative analysis of the metabolome and transcriptome (Figure 5). Based on these findings, we can confidently conclude that the flavonoid biosynthetic process indeed makes a substantial contribution to the enlargement of leaf and fruit size.
As is universally acknowledged, flavonoids constitute a series of secondary metabolites that play important roles in plants, performing diverse functions [47]. Numerous studies have highlighted the significance of flavonoids in protecting plants against abiotic and biotic stresses [48,49,50]. More importantly, flavonoid compounds, including anthocyanins, chalcones, aurones, flavonols and flavones, serve as vital sources of pigments, imparting plants with vibrant hues [47]. The existing research on flavonoids in pear fruits has mainly focused on their role in affecting fruit coloration, such as ‘Red Bartlett’, ‘Red Zaosu’, ‘Red D’Anjou’, ‘Autumn Red’ and so on [29,51,52]. Several MYB transcription factors, PuMYB110a, PyMYB10, and PpMYB17, have been demonstrated to regulate the accumulation of anthocyanin in pear fruits [33,34,35]. Nevertheless, the results in this study opened a novel direction. Indeed, it has already been proven that secondary metabolites can also contribute to fruit development. For instance, transgenic tomatoes have been engineered to accumulate glycinebetaine (GB), an effective protectant shielding plants against abiotic stress and also enabling the production of enlarged flowers and fruits [53]. Further investigation found that the transgenic tomatoes had higher photosynthetic rates, assimilate accumulation, leaf chlorophyll contents and altered plant hormone levels, indicating that GB stimulated plant growth indirectly [33]. In our study, the ‘Xiang shuomi’ pear was found to accumulate four metabolites of flavonoid biosynthesis, galangin, chlorogenic acid, luteolin and catechin (Figure 6). Therefore, we hypothesized that the flavonoid biosynthetic pathway explored in this research may also indirectly promote the development of leaves and fruits in pears.
Auxin is known to act as a key regulator of cell development in plants [54]. Meanwhile, the flavonoid compounds were found to function as regulators of auxin transport, influencing plant growth and development through regulating auxin homeostasis and signaling pathways [55]. For example, flavonoids were proven to inhibit the growth of primary roots while promoting the development of lateral roots in sorghum [56]. In maize, a specific flavonol known as quercetin was shown to modulate the basipetal transport of auxin [57]. Further research revealed that the flavonol was able to affect auxin transportation to regulate plant growth by changing the polarity of the auxin transporter PIN2 [58]. Therefore, flavonoid biosynthesis and auxin affect cell division and cell polarity via cellular signaling mechanisms. Our transcriptome analysis also revealed the distinct expression profiles of genes associated with auxin, including eight genes encoding AUX/IAA (pycom15g15080), GH3 (pycom05g09190 and pycom11g20410) and SAUR (pycom05g04410, pycom05g10840, pycom10g04730, pycom11g11850 and pycom13g10810) in ‘Xiang shuomi’ and ‘Bartlett’ pears. These findings indicated that alterations had occurred in both flavonoid biosynthesis and auxin signaling in ‘Xiang shuomi’. In alignment with previous research, our research suggested that the flavonoids served as a mediator in regulating the leaf and fruit development, as well as auxin biosynthesis, transport or signaling in pears.
Notably, the crosstalk between auxin and flavonoid is complicated, and auxin in turn is able to regulate flavonoid biosynthesis through complex transcriptional networks [59]. In apples, the auxin response factors MdARF2 and MdARF5-1 were proven to regulate anthocyanin biosynthesis negatively [60]. Similarly, the SlMYB72 protein not only can interact with SlARF4 but also target the chalcone synthase (CHS) gene, regulating flavonoid biosynthesis in tomatoes [61]. CHS, as the gatekeeper of flavonoid biosynthesis, catalyzes the initial step in the flavonoid biosynthetic pathway [43]. In our research, two genes (pycom420g00730 and pycom13g10200) encoding CHS increased their expressions in the ‘Xiang shuomi’ pear (Figure 6). Hence, this raised another possibility that it was the changes in auxin signaling that induced the accumulation of the flavonoid in the ‘Xiang shuomi’ pear. Meanwhile, the genes of HCT (pycom09g14560), CHI (pycom07g17740), LAR (pycom06g18890) and CYP75B1 (pycom06g17760) all showed increased expressions in ‘Xiang shuomi’ (Figure 6). Therefore, many more studies are required in the future to confirm the roles of the identified genes and metabolites in this research in regulating leaf and fruit size. In addition, whether these genes were also regulated by auxin signaling remains to be explored to reveal the molecular mechanisms underlying flavonoid biosynthesis, plant growth and auxin signaling.
5. Conclusions
‘Xiang shuomi’ is a new pear cultivar coming from a bud sport of ‘Bartlett’, characterized by larger fruits and leaves. This study dissected the regulatory mechanisms underlying the enhanced leaf and fruit size in the ‘Xiang shuomi’ pear by employing transcriptome and metabolome analysis as well as the integrative analysis of both. We identified a total of 1279 differentially expressed genes (DEGs) and 412 differentially abundant metabolites (DAMs) through transcriptome and metabolome profiling. The GO enrichment analysis of the DEGs identified a significant enrichment of genes related to the flavonoid biosynthetic process, which was reconfirmed by the GSEA of flavonoid biosynthesis. The integrated transcriptome and metabolome analysis also underscored the crucial role of the flavonoid biosynthetic process in contributing to the increased leaf and fruit size in the ‘Xiang shuomi’ pear. In addition, the expressions of genes encoding key components of auxin signaling and enzymes of flavonoid biosynthesis, including AUX/IAA, GH3, SAUR, CHS, CHI, HCT, LAR and CYP75B1, all changed in the ‘Xiang shuomi’ pear. Further investigation of these pivotal genes holds promise for uncovering the intricate relationships between flavonoids, auxin signaling and plant growth and development. This research offers plenty of data for exploring another regulatory mechanism underlying leaf and fruit size and identified potential genes and metabolites for high-yield pear breeding programs in the future.
Supplementary Materials
The following supporting information can be downloaded at https://www.mdpi.com/article/10.3390/horticulturae11020215/s1, Figure S1: The numbers of identified metabolites in different levels; Figure S2: KEGG enrichment analysis of DAMs. The red arrow indicates the biosynthesis of secondary metabolites, the blue arrow stands for amino acid metabolism and the black arrow represents carbohydrate metabolism; Table S1: Overview of the sequencing data; Table S2: The 412 Differentially Abundant Metabolites in YB.
Author Contributions
X.T. and F.J. planned and designed the experiments. Q.L., F.J., Y.W., J.L. and Q.Y. performed the experiments. Y.W. and F.J. analyzed the data. X.T. and F.J. wrote the manuscript. All authors have read and agreed to the published version of the manuscript.
Funding
This work was supported by the Earmarked Fund for China Agriculture Research System (CARS-28).
Data Availability Statement
All raw data of the RNA-seq supporting this study were deposited in the NCBI Sequence Read Archive with the ID number PRJNA1203066.
Conflicts of Interest
The authors declare no conflicts of interest.
References
- Swinnen, G.; Mauxion, J.P.; Baekelandt, A.; De Clercq, R.; Van Doorsselaere, J.; Inzé, D.; Gonzalez, N.; Goossens, A.; Pauwels, L. SlKIX8 and SlKIX9 are negative regulators of leaf and fruit growth in tomato. Plant Physiol. 2022, 188, 382–396. [Google Scholar] [CrossRef]
- Vercruysse, J.; Baekelandt, A.; Gonzalez, N.; Inzé, D. Molecular networks regulating cell division during Arabidopsis leaf growth. J. Exp. Bot. 2020, 71, 2365–2378. [Google Scholar] [CrossRef] [PubMed]
- Tsukaya, H. Mechanism of leaf-shape determination. Annu. Rev. Plant Biol. 2006, 57, 477–496. [Google Scholar] [CrossRef]
- Liu, X.; Chen, J.; Zhang, X. Genetic regulation of shoot architecture in cucumber. Hortic. Res. 2021, 8, 143. [Google Scholar] [CrossRef] [PubMed]
- Baekelandt, A.; Pauwels, L.; Wang, Z.; Li, N.; De Milde, L.; Natran, A.; Vermeersch, M.; Li, Y.; Goossens, A.; Inzé, D.; et al. Arabidopsis Leaf Flatness Is Regulated by PPD2 and NINJA Through Repression of CYCLIN D3 Genes. Plant Physiol. 2018, 178, 217–232. [Google Scholar] [CrossRef] [PubMed]
- Gonzalez, N.; Pauwels, L.; Baekelandt, A.; De Milde, L.; Van Leene, J.; Besbrugge, N.; Heyndrickx, K.S.; Cuéllar Pérez, A.; Durand, A.N.; De Clercq, R.; et al. A Repressor Protein Complex Regulates Leaf Growth in Arabidopsis. Plant Cell 2015, 27, 2273–2287. [Google Scholar] [CrossRef]
- Wang, Z.; Li, N.; Jiang, S.; Gonzalez, N.; Huang, X.; Wang, Y.; Inzé, D.; Li, Y. SCF(SAP) controls organ size by targeting PPD proteins for degradation in Arabidopsis thaliana. Nat. Commun. 2016, 7, 11192. [Google Scholar] [CrossRef]
- Ge, L.; Yu, J.; Wang, H.; Luth, D.; Bai, G.; Wang, K.; Chen, R. Increasing seed size and quality by manipulating BIG SEEDS1 in legume species. Proc. Natl. Acad. Sci. USA 2016, 113, 12414–12419. [Google Scholar] [CrossRef] [PubMed]
- Li, X.; Liu, W.; Zhuang, L.; Zhu, Y.; Wang, F.; Chen, T.; Yang, J.; Ambrose, M.; Hu, Z.; Weller, J.L.; et al. BIGGER ORGANS and ELEPHANT EAR-LIKE LEAF1 control organ size and floral organ internal asymmetry in pea. J. Exp. Bot. 2019, 70, 179–191. [Google Scholar] [CrossRef] [PubMed]
- Yang, L.; Liu, H.; Zhao, J.; Pan, Y.; Cheng, S.; Lietzow, C.D.; Wen, C.; Zhang, X.; Weng, Y. LITTLELEAF (LL) encodes a WD40 repeat domain-containing protein associated with organ size variation in cucumber. Plant J. 2018, 95, 834–847. [Google Scholar] [CrossRef]
- Omidbakhshfard, M.A.; Proost, S.; Fujikura, U.; Mueller-Roeber, B. Growth-Regulating Factors (GRFs): A Small Transcription Factor Family with Important Functions in Plant Biology. Mol. Plant 2015, 8, 998–1010. [Google Scholar] [CrossRef]
- van der Knaap, E.; Kim, J.H.; Kende, H. A novel gibberellin-induced gene from rice and its potential regulatory role in stem growth. Plant Physiol. 2000, 122, 695–704. [Google Scholar] [CrossRef] [PubMed]
- Wang, J.; Zhou, H.; Zhao, Y.; Sun, P.; Tang, F.; Song, X.; Lu, M.Z. Characterization of poplar growth-regulating factors and analysis of their function in leaf size control. BMC Plant Biol. 2020, 20, 509. [Google Scholar] [CrossRef]
- Wang, F.; Qiu, N.; Ding, Q.; Li, J.; Zhang, Y.; Li, H.; Gao, J. Genome-wide identification and analysis of the growth-regulating factor family in Chinese cabbage (Brassica rapa L. ssp. pekinensis). BMC Genom. 2014, 15, 807. [Google Scholar] [CrossRef] [PubMed]
- Cao, Y.; Han, Y.; Jin, Q.; Lin, Y.; Cai, Y. Comparative Genomic Analysis of the GRF Genes in Chinese Pear (Pyrus bretschneideri Rehd), Poplar (Populous), Grape (Vitis vinifera), Arabidopsis and Rice (Oryza sativa). Front. Plant Sci. 2016, 7, 1750. [Google Scholar] [CrossRef]
- Zhang, J.; Li, Z.; Jin, J.; Xie, X.; Zhang, H.; Chen, Q.; Luo, Z.; Yang, J. Genome-wide identification and analysis of the growth-regulating factor family in tobacco (Nicotiana tabacum). Gene 2018, 639, 117–127. [Google Scholar] [CrossRef]
- Liu, X.; Guo, L.X.; Jin, L.F.; Liu, Y.Z.; Liu, T.; Fan, Y.H.; Peng, S.A. Identification and transcript profiles of citrus growth-regulating factor genes involved in the regulation of leaf and fruit development. Mol. Biol. Rep. 2016, 43, 1059–1067. [Google Scholar] [CrossRef] [PubMed]
- Kim, J.H.; Choi, D.; Kende, H. The AtGRF family of putative transcription factors is involved in leaf and cotyledon growth in Arabidopsis. Plant J. 2003, 36, 94–104. [Google Scholar] [CrossRef]
- Wu, L.; Zhang, D.; Xue, M.; Qian, J.; He, Y.; Wang, S. Overexpression of the maize GRF10, an endogenous truncated growth-regulating factor protein, leads to reduction in leaf size and plant height. J. Integr. Plant Biol. 2014, 56, 1053–1063. [Google Scholar] [CrossRef] [PubMed]
- Kim, J.H.; Tsukaya, H. Regulation of plant growth and development by the GROWTH-REGULATING FACTOR and GRF-INTERACTING FACTOR duo. J. Exp. Bot. 2015, 66, 6093–6107. [Google Scholar] [CrossRef]
- Wen, Y.; Wu, K.; Chai, B.; Fang, Y.; Hu, P.; Tan, Y.; Wang, Y.; Wu, H.; Wang, J.; Zhu, L.; et al. NLG1, encoding a mitochondrial membrane protein, controls leaf and grain development in rice. BMC Plant Biol. 2023, 23, 418. [Google Scholar] [CrossRef]
- Chen, K.; Guo, T.; Li, X.M.; Yang, Y.B.; Dong, N.Q.; Shi, C.L.; Ye, W.W.; Shan, J.X.; Lin, H.X. NAL8 encodes a prohibitin that contributes to leaf and spikelet development by regulating mitochondria and chloroplasts stability in rice. BMC Plant Biol. 2019, 19, 395. [Google Scholar] [CrossRef] [PubMed]
- Schruff, M.C.; Spielman, M.; Tiwari, S.; Adams, S.; Fenby, N.; Scott, R.J. The AUXIN RESPONSE FACTOR 2 gene of Arabidopsis links auxin signalling, cell division, and the size of seeds and other organs. Development 2006, 133, 251–261. [Google Scholar] [CrossRef] [PubMed]
- Aya, K.; Hobo, T.; Sato-Izawa, K.; Ueguchi-Tanaka, M.; Kitano, H.; Matsuoka, M. A novel AP2-type transcription factor, SMALL ORGAN SIZE1, controls organ size downstream of an auxin signaling pathway. Plant Cell Physiol. 2014, 55, 897–912. [Google Scholar] [CrossRef] [PubMed]
- Hu, Y.; Xie, Q.; Chua, N.H. The Arabidopsis auxin-inducible gene ARGOS controls lateral organ size. Plant Cell 2003, 15, 1951–1961. [Google Scholar] [CrossRef] [PubMed]
- Chen, J.; Liu, L.; Chen, G.; Wang, S.; Liu, Y.; Zhang, Z.; Li, H.; Wang, L.; Zhou, Z.; Zhao, J.; et al. CsRAXs negatively regulate leaf size and fruiting ability through auxin glycosylation in cucumber. J. Integr. Plant Biol. 2024, 66, 1024–1037. [Google Scholar] [CrossRef]
- Yue, Z.; Wang, Z.; Yao, Y.; Liang, Y.; Li, J.; Yin, K.; Li, R.; Li, Y.; Ouyang, Y.; Xiong, L.; et al. Variation in WIDTH OF LEAF AND GRAIN contributes to grain and leaf size by controlling LARGE2 stability in rice. Plant Cell 2024, 36, 3201–3218. [Google Scholar] [CrossRef]
- Hong, S.Y.; Lansky, E.; Kang, S.S.; Yang, M. A review of pears (Pyrus spp.), ancient functional food for modern times. BMC Complement. Med. Ther. 2021, 21, 219. [Google Scholar] [CrossRef] [PubMed]
- Dai, X.; Li, Q.; Jiang, F.; Song, Z.; Tang, X.; Su, S.; Yao, R.; Yang, H.; Yang, Y.; Zhang, H. Transcriptome analysis of branches reveals candidate genes involved in anthocyanin biosynthesis of ’Red Bartlett’ pear (Pyrus communis L.). Sci. Hortic. 2022, 305, 111392. [Google Scholar] [CrossRef]
- Wang, Z.; Du, H.; Zhai, R.; Song, L.; Ma, F.; Xu, L. Transcriptome Analysis Reveals Candidate Genes Related to Color Fading of ’Red Bartlett’ (Pyrus communis L.). Front. Plant Sci. 2017, 8, 455. [Google Scholar] [CrossRef]
- Zheng, J.; Wu, H.; Zhu, H.; Huang, C.; Liu, C.; Chang, Y.; Kong, Z.; Zhou, Z.; Wang, G.; Lin, Y.; et al. Determining factors, regulation system, and domestication of anthocyanin biosynthesis in rice leaves. New Phytol. 2019, 223, 705–721. [Google Scholar] [CrossRef]
- Ni, J.; Bai, S.; Zhao, Y.; Qian, M.; Tao, R.; Yin, L.; Gao, L.; Teng, Y. Ethylene response factors Pp4ERF24 and Pp12ERF96 regulate blue light-induced anthocyanin biosynthesis in ’Red Zaosu’ pear fruits by interacting with MYB114. Plant Mol. Biol. 2019, 99, 67–78. [Google Scholar] [CrossRef] [PubMed]
- Liu, W.; Wei, Y.; Sha, S.; Xu, Y.; Li, H.; Yuan, H.; Wang, A. The mechanisms underpinning anthocyanin accumulation in a red-skinned bud sport in pear (Pyrus ussuriensis). Plant Cell Rep. 2023, 42, 1089–1105. [Google Scholar] [CrossRef] [PubMed]
- Premathilake, A.T.; Ni, J.; Bai, S.; Tao, R.; Ahmad, M.; Teng, Y. R2R3-MYB transcription factor PpMYB17 positively regulates flavonoid biosynthesis in pear fruit. Planta 2020, 252, 59. [Google Scholar] [CrossRef] [PubMed]
- Yao, G.; Gou, S.; Zhong, T.; Wei, S.; An, X.; Sun, H.; Sun, C.; Hu, K.; Zhang, H. Persulfidation of transcription factor MYB10 inhibits anthocyanin synthesis in red-skinned pear. Plant Physiol. 2023, 192, 2185–2202. [Google Scholar] [CrossRef]
- Zhang, L.; Wang, L.; Fang, Y.; Gao, Y.; Yang, S.; Su, J.; Ni, J.; Teng, Y.; Bai, S. Phosphorylated transcription factor PuHB40 mediates ROS-dependent anthocyanin biosynthesis in pear exposed to high light. Plant Cell 2024, 36, 3562–3583. [Google Scholar] [CrossRef]
- Xie, M.; Huang, Y.; Zhang, Y.; Wang, X.; Yang, H.; Yu, O.; Dai, W.; Fang, C. Transcriptome profiling of fruit development and maturation in Chinese white pear (Pyrus bretschneideri Rehd). BMC Genom. 2013, 14, 823. [Google Scholar] [CrossRef] [PubMed]
- Anders, S.; Pyl, P.T.; Huber, W. HTSeq--a Python framework to work with high-throughput sequencing data. Bioinformatics 2015, 31, 166–169. [Google Scholar] [CrossRef] [PubMed]
- Kim, D.; Langmead, B.; Salzberg, S.L. HISAT: A fast spliced aligner with low memory requirements. Nat. Methods 2015, 12, 357–360. [Google Scholar] [CrossRef]
- Roberts, A.; Trapnell, C.; Donaghey, J.; Rinn, J.L.; Pachter, L. Improving RNA-Seq expression estimates by correcting for fragment bias. Genome Biol. 2011, 12, R22. [Google Scholar] [CrossRef] [PubMed]
- Love, M.I.; Huber, W.; Anders, S. Moderated estimation of fold change and dispersion for RNA-seq data with DESeq2. Genome Biol. 2014, 15, 550. [Google Scholar] [CrossRef] [PubMed]
- Subramanian, A.; Tamayo, P.; Mootha, V.K.; Mukherjee, S.; Ebert, B.L.; Gillette, M.A.; Paulovich, A.; Pomeroy, S.L.; Golub, T.R.; Lander, E.S.; et al. Gene set enrichment analysis: A knowledge-based approach for interpreting genome-wide expression profiles. Proc. Natl. Acad. Sci. USA 2005, 102, 15545–15550. [Google Scholar] [CrossRef] [PubMed]
- Zhang, X.; Abrahan, C.; Colquhoun, T.A.; Liu, C.J. A Proteolytic Regulator Controlling Chalcone Synthase Stability and Flavonoid Biosynthesis in Arabidopsis. Plant Cell 2017, 29, 1157–1174. [Google Scholar] [CrossRef] [PubMed]
- Ort, D.R.; Merchant, S.S.; Alric, J.; Barkan, A.; Blankenship, R.E.; Bock, R.; Croce, R.; Hanson, M.R.; Hibberd, J.M.; Long, S.P.; et al. Redesigning photosynthesis to sustainably meet global food and bioenergy demand. Proc. Natl. Acad. Sci. USA 2015, 112, 8529–8536. [Google Scholar] [CrossRef] [PubMed]
- Wang, P.; Wu, X.; Shi, Z.; Tao, S.; Liu, Z.; Qi, K.; Xie, Z.; Qiao, X.; Gu, C.; Yin, H.; et al. A large-scale proteogenomic atlas of pear. Mol. Plant 2023, 16, 599–615. [Google Scholar] [CrossRef]
- Shani, E.; Hedden, P.; Sun, T.P. Highlights in gibberellin research: A tale of the dwarf and the slender. Plant Physiol. 2024, 195, 111–134. [Google Scholar] [CrossRef] [PubMed]
- Liu, W.; Feng, Y.; Yu, S.; Fan, Z.; Li, X.; Li, J.; Yin, H. The Flavonoid Biosynthesis Network in Plants. Int. J. Mol. Sci. 2021, 22, 12824. [Google Scholar] [CrossRef] [PubMed]
- Shen, Y.; Sun, T.; Pan, Q.; Anupol, N.; Chen, H.; Shi, J.; Liu, F.; Deqiang, D.; Wang, C.; Zhao, J.; et al. RrMYB5- and RrMYB10-regulated flavonoid biosynthesis plays a pivotal role in feedback loop responding to wounding and oxidation in Rosa rugosa. Plant Biotechnol. J. 2019, 17, 2078–2095. [Google Scholar] [CrossRef] [PubMed]
- Zhang, P.; Du, H.; Wang, J.; Pu, Y.; Yang, C.; Yan, R.; Yang, H.; Cheng, H.; Yu, D. Multiplex CRISPR/Cas9-mediated metabolic engineering increases soya bean isoflavone content and resistance to soya bean mosaic virus. Plant Biotechnol. J. 2020, 18, 1384–1395. [Google Scholar] [CrossRef] [PubMed]
- Ahmed, U.; Rao, M.J.; Qi, C.; Xie, Q.; Noushahi, H.A.; Yaseen, M.; Shi, X.; Zheng, B. Expression Profiling of Flavonoid Biosynthesis Genes and Secondary Metabolites Accumulation in Populus under Drought Stress. Molecules 2021, 26, 5546. [Google Scholar] [CrossRef]
- Yang, Y.N.; Yao, G.F.; Zheng, D.; Zhang, S.L.; Wang, C.; Zhang, M.Y.; Wu, J. Expression differences of anthocyanin biosynthesis genes reveal regulation patterns for red pear coloration. Plant Cell Rep. 2015, 34, 189–198. [Google Scholar] [CrossRef]
- Zhai, R.; Liu, X.T.; Feng, W.T.; Chen, S.S.; Xu, L.F.; Wang, Z.G.; Zhang, J.L.; Li, P.M.; Ma, F.W. Different biosynthesis patterns among flavonoid 3-glycosides with distinct effects on accumulation of other flavonoid metabolites in pears (Pyrus bretschneideri Rehd.). PLoS ONE 2014, 9, e91945. [Google Scholar] [CrossRef] [PubMed]
- Park, E.J.; Jeknić, Z.; Chen, T.H.; Murata, N. The codA transgene for glycinebetaine synthesis increases the size of flowers and fruits in tomato. Plant Biotechnol. J. 2007, 5, 422–430. [Google Scholar] [CrossRef]
- Pan, X.; Chen, J.; Yang, Z. Auxin regulation of cell polarity in plants. Curr. Opin. Plant Biol. 2015, 28, 144–153. [Google Scholar] [CrossRef] [PubMed]
- Hassan, S.; Mathesius, U. The role of flavonoids in root-rhizosphere signalling: Opportunities and challenges for improving plant-microbe interactions. J. Exp. Bot. 2012, 63, 3429–3444. [Google Scholar] [CrossRef]
- Franco, D.M.; Silva, E.M.; Saldanha, L.L.; Adachi, S.A.; Schley, T.R.; Rodrigues, T.M.; Dokkedal, A.L.; Nogueira, F.T.; Rolim de Almeida, L.F. Flavonoids modify root growth and modulate expression of SHORT-ROOT and HD-ZIP III. J. Plant Physiol. 2015, 188, 89–95. [Google Scholar] [CrossRef] [PubMed]
- Wang, Y.; Sun, H.; Wang, H.; Yang, X.; Xu, Y.; Yang, Z.; Xu, C.; Li, P. Integrating transcriptome, co-expression and QTL-seq analysis reveals that primary root growth in maize is regulated via flavonoid biosynthesis and auxin signal transduction. J. Exp. Bot. 2021, 72, 4773–4795. [Google Scholar] [CrossRef]
- Kuhn, B.M.; Nodzyński, T.; Errafi, S.; Bucher, R.; Gupta, S.; Aryal, B.; Dobrev, P.; Bigler, L.; Geisler, M.; Zažímalová, E.; et al. Flavonol-induced changes in PIN2 polarity and auxin transport in the Arabidopsis thaliana rol1-2 mutant require phosphatase activity. Sci. Rep. 2017, 7, 41906. [Google Scholar] [CrossRef]
- Lewis, D.R.; Ramirez, M.V.; Miller, N.D.; Vallabhaneni, P.; Ray, W.K.; Helm, R.F.; Winkel, B.S.; Muday, G.K. Auxin and ethylene induce flavonol accumulation through distinct transcriptional networks. Plant Physiol. 2011, 156, 144–164. [Google Scholar] [CrossRef]
- Li, H.L.; Liu, Z.Y.; Wang, X.N.; Han, Y.; You, C.X.; An, J.P. E3 ubiquitin ligases SINA4 and SINA11 regulate anthocyanin biosynthesis by targeting the IAA29-ARF5-1-ERF3 module in apple. Plant Cell Environ. 2023, 46, 3902–3918. [Google Scholar] [CrossRef] [PubMed]
- Wu, M.; Xu, X.; Hu, X.; Liu, Y.; Cao, H.; Chan, H.; Gong, Z.; Yuan, Y.; Luo, Y.; Feng, B.; et al. SlMYB72 Regulates the Metabolism of Chlorophylls, Carotenoids, and Flavonoids in Tomato Fruit. Plant Physiol. 2020, 183, 854–868. [Google Scholar] [CrossRef] [PubMed]
Disclaimer/Publisher’s Note: The statements, opinions and data contained in all publications are solely those of the individual author(s) and contributor(s) and not of MDPI and/or the editor(s). MDPI and/or the editor(s) disclaim responsibility for any injury to people or property resulting from any ideas, methods, instructions or products referred to in the content. |
© 2025 by the authors. Licensee MDPI, Basel, Switzerland. This article is an open access article distributed under the terms and conditions of the Creative Commons Attribution (CC BY) license (https://creativecommons.org/licenses/by/4.0/).