Article

Effects of Macronutrients on the Growth, Essential Oil Production, and Quality of Echinophora platyloba (DC.) in Natural Ecosystems

1
Department of Agronomy, Faculty of Agriculture, Shahrekord University, Shahrekord 115, Iran
2
Chemistry Interdisciplinary Project (ChIP) Research Center, School of Pharmacy, University of Camerino, 62032 Camerino, Italy
*
Authors to whom correspondence should be addressed.
Horticulturae 2025, 11(2), 185; https://doi.org/10.3390/horticulturae11020185
Submission received: 7 January 2025 / Revised: 5 February 2025 / Accepted: 7 February 2025 / Published: 8 February 2025

Abstract

:
Echinophora platyloba DC. (Apiaceae) is recognized for its important secondary metabolites and antifungal agents. To evaluate the effects of macronutrient fertilizers on the growth parameters and essential oils yield of E. platyloba, a study was conducted in 2018 at Shahrekord University, Iran. The treatments included the individual and combined application of nitrogen, phosphorus, and potassium, along with control groups. The results revealed that nitrogen application significantly influenced biomass accumulation in stems, leaves, and inflorescences, with phosphorus-treated plants showing a notable increase in leaf weight. Compared to a positive control, phosphorus increased the essential oil yield by 488%, while nitrogen enhanced biomass accumulation by 165%. The primary compounds identified included (E)-β-ocimene, (E)-sesquilavandolol, and β-pinene, with percentages ranging between 21.3–32.1%, 14.1–42.0%, and 2.0–8.8%, respectively. The levels of β-pinene, (E)-β-ocimene, γ-decalactone, and spathulenol were found to be higher in the phosphorus and potassium treatments than in nitrogen. In contrast, limonene, linalool, geraniol, and (E)-sesquilavandulol concentrations were greater in the nitrogen treatment compared with phosphorus and potassium treatments. In conclusion, phosphorus fertilization can substantially increase the essential oil yield in E. platyloba compared to other treatments, potentially enhancing production per unit area, which supports farmers’ income and helps prevent the degradation of this species in natural habitats.

1. Introduction

Iran’s varied climate and topography supports about 8200 species of vascular plants. Of these, approximately 2300 species are noted for their medicinal and aromatic characteristics. The use of these plants is increasing, thanks to their effectiveness in treating numerous health issues and their relatively mild side effects [1,2,3,4]. As a result, worldwide research efforts have increasingly focused on identifying new medicinal compounds and active ingredients from these plants rather than on their cultivation or domestication. Nonetheless, factors such as population growth, overharvesting, unregulated collection practices, excessive grazing, wildfires, and climate change have placed many of these species at risk of extinction [5,6].
Echinophora platyloba DC., a member of the Apiceae family, is native to Iran and is specifically found in the provinces of Kermanshah, Hamadan, and Lorestan [7]. In traditional Iranian medicine, E. platyloba is used as an antifungal agent to avert fungal contamination in dairy products and other foods. This traditional application has led to the assumption that E. platyloba possesses antifungal properties [8]. Furthermore, studies have recognized its anticancer and cytotoxic effects, linked to its high levels of monoterpenes, sesquiterpenes, and phytochemicals like betulinic acid and ursolic acid, which are recognized for inducing apoptosis [9].
The nutrients supplied during plant cultivation perform specific functions within their biological systems [10]. Nitrogen, an essential element of proteins and enzymes, is vital for the growth of plant tissues and the support of metabolic activities [11]. Potassium is crucial for the formation of starch, proteins, sugars, and pectin and plays an important role in managing the opening and closing of stomata [12]. Phosphorus is necessary for the Calvin cycle. It affects the degree of photophosphorylation and increases the synthesis of adenosine triphosphate, along with the ability to assimilate carbon dioxide, thereby enhancing photosynthetic efficiency. For instance, higher phosphorus levels lead to an elevated net photosynthesis rate in plants by boosting the functioning of key enzymes involved in the Calvin cycle and improving carbon dioxide assimilation [13].
Jiang et al. [14] indicated that the use of balanced fertilization led to the highest recorded measurements of the leaf area, stem diameter, and plant height in Chrysanthemum morifolium Ramat., at 38.5 cm2, 0.78 cm, and 82 cm, respectively. Conversely, the high-potassium treatment significantly improved the flower size and yield compared to balanced fertilization. Furthermore, chlorophyll concentration was enhanced under the high-potassium treatment. The research also revealed that the activity of peroxidase was affected by low low-phosphorus and -nitrogen treatments, while the high-potassium treatment increased the activity of phenylalanine aminolase, resulting in a higher level of flavonoids in C. morifolium. Additionally, low-phosphorus treatment was shown to enhance the accumulation of flavonoids [14,15].
The composition of essential oils can be improved by the nutrient quantity and availability [16,17,18]. Nitrogen is essential as a component of amino acids and enzymes, and its deficiency adversely affects terpenoid biosynthesis. This nutrient enhances the production of terpenoids by increasing the rate of electron transport and promoting photosynthesis in leaves [19]. The process of photosynthesis yields carbon substrates (such as pyruvate or glyceraldehyde-3-phosphate) and ATP required for isoprene synthesis. Moreover, nitrogen, in the form of NADPH, is vital for terpenoid biosynthesis [20].
Phosphorus aids terpenoid biosynthesis by raising the levels of pyrophosphate compounds, like DMAPP and IPP, which contain high-energy phosphate bonds [21]. The importance of phosphorus is clear in the production of terpenoid precursors via both the MEP pathway (glyceraldehyde phosphate and pyruvate) and the MVA pathway (acetyl-CoA, ATP, and NADPH). Furthermore, a phosphorus deficiency results in the decreased stability of the phospholipid bilayer of cell membranes, a situation addressed by isoprene emissions [22,23].
Moghaddam et al. [24] found that the E. platyloba seed essential oil contains a complex mix primarily made up of monoterpene hydrocarbons, accounting for 69.8% of the total mixture. The other components consist of oxygenated monoterpenes (6.7%), aromatic compounds (5.5%), sesquiterpene hydrocarbons (5.5%), and oxygenated sesquiterpenes (0.4%). In a separate study, the hydro-distillation method yielded a maximum extraction of E. platyloba essential oil at 1.12%. The principal compounds in the essential oil were (E)-β-ocimene (47%), spathulenol (9.0%), β-myrcene (6.2%), limonene (5.4%), and α-pinene (4.6%) [25].
In the natural ecosystems of semi-arid regions, the lack of vegetation and elevated temperatures result in low organic matter content and alkaline soil pH. Consequently, nitrogen deficiency, reduced phosphorus absorption capacity, and potassium leaching are prevalent in most soils. As a result, nitrogen, phosphorus, and potassium emerge as critical micronutrients that restrict plant growth. This study aims to evaluate the hypothesis that the application of essential macronutrients can enhance plant growth and prevent extinction in natural ecosystems by increasing production per unit area. Given that no previous research has focused on improving the growth of this plant, the primary objective is to maximize the yield and effectiveness of E. platyloba essential oil through the application of NPK fertilizers in semi-natural environments. The primary goal was to maximize the yield and effectiveness of E. platyloba essential oil through the use of NPK fertilizers in semi-natural environments.

2. Materials and Methods

2.1. Characteristics of the Experimental Site

This study was conducted in 2018 at Shahrekord University, situated at a latitude of 32°21′ north and a longitude of 50°49′ east, with an elevation of 2116 m a.s.l. The climate conditions at the experimental site are categorized as mild and cold, with hot and dry summers. Historical meteorological data over 30 years show an average annual precipitation of 320 mm. The average temperature and rainfall during the growing season for the area, obtained from the official meteorological website of the Chaharmahal-O-Bakhtiari province, are presented in Table 1. According to the Emberger classification, this area is characterized as arid, while the Gossen method categorizes it as a cold steppe climate. The peak annual precipitation occurs during the winter months and does not align with the growing season of E. platyloba, resulting in unfavorable temporal distribution conditions (Table 1). The soil in this region is classified taxonomically as Calcixerepts Typic. Before the initiation of the experiment, a composite soil sample was collected from a depth of 0–30 cm, and after being air-dried in the laboratory and sieved through a 2 mm mesh, its properties were analyzed. The soil texture was identified as sandy loam, with a pH level of 8 and an electrical conductivity of 0.66 dS/m. The organic matter content was measured at 0.8%, while the nitrogen content was recorded at 0.05%. Additionally, the available phosphorus and potassium levels were found to be 6 and 182 mg/kg, respectively.

2.2. Specifications of the Experimental Design

The experimental design used was a completely randomized design (CRD) with four replications. The specific treatments applied in the experiment are listed in Table 2. The amount of fertilizer used in each treatment was determined based on the nutritional needs of plant species comparable to E. platyloba found in the area.

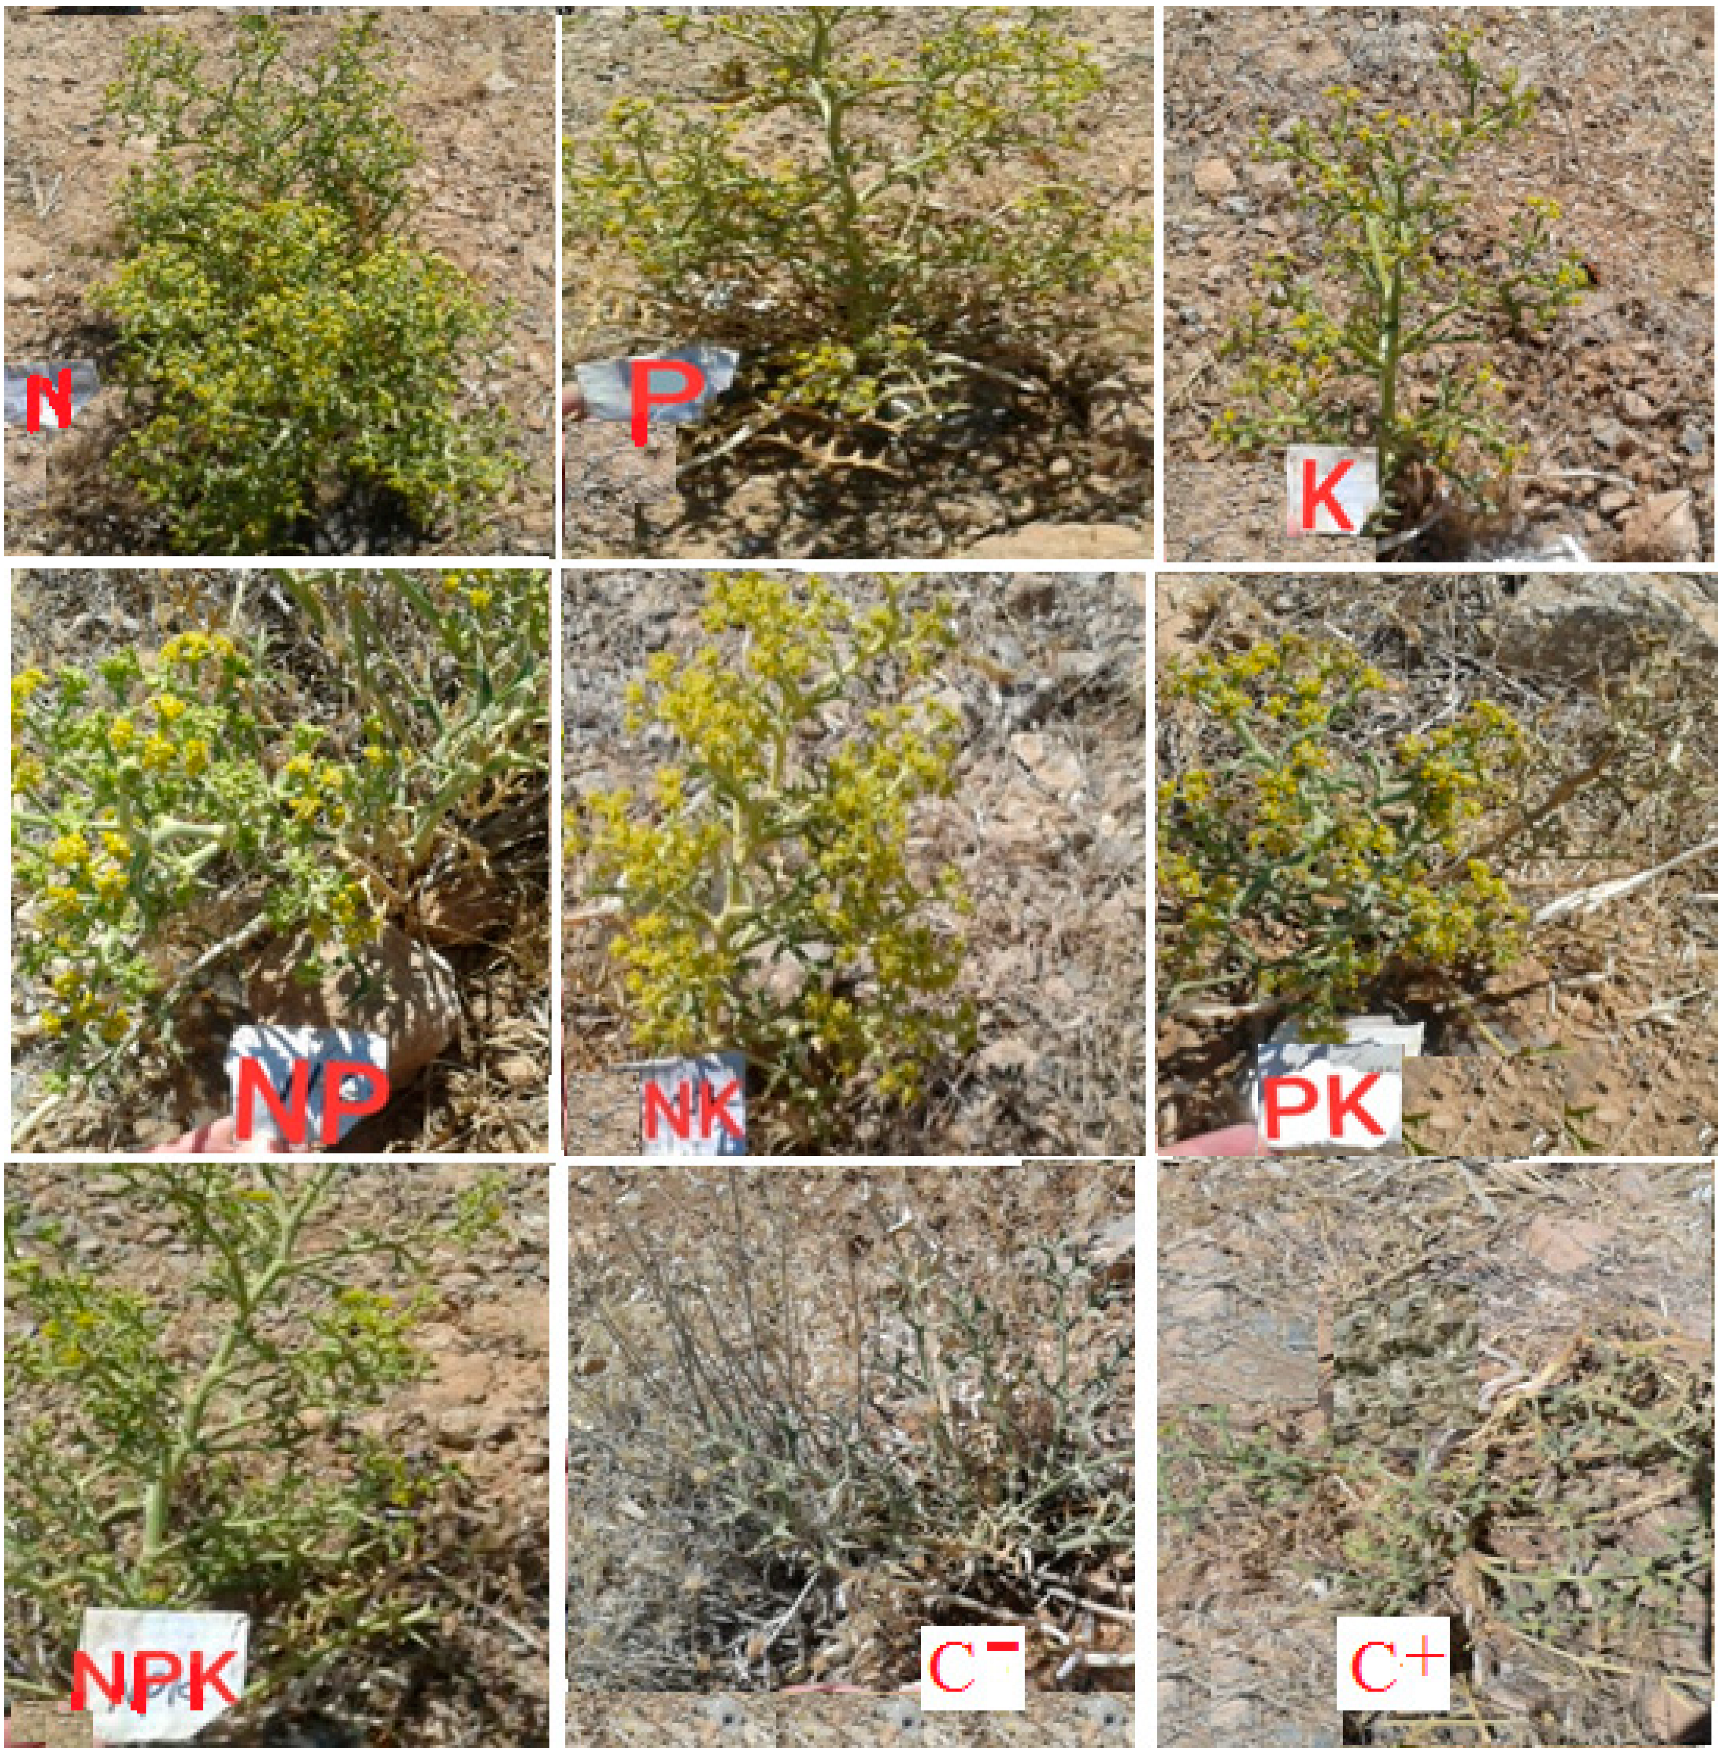
2.3. Experimental Operation

After soil sampling on 24 June, and coinciding with the beginning of plant growth, uniform plants of comparable size were randomly selected and labeled for assignment to the experimental units. The treatments were then applied to the soil near the plants. In total, 180 uniform plants were chosen, with 45 plants assigned to each replication and each treatment within each replication consisting of five randomly chosen plants.
On 27 June, the experimental treatments, as outlined in Table 2, were applied to the assigned plants. Nitrogen, phosphorus, and potassium were provided through urea, triple superphosphate, and potassium sulfate, respectively. Afterward, the plants were irrigated weekly until the end of the growth period. During the experimental period, various external characteristics, such as plant height and flowering dates, were recorded. Flowering began at the end of July (22 July), with the peak flowering occurring from mid-August to the end of August (10 August to 28 August).

2.4. Measurement of Attributes

During the peek of flowering, specifically from 1–3 September, various morphological and physiological traits were evaluated. These included the plant height, branch number, main stem diameter, flower number, inflorescence number, and leaf number. Additionally, fresh weights of leaves, stems, and inflorescences were recorded. After harvesting and measuring these characteristics, the aerial parts of the plants were separated and underwent a two-week drying process in the shade before being taken to the laboratory for weighing. The dry weights of the designated plant parts were determined using a digital scale and then ground into a fine powder. The essential oil content was assessed using the water distillation method after the aerial parts had been dried. For this process, 60 g of the dried plant material, adjusted for moisture content, was placed in the flask of a Clevenger apparatus, to which a sufficient amount of distilled water was added at a 1:10 ratio. The heat source beneath the flask was turned on to produce adequate heat for boiling the mixture. The duration of boiling was carefully monitored, lasting for a total of 4 h. The application of heat-elevated water vapor pressure aided the release of essential oil from the plant glands into the vapor phase. This vapor then moved to the condenser, where it condensed and formed essential oil droplets that separated from the water due to their lower density. The excess water was then drained through a connecting tube. After the apparatus cooled, the valve was opened to release the water, enabling the careful collection of the essential oil. After weighing the empty jars designated for sampling, the essential oils were poured into these jars, which were then weighed again. Observations were noted regarding the storage conditions, emphasizing the need to keep the jars in a dark environment and refrigerate them at temperatures below zero.
The determination of the essential yield was achieved by multiplying the aerial biomass (in g/plant) by the essential oil content (in %), and the result was expressed in milligrams per plant [17]. To analyze the compositions of the essential oils, the filled bottles were sent to the essential oils analysis laboratory associated with the Forestry and Pastures Organization of Iran.

2.5. Qualitative and Semi-Quantitative Analysis of Essential Oils Samples

An ultrafast gas chromatograph, specifically the Ultra Fast Module (UFM) model produced by Thermo Company in Italy, was utilized for this analysis. This instrument is integrated with a Chrom-Card A/D data processor and features a DB-5 capillary column, which is nonpolar and constructed from fused silica. The column measures 10 m in length, has a diameter of 0.1 mm, and possesses a stationary phase layer thickness of 0.4 μm, composed of 5% diphenyl and 95% methylpolysiloxane. The thermal programming of the column was set to range from 60 °C to 280 °C, with a heating rate of 40 °C per minute, followed by a hold at the final temperature for 3 min. The injection chamber (Injector) was maintained at 280 °C, and the detector employed was a Flame Ionization Detector (FID) operating at 290 °C. Helium served as the carrier gas, with a flow rate of 0.5 mL/min and a split ratio of 1:1000 [26,27]. Furthermore, The identification of essential oil compounds was conducted utilizing an Agilent 7890A gas chromatograph coupled with an Agilent 5975C quadrupole mass spectrometer, both manufactured in the United States. This system was fitted with a DB-5 column, which has a length of 30 m, an internal diameter of 0.25 mm, and a stationary phase thickness of 0.25 μm. The thermal programming of the column involved a temperature ramp from 60 °C to 220 °C at a rate of 3 °C per minute, followed by an increase to 260 °C at a rate of 20 °C per minute, and a final hold at this temperature for 3 min. The injection chamber was maintained at 260 °C, while the transfer line was set to 280 °C. Helium served as the carrier gas, flowing through the column at a velocity of 30.6 cm/s. The scan time was established at one second, with an ionization energy of 70 electron volts and a mass range scan spanning from 40 to 340 [27,28]. The identification of chemical constituents in the essential oil samples was accomplished by comparing their mass spectra with those in a computer database or known standards. Retention indices (RI) were determined by comparing the retention times of n-alkanes (C8-C24) under identical conditions. The identities of the chemical compositions were further validated using relative retention indices and literature references [29].

2.6. Statistical Analysis

The analysis of data was conducted utilizing SAS, Version 9.1. Mean values were compared, and significant differences were identified through the LSD test, applying a significance threshold of p < 0.05. Various parameters, including vegetative characteristics, flowering traits, the weight of aerial parts, and both the quantity and yield of essential oils, were evaluated with a sample of 20 plants (5 samples × 4 replications). After establishing the normality of the data, an analysis of variance was performed, utilizing a significance level of less than 5%. The data were analyzed according to a completely randomized design. A comparison of mean values was conducted, and significant differences were detected via the LSD test, utilizing a significance threshold of p < 0.05.

3. Results

3.1. Plant Height

Fertilization treatments had a significant effect on the plant height at the 1% probability level (Table 3). The height recorded in the positive control treatment exceeded 24% that of the negative control (Figure 1a). The N treatment resulted in the tallest plants, measuring 2.5 times more than the negative control, with P and NPK also increasing following treatments (Figure 1a).

3.2. Branch Number

The effect of macronutrient treatments on the number of branches per plant was statistically significant (Table 3). The branching status of plants subjected to various macronutrients is displayed in Figure 2. Fertilization enhanced the number of branches per plant by 79% to 207% relative to the positive control (Figure 1b). The highest branch counts per plant (from 22.2 to 18.2) were observed in the N and P treatments, with the NPK treatment ranking second (Figure 1b). In contrast, the lowest branch count (13) was noted in plants treated with PK (Figure 1b).

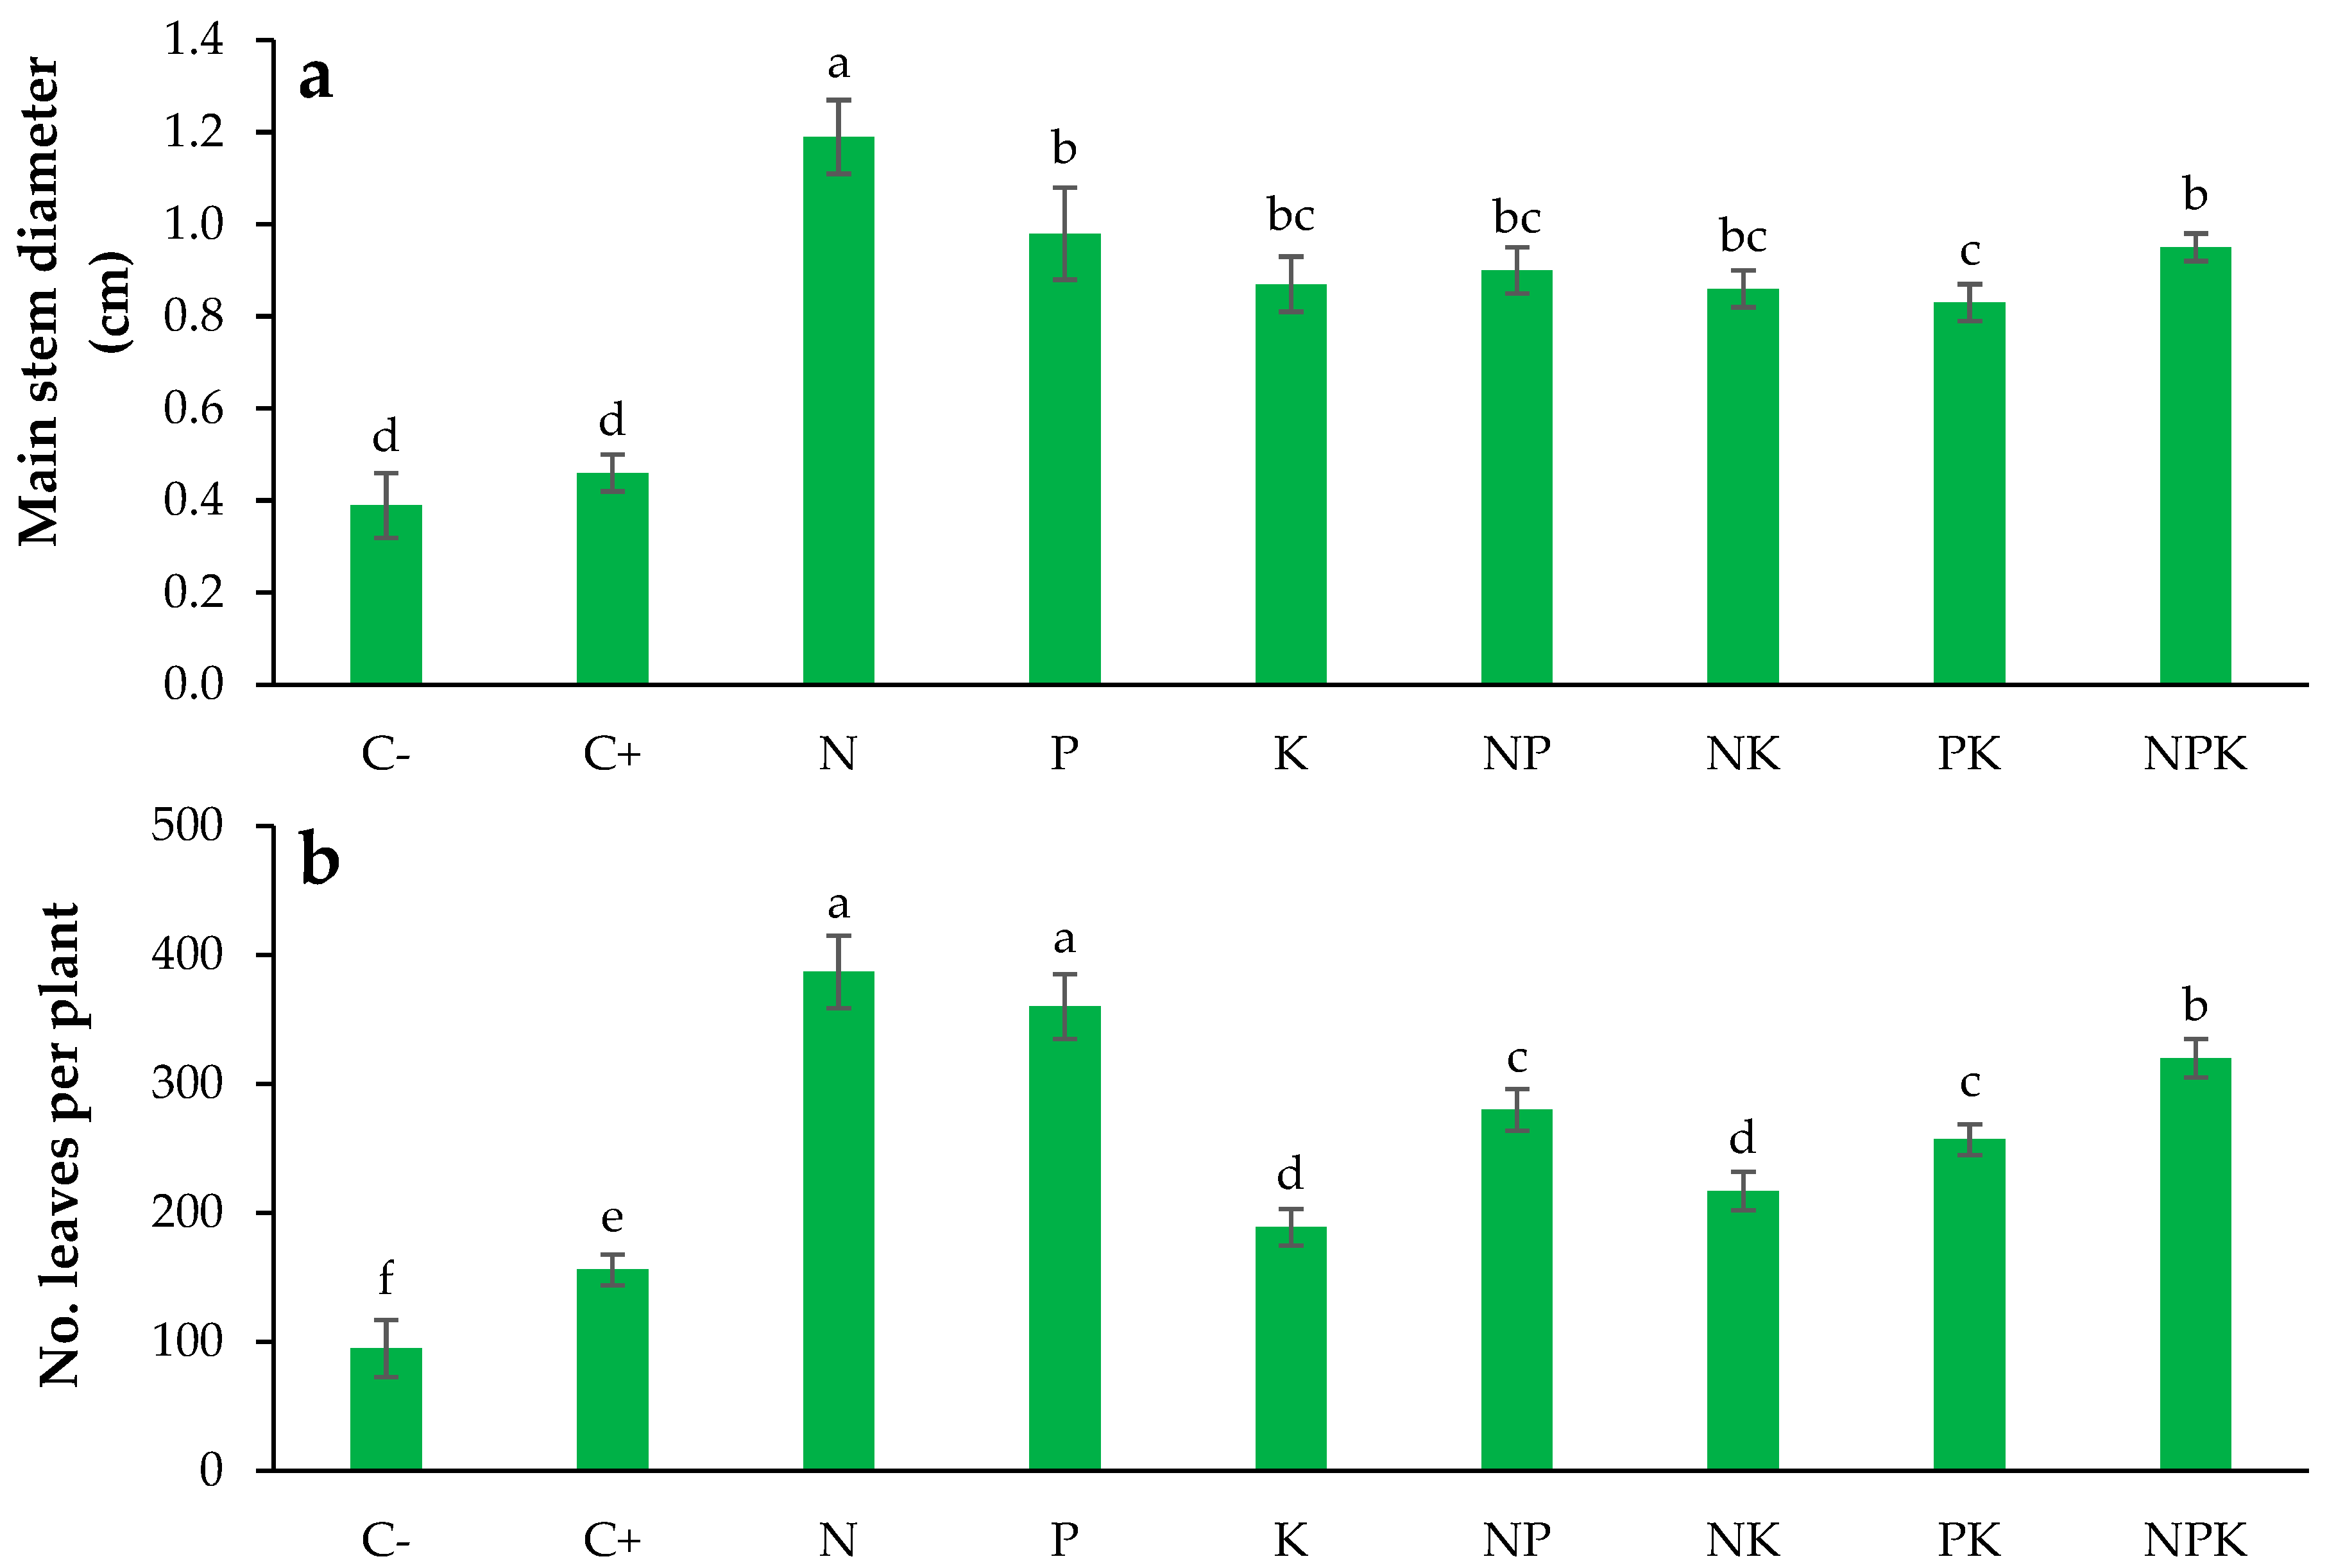
3.3. Main Stem Diameter

As shown in Table 3, the diameter of the main stem was significantly affected by fertilization treatments at the 1% probability level. The water supply did not significantly influence stem diameter (Figure 3a). The N treatment had the largest main stem diameter, which was 1.2 times the negative control, with P and NPK treatments following in size (Figure 3a). The smallest main stem diameter (0.83 cm) among fertilized plants was linked to the PK treatment (Figure 3a).

3.4. Leaf Number

Table 3 demonstrates the significant effect of macronutrient treatments on the number of leaves per plant. There was no significant difference between the N and P treatments, with both showing a higher leaf count than other treatments (378 and 360, respectively). The NPK treatment was ranked second in terms of leaf number (320) (Figure 3b). Furthermore, the leaf count for NP and PK treatments (280 and 257, respectively) was significantly greater than those for K and NK treatments (189 and 217, respectively) (Figure 3b).

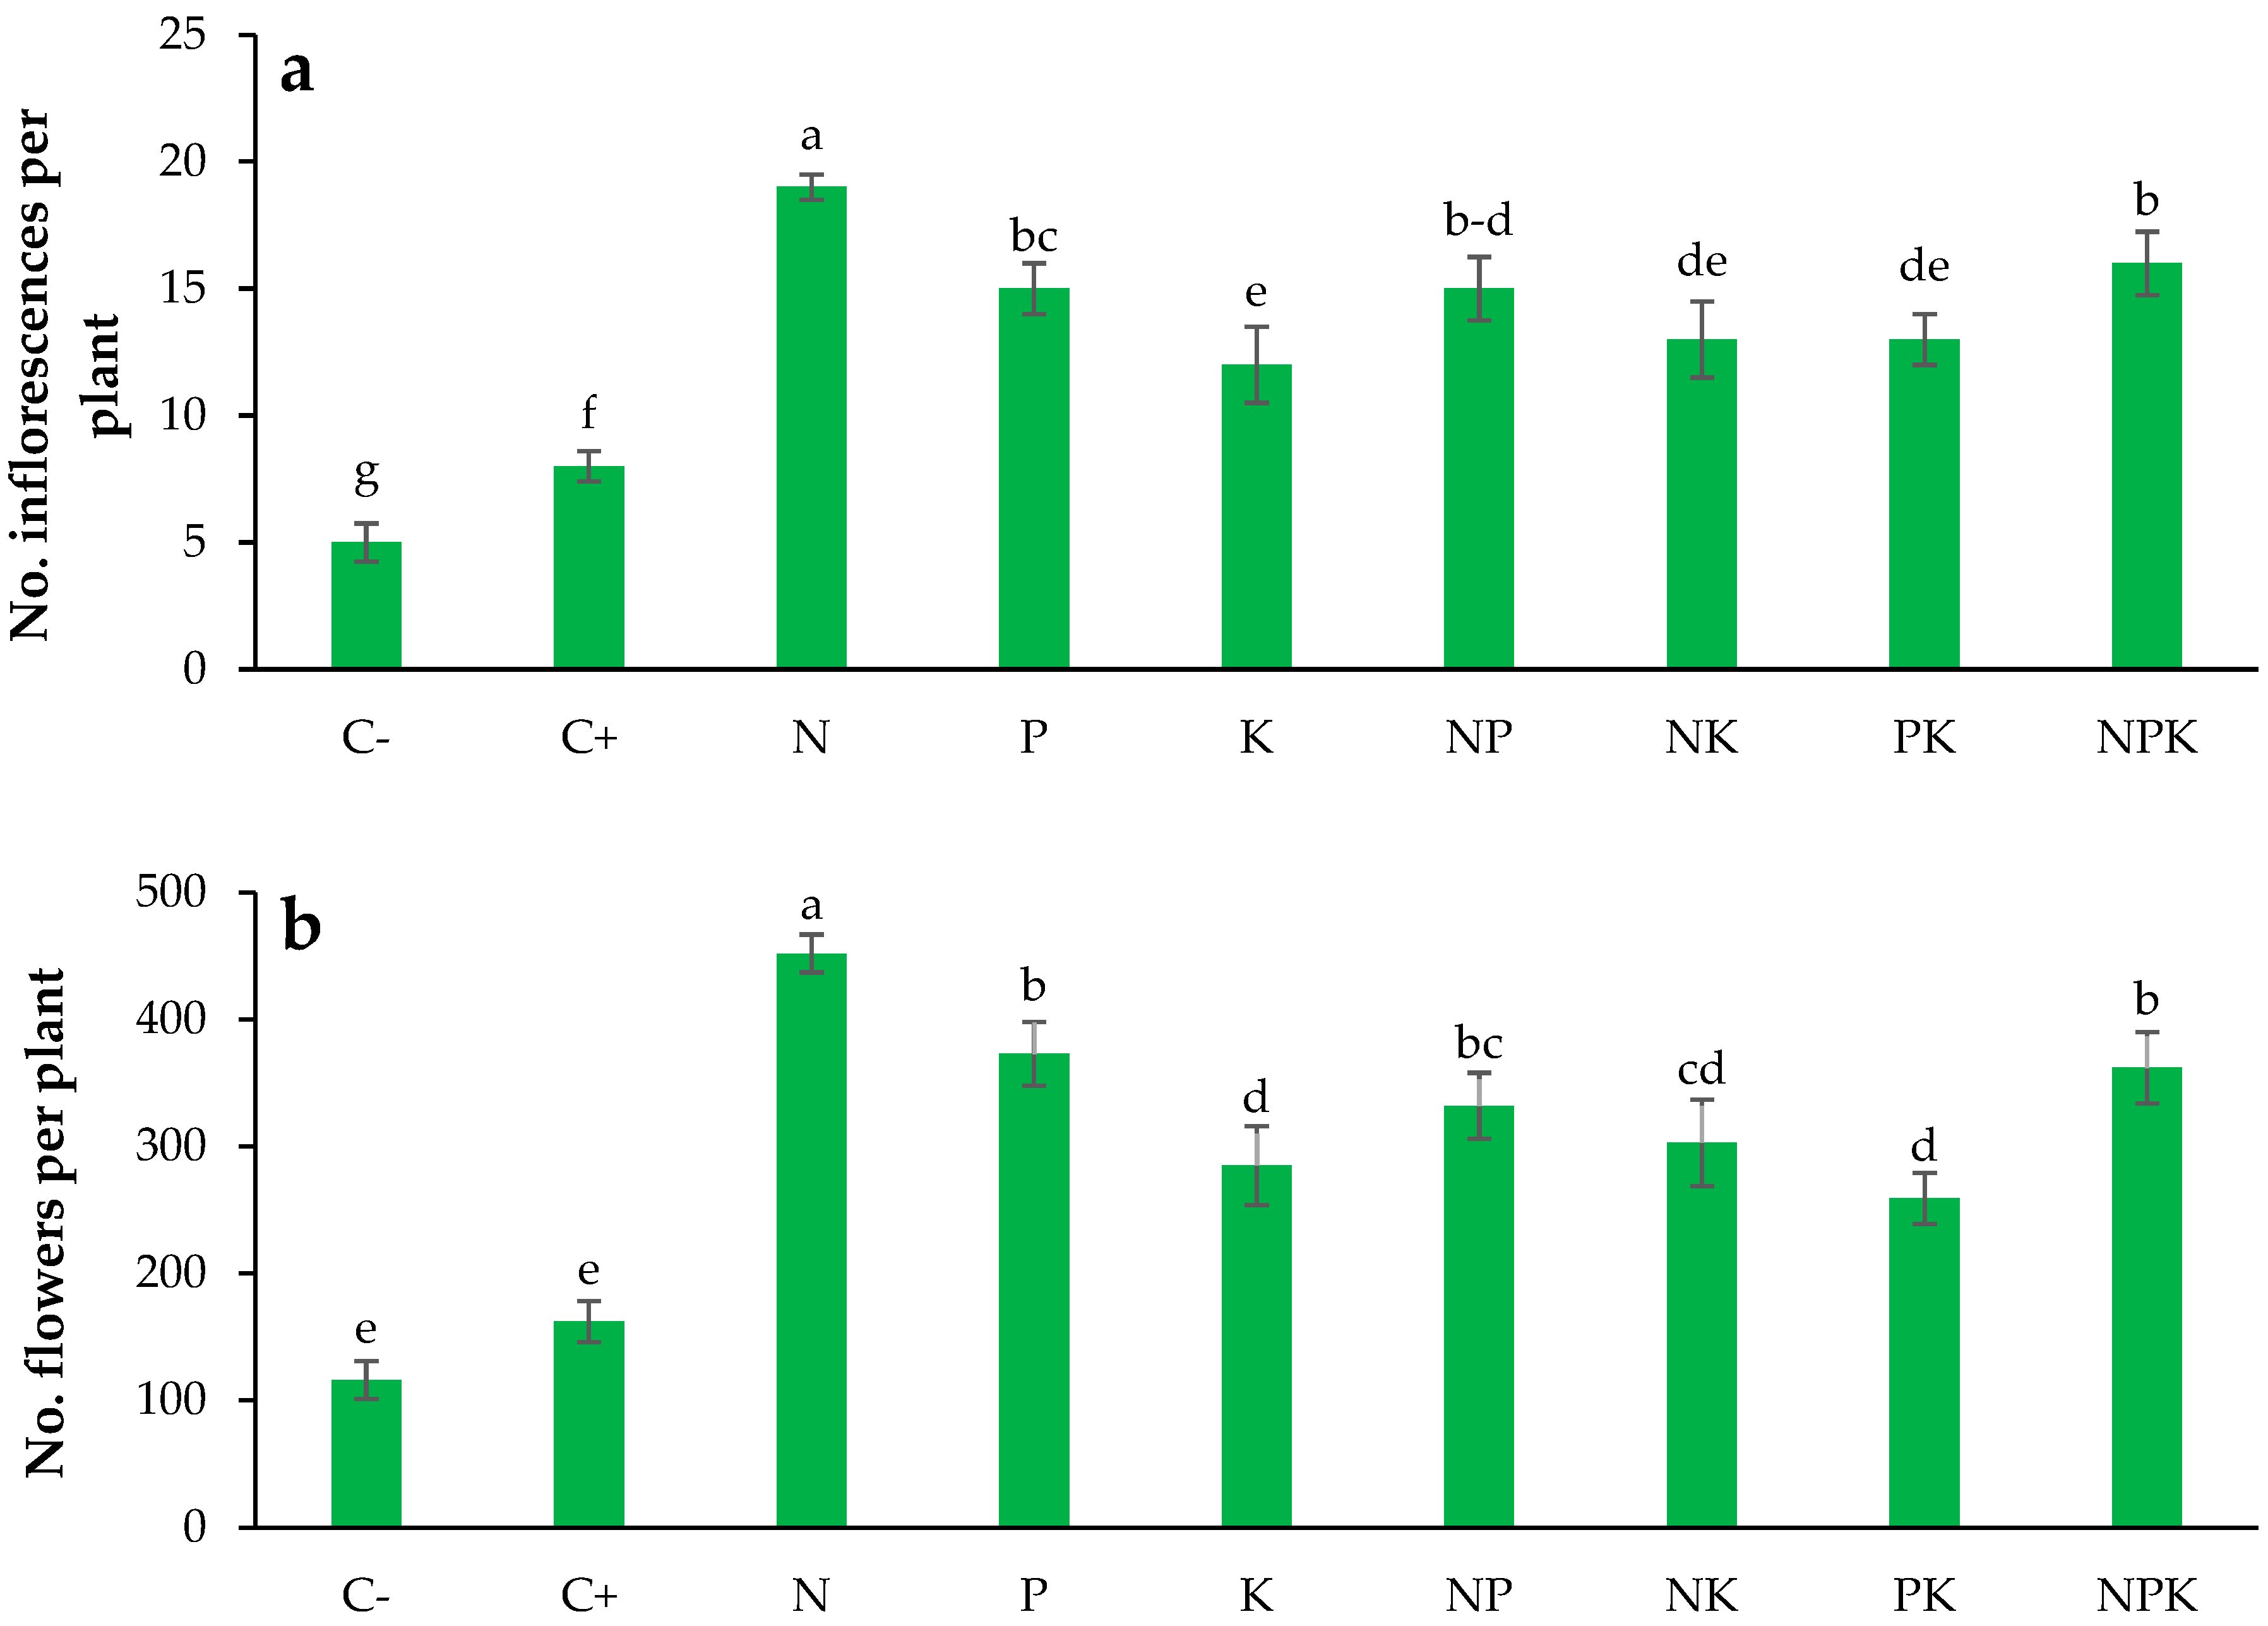
3.5. Inflorescence Number

The effect of macronutrient application on the number of inflorescences per plant was found to be significant at the 1% probability level (Table 3). A significant difference in inflorescence numbers was noted between the negative and positive control treatments (Figure 4a). The N treatment produced the highest number of inflorescences, totaling 19, followed by the P, NP, and NPK treatments (16, 15, and 15, respectively). Conversely, the K, NK, and PK treatments produced the lowest inflorescence counts per plant (12–13), except for the control treatments (p < 0.05; Figure 4a).

3.6. Flower Number

As indicated in Table 3, the number of flowers per plant was significantly affected by the type of macronutrient applied. The flowering of plants treated with different macronutrient fertilizers is illustrated in Figure 4b. The N treatment resulted in the highest flower number, with a total of 452, followed by the P, NPK, and NP treatments (373, 362, and 332, respectively). Among macronutrient treatments, the K, NK, and PK treatments had the lowest flower counts per plant (259–303) (Figure 4b).

3.7. Stem Dry Weight

ANOVA results indicated that the dry weight of the E. platyloba stem was significantly affected by the macronutrient treatments (Table 4). The dry weight of stems in both the negative and positive control treatments was similar (2.48 and 3.32 g/plant, respectively). However, the use of macronutrient fertilizers increased the stem dry weight, ranging from 1.16 to 2.38 times that of the negative control (p < 0.05; Figure 5a). Among the different treatments, the N treatment showed the greatest stem dry weight (8.39 g/plant). Apart from the N treatment, no significant differences were observed among the other macronutrient treatments regarding stem dry weight (p > 0.05; Figure 5a).

3.8. Leaf Dry Weight

The leaf dry weight was significantly influenced by the macronutrient treatments at the 1% probability level (Table 4). No significant differences were detected between the leaf dry weights of the negative and positive control treatments (3.74 and 4.45 g/plant, respectively). The use of macronutrients resulted in a 74–331% increase in leaf weight compared to the negative control (Figure 5b). The N and P treatments produced the highest leaf dry weights by 178% and 142%, respectively, compared to the positive control (p < 0.05; Figure 5b).

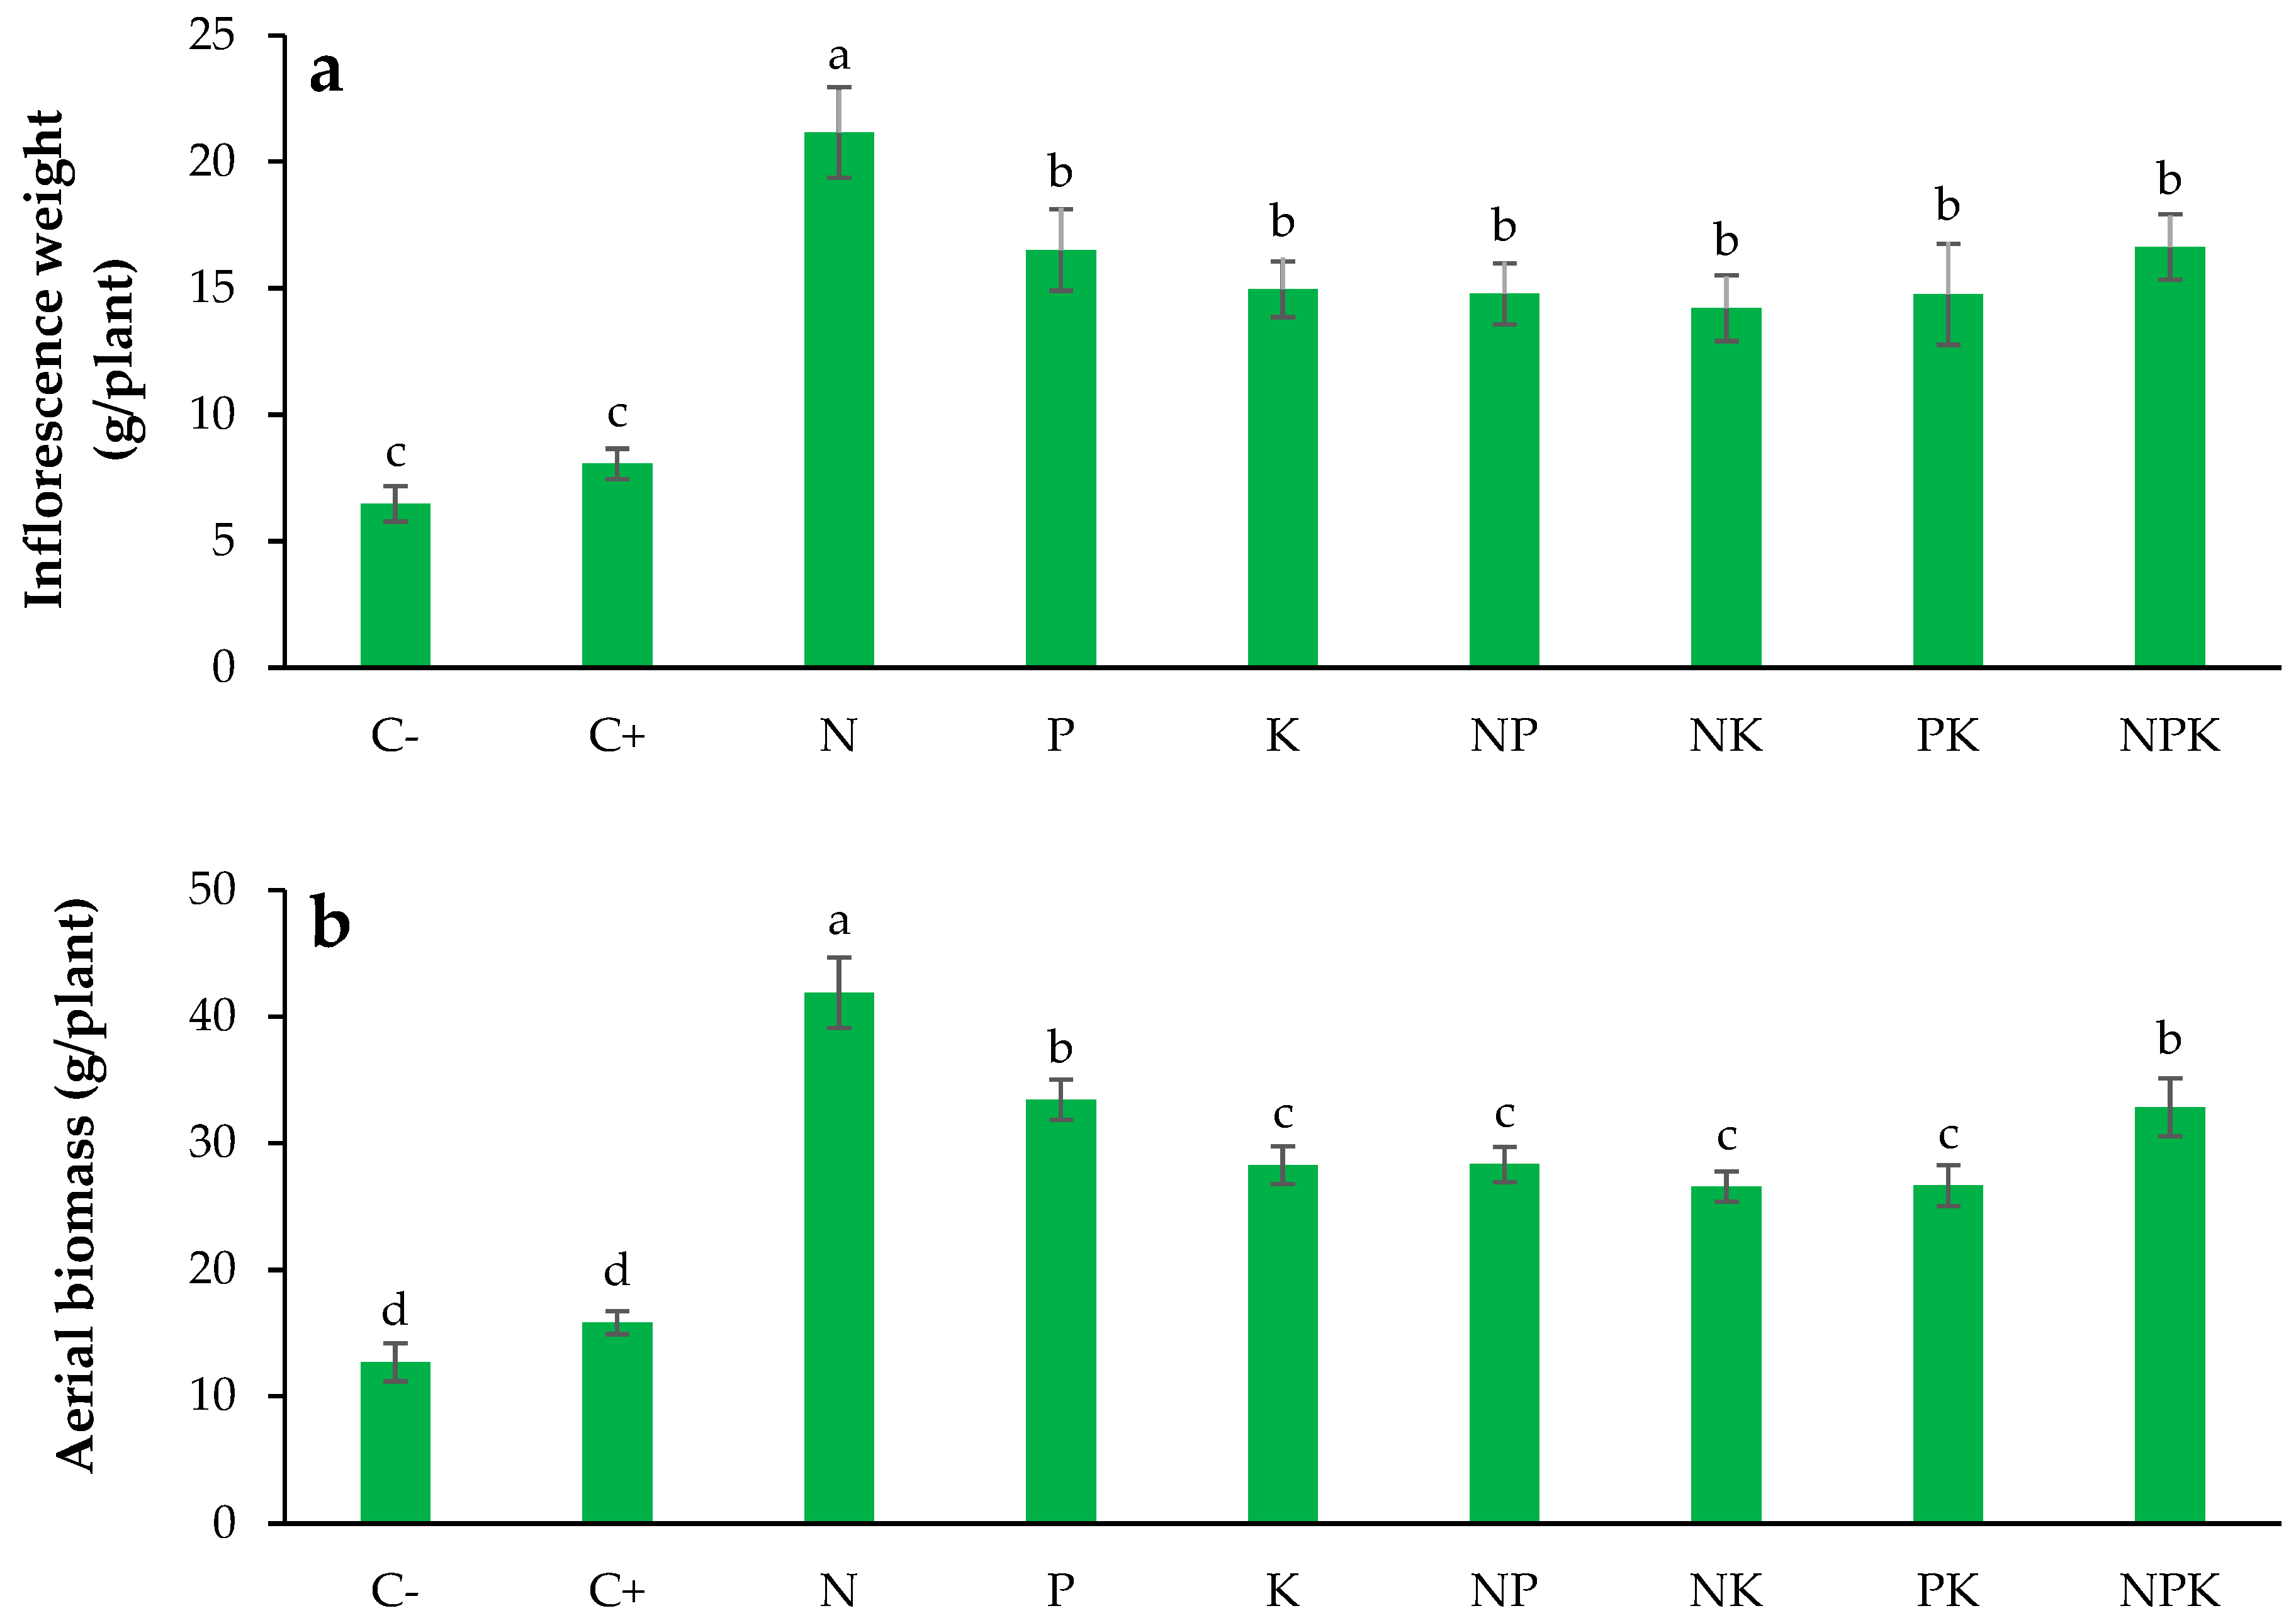
3.9. Inflorescence Dry Weight

The analysis of variance results shown in Table 4 reveals that macronutrient treatment significantly affected the dry weight of inflorescences. Specifically, the dry weight of inflorescences across different macronutrient treatments was found to be 2.26 to 1.19 times greater than that of the negative control treatment, as illustrated in Figure 6a. Notably, except for the nitrogen treatment (21.2 g/plant), no significant differences were found among the macronutrient treatments concerning the dry weight of the inflorescences (14.2–16.6 g/plant) (p > 0.05; Figure 6a).

3.10. Aerial Biomass

The aerial biomass of E. platyloba showed significant variations in response to macronutrient treatments, as indicated in Table 4. However, no significant differences were observed in the biomass of aerial organs between the negative and positive control treatments (12.7 and 15.8 g/plant, respectively), as shown in Figure 6b. The biomass of the aerial parts was approximately 1.10 to 2.30 times greater than that of the negative control treatment p < 0.05). Among the macronutrient treatments, the nitrogen treatment produced the highest shoot biomass (41.9 g/plant), while the P and NPK treatments yielded similar amounts of aerial biomass (33.4 and 32.8 g/plant, respectively), ranking second after the nitrogen treatment (Figure 6b).

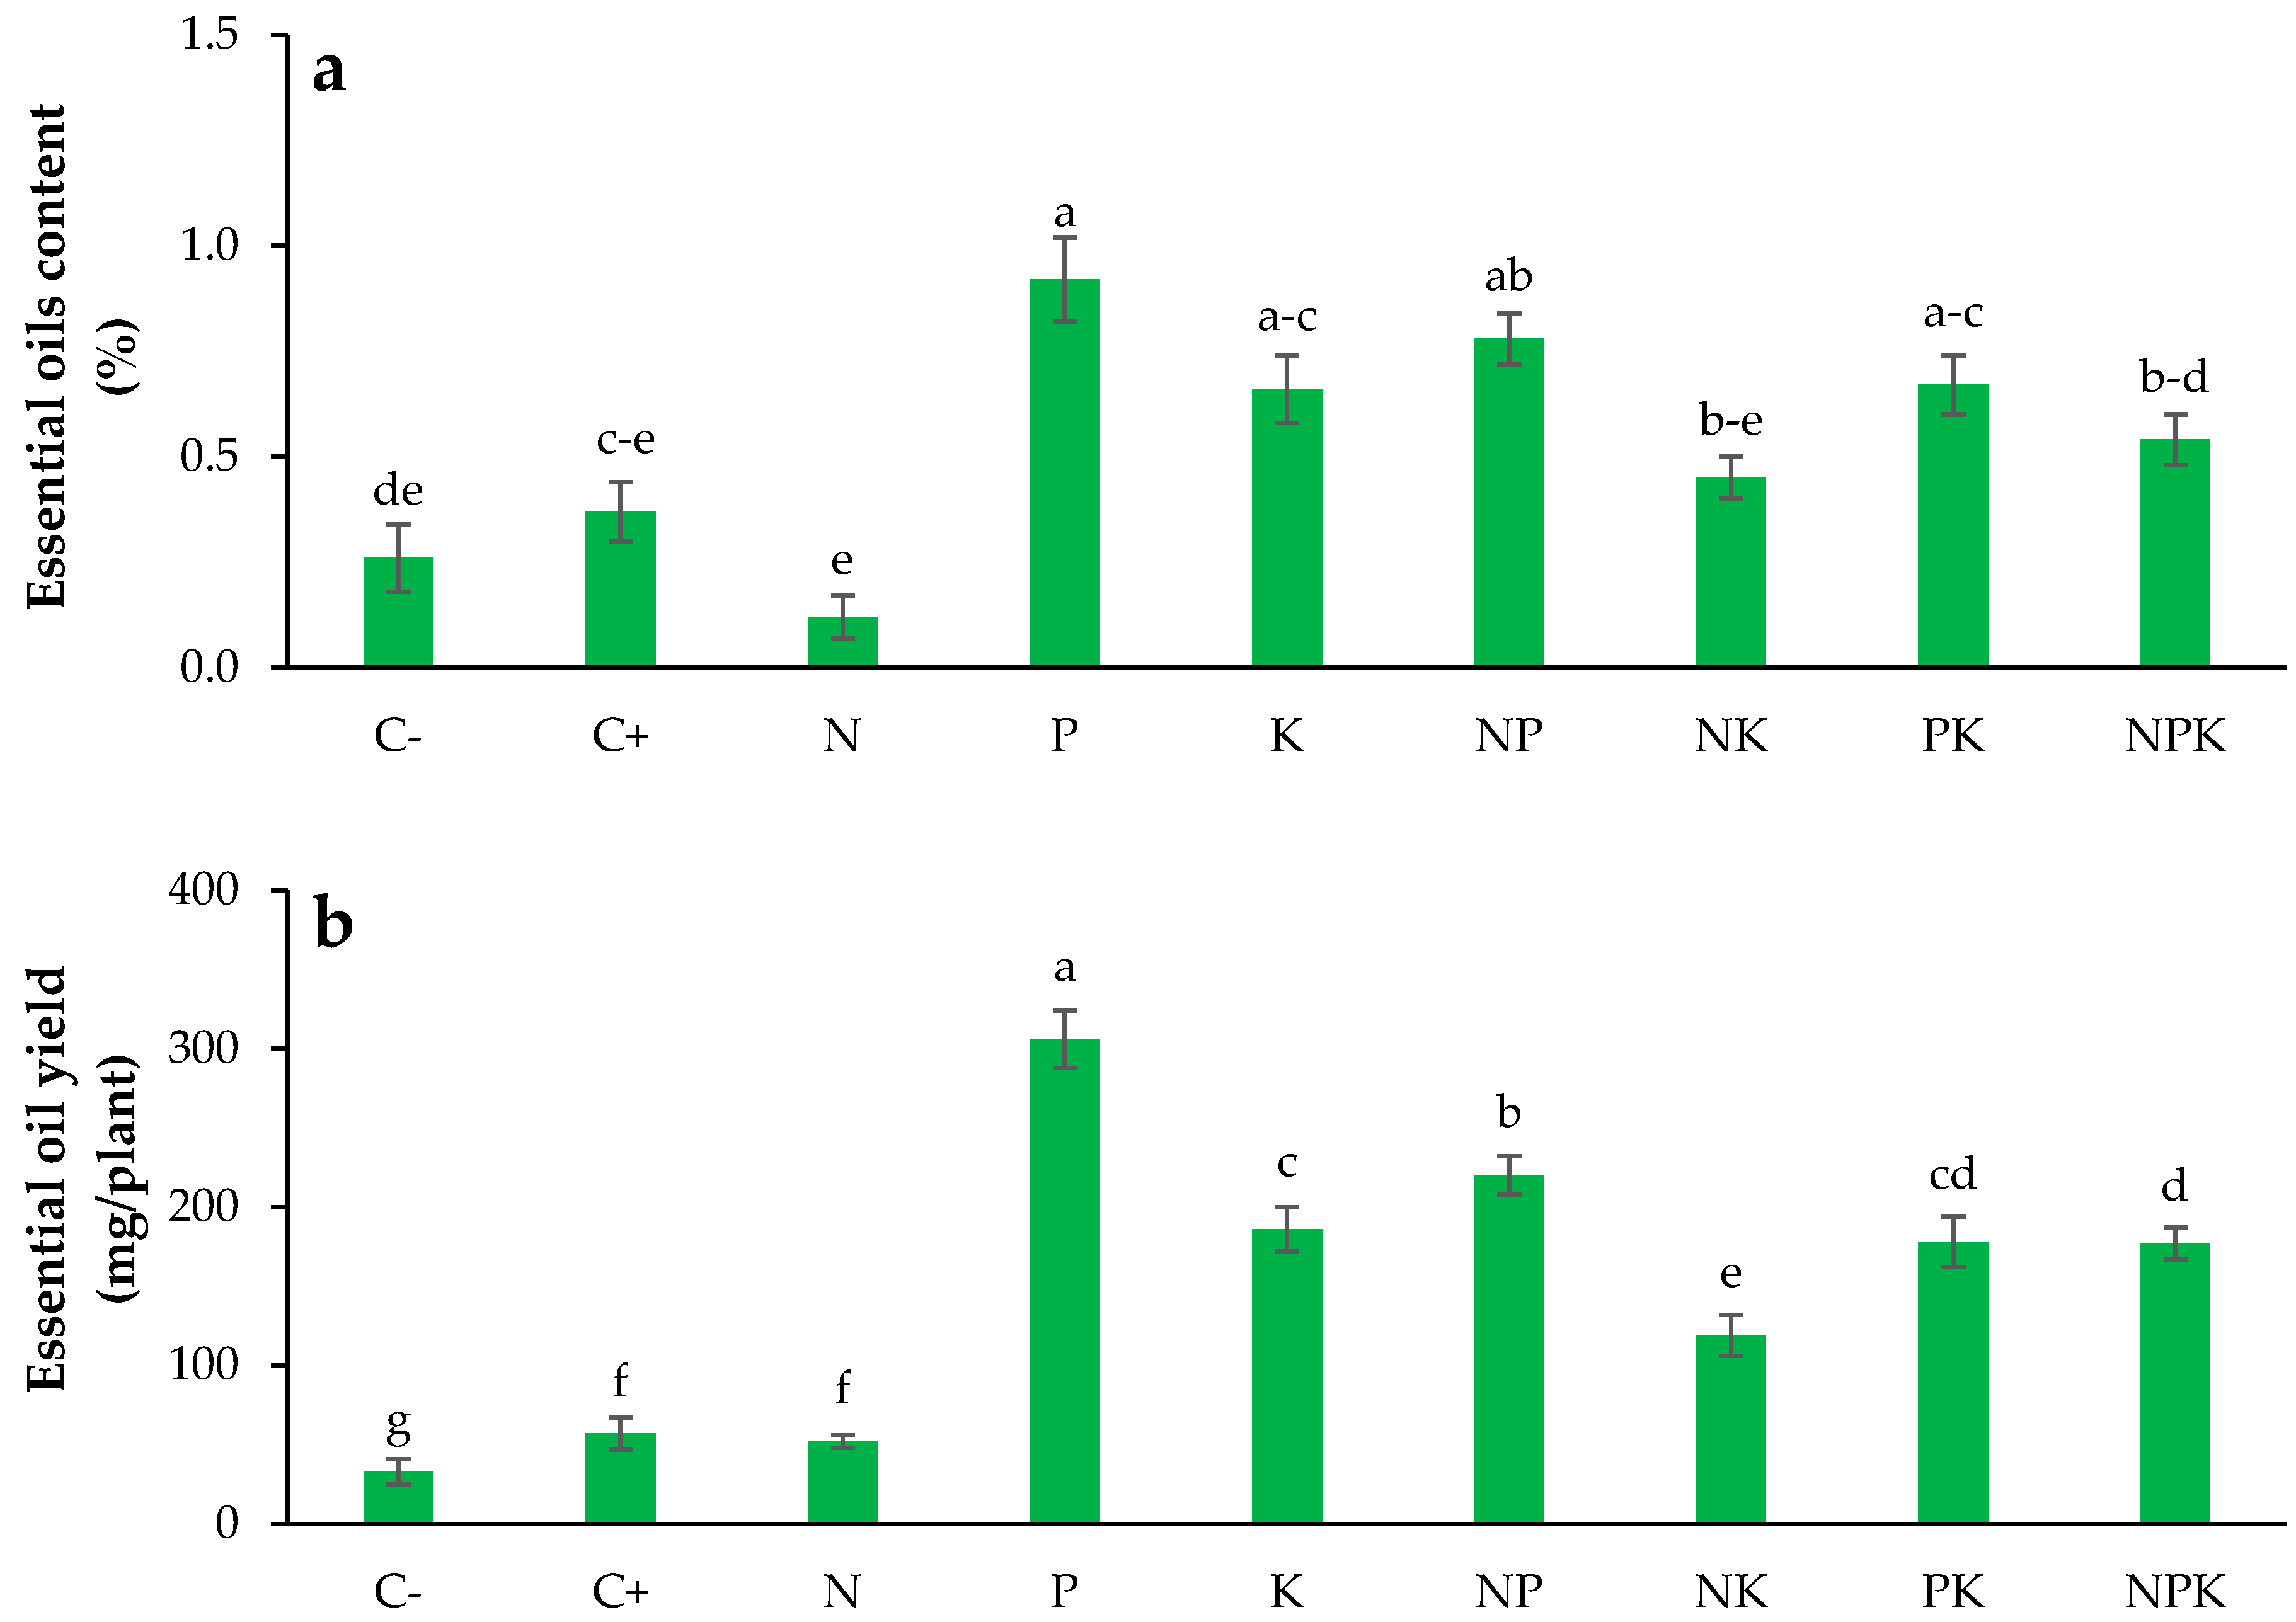
3.11. Essential Oils Content

The content of essential oils was significantly affected by the macronutrient treatments, as shown in Table 4. The nitrogen and NK treatments did not exhibit significant differences from the control treatments concerning essential oil content (0.12, 0.26, and 0.37%, respectively), as depicted in Figure 7a. The highest essential oil content was found in the phosphorus and NP treatments, with values of 0.92% and 0.78%, respectively, both of which were significantly different from the control treatments (p < 0.05; Figure 7a).

3.12. Essential Oils Yield

The effect of macronutrient treatments on the yield of E. platyloba essential oils was significant at the 1% probability level, as illustrated in Table 4. The results from the nitrogen treatment were similar to those of the control treatments (33 and 57 mg/plant, respectively), as shown in Figure 7b. The phosphorus treatment achieved the highest essential oil yield at 306 mg per plant, which was 4.4 to 8.3 times more than that of the control treatments (p < 0.05). The NP treatment resulted in an essential oil yield of 220 mg per plant, and no significant differences were observed between the K and PK treatments concerning the essential oil output (186 and 178 mg/plant, respectively) (p > 0.05; Figure 7b).

3.13. Essential Oil Chemical Compositions

The results revealed that the total percentage of essential-oil-identified components was 86.7–92.8%. These essential oils consisted of 23 components in total, as specified in Table 5 and Figure 8. The primary compounds included (E)-β-ocimene, sesquilavandulol, and β-pinene, with percentages of 21.3–32.1, 14.18–4, and 2.04–8.78%, respectively (Table 5). The positive control treatment caused a significant rise in the levels of linalool, spathulenol, (3Z)-hexenyl-3-methyl butanoate, geraniol, neral, and geranial when compared to the negative control. In contrast, the percentages of α-pinene, β-pinene, p-cymene, (E)-β-ocimene, methyl eugenol, y-decalactone, spathulenol, and y-dodecalactone were higher in the P and K treatments than in the N treatment. In contrast, the levels of myrcene, limonene, linalool, geraniol, geranial, neral, and (E)-sesquilavandulol were enhanced in the N treatment compared to the P and K treatments (Table 5). The NP treatment resulted in an increase in β-pinene, methyl eugenol, y-decalactone, and y-dodecalactone when compared to the other macronutrient treatments. The PK treatment displayed the highest concentration of p-cymene, whereas the NPK treatment produced a relatively high quantity of neral and geranial (Table 5).

4. Discussion

The significant enhancement of the morphological characteristics of E. platyloba due to macronutrient application can be linked to the quick availability of essential nutrients like nitrogen, phosphorus, and potassium, which are necessary for plant development. Nitrogen is especially important for the assimilation of proteins and nucleic acids required for chlorophyll creation and cellular division, thus aiding various biochemical processes promoting plant development and flowering capacity [30]. Moreover, nitrogen is vital for synthesizing tryptophan, which is important for the absorption of indole-3-acetic acid, a hormone that regulates cell division, elongation, and the activation of meristematic tissues [31]. A study by Jiang et al. [14] showed that balanced fertilization resulted in ideal measurements of leaf area, stem diameter, and plant height in C. morifolium, consistent with the outcomes of this study. However, it was observed that high potassium levels significantly improved the flower size and yield compared to balanced fertilization, which differed from the observations made in this experiment. Nofal et al. [32] showed that applying a compound macronutrient (NPK) significantly enhanced plant growth in Tagetes erecta (L.). Likewise, Gaber [33] noted that utilizing combined macronutrients (NPK) greatly improved the growth parameters of Pelargonium zonale, such as plant height, branch count, leaf number, leaf area, and shoot dry weight.
Physiologically, phosphorus promotes increased growth, enhanced photosynthesis, and alterations in root architecture. Additionally, by adjusting their phosphorus metabolism, plants can tolerate various abiotic stresses such as heat, drought, salinity, and heavy metal toxicity [34]. Adequate potassium levels are crucial for different physiological functions throughout the plant life cycle. Besides its important function in leaf growth, potassium plays a role in creating peptide bonds and metabolizing proteins and carbohydrates [35]. In Gossypium hirsutum (L.), the glucose concentration in potassium-deficient pistils was diminished by 53% compared to those with sufficient potassium levels. This reduction can be attributed to decreased activities of both acid and alkaline invertases, while sucrose synthase activity remained unchanged. Furthermore, the levels of soluble carbohydrates and ATP were found to be lower in the potassium-deficient pistils, paralleling the observed reductions in pollen tube growth rate and seed set efficiency [36]. Gaber [33] showed that the use of combined macronutrients significantly improved flowering traits in Pelargonium zonale, including the number of inflorescences per plant, and the longevity of inflorescences, while also increasing nitrogen, phosphorus, and potassium levels and chlorophyll concentration. Moreover, Nofal et al. [32] indicated that the use of compound macronutrients considerably enhanced flowering in T. erecta. Phosphorus is essential for enhancing photosynthesis and is a fundamental part of the Calvin cycle, affecting photophosphorylation levels and increasing adenosine triphosphate synthesis, as well as carbon dioxide absorption, thus improving photosynthetic efficiency [13]. Therefore, carbohydrates are the main metabolites involved in flower development and may lead to higher flower counts per plant [37].
The noted rise in the dry weight of different components of E. platyloba in this research suggests that adequate availability and balance are crucial for meeting nutrient demands and bridging the gap between soil and organic sources [38]. This process is aided by the promotion of cell expansion and division through plant hormones like auxin, cytokinin, and gibberellin [39]. Additionally, it improves the creation of nucleic acids, proteins, and chlorophyll while speeding up photosynthesis and the build-up of plant biomass, which is critical for flowering traits [40]. The makeup of essential oils is considerably influenced by the amount and accessibility of nutrients [16,17,18]. Nitrogen is a vital component in the synthesis of amino acids and enzymes, and its lack negatively affects terpenoid biosynthesis. This nutrient enhances the production of terpenoids by improving electron transfer rates and increasing photosynthesis in leaves [19]. Photosynthesis produces carbon substrates, such as pyruvate or glyceraldehyde-3-phosphate, along with ATP, which are essential for isoprene production. Moreover, phosphorus, in the form of NADPH, is indispensable for the biosynthesis of terpenoids [20]. Phosphorus also contributes to terpenoid biosynthesis by increasing the levels of high-energy pyrophosphate compounds, including DMAPP and IPP [21]. In this study, the highest essential oil yield was recorded with phosphorus treatment, indicating that this nutrient supports the accumulation of secondary metabolites in plant tissues. Conversely, an excessive rise in dry matter due to nitrogen, especially in the stem, may reduce the concentration of essential oil in the plant. Thus, the use of macronutrients, especially phosphorus, is vital for boosting the essential oil yield.
A significant increase in the percentages of linalool, spathulenol, (3Z)-hexenyl-3-methylbutanoate, geraniol, neral, and geranial seen in the positive control treatment highlights the essential role of adequate moisture availability in boosting the production of valuable essential oil constituents, particularly geraniol, neral, and geranial. This improvement can be supported by using a water supply in the summer season. Moreover, the rise in α-pinene, β-pinene, p-cymene, (E)-β-ocimene, methyl eugenol, y-decalactone, spathulenol, and y-dodecalactone in plants treated with phosphorus and potassium serves specific purposes related to these compounds, indicating a positive strategy. However, although myrcene, limonene, linalool, geraniol, geranial, neral, and (E)-sesquilavandulol levels were increased in plants fertilized with nitrogen, the particularly low essential oil yield from this treatment may diminish the relevance of nitrogen’s impact on these compounds. Among the various combined treatments, the NP one led to higher levels of β-pinene, methyl eugenol, y-decalactone, and y-dodecalactone. In general, the choice of macronutrient treatment should correspond to the intended composition of essential oils. In this regard, it has been reported that essential oils extracted from E. platyloba seeds comprise a complex mixture primarily of monoterpene hydrocarbons [24]. The primary components of the essential oil from its aerial parts include (E)-β-ocimene (47%), spatholenol (9%), β-myrcene (6.2%), limonene (5.4%), and α-pinene (4.6%) [25]. Studies suggest that the peak yields of geraniol (90%) and geranyl acetate (3.0%) in the leaves of Cymbopogon martinii (Roxb.) were recorded during the summer months [41]. This implies that the use of water and nitrogen may have aided in the increased production of these compounds, resulting in the most fragrant leaves during this period.
Semi-natural ecosystem management with minimal intervention, including fertilization and irrigation, has resulted in an 8.3-fold increase in essential oil productivity. This highlights the substantial effectiveness of fertilization in fragile ecosystems while ensuring access to medicinal plant raw materials at limited levels. When evaluating the costs of fertilizers and irrigation against the value of the produced medicinal plants, it is evident that fertilizer application can significantly boost efficiency and profitability for farmers. This approach not only enhances the living conditions of smallholder farmers but also promotes environmental conservation and sustainability by safeguarding species in their natural habitats and diminishing reliance on tillage practices. Nevertheless, despite the low rainfall typical of semi-arid regions and the perennial nature of E. platyloba that helps reduce fertilizer leaching, important aspects of fertilizer management must still be addressed similarly to agricultural ecosystems.

5. Conclusions

The experiment’s findings indicate that utilizing nitrogen, followed by phosphorus and NPK, results in improved plant height and increased flowering. The accumulation of dry matter in various plant parts was significantly influenced by nitrogen, with a notable rise in leaf weight found in plants that were given phosphorus. The use of phosphorus resulted in the highest levels of essential oils and overall productivity. The substantial differences in essential oil composition among the various macronutrient treatments highlight the opportunity to tailor specific treatments to enhance the production of desired compounds, thus improving overall productivity and fulfilling the needs of relevant industries. Moreover, the knowledge acquired from this research may establish a useful framework for managing E. platyloba in natural ecosystems, ensuring the sustainable supply of required plant materials while reducing the risk of overexploitation in these regions. Based on the results of this experiment, the utilization of phosphorus is recommended to attain the maximum yield of E. platyolba in semi-arid soil conditions. Exploring phosphorus-boosting biological fertilizers and mycorrhizal relationships in semi-natural settings seems to be advantageous for future studies.

Author Contributions

Conceptualization, S.F. and F.M.; Data curation, S.M. and S.F.; Formal analysis, S.M. and S.F.; Funding acquisition, S.F.; Methodology, S.M.; Resources, S.F.; Software, S.F. and S.M.; Supervision, S.F.; Validation, S.F.; Writing—original draft, S.M. and S.F.; Writing—review and editing, S.F. and F.M. All authors have read and agreed to the published version of the manuscript.

Funding

This study was funded, in part, by Shahrekord University (grant #96GRN1M731 to S.F.).

Data Availability Statement

The datasets generated during the current study are available from the corresponding author on reasonable request.

Acknowledgments

This study was conducted at the Department of Agronomy, Shahrekord University, Iran.

Conflicts of Interest

The authors declare no conflict of interest.

References

  1. Hassanpouraghdam, M.B.; Ghorbani, H.; Esmaeilpour, M.; Alford, M.H.; Strzemski, M.; Dresler, S. Diversity and distribution patterns of endemic medicinal and aromatic plants of Iran: Implications for conservation and habitat management. Int. J. Environ. Res. Public Health 2022, 19, 1552. [Google Scholar] [CrossRef]
  2. Davis, C.C.; Choisy, P. Medicinal plants meet modern biodiversity science. Curr. Biol. 2024, 24, 158–173. [Google Scholar] [CrossRef] [PubMed]
  3. Tabin, S.; Gupta, R.C.; Kamili, A.N.; Parray, J.A. Medical and medicinal importance of Rheum spp. collected from different altitudes of the Kashmir Himalayan range. Cell. Mol. Biomed. Rep. 2022, 2, 187–201. [Google Scholar] [CrossRef]
  4. Morovati, Z.; Karimzadeh, G.; Naghavi, M.R.; Rashidi Monfared, S. Essential oil profile of areal part of Datura stramonium L. and D. innoxia from Iran. Agrotech. Ind. Crops 2023, 3, 53–59. [Google Scholar] [CrossRef]
  5. Salmerón-Manzano, E.; Garrido-Cardenas, J.A.; Manzano-Agugliaro, F. Worldwide research trends on medicinal plants. Int. J. Environ. Res. Public. Health 2020, 17, 3376. [Google Scholar] [CrossRef] [PubMed]
  6. Kidane, Y.O.; Steinbauer, M.J.; Beierkuhnlein, C. Dead end for endemic plant species? A biodiversity hotspot under pressure. Glob. Ecol. Conserv. 2019, 19, e00670. [Google Scholar] [CrossRef]
  7. Sasani, S.; Rashidi Monfared, S.; Mirzaei, A.R. Identification of some Echinophora platyloba miRNAs using computational methods and the effect of these miRNAs in the expression of TLN2 and ZNF521 genes in different human body organs. Cell. Mol. Biomed. Rep. 2024, 4, 43–53. [Google Scholar] [CrossRef]
  8. Avijgan, M.; Mahboubi, N. Echinophora platyloba DC. as a new natural antifungal agent. Asian Pac. J. Trop. Dis. 2015, 5, 169–174. [Google Scholar] [CrossRef]
  9. Shahneh, F.Z.; Baradaran, B.; Majidi, J.; Babaloo, Z. Echinophora platyloba DC (Apiaceae) crude extract induces apoptosis in human prostate adenocarcinoma cells (PC 3). Biomed. J. 2014, 37, 298–304. [Google Scholar] [CrossRef] [PubMed]
  10. Wszelaczyńska, E.; Pobereżny, J.; Gościnna, K.; Retmańska, K.; Kozera, W.J. Nutritional value of parsley roots depending on nitrogen and magnesium fertilization. Agriculture 2024, 14, 143. [Google Scholar] [CrossRef]
  11. Ismail, M.S.; Nawaz, F.; Shehzad, M.A. Contributions of Nitrogen Metabolic Enzymes in Storage Protein Assimilation and Mineral Accumulation Regulated by Nitrogen and Selenium in Triticum aestivum L. Plant Physiol. Biochem. 2025, 221, 109597. [Google Scholar] [CrossRef] [PubMed]
  12. Johnson, R.; Vishwakarma, K.; Hossen, M.S.; Kumar, V.; Shackira, A.M.; Puthur, J.T.; Abdi, G.; Sarraf, M.; Hasanuzzaman, M. Potassium in plants: Growth regulation, signaling, and environmental stress tolerance. Plant Physiol. Biochem. 2022, 172, 56–69. [Google Scholar] [CrossRef] [PubMed]
  13. Dang, K.; Gong, X.; Liang, H.; Guo, S.; Zhang, S.; Feng, B. Phosphorous fertilization alleviates shading stress by regulating leaf photosynthesis and the antioxidant system in mung bean (Vigna radiata L.). Plant Physiol. Biochem. 2023, 196, 111–1121. [Google Scholar] [CrossRef] [PubMed]
  14. Jiang, K.; Peng, S.; Yin, Z.; Li, X.; Xie, L.; Shen, M.; Li, D.; Gao, J. Effects of N, P, K nutrition levels on the growth, flowering attributes and functional components in Chrysanthemum morifolium. Horticulturae 2024, 10, 226. [Google Scholar] [CrossRef]
  15. Xiong, C.; Li, X.; Wang, X.; Wang, J.; Lambers, H.; Vance, C.P.; Shen, J.; Cheng, L. Flavonoids are involved in phosphorus-deficiency-induced cluster-root formation in white lupin. Ann. Bot. 2020, 129, 101–112. [Google Scholar] [CrossRef] [PubMed]
  16. Fallah, S.; Maggi, F.; Ghanbari-Odivi, A.; Rostaei, M. Optimizing lemon balm (Melissa officinalis L.) cultivation: Effects of different manures on plant growth and essential oil production during consecutive harvests. Horticulturae 2024, 10, 1105. [Google Scholar] [CrossRef]
  17. Ghanbari-Odivi, A.; Fallah, S.; Carrubba, A. Optimizing hyssop (Hyssopus officinalis L.) cultivation: Effects of different manures on plant growth and essential oil yield. Horticulturae 2024, 10, 894. [Google Scholar] [CrossRef]
  18. Fallah, S.; Maggi, F.; Ghanbari-Odivi, A.; Rostaei, M.; Shahbazi, E. Improvement of production and quality of essential oils in multi-cut peppermint (Mentha x piperita L.) through eco-friendly fertilizers in the semi-arid highlands. Ind. Crops Prod. 2024, 216, 118801. [Google Scholar] [CrossRef]
  19. Bustamante, M.Á.; Michelozzi, M.; Barra Caracciolo, A.; Grenni, P.; Verbokkem, J.; Geerdink, P.; Safi, C.; Nogues, I. Effects of soil fertilization on terpenoids and other carbon-based secondary metabolites in Rosmarinus officinalis plants: A comparative ttudy. Plants 2020, 9, 830. [Google Scholar] [CrossRef] [PubMed]
  20. Kapoor, R.; Anand, G.; Gupta, P.; Mandal, S. Insight into the mechanisms of enhanced production of valuable terpenoids by arbuscular mycorrhiza. Phytochem. Rev. 2017, 16, 677–692. [Google Scholar] [CrossRef]
  21. Liang, H.; Sun, H.; Shao, C.; Lv, B.; Cao, W.; Zhou, J.; Zhu, J.; Zhang, Y. Regulation of nitrogen and phosphorus content and terpenoid metabolite accumulation in P. ginseng by exogenous strigolactone. Curr. Plant Biol. 2024, 41, 100425. [Google Scholar] [CrossRef]
  22. Velikova, V.; Müller, C.; Ghirardo, A.; Rock, T.M.; Aichler, M.; Walch, A.; Schmitt-Kopplin, P.; Schnitzler, J.P. Knocking down of osoprene emission modifies the lipid matrix of thylakoid membranes and influences the chloroplast ultrastructure in poplar. Plant Physiol. 2015, 168, 859–870. [Google Scholar] [CrossRef] [PubMed]
  23. Wagatsuma, T. The membrane lipid bilayer as a regulated barrier to cope with detrimental ionic conditions: Making new tolerant plant lines with altered membrane lipid bilayer. Soil. Sci. Plant Nutr. 2017, 63, 507–516. [Google Scholar] [CrossRef]
  24. Moghaddam, M.; Taheri, P.; Ghasemi Pirbalouti, M.; Mehdizadeh, L. Chemical composition and antifungal activity of essential oil from the seed of Echinophora platyloba DC. against phytopathogens fungi by two different screening methods. LWT—Food Sci. Technol. 2015, 61, 536–542. [Google Scholar] [CrossRef]
  25. Sodeifian, G.; Sajadian, S.A. Investigation of essential oil extraction and antioxidant activity of Echinophora platyloba DC. using supercritical carbon dioxide. J. Supercrit. Fluids. 2017, 121, 52–62. [Google Scholar] [CrossRef]
  26. Abbaszadeh, B.; Layeghhaghighi, M.; Azimi, R.; Hadi, N. Improving water use efficiency through drought stress and using salicylic acid for proper production of Rosmarinus officinalis L. Ind. Crops Prod. 2020, 144, 111893. [Google Scholar] [CrossRef]
  27. Mahdi Navehsi, F.; Abdossi, V.; Abbaszadeh, B.; Azimi, R.; Dianat, M. Effect of gamma rays on the essential oil and biochemical characteristics of the Satureja mutica Fisch & C. A. Mey. Sci. Rep. 2024, 14, 7581. [Google Scholar] [CrossRef] [PubMed]
  28. Solouki, A.; Zare Mehrjerdi, M.; Aliniaeifard, S.; Azimi, R. Postharvest light and temperature elicitors improve chemical composition and level of essential oils in basil (Ocimum basilicum L.) through boosting antioxidant machinery. Postharvest Biol. Technol. 2023, 199, 112279. [Google Scholar] [CrossRef]
  29. Adams, R.P. Identification of Essential Oil Components by Gas Chromatography/mass Spectrometry, 4.1st ed.; Allured Publishing: Carol Stream, IL, USA, 2017. [Google Scholar]
  30. Zayed, O.; Hewedy, O.A.; Abdelmoteleb, A.; Ali, M.; Youssef, M.S.; Roumia, A.F.; Seymour, D.; Yuan, Z.C. Nitrogen Journey in Plants: From Uptake to Metabolism, Stress Response, and Microbe Interaction. Biomolecules 2023, 13, 1443. [Google Scholar] [CrossRef] [PubMed]
  31. Gang, S.; Sharma, S.; Saraf, M.; Buck, M.; Schumacher, J. Bacterial Indole-3-Acetic Acid Influences Soil Nitrogen Acquisition in Barley and Chickpea. Plants 2021, 10, 780. [Google Scholar] [CrossRef]
  32. Nofal, E.M.S.; EL-Mahrouk, M.E.; EL-Sayed, B.A.; Radwan, A.M.M. Effect of NPK fertilizer and some natural extract treatments on the vegetative growth and flowering of African marigold (Tagetes erecta L. var. Dwarf Chrysanthemum). Appl. Ecol. Environ. Res. 2021, 19, 3167–3179. [Google Scholar] [CrossRef]
  33. Gaber, M.K. Vegetative and flowering growth of geranium as affected by mineral fertilization and ascorbic acid foliar application. Middle East. J. Appl. Sci. 2019, 9, 220–230. [Google Scholar]
  34. Khan, F.; Siddique, A.B.; Shabala, S.; Zhou, M.; Zhao, C. Phosphorus Plays Key Roles in Regulating Plants’ Physiological Responses to Abiotic Stresses. Plants 2023, 12, 2861. [Google Scholar] [CrossRef] [PubMed]
  35. Xu, X.; Du, X.; Wang, F.; Sha, J.; Chen, Q.; Tian, G.; Zhu, Z.; Ge, S.; Jiang, Y. Effects of Potassium Levels on Plant Growth, Accumulation and Distribution of Carbon, and Nitrate Metabolism in Apple Dwarf Rootstock Seedlings. Front. Plant Sci. 2020, 11, 904. [Google Scholar] [CrossRef]
  36. Hu, W.; Loka, D.A.; Fitzsimons, T.R.; Zhou, Z.; Oosterhuis, D.M. Potassium deficiency limits reproductive success by altering carbohydrate and protein balances in cotton (Gossypium hirsutum L.). Environ. Exp. Bot. 2018, 145, 87–94. [Google Scholar] [CrossRef]
  37. Önder, S.; Tonguç, M.; Önder, D.; Erbaş, S.; Mutlucan, M. Flower color and carbohydrate metabolism changes during the floral development of Rosa damascena. S. Afr. J. Bot. 2023, 156, 234–243. [Google Scholar] [CrossRef]
  38. Pandian, K.; Mustaffa, M.R.A.F.; Mahalingam, G.; Paramasivam, A.; John Prince, A.; Gajendiren, M.; Rafiqi Mohammad, A.R.; Varanasi, S.T. Synergistic conservation approaches for nurturing soil, food security and human health towards sustainable development goals. J. Hazard. Mater. Adv. 2024, 16, 100479. [Google Scholar] [CrossRef]
  39. Jia, Z.; Giehl, R.F.H.; von Wirén, N. Nutrient–hormone relations: Driving root plasticity in plants. Molecular Plant 2022, 15, 86–103. [Google Scholar] [CrossRef] [PubMed]
  40. Shah, I.H.; Jinhui, W.; Li, X.; Hameed, M.K.; Manzoor, M.A.; Li, P.; Zhang, Y.; Niu, Q.; Chang, L. Exploring the role of nitrogen and potassium in photosynthesis implications for sugar: Accumulation and translocation in horticultural crops. Sci. Hortic. 2024, 327, 112832. [Google Scholar] [CrossRef]
  41. Nilofer, N.; Singh, S.; Singh, A.; Kaur, P.; Siddiqui, A.; Kumar, D.; Lal, R.; Chanotiya, C. Influence of the season on the quantity and chemical composition of the essential oil and synthesis of secondary metabolites in Cymbopogon martinii (Roxb.). Wats. Agrotech. Ind. Crops 2023, 3, 170–191. [Google Scholar] [CrossRef]
Figure 1. Plant height (a) and branch number (b) in Echinophora platyloba exposed to different macronutrient fertilizers. Means accompanied with the same letter are not significantly different according to LSD test (p < 0.05). C− (negative control, no fertilizer and water), C+ (positive control, no fertilizer), N (250 mg N/plant, urea), P (250 mg P/plant, triple superphosphate), K (250 mg K/plant, potassium sulfate), NP (N+P), NK (N+K), PK (P+K), NPK (N+P+K). Error bars represent ± SD (n = 20).
Horticulturae 11 00185 g001
Figure 2. The growth of Echinophora platyloba treated with different macronutrient fertilizers. See Figure 1 for abbreviations.
Horticulturae 11 00185 g002
Figure 3. Main stem diameter (a) and leaf number (b) in Echinophora platyloba exposed to different macronutrient fertilizers. Means accompanied with the same letter are not significantly different according to LSD test (p < 0.05). See Figure 1 for abbreviations. Error bars represent ± SD (n = 20).
Horticulturae 11 00185 g003
Figure 4. Inflorescence number (a) and flower number (b) in Echinophora platyloba exposed to different macronutrient fertilizers. Means accompanied with the same letter are not significantly different according to LSD test (p < 0.05). See Figure 1 for abbreviations. Error bars represent ± SD (n = 20).
Horticulturae 11 00185 g004
Figure 5. Stem weight (a) and leaf weight (b) in E. platyloba exposed to different macronutrient fertilizers. Means accompanied with the same letter are not significantly different according to LSD test (p < 0.05). See Figure 1 for abbreviations. Error bars represent ± SD (n = 20).
Horticulturae 11 00185 g005
Figure 6. Inflorescence weight (a) and aerial biomass (b) in Echinophora platyloba exposed to different macronutrient fertilizers. Means accompanied with the same letter are not significantly different according to LSD test (p < 0.05). See Figure 1 for abbreviations. Error bars represent ± SD (n = 20).
Horticulturae 11 00185 g006
Figure 7. Essential oils content (a) and essential oils yield (b) in Echinophora platyloba exposed to different macronutrient fertilizers. Means accompanied with the same letter are not significantly different according to LSD test (p < 0.05). See Figure 1 for abbreviations. Error bars represent ± SD (n = 20).
Horticulturae 11 00185 g007
Figure 8. GC-MS profile of essential oil from aerial parts of Echinophora platyloba exposed to different macronutrient fertilizers.
Horticulturae 11 00185 g008
Table 1. Monthly average temperature and total monthly precipitation in 2018.
Air Temperature (°C)Daylight LengthRelative HumidityPrecipitation
Min.Max.Mean(h)(%)(mm)
January−4.790.82315317.4
February−212.65.31885243.6
March−1.119.29291312.3
April2.518.510.52234950.1
May623.514.82684936.7
June9.232.120.7350210
July13.234.323.8343160
August11.734.523.1343190
September7.730.819.3318220
October3.422.212.82244321.7
November−0.1136.51656370.7
December−5.412.23.42525120.8
Table 2. Description of different treatments on Echinophora platyloba.
TreatmentDescription
Nitrogen (N)250 mg N/plant, urea + 500 mL water
Phosphorus (P)250 mg P/plant, triple superphosphate + 500 mL water
Potassium (K)250 mg K/plant, potassium sulfate + 500 mL water
Nitrogen + Phosphorus (NP)250 mg N/plant, urea + 250 mg P/plant, triple superphosphate + 500 mL water
Nitrogen + Potassium (NK)250 mg N/plant, urea + 250 mg K/plant, potassium sulfate + 500 mL water
Phosphorus + Potassium (PK)250 mg P/plant, triple superphosphate + 250 mg K/plant, potassium sulfate + 500 mL water
Nitrogen + Phosphorus + Potassium (NPK)250 mg N/plant, urea + 250 mg P/plant, triple superphosphate + 250 mg K/plant, potassium sulfate + 500 mL water
Positive control) (C+)500 mL water and no fertilizer
Negative control (C−)No fertilizer and no water
Table 3. Analysis of variance (mean square) for plant height, branch number, main stem diameter, leaf number, inflorescence number, and flower number in Echinophora platyloba exposed to different macronutrient fertilizers.
Source of VariationdfPlant HeightBranche NumberMain Stem DiameterLeaf NumberInflorescences NumberFlowers Number
Treatment8429 **111 **0.25 **35,589 **79 **40,692 **
Error274.47.650.014761.891253
CV (%) 7.319.310.78.710.712.6
**: significant at the 1% probability level.
Table 4. Analysis of variance (mean square) for aerial parts dry weight and essential oils in Echinophora platyloba exposed to different macronutrient fertilizers.
Source of VariationdfStem Dry WeightLeaf Dry WeightInflorescence Dry WeightAerial BiomassEssential Oils ContentEssential Oils Yield
Treatment812.1 **31.9 **79.1 **317 **0.26 **32,438 **
Error270.751.434.057.180.0531.6
CV (%) 15.115.514.29.723.93.8
**: significant at the 1% probability level.
Table 5. Chemical composition of essential oils in Echinophora platyloba exposed to different macronutrient fertilizers.
CompoundFormulaRIaRIbC−C+NPKNPNKPKNPK
α-PineneC10H169439391.201.161.461.81.921.801.692.041.25
β-PineneC10H169759792.043.195.336.107.708.786.516.614.47
MyrceneC10H169969910.750.812.091.051.111.191.601.040.87
p-CymeneC10H14102810251.842.721.212.482.061.121.643.001.51
LimoneneC10H16103510293.682.615.823.372.953.654.382.253.89
(E)-β-OcimeneC10H161050104427.8126.6421.3230.1026.9724.6924.1429.2526.85
TerpinoleneC10H16108010880.700.880.750.970.740.700.750.790.98
LinaloolC10H18O110010961.967.116.604.603.903.355.254.453.99
(3Z)-Hexenyl-2-methyl butanoateC11H20O2123512240.570.440.770.530.460.470.610.440.53
(3Z)-Hexenyl-3-methyl butanoateC11H20O2123712330.321.460.960.860.660.450.810.870.70
NeralC10H16O124212380.300.962.062.031.351.621.701.072.63
GeraniolC10H18O12561253-0.963.102.021.341.102.221.592.09
GeranialC10H16O127312671.422.784.203.903.163.953.682.364.87
Limonen-10-olC10H16O129512881.361.702.662.341.671.592.161.712.56
Methyl eugenolC11H14O2141214030.861.220.851.211.632.381.240.901.30
y-DecalactoneC10H18O2147014651.192.371.671.853.765.912.721.621.75
MyristicinC11H12O3151015170.360.620.510.470.700.950.610.460.59
KessaneC15H26O153615291.060.550.530.551.121.700.830.550.65
(3Z)-hexenyl benzoateC13H16O2156015650.391.960.600.680.750.930.680.570.86
SpathulenolC15H24O158215771.705.814.144.805.346.214.744.474.32
(E)-SesquilavandulolC15H26O1643163142.0020.7622.4320.9117.1714.0819.8020.2519.61
α-MuurololC15H26O165016440.33-0.55-0.660.800.600.51-
y-Dodecalactone C12H22O2167416760.95-0.721.011.381.871.050.890.95
Total identified (%) 92.7986.7190.3393.6388.5089.2989.4187.6987.22
RIa: Kovats index on the DB-5 column. RIb: Relative retention indices taken from Adams [29]. See Figure 1 for abbreviations.
Disclaimer/Publisher’s Note: The statements, opinions and data contained in all publications are solely those of the individual author(s) and contributor(s) and not of MDPI and/or the editor(s). MDPI and/or the editor(s) disclaim responsibility for any injury to people or property resulting from any ideas, methods, instructions or products referred to in the content.

