Article

Non-Destructive Monitoring of Postharvest Hydration in Cucumber Fruit Using Visible-Light Color Analysis and Machine-Learning Models

by
Theodora Makraki
1,
Georgios Tsaniklidis
2,
Dimitrios M. Papadimitriou
3,
Amin Taheri-Garavand
4 and
Dimitrios Fanourakis
1,*
1
Laboratory of Quality and Safety of Agricultural Products, Landscape and Environment, Department of Agriculture, School of Agricultural Sciences, Hellenic Mediterranean University, 71004 Heraklion, Greece
2
Institute of Olive Tree, Subtropical Plants and Viticulture, Hellenic Agricultural Organization ‘ELGO-Dimitra’ Kastorias 32A, 71307 Heraklion, Greece
3
Department of Agriculture, Laboratory of Natural Resources Management & Agricultural Engineering, Hellenic Mediterranean University, 71410 Heraklion, Greece
4
Mechanical Engineering of Biosystems Department, Lorestan University, Khorramabad P.O. Box 465, Iran
*
Author to whom correspondence should be addressed.
Horticulturae 2025, 11(11), 1283; https://doi.org/10.3390/horticulturae11111283 (registering DOI)
Submission received: 1 October 2025 / Revised: 14 October 2025 / Accepted: 20 October 2025 / Published: 24 October 2025

Abstract

Water loss during storage is a major cause of postharvest quality deterioration in cucumber, yet existing methods to monitor hydration are often destructive or require expensive instrumentation. We developed a low-cost, non-destructive approach for estimating fruit relative water content (RWC) using visible-light color imaging combined with an ensemble machine-learning model (Random Forest). A total of 1200 fruits were greenhouse-grown, harvested at market maturity, and equally divided between optimal and ambient storage temperature (10 and 25 °C, respectively). Digital images were acquired at harvest and at 7 d intervals during storage, and color parameters from four standard color systems (RGB, CMYK, CIELAB, HSV) were extracted separately for the neck, mid, and blossom regions as well as for the whole fruit. During storage, fruit RWC decreased from 100% (fully hydrated condition) to 15.3%, providing a broad dynamic range for assessing color–hydration relationships. Among the 16 color features evaluated, the mean cyan component (μC) of the CMYK space showed the strongest relationship with measured RWC (R2 up to 0.70 for whole-fruit averages), reflecting the cyan region’s heightened sensitivity to dehydration-induced changes in pigments, cuticle properties and surface scattering. The Random Forest regression model trained on these features achieved a higher predictive accuracy (R2 = 0.89). Predictive accuracy was also consistently higher when μC was calculated over the entire fruit surface rather than for individual anatomical regions, indicating that whole-fruit color information provides a more robust hydration signal than region-specific measurements. Our findings demonstrate that simple visible-range imaging coupled with ensemble learning can provide a cost-effective, non-invasive tool for monitoring postharvest hydration of cucumber fruit, with direct applications in quality control, shelf-life prediction and waste reduction across the fresh-produce supply chain.

1. Introduction

Water loss during storage is a major determinant of postharvest quality deterioration in fruits and vegetables [1,2]. Dehydration accelerates softening, shriveling and loss of marketability, ultimately reducing shelf life and increasing food waste [1,3]. Conventional quality control practices rely mainly on visual inspection or destructive sampling of a small number of fruits, which provides only a coarse and often unreliable estimate of hydration status at the batch level [4,5].
Non-destructive sensing of water content in plant tissues has been widely explored at the leaf or canopy scale using hyperspectral, near-infrared (NIR) and magnetic resonance techniques [6,7]. Although these approaches can achieve high prediction accuracies, they are expensive, require specialized instrumentation and trained operators, and are therefore largely confined to research environments rather than routine commercial use [6,8]. At the individual fruit level, very few low-cost methods have been demonstrated for directly estimating relative water content (RWC) during storage [9,10].
Visible-range color imaging offers a promising alternative. Standard digital cameras are inexpensive, widely available and capable of capturing subtle spectral shifts in the 400–700 nm region that may reflect changes in tissue hydration, surface scattering and pigment composition [11]. In addition to pigment changes, the fruit cuticle strongly influences both water loss and surface reflectance. Recent work shows that cuticle composition, thickness and microstructure govern reflectance in the blue–green region as well as regulate transpirational water loss [12,13]. Similarly, postharvest changes in cuticle biophysics have been shown to correlate with both optical appearance and moisture retention [14]. These findings provide a mechanistic basis for expecting short-visible (especially cyan) wavelengths to be sensitive to hydration status. However, the relationships between color features and fruit RWC have not been systematically quantified, and no robust, low-cost model currently exists for routine postharvest monitoring of cucumber hydration.
Fruits (e.g., cucumber, tomato and melon) exhibit longitudinal anatomical heterogeneity, with physiologically distinct zones, namely the stem-end, middle and blossom-end, differing in traits such as firmness, sugar content, water distribution and respiration rate [15,16]. These zones may experience distinct microclimatic conditions and vary in tissue structure, resulting in spatial differences in water loss and associated surface color [16,17]. Such intra-fruit variability can confound hydration assessment when the fruit is analyzed as a uniform entity, highlighting the need for localized, segment-specific evaluation methods.
Machine-learning algorithms can extract complex, non-linear relationships between image features and physiological traits without requiring pre-defined indices [18,19]. Ensemble methods such as Random Forest (RF) are especially attractive because they handle multicollinearity among predictors, are resistant to overfitting and yield straightforward measures of variable importance [20,21]. Combining standard color imaging with such models could therefore provide a practical pathway for objective, non-destructive assessment of cucumber hydration status during storage.
The objective of this study was to develop and evaluate a low-cost method for estimating fruit RWC using visible-light color features and an RF model. Cucumber (Cucumis sativus L.) was selected as a model system due to its high water content (~95%) and susceptibility to dehydration, short shelf life and strong commercial relevance, making it ideal for studies on postharvest monitoring and quality improvement [22,23]. In this context, inclusion of near-ambient storage temperatures, commonly encountered in the supply chains of developing countries where refrigeration infrastructure may be limited [24,25], enhances the practical relevance of the proposed approach for postharvest monitoring under real-world, resource-constrained conditions. A further objective was to compare color features extracted from defined anatomical regions (neck, mid, blossom) with whole-fruit averages to determine whether aggregating across the entire surface improves predictive performance, and to identify the most informative features across multiple color spaces (RGB, CMYK, CIELAB, HSV). In this study, we present a low-cost, visible-light imaging approach combined with an RF regression model to estimate RWC of cucumber fruit non-destructively during storage. Uniquely, we identify the mean cyan (μC) component of the CMYK system as the most powerful single predictor and show that whole-fruit color information yields higher predictive accuracy than region-specific measurements, distinguishing our work from previous methods relying on costly instrumentation or single-point measurements.

2. Materials and Methods

2.1. Plant Material and Growth Conditions

The experiment was carried out in a greenhouse (0.63 ha) located in Rethymno, Crete, Greece (35.3647° N, 24.4822° E). Sampling was conducted in a commercial facility because above- and below-ground conditions frequently differ markedly between experimental and commercial environments, thereby constraining the extrapolation of research findings to real-world contexts [26]. ‘Cretasun RZ’ (Rijk Zwaan, De Lier, The Netherlands), a parthenocarpic hybrid, was selected because it produces seedless cucumbers of highly uniform shape, size and color at harvest, thereby reducing background variability and allowing a more reliable assessment of the relationship between external color traits and fruit RWC after harvest. Transplanting took place on 10 November 2024 and harvest on 10 February 2025. Growing the plants in winter under well-watered conditions ensured high plant turgor and full fruit hydration at harvest, creating a clear starting point for monitoring postharvest water loss.
Plants were grown in single rows (3 plants m−1, 1.6 m between rows), giving a density of 1.5 plants m−2. Cultivation was performed on Crodan rockwool slabs placed on gutters.
Greenhouse climate was managed with active heating, maintaining a minimum temperature of 14 °C, while no supplemental lighting was used. The average daily light integral during the cultivation period ranged from 6 to 12 mol m−2 d−1, and relative air humidity was maintained between 65 and 80%. Environmental parameters were continuously recorded with an automated climate control and data-logging system.
Irrigation and fertigation were delivered through a closed hydroponic drip-irrigation system, scheduled according to radiation sum and substrate moisture. The nutrient solution composition was adjusted to the plant growth stage, with an electrical conductivity (EC) of 2.5–3.0 dS m−1 and pH of 5.5–6.0.
Lateral shoots were pruned above the second leaf to limit vegetative overgrowth and enhance fruit set. The first 7–8 fruits per plant were removed to maintain an adequate source–sink balance. Fruits for analysis were harvested at the node corresponding to the 20th leaf (cross-harvest), as fruit set at this position represents a stable mid-season developmental stage in which plant growth and source–sink relationships have equilibrated, thereby ensuring uniform size and maturity among experimental samples.
Fruits were harvested exactly 1 h prior to the onset of the photoperiod, a time chosen to coincide with peak morning turgor and minimal transpirational water loss. At this stage, fruits were considered fully hydrated (RWC = 100%). Although the fruit samples were not rehydrated after collection to verify full saturation, the combination of well-watered plants, low transpiring (winter) conditions and the timing of harvest support the assumption of full hydration. All fruits were clipped from the plant using sterilized scissors, handled only by the peduncle to avoid pressure on the pericarp, immediately placed into pre-cooled, perforated polyethylene containers lined with moist paper to limit evaporative loss, and the peduncle was then removed prior to further processing. The containers were kept inside an insulated box with ice packs, maintaining an internal temperature of approximately 10 °C during transport. The transit from the cultivation site to the laboratory did not exceed 2 h. All fruits were uncoated and unwaxed, and no surface treatments were applied. Upon arrival at the laboratory, fruit surface moisture was gently blotted away, sample labels were checked, and all subsequent analyses (weighing, imaging) commenced immediately to minimize post-harvest changes. The average fruit length, diameter and weight were 17.4 ± 0.6 cm, 3.2 ± 0.1 cm and 120 ± 5 g, respectively. Fruit length was measured excluding the peduncle and blossom remnant, and diameter was taken at the mid-equator with calipers. All fruits were straight (angle between the longitudinal axis of the fruit and a horizontal reference line < 1°, determined from digital images), and diameter variation between the equator and distal/proximal ends was lower than 5%.
Fruits were then stored either at optimal storage temperature (10 °C) or at ambient room temperature (25 °C). At each storage temperature, fruits were weighed for RWC estimation and imaged for colorimetric analysis at time 0 (immediately upon arrival at the laboratory) and subsequently at 7 d intervals. Samples from the 10 °C storage were evaluated and returned to the storage facility within 10 min to minimize temperature fluctuations. Measurements were continued up to 49 d for fruit stored at 10 °C and up to 28 d for fruit stored at 25 °C. Fruits were carefully handled during all stages of handling, storage, and assessment to avoid mechanical injury and bruising. In total, 1200 fruits were analyzed, equally divided between the two temperature regimes.

2.2. Relative Water Content

In this study, hydration status is quantified as fruit RWC, while acknowledging that other indicators (e.g., water potential, gravimetric water content/mass loss, dielectric/impedance measures, low-field NMR metrics) reflect complementary aspects of the same state. Because these measures are physically connected (e.g., pressure–volume theory links RWC with water potential, and water loss decreases water content while altering dielectric and LF-NMR signals), a monotonic relationship between RWC and these indicators is expected, although each captures a different facet (amount vs. potential vs. mobility). A hydration gradient was established by subjecting the harvested fruits to storage. Each fruit was weighed at 7 d intervals at either storage temperature. Immediately after each weighing, an image of the entire fruit was captured (see below). At the end of the storage period, fruits were oven-dried for 96 h at 80 °C to determine dry weight. Fruit RWC (also referred to as relative turgidity) was then calculated using the following equation [11]:
R W C = f r e s h   w e i g h t d r y   w e i g h t s a t u r a t e d   f r e s h   w e i g h t d r y   w e i g h t × 100

2.3. Colorimetric Analysis

Fruit was photographed using a custom-built imaging station (l × w × h = 44 × 44 × 44 cm) designed to provide a stable, enclosed environment for color acquisition [27]. To maintain consistent and defined illumination conditions, an artificial lighting system consisting of a 4000 K white light-emitting diode (LED) strip (Philips, Eindhoven, The Netherlands) was installed along the top (interior) side of the station. The LED was operated at constant current to minimize flicker and spectral drift, and the enclosure was allowed to stabilize for 5 min before each imaging session to avoid warm-up effects. Spectral profile and photon flux of the LED lighting were monitored throughout the experiment and remained stable over time. To enhance light reflectivity and ensure an even light distribution, all interior walls of the imaging station were painted matte white, and the fruit was placed on a non-reflective white platform aligned with the optical axis. Images were captured through a circular aperture (diameter 8 cm) positioned at the center of the top panel. The aperture was surrounded by a light baffle to prevent stray light and glare. The camera-to-sample distance was kept constant at 36 cm by mounting the camera on a fixed bracket, and the field of view was marked to ensure identical sample positioning. Samples were manually inserted via a front access door. To avoid light contamination, the door was closed during image acquisition, and all imaging was performed in a darkened room (<1 µmol m−2 s−1 ambient light).
Before each imaging session, a neutral white and a 24-patch color calibration card (X-Rite ColorChecker, Grand Rapids, MI, USA) were photographed under the same conditions to enable color standardization and white-balance correction during image processing. These calibration images were used to compute a session-specific white-balance and color-correction transform, which was then applied to all fruit images to ensure standardized color values across sessions. Samples were imaged against a uniform white, non-glossy background to facilitate segmentation. Two-dimensional (2D) images were recorded using a charge-coupled device (CCD) digital camera (PowerShot G15, 12 megapixels; Canon, Tokyo, Japan) mounted with a fixed focal length lens. Across all evaluations, image capture settings [resolution 12 megapixels, f-stop 2.8, shutter speed (exposure time) 1/100 s, ISO 800 (ISO-800), no flash or digital zoom, daylight white-balance] were held constant. Images were stored in the RGB color space and saved in JPEG format (4000 × 3000 pixels) at maximum quality. Environmental conditions (air temperature 25 ± 0.1 °C, relative air humidity 50 ± 5%) inside the laboratory were monitored to ensure stable conditions throughout imaging. Under this setup, the manual workflow (i.e., placing the fruit, closing the door, clicking capture and running the feature-extraction script) required approximately 1 min fruit−1, allowing the system to process roughly 60 fruits h−1. Automating positioning, imaging and feature extraction would substantially reduce the required time per fruit [28], thereby enabling true high-throughput operation and illustrating the system’s scalability for commercial packhouse applications.
The captured images were digitally processed using Trigit (accessed September 2025) [29] for the acquisition of colorimetric features in the following color systems (also referred to as color spaces): RGB [red (R), green (G) and blue (B)], CMYK [cyan (C), magenta (M), yellow (Y) and key (black; K)], CIELAB [lightness (L*), red/green (a*), and yellow/blue (b*)], and HSV [hue (H), saturation (S), and value (V)] (Table 1). Trigit is a free web application that segments user-defined regions of an image, applies white-balance and color-correction transforms from calibration targets, and outputs mean pixel values for multiple color spaces to facilitate rapid colorimetric analysis. Prior to analysis, each image was white-balanced against a neutral reference card to standardize color across sessions.
For each measurement, fruits were placed in a fixed orientation so that the same areas of each fruit were always exposed to the imaging device. This ensured that differences among anatomical regions could be assessed consistently (Figure 1). Color parameters were extracted separately for three longitudinal regions of each fruit: the neck or stem end (proximal ≈ 0–6 cm from the stalk attachment point), the mid-region (central ≈ 6–12 cm of the fruit equator) and the blossom region or blossom end (distal ≈ 12–17 cm surrounding the flower end), as well as for the whole fruit.

2.4. Imaging Deployment Standards: Lighting and Defect Pre-Screening

The procedures described below were not performed in this study. They are provided as recommended practices for future deployment outside the laboratory, including lighting standardization and a brief quality-control pre-screen to detect and mask surface defects or early lesions before color extraction.
In operational settings, images can be acquired under controlled illumination and fixed camera settings to ensure color stability. A compact imaging hood or light tent can be used to block ambient light, with illumination provided by high-CRI (≥95), flicker-free LED panels at fixed geometry and distance (CCT 5000–6500 K). Camera parameters should be set to manual exposure and fixed white balance, and images should be captured in RAW or the highest-quality JPEG. At the start of each imaging session, photograph a neutral gray card and a multi-patch color reference to enable automated white balance and color correction. Recapture the references whenever lighting conditions change. For mobile use where a full enclosure is not feasible, use a portable shroud and a standardized matte background, and lock exposure and white balance. Perform session-wise recalibration to maintain consistency across sites.
In commercial grading, fruit with obvious defects or disease symptoms are typically off-grade and removed prior to sale, so such cases fall outside the intended application scope. Nonetheless, minor cosmetic defects and early lesions can alter optical signals (gloss, saturation, local hue) and may bias color-based prediction. As guidance for deployment, we recommend a brief quality-control pre-screen prior to color extraction (e.g., rule-based thresholding or a lightweight classifier/segmenter) to mask or reject affected areas so that features are computed from intact surface regions only.

2.5. Statistical Analysis and Model Development

Color features extracted from the digital images (Table 1) were used as predictors of fruit RWC. All estimations, both linear and RF, were performed for each anatomical region (neck, mid, blossom) as well as for the whole fruit.
For each color feature, we first fitted simple linear regression models. The bootstrap percentile method was used to calculate 95% confidence intervals (CIs) of the intercept and slope for each model [30]. Model accuracy was evaluated by random sampling with replacement of 400 samples from the dataset for each estimate. The coefficient of determination (R2) and the mean square error (MSE) were used to assess model fit.
RWC was then estimated from the full set of color features by using the Random Forest Regression (RFR) algorithm originally proposed by Breiman (2001) [21]. RFR is a widely adopted supervised-learning technique that builds an ensemble of decision trees, each trained on a different bootstrap sample of the training data, and averages their outputs to produce the final prediction. This procedure enhances model stability and markedly reduces variance and overfitting relative to single-tree approaches. Each decision tree has a hierarchical structure of binary decision nodes that split the data based on input-feature values until reaching terminal nodes, or “leaves,” which contain the prediction outcomes. To increase diversity among trees and improve generalization, both bootstrap sampling of observations and random selection of predictor variables at each node split were used.
In our implementation, hyperparameters were selected empirically and refined through iterative testing to balance computational efficiency with predictive accuracy. Forests comprised 30 decision trees, each with a maximum of 10,000 leaves. This value served as an upper bound, and in practice realized trees were much smaller because other stopping criteria, including feature subsampling at splits, impurity reduction thresholds, and minimum samples per split or per leaf, limited growth. Each tree was trained on a stratified bootstrap sample corresponding to 10% of the full training dataset, with observations drawn evenly from each decile of the predictor-variable range to ensure comprehensive coverage of the solution space. Sensitivity analysis showed that varying the number of trees or the maximum leaf limit by up to 50% had minimal effect on model performance, indicating robustness of the chosen configuration [31]. In line with recommendations in the literature [32], additional key hyperparameters known to influence RF performance, such as the number of features considered at each split (max_features) and the maximum tree depth (max_depth), were also adjusted to achieve stable behavior under our specific application constraints. Besides its predictive capability, the RFR algorithm enables assessment of variable importance and inspection of decision pathways, which provides insight into the relative influence of each input feature on RWC variability.
Model performance was evaluated using a comprehensive suite of statistical metrics: Pearson’s correlation coefficient (R), R2, MSE, root mean squared error (RMSE) and mean absolute error (MAE). These indices jointly characterize model fit by assessing both the strength of association between predicted and observed values and the average magnitude of prediction residuals.
Separate models were initially tested for each storage temperature (10 and 25 °C), but both linear and RF approaches produced unstable parameter estimates and lower accuracy (R2 decreased by ≈ 0.15–0.20; RMSE increased by ≈ 30%) because of the reduced sample size and narrower RWC range. Because the underlying mechanisms of dehydration and color change are similar across these temperatures [33,34], and a stratified 70/30 split was performed within each temperature so that fruits from both conditions were represented in the training and testing sets, we therefore pooled the two datasets to increase statistical power and hydration-range coverage. Pooling improved model stability and predictive performance, while including temperature as an input variable enabled the unified model to capture any temperature-specific effects and preserve generalization across storage regimes. This approach therefore better reflects the real-world situation in which fruits from different storage conditions may be mixed within supply chains [35].

3. Results

3.1. Performance of Linear Regression Models

RWC of cucumber fruit was estimated from colorimetric features extracted from digital images (Table 2). Three longitudinal regions of each fruit (neck/stem end, mid-region and blossom end) were analyzed separately, in addition to a whole-fruit assessment. In all samples, the magenta (M) component of the CMYK color system was consistently zero and therefore excluded from further analysis. Among the remaining 15 colorimetric traits examined (Table 1), the mean cyan component (μC) of the CMYK system exhibited the strongest relationship with measured RWC, with R2 values higher or equal to 0.617. A more modest estimation was obtained using proportions of red (%R; 0.485 ≤ R2). In contrast, all other color traits showed poor predictive performance (R2 ≤ 0.402).
When μC was calculated separately for the three longitudinal regions, its predictive power was consistently lower than when derived from the entire fruit surface. This indicates that, for RWC estimation, the mean cyan value integrated over the whole fruit provides a more reliable and robust predictor than region-specific values.

3.2. Performance of the Random Forest Model

Figure 2 illustrates the structure of the Random Forest Regression (RFR) algorithm applied in this study to predict fruit RWC. Multiple decision trees, each trained on a bootstrap sample of the predictor variables, independently estimate RWC. Their outputs are then averaged to generate the final prediction. This ensemble approach leverages the diversity of individual trees to achieve high predictive accuracy and reduce model variance.
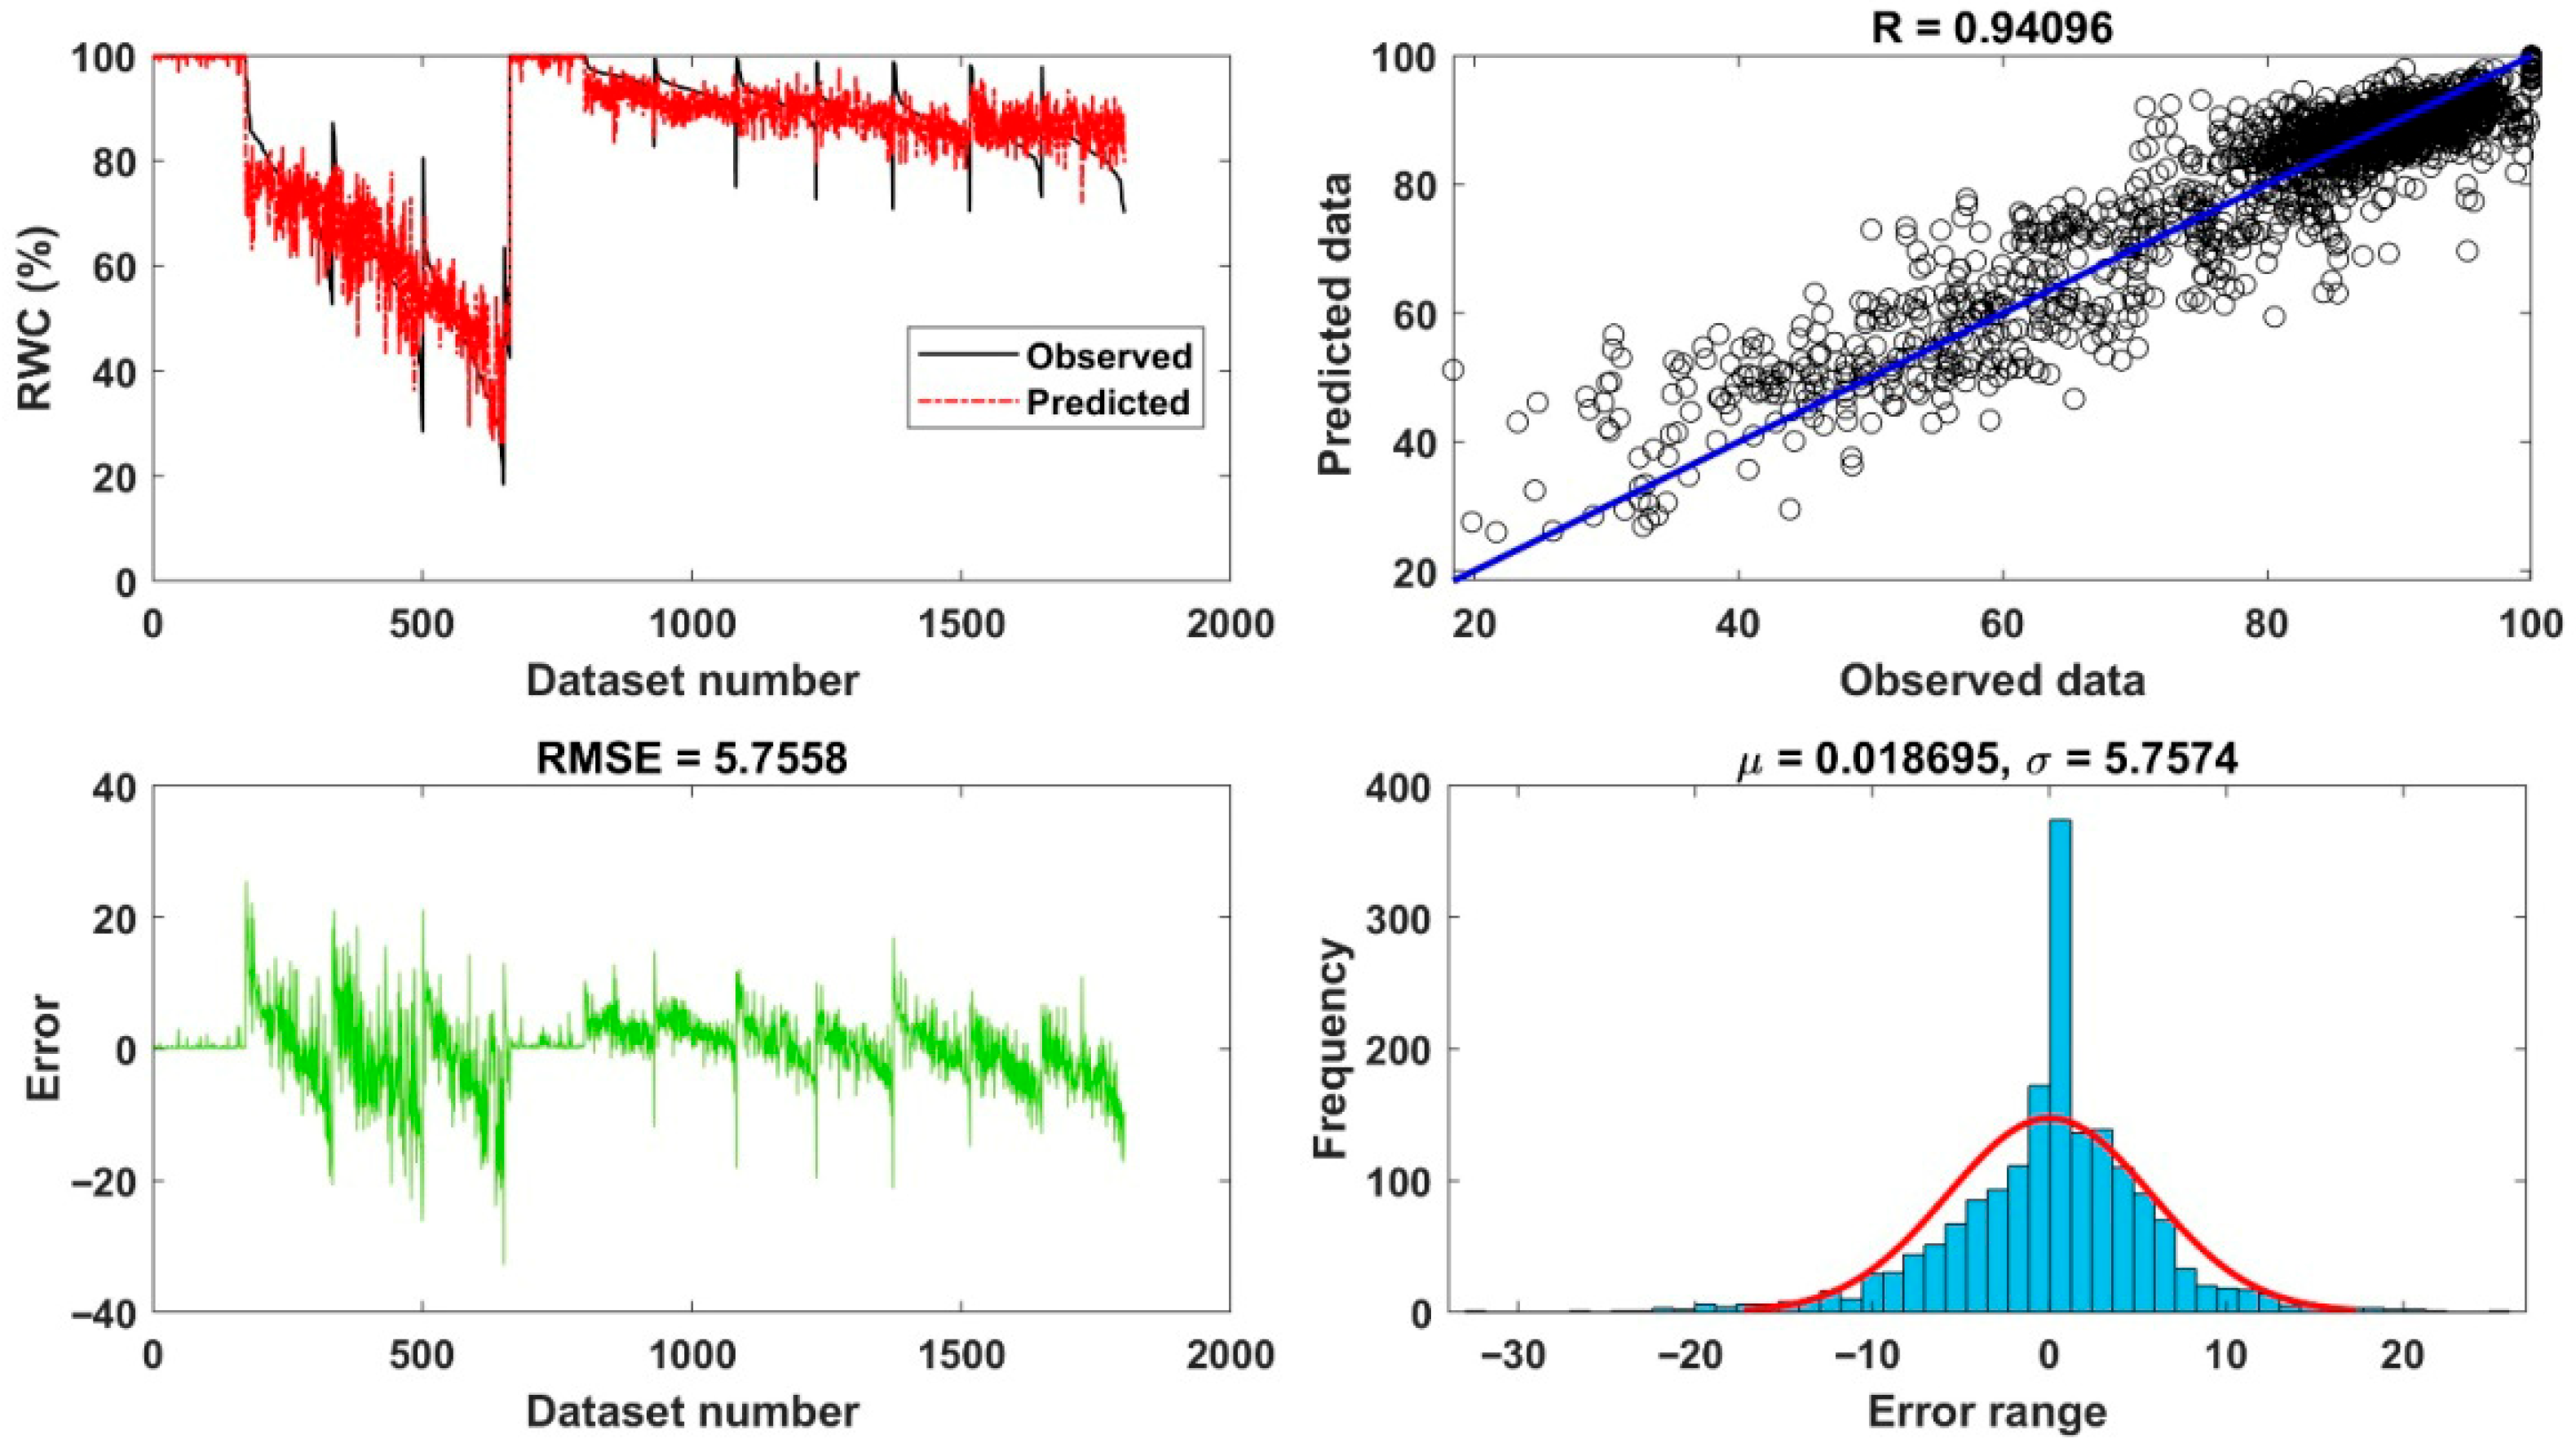
For the whole-fruit assessment, the performance of the RF model trained on these features is illustrated in Figure 3. The close agreement between RF-predicted and experimentally measured RWC values (concordance plot) indicates that the model provides accurate and unbiased estimates of fruit hydration status. In the scatter plot of predicted versus measured data, most points clustered tightly along the 45° reference line (y = x), indicating a high level of predictive accuracy. The relative error across the testing dataset indicates that prediction residuals were generally small and randomly distributed. The error distribution was narrow and centered around zero, consistent with low bias and high model precision. During the testing stage, the model achieved an RMSE of 5.76% and a Pearson correlation coefficient (R) of 0.941, confirming strong agreement between predictions and observations.
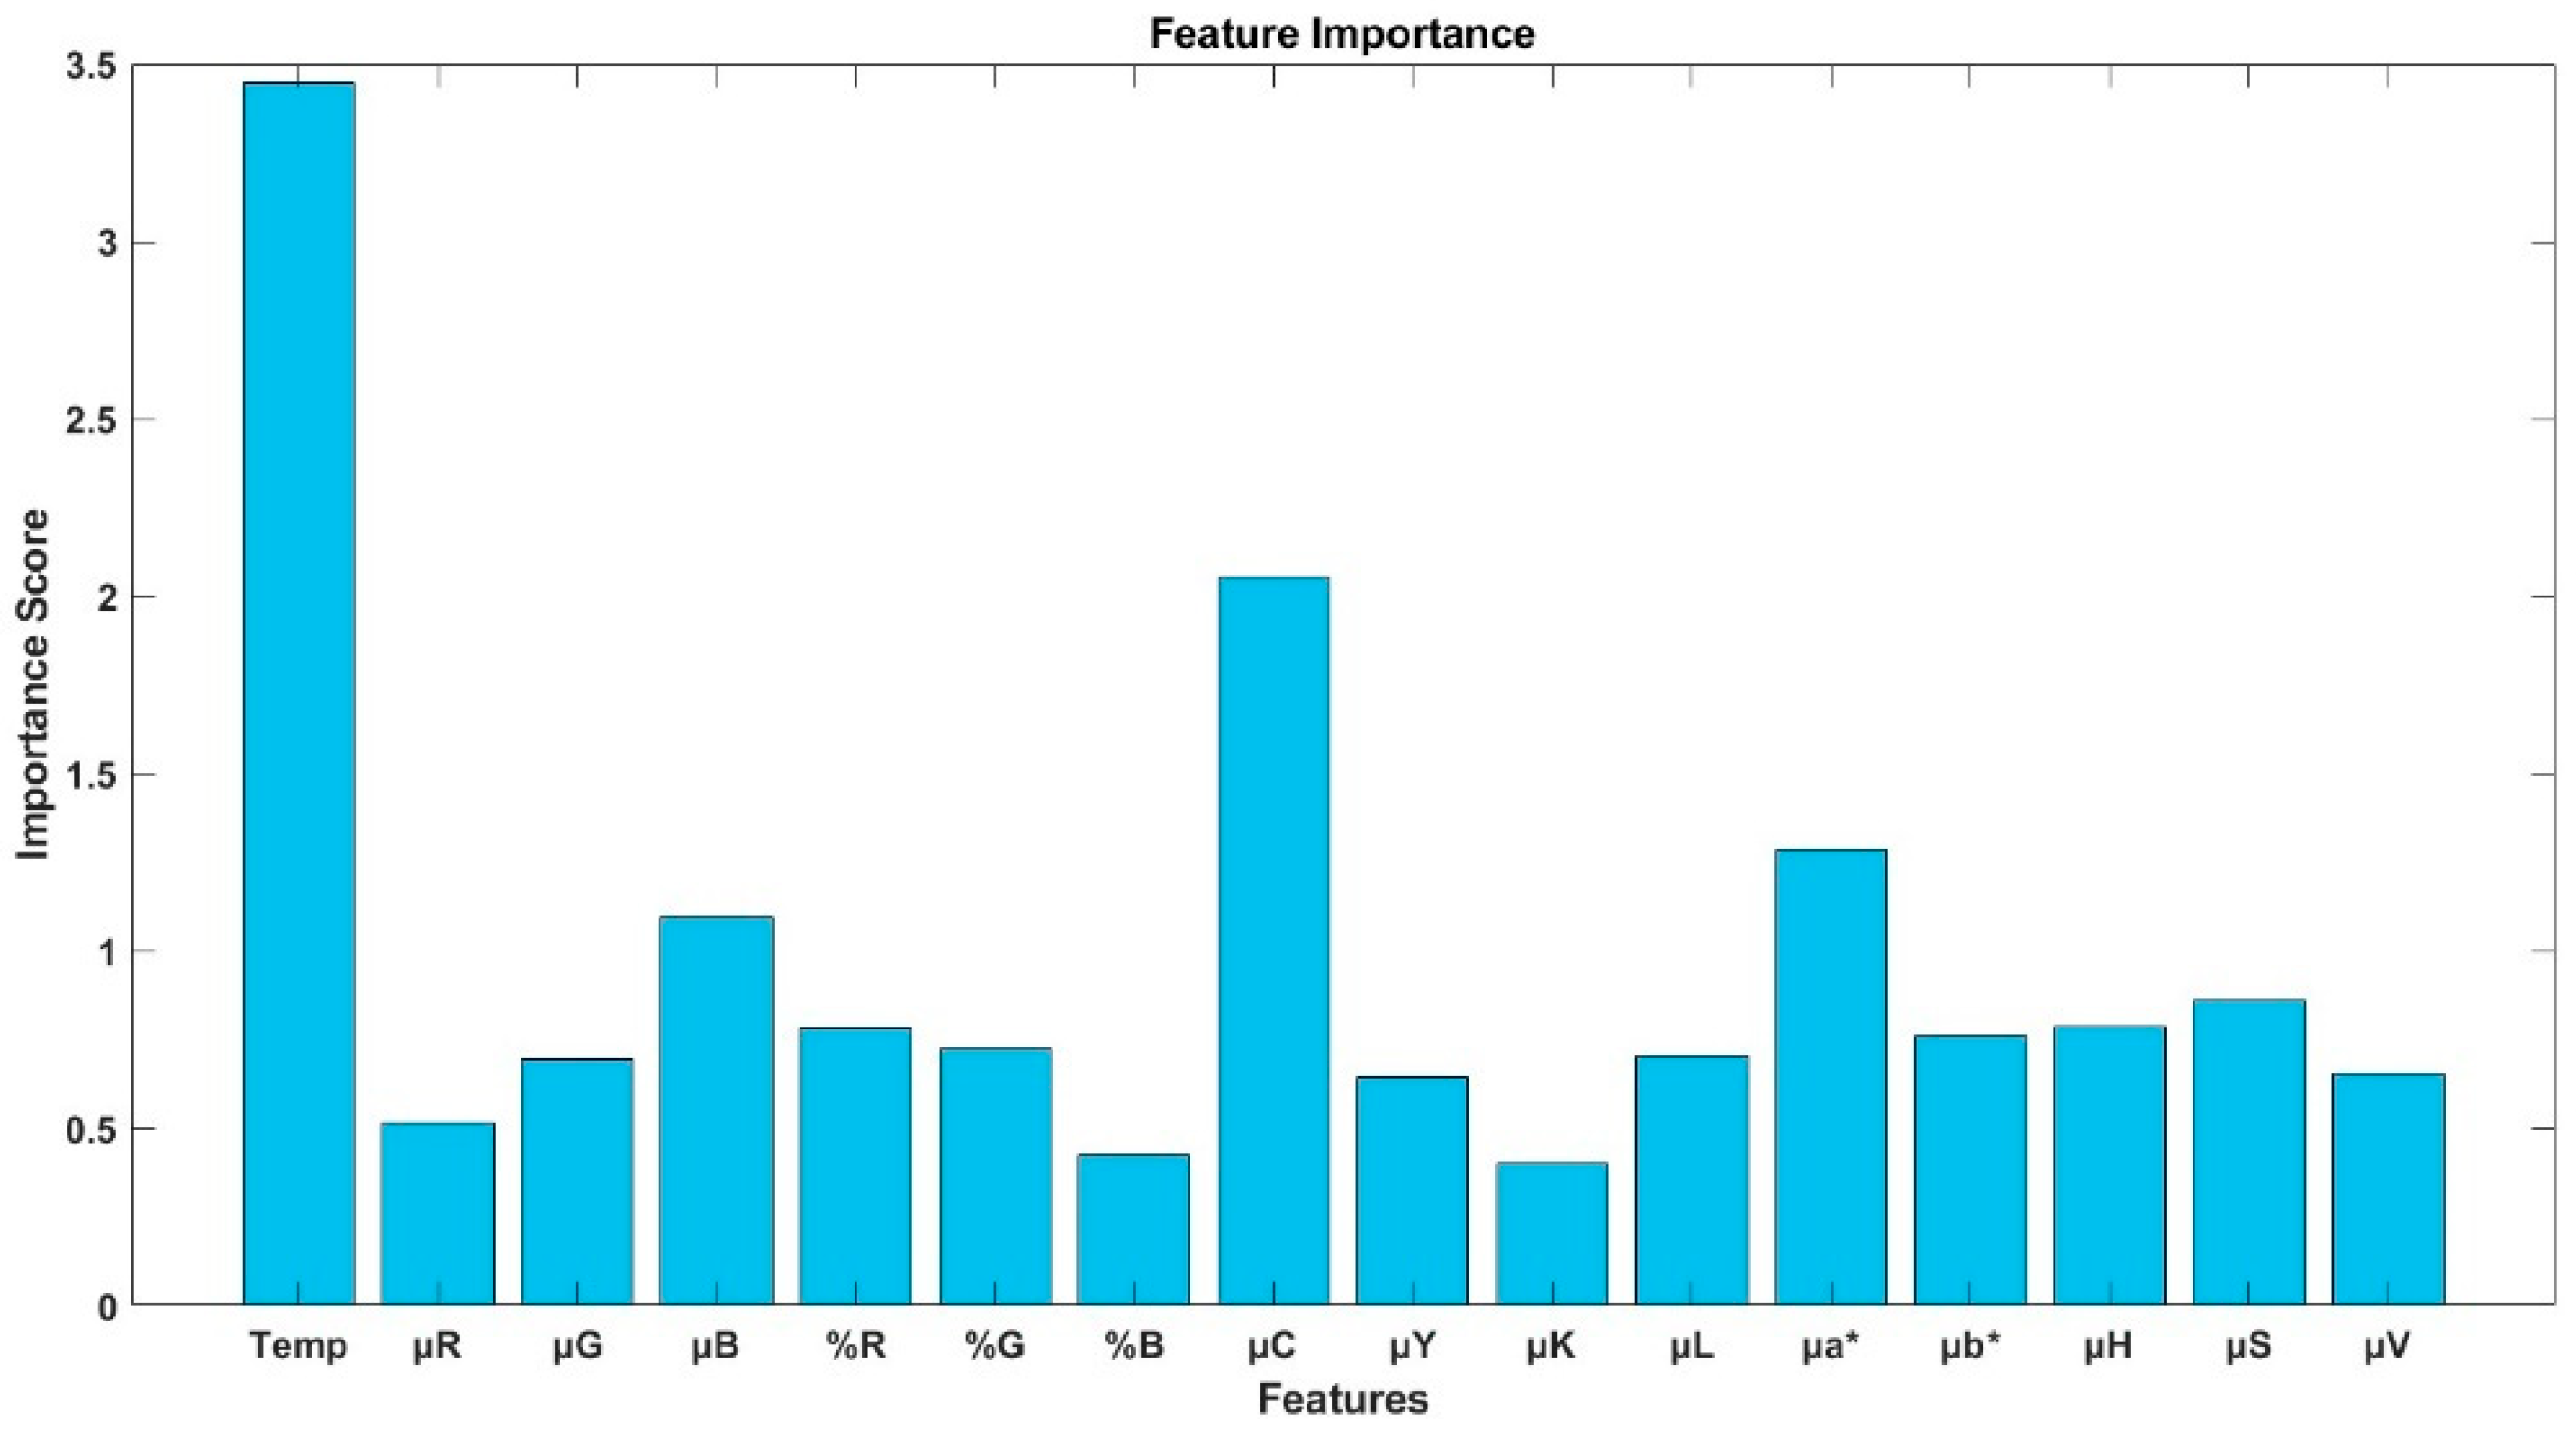
Figure 4 ranks the relative importance of the top 16 input features in the RF model. Importance scores were computed as the mean decrease in impurity averaged across all 30 decision trees. Temperature was the most influential predictor, followed by μC, highlighting the dominance of cyan-channel information in explaining fruit water status.
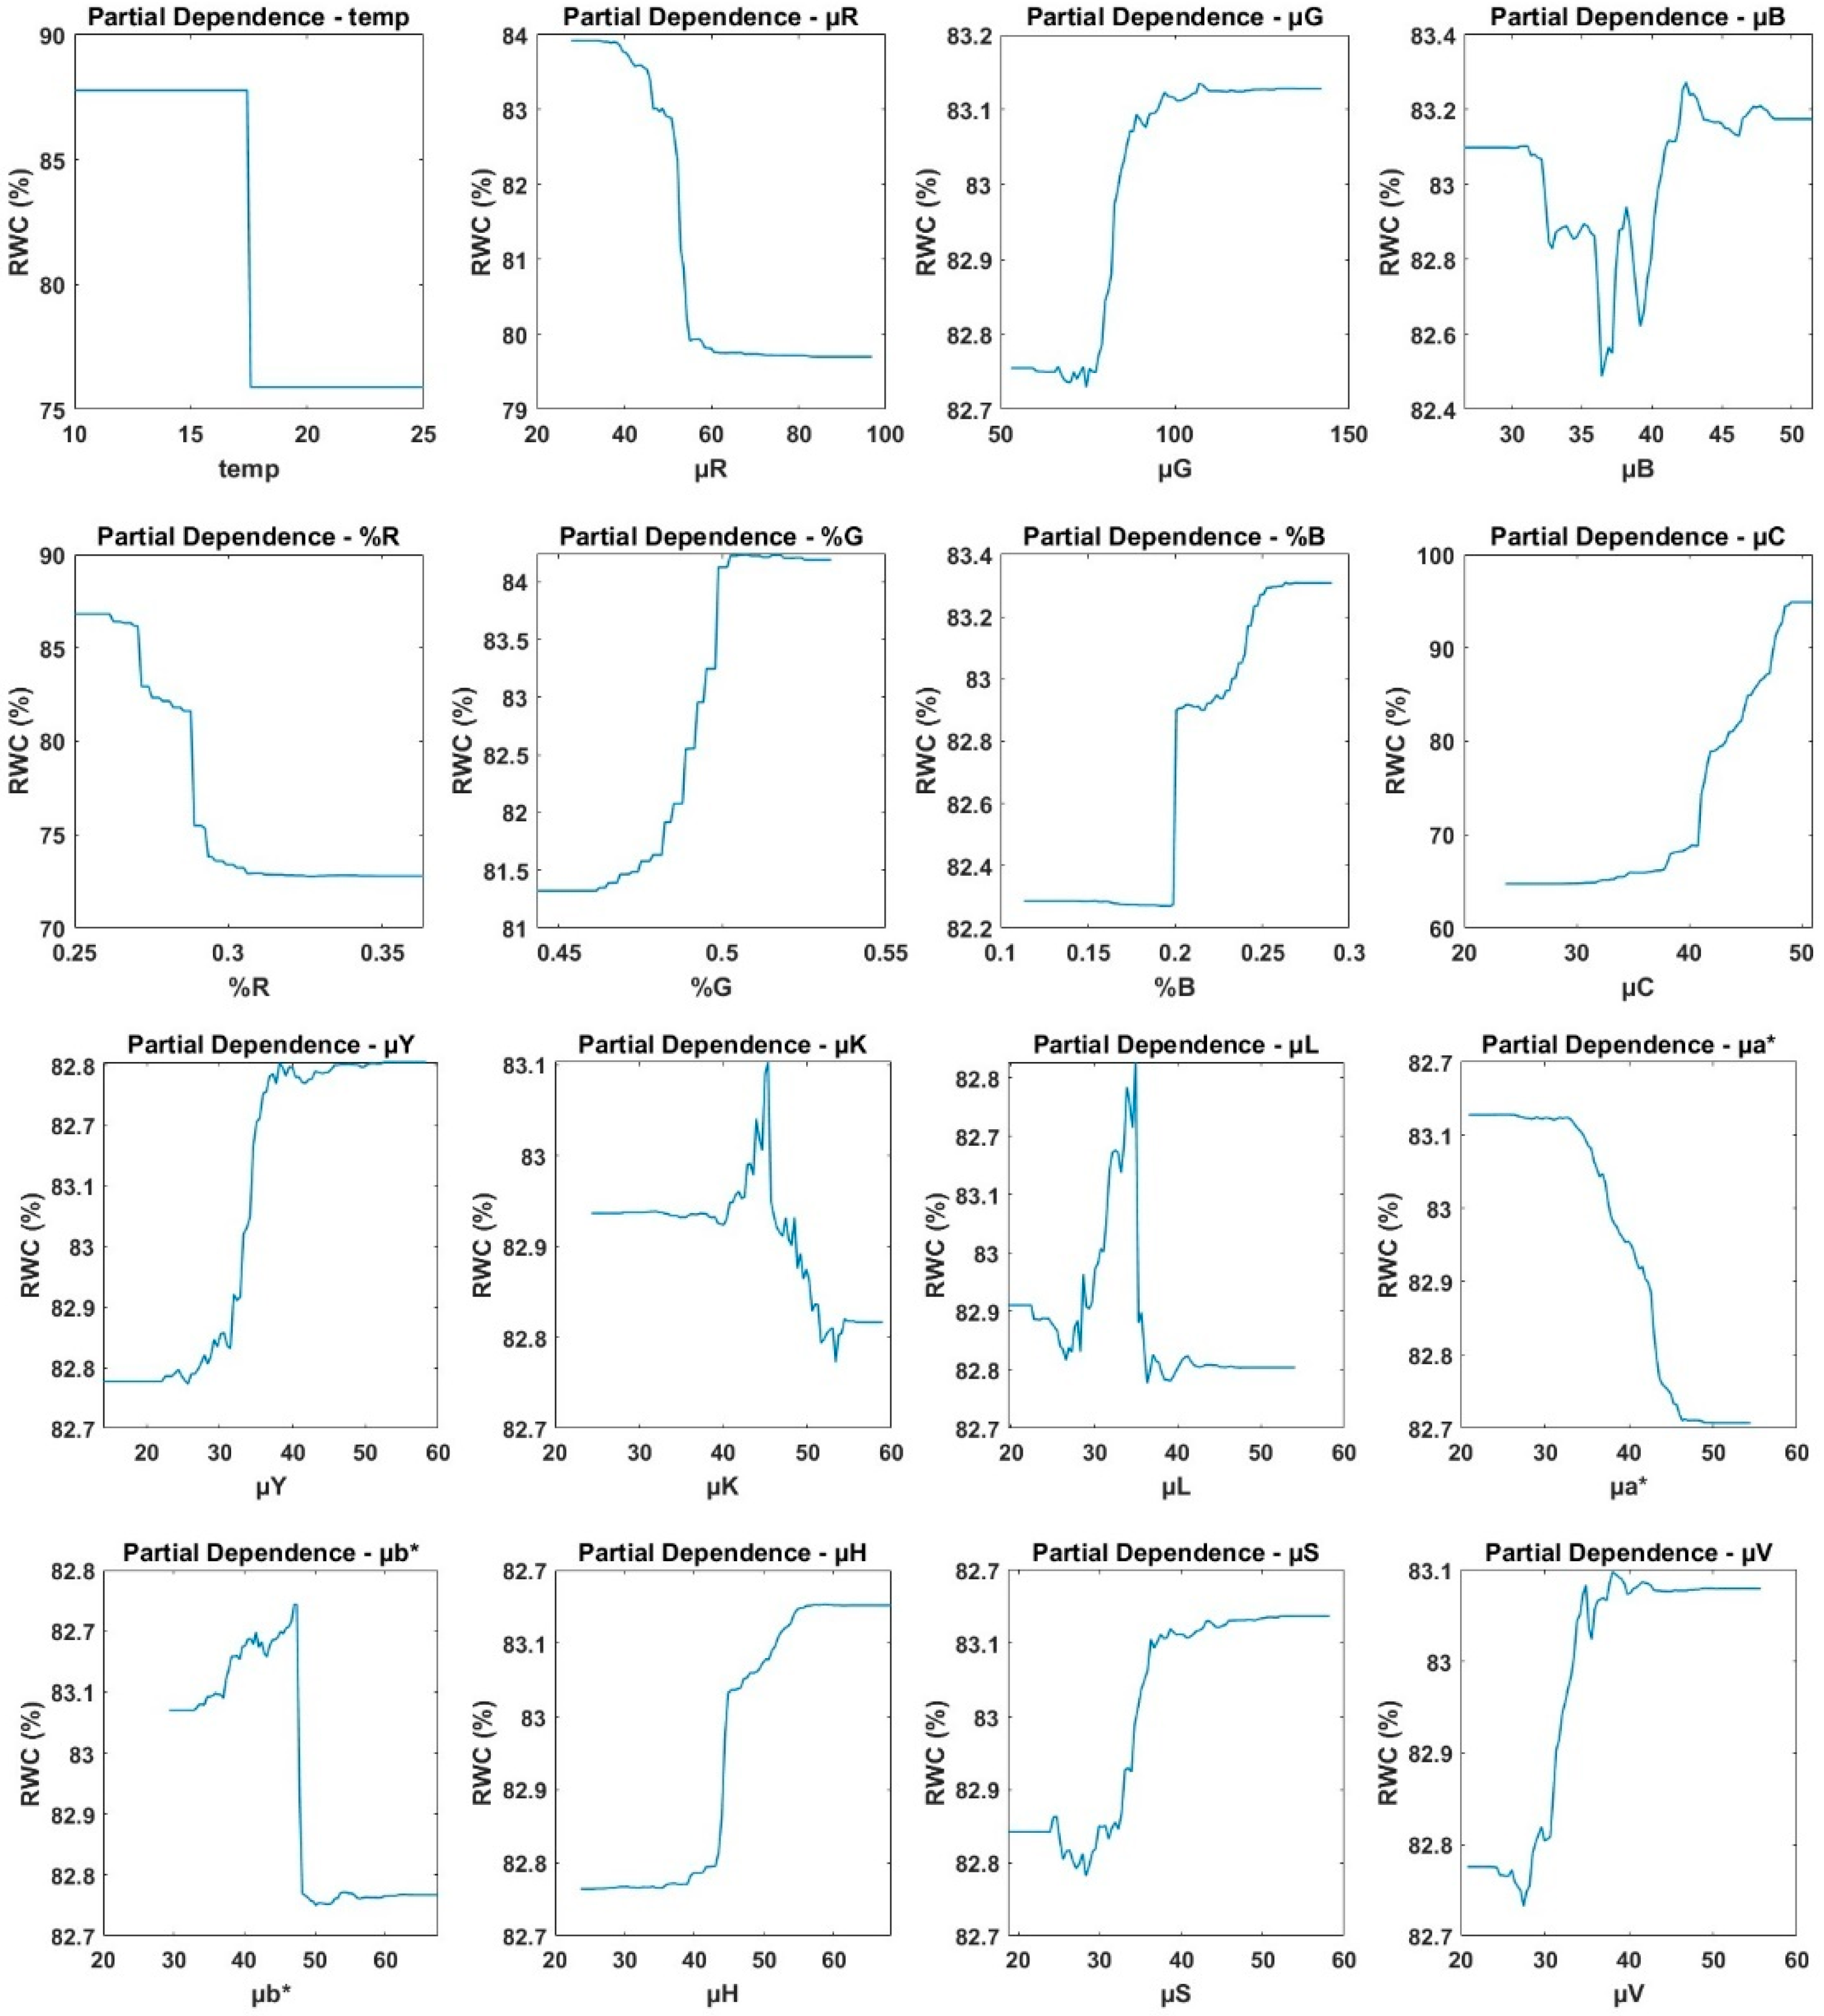
Partial dependence plots in Figure 5 further elucidate how key input variables influence predicted RWC. Temperature, μR, %R, and μa* displayed a pronounced negative effect. Instead, μG, %G, %B, μC, μY, and μH showed a strong positive association with RWC. Partial dependence plots for μB, μK, μL, μb*, μS and μV exhibited complex, non-linear patterns with multiple inflection points, indicating threshold effects. These patterns indicate that both pigment-related reflectance metrics (CIELAB and hue features) and visible-range attributes reflecting surface/subsurface optical properties (saturation and brightness) underpin fruit water status.
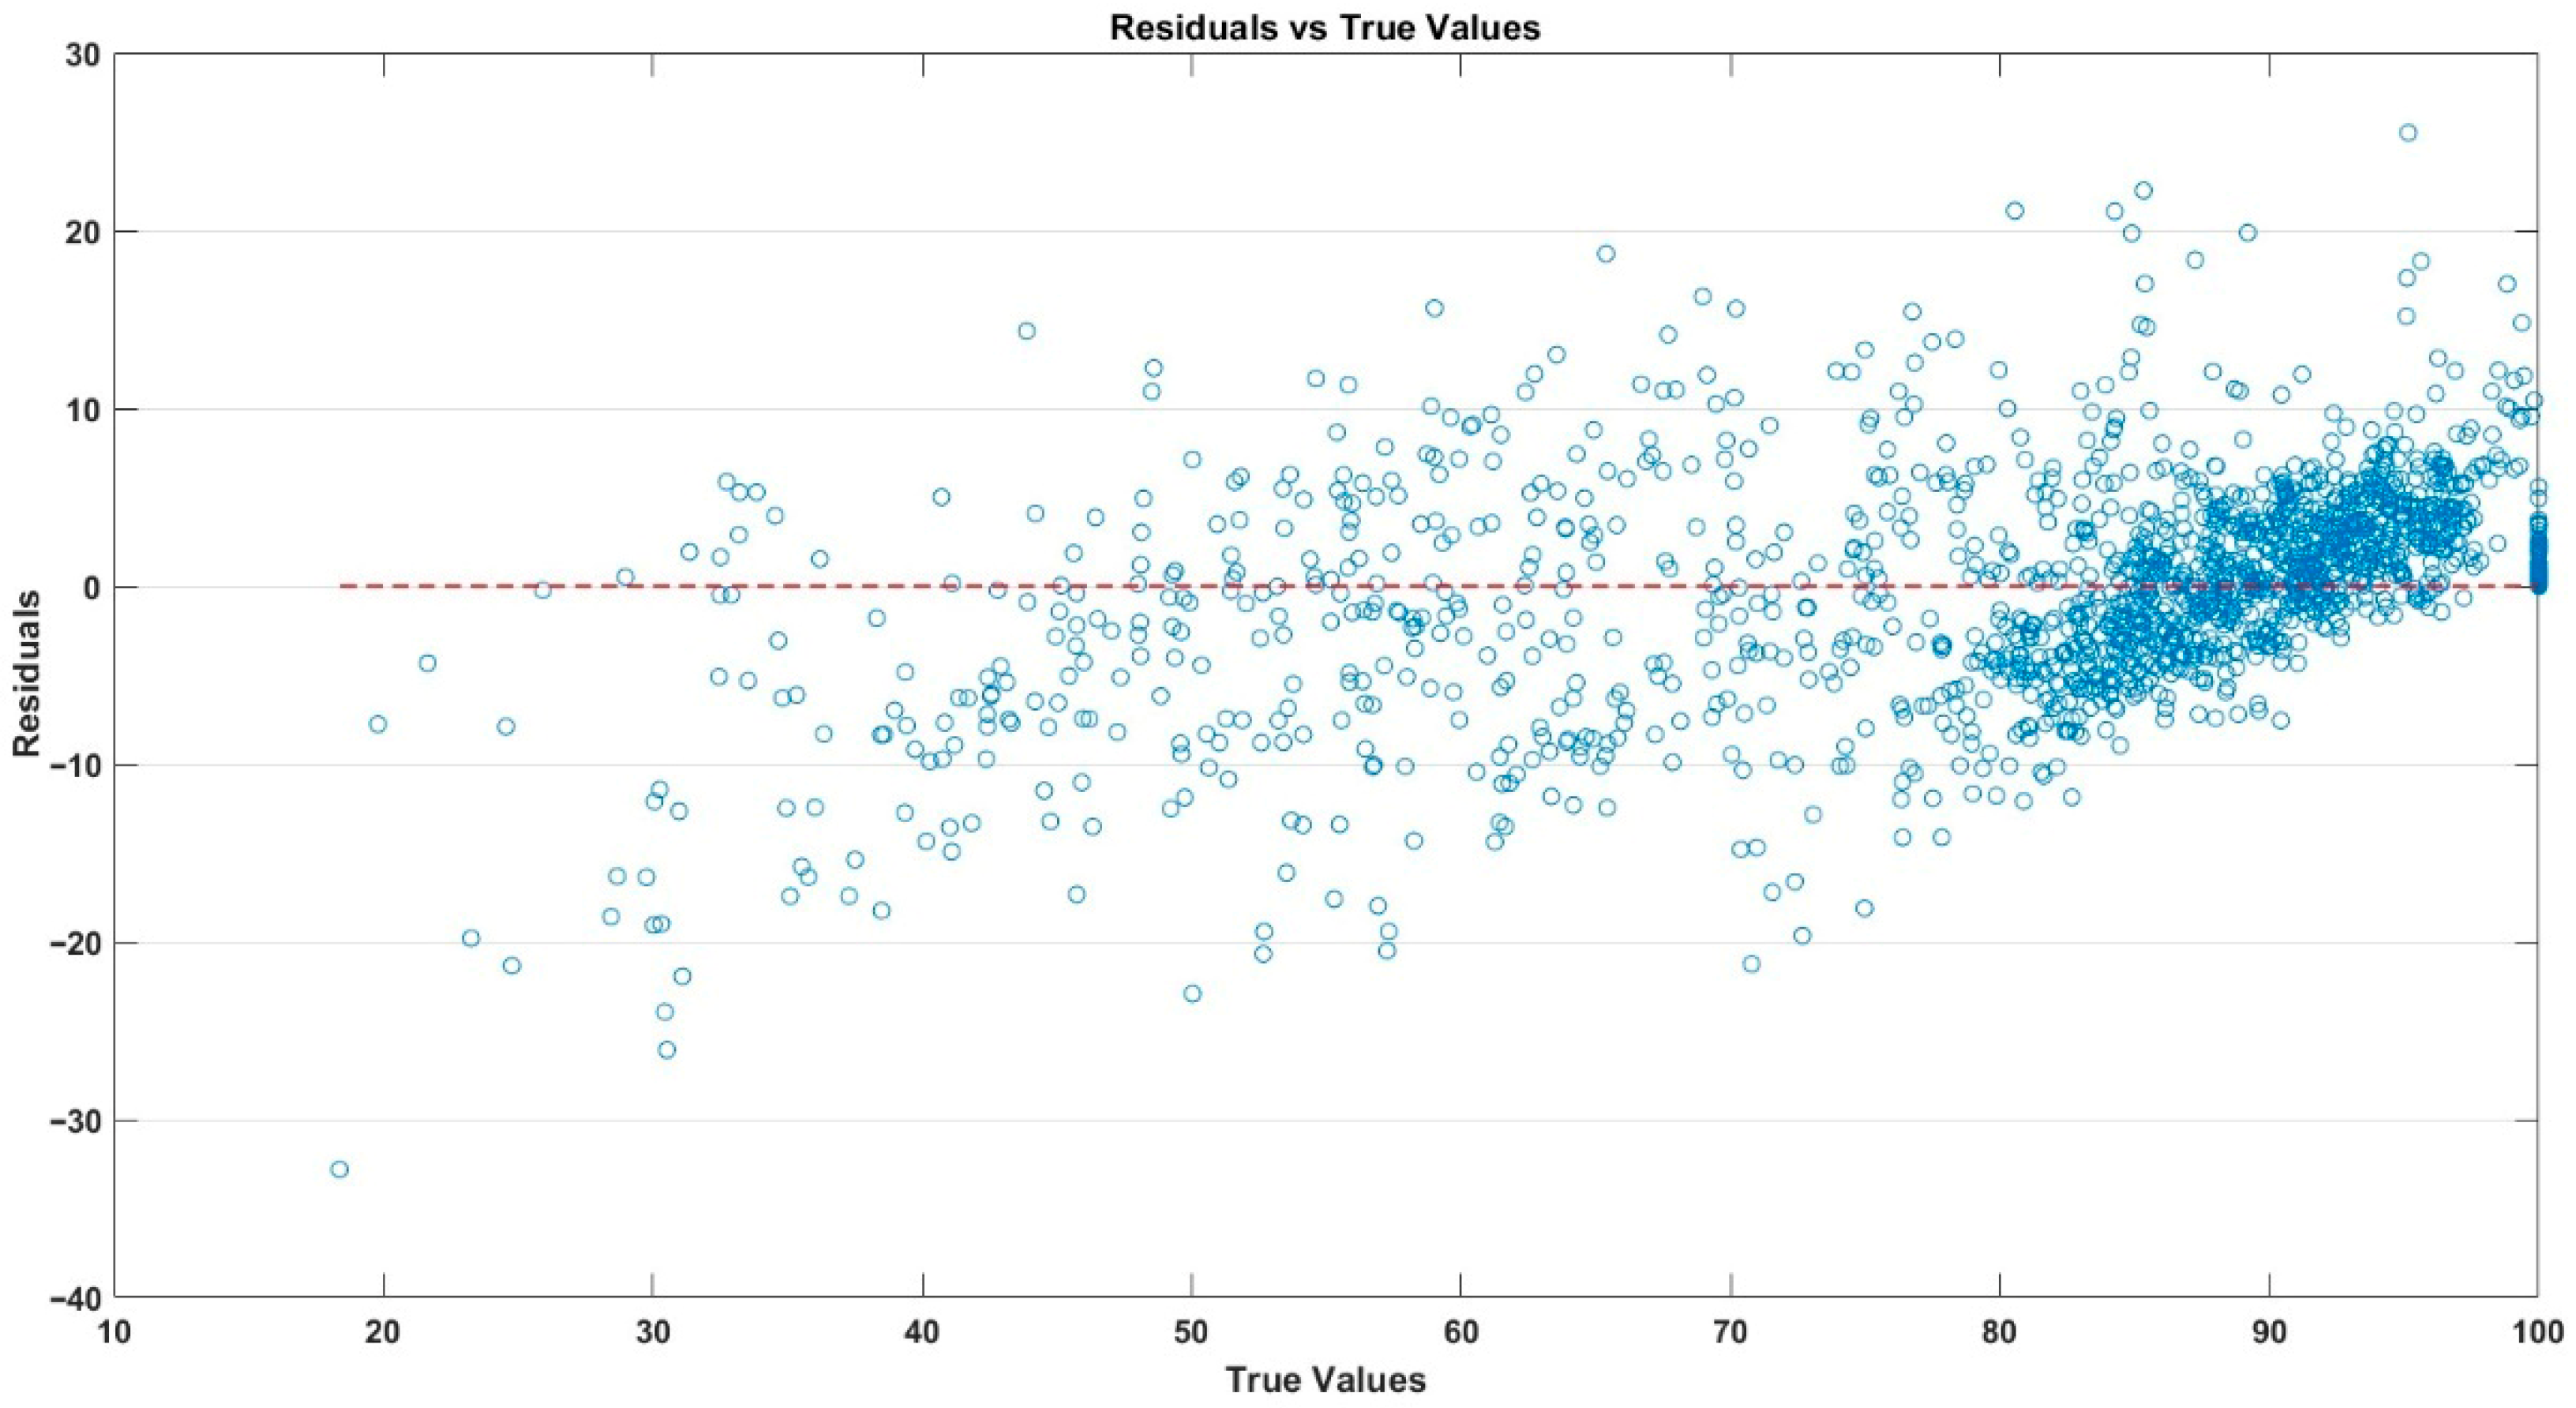
Finally, Figure 6 presents the residual plot of the RF model, plotting residuals (predicted minus measured RWC) against observed values. The random dispersion of points around zero indicates that model errors were unbiased and homoscedastic, further confirming the robustness of the developed approach.
For the three fruit longitudinal regions (neck/stem end, mid-region and blossom end), the performance of the RF model trained on RWC estimation is illustrated in Supplementary Figures S1–S3. Table 3 summarizes the statistical performance of the RF model for predicting fruit RWC across the different anatomical regions and for the whole fruit. The model achieved high predictive accuracy in all cases, with R2 values ranging from 0.855 to 0.886 and RMSE values between 6.33 and 5.76%, confirming that even region-specific color data provide robust RWC estimates. As expected, the whole-fruit average yielded the strongest performance (R2 = 0.886, RMSE = 5.76%), underscoring the advantage of integrating information over the entire fruit surface rather than restricting analysis to a single region.

4. Discussion

This study demonstrates that simple color features extracted from conventional digital images can be used, in combination with machine-learning algorithms, to non-destructively estimate postharvest hydration status in cucumber fruit. Although previous work has emphasized hyperspectral, near-infrared or magnetic resonance techniques for assessing plant water status, these methods are costly, require specialized operators and are often limited to research settings [36,37]. By contrast, our approach employs low-cost, visible-light imaging and an easily implemented RF model, offering a practical pathway for routine monitoring of fresh produce.
A key finding is the dominance of the mean cyan (μC) component of the CMYK space as a predictor of fruit RWC (Table 2). All other individual color traits examined, including RGB, HSV and CIELAB parameters, showed weak or negligible predictive power (R2 ≤ 0.5), whereas μC consistently achieved the highest R2 values across anatomical regions (≈0.62–0.65) and especially when integrated over the whole fruit surface (R2 ≈ 0.70). This indicates that the cyan channel captures subtle spectral shifts linked to water status more effectively than red, green, blue or derived indices. Cyan reflectance is likely sensitive to dehydration-induced changes in surface and pigment properties, making it a robust proxy for fruit hydration. These effects primarily involve cuticle water loss that increases surface scattering, partial chlorophyll degradation, and corresponding shifts in light absorption across the blue–green spectrum.
Although explicit demonstrations that a narrow cyan band outperforms other visible bands for fruit hydration are lacking, several lines of evidence support this premise. Cyan-inclusive vegetation indices (e.g., Cyan–Orange–NIR) have improved crop-status tracking relative to conventional visible-light indices, indicating additive sensitivity in the ≈490–520 nm region [38]. Moreover, drought-related changes captured by blue–green features such as the Photochemical Reflectance Index (PRI, 531/570 nm) are well established as water-stress indicators, arising from xanthophyll-cycle and chlorophyll changes during water deficit [39,40]. These findings provide a mechanistic precedent for expecting cyan-band reflectance to respond strongly to fruit hydration status.
In addition to pigment and photochemistry effects, the fruit cuticle strongly influences both water loss and surface reflectance. Recent work shows that cuticle composition, thickness and microstructure govern reflectance in the blue–green region as well as regulate transpirational water loss [12,13]. Similarly, Lara et al. [13] demonstrated that postharvest changes in cuticle biophysics (e.g., hydrophobicity, thickness) correlate with both optical appearance and moisture retention. These findings provide a complementary mechanistic basis for the strong association observed here between cyan-band reflectance and RWC in cucumber fruit.
Another important result is that using μC averaged over the entire fruit produced better predictions than region-specific μC values from the neck, mid-region or blossom end (Table 2 and Table 3). Cucumber fruits are known to be anatomically heterogeneous, with differences in tissue structure, vascularization and respiration rates along their length [41,42]. Such differences can translate into spatially variable water loss and thus color change. However, our results suggest that for practical purposes, integrating the whole surface reduces local variability and yields a more stable hydration signal for both simple correlations and model-based predictions. This has practical implications: image acquisition and analysis can be simplified by treating the fruit as a single unit rather than segmenting it, reducing data-processing time without sacrificing accuracy.
The RF model further improved prediction accuracy relative to simple linear regressions, achieving R2 of 0.886 and RMSE of 5.8% for the whole-fruit dataset (Table 2 and Table 3). This corresponds to an increase of about 0.19 in R2 (≈27% more variance explained) and a ≈30% reduction in RMSE compared with the best-performing linear model (R2 ≈ 0.70, RMSE ≈ 8.2%), clearly demonstrating the added value of the ensemble approach. These values compare favorably with other non-destructive approaches reported in the literature for leaves and fruits, where R2 values typically range from 0.80 to 0.95 depending on the species and sensor used (e.g., hyperspectral or NIR studies) [43,44,45]. The narrow, centered error histogram and the random distribution of residuals around zero indicate that the RF model generalizes well and is not biased across the tested range of RWC values (Figure 3). The partial dependence plots reveal both monotonic and non-linear relationships between spectral features and predicted RWC (Figure 5), highlighting the ability of RF to capture complex, non-linear effects that would be missed by conventional regression.
From a practical perspective, the ability to estimate RWC non-destructively at both optimal (10 °C) and ambient (25 °C) storage conditions is valuable. Cucumber fruits are highly perishable, with shelf life dropping from 7–14 d under refrigeration to 3–5 d at near-ambient temperatures [34]. Early detection of hydration loss could allow producers and retailers to identify lots approaching critical dehydration, optimize storage conditions and adjust distribution to minimize waste. Because our imaging setup used only a standard camera and LED illumination in a simple enclosure [27], it could be scaled or adapted for packhouses, distribution centers or even retail settings without prohibitive cost.

Limitations and Future Prospects

While the Random Forest model achieved high predictive accuracy (R2 = 0.89, RMSE ≈ 5.8%) using a 70/30 stratified hold-out split, this represents internal rather than external validation. To minimize overfitting, model complexity was controlled through hyperparameter tuning (e.g., tree depth), and stratified sampling ensured balanced representation of storage conditions and hydration levels. The broader aspects of generalizability and external validation across cultivars, seasons, and commercial environments are discussed in the following paragraphs.
A primary limitation is that the dataset comprised a single cultivar (‘Cretasun RZ’) grown under controlled greenhouse conditions. Although this cultivar is commercially important, differences among cultivars in cuticle thickness, stomatal density (influencing transpiration pathways and surface microtexture), and surface glossiness [46,47] may alter color–hydration relationships, suggesting that future research should extend the approach to additional cucumber cultivars and other fruit types to test the generality of the μC–RWC relationship. Within cucumber, this could include slicing versus pickling types or smooth versus spiny surfaces, which may influence reflectance and dehydration patterns. Beyond cucumber, the method could be validated in other fruit crops (e.g., zucchini and bell pepper), where color and hydration are closely linked.
Commercial grading standards impose strict requirements for fruit shape (e.g., absence of curvature) and size, with the latter depending on the cultivar, and these were rigorously followed in the lot under investigation. Consequently, the dataset consisted of highly uniform fruits grown under controlled greenhouse conditions. Therefore, the current model has not yet been validated for fruit exhibiting greater heterogeneity in shape, size, or surface characteristics, as may occur in local markets not governed by international grading standards. Such variability can arise from differences in fruit position within the canopy and associated microclimatic factors (e.g., light exposure). Furthermore, while the model successfully estimates fruit hydration status, it does not directly predict visual or textural quality attributes affected by dehydration, including glossiness, firmness, and color uniformity, which are critical to consumer acceptance. Future work should therefore aim to test the model’s robustness under a wider range of cultivation regimes to confirm its applicability beyond controlled environments, while simultaneously coupling hydration assessment with externally perceivable quality parameters to develop more comprehensive, consumer-oriented prediction frameworks.
Commercial waxing, which is commonly applied to reduce postharvest water loss, can alter surface optics and consequently influence color-based reflectance signals. Future deployments should therefore verify model performance on waxed fruit to ensure predictive robustness under commercial handling conditions. In addition, minor cosmetic defects (e.g., abrasions, scars, or localized discoloration), typically absent under commercial grading standards but occasionally observed in local markets, may further bias color feature extraction. Deployments should thus include a brief pre-screening step to detect and mask affected surface areas prior to analysis (see Section 2.4), minimizing noise and preserving model accuracy.
All images were acquired under tightly controlled illumination in a custom-built enclosure. In real-world packhouse or warehouse environments, variable lighting and backgrounds could introduce bias. To mitigate these effects, routine per-session color calibration with reference targets and fixed camera settings should be used (see Section 2.4). Such procedures are standard in digital photography and can be implemented in packhouses with minimal disruption, ensuring that color features remain comparable despite differences in ambient light or lamp type [48]. Developing and validating calibration or normalization procedures (e.g., reference targets or color-constancy algorithms) under field or commercial conditions will be essential to demonstrate robustness beyond the laboratory.
Although the RF model performed well in this study, other machine-learning methods such as gradient boosting or deep neural networks might further improve accuracy or enable transfer learning across commodities. Future work should compare alternative algorithms and explore adaptive or commodity-specific models trained on larger, more diverse datasets to enhance predictive power and minimize recalibration needs.
Finally, while data from both storage temperatures were pooled here, performance under a wider range of temperature–relative air humidity scenarios remains untested. Expanding the training dataset to include a broader range of postharvest conditions, while quantifying throughput and hardware costs in commercial settings, will facilitate integration with automated sorting lines and real-time decision support.
Despite these limitations, our results demonstrate that visible-light imaging combined with an ensemble learning model can reliably and non-destructively estimate fruit hydration status. The identification of μC as a strong single predictor simplifies feature selection and model training, lowering the barrier to adoption. Building on this foundation, future work should focus on real-time deployment of such models, integration with automated sorting lines and validation under commercial supply chain conditions. Because the imaging setup uses only standard cameras and LED lighting, it can be readily incorporated into existing grading or packaging lines [27], for example, as overhead cameras above conveyor belts linked to edge-computing software, allowing continuous, real-time hydration assessment at commercial scale.
At present, there are no routine procedures for grading fresh cucumbers by hydration status, making it difficult to identify batches with reduced water content and shortened shelf life potential. The approach presented here offers a practical decision-support tool for such discrimination and can be implemented under real-world conditions using defined illumination, which is readily achievable with simple light sources in packhouses or storage facilities. Because only standard visible-range imaging equipment is required, considerably less expensive than hyperspectral or extended-NIR sensors [49], the technique has clear commercial potential. Although initial investment and calibration will be needed for each commodity [50], grading fruit by hydration level (and thus shelf life potential) could increase returns by improving quality consistency and enabling entry into premium markets.

5. Conclusions

This study demonstrates that simple visible-light color imaging combined with a Random Forest (RF) model can reliably and non-destructively estimate the postharvest hydration status of cucumber fruit. Among the 16 colorimetric traits examined, the mean cyan component (μC) of the CMYK system emerged as the most powerful single predictor of relative water content (RWC), consistent with the mechanistic expectation that reflectance in the cyan region of the visible spectrum is especially sensitive to dehydration-induced changes in pigments, cuticle properties and surface scattering. The RF model trained on these features achieved high accuracy (R2 = 0.89, RMSE ≈ 5.8% on the testing set) and produced residuals that were narrowly distributed and unbiased, indicating strong generalization. Predictive ability was maximized when μC was calculated over the entire fruit surface rather than for individual anatomical regions, indicating that whole-fruit color information provides a more robust hydration signal than region-specific measurements for both simple correlations and model-based predictions.
These findings highlight the feasibility of using low-cost imaging and machine-learning tools for rapid, non-destructive postharvest monitoring of cucumber hydration status under both refrigerated and ambient storage conditions. By enabling early detection of water loss, this approach can support better quality control, shelf-life prediction and waste reduction across the fresh-produce supply chain. Future research should validate the method across multiple cultivars, lighting conditions and fruit types, and develop deep-learning approaches for end-to-end image analysis without manual feature extraction, as well as integrate the system with automated grading and sorting lines for large-scale deployment. Even a modest reduction of 5–10% in dehydration-related shrinkage could translate into substantial savings for packhouses and retailers, improving profit margins while reducing food waste and environmental impact.

Supplementary Materials

The following supporting information can be downloaded at: https://www.mdpi.com/article/10.3390/horticulturae11111283/s1. Supplementary Figure S1: Performance of the Random Forest (RF) model in predicting the relative water content (RWC) of cucumber fruit using the testing dataset. (A) Plot of measured (black) and RF-predicted (red) RWC values across the dataset. (B) Scatter plot of RF-predicted versus measured RWC values; circles represent individual data points and the blue line represents the 1:1 (perfect-agreement) line. The coefficient of correlation (R) is also shown. (C) Plot of prediction errors (predicted–measured) across the dataset. (D) Histogram of prediction errors; bars represent the frequency of the errors and the red curve represents the fitted normal (Gaussian) distribution of those errors. Results correspond to the neck (stalk region)–stem end. Supplementary Figure S2; Performance of the Random Forest (RF) model in predicting the relative water content (RWC) of cucumber fruit using the testing dataset. (A) Plot of measured (black) and RF-predicted (red) RWC values across the dataset. (B) Scatter plot of RF-predicted versus measured RWC values; circles represent individual data points and the blue line represents the 1:1 (perfect-agreement) line. The coefficient of correlation (R) is also shown. (C) Plot of prediction errors (predicted–measured) across the dataset. (D) Histogram of prediction errors; bars represent the frequency of the errors and the red curve represents the fitted normal (Gaussian) distribution of those errors. Results correspond to the mid-region. Supplementary Figure S3: Performance of the Random Forest (RF) model in predicting the relative water content (RWC) of cucumber fruit using the testing dataset. (A) Plot of measured (black) and RF-predicted (red) RWC values across the dataset. (B) Scatter plot of RF-predicted versus measured RWC values; circles represent individual data points and the blue line represents the 1:1 (perfect-agreement) line. The coefficient of correlation (R) is also shown. (C) Plot of prediction errors (predicted–measured) across the dataset. (D) Histogram of prediction errors; bars represent the frequency of the errors and the red curve represents the fitted normal (Gaussian) distribution of those errors. Results correspond to the blossom region–blossom end.

Author Contributions

T.M.: Investigation, Methodology, Data Curation, Formal Analysis, Visualization, Writing—Review and Editing. G.T.: Supervision, Writing—Review and Editing. D.M.P.: Data Curation, Model Development. A.T.-G.: Data Curation, Model Development, Visualization. D.F.: Conceptualization, Investigation, Methodology, Data Curation, Validation, Visualization, Supervision, Writing—Original Draft, Writing—Review and Editing, Project Administration, Resources. All authors have read and agreed to the published version of the manuscript.

Funding

This research received no external funding.

Data Availability Statement

The raw data supporting the conclusions of this article will be made available by the authors on request.

Acknowledgments

We gratefully thank students Theodoros Michailellis, Aikaterini Oikonomou, Aikaterini Liouliaki and Aggeliki Sakellariou for their valuable assistance with the measurements. We also thank the Academic Editor and the four anonymous reviewers for their insightful and constructive comments, which substantially improved the manuscript.

Conflicts of Interest

The authors declare that they have no known competing financial interests or personal relationships that could have appeared to influence the work reported in this paper.

Abbreviations

a*, red/green; B, blue; b*, yellow/blue; C, cyan; CCT, correlated color temperature; CI, confidence intervals; CRI, Color Rendering Index; G, green; H, hue; K, black; L*, lightness; LED, light-emitting diode; M, magenta; MAE, mean absolute error; MSE, mean square error; NIR, near-infrared; PRI, Photochemical Reflectance Index; R, red; R, correlation coefficient; R2, coefficient of determination; RF, Random Forest; RFR, Random Forest Regression; RMSE, root mean square error; RWC, relative water content; S, saturation; V, value; Y, yellow.

References

  1. Gidado, M.J.; Gunny, A.A.N.; Gopinath, S.C.B.; Ali, A.; Wongs-Aree, C.; Salleh, N.H.M. Challenges of Postharvest Water Loss in Fruits: Mechanisms, Influencing Factors, and Effective Control Strategies—A Comprehensive Review. J. Agric. Food Res. 2024, 17, 101249. [Google Scholar] [CrossRef]
  2. Galindo, F.G.; Herppich, W.; Gekas, V.; Sjöholm, I. Factors Affecting Quality and Postharvest Properties of Vegetables: Integration of Water Relations and Metabolism. Crit. Rev. Food Sci. Nutr. 2004, 44, 139–154. [Google Scholar] [CrossRef] [PubMed]
  3. Lufu, R.; Ambaw, A.; Opara, U.L. Water Loss of Fresh Fruit: Influencing Pre-Harvest, Harvest and Postharvest Factors. Sci. Hortic. 2020, 272, 109519. [Google Scholar] [CrossRef]
  4. Li, L.; Jia, X.; Fan, K. Recent Advance in Nondestructive Imaging Technology for Detecting Quality of Fruits and Vegetables: A Review. Crit. Rev. Food Sci. Nutr. 2025, 65, 5181–5199. [Google Scholar] [CrossRef]
  5. Cubero, S.; Aleixos, N.; Moltó, E.; Gómez-Sanchis, J.; Blasco, J. Advances in Machine Vision Applications for Automatic Inspection and Quality Evaluation of Fruits and Vegetables. Food Bioproc. Technol. 2011, 4, 487–504. [Google Scholar] [CrossRef]
  6. Quemada, C.; Pérez-Escudero, J.M.; Gonzalo, R.; Ederra, I.; Santesteban, L.G.; Torres, N.; Iriarte, J.C. Remote Sensing for Plant Water Content Monitoring: A Review. Remote Sens. 2021, 13, 2088. [Google Scholar] [CrossRef]
  7. Van As, H.; Scheenen, T.; Vergeldt, F.J. MRI of Intact Plants. Photosynth. Res. 2009, 102, 213–222. [Google Scholar] [CrossRef]
  8. Nicolaï, B.M.; Defraeye, T.; De Ketelaere, B.; Herremans, E.; Hertog, M.L.A.T.M.; Saeys, W.; Torricelli, A.; Vandendriessche, T.; Verboven, P. Nondestructive Measurement of Fruit and Vegetable Quality. Annu. Rev. Food Sci. Technol. 2014, 5, 285–312. [Google Scholar] [CrossRef] [PubMed]
  9. Liu, J.; Sun, J.; Wang, Y.; Liu, X.; Zhang, Y.; Fu, H. Non-Destructive Detection of Fruit Quality: Technologies, Applications and Prospects. Foods 2025, 14, 2137. [Google Scholar] [CrossRef] [PubMed]
  10. Aline, U.; Bhattacharya, T.; Faqeerzada, M.A.; Kim, M.S.; Baek, I.; Cho, B.-K. Advancement of Non-Destructive Spectral Measurements for the Quality of Major Tropical Fruits and Vegetables: A Review. Front. Plant Sci. 2023, 14, 1240361. [Google Scholar] [CrossRef]
  11. Taheri-Garavand, A.; Rezaei Nejad, A.; Fanourakis, D.; Fatahi, S.; Ahmadi Majd, M. Employment of Artificial Neural Networks for Non-Invasive Estimation of Leaf Water Status Using Color Features: A Case Study in Spathiphyllum wallisii. Acta Physiol. Plant 2021, 43, 78. [Google Scholar] [CrossRef]
  12. Camarillo-Castillo, F.; Huggins, T.D.; Mondal, S.; Reynolds, M.P.; Tilley, M.; Hays, D.B. High-Resolution Spectral Information Enables Phenotyping of Leaf Epicuticular Wax in Wheat. Plant Methods 2021, 17, 58. [Google Scholar] [CrossRef] [PubMed]
  13. Lara, I.; Heredia, A.; Domínguez, E. Shelf Life Potential and the Fruit Cuticle: The Unexpected Player. Front. Plant Sci. 2019, 10, 770. [Google Scholar] [CrossRef] [PubMed]
  14. Fernández-Muñoz, R.; Heredia, A.; Domínguez, E. The Role of Cuticle in Fruit Shelf-Life. Curr. Opin. Biotechnol. 2022, 78, 102802. [Google Scholar] [CrossRef] [PubMed]
  15. Jiang, C.; Perkins-Veazie, P.; Ma, G.; Gunter, C. Muskmelon Fruit Quality in Response to Postharvest Essential Oil and Whey Protein Sprays. HortScience 2017, 52, 887–891. [Google Scholar] [CrossRef]
  16. Reitz, N.F.; Mitcham, E.J. Validation and Demonstration of a Pericarp Disc System for Studying Blossom-End Rot of Tomatoes. Plant Methods 2021, 17, 28. [Google Scholar] [CrossRef]
  17. Woltering, E.; Mensink, M.; Nijenhuis-De Vries, M.; Harchioui, N.E.; Hogeveen-Van Echtelt, E. Determining Water Loss Characteristics in Cucumber Cultivars Breeding for Post-Harvest Quality Work Package 1, Year 1; Wageningen Food & Biobased Research: Wageningen, The Netherlands, 2021. [Google Scholar]
  18. Yang, C.; Guo, Z.; Fernandes Barbin, D.; Dai, Z.; Watson, N.; Povey, M.; Zou, X. Hyperspectral Imaging and Deep Learning for Quality and Safety Inspection of Fruits and Vegetables: A Review. J. Agric. Food Chem. 2025, 73, 10019–10035. [Google Scholar] [CrossRef]
  19. Rahman, A.; Kandpal, L.; Lohumi, S.; Kim, M.; Lee, H.; Mo, C.; Cho, B.-K. Nondestructive Estimation of Moisture Content, PH and Soluble Solid Contents in Intact Tomatoes Using Hyperspectral Imaging. Appl. Sci. 2017, 7, 109. [Google Scholar] [CrossRef]
  20. Cutler, D.R.; Edwards, T.C.; Beard, K.H.; Cutler, A.; Hess, K.T.; Gibson, J.; Lawler, J.J. Random Forests for Classification in Ecology. Ecology 2007, 88, 2783–2792. [Google Scholar] [CrossRef]
  21. Breiman, L. Random Forests. Mach. Learn. 2001, 45, 5–32. [Google Scholar] [CrossRef]
  22. Abdelkader, M.F.M.; Mahmoud, M.H.; Lo’ay, A.A.; Abdein, M.A.; Metwally, K.; Ikeno, S.; Doklega, S.M.A. The Effect of Combining Post-Harvest Calcium Nanoparticles with a Salicylic Acid Treatment on Cucumber Tissue Breakdown via Enzyme Activity during Shelf Life. Molecules 2022, 27, 3687. [Google Scholar] [CrossRef]
  23. Hussain, N.; Azizan, A.H.; Ghazali, A.M. Impact of Minimal Processing on Quality and Shelf Life of Cucumbers (Cucumis Sativus). J. Biochem. Microbiol. Biotechnol. 2025, 13, 42–48. [Google Scholar] [CrossRef]
  24. Kitinoja, L. Innovative Approaches to Food Loss and Waste Issues. 2016. Available online: https://www.researchgate.net/profile/Lisa-Kitinoja/publication/303185499_Innovative_Approaches_to_Food_Loss_and_Waste_Issues/links/573881f308ae9f741b2bcbec/Innovative-Approaches-to-Food-Loss-and-Waste-Issues.pdf (accessed on 1 September 2025).
  25. Onwude, D.I.; Chen, G.; Eke-emezie, N.; Kabutey, A.; Khaled, A.Y.; Sturm, B. Recent Advances in Reducing Food Losses in the Supply Chain of Fresh Agricultural Produce. Processes 2020, 8, 1431. [Google Scholar] [CrossRef]
  26. Poorter, H.; Fiorani, F.; Pieruschka, R.; Wojciechowski, T.; van der Putten, W.H.; Kleyer, M.; Schurr, U.; Postma, J. Pampered inside, Pestered Outside? Differences and Similarities between Plants Growing in Controlled Conditions and in the Field. New Phytol. 2016, 212, 838–855. [Google Scholar] [CrossRef] [PubMed]
  27. Tsaniklidis, G.; Makraki, T.; Papadimitriou, D.; Nikoloudakis, N.; Taheri-Garavand, A.; Fanourakis, D. Non-Destructive Estimation of Area and Greenness in Leaf and Seedling Scales: A Case Study in Cucumber. Agronomy 2025, 15, 2294. [Google Scholar] [CrossRef]
  28. Kirchgessner, N.; Hodel, M.; Studer, B.; Patocchi, A.; Broggini, G.A.L. FruitPhenoBox—A Device for Rapid and Automated Fruit Phenotyping of Small Sample Sizes. Plant Methods 2024, 20, 74. [Google Scholar] [CrossRef]
  29. Tjandra, A.D.; Heywood, T.; Chandrawati, R. Trigit: A Free Web Application for Rapid Colorimetric Analysis of Images. Biosens. Bioelectron. X 2023, 14, 100361. [Google Scholar] [CrossRef]
  30. Dai, W.; Hamasaki, T. Statistics in Medicine, 4th ed.; Riffenburgh, R.H., Gillen, D.L., Eds.; Academic Press: Oxford, UK, 2020; Volume 76. [Google Scholar]
  31. Keller, C.A.; Evans, M.J. Application of Random Forest Regression to the Calculation of Gas-Phase Chemistry within the GEOS-Chem Chemistry Model V10. Geosci. Model. Dev. 2019, 12, 1209–1225. [Google Scholar] [CrossRef]
  32. Cheng, L.; De Vos, J.; Zhao, P.; Yang, M.; Witlox, F. Examining Non-Linear Built Environment Effects on Elderly’s Walking: A Random Forest Approach. Transp. Res. D Transp. Environ. 2020, 88, 102552. [Google Scholar] [CrossRef]
  33. Moalemiyan, M.; Ramaswamy, H.S. Quality Retention and Shelf-Life Extension in Mediterranean Cucumbers Coated with a Pectin-Based Film. J. Food Res. 2012, 1, 159. [Google Scholar] [CrossRef]
  34. Manjunatha, M.; Anurag, R.K. Effect of Modified Atmosphere Packaging and Storage Conditions on Quality Characteristics of Cucumber. J. Food Sci. Technol. 2014, 51, 3470–3475. [Google Scholar] [CrossRef] [PubMed]
  35. Feng, Y.-Z.; Sun, D.-W. Application of Hyperspectral Imaging in Food Safety Inspection and Control: A Review. Crit. Rev. Food Sci. Nutr. 2012, 52, 1039–1058. [Google Scholar] [CrossRef]
  36. Gerhards, M.; Schlerf, M.; Mallick, K.; Udelhoven, T. Challenges and Future Perspectives of Multi-/Hyperspectral Thermal Infrared Remote Sensing for Crop Water-Stress Detection: A Review. Remote Sens. 2019, 11, 1240. [Google Scholar] [CrossRef]
  37. Mertens, S.; Verbraeken, L.; Sprenger, H.; De Meyer, S.; Demuynck, K.; Cannoot, B.; Merchie, J.; De Block, J.; Vogel, J.T.; Bruce, W.; et al. Monitoring of Drought Stress and Transpiration Rate Using Proximal Thermal and Hyperspectral Imaging in an Indoor Automated Plant Phenotyping Platform. Plant Methods 2023, 19, 132. [Google Scholar] [CrossRef]
  38. Vásquez, R.A.R.; Heenkenda, M.K.; Nelson, R.; Segura Serrano, L. Developing a New Vegetation Index Using Cyan, Orange, and Near Infrared Bands to Analyze Soybean Growth Dynamics. Remote Sens. 2023, 15, 2888. [Google Scholar] [CrossRef]
  39. Suárez, L.; Zarco-Tejada, P.J.; Sepulcre-Cantó, G.; Pérez-Priego, O.; Miller, J.R.; Jiménez-Muñoz, J.C.; Sobrino, J. Assessing Canopy PRI for Water Stress Detection with Diurnal Airborne Imagery. Remote Sens. Environ. 2008, 112, 560–575. [Google Scholar] [CrossRef]
  40. Zhang, C.; Filella, I.; Liu, D.; Ogaya, R.; Llusià, J.; Asensio, D.; Peñuelas, J. Photochemical Reflectance Index (PRI) for Detecting Responses of Diurnal and Seasonal Photosynthetic Activity to Experimental Drought and Warming in a Mediterranean Shrubland. Remote Sens. 2017, 9, 1189. [Google Scholar] [CrossRef]
  41. Sui, X.; Shan, N.; Hu, L.; Zhang, C.; Yu, C.; Ren, H.; Turgeon, R.; Zhang, Z. The Complex Character of Photosynthesis in Cucumber Fruit. J. Exp. Bot. 2017, 68, 1625–1637. [Google Scholar] [CrossRef]
  42. Thompson, R.L.; Fleming, H.P.; Hamann, D.D.; Monroe, R.J. Method for Determination of Firmness in Cucumber Slices 1. J. Texture Stud. 1982, 13, 311–324. [Google Scholar] [CrossRef]
  43. Fanourakis, D.; Papadakis, V.M.; Machado, M.; Psyllakis, E.; Nektarios, P.A. Non-invasive Leaf Hydration Status Determination through Convolutional Neural Networks Based on Multispectral Images in Chrysanthemum. Plant Growth Regul. 2024, 102, 485–496. [Google Scholar] [CrossRef]
  44. Falcioni, R.; Gonçalves, J.V.F.; de Oliveira, K.M.; de Oliveira, C.A.; Reis, A.S.; Crusiol, L.G.T.; Furlanetto, R.H.; Antunes, W.C.; Cezar, E.; de Oliveira, R.B.; et al. Chemometric Analysis for the Prediction of Biochemical Compounds in Leaves Using UV-VIS-NIR-SWIR Hyperspectroscopy. Plants 2023, 12, 3424. [Google Scholar] [CrossRef]
  45. Amoriello, T.; Ciorba, R.; Ruggiero, G.; Masciola, F.; Scutaru, D.; Ciccoritti, R. Vis/NIR Spectroscopy and Vis/NIR Hyperspectral Imaging for Non-Destructive Monitoring of Apricot Fruit Internal Quality with Machine Learning. Foods 2025, 14, 196. [Google Scholar] [CrossRef]
  46. Rett-Cadman, S.; Colle, M.; Mansfeld, B.; Barry, C.S.; Wang, Y.; Weng, Y.; Gao, L.; Fei, Z.; Grumet, R. QTL and Transcriptomic Analyses Implicate Cuticle Transcription Factor SHINE as a Source of Natural Variation for Epidermal Traits in Cucumber Fruit. Front. Plant Sci. 2019, 10, 1536. [Google Scholar] [CrossRef]
  47. Liu, X.; Ge, X.; An, J.; Liu, X.; Ren, H. CsCER6 and CsCER7 Influence Fruit Glossiness by Regulating Fruit Cuticular Wax Accumulation in Cucumber. Int. J. Mol. Sci. 2023, 24, 1135. [Google Scholar] [CrossRef]
  48. Tovar, J.C.; Hoyer, J.S.; Lin, A.; Tielking, A.; Callen, S.T.; Elizabeth Castillo, S.; Miller, M.; Tessman, M.; Fahlgren, N.; Carrington, J.C.; et al. Raspberry Pi–Powered Imaging for Plant Phenotyping. Appl. Plant Sci. 2018, 6, e1031. [Google Scholar] [CrossRef] [PubMed]
  49. Stuart, M.B.; Davies, M.; Hobbs, M.J.; Pering, T.D.; McGonigle, A.J.S.; Willmott, J.R. High-Resolution Hyperspectral Imaging Using Low-Cost Components: Application within Environmental Monitoring Scenarios. Sensors 2022, 22, 4652. [Google Scholar] [CrossRef] [PubMed]
  50. Taheri-Garavand, A.; Mumivand, H.; Fanourakis, D.; Fatahi, S.; Taghipour, S. An Artificial Neural Network Approach for Non-Invasive Estimation of Essential Oil Content and Composition through Considering Drying Processing Factors: A Case Study in Mentha Aquatica. Ind. Crops Prod. 2021, 171, 113985. [Google Scholar] [CrossRef]
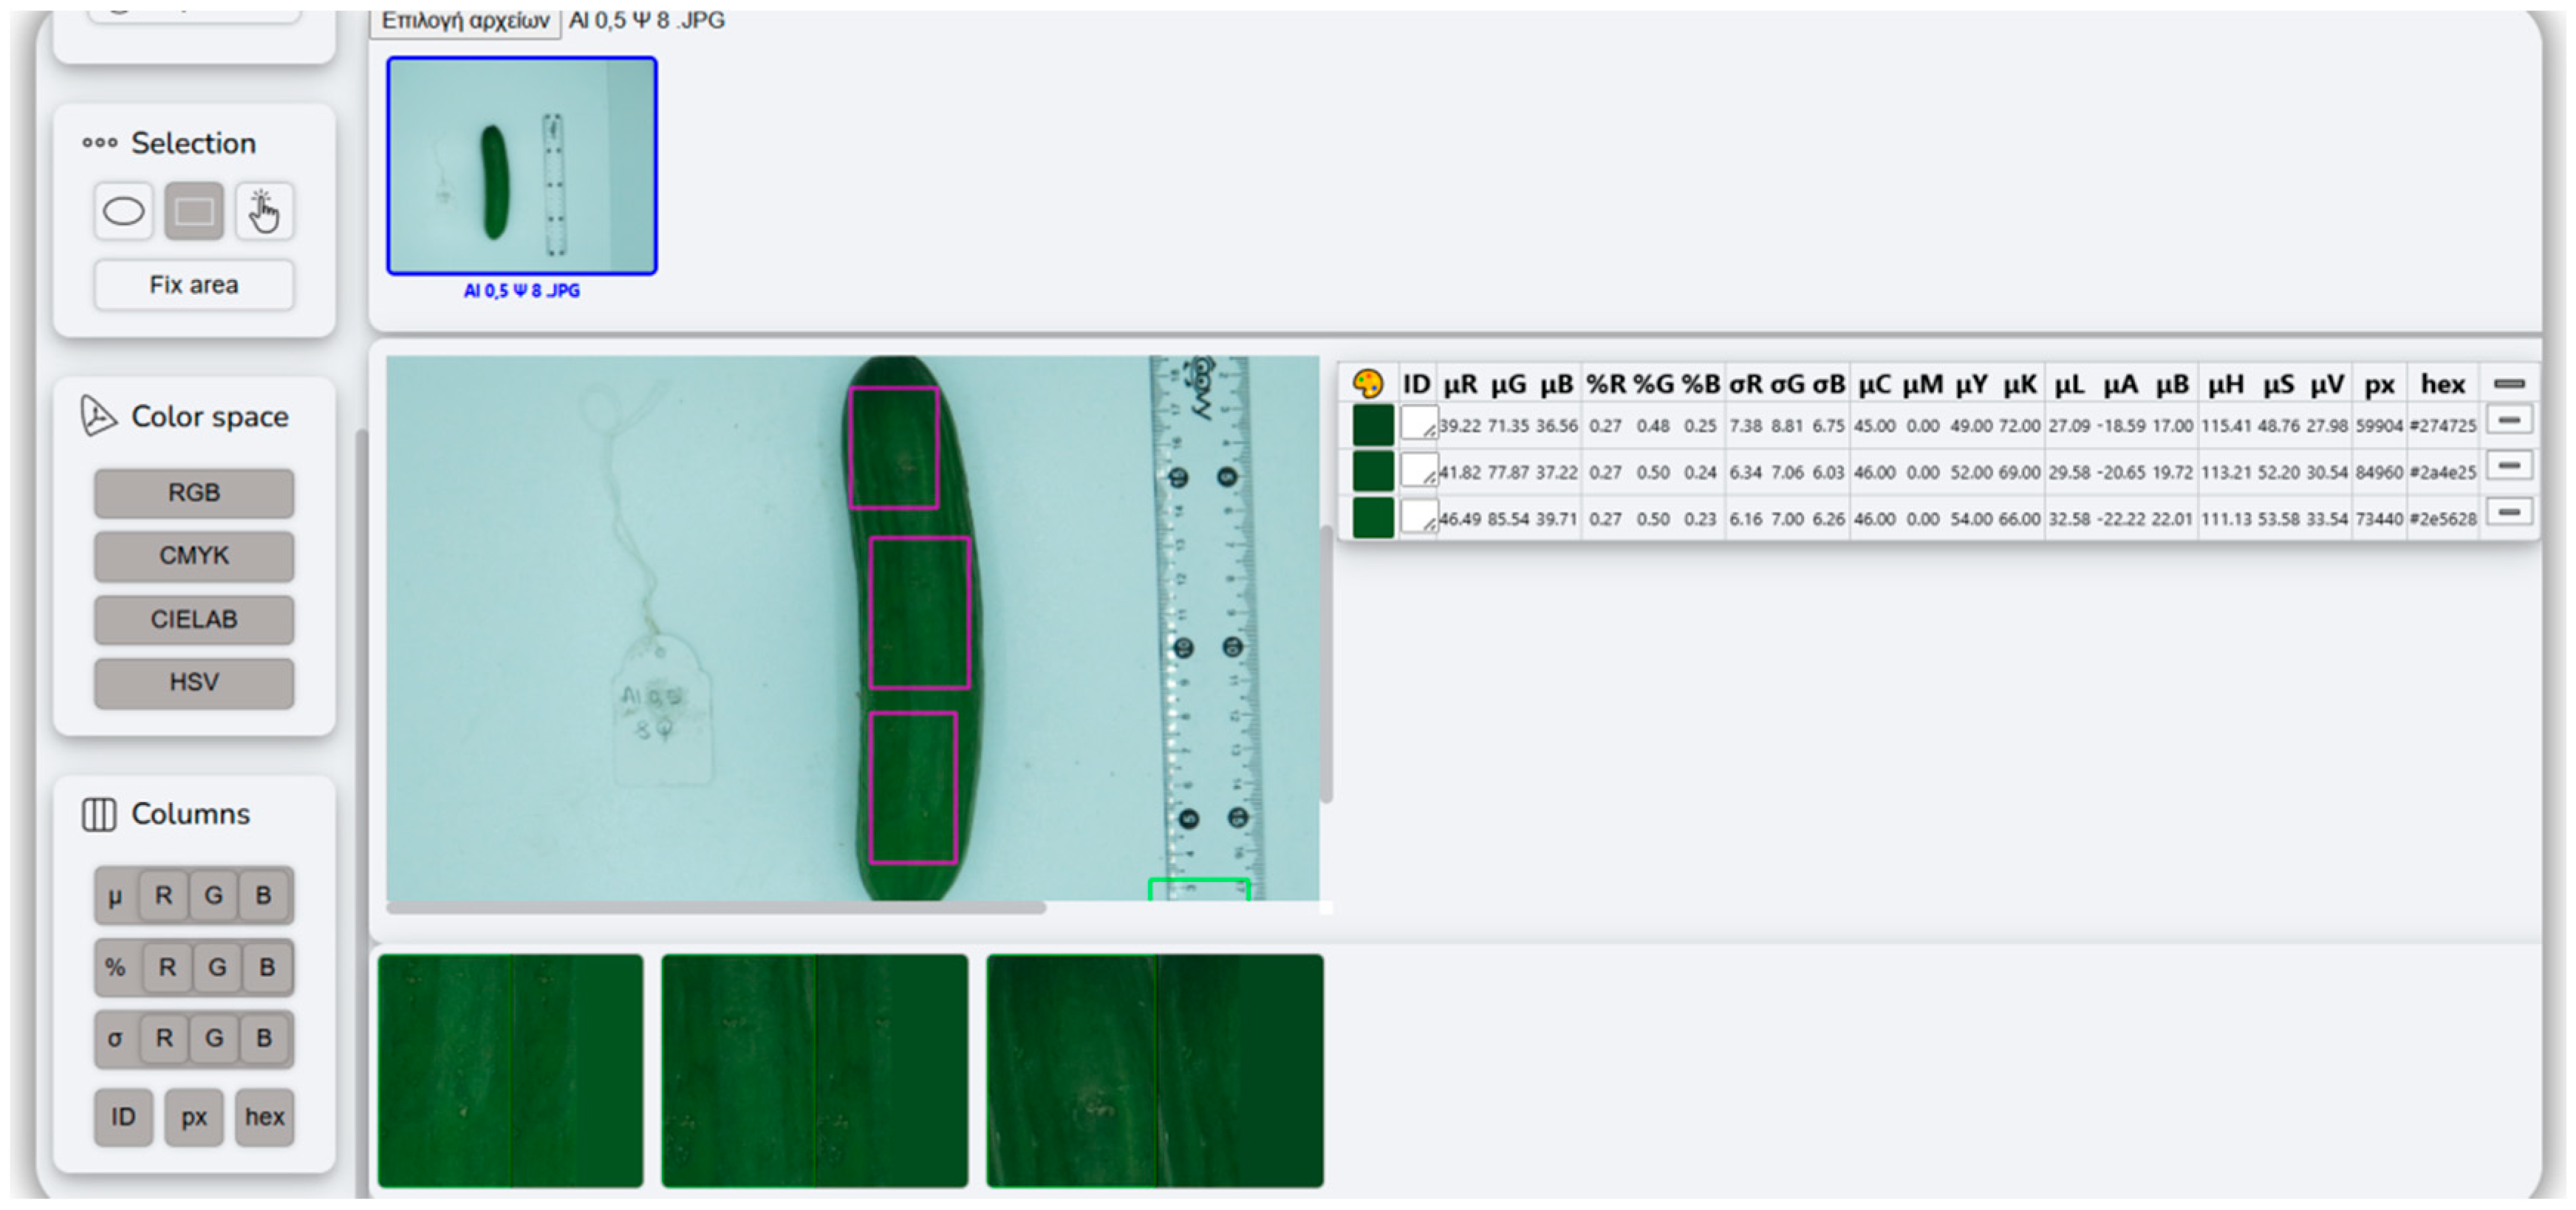
Figure 1. Example of cucumber fruit segmentation into longitudinal regions for color analysis. In the central panel, the neck or stem end (proximal), mid-region (central), and blossom end (distal) are delineated on the fruit and highlighted with purple boxes. The three panels at the bottom show the corresponding cropped image areas used for calculating color parameters in each region, while the right-hand panel displays the software output with mean color metrics for each defined region. The blue box at the top left indicates the currently selected image within the Trigit workspace. Columns “px” (pixel count per region) and “hex” (mean RGB color code) were not included in the present analysis. A scale ruler and identification tag are included for reference.
Horticulturae 11 01283 g001
Figure 2. Schematic representation of the Random Forest Regression (RFR) algorithm used for predicting cucumber fruit relative water content (RWC). Color features (provided in Table 1) extracted from digital images with Trigit, either from the whole fruit or separately from each longitudinal region (neck, mid, blossom), served as input variables. These inputs were processed by an ensemble of decision trees, each trained on a bootstrap sample of the data and producing its own prediction. The individual tree predictions were then averaged to generate the final output, which is the predicted RWC of cucumber fruit.
Horticulturae 11 01283 g002
Figure 3. Performance of the Random Forest (RF) model in predicting the relative water content (RWC) of cucumber fruit using the testing dataset. Upper left: Plot of measured (black) and RF-predicted (red) RWC values across the dataset. Upper right: Scatter plot of RF-predicted versus measured RWC values; circles represent individual data points and the blue line represents the 1:1 (perfect-agreement) line. The coefficient of correlation (R) is also shown. Lower left: Plot of prediction errors (predicted–measured) across the dataset. Lower right: Histogram of prediction errors; bars represent the frequency of the errors and the red curve represents the fitted normal (Gaussian) distribution. Results correspond to the whole-fruit assessment.
Horticulturae 11 01283 g003
Figure 4. Relative importance of input features for predicting fruit relative water content (RWC) with the Random Forest (RF) model. The RF model comprised 30 decision trees trained to predict RWC. Feature importance was computed as the mean decrease in impurity averaged across all trees. The plot displays the 16 most influential input features. Color features are provided in Table 1. Results correspond to the whole-fruit assessment.
Horticulturae 11 01283 g004
Figure 5. Partial dependence plots showing the effect of the most influential predictors on fruit relative water content (RWC) as estimated by the Random Forest (RF) model. Each curve depicts the marginal change in predicted RWC as a function of a single input feature, holding all other variables constant at their mean values. These plots illustrate the direction and strength of each key predictor’s relationship with RWC. Color features are provided in Table 1. Results correspond to the whole-fruit assessment.
Horticulturae 11 01283 g005
Figure 6. Residual plot of the Random Forest (RF) model for fruit relative water content (RWC). Residuals (predicted minus measured RWC) are plotted against the corresponding predicted RWC values to assess model fit and identify any systematic bias or heteroscedasticity. The red dashed line indicates the zero-residual reference (perfect prediction) line. Results correspond to the whole-fruit assessment.
Horticulturae 11 01283 g006
Table 1. Colorimetric parameters assessed in cucumber fruit. For each parameter, the table reports the name, description, calculation formula and value range/unit. Color features were extracted from digital images using Trigit and obtained both for the whole fruit and separately for each longitudinal region (neck, mid, blossom).
Color ParameterFormulaRange (Unit)
red (R) 1amount of red
0–255 (−)
green (G) 1amount of green
blue (B) 1amount of blue
%R R R + G + B × 100
0≤
≤100 (%)
%G G R + G + B × 100
%B B R + G + B × 100
cyan (C) 2

0–100 (%)
magenta (M) 2
yellow (Y) 2
black (K) 2
lightness (L*) 30 specifies black, 100 specifies white
red/green (a*) 3amount of red or green tones −110–110 (−)
yellow/blue (b*) 3amount of yellow or blue tones
hue (H) 4location on the color wheel0–360 (°)
saturation (S) 4vividness or dullness0–255 (−)
value (V) 4amount of white
1 RGB color system; 2 CMYK color system; 3 CIELAB color system; 4 HSV color system.
Table 2. Fitted coefficient (b) and constant (a) values of the regression models used to estimate cucumber fruit relative water content (RWC) based on color parameters (Table 1). For each model, the constant (a), fitted coefficient (b), coefficient of determination (R2), mean square error (MSE) and 95% bootstrap confidence limits (BC lower/upper) are provided. Color features were extracted from digital images using Trigit and calculated for the whole fruit as well as separately for each longitudinal region (neck, mid, blossom). A total of 1200 fruits (equally shared between the two storage temperatures) were analyzed over time (up to 49 days for fruit stored at 10 °C and up to 28 days for fruit stored at 25 °C).
RegionModela (Constant)b (Fitted Coefficient)R2RMSEBC lowerBC Upper
Neck (stalk region)–stem end1RWC = a + b μR−1.117129.0780.28414.0570.2590.309
2RWC = a + b μG−0.498119.9120.09915.7640.0810.123
3RWC = a + b μB−0.605104.1330.02116.4420.0130.028
4RWC = a + b%R−693.185272.4210.48511.9230.4640.504
5RWC = a + b%G340.053−84.5990.10415.7210.0870.128
6RWC = a + b%B219.92431.6270.08715.8760.07250.105
7RWC = a + b μC3.228−61.6750.6389.9930.6200.653
8RWC = a + b μY0.021105.5260.02116.4380.0130.032
9RWC = a + b μK1.267−6.8790.09915.7660.0810.120
10RWC = a + b μL−1.347120.8930.11515.6310.0950.136
11RWC = a + b μa*−0.49573.5110.00516.570.0010.012
12RWC = a + b μb*−1.194105.9780.09915.7690.0810.120
13RWC = a + b μH1.356−68.1460.30513.8480.2810.329
14RWC = a + b μS−0.467107.5690.02316.4200.0140.034
15RWC = a + b μV−1.270119.9100.09915.7640.0790.118
Mid-region1RWC = a + b μR−1.243140.7590.37313.1590.3500.391
2RWC = a + b μG−0.664137.9230.17715.0650.1570.199
3RWC = a + b μB−0.848115.6560.04216.2590.0310.053
4RWC = a + b%R−752.269290.5210.50311.7090.4810.522
5RWC = a + b%G314.472−72.0860.07315.9930.0600.088
6RWC = a + b%B275.87519.3540.12115.5760.1160.159
7RWC = a + b μC3.438−69.8300.6499.8460.6330.664
8RWC = a + b μY−0.670118.6190.04416.2440.0310.056
9RWC = a + b μK1.684−30.7230.17715.0710.1570.199
10RWC = a + b μL−1.784139.1690.19614.8910.1760.219
11RWC = a + b μa*0.25988.4880.00116.6030.0010.004
12RWC = a + b μb*−1.517115.4660.15915.2310.1410.181
13RWC = a + b μH1.541−86.9290.34013.4920.3190.365
14RWC = a + b μS−0.696120.0060.04516.2320.0320.057
15RWC = a + b μV−1.692137.9210.17815.0650.1550.197
Blossom region–Blossom end1RWC = a + b μR−1.066137.4360.40212.8470.3790.421
2RWC = a + b μG−0.659142.1380.23514.5340.2160.258
3RWC = a + b μB−0.511103.4180.01716.4710.0110.025
4RWC = a + b%R−670.327271.3730.50711.6650.4860.527
5RWC = a + b%G235.327−33.7990.03716.3010.0280.048
6RWC = a + b%B319.38111.9890.18914.9590.1690.209
7RWC = a + b μC3.153−55.1130.61710.2860.5990.631
8RWC = a + b μY−0.988137.5150.10215.7430.0850.119
9RWC = a + b μK1.676−25.5550.23414.5350.2130.255
10RWC = a + b μL−1.767143.5700.25214.3680.2280.279
11RWC = a + b μa*0.810101.1640.01216.5110.0070.019
12RWC = a + b μb*−1.568120.500.23314.5470.2110.255
13RWC = a + b μH1.651−94.8730.39612.9070.3710.423
14RWC = a + b μS−1.004138.3800.10415.7310.0860.122
15RWC = a + b μV142.138−1.6790.23514.5340.2130.257
Whole fruit1RWC = a + b μR141.329−1.2610.39212.9610.3690.410
2RWC = a + b μG139.624−0.6890.18914.9590.1710.211
3RWC = a + b μB−0.793112.9640.03116.3550.0220.039
4RWC = a + b%R−777.716298.1990.55111.1340.5330.571
5RWC = a + b%G385.268−107.3820.09015.8510.0760.106
6RWC = a + b%B315.21910.8450.14915.3190.1310.171
7RWC = a + b μC3.597-76.5370.6989.1340.6840.711
8RWC = a + b μY−0.813126.5610.05916.1160.0460.074
9RWC = a + b μK1.755−35.9310.18914.9590.1690.214
10RWC = a + b μL−1.842140.6980.20814.7890.1890.229
11RWC = a + b μa*0.21987.6040.00116.6060.0010.004
12RWC = a + b μb*−1.631118.0780.18315.0160.1650.202
13RWC = a + b μH1.648−98.0030.37713.1140.3540.401
14RWC = a + b μS−0.851128.6270.06216.0920.0480.077
15RWC = a + b μV−1.756139.6230.18914.9590.1670.209
Table 3. Performance metrics of the Random Forest model for predicting relative water content (RWC) of cucumber fruit in the testing dataset across different fruit regions and whole-fruit averages. Metrics reported include the Pearson’s correlation coefficient (R), coefficient of determination (R2), mean square error (MSE), root mean square error (RMSE) and mean absolute error (MAE). Confidence intervals (CI) were estimated via the bootstrap percentile method based on the distribution of test set predictions.
Statistical IndexNeck (Stalk Region)–Stem EndMid-RegionBlossom Region–Blossom EndWhole Fruit Average
R0.9290.9270.9250.941
R2 (95% CI)0.863 (0.851–0.874)0.859 (0.846–0.871)0.855 (0.842–0.868)0.886 (0.875–0.897)
MSE39.59739.07440.08433.13
RMSE (95% CI)6.293 (6.201–6.385)6.251 (6.159–6.343)6.331 (6.239–6.423)5.756 (5.664–5.848)
MAE4.3854.3214.2123.996
Disclaimer/Publisher’s Note: The statements, opinions and data contained in all publications are solely those of the individual author(s) and contributor(s) and not of MDPI and/or the editor(s). MDPI and/or the editor(s) disclaim responsibility for any injury to people or property resulting from any ideas, methods, instructions or products referred to in the content.