Article

Characterization of Postharvest Changes in Fruit Quality Traits of Highbush Blueberry (Vaccinium corymbosum L.) Cultivars

Liaoning Institute of Pomology, Yingkou 115009, China
*
Author to whom correspondence should be addressed.
Horticulturae 2025, 11(10), 1250; https://doi.org/10.3390/horticulturae11101250
Submission received: 20 August 2025 / Revised: 22 September 2025 / Accepted: 25 September 2025 / Published: 16 October 2025
(This article belongs to the Section Postharvest Biology, Quality, Safety, and Technology)

Abstract

This study investigated the dynamic changes in fruit color, texture and quality attributes of blueberry cultivars during a 15-day postharvest storage period to provide theoretical insights for cultivar selection, postharvest preservation and commercial evaluation. Phenotypic and quality traits, including color parameters (CIE-Lab*), texture attributes (Note: hardness represents firmness and is an indicator in the Brookfield’s texture analyzer), adhesive force and physicochemical indices, were systematically analyzed using a colorimeter, texture analyzer and conventional methods. Principal component analysis (PCA) and cluster analysis were applied to evaluate postharvest performance. Southern highbush cultivars, including ‘EB 9-2’, ‘Meadowlark’, ‘Primadonna’, ‘Eureka’ and ‘Camellia’, exhibited superior comprehensive quality, characterized by small fruit shape index, minimal scar sizes and stable hardness dynamics. During the storage period, ‘Legacy’ demonstrated optimal color stability (ΔE < 3.5 from days 0–15), while ‘EB 9-2’ showed the most significant hardness increase. Scar size, fruit shape index and flesh elasticity were identified as key indicators for analyzing shelf-life hardness variations, offering scientific guidance for cultivar selection and postharvest management.

1. Introduction

Blueberries (Vaccinium spp.), as berry crops with high nutritional and economic value, have become a pivotal component of the global agricultural product trade, with their industrial scale and market influence experiencing explosive growth over the past two decades. According to data from the IBO 2024 report (http://www.THEIBO.org, accessed on 4 December 2024), the global total blueberry yield has exceeded 1.7823 million tonnes, of which 71% is consumed as fresh fruit and 29% for processing—representing a nearly 250% increase in total yield over ten years. In terms of trade flows, the global blueberry trade exhibits the characteristics of ‘Core producing regions leverage climatic differences to achieve staggered maturity periods, enabling nearly year-round supply of blueberries’. Fresh blueberry trade primarily relies on a combination of short-distance air transportation and long-distance maritime shipping, with the United States, the European Union and China as the three major consumer markets. According to Li’s report [1], China’s fresh blueberry imports increased continuously from 2012, reaching 22,000 tonnes in 2019, followed by a fluctuating upward trend after 2020. After peaking at 42,900 tonnes in 2022 (the highest in recent years), imports began to decline. The primary driver of this decline is the early ripening of fresh blueberries from protected cultivation in Yunnan and solar greenhouses in Liaoning, which fills the gap in China’s fresh fruit market as early as February.
Consumer preference is the core driver of the blueberry industry’s development. Consumer expectations for blueberry shelf life have shifted from ‘basic freshness’ to ‘stable quality + extended shelf life’. In the South Korean market, despite competition from cheaper imported blueberries, local consumers exhibit a stronger preference for fresher domestic blueberries. Both global and domestic industry reports confirm that the returns on high-quality blueberries are substantial, with the high-end market willing to pay a premium for such products. Shelf life refers to the duration during which fruit retain safety, sensory appeal and physicochemical integrity under recommended conditions after harvest or storage [2]. Postharvest performance directly impacts consumer preference and market competitiveness.
Postharvest research has predominantly focused on preservation techniques involving exogenous treatments [3]. Existing studies have identified storage temperature, relative humidity and gas atmosphere as core factors affecting blueberry shelf-life quality, and preliminary insights have been gained into the regulatory mechanisms of different storage conditions on fruit physiological metabolism and quality changes. Angeletti [4] focused on two highbush blueberry cultivars, ‘O’Neal’ and ‘Bluecrop’, investigating the regulatory effect of preharvest calcium application on fruit firmness. The study confirmed that preharvest calcium treatment significantly increased firmness in ‘O’Neal’ compared to the control; in contrast, ‘Bluecrop’ showed no significant firmness difference from the control on the harvest day, but, after 23 days of storage at 2 °C, both cultivars exhibited significantly higher firmness under calcium treatment than the control. The research emphasized the benefits of preharvest calcium fertilization for blueberry storage. Srivastava [5] noted that storage at −20 °C inhibited the degradation of total polyphenols and total anthocyanins in ‘Tifblue’ and ‘Powderblue’ blueberries; in contrast, significant degradation of these compounds occurred after 15 days of storage at 23 °C and 35 °C. Therefore, refrigeration or freezing minimizes adverse effects on total polyphenols and total anthocyanins in blueberry fruit. Paniagua [6] explored the correlation between air flow rate, weight loss and firmness changes in postharvest ‘Centurion’ rabbiteye blueberries by modifying storage air flow rates. They found that faster air flow resulted in greater weight loss and more rapid firmness decline. Intriguingly, independent of air flow rate and storage duration, ‘Centurion’ berries exhibited a ‘firming increase phenomenon’ when weight loss was below 1.34%, whereas softening occurred when weight loss exceeded 3.47%. Additionally, magnetic resonance imaging (MRI) revealed that water loss primarily occurred in the epidermal layer at low weight loss; at high weight loss, mesocarp cells shrank due to dehydration, leading to increased intercellular spaces.
Dragisić [7] investigated mid- and late-season blueberry cultivars ‘Bluecrop’ and ‘Liberty’ under regular atmosphere (RA) and modified-atmosphere packaging (MAP) during 30 d storage at 2 °C, revealing significant varietal divergence in firmness decay, where crisp-fleshed ‘Liberty’ exhibited higher initial firmness (428 g) versus soft-fleshed ‘Bluecrop’ (296 g), with MAP significantly enhancing quality preservation in ‘Bluecrop’ through superior Total Quality Index (TQI) and 13% higher sugar retention compared to RA, whereas conversely inhibiting quality retention in ‘Liberty’, demonstrating that MAP applicability cannot be universally assumed for long-term storage and necessitating precision postharvest technologies aligned with cultivar-specific traits to optimize shelf-life extension and distribution logistics and, similarly, necessitating systematic analysis of phenotypic dynamics to refine postharvest logistics and preservation strategies. Harb [8] reported that excessively high CO2 concentrations induce texture deterioration and flavor abnormalities in blueberries, but the cultivar-specific CO2 tolerance thresholds remain unclear. Precise postharvest treatment technologies tailored to cultivar characteristics are therefore required to extend shelf life, necessitating systematic analysis of phenotypic dynamics to optimize postharvest logistics and preservation strategies.
As consumer demands for commercial traits continue to rise, blueberry shelf-life quality evaluation has evolved from ‘single-index assessment’ to ‘multi-dimensional comprehensive evaluation’. Texture, color and functional components are core evaluation indicators. Accurate assessment of fruit phenotypic traits and postharvest phenotypic changes across blueberry cultivars is of great value to both breeders and consumers.
In terms of texture evaluation, traditional studies have primarily used Texture Analyzers for compression testing. Rivera [9] used two blueberry cultivars, ‘Nui’ and ‘Rahi’, harvested at three maturity stages, to investigate texture changes under different storage technologies and MAP treatments. They identified hardness slope and skin break slope as indicators capable of distinguishing harvest maturity and storage technology, which could also detect fruit softening and firming during storage. While this study advanced the blueberry texture evaluation system, it did not address the mechanistic link between texture changes and cellular microstructure. Li [10] employed Optical Coherence Tomography (OCT) to nondestructively assess mesocarp microstructure in stored berries. They found that the thickness of the top two epidermal cell layers increased with weight loss due to moisture depletion, and this thickness exhibited a linear Pearson correlation with TPA parameters of blueberries. However, the high equipment cost of this technology limits its application in industrial practice. The CIE Lab color space is a widely used color evaluation method. Jimenes [11] found that ‘Snowchaser’ blueberries maintained stable peel color (unchanged L* and b*, minimal a* variation) under 22 °C and 60% relative humidity, with a 6-day maximum shelf life. Cesa [12] reported that the hue angle (hab) in the CIELAB color space is negatively correlated with total anthocyanin content and closely associated with the ratio of different anthocyanins, making it a viable indirect indicator of anthocyanin changes.
The fresh blueberry industry still faces significant challenges in accurately evaluating inter-cultivar differences and optimizing cultivation management and postharvest treatments to maintain quality stability based on inherent cultivar traits. This study focuses on 24 blueberry cultivars, including southern highbush, northern highbush and their hybrids. To eliminate the interference of environmental variables on inter-cultivar quality comparisons, comprehensive quality evaluations were conducted under uniform cultivation and laboratory conditions. During a 15-day shelf life at a consistent refrigeration temperature of 4 °C, postharvest quality indicators related to commercial value—including soluble solids content, color and fruit texture—were compared across cultivars. Dynamic changes in these parameters during the 15-day postharvest period were analyzed. By comparing textural trait differences among multiple cultivars, evaluations of both fresh fruit and shelf-life fruit (in terms of color and texture) were conducted, aiming to provide a reference for commercial value analysis based on phenotypic and textural traits.

2. Materials and Methods

2.1. Plant Materials and Sampling

Twenty-four highbush blueberry cultivars grown in greenhouses at the Small Fruits Demonstration Area of the Liaoning Institute of Pomology (Yingkou City, Liaoning Province, China) in 2024 were used as materials (Table 1). The greenhouses are located within the Small Fruits Demonstration area, equipped with integrated water and fertilizer machines, and operated under the same management mode. All indoor experiments of this study were conducted at the Key Laboratory of Small Fruits Genetic Improvement and High-Efficiency Cultivation (both Ministry of Agriculture and Rural Affairs and Liaoning Province) and the Key Laboratory of Northern Fruit Tree Resources and Breeding (Liaoning Province).
Fruit were harvested from plants with a ripeness level of 50% [13]. Only fruit with proper shape, uniform size and uniform maturity, without pests, diseases and mechanical damage were selected and transferred to the laboratory. Fruit with pinkish stem scars were manually sorted out, while those showing an overall blue-purple color visible to the naked eye were retained. The measurements were taken at day 0, day 5, day 10 and day 15 of picking, under the refrigerated condition of 4 °C ± 1 °C. The classification criteria for southern highbush blueberries and northern highbush blueberries refer to Li [14] and Gu, et al. [15].

2.2. Experimental Instruments and Methods

Average single-fruit weight was measured using an electronic balance (PL602-L PL-L Mettler Toledo, Greifensee, Switzerland), while scar size was determined with a vernier caliper (0–150 mm, Delixi Electric, Yueqing, China). Total soluble solids content was analyzed using a digital refractometer (PR-100, Atago, Tokyo, Japan). Total acid content was determined by NaOH titration. Fruit color was quantified using a portable colorimeter (CM-700d/600d, Konica Minolta, Tokyo, Japan), and texture parameters were assessed via a texture analyzer (TA. XT Plus, Brookfield, Middleboro, MA, USA) with a TA25/1000 cylindrical probe (50.8 mm diameter). The fruit shape index was calculated as the ratio of longitudinal to transverse diameter. Fruit shape index = longitudinal diameter/transverse diameter. Triplicate analysis was performed, and each replicate randomly selected 10 berries were used for each trait and duration.

2.3. Experimental Procedures

2.3.1. Colorimetric Analysis

For each cultivar, 10 fruits were selected as one measurement group, with three replicates performed (i.e., three groups in total per cultivar, 10 fruits per group). Fruit color was measured using a calibrated colorimeter. The measurement methods were as follows: two non-overlapping points were selected only on the equatorial region of each fruit, and the calyx scar area was avoided to ensure the accuracy and representativeness of the measurement results. Color values (L: lightness; a: red–green axis; b: yellow–blue axis) were averaged for each fruit, following the CIE-Lab system [16]. Total color difference is a key indicator for evaluating the ripeness, freshness and processing suitability of blueberries. Total color difference (ΔE) was calculated as follows:
Δ E = [ ( L * L 0 ) 2   +   ( a * a 0 ) 2   +   ( b * b 0 ) 2 ]
where L0, a0 and b0 represent initial values.

2.3.2. Texture Profile Analysis (TPA)

The parameter of TPA was adapted from Liu et al. [17]: pre-test speed = 5 mm/s, test speed = 2 mm/s, post-test speed = 2 mm/s, deformation = 25% and trigger force = 5.0 g. Ten fruits per replicate (three replicates total) were analyzed.

2.4. Statistical Analysis

The raw experimental data were recorded, organized and compiled using Microsoft Excel 2021. Statistical analysis and graphing of the data were performed using SPSS 26.0 and Origin 2024, respectively. The data were validated via one-way analysis of variance (ANOVA) and Levene’s test. Based on the establishment of homogeneous variances, pairwise comparisons among all the treatment groups were conducted using Tukey’s post hoc test. The final analytical results were presented in tables or figures, with significant differences between groups marked: different lowercase letters indicate significant differences among groups (p < 0.05), while the same lowercase letters indicate no significant difference between groups.

3. Results

3.1. Fruit Characteristics of Blueberry Cultivars at Harvest

Quality indices of 24 cultivars are summarized in Table 2. Fruit transverse and longitudinal diameters ranged from 13.93 to 22.19 mm and 10.78 to 17.09 mm, respectively. Cultivar 1 (‘Eureka’) exhibited the largest transverse (22.19 mm) and longitudinal (17.09 mm) diameters, showing no significant difference with cultivars 4, 9 and 21 in transverse diameter but differing significantly from others. Longitudinal diameters of cultivars 4, 6, 11, 15 and 16 were statistically comparable to ‘Eureka’ but significantly different from other cultivars. Cultivar 22 had the smallest dimensions. Fruit shape index ranged from 0.69 to 1.02, with only cultivar 16 being spherical (index = 1.02). Single fruit weights varied between 2.01 and 4.21 g, with ‘Eureka’ (4.21 g) and cultivar 4 (4.13 g) being the heaviest. Scar sizes ranged from 1.36 to 3.32 mm, with cultivar 22 having the smallest scar (<2.00 mm in six cultivars: 1, 5, 6, 17, 19 and 21). SSC values spanned 9.27–17.63%, with cultivar 19 showing the highest content.
Fruit hardness ranged from 7.19 to 27.65 N (Table 3), with cultivars 18, 21 and 4 exceeding 20 N, while cultivar 16 exhibited the lowest value. Adhesive force and cohesiveness varied between 1.87 and 9.73 g, and 0.05 and 0.21, respectively. Springiness, reflecting the recoverable height between the first and second compression cycles during texture profile analysis (TPA), was highest in cultivar 16 (7.67 mm). The remaining 23 cultivars showed significantly lower springiness (2.02–3.86 mm). Gumminess and chewiness ranged from 0.71 to 3.83 N and 1.50 to 13.19 mJ, respectively.

3.2. Color Evaluation During Blueberry Postharvest Period

The L* value quantifies lightness (0 = pure black; 100 = pure white). According to Table 4, cultivar 12 exhibited the highest L* value (visually perceived as bluish-white), showing no significant difference with cultivars 3, 9 and 14 but differing markedly from others. The a* (green–red axis) was positive (redness-dominant) in all cultivars, with cultivar 13 displaying the highest a* (0.75), likely due to slight pink pigmentation near the calyx. The b* (blue–yellow axis) minimally influenced visual perception of berry color. Cultivar 17 showed comparable b* to cultivars 1 and 10 but differed significantly from the remaining 20 cultivars.
As shown in Figure 1, the L* (lightness) of all 24 blueberry cultivars declined progressively over the 15-day postharvest storage period, ranging from 33.06 to 48.47. By day 15, the berries exhibited a significantly darker coloration compared to 0 d (harvest). At harvest, mean a* (green–red axis) were negative, confirming full ripeness without residual redness. No significant temporal trends in a* were observed during storage. Negative b* (blue–yellow axis) indicated blue-dominant coloration, with higher absolute values corresponding to deeper blue hues. Median b* increased slightly over time, suggesting a gradual reduction in blue intensity.
ΔE (total color difference) served as a critical indicator of color stability. ΔE < 1.0 represents undetectable differences by instruments, while ΔE = 1.0–3.5 corresponds to the perceptibility threshold for trained evaluators. ΔE > 3.5 denotes visually discernible changes under standard quality criteria [18]. During 0–5 d, 13 cultivars 1, 2, 6, 7, 8, 9, 10, 12, 13, 14, 19, 21 and 24 maintained ΔE < 3.5, indicating acceptable color stability for consumer preference (Table 5). By days 0–10, only eight cultivars (6, 7, 8, 9, 12, 18, 19 and 21) retained ΔE < 3.5, with cultivar 18 showing ΔE fluctuations (4.17 at days 0–5; 2.39 at days 0–10; 3.97 at 0–15 d). Notably, cultivar 21 was the sole cultivar maintaining ΔE < 3.5 throughout the 15 days. These findings suggest that 16 cultivars require short-distance distribution and limited postharvest storage period (<10 d) to preserve color quality.

3.3. Flesh Hardness Evaluation During Postharvest Storage

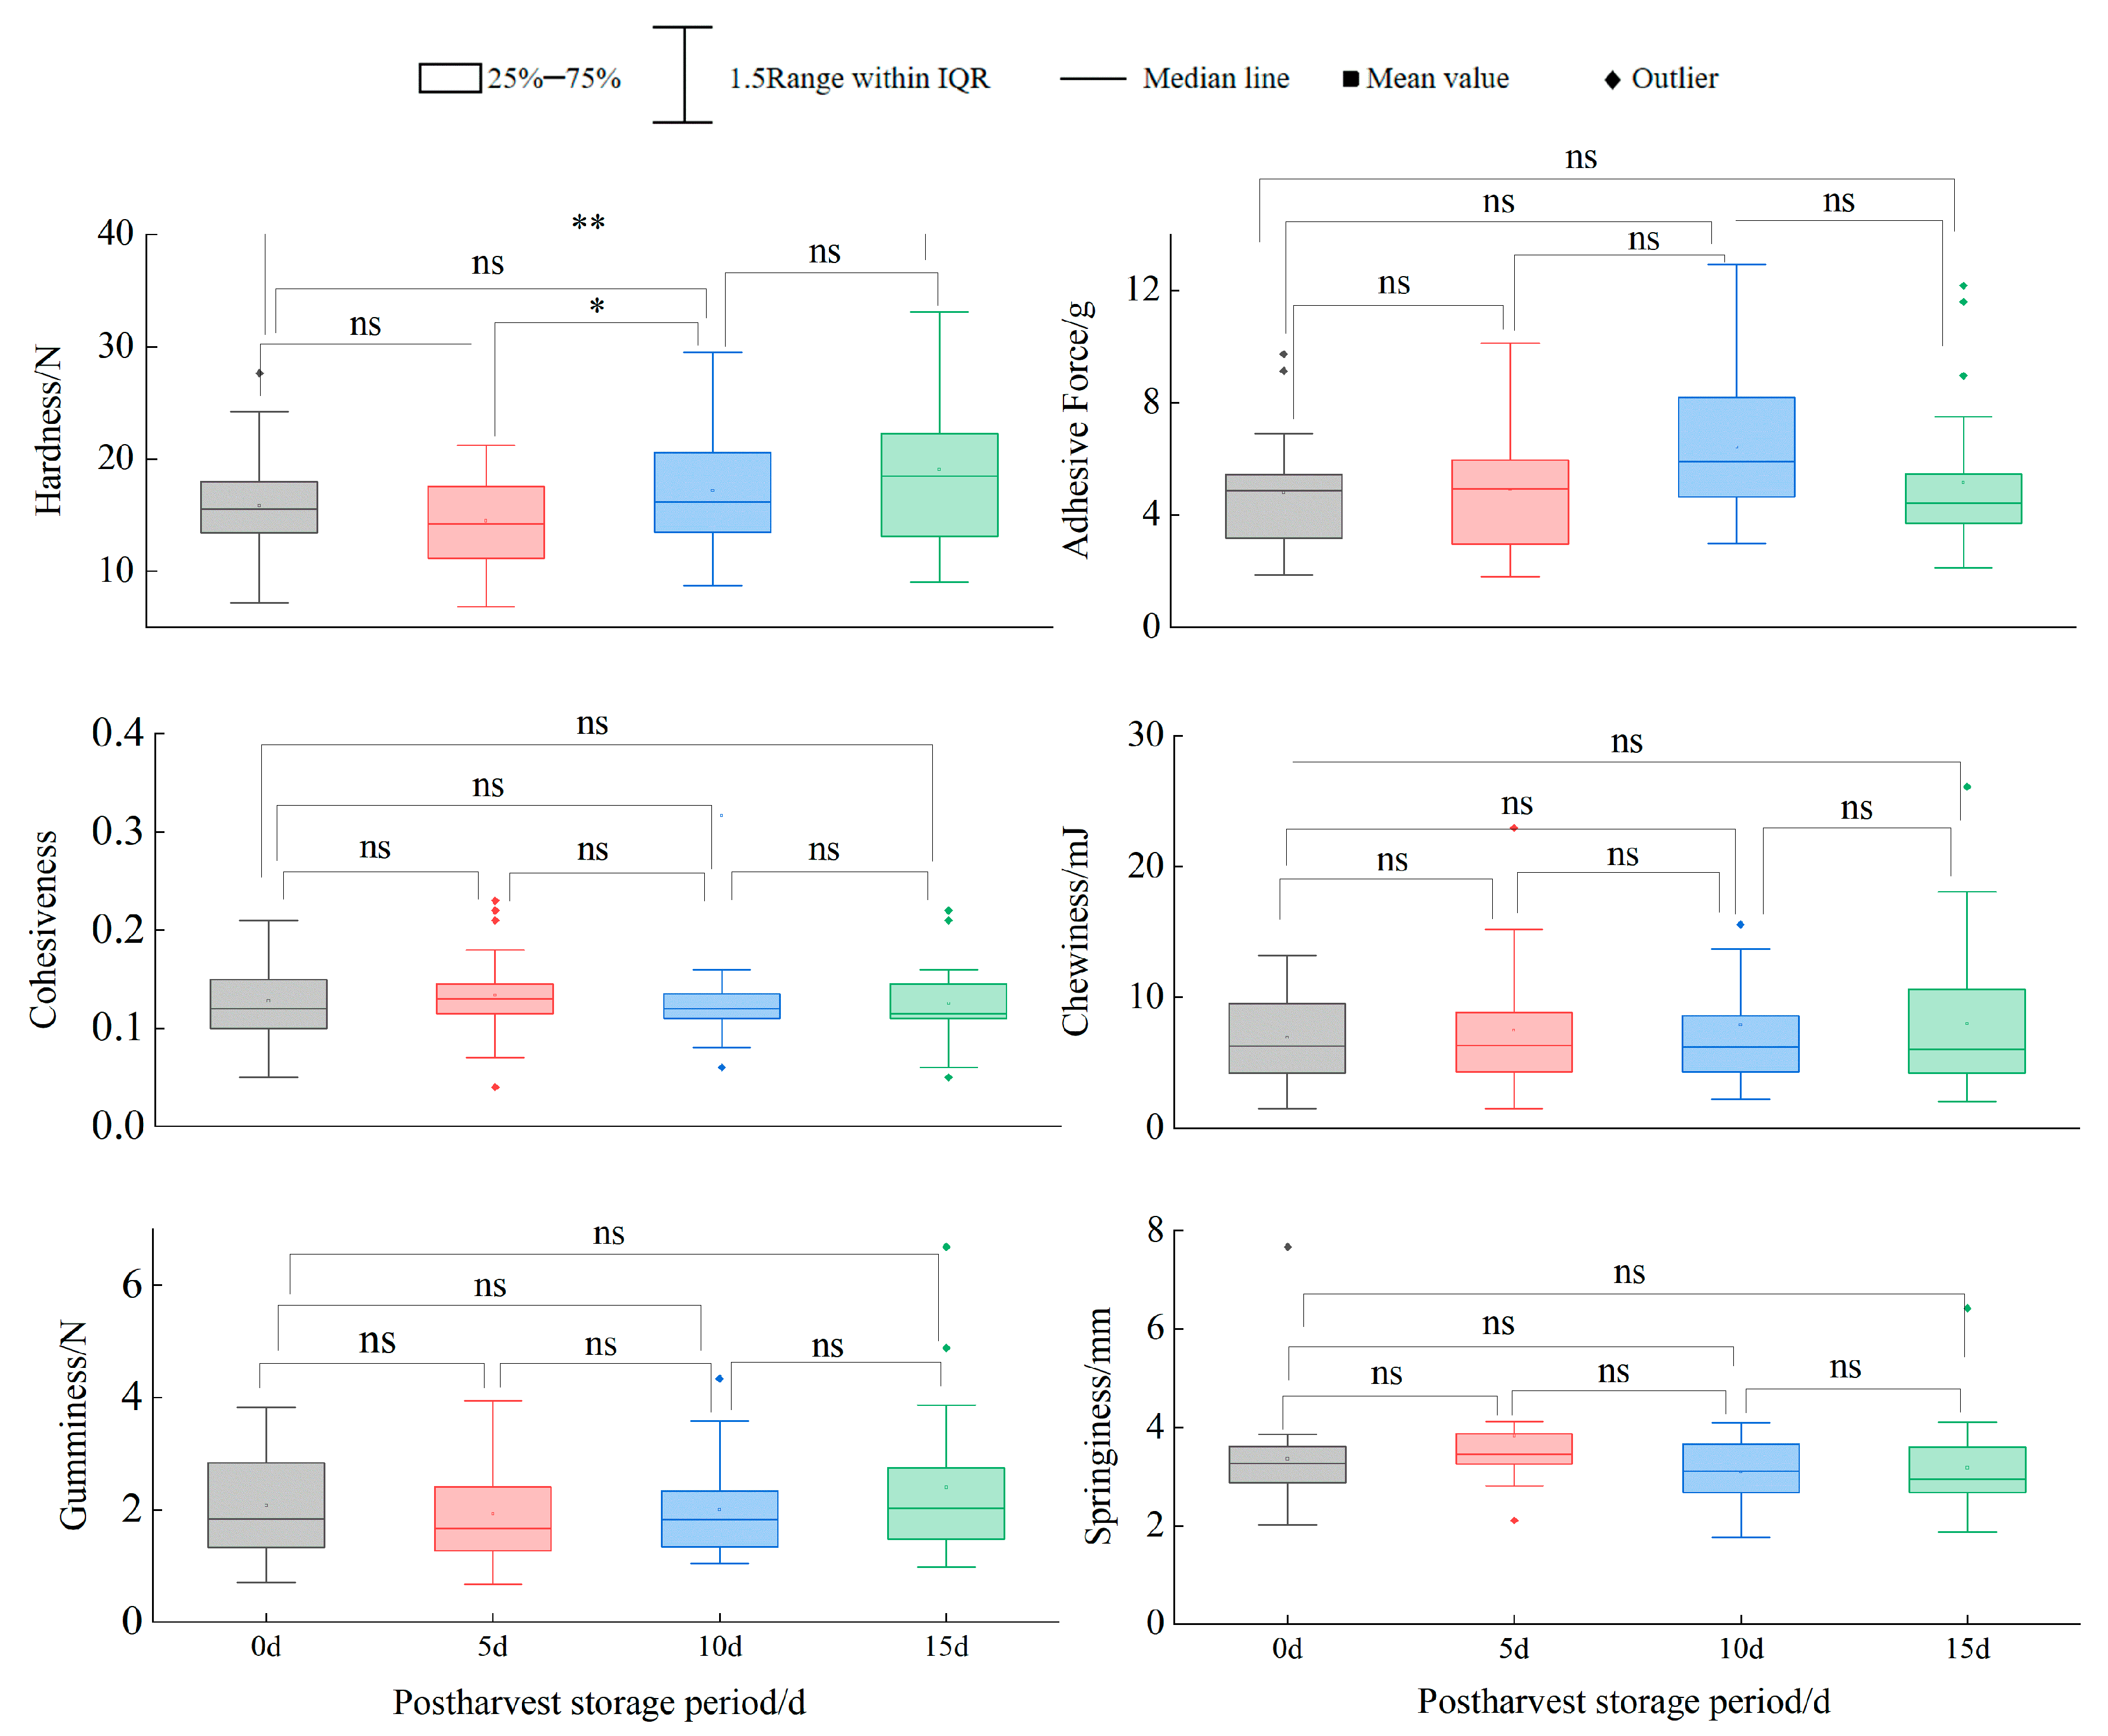
Hardness exhibited a U-shaped trend during storage, declining significantly by 5 d compared to 0 d (p < 0.05), followed by partial recovery at days 10 and 15 (Figure 2). However, there was still an extremely significant difference in hardness between 15 d and 0 d. (p < 0.01). Initial softening may relate to respiratory sugar depletion and cell wall loosening, while later hardening likely reflects tissue dehydration and lignification. Adhesive force, cohesiveness, springiness, gumminess and chewiness showed no significant temporal variations, though cohesiveness decreased marginally.
Notably, cultivars 3, 6, 7, 10, 18 and 20 exhibited hardness reductions of 5.54%, 15.36%, 22.17%, 13.86%, 5.72% and 23.64%, respectively, by day 15. In contrast, cultivar 14 displayed a 119.93% hardness increase. Comparative analysis within cultivars revealed highly significant differences (p < 0.01) between 0 d and 15 d for cultivars 4, 14, 21 and 22, while cultivars 2 and 5 showed significant differences (p < 0.05) (Table 6).

3.4. Correlation Analysis of Fruit Quality Traits

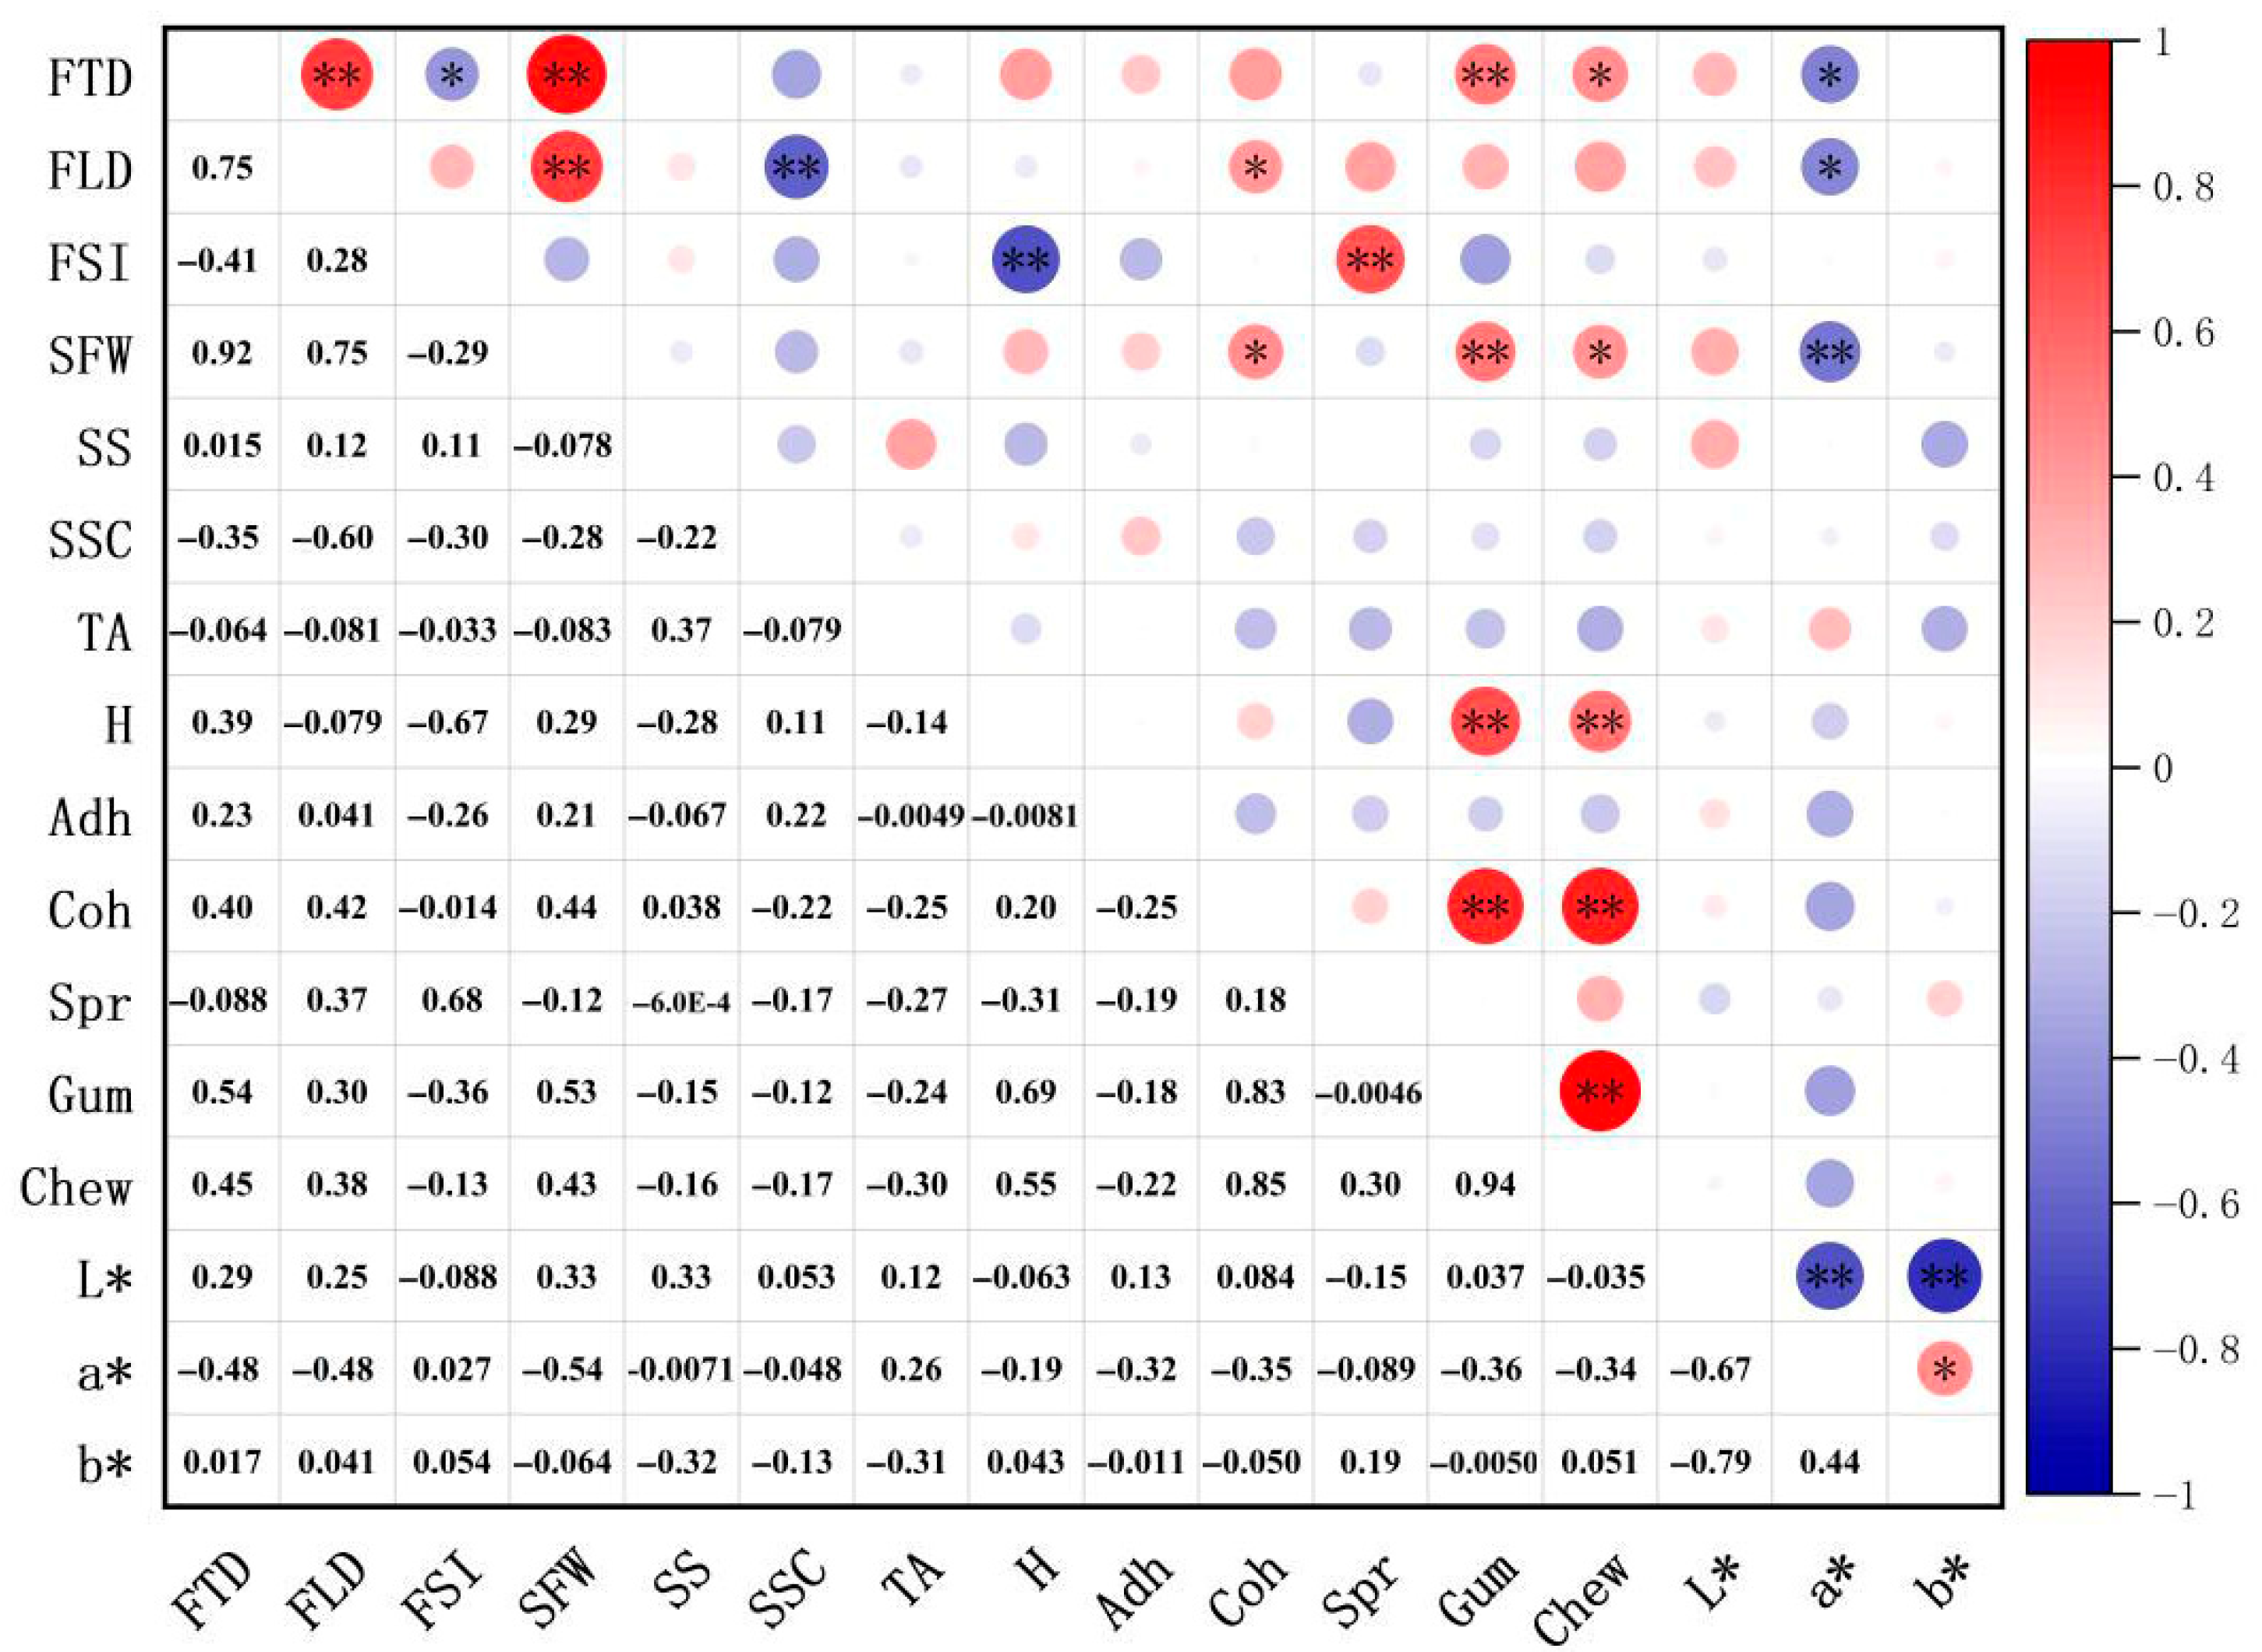
Correlation analysis of 16 textural and quality parameters (Figure 3) revealed highly significant positive correlations between fruit dimensions (transverse and longitudinal diameters) and single fruit weight (r = 0.75–0.92, p < 0.01). Fruit shape index correlated negatively with transverse diameter (r = −0.41, p < 0.05) and hardness (r = −0.67, p < 0.01) but positively with springiness (r = 0.68, p < 0.01). Hardness showed strong positive associations with gumminess (r = 0.69) and chewiness (r = 0.55). Color parameters exhibited significant interdependencies: L* correlated negatively with a* (r = −0.67) and b* (r = −0.79), while a* and b* showed positive correlation (r = 0.44, p < 0.05).

3.5. Principal Component Analysis and Comprehensive Evaluation

Principal component analysis (PCA) of 16 standardized textural and quality traits yielded five components with eigenvalues >1, accounting for 83.38% cumulative variance (Table 7). Component 1 (‘texture factor’) was dominated by cohesiveness, gumminess, chewiness and hardness. Component 2 (‘appearance factor’) included transverse diameter, longitudinal diameter and single-fruit weight (loadings: 0.307, 0.313 and 0.287). Component 3 combined appearance and texture traits, with fruit shape index and cohesiveness contributing most. Together, these three components explained 56.72% of variance. Component 4 (‘color-SSC factor’) was driven by L* and soluble solids content (SSC), while Component 5 (‘flavor factor’) exhibited strong negative loading for titratable acidity.
The comprehensive evaluation model derived from PCA is expressed as follows:
Y 1   =   0 . 290 X 2   +   0 . 238 X 4     0 . 390 X 6   +   0 . 369 X 7   +   0 . 383 X 8   +   0 . 307 X 9 +   0 . 380 X 10
Y 2 = 0 . 349 X 1   +   0 . 349 X 3   +   0 . 408 X 13   +   0 . 450 X 16
Y 3 = 0 . 372 X 1     0 . 398 X 4   +   0 . 328 X 9   +   0 . 351 X 11   +   0 . 349 X 13
Y 4 = 0 . 426 X 3   + 0 . 408 X 15  
Y 5 = 0 . 412 X 2   +   0 . 513 X 14  
Y = 0 . 242 Y 1   +   0 . 241 Y 2   +   0 . 197 Y 3   +   0 . 183 Y 4   +   0 . 137 Y 5  
Southern highbush cultivars 14, 15 and 16 ranked highest in comprehensive scores under greenhouse cultivation (Table 8), while the cultivar 24 and southern highbush cultivars 21 ‘Legacy’ (rank 6) showed moderate performance. The top five cultivars were all southern highbush types (14, 15, 16, 1 and 4).

3.6. Cluster Analysis

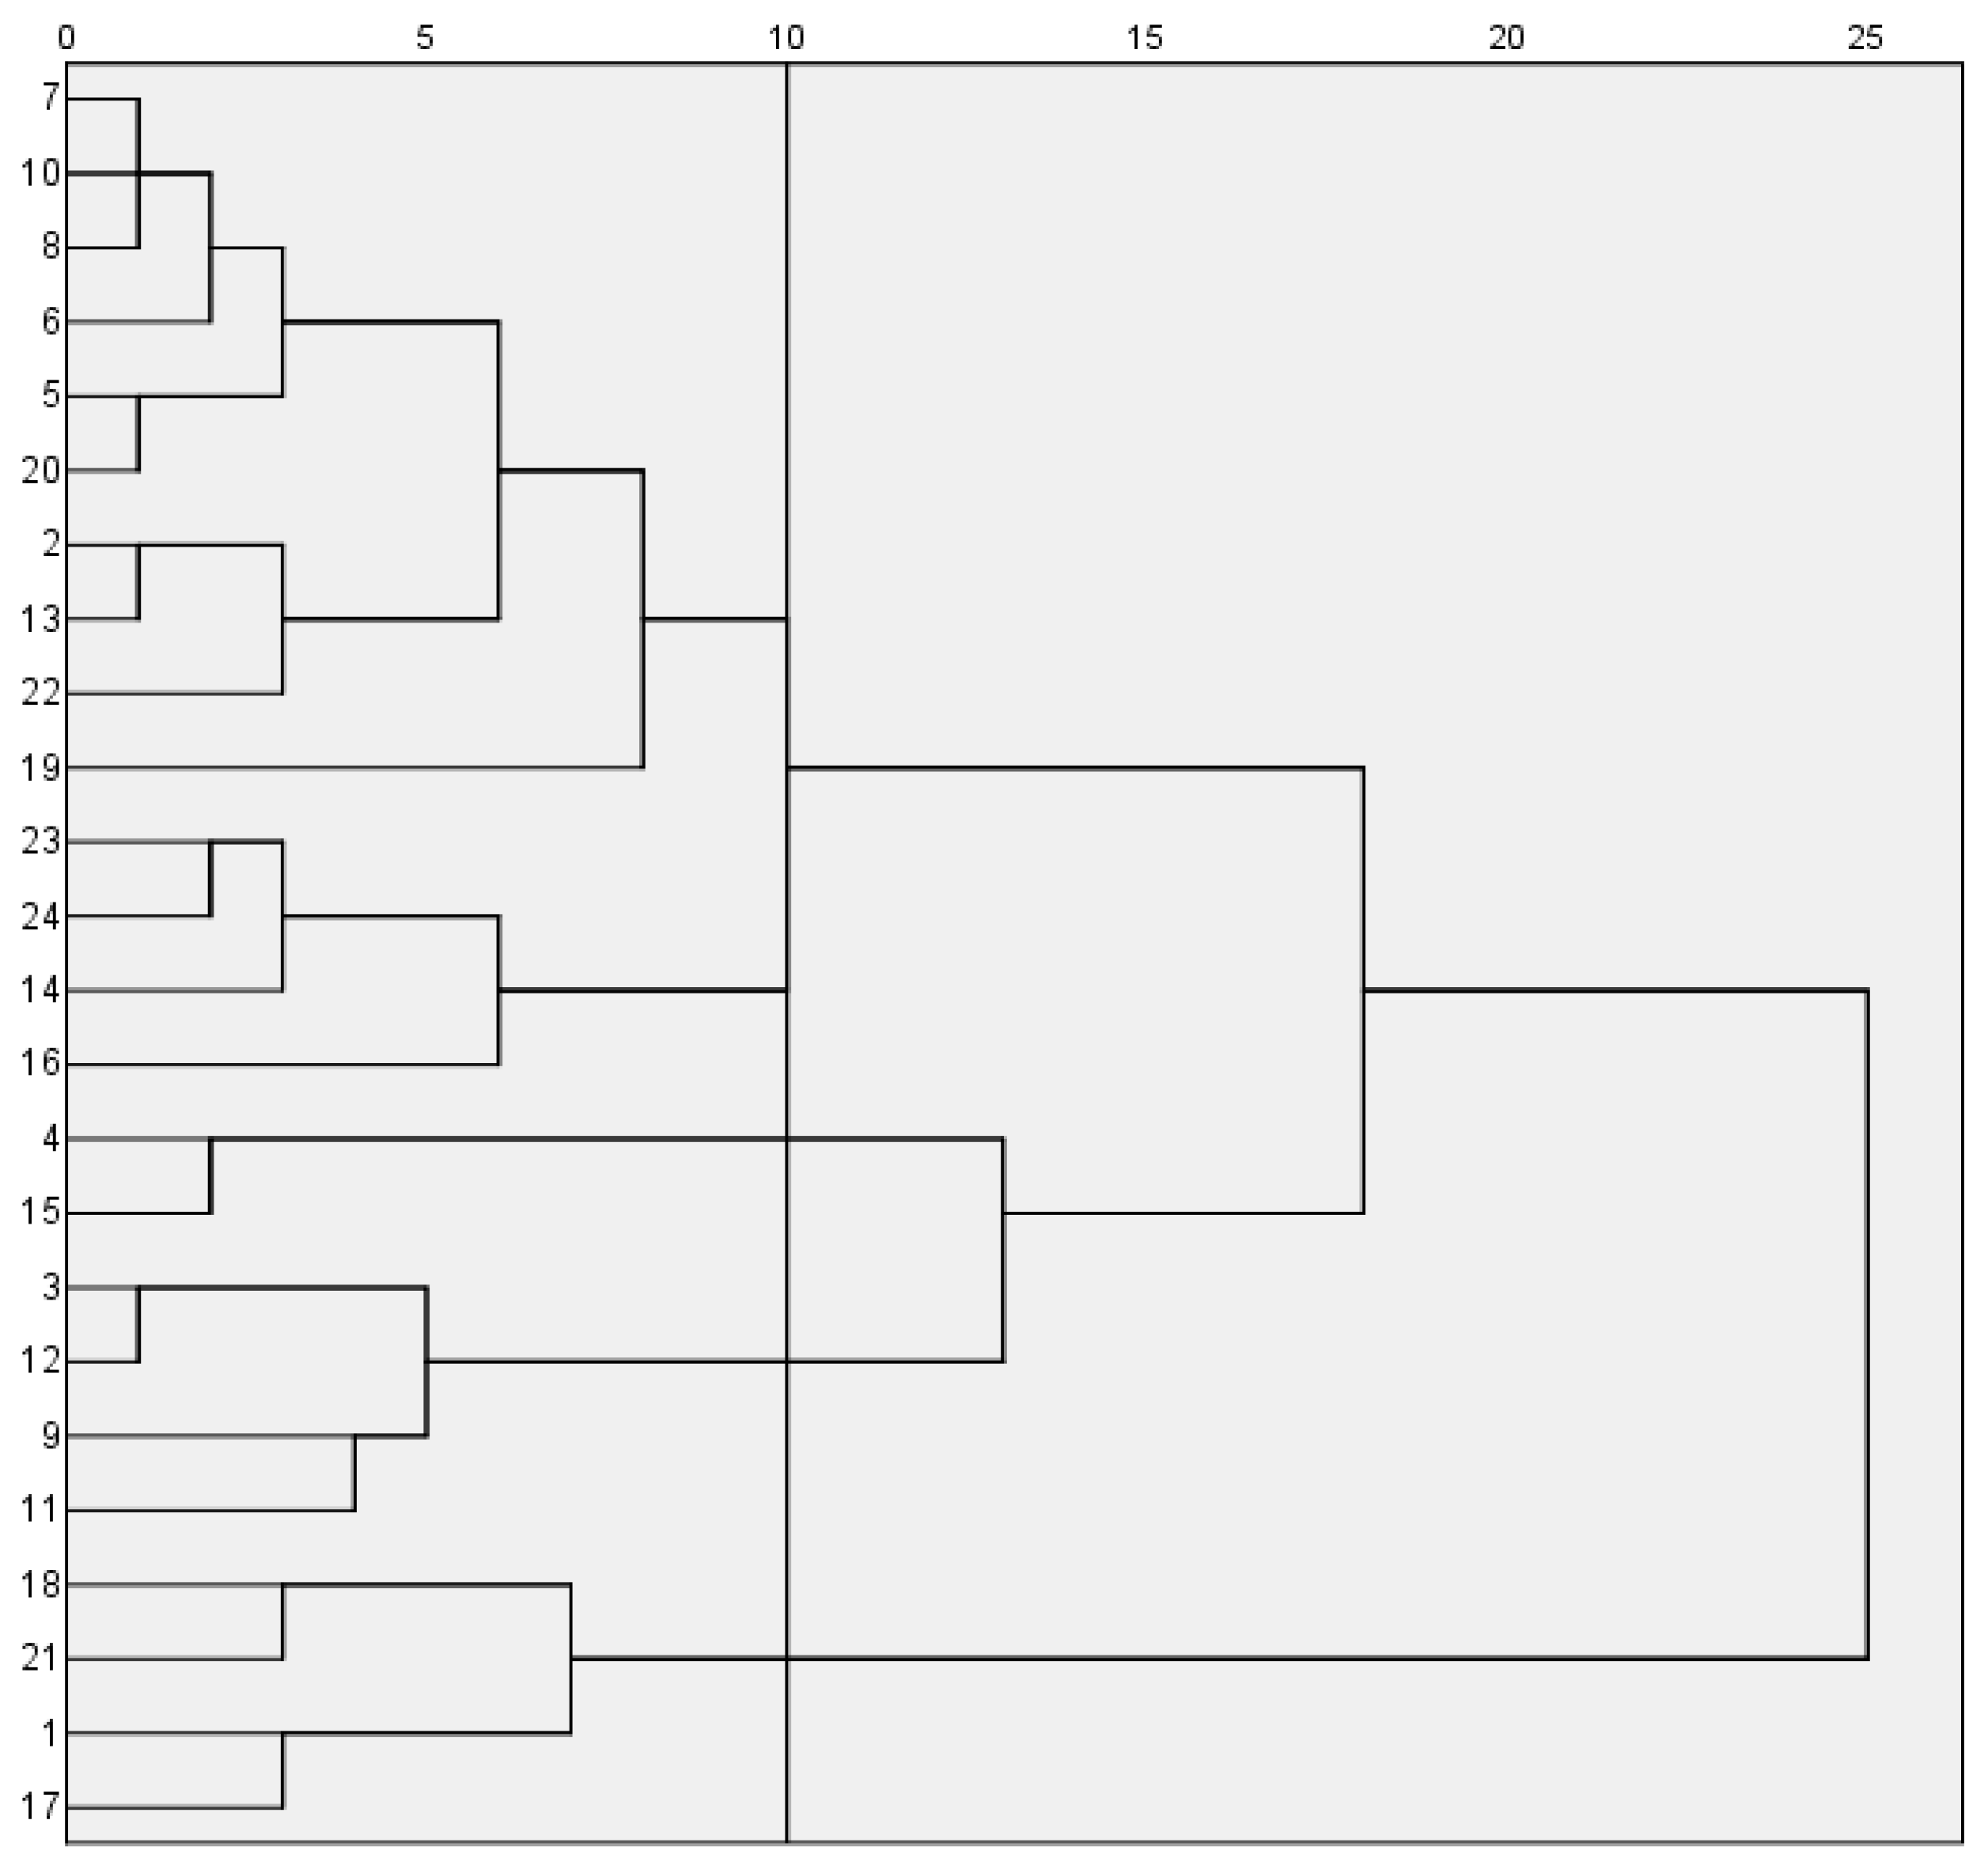
Hierarchical clustering (squared Euclidean distance, furthest neighbor method) based on five PCA-derived indices classified the 24 cultivars into five clusters at a distance threshold of 10 (Figure 4): Cluster I (2, 5, 6, 7, 8, 10, 13, 19, 20 and 22), characterized by the lowest L* (darkest hue) and highest a* values (reddish undertones). Cluster II (14, 16, 23 and 24) exhibited minimal soluble solids content (SSC), near-spherical morphology (lowest shape index), reduced hardness and negligible adhesiveness. Cluster III (4 and 15), distinguished by maximal L* (brightest), minimal a*/b* (intense blue coloration), largest fruit dimensions and elevated hardness. Cluster IV (3, 9, 11 and 12) featured high L* (bright appearance), peak titratable acidity, low SSC, soft texture (lowest hardness) and prominent stem scars. Cluster V (1, 17, 18 and 21) displayed the largest horizontal diameters, highest shape index (button-like flatness), minimal stem scars and maximum hardness despite lower L*.
Clusters I and III maintained ΔE < 3.5 during days 0–5, with Cluster III showing the least color variation in the Table 9 (ΔE < 3.5 at days 0–10). Darker-colored cultivars exhibited minimal chromatic shifts, likely attributable to low baseline color perceptibility and small stem scars. All the clusters exceeded ΔE > 3.5 by day 15, and only Cluster V had ΔE < 3.5 by day 10, suggesting a maximum recommended shelf life of 10 days for marketability.
Hardness trajectories followed U-shaped patterns (initial decline followed by recovery) in Clusters I, III, IV and V, contrasting with the monotonic increase in Cluster II (lowest single-fruit weight, reduced hardness and elevated adhesiveness). This divergence may reflect accelerated cellular dehydration in Cluster II cultivars. Notably, Clusters I and V demonstrated marginal hardness changes (8.21% and 11.46%, respectively) over 15 d.

4. Discussion

Investigating blueberry fruit quality traits is critical for cultivar selection and germplasm innovation. Comprehensive evaluation of varietal quality attributes and their shelf-life dynamics (color and hardness) provides theoretical guidance for optimizing cultivation strategies and enhancing breeding efficiency.

4.1. Varietal Differences in External Quality and Trait Correlations

Understanding intrinsic fruit quality and its shelf-life dynamics enables growers to optimize cultivar selection and marketing strategies. Visual traits, particularly fruit size and color, dominate consumer preference, with color serving dual roles as a maturity indicator and key aesthetic attribute [19]. The observed phenotypic diversity included fruit transverse diameter: 13.93–22.19 mm; fruit longitudinal diameter: 10.78–17.09 mm; shape index: 0.69–1.02; single-fruit weight: 2.01–4.21 g; and scar size: 1.36–3.32 mm. These provide breeders with substantial selection flexibility [20,21]. Chromatic analysis revealed that higher L* (bright bluish-white) and lower L* (darker hues) correlated strongly with negative a* (greenness) and b* (yellowness) associations (p < 0.01). Notably, a* exhibited negative correlations with fruit dimensions (p < 0.05) and shape index (p < 0.01).
Hardness, derived from TPA, quantifies resistance to compression and deformation, integrating initial resistance and post-compression behavior [22,23,24,25,26]. Chewiness reflects mastication energy expenditure, while springiness measures recoverable height between compression cycles. Adhesive force, cohesiveness and gumminess collectively define textural mouthfeel.In comparative analysis with cucumber germplasm (hardness 12.35 to 22.32 N, chewiness 11.87 to 61.97 mJ) [27], contextualized observed blueberry textural ranges included hardness (7.19–27.65 N), chewiness (1.50–13.19 mJ), adhesiveness (1.87–9.73 g), cohesiveness (0.05–0.21), springiness (2.02–7.67 mm) and gumminess (0.71–3.83 N). Although the numerical ranges of hardness and chewiness, more research is still required for the study and enhancement of the textural trait of blueberries.
Fruit transverse diameter and longitudinal diameter showed a highly significant positive correlation with single-fruit weight (p < 0.01), while a significant negative correlation was observed between transverse diameter and fruit shape index (p < 0.05). No significant correlation existed between longitudinal diameter and fruit shape index, which is in line with the findings reported by Zhao et al. [28]. Fruit shape index exhibited a highly significant negative correlation with fruit hardness (p < 0.01) and a highly significant positive correlation with elasticity (p < 0.01), indicating that fruit shape index may serve as an indirect indicator of hardness and elasticity. However, whether the correlation between the morphological and textural characteristics of blueberry fruit across different cultivars is species-specific remains to be further verified by expanding the sample size and incorporating observations of cellular structure. No significant correlation was observed between the stem scar and other indicators in the correlation analysis, indicating that its uniqueness renders it irreplaceable by other indicators. Furthermore, in the cluster analysis results of this study, the stem scar also emerged as a key basis for cultivar classification. Therefore, the stem scar should be regarded as an important indicator in future experiments.
Among textural properties, hardness demonstrated highly significant positive correlations with gumminess and chewiness (p < 0.01), consistent with the results of Cui et al. [29] in their correlation analysis of lychee pulp texture. Therefore, in practical breeding and production targeting specific textural properties of blueberries, comprehensive consideration of fruit shape index is essential.

4.2. Shelf-Life Dynamics of Color and Texture

Blueberry color and flesh texture directly reflect fruit tissue integrity and sensory quality [30], serving as critical shelf-life indicators. L* values (lightness) declined significantly from 33.06–48.47 at day 0 to 27.65–43.97 at day 15 (p < 0.01), indicating progressive darkening likely due to water loss or cuticular wax degradation. While a* (green–red axis) remained stable, |b*| (blue–yellow axis) decreased significantly between days 0–10 (p < 0.05) and 0–15 (p < 0.01), confirming reduced blue intensity. Thus, L* and b* are primary color change indicators during postharvest, with minimal a* influence.
Texture profile analysis (TPA), traditionally used for storage-related texture assessment [31], revealed U-shaped hardness trajectories: initial decline (0–5 d; nonsignificant), followed by increased (5–10 d; p < 0.05) and stabilization (10–15 d). The dynamic change in firmness, characterized by an initial decrease followed by an increase, is similar to the ‘segmented effect of moisture loss’ proposed by Paniagua [6]. However, since fruit weight loss during shelf life was not measured in this study, we cannot definitively conclude that our results are entirely consistent with those of previous research. In subsequent studies, on the basis of investigating the dynamic changes in fruit color, texture and the underlying mechanisms during shelf life, we will conduct more systematic and rigorous verification work to clarify the consistency and generalizability of the results. Despite significant overall differences between days 0 and 15 (p < 0.01), adhesiveness, cohesiveness, springiness, gumminess and chewiness showed no temporal variations. Northern highbush cultivars (22, 23 and 24) exhibited atypical hardness patterns—initial increase peaking at day 10, then slight decline—yet maintained higher final hardness than harvest values. This anomaly may stem from delayed greenhouse maturation under elevated temperatures, resulting in softer initial textures compared to early-ripening southern highbush cultivars. In the present study, we conducted a comprehensive evaluation of different blueberry cultivars and investigated the changes in fruit color and texture across these cultivars during a 15-day shelf-life period under 4 °C storage conditions. Building upon the key findings regarding early-stage changes identified herein, future work should aim to develop a comprehensive evaluation model for blueberry cultivars by further integrating appearance, texture and flavor traits.

4.3. Cluster-Specific ΔE and Hardness Variations

Cluster V cultivars (18, 21, 1 and 17), characterized by relatively small color variation (ΔE = 3.82 at 0–5 d; 3.26 at 0–10 d) and low L*, demonstrated exceptional color stability, making them ideal for long-distance distribution. Small stem scars are beneficial for fruit water retention, while a flattened morphology likely mitigating water loss through reduced surface-to-volume ratios [30]. Cluster V and Cluster I showed marginal hardness changes (11.46% and 8.21% over 15 d),contrasting with other Cluster This is consistent with the findings of Makus [32]. Specifically, highbush blueberry cultivars exhibit larger stem scars than rabbiteye cultivars and soften more rapidly after harvest. Small stem scars are considered a desirable trait, confirming that stem scar size exerts a significant influence on the postharvest stability of blueberry fruit.
Cluster II cultivars (14, 16, 23 and 24) displayed a 50.60% hardness surge. Although their average scar size (2.21 mm) was slightly smaller than Cluster III (2.24 mm), their fruit shape index and springiness (4.66 mm) were the highest. Correlation analysis showed that springiness was extremely significantly positively correlated with fruit shape index (r = 0.68), indicating that in addition to scar size and fruit shape index. Therefore, springiness is also an important factor affecting changes in fruit quality.
Cluster III exhibited biphasic hardness patterns, 8.48% decline (0–5 d) followed by 53.26% recovery (5 d–15 d), potentially linked to sequential cell wall remodeling [25]. Cluster IV, despite low baseline hardness and large stem scars (2.58 mm), recorded 28.37% hardness variation, driven by minimal springiness and compact morphology. These findings align with prior studies [33,34,35] emphasizing that small, dry stem scars enhance postharvest quality by reducing water loss and decay risks, whereas large and moist scars accelerate deterioration. However, the correlation between stem scar size and firmness exhibits cultivar-specificity; when comparing across different cultivars, there is no direct correlation between stem scar area and firmness, which requires comprehensive evaluation in combination with cuticular wax composition.
This finding suggests that a single trait indicator is insufficient to fully reflect the postharvest quality stability of blueberries, necessitating the establishment of a multi-dimensional evaluation system. From an industrial practice perspective, the market adaptability of cultivars has become a core consideration in breeding and promotion. Meanwhile, the trend of quality stratification for blueberries in the international market is becoming increasingly prominent, particularly in emerging markets in Asia and South America. For instance, Colombia and Ecuador have begun adopting grading systems based on fruit size, firmness, soluble solid content and flavor. This indicates that in addition to yield and stress resistance, traits such as fruit uniformity, postharvest shelf life, and flavor stability should also be incorporated into breeding objectives to enhance the international competitiveness of cultivars. Based on the above discussion, the systematic evaluation of the basic quality and postharvest storage performance of blueberries is growing increasingly important.

5. Conclusions

A comprehensive evaluation of 24 blueberry cultivars revealed that southern highbush cultivars ‘EB 9-2’, ‘Meadowlark’, ‘Primadonna’, ‘Eureka’ and ‘Camellia’ exhibited superior fruit size, texture and color, ranking highest in overall quality. Postharvest analysis identified significant hardness differences (p < 0.05) between day 0 and 15 in cultivars ‘Star’, ‘Camellia’, ‘Farthing’, ‘EB 9-2’, ‘Legacy’, ‘Unknown’ and ‘Gulfcoast’, while other cultivars showed no significant temporal variations. Color stability (ΔE < 3.5) was maintained only by ‘Legacy’ throughout the 15 days. Although minimal ΔE shifts occurred in most cultivars during days 0–5 or 0–10, pronounced color changes (ΔE > 3.5) emerged by day 15. Scar size, fruit shape index and springiness were validated as key predictors of shelf-life hardness dynamics, providing actionable metrics for cultivar selection and postharvest management.
The findings of this study can provide scientific references for the development of the entire blueberry industry chain. For future variety breeding, it is recommended to comprehensively consider fruit texture, color stability and flavor quality to cultivate varieties with synergistically excellent ‘fresh-eating palatability and postharvest storability’. The revealed characteristics of inter-varietal quality differences and shelf-life variability can serve as references for growers to select varieties and determine harvest timing, as well as for distributors to optimize the matching of sales cycles based on the storage and transportation characteristics of different varieties, thereby avoiding the risk of quality deterioration caused by immature harvesting.
However, this study only focused on the postharvest performance of highbush blueberries under constant low-temperature conditions and did not include rabbiteye blueberries and other blueberry types, resulting in certain limitations in the generalizability and explanatory depth for complex industrial scenarios. Future research can further expand the sample coverage by including multi-geographical origin blueberry varieties. Simultaneously, it should simulate complex environmental conditions, such as temperature fluctuations and different preservation measures in the supply chain, and construct an integrated comprehensive evaluation system of ‘variety evaluation—storage and transportation optimization—sales adaptation’, so as to provide more systematic scientific support for the high-quality and high-yield development of the blueberry industry.

Author Contributions

C.L., as the corresponding author, contributed to the conception of the study, wrote the manuscript and performed the data analyses; Y.X., as the first author, performed the experiments; X.W., as the second author, contributed to the analysis and manuscript preparation; Y.L., as the third author, helped perform the analysis with constructive discussions. All authors have read and agreed to the published version of the manuscript.

Funding

This study was supported by the China Agriculture Research System (CARS-29); Discipline Construction Program of Liaoning Academy of Agricultural Sciences of China (2024XKJS5229); and Shenyang Municipal Science and Technology Plan for Seed Industry Innovation Special Project of China (24-215-2-15).

Data Availability Statement

The data are contained within the article.

Conflicts of Interest

The authors declare no conflicts of interest.

References

  1. Li, Y.D.; Liu, C.; Wei, X.; Liu, J.; Hao, J.; Chen, L.; Sun, H. Development report of 2024 China blueberry industry. J. Jilin Agric. Univ. 2025, 47, 1–14. (In Chinese) [Google Scholar] [CrossRef]
  2. Jiang, H.; Hong, W.; Zhang, Y.; Liu, S.; Jiang, H.; Xia, S.; Si, X.; Li, B. Effects of static magnetic field-prolonged supercooling preservation on blueberry quality. Food Biosci. 2024, 59, 103771. [Google Scholar] [CrossRef]
  3. Liu, Y.; Cai, Q.; Wang, Y. Mechanism of quality deterioration and controlling technology of blueberry fruit. Food Sci. Technol. 2013, 38, 76–79. (In Chinese) [Google Scholar] [CrossRef]
  4. Angeletti, P.; Castagnasso, H.; Miceli, E.; Terminiello, L.; Concellón, A.; Chaves, A.; Vicente, A.R. Effect of Preharvest Calcium Applications on Postharvest Quality, Softening and Cell Wall Degradation of Two Blueberry (Vaccinium corymbosum) Varieties. Postharvest Biol. Technol. 2010, 58, 98–103. [Google Scholar] [CrossRef]
  5. Srivastava, A.; Akoh, C.C.; Yi, W.; Fischer, J.; Krewer, G. Effect of Storage Conditions on the Biological Activity of Phenolic Compounds of Blueberry Extract Packed in Glass Bottles. J. Agric. Food Chem. 2007, 55, 2705–2713. [Google Scholar] [CrossRef]
  6. Paniagua, A.C.; East, A.R.; Hindmarsh, J.P.; Heyes, J.A. Moisture Loss Is the Major Cause of Firmness Change during Postharvest Storage of Blueberry. Postharvest Biol. Technol. 2013, 79, 13–19. [Google Scholar] [CrossRef]
  7. Dragišić, M.; Milivojević, J.; Djekić, I.; Radivojević, D.; Veberič, R.; Mikulič Petkovšek, M. Changes in quality characteristics of fresh blueberries: Combined effect of cultivar and storage conditions. J. Food Compos. Anal. 2022, 111, 104597. [Google Scholar] [CrossRef]
  8. Harb, J.Y.; Streif, J. Controlled Atmosphere Storage of Highbush Blueberries Cv. ‘Duke’. Eur. J. Hortic. Sci. 2004, 69, 66–72. [Google Scholar] [CrossRef]
  9. Rivera, S.; Kerckhoffs, H.; Sofkova-Bobcheva, S.; Hutchins, D.; East, A. Influence of Harvest Maturity and Storage Technology on Mechanical Properties of Blueberries. Postharvest Biol. Technol. 2022, 191, 111961. [Google Scholar] [CrossRef]
  10. Li, M.; Rivera, S.; Franklin, D.; Nowak, E.; Hallett, I.; Kolenderska, S.; Urbańska, M.; Vanholsbeeck, F.; East, A. Use of Optical Coherence Tomography and Light Microscopy for Characterisation of Mechanical Properties and Cellular Level Responses of ‘Centurion’ Blueberries during Weight Loss. J. Food Eng. 2021, 303, 110596. [Google Scholar] [CrossRef]
  11. Jimenes, I.M.; Silva, S.R.D.; Tezotto-Uliana, J.V.; Cantuarias-Avilés, T. Fruit Quality Attributes of Low Chilling Requirement ‘Snowchaser’ Blueberry Cultivated in Brazil. Rev. Bras. Frutic. 2018, 40, e-473. [Google Scholar] [CrossRef]
  12. Cesa, S.; Carradori, S.; Bellagamba, G.; Locatelli, M.; Casadei, M.A.; Masci, A.; Paolicelli, P. Evaluation of Processing Effects on Anthocyanin Content and Colour Modifications of Blueberry (Vaccinium spp.) Extracts: Comparison between HPLC-DAD and CIELAB Analyses. Food Chem. 2017, 232, 114–123. [Google Scholar] [CrossRef] [PubMed]
  13. Song, H.; Zhang, B. Descriptors and Data Standard for Blueberry (Vaccinium L.); China Agricultural Science and Technology Press: Beijing, China, 2013; ISBN 978-7-511-61203-8. (In Chinese) [Google Scholar]
  14. Li, Y. Theory and Practice of Blueberry Production in China; China Agriculture Press: Beijing, China, 2023; ISBN 9787109305120. (In Chinese) [Google Scholar]
  15. Gu, Y.; He, S. Blueberries and Cranberries; China Agriculture Press: Beijing, China, 2001; ISBN 9787109067523. (In Chinese) [Google Scholar]
  16. Blattner, P. 51-1: Invited Paper: The International Commission on Illumination (CIE) and aspects of measurement uncertainty in photometry. SID Symp. Dig. Tech. Pap. 2021, 52, 698–701. [Google Scholar] [CrossRef]
  17. Liu, B.; Wang, K.; Wang, X.; Liang, J.; Bai, R.; Xie, X.; Sun, L. Evaluation of Fruit Texture Quality of Blueberry Based on Principal Component Analysis. J. Nucl. Agric. Sci. 2019, 33, 927–935. (In Chinese) [Google Scholar] [CrossRef]
  18. Mokrzycki, W.S.; Tatol, M. Colour difference ΔE: A survey. Mach. Graph. Vis. 2011, 20, 383–412. [Google Scholar]
  19. Tarancón, P.; Tárrega, A.; González, M.; Cristina, B. External quality of mandarins: Influence of fruit appearance characteristics on consumer choice. Foods 2021, 10, 2188. [Google Scholar] [CrossRef]
  20. Zhao, D.; Zhang, Y.; Hu, Y.; Wu, X.; Liu, W.; Zhang, K.; Li, F. Analysis of the phenotypic traits of 20 crabapple varieties (Malus spp.). J. Fruit Sci. 2025, 42, 555–567. (In Chinese) [Google Scholar] [CrossRef]
  21. Zhou, C.; Wu, H.; Sheng, Q.; Cao, F.; Zhu, Z. Study on the phenotypic diversity of 33 ornamental Xanthoceras sorbifolium cultivars. Plants 2023, 12, 2448. [Google Scholar] [CrossRef]
  22. Xu, X.; Li, B.; Qin, G.; Chen, T.; Zhang, Z.; Tian, S. Molecular Basis and Regulation Strategies for Quality Maintenance of Postharvest Fruit. Acta Hortic. Sin. 2020, 47, 1595–1609. (In Chinese) [Google Scholar] [CrossRef]
  23. Jiang, J.; Fan, X.; Zhang, Y.; Sun, L.; Li, M.; Liu, Y.; Niu, S.; Zhang, Z.; Liu, C. Analysis and comprehensive evaluation of grape berry texture based on TPA method. China Fruits 2022, 03, 31–36. (In Chinese) [Google Scholar] [CrossRef]
  24. Zhao, D.; Jia, M.; Tang, G.; Liang, Y.; Wang, X.; Shu, X.; Liang, J.; Qi, Y.; Sun, L.; Qu, L. Establishment of the Detecting Method on the Fruit Texture of Pomegranate by Puncture Test. Chin. J. Trop. Crops 2016, 37, 1419–1423. (In Chinese) [Google Scholar] [CrossRef]
  25. Zhang, R.; Feng, G.; Fu, S.; Wang, H.; Gao, S.; Zhu, Y.; Liu, Z. Convolutional Neural Network-Gated Recurrent Unit-Attention Based Model for blueberry Shelf Life Prediction. Food Sci. 2024, 45, 229–238. (In Chinese) [Google Scholar] [CrossRef]
  26. Ma, C.; Cao, S.; Long, X.; Ji, N.; Yang, X.; Zhou, Y.; Ma, L.; Wang, R. Effect of different treatments on the simulated transportation and shelf quality of blueberry based on texture profile analysis. Sci. Technol. Food Ind. 2017, 38, 286–290+314. (In Chinese) [Google Scholar] [CrossRef]
  27. Ding, Y.; Hou, D.; Zhang, D.; Tao, H.; Yue, H.; Li, Y.; Xie, J.; Wang, S. Texture analysis and evaluation of 51 cucumber germplasm resource. J. Gansu Agric. Univ. 2025, 60, 128–137. (In Chinese) [Google Scholar] [CrossRef]
  28. Zhao, H.; Zhao, F.; Liu, X.; Wu, W.; Wu, Y.; Li, W. A comprehensive evaluation of fruit characteristics of 46 blueberry cultivars. J. Nanjing For. Univ. Nat. Sci. Ed. 2025, 49, 52–62. (In Chinese) [Google Scholar] [CrossRef]
  29. Cui, Y.; Chen, J.; Shi, F.; Jiang, Y.; Yan, Q.; Ou, L.; Liu, H.; Cai, C. Analysis of texture quality of the fruits in litchi based on the texture profile analysis (TPA). J. Fruit Sci. 2022, 39, 2241–2252. (In Chinese) [Google Scholar] [CrossRef]
  30. Liu, Y.; Liu, W.; Wang, X.; Yang, Y.; Wei, X.; Sun, B.; Zhang, D.; Yang, Y.; Liu, C.; Li, T. Screening and inheritance of fruit storage-related traits based on reciprocal cross of southern × northern highbush blueberry (Vaccinium Linn). Chin. Agric. Sci. 2020, 53, 4045–4056. (In Chinese) [Google Scholar] [CrossRef]
  31. Zhang, W.; Jamal, M.; Wang, M.; Han, S.; Xie, H.; Pan, M. Analysis of flesh texture, cell architecture and its physiological characteristics of different grape cultivars. Acta Bot. Boreali-Occident. Sin. 2022, 42, 1870–1879. (In Chinese) [Google Scholar] [CrossRef]
  32. Makus, D.J.; Morris, J.R. A comparison of fruit of highbush and rabbiteye blueberry cultivars. J. Food Qual. 1993, 16, 417–428. [Google Scholar] [CrossRef]
  33. Yan, Y.; Gagalova, K.; Gerbrandt, E.; Castellarin, S. Cuticular wax biosynthesis in blueberries (Vaccinium corymbosum L.): Transcript and metabolite changes during ripening and storage affect key fruit quality traits. Hortic. Res. 2024, 11, uhae004. [Google Scholar] [CrossRef]
  34. Lei, L.; Xu, G.H.; Wang, L.; Du, Q.; Li, Y.; Wang, H. Analysis of inherited tendency of the main fruit economic characteristics in reciprocal crossing between ‘Senmao No.1’ and ‘Jewel’ of blueberry. J. Fruit Sci. 2022, 39, 1573–1586. (In Chinese) [Google Scholar] [CrossRef]
  35. Yan, Y.; Castellarin, S.D. Blueberry Water Loss Is Related to Both Cuticular Wax Composition and Stem Scar Size. Postharvest Biol. Technol. 2022, 188, 111907. [Google Scholar] [CrossRef]
Figure 1. Changes in CIE-Lab values during the postharvest period of blueberry. Note: * indicates p < 0.05; ** indicates p < 0.01; ns indicates no significant difference.
Horticulturae 11 01250 g001
Figure 2. Changes in flesh texture during the postharvest storage of blueberries. Note: * indicates <0.05; ** indicates <0.01; ns indicates no significant difference.
Horticulturae 11 01250 g002
Figure 3. Correlation analysis of fruit quality indicators. Note: * indicates p < 0.05; ** indicates p < 0.01. Abbreviations for each indicator are as follows: fruit transverse diameter: FTD; fruit longitudinal diameter: FLD; fruit shape index: FSI; single fruit weight: SFW; scar size: SS; soluble solids content: SSC; titratable acidity: TA; hardness: H; adhesive force: Adh; cohesiveness: Coh; springiness: Spr; gumminess: Gum; chewiness: Chew; L: L*; a: a*; b: b*.
Horticulturae 11 01250 g003
Figure 4. Clustering diagram of blueberry fruit quality indicators.
Horticulturae 11 01250 g004
Table 1. Cultivars’ name and corresponding code.
CultivarsCodeTypesCultivarsCodeTypes
Eureka1Southern highbushJewel13Southern highbush
Star2EB 9-214
Emerald3Meadowlark15
Camellia4Primadonna16
Farthing5Eureka Sunrise17
Springhigh6C99-42 (Kirra)18
Eureka Sunset7Misty19
Windsor8Rocio20
Scintilla9Legacy21
Suziblue10Unknown22Northern highbush
Ventura11Gulfcoast23
Magnifica12Liaolan 51324Southern × Northern highbush hybird
Table 2. Comparative analysis of fruit traits in blueberry cultivars.
CodeFruit Transverse
Diameter (mm)
Fruit Longitudinal Diameter (mm)Fruit Shape Index (%)Single Fruit Weight (g)Scar Size (mm)Soluble Solid Content (%)Titratable Acidity (mg/g)
122.19 ± 1.09 a17.09 ± 0.77 a0.77 ± 0.03 defgh4.21 ± 0.37 a1.45 ± 0.18 hi10.62 ± 0.18 fghi5.83 ± 0.14 gh
217.24 ± 0.36 hij13.79 ± 0.42 efg0.80 ± 0.01 bcdefgh2.44 ± 0.18 efgh2.41 ± 0.26 cde10.63 ± 0.37 fghi5.46 ± 0.27 h
317.89 ± 0.44 efghi14.31 ± 0.35 def0.80 ± 0.00 bcdefgh2.84 ± 0.22 defg2.07 ± 0.02 defg10.57 ± 0.35 ghi6.39 ± 0.22 efg
421.42 ± 0.84 ab15.75 ± 0.29 abcd0.74 ± 0.02 ghi4.13 ± 0.18 a2.36 ± 0.39 cde11.87 ± 0.35 efgh8.70 ± 0.27 c
518.25 ± 0.37 defghi13.65 ± 0.58 efg0.75 ± 0.02 fghi2.57 ± 0.16 efgh1.68 ± 0.08 ghi13.53 ± 1.19 cde7.45 ± 0.26 d
619.58 ± 0.36 bcdefg16.38 ± 0.41 ab0.84 ± 0.01 bcdef3.67 ± 0.14 abc1.91 ± 0.03 efgh10.63 ± 0.41 fghi5.21 ± 0.10 hi
719.84 ± 0.52 bcdef15.02 ± 0.46 bcde0.76 ± 0.01 efghi3.29 ± 0.19 bcd2.39 ± 0.23 cde12.5 ± 1.06 cdefg4.64 ± 0.21 ij
817.47 ± 0.48 ghij13.72 ± 0.24 efg0.79 ± 0.01 cdefgh2.52 ± 0.19 efgh3.25 ± 0.15 ab11.70 ± 0.47 fgh7.04 ± 0.21 de
920.21 ± 0.57 abc14.61 ± 0.68 cdef0.72 ± 0.01 hi3.30 ± 0.33 bcd2.09 ± 0.02 defg13.03 ± 0.23 cde5.72 ± 0.17 gh
1018.89 ± 0.89 cdefgh14.73 ± 0.29 cde0.78 ± 0.04 cdefgh3.10 ± 0.28 cde2.50 ± 0.09 cd12.80 ± 1.27 cdefg4.27 ± 0.25 jk
1118.52 ± 0.92 defgh16.21 ± 1.04 abc0.88 ± 0.04 b3.11 ± 0.32 cde3.32 ± 0.19 a9.27 ± 0.27 i10.05 ± 0.47 a
1218.26 ± 0.28 defghi13.62 ± 0.24 efg0.75 ± 0.02 ghi2.62 ± 0.07 defgh2.82 ± 0.14 bc14.33 ± 0.86 bcd4.04 ± 0.42 jk
1316.15 ± 0.14 ijk13.81 ± 0.64 efg0.86 ± 0.05 bcd2.19 ± 0.13 gh2.57 ± 0.16 cd10.37 ± 1.04 hi9.37 ± 0.17 b
1417.70 ± 0.66 fghi15.26 ± 0.54 bcde0.86 ± 0.01 bc2.91 ± 0.37 def2.14 ± 0.03 defg12.00 ± 0.32 defgh3.59 ± 0.16 kl
1519.96 ± 0.12 bcde16.22 ± 0.17 abc0.81 ± 0.01 bcdefg3.70 ± 0.14 abc2.11 ± 0.20 defg11.20 ± 0.40 efghi3.23 ± 0.03 l
1615.49 ± 0.28 jk15.85 ± 0.52 abcd1.02 ± 0.03 a2.11 ± 0.07 h2.08 ± 0.14 defg12.4 ± 1.25 cdefgh4.18 ± 0.04 jk
1717.77 ± 0.81 fghi14.31 ± 0.28 def0.81 ± 0.02 bcdefgh2.48 ± 0.26 efgh1.56 ± 0.22 hi11.23 ± 0.74 efghi4.55 ± 0.16 ij
1818.28 ± 0.89 defghi12.52 ± 0.75 ghi0.69 ± 0.02 i2.27 ± 0.19 fgh2.09 ± 0.08 defg12.33 ± 0.52 defgh6.26 ± 0.06 fg
1914.73 ± 1.07 kl11.34 ± 0.58 ig0.77 ± 0.04 cdefgh2.20 ± 0.06 fgh1.75 ± 0.19 fghi17.63 ± 0.15 a7.52 ± 0.22 d
2017.34 ± 1.01 hij14.56 ± 0.27 def0.84 ± 0.04 bcde2.66 ± 0.34 defgh2.27 ± 0.07 cde14.3 ± 0.57 bcd8.50 ± 0.23 c
2120.85 ± 0.14 abc15.10 ± 0.09 bcde0.72 ± 0.01 ghi3.93 ± 0.04 ab1.77 ± 0.03 fghi14.73 ± 0.47 bc4.42 ± 0.16 j
2213.39 ± 0.98 l10.78 ± 0.13 j0.81 ± 0.05 bcdefgh2.01 ± 0.11 h1.36 ± 0.06 i13 ± 0.81 cdef4.50 ± 0.24 j
2315.49 ± 0.18 jk11.68 ± 0.36 hij0.76 ± 0.03 efghi2.36 ± 0.14 fgh2.37 ± 0.12 cde16.23 ± 0.33 ab6.69 ± 0.16 ef
2415.49 ± 0.13 jk13.03 ± 0.25 fgh0.84 ± 0.02 bcde2.16 ± 0.05 gh2.24 ± 0.05 def13.5 ± 1.01 cde5.39 ± 0.16 h
Note: Different letters indicate significant differences in the same column; p < 0.05.
Table 3. Comparative analysis of fruit texture of blueberry cultivars.
CodeHardness (N)Adhesive Force (g)CohesivenessSpringiness (mm)Gumminess (N)Chewiness (mJ)
118.19 ± 0.61 cde5.63 ± 1.58 bcd0.19 ± 0.01 ab3.86 ± 0.06 b3.48 ± 0.39 a13.17 ± 1.51 a
211.99 ± 0.37 efgh4.27 ± 0.15 bcde0.12 ± 0.01 cdefg3.41 ± 0.12 b1.39 ± 0.11 ef4.71 ± 0.59 efgh
316.77 ± 2.40 cdef4.13 ± 0.19 bcde0.08 ± 0.01 fgh2.65 ± 0.02 b1.36 ± 0.07 ef3.53 ± 0.19 fgh
420.03 ± 2.10 bc5.40 ± 0.58 bcde0.19 ± 0.01 ab2.91 ± 0.06 b3.83 ± 0.51 a11.52 ± 1.33 abc
517.78 ± 0.39 cde1.87 ± 0.48 e0.09 ± 0.01 fgh3.14 ± 0.25 b1.65 ± 0.24 def5.12 ± 0.95 defgh
613.94 ± 1.60 cdefg6.90 ± 1.22 ab0.12 ± 0.01 cdefg3.70 ± 0.19 b1.67 ± 0.04 def6.06 ± 0.29 defgh
715.51 ± 1.66 cdefg4.93 ± 0.23 bcde0.14 ± 0.02 bcd2.86 ± 0.26 b2.23 ± 0.50 cde6.00 ± 0.70 defgh
816.53 ± 2.36 cdef6.73 ± 2.11 abc0.11 ± 0.02 defg3.29 ± 0.18 b1.74 ± 0.12 def5.58 ± 0.19 defgh
910.13 ± 1.84 gh9.73 ± 1.39 a0.10 ± 0.01 defg2.63 ± 0.17 b1.04 ± 0.18 f2.71 ± 0.57 fgh
1014.95 ± 0.94 cdefg3.03 ± 0.42 de0.14 ± 0.01 bcd3.51 ± 0.31 b2.17 ± 0.19 cde7.49 ± 0.77 bcdefg
1110.96 ± 0.61 fgh3.43 ± 0.23 bcde0.11 ± 0.00 defg2.89 ± 0.22 b1.23 ± 0.12 ef3.56 ± 0.65 fgh
1216.83 ± 2.27 cdef5.50 ± 0.56 bcd0.10 ± 0.00 efg2.86 ± 0.22 b1.57 ± 0.16 def4.46 ± 0.78 efgh
1311.28 ± 1.24 fgh3.07 ± 0.13 de0.11 ± 0.00 defg3.33 ± 0.12 b1.23 ± 0.15 ef3.99 ± 0.50 fgh
1413.67 ± 0.68 defg4.93 ± 0.58 bcde0.21 ± 0.02 a3.76 ± 0.14 b2.86 ± 0.22 abc9.95 ± 1.75 abcd
1519.96 ± 2.06 bc3.17 ± 0.20 cde0.19 ± 0.01 ab3.56 ± 0.08 b3.77 ± 0.54 a13.19 ± 2.11 a
167.19 ± 0.71 h4.37 ± 0.07 bcde0.10 ± 0.01 efg7.67 ± 4.57 a0.71 ± 0.13 f6.45 ± 4.62 defgh
1718.99 ± 1.39 bcd5.07 ± 1.03 bcde0.13 ± 0.01 cdef3.14 ± 0.13 b2.47 ± 0.28 bcd7.67 ± 1.15 bcdef
1827.65 ± 4.20 a5.27 ± 1.22 bcde0.13 ± 0.03 cdef3.67 ± 0.26 b3.38 ± 0.33 ab12.26 ± 1.77 ab
1915.77 ± 2.46 cdefg9.13 ± 3.29 a0.05 ± 0.01 h2.02 ± 0.21 b0.74 ± 0.12 f1.50 ± 0.37 h
2013.56 ± 2.83 defg4.77 ± 0.18 bcde0.11 ± 0.02 defg3.26 ± 0.11 b1.46 ± 0.38 ef4.72 ± 1.31 efgh
2124.18 ± 1.16 ab5.17 ± 0.22 bcde0.12 ± 0.00 cdefg3.07 ± 0.10 b3.02 ± 0.18 abc9.07 ± 0.56 abcde
2214.87 ± 2.09 cdefg3.07 ± 0.07 de0.08 ± 0.01 gh2.27 ± 0.24 b1.11 ± 0.06 f2.50 ± 0.39 gh
2313.33 ± 1.80 defg3.17 ± 0.77 cde0.16 ± 0.01 bc3.48 ± 0.28 b2.20 ± 0.38 cde7.30 ± 0.89 cdefg
2415.53 ± 0.71 cdefg2.93 ± 0.07 de0.21 ± 0.04 a3.71 ± 0.17 b3.29 ± 0.68 ab12.16 ± 2.92 ab
Note: Different letters indicate significant differences in the same column; p < 0.05.
Table 4. Analysis of fruit color among blueberry cultivars.
CodeL*a*b*
136.03 ± 1.11 ghi−0.56 ± 0.14 cdefgh−6.16 ± 0.75 abc
237.67 ± 1.75 efghi0.14 ± 0.17 b−7.56 ± 0.64 cdefgh
345.63 ± 1.63 abc−0.52 ± 0.03 bcdefgh−7.52 ± 0.34 cdefgh
443.76 ± 0.73 bcde−1.03 ± 0.28 hi−8.73 ± 0.63 fgh
541.61 ± 2.02 cdef−0.05 ± 0.03 bcde−7.73 ± 0.53 cdefgh
639.20 ± 0.94 efghi−0.42 ± 0.12 bcdefgh−7.01 ± 0.36 bcdef
739.00 ± 2.57 efghi−0.56 ± 0.19 cdefgh−6.23 ± 0.84 abcd
836.32 ± 1.01 fghi−0.07 ± 0.10 bcde−6.69 ± 0.53 bcde
948.17 ± 2.14 ab−0.78 ± 0.33 fgh−7.60 ± 0.30 cdefgh
1036.65 ± 1.49 fghi−0.30 ± 0.28 bcdefg−5.57 ± 0.49 ab
1143.89 ± 0.08 bcde−0.91 ± 0.07 gh−9.16 ± 0.43 h
1248.47 ± 0.87 a−0.71 ± 0.03 efgh−8.52 ± 0.42 efgh
1334.85 ± 2.29 hi0.75 ± 0.30 a−6.85 ± 0.71 bcdef
1445.02 ± 0.89 abcd−1.53 ± 0.08 i−8.94 ± 0.27 gh
1540.23 ± 1.19 efgh−0.76 ± 0.34 fgh−8.34 ± 0.59 efgh
1640.10 ± 1.55 efgh−0.68 ± 0.33 defgh−6.66 ± 0.80 bcde
1733.06 ± 1.75 i−0.11 ± 0.11 bcdef−4.59 ± 0.70 a
1838.66 ± 0.68 efghi−0.56 ± 0.18 cdefgh−7.70 ± 0.51 cdefgh
1940.97 ± 0.85 defg−0.53 ± 0.04 bcdefgh−7.96 ± 0.34 cdefgh
2039.78 ± 1.29 efgh−0.41 ± 0.07 bcdefgh−7.83 ± 0.68 cdefgh
2142.21 ± 0.76 cdef−1.02 ± 0.08 hi−7.05 ± 0.33 bcdefg
2235.72 ± 1.33 ghi0.09 ± 0.18 bc−7.17 ± 0.39 bcdefg
2342.12 ± 0.98 cdef−0.01 ± 0.34 bcd−8.06 ± 0.37 defgh
2440.47 ± 1.07 defgh−0.32 ± 0.20 bcdefg−7.05 ± 0.68 bcdefg
Note: Different letters indicate significant differences in the same column; p < 0.05.
Table 5. Changes in total color difference during postharvest storage of blueberry cultivars.
CodeΔECodeΔE
(0–5 d)(0–10 d)(0–15 d)(5–10 d)(0–5 d)(0–10 d)(0–15 d)(5–10 d)
12.984.016.581.88 133.494.163.582.09
22.754.114.712.27 142.098.1913.167.07
34.365.527.333.39 151.95 6.008.675.36
44.394.996.512.89 165.365.543.582.09
55.734.067.164.10 175.415.025.072.72
63.043.414.935.11 184.172.393.975.41
72.382.995.934.88 192.982.406.091.37
82.252.063.532.01 203.985.154.693.71
91.761.596.051.05 212.721.612.961.20
101.393.644.492.64 225.065.968.323.20
116.885.416.771.76 234.925.875.655.16
122.862.985.312.97 242.903.733.791.86
Table 6. Changes in hardness during the postharvest storage.
Code0 d5 d10 d15 dChange in Hardness at the End of the Postharvest %
118.19 ± 0.61 a15.00 ± 0.24 a14.30 ± 2.98 a20.53 ± 1.88 a12.85
211.99 ± 0.37 a13.19 ± 1.95 ab14.29 ± 0.95 ab17.61 ± 0.64 b46.87
316.77 ± 2.40 a14.21 ± 0.66 a14.76 ± 0.75 a15.84 ± 0.41 a−5.54
420.03 ± 2.10 a18.93 ± 1.04 a21.12 ± 2.10 a33.03 ± 1.13 b64.89
517.78 ± 0.39 a14.19 ± 2.30 ab18.84 ± 1.06 ab21.14 ± 1.40 b18.87
613.94 ± 1.60 a12.64 ± 2.11 a13.65 ± 2.53 a11.80 ± 1.73 a−15.36
715.51 ± 1.66 a10.91 ± 0.48 a12.87 ± 0.75 a12.07 ± 1.65 a−22.17
816.53 ± 2.36 a11.15 ± 1.05 a13.33 ± 1.02 a16.82 ± 1.58 a1.78
910.13 ± 1.84 a10.40 ± 0.93 a15.97 ± 2.28 a13.30 ± 3.25 a31.24
1014.95 ± 0.94 a11.15 ± 2.25 a10.42 ± 0.51 a12.88 ± 1.40 a−13.86
1110.96 ± 0.61 a11.70 ± 1.77 a15.77 ± 2.11 a18.72 ± 2.20 a70.81
1216.83 ± 2.27 a13.22 ± 1.15 a21.88 ± 3.82 a19.69 ± 2.31 a16.97
1311.28 ± 1.24 a10.66 ± 0.70 a11.50 ± 1.07 a12.20 ± 0.31 a8.16
1413.67 ± 0.68 a17.19 ± 1.19 a23.82 ± 3.90 ab30.07 ± 2.35 b119.93
1519.96 ± 2.06 a17.67 ± 1.66 a29.45 ± 5.86 a23.33 ± 4.79 a16.93
167.19 ± 0.71 a6.82 ± 1.13 a8.70 ± 0.25 a9.00 ± 1.80 a25.14
1718.99 ± 1.39 a17.42 ± 3.88 a19.14 ± 2.04 a19.32 ± 3.03 a1.75
1827.65 ± 4.20 a21.20 ± 3.89 a21.33 ± 1.75 a26.07 ± 3.68 a−5.72
1915.77 ± 2.46 a15.62 ± 0.54 a18.15 ± 3.75 a16.04 ± 1.31 a1.71
2013.56 ± 2.83 a8.91 ± 0.44 a12.15 ± 2.54 a10.35 ± 1.19 a−23.64
2124.18 ± 1.16 a19.83 ± 1.48 a25.03 ± 1.46 ab33.12 ± 2.69 b36.97
2214.87 ± 2.09 a17.14 ± 0.62 a16.39 ± 2.71 a26.73 ± 0.87 b79.72
2313.33 ± 1.80 a19.98 ± 0.54 ab20.05 ± 1.56 b18.37 ± 1.26 b37.76
2415.53 ± 0.71 a17.83 ± 0.37 a19.31 ± 2.43 a18.57 ± 0.59 a19.56
Note: The change in hardness at the end of postharvest storage is the proportion of the difference between the hardness at 15 d and the hardness at 0 d; different letters indicate significant differences in the same row; p < 0.05.
Table 7. Principal component analysis of fruit traits of different blueberry cultivars.
Fruit Quality IndexPrincipal Component
PC1PC2PC3PC4PC5
L* (X1)−0.017−0.0090.0180.376−0.04
a* (X2)0.012−0.056−0.079−0.316−0.236
b* (X3)−0.0760.1460.006−0.380.137
Hardness (X4)0.154−0.042−0.248−0.0490.037
Cohesiveness (X5)0.287−0.0410.0680.05−0.045
Gumminess (X6)0.288−0.035−0.0820.002−0.013
Chewiness (X7)0.299−0.0470.0260.0040.038
Fruit transverse diameter (mm) (X8)−0.0530.307−0.107−0.053−0.027
Fruit longitudinal diameter (X9)−0.0540.3130.143−0.031−0.032
Single fruit weight (X10)−0.0540.287−0.075−0.0060.017
Scar size (X11)0.0390.0060.0260.094−0.376
Soluble solid content (X12)−0.012−0.236−0.0810.1960.291
Fruit shape index (X13)−0.002−0.0160.3620.0340.019
Titratable acidity (X14)−0.0280.032−0.132−0.031−0.427
Adhesive force (X15)−0.2990.19−0.0840.0640.275
Springiness (X16)0.07−0.0160.3380.020.158
Eigenvalue4.8442.7022.641.6361.519
Contribution rate20.15620.11216.45515.26511.394
Cumulative contribution rate20.15640.26756.72271.98683.38
Table 8. Principal component scores, composite scores and ranking of blueberry fruit quality.
\FAC1FAC2FAC3FAC4FAC5Comprehensive ScoreRanking
10.921.97−0.18−1.170.680.544
2−0.36−0.220.34−0.69−0.72−0.3019
3−0.710.24−0.200.13−0.50−0.2016
41.141.16−0.981.19−0.830.465
50.00−0.65−0.63−0.30−0.48−0.4020
6−0.781.460.47−0.500.460.237
7−0.150.75−0.33−0.510.230.0210
8−0.500.08−0.28−0.71−0.95−0.4221
9−1.971.17−0.580.970.79−0.0212
100.360.280.18−1.030.100.0211
11−0.570.790.731.48−2.690.109
12−0.52−0.43−0.441.440.18−0.0313
13−0.40−0.440.41−1.62−2.13−0.7122
141.06−0.051.141.720.800.891
151.760.590.270.740.240.792
16−0.56−0.273.660.091.290.723
170.110.24−0.14−2.080.89−0.2017
181.31−0.73−1.36−0.170.25−0.1214
19−1.97−1.33−1.170.811.25−0.7123
20−0.54−0.300.150.22−0.48−0.2015
210.410.74−1.130.301.360.296
22−0.56−1.83−0.24−0.880.54−0.7124
230.70−1.84−0.250.54−0.29−0.2618
241.80−1.400.570.030.000.228
Table 9. Means of variation in blueberry fruit color and firmness based on cluster analysis.
ΔEHardness (N)Change in Hardness at the End
of the Postharvest %
0–5 d0–10 d0–15 d5–10 d0 d5 d10 d15 d
Clusters I3.313.795.343.1414.6212.5614.1615.76 8.21
Clusters II3.825.836.544.0512.4315.4517.9819.00 50.60
Clusters III3.175.507.594.1320.0018.3025.2928.18 40.91
Clusters IV3.973.876.372.2913.6712.3817.0916.89 28.37
Clusters V3.82 3.26 4.65 2.80 22.25 18.36 19.95 24.76 11.46
Note: The change in hardness at the end of postharvest storage is directly calculated based on Table 6 and the results of cluster analysis.
Disclaimer/Publisher’s Note: The statements, opinions and data contained in all publications are solely those of the individual author(s) and contributor(s) and not of MDPI and/or the editor(s). MDPI and/or the editor(s) disclaim responsibility for any injury to people or property resulting from any ideas, methods, instructions or products referred to in the content.