Article

Identification of Reliable Reference Genes for qRT-PCR Normalization in Tomato Genotypes with Contrasting Salinity Tolerance

by
Helen I. Rostovtseva
1,
Liliya R. Bogoutdinova
2,
Galina N. Raldugina
1 and
Ekaterina N. Baranova
2,*
1
K. A. Timiryazev Institute of Plant Physiology, Russian Academy of Sciences, Botanicheskaya Str. 35, 127276 Moscow, Russia
2
Plant Cell Biology Laboratory, All-Russia Research Institute of Agricultural Biotechnology, Timiryazevskaya 42, 127550 Moscow, Russia
*
Author to whom correspondence should be addressed.
Horticulturae 2025, 11(10), 1249; https://doi.org/10.3390/horticulturae11101249
Submission received: 30 August 2025 / Revised: 27 September 2025 / Accepted: 11 October 2025 / Published: 16 October 2025
(This article belongs to the Special Issue Stress Physiology and Molecular Biology of Vegetable Crops)

Abstract

Salt-tolerance improvement of tomatoes is largely a task of modern selection and plant molecular genetics because of cultivation on dry and irrigated lands under salt stress. To reveal the salt resistance gene, we need quantitative real-time polymerase chain reaction (qRT-PCR) normalization through reference genes analysis. Sometimes, housekeeping gene expression changes in response to various stress factors, especially salinity. In this manuscript, we evaluated expression changes of elongation factor 1α X53043.1 (EF1α), actin BT013707.1 (ACT), ubiquitin NM_001346406.1 (UBI), nuclear transcript factor XM_026030313.2 (NFT-Y), β-tubulin NM_001247878.2 (TUB), glyceraldehyde-3 phosphate dehydrogenase NM_001247874.2 (GAPDH), phosphatase 2A catalytic subunit NM_001247587.2 (PP2a), and phosphoglycerate kinase XM_004243920.4 (PGK) in salt-sensitive Solanum lycopersicum L. YaLF line and salt tolerance Rekordsmen cv. under 100 mM NaCl. We also suggested potential correlations between relative water content (RWC), ion accumulation, and reference gene expression in tomato genotypes with contrasting salinity tolerance. We used geNorm, NormFinder, BestKeeper, ∆Ct, and RefFinder algorithms to establish a set of the most reliable tomato candidate genes. The most stable genes for YaLF tomatoes were ACT, UBI, TUB, and PP2a. Despite differences in ranks, the NFT-Y was present in Rekordsmen’s stable set.

1. Introduction

The global climate change increases the risk of soil flooding and salinization through the thawing of permafrost [1,2]. The last FAO (Food and Agriculture Organization) report estimates the salt-affected soils area at 10.7% of the total land in the near future and may increase between 24 and 32% according to the last models of global aridity predictions [3,4,5,6,7,8,9]. Today, salt stress adaptation contributes to solving the food security problem in response to the ever-growing global population [1].
Tomato (Solanum lycopersicum L.), as a worldwide agro-economically significant vegetable crop, is largely affected by salt stress because of cultivation on dry and irrigated lands [6,7]. The global market of tomatoes is predicted to reach USD 205.48 billion by 2029 (1 January 2025, http://www.thebusinessresearchcompany.com). Therefore, salinity is a constraint not only for S. lycopersicon planting in new areas but also for productivity saving [4].
Salt stress disrupts osmosis and metabolism in tomatoes. The changes are often dependent on the developmental stage, type of salinity, and concentration of toxic ions. Even moderately salt-sensitive tomatoes are damaged by 25 mM NaCl [10,11]. Additionally, increased NaCl levels could significantly affect the plant’s morphology and seed germination traits [11]. The Na+/K+ ratio increases contributed to numerous K+-dependent enzyme suppression [12,13,14] and water and ion imbalance [12,13,14,15,16,17,18,19]. Consequently, halophytic tomato adaptation peculiarities may be used in conventional selection, breeding, analysis of mutant tomato lines [20], and genetic engineering [14,15].
In recent studies, 88 tomato lines selected on a floating raft system with 0 or 100 mM NaCl have shown a significant decrease in the leaf area, root length, final plant height, and growth rate [16]. Previously, a similar task was carried out by our laboratory [18]. We revealed the differences in salt tolerance between the YaLF line and Rekordsmen cv. in vitro based on main morphological, physiological, biochemical, and cytological characteristics for future tomato salt tolerance improvement research.
The seeds of tomato (S. lycopersicum L.) line YaLF, the male parental line for the commercial F1 Yunior hybrid, and cv. Rekordsmen were obtained from N.N. Timofeev selection station, Russian State Agrarian University-Moscow Timiryazev Agricultural Academy (Moscow, Russia), as well as All-Russia Research Institute of Irrigated Vegetable, Melon and Ground Growing (Astrakhan oblast, Kamyziyak, Russia), respectively. F1 Yunior hybrid and cv. Rekordsmen are recommended for farmer cultivation in the greenhouse and open-field system [17]. We used these tomato genotypes (Solanum lycopersicum L.) from various ecological and geographical origins (Central and Lower Volga regions of the Russian Federation) at the seedling stage, like colleagues [15].
Basically, to avoid salt stress, tomatoes change the transcript level of genes involved in various metabolic, physiological, and biochemical processes [18,19]. That is why qRT-PCR analysis always helps researchers in salt resistance selection programs and also requires internal controls. Although housekeeping genes should be steadily expressed under salt stress [19,20,21,22], sometimes they may be unsuitable for breeding studies with various genotypes or plant species [18]. HKGs (housekeeping genes) are also useful for the transgenic plants analysis, such as transgene copy number determination of mutant expression profiles [23] or salt stress resistance research [5,6,7,8].
The introduction of stable reference genes as internal controls is crucial for normalization of qRT-PCR in response to salt stress of tomato genotypes [16]. Salinity can affect HKG stability differently through osmotic and nutritional disorders. In this study, we also hypothesize RWC’s influence on HKG expression level [11].
In the present study, several mathematical algorithms, such as ∆Ct [22], BestKeeper [24], geNorm [25], NormFinder [26], and RefFinder WEB-based software [27], were used to assess the reference candidate gene expression stability and included elongation factor 1α X53043.1 (EF1α), actin BT013707.1 (ACT), ubiquitin NM_001346406.1 (UBI), nuclear transcript factor XM_026030313.2 (NFT-Y), β-tubulin NM_001247878.2 (TUB), glyceraldehyde- 3 phosphate dehydrogenase NM_001247874.2 (GAPDH), phosphatase 2A catalytic subunit NM_001247587.2 (PP2a), and phosphoglycerate kinase XM_004243920.4 (PGK). We also tried to compare HKGs of specifically S. lycopersicum genotypes with contrasting salt tolerance [17]. We also suggested HKGs’ lower variations of Rekordsmen compared to YaLF plants and RWC changes [17].

2. Materials and Methods

2.1. Plant Material

The seeds of S. lycopersicum L. YaLF line and Rekordsmen cv., accordingly, were obtained from N.N. Timofeev breeding station (Russian State Agrarian University-Moscow Timiryazev Agricultural Academy, Moscow, Russia) and All-Russia Research Institute of Irrigated Vegetable, Melon and Ground Growing, Astrakhan oblast, Kamyziyak, Russia. These two genotypes were used because of various salinity cultivation areas and confirmed salt tolerance differences in our previous works [18]. The tomato seeds were sterilized by 96% ethanol for 30 s and 20% water solution (v/v) of a commercial bleach ace (5% NaOCl, Procter and Gamble, Saint Petersburg, Russia) with supplementation of 5 µL Tween-20 for 6–8 min. Then, the seeds were washed in distilled water for 1 min four times and germinated in culture vessels with agar-solidified (0.7% (w/v)) MS (Murashige and Skoog) basal medium [28]. The pH was adjusted to 5.7–5.8 for 20 min before autoclaving at 121 °C. Plants were grown in a growth room delivering long-day photoperiod (16 h light/8 h dark) by lamps WLR-351H (Sanyo, Japan) with an average photosynthetic photon flux PPF (65 µmol m−2 s−1) under 25/23 (day/night) ± 1 °C and RH humidity 70%.
The plants were grown on the nutrient medium until the formation of the first true leaf. The root and a part of the hypocotyl about 2 cm in size were cut from tomato seedlings, and then this part was transferred into culture vessels containing root induction medium (MS medium with half strength of macro and micro salts, vitamins, 2% (w/v) sucrose, 0.7% (w/v) agar, 0.2 mg/L indole-3-butyric acid (IBA) (Sigma, Saint-Louis, MO, USA), and 100 mM NaCl [28]. NaCl was added to the growth medium at a concentration of 100 mM at one time. Root induction medium without NaCl was used as a control.
On the 8th cultivation day, tomato seedlings were removed from the nutrient medium and used for RNA extraction [26]. Three biological replications are used for each part of the experiment, with ten plants per replication and six or nine repeating RT-PCR reactions.

2.2. Total RNA Extraction and cDNA Synthesis

Total RNA extraction from S. lycopersicum leaves was carried out by using a hot phenol procedure [8]. The main peculiarity of this method lies in transferring hot acidic phenol (pH 4.5) into samples ground in liquid nitrogen. Samples for RNA preps were taken from well-mixed leaves of 15–20 individual plants frozen in liquid nitrogen. The purified RNA was analyzed on a 1% non-denaturing agarose gel containing 0.5 ethidium bromide (EtBr) to check RNA integrity; impurities of genomic DNA in RNA samples were removed by DNase I (Thermo Fisher Scientific, Waltham, MA, USA). Samples demonstrated good RNA quality with sharp and intense 28S, 18S ribosomal RNA bands without degradation. To determine the concentration of total RNA, we used NanoDropTM One (Thermo Fisher Scientific, Waltham, MA, USA). The OD260/280 of each sample ranged between 1.8 and 2.1, while OD260/230 ranged between 2.17 and 2.41.
An MMLV RT kit (Evrogen, Moscow, Russia) with oligo (dT) primer was used to synthesize the first-strand cDNA. The last two procedures were carried out according to the manufacturer’s recommendations.

2.3. Primer Design and Calibration

All primer sequences were deposited from NCBI, with special numbers shown in Appendix A, Table A1, and [7,29,30]. In the PCR melting curve, all candidates produced a single specific peak or single band on 2% agarose gel, especially for short DNA fragments (Figure 1).

2.4. Quantitative Real-Time PCR

All reference gene expression was analyzed by qRT-PCR using qPCRmix-HS SYBR (Sintol, Moscow, Russia) and SYBR Green intercalating on the LightCycler® 96 system (Roche Diagnostics Corporation, Indianapolis, IN, USA) and ANK-32 thermocycler (Synthol, Moscow, Russia). Primers for qRT-PCR were obtained in [31]. The PCR program consisted of pre-denaturation at 95 °C for 5 min and 45 cycles of the following steps: 95 °C for 20 s, 58 °C for 20 s, and 72 °C for 20 s. Between 30 and 100 ng of the template was added to the sample (based on the amount of RNA taken for cDNA synthesis). The resulting data were analyzed by the 2−ΔΔCT method [32] using Microsoft Excel, Sigma Plot 15.0 software, Statistica 6.0, and R (v4.2). Our poster was created with BioRender.com.

2.5. Determination of Electrolyte Leakage and Ion Absorption

To determine the ion content (Cl, Na+, K+) in the tissues of tomato leaves, the elements were extracted for 30 min at 40 °C with 25 mL of deionized water using an ultrasonic device (Sapphire, Moscow, Russia) from 200 mg of a fresh sample. The ultrasound power level was 35 kHz. The samples were cooled, passed through a 0.45 μm porous filter, and used for ion content analysis. Determination of ion content was carried out using ion-selective electrodes: potassium electrode (ELIT-031), sodium–sodium electrode (ELIS-112), and chlorine–chloride electrode (ELIT-261). The ion content (mg L−1) was determined on the ITAN ionometer (Tomsk Analit, Tomsk, Russia). By plotting the dependence of the electrical conductivity on the ion concentration on a pre-constructed scale of standard solutions in the studied concentration range (10−1–10−4 M). A silver chloride electrode (EVL-1M3.1) was used as a reference. The electrolyte content in the samples was determined by the electrical conductivity of the solution using an Expert-002 conductometer (Econix, Tomsk, Russia). The change in electrical conductivity of samples in mgL−1 is proportional to the concentration of electrolytes and reflects the degree of ion accumulation in plant tissues [33].

2.6. Water Content

Morphological characteristics were assessed, including wet and dry biomass (mg) of roots and shoots. Dry and wet biomass were determined gravimetrically using an analytical balance (Sartorius, Göttingen, Germany).
RWC (%) = [(FW−DW)/FW] × 100
where RWC—water content (%), FW—wet biomass (mg), and DW—dry biomass (mg) [33,34].

2.7. Statistical Analysis

In order to minimize the statistical deviations, we used four types of algorithms and revealed the final rank by RefFinder. Additionally, special pairwise variations have confirmed these differences between YaLF and Rekordsmen.
The ∆Ct analysis calculation reveals the candidate genes’ stability by relative expression compared among the experimental samples [23]. The ΔCt value is calculated by subtracting the Ct (cycle threshold) value of a reference gene from the Ct value of a target gene.
Gene expression variation in the BestKeeper applet [24] reveals standard deviations based on the Cq values. We also used the geNorm method, which is based on pairwise variation assessment and the average expression stability measure (M value) for each candidate against others [25]. NormFinder determines gene stability by analyzing expression through inter-group (differences between sample groups) and intra-group variations (variation within sample groups). Accordingly, genes with minimal combined inter- and intra-group variations are considered the most stable [26].
The final rank was calculated using RefFinder software [27]. The correlation map was calculated using Statistica 6.0 software.

3. Results

Using a housekeeping gene as a reference is thought to underlie low expression deviation in different stressful conditions [35,36,37,38]. Sometimes, salinity stress necessitates additional troubleshooting and encourages researchers to discover personalized PCR optimization strategies [39,40,41]. Various S. lycopersicum genotypes also differ in salt tolerance [42,43,44,45,46]. In this study, we have chosen two tomato varieties and examined the expression deviation of famous HKGs in response to salt stress.
Target gene preparation of Rekordsmen and YaLF seedlings included mRNA extraction, cDNA synthesis, special primer design, primer calibration, and qRT-PCR analysis (Section 2). Primers shown in Appendix A, Table A1, and correlation coefficients (R2) ranged from 0.86 to 0.99. Statistical criteria are specified in Section 2.

3.1. Primer Efficiency and Ct Variation

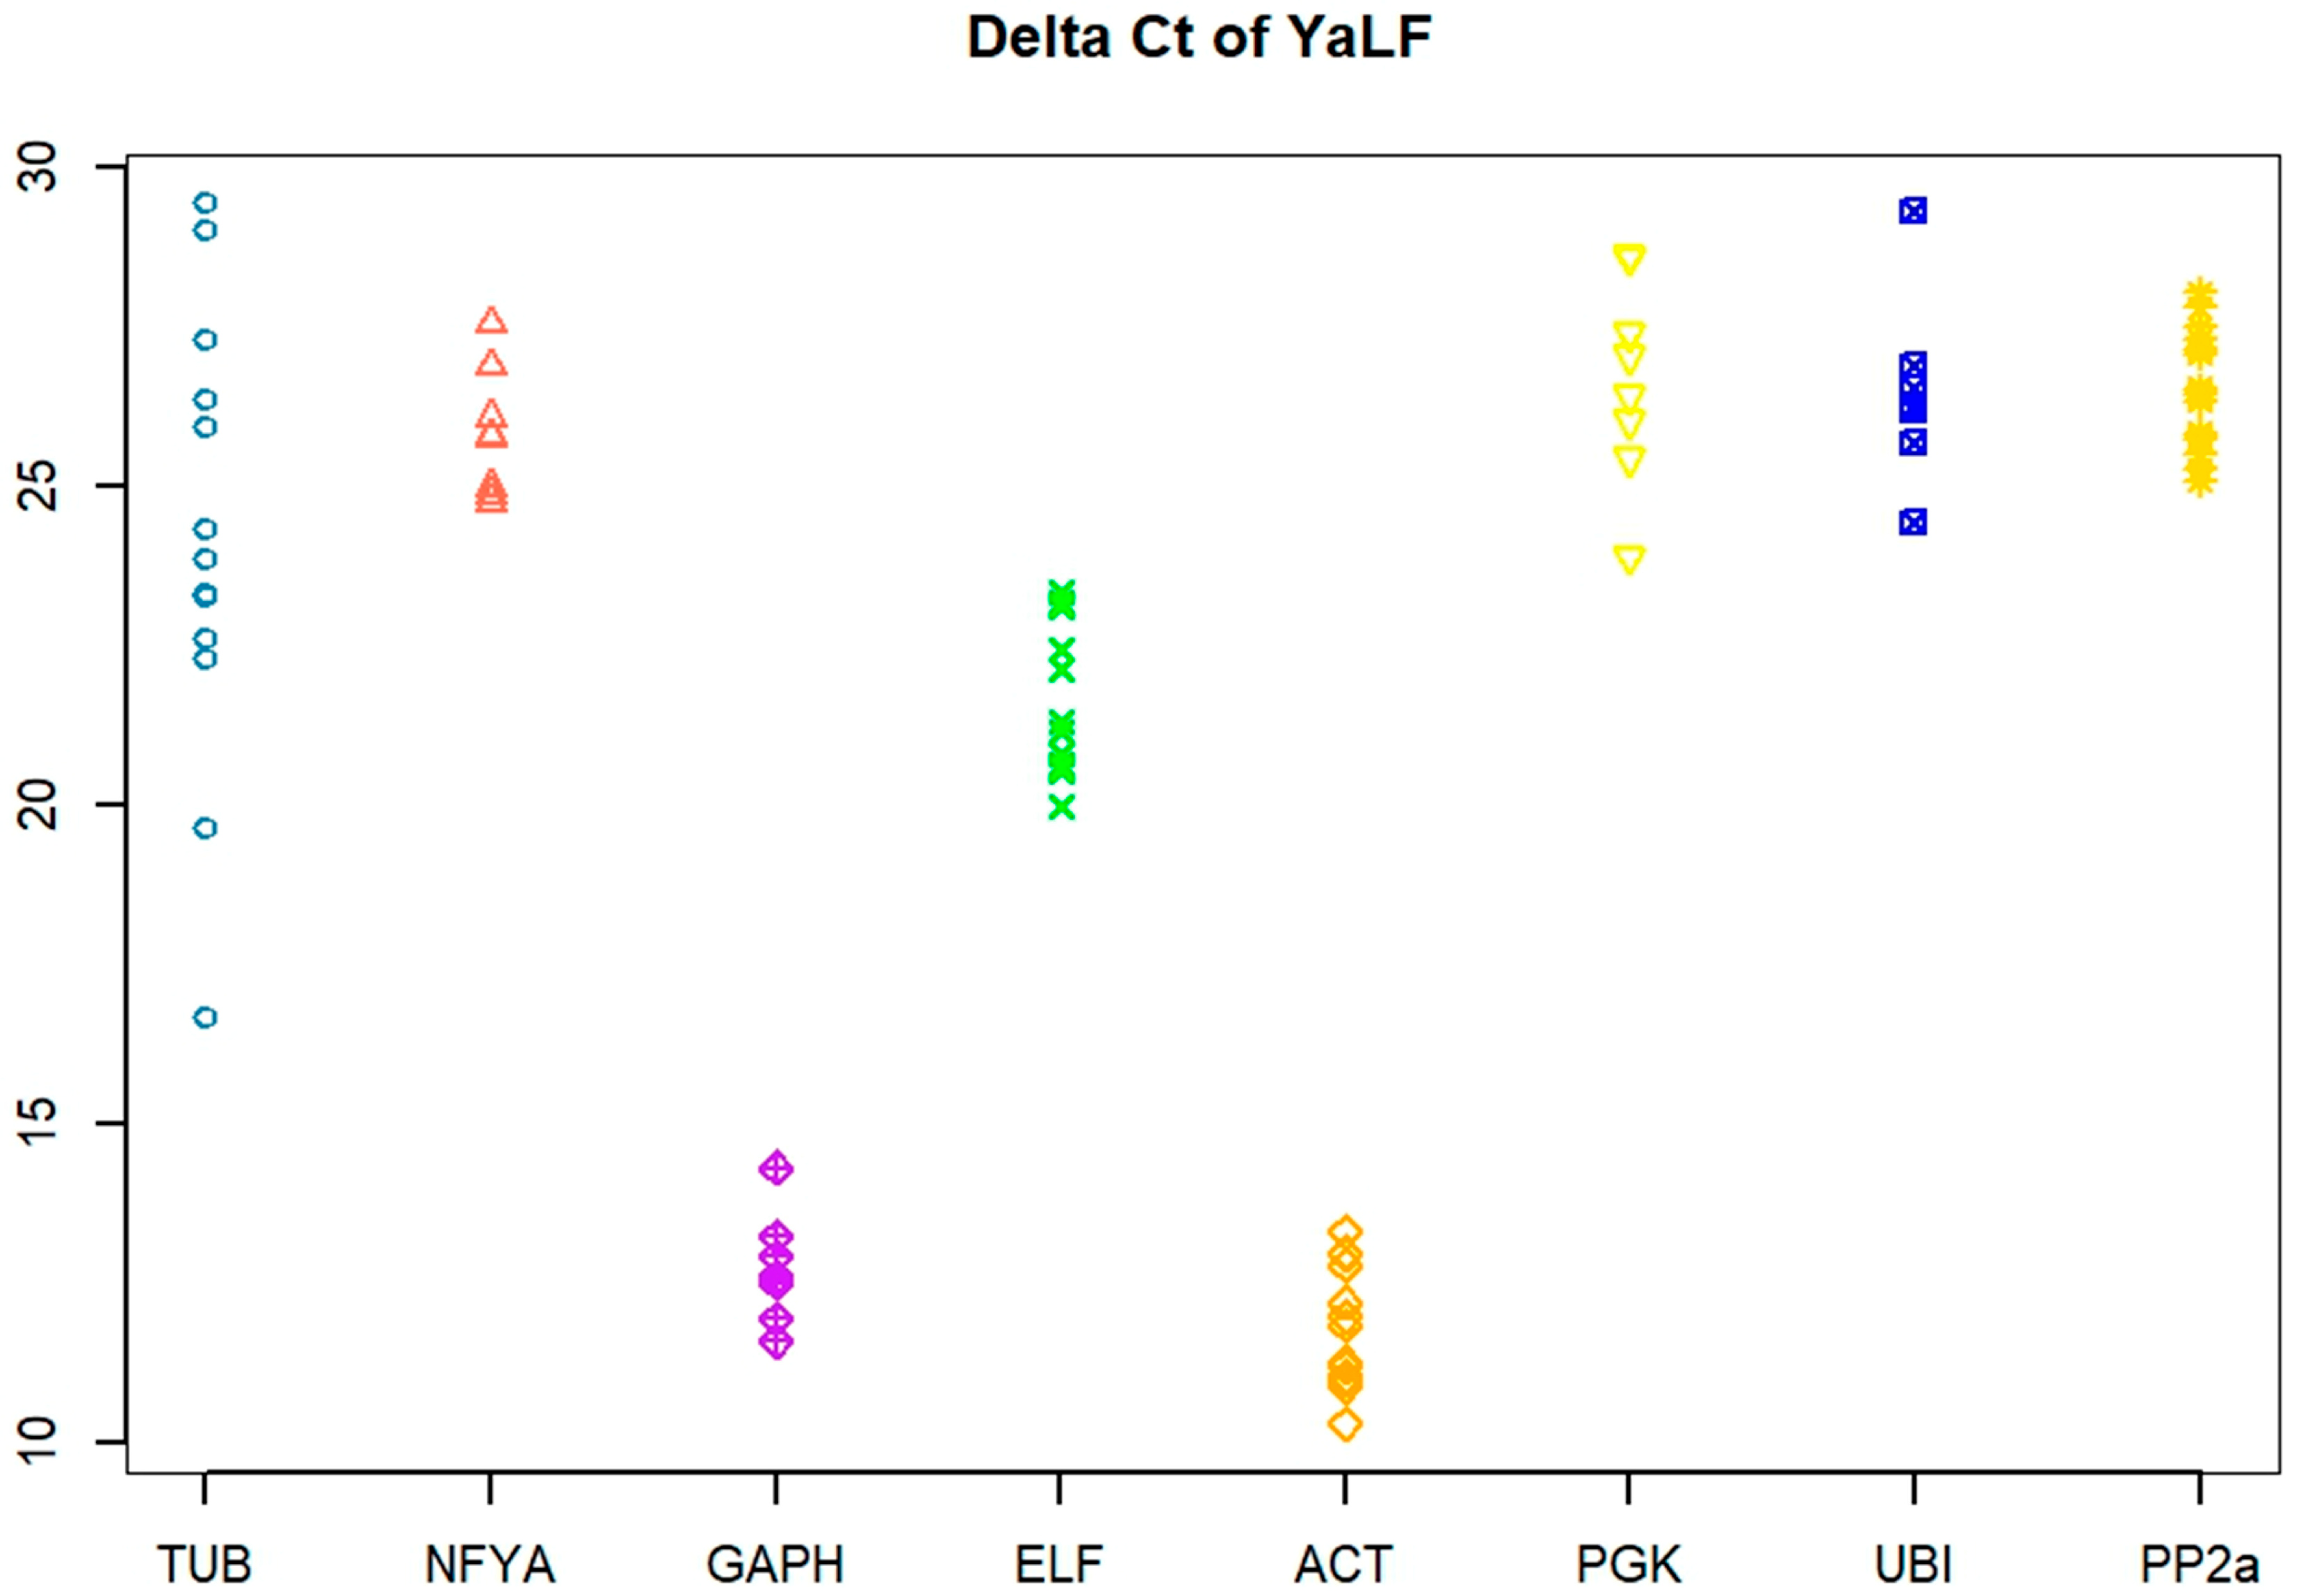
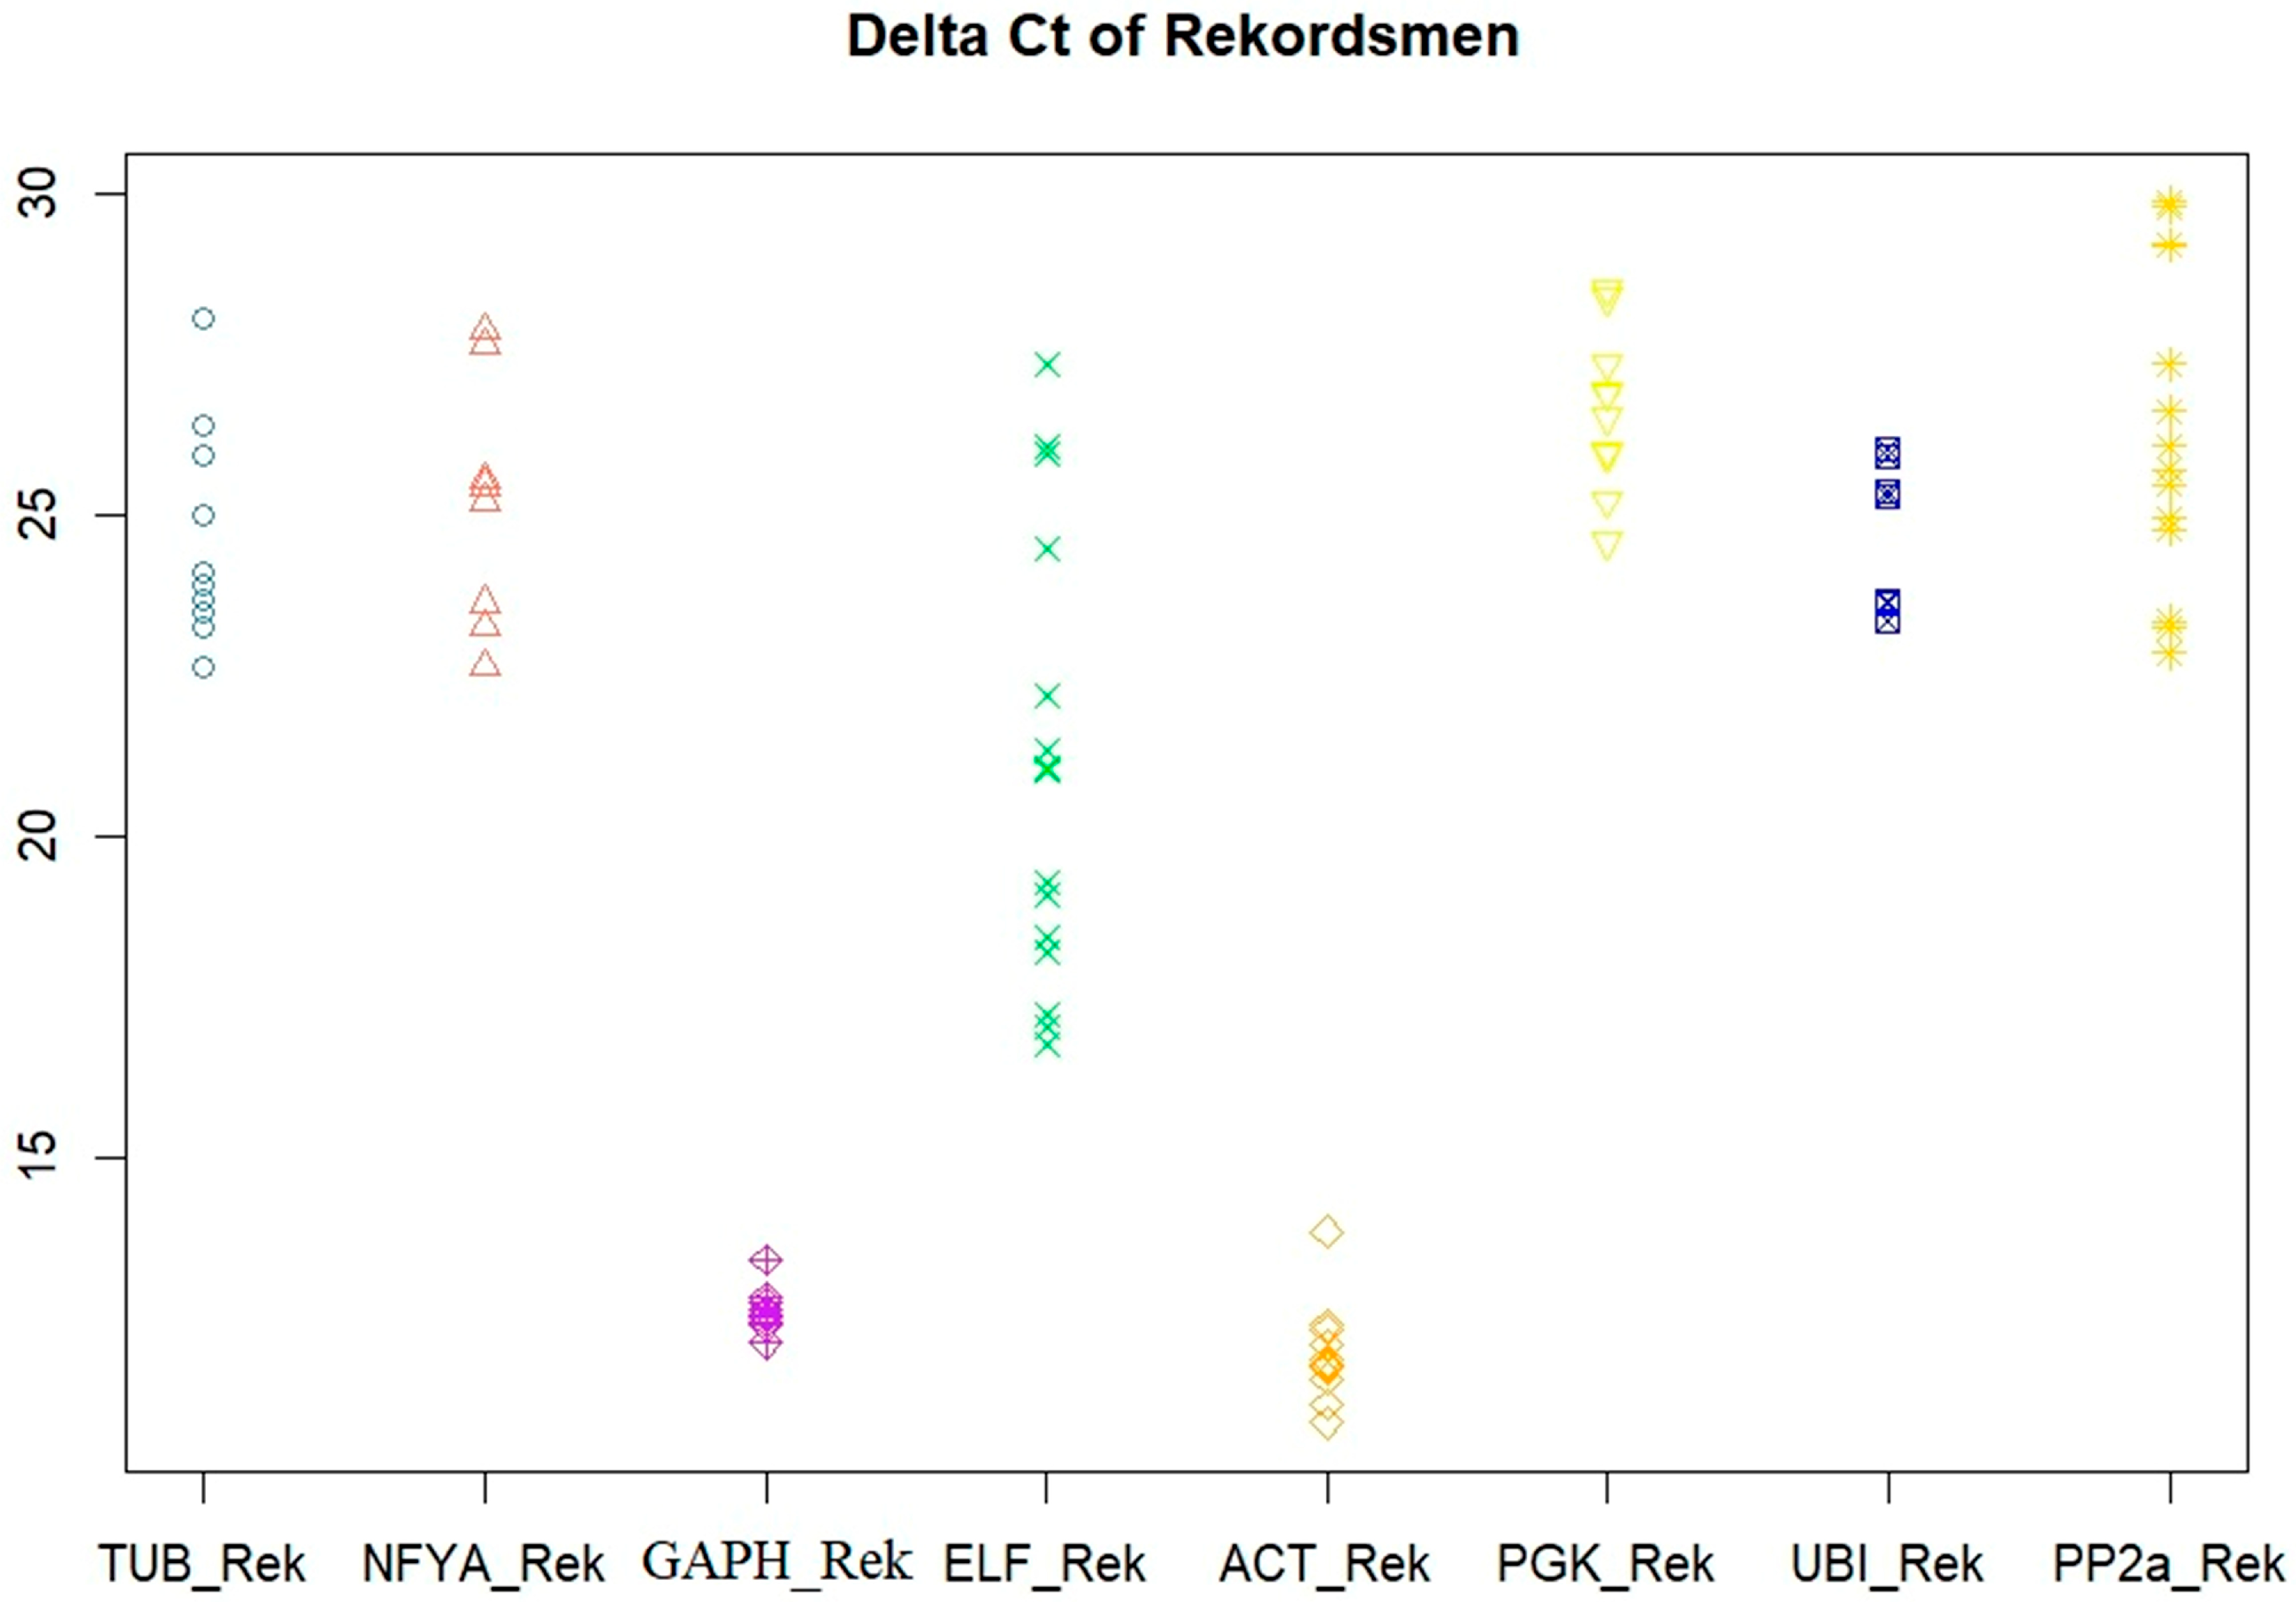
In order to assess the expression of HKGs, RNA transcription levels were assessed in response to 100 mM NaCl. Except for ACT and GAPDH transcript levels, all genes showed significant variation. Wang et. al. reported earlier that GAPH and ACT with a higher annealing temperature (58 °C) had better amplification [8,9] on tomatoes, and we used it. The average Ct of eight candidate genes ranged from 11.9 (ACT) to 28.8 (PGK) in both tomato genotypes (Figure 1).
Interestingly, ELF, NTF-Y, and PP2a had a slight Ct deviation in the potentially less salinity-tolerant YaLF line. At the same time, average Ct values of TUB, PGK, and UBI were notably less variable in Rekordsmen (24.9–28.1). A significant increase in variation in response to 100 mM NaCl showed some housekeeping genes in both tomato varieties (ELFYALF, TUBREK, NFT-YYALF, PP2aYALF). Despite the several genes (TUB, PP2a, NFT-Y, UBI) clustering Ct values around 26 and 15 (25, 4) for YaLF and Rekordsmen, accordingly, the general trend consisted of Ct deviation improvement under salinity. Among the candidates considered, ACT exhibited slightly average Ct, and UBI showed the highest transcript level in S. lycopersicum genotypes.
TUB and UBI had the most unstable Ct values in response to NaCl impact.

3.2. Stability of Reference Genes Using the ∆Ct Algorithm

Sorting variabilities of housekeeping gene expression levels are shown in Figure 2 and Figure 3 and Table A1.
The most reliable genes in YaLF based on the ∆Ct method were GAPH, UBI, ACT, and NFT-Y, with corresponding mean SD values of 0.25 and 0.41. Contrary to this, PP2a and TUB exhibited more deviations and SD values of around 0.8.
At the same time, we discovered another gene set for Rekordsmen HKGs in response to salt stress. UBI, GAPH, PGK, and ACT were the most stable genes, with mean standard deviation (SD) values of 0.019 and 0.039. NFT-Y and TUB were ranked low and had only 0.86 and 0.38 SD values, respectively.

3.3. Stability of Reference Genes Using BestKeeper Analysis

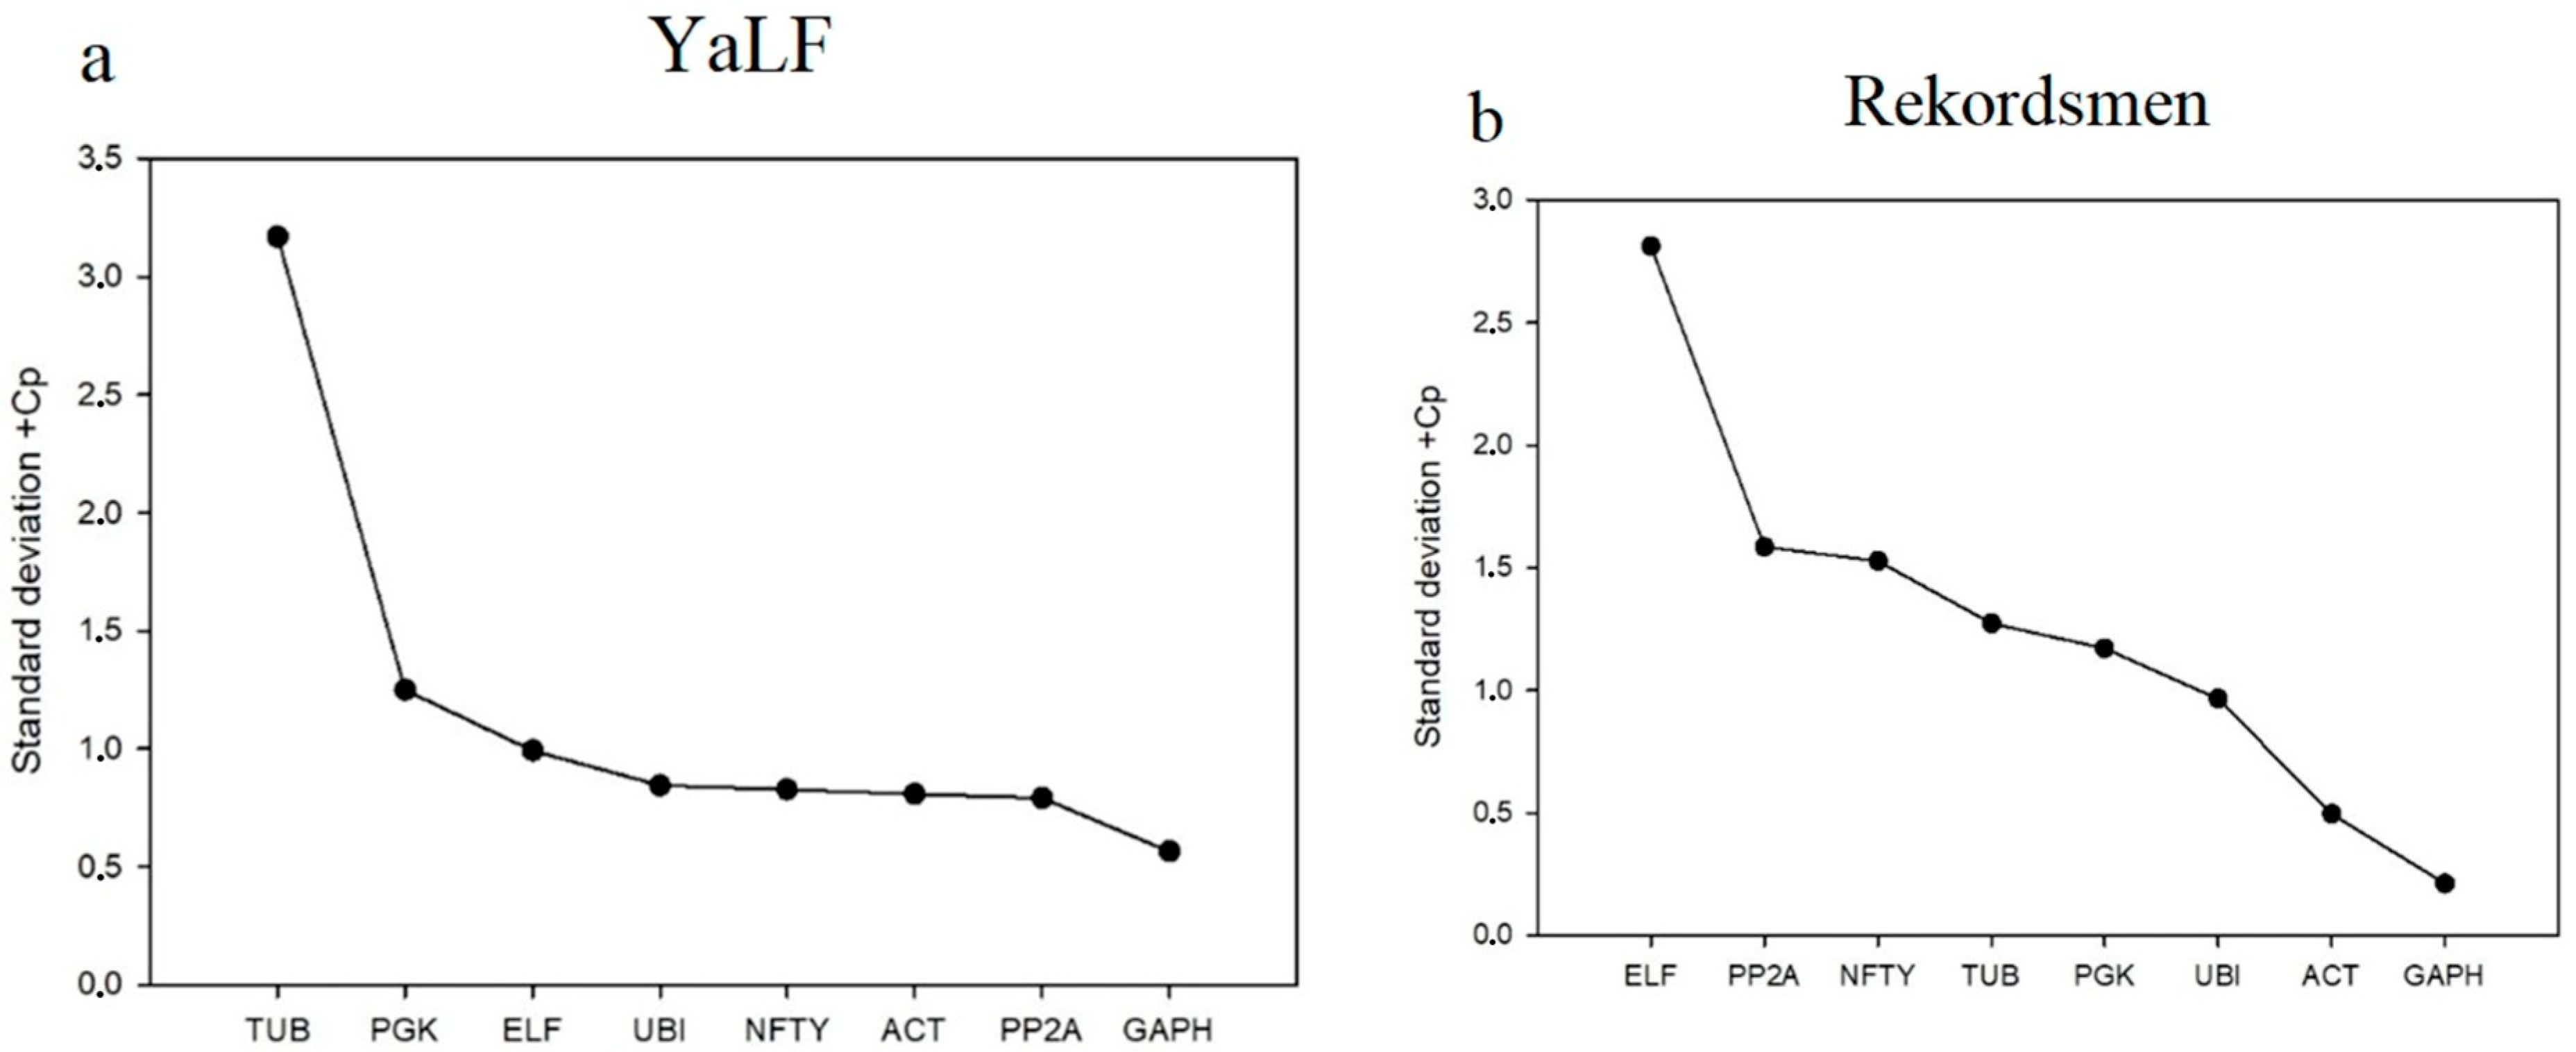
Variance coefficients (CV) (Figure 4 and Figure 5) and SD are shown in Table 1 and Table 2 and Appendix A, Table A2. We revealed ACT, PP2a, and GAPH as genes with the best rank in YaLF calculated by BestKeeper. By the way, UBI, ACT, and GAPH had the leading rank in Rekordsmen plants.
On the other hand, TUB and PGK had a slight Cv rank (YaLF)—3.17 and 1.25, respectively, while ELF and PP2a had a similar rank because of standard deviations (2.81 and 1.5) in Rekordsmen plants. Curiously, the PP2a rank of BestKeeper in the salt-sensitive tomato line YaLF characterized more stability than UBI in the ∆Ct method. Nevertheless, Rekordsmen characterized less variation of HKGs calculated with BestKeeper.

3.4. Stability of Reference Genes Using the geNorm Algorithm

The statistical analysis showed a slight UBI, PP2a, PGK, and ACT deviation of Ct in YaLF (4.36, 6.5, and 6.6, respectively) and Rekordsmen plants (Figure 6). At the same time, NFT-Y and GAPH have significant variations in both lines. Rekordsmen’s results were similar to BestKeeper for NFT-Y, TUB, and ELF genes. They remained at a low rank, while UBI and PGK improved their positions compared to the previous calculation of BestKeeper.

3.5. Stability of Reference Genes Using NormFinder Analysis

We provided geNorm and showed the best rank for NFT-Y and TUB genes in YaLF plants, while NFT-Y had a lower rank in Rekordsmen plants in NormFinder analysis. (Figure 7). Next, calculations revealed ACT and six of the eight genes as stable (except NFT-Y and TUB), whereas TUB and NFT-Y also had leading ranks in Rekordsmen (Figure 7). By the way, some YaLF HKGs with NormFinder average rank (GAPH) or ACT calculated by GeNorm changed their positions to the opposite. Apparently, this is indicated in the calculation features of these algorithms (Materials and Methods).
TUB and NFT-Y in Rekordsmen showed similar results of stability as the NormFinder analysis. We also unexpectedly discovered the same high rank assessment of TUB, NFT-Y, and PP2a stability in Rekordsmen based on NormFinder, ∆Ct, and BestKeeper analyses.
In conclusion, we calculated the final ranking of eight candidate reference genes by RefFinder and summarized the results. We also showed the final rank in Figure 8 for a graphic focusing on the difference between the YaLF line and Rekordsmen cv. expression deviation of HKGs.

3.6. RWC and Ion Accumulation Correlation with Candidate Gene Expression Level

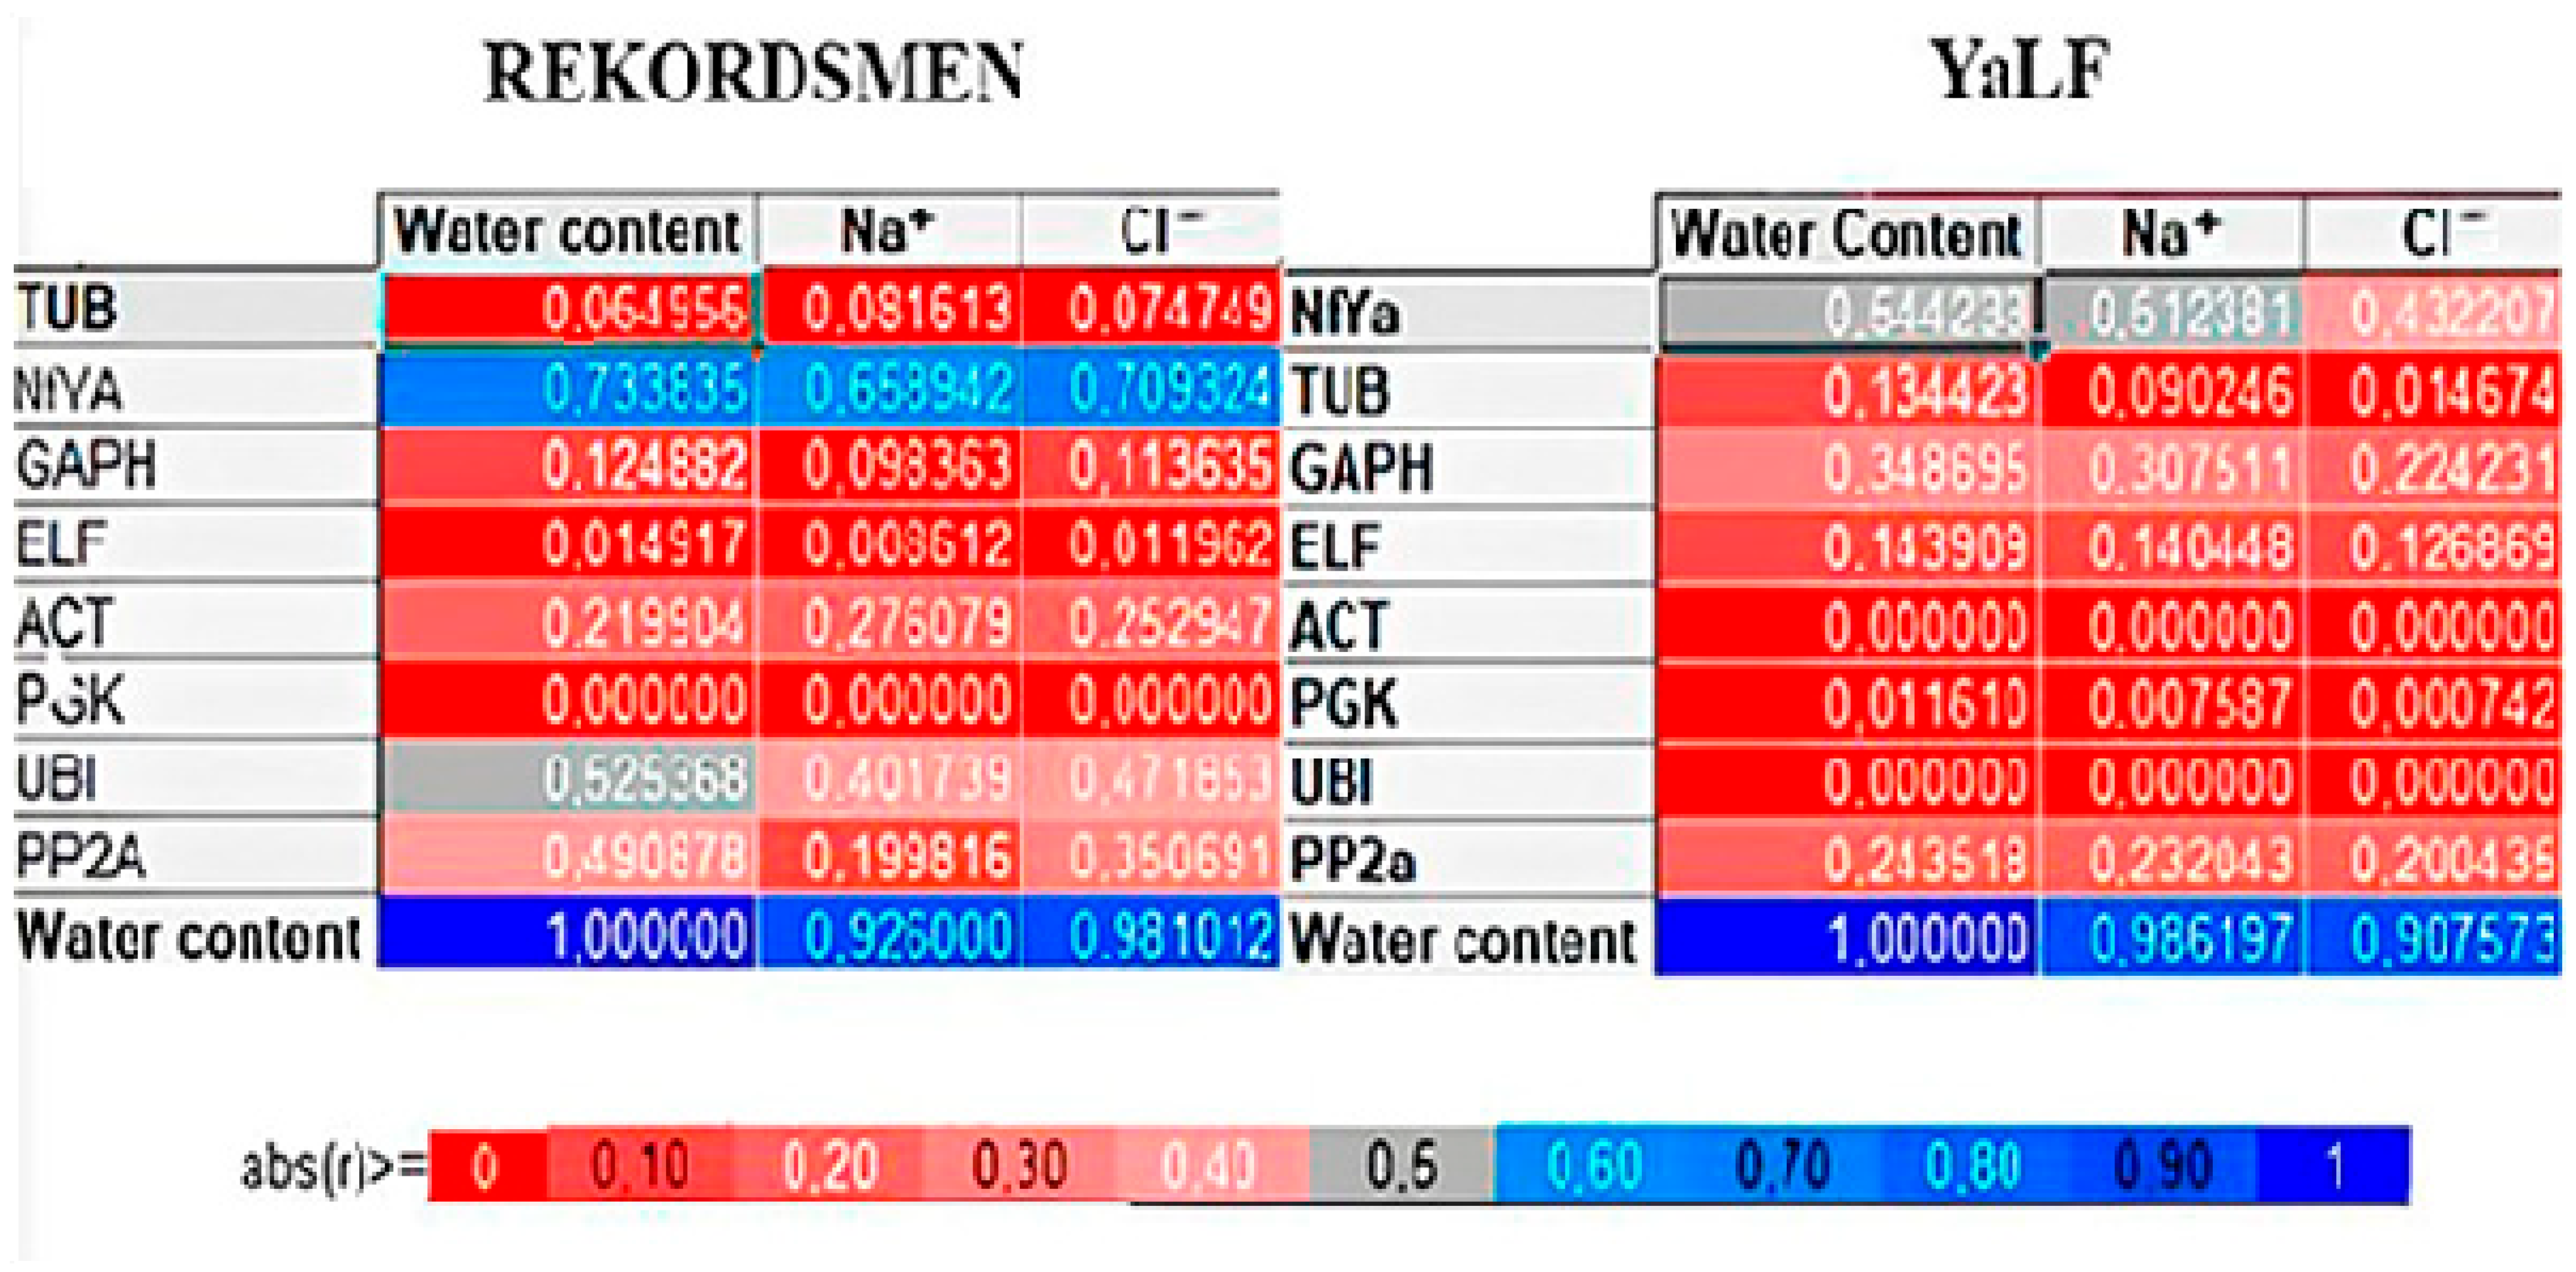
The physiological adaptation through RWC was studied for the salt-sensitive YaLF tomato and the more salt-tolerant Rekordsmen. The tomato varieties analysis showed a stronger positive correlation between RWC and ion content (>0.92, 0.98 for YaLF). These results (unpublished data) confirmed our previous studies and may be a part of the adaptation strategy of more salt-tolerant tomatoes compared to YaLF because of 5–6 times greater differences in Na+/Cl accumulation in YaLF tissues [31,47].
To investigate the potential RWC influence on reference gene expression levels, we calculated expression correlations with water and Na+/Cl content changes in plants (Appendix A, Figure A1). As we hypothesized earlier, most of the HKGs showed zero or weak (<0.5) negative correlation. By the way, NFT-Y had a strong positive correlation in Rekordsmen plants, ranging from 0.65 (Na+), 0.7 (Cl) to 0.73 for RWC values.
These results may introduce some errors into the qRT-PCR research on the salinity of tomato species and should be useful for investigators.

4. Discussion

Most Solanaceae family members have no salinity resistance and need salt tolerance improvement by molecular engineering [47,48,49,50,51,52,53,54,55,56,57], or selection, like with other salt-sensitive plant species [31]. The overall sustainability of agriculture is influenced by the effects of salt stress on different tomato organs and tissues. Today, breeders also create new tomato F1 hybrids with different salt stress resistance [36,37].
Today, few researchers consider differences between tomato varieties during selection research [43,44]. In our previous studies [17,44,45], we showed Rekordsmen cv.’s salt resistance compared to the YaLF line based on rhizogenesis frequency, count and length of roots, and shoot and root FW/DW (fresh/drought weight) parameters [17,44]. The average area of epidermal and mesophyll cotyledon cells, chloroplast’s ultrastructure, and nuclear compartments have also confirmed these results. Also, the YaLF line was characterized by genotype-specific salt-sensitive reactions in response to 150 mM NaCl, in contrast to Rekordsmen.
Some studies connected sort-specific tomato salt stress reactions with root architecture changes by gene DRO1 [37]. This gene may be involved in tomato tolerance genetic regulation in our genotypes, too, or other plants [28,32,52,53,54,55,56,57,58,59,60,61,62,63,64,65,66,67,68,69,70,71,72,73,74,75,76,77,78,79,80].
Most salt-sensitive species (Arabidopsis, rice (Oryza sativa), maize (Zea mays), and Brassica) have often shown root growth and a decrease in meristem activity in response to NaCl [66,67,68,69,70,71,72,73,74,75,76,77,78,79,80]. On the contrary, exogenous sucrose treatment restored the moderate salt stress-promoted primary root growth in rape [58]. In our previous study, we also obtained some increment of root growth and numbers under 25–75 mM NaCl of salt-tolerant Rekordsmen cv [17]. This example shows that salt adaptation can be compared across genotypes and different crops and may be regulated by transcript levels of salt-resistance gene candidates, such as DRO1. By the way, DRO1 validation or another gene of interest expression in our genotypes in future research demands from us suitable reference genes [19,32,33,63,64,65,66,67,71,72].
In this study, special attention was paid to choosing genes from various functional classes to reduce the chance of their regulation and potential expression correlation under salt stress. We also showed a little correlation of HKG expression levels with RWC and Na+/Cl content changes in tomato varieties (Appendix A, Figure A1), which may also help investigators assess the influence of RWC. Only NFT-Y had the stronger positive correlation with RWC (>0.7) in Rekordsmen and YaLF, accordingly (>0.5). Similar results were obtained in various plants and confirmed this gene’s involvement in osmotic stress reactions [47,75,76].
All statistical algorithms provided consistent results, with some variations in HKG ranking order in the YalF line (Ct, BestKeeper, NormFinder). This behavior confirmed the necessity to choose the right algorithm in each experiment with tomatoes under salt stress [44]. To summarize the final ranks, we used RefFinder [38] and confirmed differences between S. lycopersicum genotypes in HKG stability based on all algorithms, which we should consider in breeding studies or mutant tomato screening.
The most stable reference genes in the salt-sensitive YaLF line were ACT, UBI, and PP2a. These genes also had a high stability level in salt-tolerant Rekordsmen cv. However, the genes had another ranking position, and the final set also included TUB and NFT-Y. Interestingly, TUB, ELF, and NFT-Y had the lowest ranks in the YaLF plant, which may be explained by the high salt-sensitivity of this genotype [26,46]. Changes in ACT and TUB ranking positions between genotypes apparently indicate disturbances of the cytoskeleton in response to salt stress reported in our recent studies [44,45]. However, PGK and GAPH, at the same time, had the last positions in comprehensive rank stability calculated for Rekordsmen plants. This does not indicate PGK and GAPH are completely unsuitable, but rather requires more detailed study with various NaCl concentrations, and may be a genotype’s peculiarity. For example, our colleagues earlier revealed GAPDH and UBI as the most stable reference genes and demonstrated expression variability in response to viral infection in other tomato types [80].
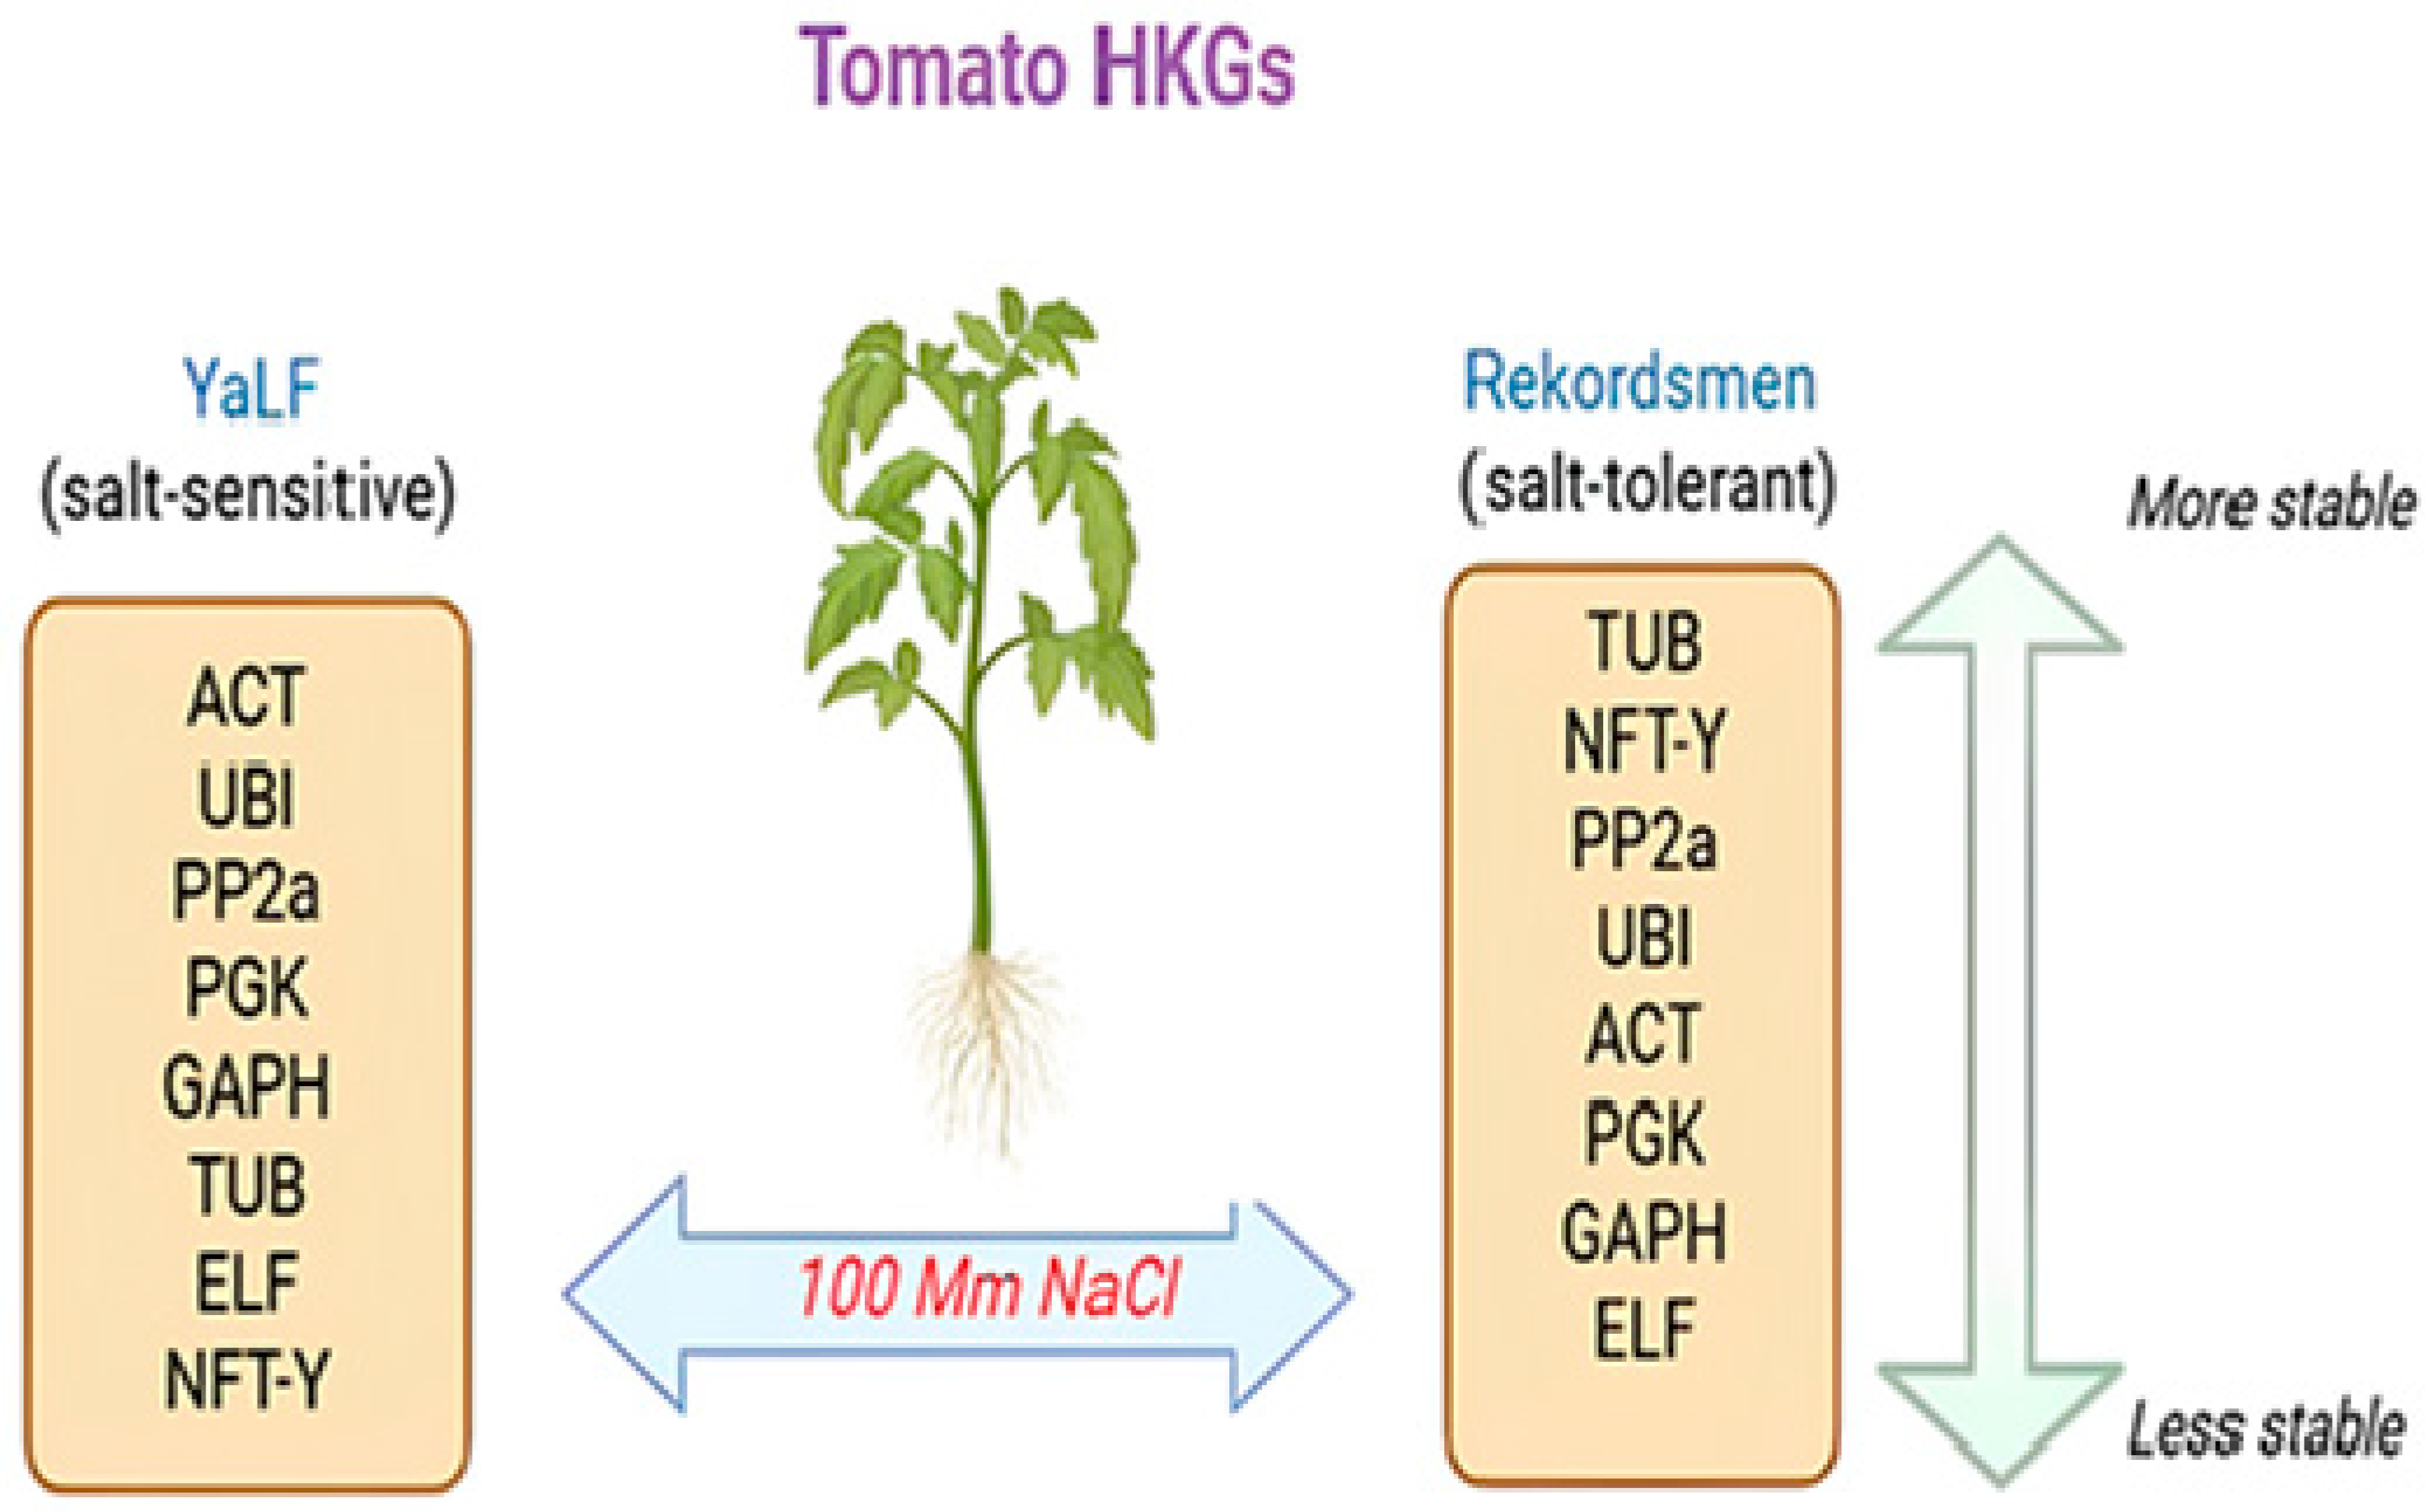
Nevertheless, YaLF showed more overall significant Ct variation of reference genes, while these HKGs had more sustainable expression levels in Rekordsmen cv. plants. Interestingly, geNorm and NormFinder showed fewer rank variables against ∆Ct and BestKeeper algorithms. Furthermore, the available literature reported ACT, ELF, GAPH, TUB, and UBI as the most stable tomato genes for normalization under salt stress [19,48,60], which we partly confirmed in YaLF and Rekordsmen plants (Figure 9). That is why tomato salt stress researchers should choose the reference genes suitable for both tomato genotypes in selection or mutant screening when they need qRT-PCR normalization.

5. Conclusions

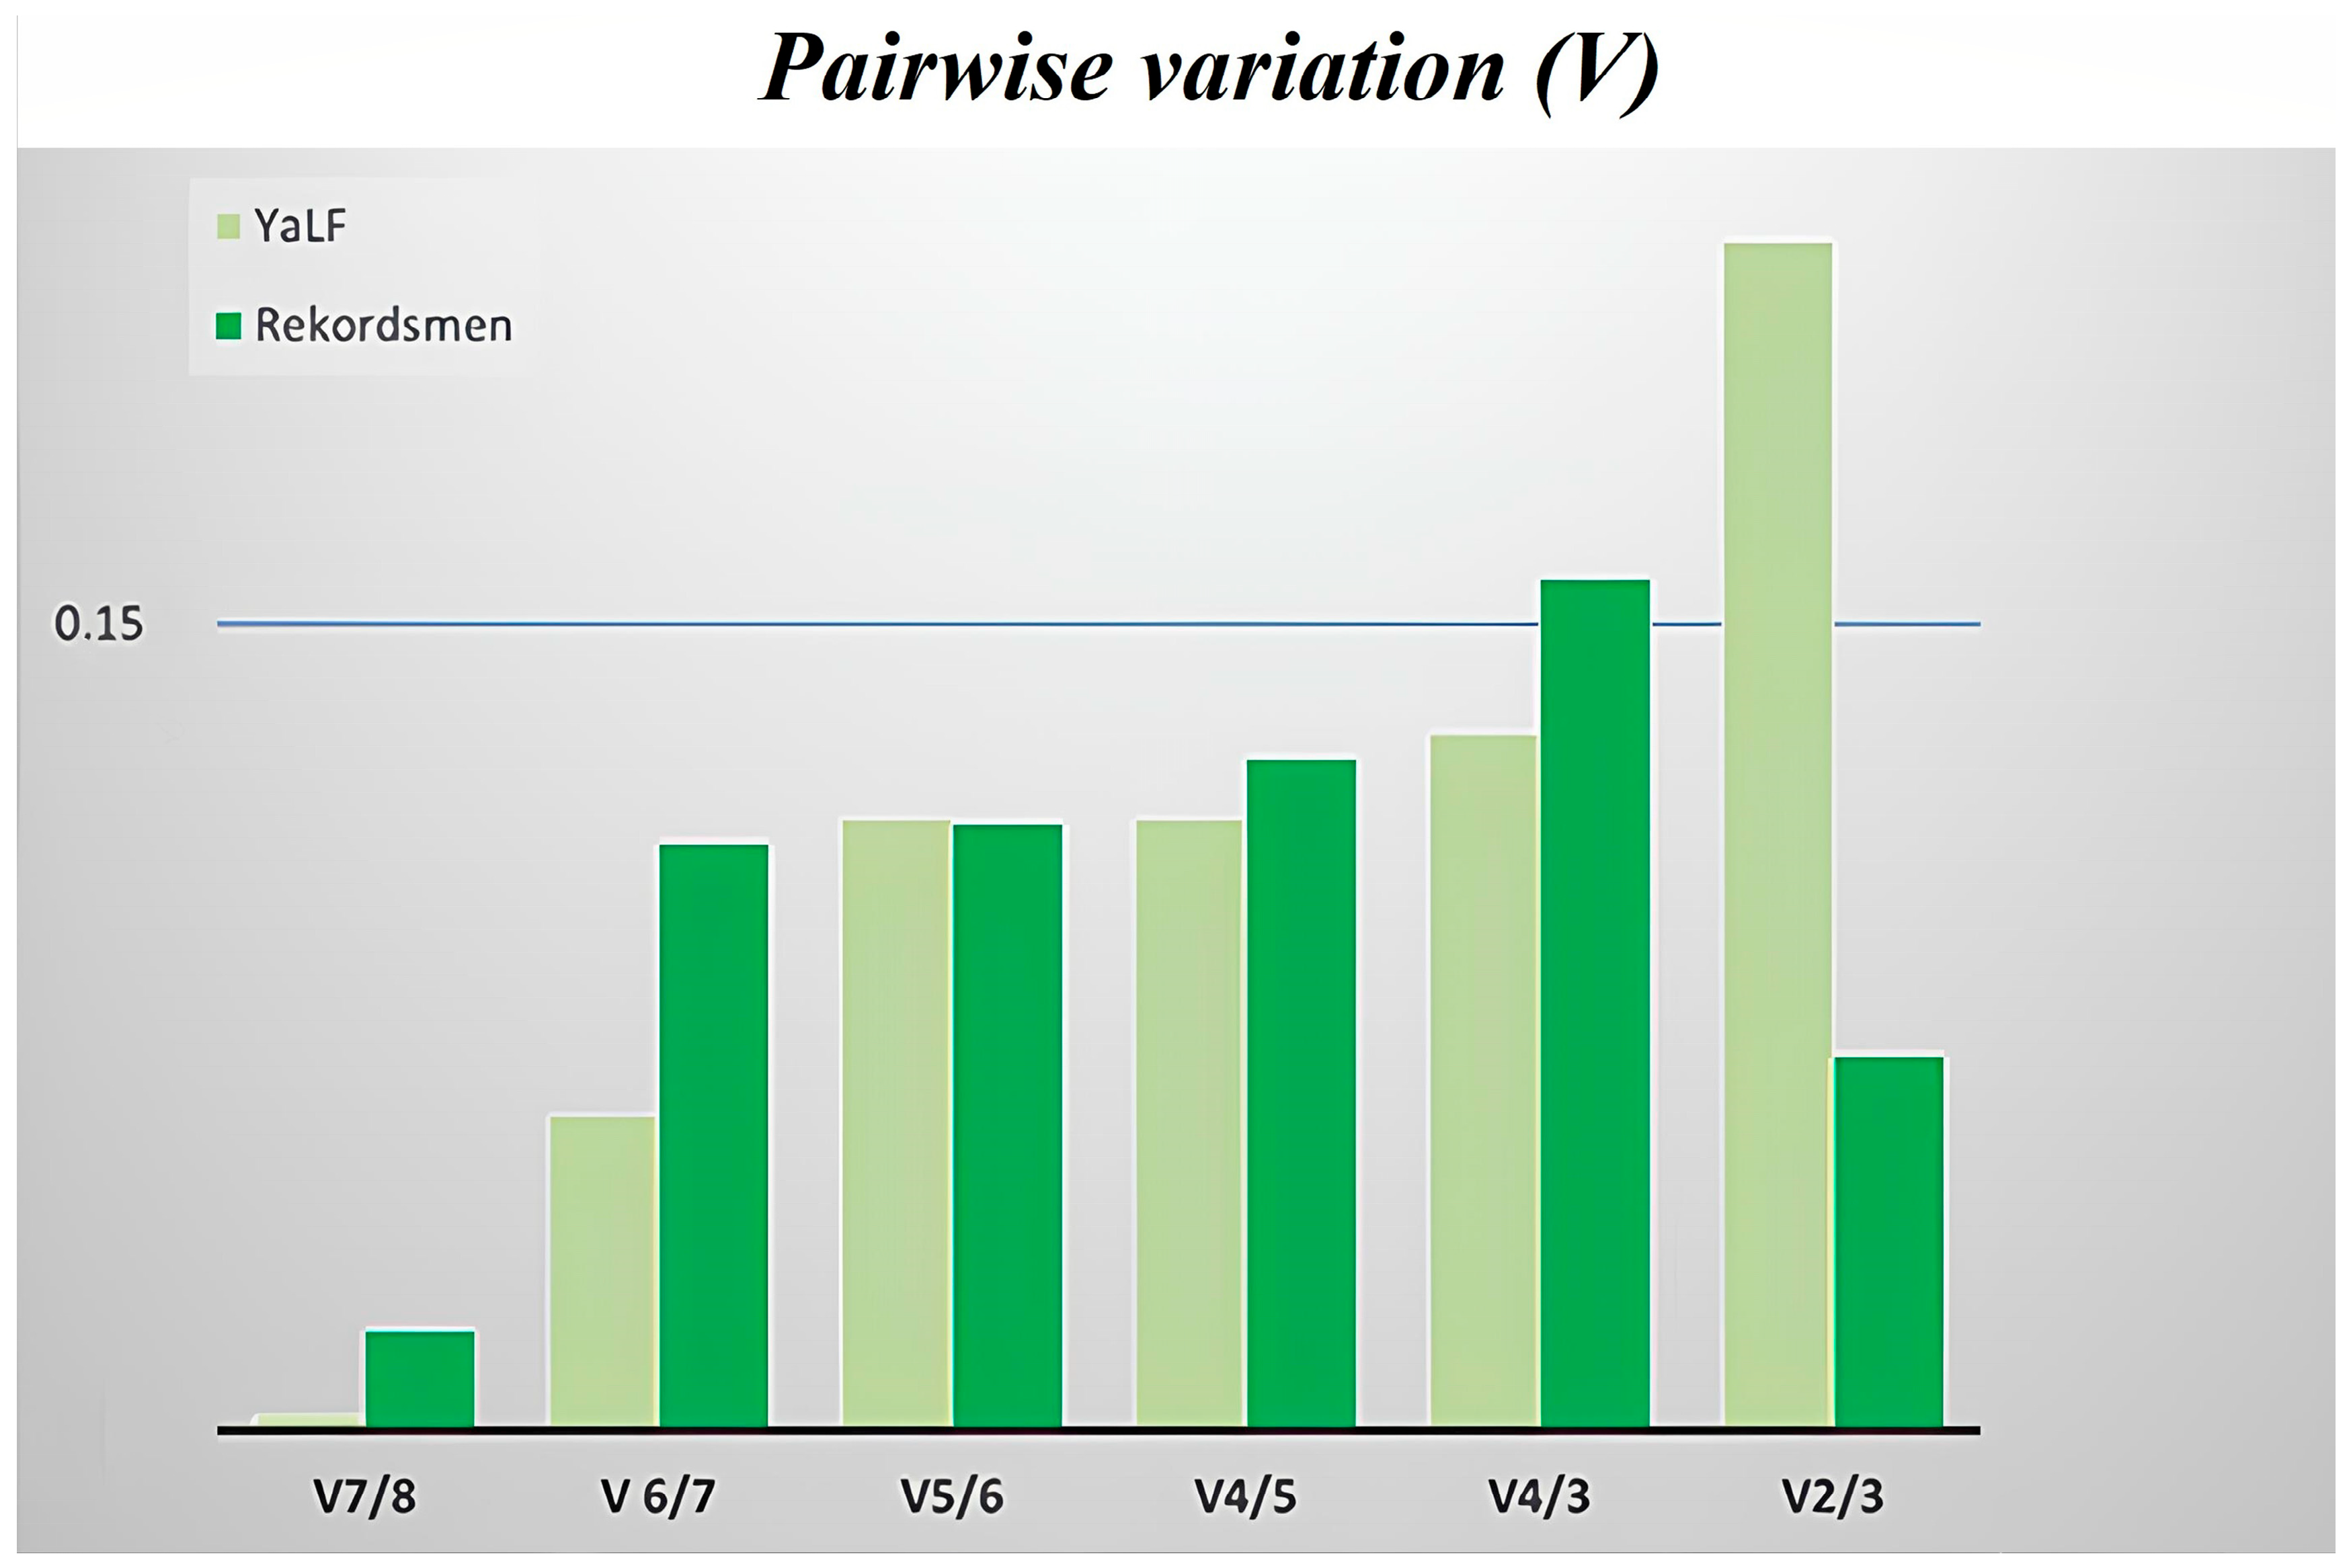
In conclusion, the final pairwise variation (V) showed the lowest V values for ACT and UBI in the YaLF line and TUB and NFT-Y in Rekordsmen cv. Accordingly, they could perform as reference genes (Figure 10).
However, under salt stress, the pairwise variation of V4/3 (Rekordsmen) or V2/3 (YaLF) was higher than 0.15. That is why we suggested three reference genes used for the YaLF line and at least four genes for Rekordsmen cv. in qPCR normalization after salt stress of 100 mM NaCl or more. By the way, the final choice of the second reference genes should be dependent on specific growing conditions [63,64,65,66,67,68,69,70,71,72,73], NaCl concentrations, and, as we showed in this study, tomato sort peculiarities [19].
As a whole, our study helped simplify the qRT-PCR investigation of salt stress tomato genes and may be beneficial for other experiments.

Author Contributions

Conceptualization, E.N.B., G.N.R. and H.I.R.; Methodology: H.I.R.; Investigation, L.R.B.; Data curation, L.R.B. and G.N.R.; Formal analysis, E.N.B., H.I.R. and L.R.B.; Manuscript writing, H.I.R. and L.R.B. All authors have read and agreed to the published version of the manuscript.

Funding

The plant growth and analysis were supported by assignments and FGUM-2025-0003 (All-Russia Research Institute of Agricultural Biotechnology). The RT-PCR analysis was carried out within the state assignment of the Ministry of Science and Higher Education of the Russian Federation (theme No. 122042700044–6). Authors pay the APC from their own funds.

Informed Consent Statement

This work does not contain any studies involving human and animal subjects.

Data Availability Statement

The original contributions presented in this study are included in the article. Further inquiries can be directed to the corresponding authors.

Acknowledgments

We express our thanks to Karpichev for primer design, work cooperation, and moral support.

Conflicts of Interest

The authors of this work declare that they have no conflicts of interest.

Abbreviations

The following abbreviations are used in this manuscript:
DWDrought weight
EtBrEthidium bromide
MMLVMoloney murine leukemia virus
qRT-PCRQuantitative real-time polymerase chain reaction
OD260/280Optical density
RWCRelative water content
FAOFood and Agriculture Organization
FWFresh weight
HKGHousekeeping gene

Appendix A

Table A1. Primer sequences of eight candidate reference genes, primer efficiency (R2), and length of the amplified product. All primers were taken from the NCBI database and [7,65,66].
NameAccession
Number
Forward Primer (Sequence 5′-3′)Reverse Primer
(Primer Sequence 5′-3′)
Primer Efficiency (R2)Amplicon Length (bp)Tm
ELFX53043.1GGAACTTGAGAAGGAGCCTAAGCAACACCAACAGCAACAGTCT0.9815858
ACTBT013707.1TCCTTACCTGAACGCCTGTCAATACGCATCCTTCTGTCCCATTCCGA0.9710758
UBINM_001346406.1TCGTAAGGAGTGCCCTAATGCTGACAATCGCCTCCAGCCTTGTTGTAA0.9112050
NTFYXM_026030313.2GGATCTGGCATGGGAACACTTCATCGGCATTCACCAA0.9612650
TUBNM_001247878.2AACCTCCATTCAGGAGATGTTTTCTGCTGTAGCATCCTGGTATT0.8618050
GAPHNM_001247874.2ACCACAAATTGCCTTGCTCCCTTGATCAACGGTCTTCTGAGTGGCTGT0.911150
PP2aNM_001247587.2CGATGTGTGATCTCCTATGGTCAAGCTGATGGGCTCTAGAAATC0.914950
PGKXM_004243920.4CTTCCTCCTTAAAACTCCTCTCCCTAAGGTCTCCAACGCTCTTCT0.8516250
Table A2. BestKeeper analysis of eight candidate genes in YaLF and Rekordsmen tomato plants.
TUBNFT-YGAPHELFACTPGKUBIPP2a
StDev + Cp (1)3.170.830.560.990.811.250.850.79
StDev + fold (1)12.843.214.414.586.794.643.192.98
StDev + Cp (1)1.271.530.212.810.491.170.961.59
StDev + fold (2)2.422.881.167.021.412.251.953.00
(1)—YaLF line; (2)—Rekordsmen cv.
Figure A1. Correlation map between candidate reference gene Ct values, plant water content, and Na+ or Cl concentration, produced by Statistica 6 software.
Horticulturae 11 01249 g0a1

References

  1. Xu, T.A.; Kohler, T.M.; Lenton, T.M.; Svenning, J.; Scheffer, M. Future of the human climate niche. Proc. Natl. Acad. Sci. USA 2020, 117, 11350–11355. [Google Scholar] [CrossRef] [PubMed]
  2. Reisinger, A.; Fuglestvedt, J.S.; Pirani, A.; Geden, O.; Jones, C.D.; Maharaj, S.; Poloczanska, E.S.; Morelli, A.; Johansen, T.G.; Adler, C.; et al. Overshoot: A Conceptual Review of Exceeding and Returning to Global Warming of 1.5 °C. Annu. Rev. Environ. Resour. 2025, 50, 185–217. [Google Scholar] [CrossRef]
  3. Shiogama, H.; Stone, D.; Emori, S.; Takahashi, K.; Mori, S.; Maeda, A.; Ishizaki, Y.; Allen, M.R. Predicting future uncertainty constraints on global warming projections. Sci. Rep. 2016, 6, 18903. [Google Scholar] [CrossRef]
  4. Basak, N.; Shit, P.K.; Adhikary, P.P.; Bhunia, G.S.; Sengupta, D. Salt Affected Soils: Global Perspectives. In Soil Health and Environmental Sustainability; Environmental Science and Engineering; Springer: Cham, Switzerland, 2022; pp. 107–129. [Google Scholar]
  5. Spencer, T.; Magnan, A.; Donner, S.; Garschagen, M.; Ford, J. Habitability of low-lying socio-ecological systems under a changing climate. Clim. Change 2024, 177, 14. [Google Scholar] [CrossRef]
  6. Løvdal, T.; Lillo, C. Reference gene selection for quantitative real-time PCR normalization in tomato subjected to nitrogen, cold, and light stress. Anal. Biochem. 2009, 387, 238–242. [Google Scholar] [CrossRef]
  7. Yourieva, N.O.; Voronkov, A.S.; Tereshonok, D.V.; Osipova, E.S.; Platonova, E.V.; Belyaev, D.V. An assay for express screening of potato transformants by GFP fluorescence. Mosc. Univ. Biol. Sci. Bull. 2018, 73, 69–75. [Google Scholar] [CrossRef]
  8. Wieczorek, P.; Wrzesińska, B.; Obrępalska-Stęplowska, A. Assessment of reference gene stability influenced by extremely divergent disease symptoms in Solanum lycopersicum L. J. Virol. Methods. 2013, 194, 161–168. [Google Scholar] [CrossRef] [PubMed]
  9. Wang, M.; Wang, Q.; Zhang, B. Evaluation and selection of reliable reference genes for gene expression under abiotic stress in cotton (Gossypium hirsutum L.). Gene 2013, 530, 44–50. [Google Scholar] [CrossRef]
  10. Kashyap, S.P.; Kumari, N.; Mishra, P.; Moharana, D.P.; Aamir, M. Tapping the potential of Solanum lycopersicum L. pertaining to salinity tolerance: Perspectives and challenges. Genet. Resour. Crop Evol. 2021, 68, 2207–2233. [Google Scholar] [CrossRef]
  11. Deanda-Tovar, A.A.; Rodríguez-Pérez, J.E.; Sahagún-Castellanos, J.; Colinas-y-León, M.T.B.; Pérez-Rodríguez, P.; Paredes-Cervantes, A.E. Tomato Lines Tolerant to Sodium Chloride at Early Growth Stages. Horticulturae. 2025, 11, 532. [Google Scholar] [CrossRef]
  12. Pailles, Y.; Awlia, M.; Julkowska, M.; Passone, L.; Zemmouri, K.; Negrão, S.; Schmöckel, S.M.; Tester, M. Diverse traits contribute to salinity tolerance of wild tomato seedlings from the Galapagos Islands. Plant Physiol. 2020, 182, 534–546. [Google Scholar] [CrossRef]
  13. Almeida, P.; Feron, R.; de Boer, G.J.; de Boer, A.H. Role of Na+, K+, Cl, proline and sucrose concentrations in determining salinity tolerance and their correlation with the expression of multiple genes in tomato. AoB Plants 2014, 6, plu039. [Google Scholar] [CrossRef] [PubMed]
  14. Du, M.; Sun, C.; Deng, L.; Zhou, M.; Li, J.; Du, Y.; Ye, Z.; Huang, S.; Li, T.; Yu, J.; et al. Molecular breeding of tomato: Advances and challenges. J. Integr. Plant Biol. 2025, 67, 669–721. [Google Scholar] [CrossRef]
  15. Tanveer, K.; Gilani, S.; Hussain, Z.; Ishaq, R.; Adeel, M.; Ilyas, N. Effect of salt stress on tomato plant and the role of calcium. J. Plant Nutr. 2020, 43, 1, 28–35. [Google Scholar]
  16. Wei, A.M.; Wais, A.H.; Ditta, A.; Islam, M.R.; Chowdhury, M.K.; Pramanik, M.H.; Ismaan, H.N.; Soufan, W.; El Sabah, A.; Islam, M.S. Seed Germination and Early Seedling Growth of Sorghum (Sorghum bicolor L. Moench) Genotypes Under Salinity Stress. Pol. Environ. Stud. 2024, 33, 3019–3032. [Google Scholar] [CrossRef]
  17. Khaliluev, M.R.; Bogoutdinova, L.R.; Raldugina, G.N.; Baranova, E.N. A Simple and Effective Bioassay Method Suitable to Comparative In Vitro Study of Tomato Salt Tolerance at Early Development Stages. Methods Protoc. 2022, 5, 11. [Google Scholar] [CrossRef]
  18. Gachon, C.; Mingam, A.; Charrier, B. Real-time PCR: What relevance to plant studies? J. Exp. Bot. 2004, 55, 1445–1454. [Google Scholar] [CrossRef] [PubMed]
  19. Lu, J.; Gao, Y.; Tian, L.; Ding, J.; Shao, G.; Zeng, Z.; Wang, J.; Su, D. Saline water irrigation induced differences in sodium ion distribution and tomato yield following drought hardening pre-treatment. Sci. Hortic. 2025, 350, 114285. [Google Scholar] [CrossRef]
  20. Guo, J.; Ling, H.; Wu, Q.; Xu, L.; Que, Y. The choice of reference genes for assessing gene expression in sugarcane under salinity and drought stresses. Sci. Rep. 2014, 4, 7042. [Google Scholar] [CrossRef]
  21. Souza, B.C.O.Q.; Andrade, E.S.; Ribeiro, C.C.; Santos, R.P.S.S.; Costa, L.C.; Tsehaye, Y.; Silva, M.L.S.; Araújo, W.L.; Marchiori, P.E.R.; Nascimento, V.L. The ethylene-insensitive tomato mutant Never ripe exhibits enhanced growth and phosphorus use efficiency under phosphorus stress. Plant Physiol. Biochem. 2025, 228, 110213. [Google Scholar] [CrossRef]
  22. Livak, K.J.; Schmittgen, T.D. Analysis of relative gene expression data using real-time quantitative PCR and the 2−ΔΔCT Method. Methods 2001, 25, 402–408. [Google Scholar] [CrossRef]
  23. Pfaffl, M.W.; Tichopad, A.; Prgomet, C.; Neuvians, T.P. Determination of stable housekeeping genes, differentially regulated target genes and sample integrity: BestKeeper-Excel-based tool using pair-wise correlations. Biotechnol. Lett. 2004, 26, 509–515. [Google Scholar] [CrossRef]
  24. Mestdagh, P.; Van Vlierberghe, P.; De Weer, A.; Muth, D.; Westermann, F.; Speleman, F.; Vandesompeleet, J. A novel and universal method for microRNA RT-qPCR data normalization. Genome Biol. 2009, 10, R64. [Google Scholar] [CrossRef]
  25. Andersen, C.L.; Jensen, J.L.; Orntoft, T.F. Normalization of real-time quantitative reverse transcription-PCR data: A model-based variance estimation approach to identify genes suited for normalization, applied to bladder and colon cancer data sets. Cancer Res. 2004, 64, 5245–5250. [Google Scholar] [CrossRef]
  26. Xie, F.; Wang, J.; Zhang, B. RefFinder: A web-based tool for comprehensively analyzing and identifying reference genes. Funct. Integr. Genom. 2023, 23, 125. [Google Scholar] [CrossRef] [PubMed]
  27. Murashige, T.; Skoog, F. A revised medium for rapid growth and bio assays with tobacco tissue cultures. Physiol. Plant. 1962, 15, 473–497. [Google Scholar] [CrossRef]
  28. Ben-Amar, A.; Allel, D.; Haouel, A.; Daldoul, S.; Zaghden, H.; Mliki, A. Overexpression of Grapevine Raffinose Synthase-Like Seed Imbibition Protein VvRS/SIP Gene Confers Salt Tolerance in Transgenic Tomato. J. Plant Growth Regul. 2025, 1–20. [Google Scholar] [CrossRef]
  29. Song, Y.; Wang, Y.; Guo, D.; Jing, L. Selection of reference genes for quantitative real-time PCR normalization in the plant pathogen Puccinia helianthi Schw. BMC Plant Biol. 2019, 19, 20. [Google Scholar] [CrossRef]
  30. Zhao, L.; Lu, J.; Zhang, J.; Wu, P.Y.; Yang, S.; Wu, K. Identification and characterization of histone deacetylases in tomato (Solanum lycopersicum). Front. Plant Sci. 2015, 5, 760. [Google Scholar] [CrossRef]
  31. Özdemir, Ö.Ü.; Yurt, K.; Pektaş, A.N.; Berk, Ş. Evaluation and normalization of a set of reliable reference genes for quantitative sgk-1 gene expression analysis in Caenorhabditis elegans-focused cancer research. Nucleosides Nucleotides Nucleic Acids 2025, 44, 91–110. [Google Scholar] [CrossRef]
  32. Yuan, Y.; Liu, C.; Bao, J.; Li, F. Selection and Validation of Appropriate Reference Genes for qRT-PCR Analysis of Iris germanica L. Under Various Abiotic Stresses. Food Sci. Nutr. 2025, 13, e4765. [Google Scholar] [CrossRef] [PubMed]
  33. Barrs, H.D. Determination of water deficits in plant tissue. In Water Deficits and Plant Growth, 1st ed.; Academic Press: New York, NY, USA, 1968; pp. 235–368. [Google Scholar]
  34. Papoui, E.; Koukounaras, A. Evaluation of Ascophyllum nodosum and Sargassum spp. Seaweed Extracts’ Effect on Germination of Tomato Under Salinity Stress. Horticulturae. 2025, 11, 290. [Google Scholar] [CrossRef]
  35. Tani, E.; Sarri, E.; Goufa, M.; Asimakopoulou, G.; Psychogiou, M.; Bingham, E.; Skaracis, G.N.; Abraham, E.M. Seedling growth and transcriptional responses to salt shock and stress in Medicago sativa L., Medicago arborea L., and their hybrid (Alborea). Agronomy 2018, 8, 231. [Google Scholar] [CrossRef]
  36. Alaguero-Cordovilla, A.; Gran-Gómez, F.J.; Tormos-Moltó, S.; Pérez-Pérez, J.M. Morphological characterization of root system architecture in diverse tomato genotypes during early growth. Int. J. Mol. Sci. 2018, 19, 3888. [Google Scholar] [CrossRef]
  37. Tal, M.; Shannon, M.C. Salt tolerance in the wild relatives of the cultivated tomato: Responses of Lycopersicon esculentum, L. cheesmanii, L. peruvianum, Solanum pennellii and F1 hybrids to high salinity. Aust. J. Plant Biol. 1983, 10, 109–117. [Google Scholar] [CrossRef]
  38. Vandesompele, J.; De Preter, K.; Pattyn, F.; Poppe, B.; Van Roy, N.; De Paepe, A.; Speleman, F. Accurate normalization of real-time quantitative RT-PCR data by geometric averaging of multiple internal control genes. Genome Biol. 2002, 3, research0034.1. [Google Scholar] [CrossRef]
  39. Kumar, S.; Muthukumar, M.; Bajpai, A.; Kushwaha, A.K.; Ahmad, I.; Bajpai, Y.; Singh, A.; Damodaran, T.; Trivedi, M. Selection and validation of stable reference genes in guava (Psidium guajava L.) for reliable and consistent gene expression analysis. Electron. J. Biotechnol. 2025, 75, 49–56. [Google Scholar] [CrossRef]
  40. Xie, F.; Xiao, P.; Chen, D.; Xu, L.; Zhang, B. miRDeepFinder: A miRNA analysis tool for deep sequencing of plant small RNAs. Plant Mol. Biol. 2012, 80, 75–84. [Google Scholar] [CrossRef]
  41. Liu, X.; Tang, S.; Gao, Y.; Zhang, X.; Dong, G.; Zhou, J.; Zhou, Y.; Yang, Z.; Huang, J.; Yao, Y. Rice Reference Genes: Redefining reference genes in rice by mining RNA-seq datasets. Plant Cell Physiol. 2025, 66, 120–132. [Google Scholar] [CrossRef]
  42. Shi, C.; Liu, B.; Song, L.; Tang, Y.; Chen, J.; Shen, X.; Peng, Y.; Yang, C.; Lu, G.; Deng, X.; et al. Physio-biochemical and dynamic transcriptome comparison of heat tolerance in wild and cultivated tomato accessions. Plant Growth Regul. 2025, 105, 1105–1123. [Google Scholar] [CrossRef]
  43. Bogoutdinova, L.R.; Lazareva, E.M.; Chaban, I.A.; Kononenko, N.V.; Dilovarova, T.; Khaliluev, M.R.; Kurenina, L.V.; Gulevich, A.A.; Smirnova, E.A.; Baranova, E.N. Salt Stress-Induced Structural Changes Are Mitigated in Transgenic Tomato Plants Over-Expressing Superoxide Dismutase. Biology 2020, 9, 297. [Google Scholar] [CrossRef]
  44. Chaban, I.A.; Kononenko, N.V.; Gulevich, A.A.; Bogoutdinova, L.R.; Khaliluev, M.R.; Baranova, E.N. Morphological Features of the Anther Development in Tomato Plants with Non-Specific Male Sterility. Biology 2020, 9, 32. [Google Scholar] [CrossRef]
  45. Singh, H.; Kumar, P.; Kumar, A.; Kyriacou, M.C.; Colla, G.; Rouphael, Y. Grafting Tomato as a Tool to Improve Salt-Tolerance. Agronomy 2020, 10, 263. [Google Scholar] [CrossRef]
  46. Dong, S.; Ling, J.; Song, L.; Zhao, L.; Wang, Y.; Zhao, T. Transcriptomic Profiling of Tomato Leaves Identifies Novel Transcription Factors Responding to Dehydration Stress. Int. J. Mol. Sci. 2023, 24, 9725. [Google Scholar] [CrossRef]
  47. Wei, K.; Li, X.; Cao, X.; Li, S.; Zhang, L.; Lu, F.; Wang, X. Candidate Gene Identification and Transcriptome Analysis of Tomato male sterile-30 and Functional Marker Development for ms-30 and Its Alleles, ms-33, 7B-1, and stamenless-2. Int. J. Mol. Sci. 2024, 25, 3331. [Google Scholar] [CrossRef]
  48. Guo, M.; Wang, X.S.; Guo, H.D.; Bai, S.Y.; Khan, A.; Wang, X.M.; Li, J.S. Tomato salt tolerance mechanisms and their potential applications for fighting salinity: A review. Front. Plant Sci. 2022, 13, 949541. [Google Scholar] [CrossRef]
  49. Bazihizina, N.; Colmer, T.D.; Cuin, T.A.; Mancuso, S.; and Shabala, S. Friend or foe? Chloride patterning in halophytes. Trends Plant Sci. 2019, 24, 142–151. [Google Scholar] [CrossRef]
  50. Joseph, J.T.; Poolakkalody, N.J.; Shah, J.M. Plant reference genes for development and stress response studies. J. Biosci. 2018, 43, 173–187. [Google Scholar] [CrossRef] [PubMed]
  51. López-Méndez, A.G.; Rodríguez-Pérez, J.E.; Mascorro-Gallardo, J.O.; Sahagún-Castellanos, J.; Lobato-Ortiz, R. Sodium chloride tolerance during germination and seedling stages of tomato (Solanum lycopersicum L.) lines native to Mexico. Horticulturae 2024, 10, 466. [Google Scholar] [CrossRef]
  52. Habibi, N.; Terada, N.; Sanada, A.; Koshio, K. Alleviating salt stress in tomatoes through seed priming with polyethylene glycol and sodium chloride combination. Stresses. 2024, 4, 210–224. [Google Scholar] [CrossRef]
  53. Sootahar, R.K.; Sootahar, M.K.; Rais, N.; Jamro, G.M.; Rais, M.U.N.; Iqbal, R.; Kumarasamy, V. In Vitro Early Vegetative Growth of Tomato (Solanum lycopersicum L.) Cultivars Under Salt Stress. Pol. J. Environ. Stud. 2024, 33, 5879–5885. [Google Scholar] [CrossRef]
  54. Sun, F.; Wang, Y.; Liu, G.; Fang, D.; Sun, M.; Bao, Z.; Ma, F. Salt stress induces SFT expression to promote early flowering and inhibits floral organ development by disturbing cell cycle in tomato. Veg. Res. 2024, 4, e019. [Google Scholar] [CrossRef]
  55. Sang, Q.; Shan, X.; An, Y.; Shu, S.; Sun, J.; Guo, S. Proteomic Analysis Reveals the Positive Effect of Exogenous Spermidine in Tomato Seedlings’ Response to High-Temperature Stress. Front. Plant Sci. 2017, 8, 120. [Google Scholar] [CrossRef] [PubMed]
  56. Al Hosni, A.; Joyce, D.C.; Hunter, M.; Perkins, M.; Al Yahyai, R. Altered calcium and potassium distribution maps in tomato tissues cultivated under salinity: Studies using X-ray fluorescence (XFM) microscopy. Irrig. Sci. 2025, 43, 613–636. [Google Scholar] [CrossRef]
  57. Garcia-Daga, S.; Roy, S.J.; Gilliham, M. Redefining the role of sodium exclusion within salt tolerance. Trends Plant Sci. 2025, 30, 137–146. [Google Scholar] [CrossRef]
  58. Du, J.; Xu, H.; Zhang, D.X.; Feng, S. Chelation and nanoparticle delivery of monomeric dopamine to increase plant salt stress resistance. Nat. Commun. 2025, 16, 4157. [Google Scholar] [CrossRef]
  59. Zhang, D.; Xu, F.; Wang, F.; Le, L.; Pu, L. Synthetic biology and artificial intelligence in crop improvement. Plant Commun. 2025, 6, 101220. [Google Scholar] [CrossRef]
  60. Wu, J.; Wang, J.; Pan, C.; Guan, X.; Wang, Y.; Liu, S.; He, Y.; Chen, J.; Chen, L.; Lu, G. Genome-wide identification of MAPKK and MAPKKK gene families in tomato and transcriptional profiling analysis during development and stress response. PLoS ONE 2014, 9, e103032. [Google Scholar] [CrossRef]
  61. Zhang, Y.; Han, X.; Chen, S.; Zheng, L.; He, X.; Liu, M.; Qiao, G.; Wang, Y.; Zhuo, R. Selection of suitable reference genes for quantitative real-time PCR gene expression analysis in Salix matsudana under different abiotic stresses. Sci. Rep. 2017, 7, 40290. [Google Scholar] [CrossRef]
  62. Bogoutdinova, L.R.; Khaliluev, M.R.; Chaban, I.A.; Gulevich, A.A.; Shelepova, O.V.; Baranova, E.N. Salt Tolerance Assessment of Different Tomato Varieties at the Seedling Stage. Horticulturae 2024, 10, 598. [Google Scholar] [CrossRef]
  63. Romaniuk-Drapała, A.; Kosicka-Noworzyń, K.; Sheng, Y.H.; Yohn, C.; Brunetti, L.; Kagan, L. Evaluation of reference genes for qPCR in human liver and kidney tissue from individuals with obesity. Sci. Rep. 2025, 15, 5347. [Google Scholar] [CrossRef] [PubMed]
  64. Xing, L.; Zhang, L.; Zheng, H.; Zhang, Z.; Luo, Y.; Liu, Y.; Wang, L. ZmmiR169q/ZmNF-YA8 is a module that homeostatically regulates primary root growth and salt tolerance in maize. Front. Plant Sci. 2023, 14, 1163228. [Google Scholar] [CrossRef]
  65. Dang, T.V.T.; Cho, H.S.; Lee, S.; Hwang, I. Salt stress-accelerated proteasomal degradation of LBD11 suppresses ROS-mediated meristem development and root growth in Arabidopsis. Plant Commun. 2025, 6, 101241. [Google Scholar] [CrossRef]
  66. Negi, Y.; Kumar, K. OsWNK9 mitigates salt stress by promoting root growth and stomatal closure in rice. Physiol. Plant. 2025, 177, e70129. [Google Scholar] [CrossRef]
  67. Li, J.; Jia, H.; Zhang, J.; Sun, P.; Li, M.; Hy, J. Selection of reliable reference genes for gene expression analysis under abiotic stresses in desert biomass willow, Salix psammophila. Front. Plant Sci. 2016, 7, 1505. [Google Scholar] [CrossRef]
  68. Hashemipetroudi, S.H.; Rezaei, A.; Kuhlmann, M. Validation of Reference Genes for Accurate RT-qPCR Normalization in Aeluropus littoralis Under Drought, Cold, and ABA Treatments. Agronomy 2025, 15, 1596. [Google Scholar] [CrossRef]
  69. Yang, X.; Xiong, J.; Du, X.; Sun, M.; Ding, L.; Mei, W.; Sun, Z.; Feng, N.; Zheng, D.; Shen, X. Effects of Exogenous Spermidine on Seed Germination and Physiological Metabolism of Rice Under NaCl Stress. Plants 2024, 13, 3599. [Google Scholar] [CrossRef]
  70. Liu, Y.; Zhu, C.; Lin, Z.; Li, H.; Di, X.; Yue, X.; Gao, Z. Systematic identification and validation of the reference genes from 447 transcriptome datasets of moso bamboo (Phyllostachys edulis). Hortic. Plant J. 2025, 11, 1353–1363. [Google Scholar] [CrossRef]
  71. Ghosh, U.K.; Islam, M.N.; Siddiqui, M.N.; Cao, X.; Khan, M.A.R. Proline, a multifaceted signalling molecule in plant responses to abiotic stress: Understanding the physiological mechanisms. Plant Biol. 2022, 24, 227–239. [Google Scholar] [CrossRef] [PubMed]
  72. Manan, A.; Ayyub, C.M.; Ahmad, R.; Bukhari, M.A.; Mustafa, Z. Salinity Induced Deleterious Effects on Biochemical and Physiological Processes of Tomato. Pak. J. Life Soc. Sci. 2016, 14, 83–90. [Google Scholar]
  73. Polash, M.A.S.; Sakil, M.A.; Tahjib-Ul-Arif, M.; Hossain, M. An Effect of salinity on osmolytes and relative water content of selected rice genotypes. Trop. Plant Res. 2018, 5, 227–232. [Google Scholar] [CrossRef]
  74. Kul, R.; Arjumend, T.; Ekinci, M.; Yildirim, E.; Turan, M.; Argin, S. Biochar as an organic soil conditioner for mitigating salinity stress in tomato. Soil Sci. Plant Nutr. 2021, 67, 693–706. [Google Scholar] [CrossRef]
  75. Fu, S.; Li, Y.; Liu, F.; Lu, C.; Liu, T.; Tian, S.; Chen, L. Structural and functional insights into NAC transcription factors in tomato stress responses and development. Biol. plantarum. 2025, 69, 49–57. [Google Scholar] [CrossRef]
  76. Filichkin, S.A.; Ansariola, M.; Fraser, V.N.; Megraw, M. Identification of transcription factors from NF-Y, NAC, and SPL families responding to osmotic stress in multiple tomato varieties. Plant Sci. 2018, 274, 441–450. [Google Scholar] [CrossRef]
  77. Chen, Y.P.; Hu, C.C.; Tsai, S.; Wen, Z.H.; Lin, C. Identification of housekeeping gene for future studies exploring effects of cryopreservation on gene expression in shrimp. Sci. Rep. 2025, 15, 11046. [Google Scholar] [CrossRef] [PubMed]
  78. Zhang, J.; Liu, X.; Yin, Z.; Zhao, T.; Du, D.; Li, J.; Zhu, M.; Sun, Y.; Pan, Y. Genome- and Transcriptome-Wide Characterization and Expression Analyses of bHLH Transcription Factor Family Reveal Their Relevance to Salt Stress Response in Tomato. Plants 2025, 14, 200. [Google Scholar] [CrossRef]
  79. Ait Hammou, R.; El Caid, M.B.; Harrouni, C.; Daoud, S. Germination enhancement, antioxidant enzyme activity, and metabolite changes in late Argania spinosa kernels under salinity. J. Arid. Environ. 2023, 219, 105095. [Google Scholar] [CrossRef]
  80. Mascia, T.; Santovito, E.; Gallitelli, D.; Cillo, F. Evaluation of reference genes for quantitative reverse-transcription polymerase chain reaction normalization in infected tomato plants. Mol. Plant Pathol. 2020, 11, 805–816. [Google Scholar] [CrossRef]
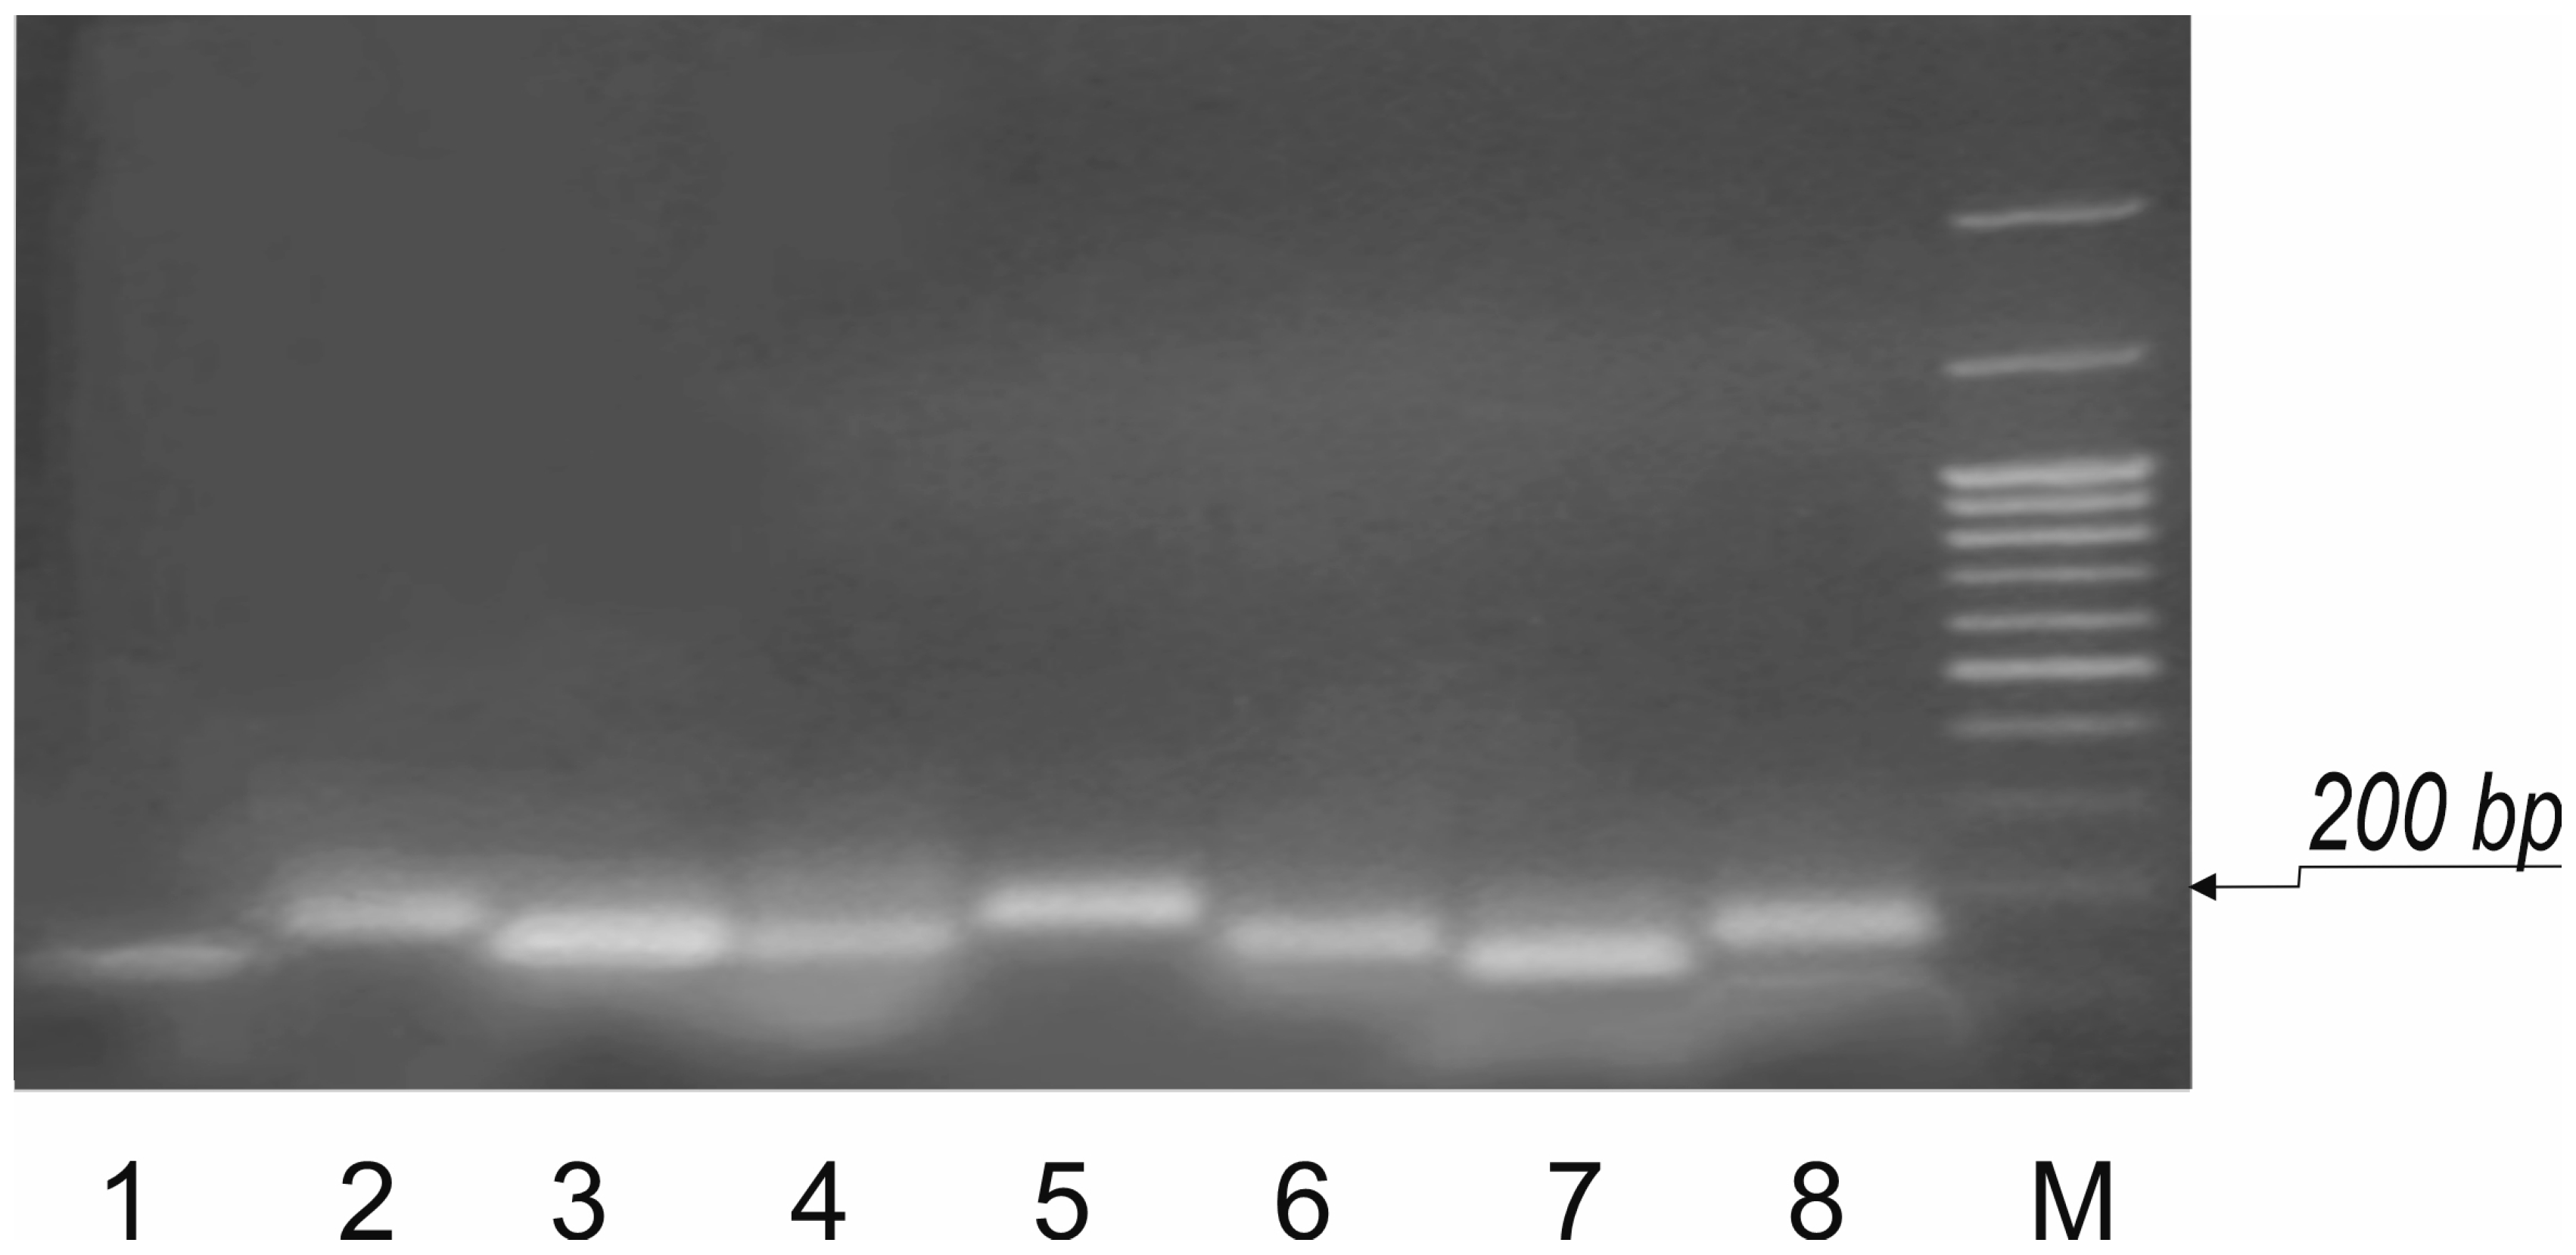
Figure 1. Performance of the HKGs of tomato plants under 8 days of in vitro cultivation and amplification primers. Amplicons obtained by qRT-PCR using cDNA as template, separated here by agarose gel electrophoresis. Primers were targeted to ACT (1)—107 bp, ELF (2) -158 bp, NFT-Y (3)—126 bp, GAPDH (4)—111 bp, TUB (5)—180 bp, PP2a (6)—149 bp, UBI (7)—120 bp, PGK (8)—162 bp, M: M27 (Sibenzyme, Novosibirsk, Russia).
Horticulturae 11 01249 g001
Figure 2. The expression profiles of the 8 candidate HKGs of YaLF line tomato plants in response to 100 mM NaCl, 8 days in vitro cultivation. (1) β-tubulin NM_001247878.2 (TUB), (2) nuclear transcript factor XM_026030313.2 (NFT-Y), (3) glyceraldehyde-3 phosphate dehydrogenase NM_001247874.2 (GAPDH), (4) elongation factor 1α X53043.1 (ELF1α), (5) actin BT013707.1 (ACT), (6) phosphoglycerate kinase XM_004243920.4 (PGK), (7) ubiquitin NM_001346406.1 (UBI), and (8) phosphatase 2A catalytic subunit NM_001247587.2 (PP2a). The box plot displays the distribution of Ct values (produced by the software package “R” (v4.2)).
Horticulturae 11 01249 g002
Figure 3. The expression profiles of the 8 candidate HKGs of Rekordsmen cv. tomato plants in response to 100 mM NaCl, 8 days in vitro cultivation. (1) β-tubulin NM_001247878.2 (TUB_Rek), (2) nuclear transcript factor XM_026030313.2 (NFT-Y_Rek), (3) glyceraldehyde-3 phosphate dehydrogenase NM_001247874.2 (GAPDH_Rek), (4) elongation factor 1α X53043.1 (ELF1_Rek), (5) actin BT013707.1 (ACT_Rek), (6) phosphoglycerate kinase XM_004243920.4 (PGK_Rek), (7) ubiquitin NM_001346406.1 (UBI_Rek), and (8) phosphatase 2A catalytic subunit NM_001247587.2 (PP2a_Rek). The box plot displays the distribution of Ct values (produced by the software package “R” (v4.2)).
Horticulturae 11 01249 g003
Figure 4. Stability of the 8 candidate HKGs of YaLF and Rekordsmen tomato plants in response to 100 mM NaCl, 8 days in vitro cultivation. Graphs showing the average of the standard deviation calculated by the delta Ct algorithm. The tomato reference genes were ranked according to increasing stability, with the most stable genes on the lower right. (a) YaLF line (1) β-tubulin NM_001247878.2 (TUB), (2) phosphatase 2A catalytic subunit NM_001247587.2 (PP2a), (3) phosphoglycerate kinase XM_004243920.4 (PGK), (4) elongation factor 1α X53043.1 (ELF1α), (5) glyceraldehyde-3 phosphate dehydrogenase NM_001247874.2 (GAPDH), (6) nuclear transcript factor XM_026030313.2 (NFT-Y), (7) ubiquitin NM_001346406.1 (UBI), and (8) actin BT013707.1 (ACT). (b) Rekordsmen cv. produced by SigmaPlot.
Horticulturae 11 01249 g004
Figure 5. Stability of the 8 candidate HKGs of YaLF and Rekordsmen tomato plants in response to 100 mM NaCl, 8 days in vitro cultivation. Graphs showing the standard deviation +Cp calculated by the BestKeeper algorithm (Appendix A, Table A2). The tomato reference genes were ranked according to increasing stability, with the most stable genes on the lower right. (a) YaLF line (1) β-tubulin NM_001247878.2 (TUB), (2) phosphoglycerate kinase XM_004243920.4 (PGK), (3) elongation factor 1α X53043.1 (ELF1α), (4) ubiquitin NM_001346406.1 (UBI), (5) nuclear transcript factor XM_026030313.2 (NFT-Y), (6) actin BT013707.1 (ACT), (7) phosphatase 2A catalytic subunit NM_001247587.2 (PP2a), and (8) glyceraldehyde-3 phosphate dehydrogenase NM_001247874.2 (GAPDH). (b) Rekordsmen cv. produced by Sigma Plot.
Horticulturae 11 01249 g005
Figure 6. Average expression stability of the 8 candidate HKGs of YaLF and Rekordsmen tomato plants in response to 100 mM NaCl, 8 days in vitro cultivation, calculated by the GeNorm algorithm. The tomato reference genes were ranked according to increasing stability, with the least stable genes on the right, YaLF line (light green). Rekordsmen cv (green).
Horticulturae 11 01249 g006
Figure 7. Average expression stability of the 8 candidate HKGs of YaLF and Rekordsmen tomato plants in response to 100 mM NaCl, 8 days in vitro cultivation, calculated by the NormFinder algorithm. The tomato reference genes were ranked according to increasing stability, with the least stable genes on the right. YaLF line (light green). Rekordsmen cv (green).
Horticulturae 11 01249 g007
Figure 8. Final stability rank of YaLF and Rekordsmen tomato plants in response to 100 mM NaCl, 8 days in vitro cultivation, calculated by the RefFinder algorithm, which included all four previous methods of statistical analysis that were summarized. The tomato reference genes were ranked according to increasing stability, with the least stable genes on the right. YaLF line (light green). Rekordsmen cv (green).
Horticulturae 11 01249 g008
Figure 9. Final poster of YaLF and Rekordsmen HKG expression profile in response to NaCl interaction.
Horticulturae 11 01249 g009
Figure 10. Pairwise variation (V) of 8 candidate HKGs of YaLF and Rekordsmen tomato plants in response to 100 mM NaCl, 8 days in vitro cultivation. Pairwise variation can be caused by increasing the number of normalization factors (reference genes) from two to three (V2/3). The next data points (V3/4 to V7/8) are generated by including less stable normalization factors sequentially. The RT-qPCR normalization calculation is more reliable when the V value decreases, suggesting a positive effect of an additional gene. Reliable values should be under a 0.15 border.
Horticulturae 11 01249 g010
Table 1. Ranking YaLF line HKGs in order of their expression stability, calculated by all algorithms.
GeneChangedSD,
BestKeeper
GeNormNormFinderFinal Rank
TUB0.8013.179.7294.45
PP2a0.670.796.1373.31
PGK0.641.257.876.633.83
ELF0.410.9910.647.265.47
GAPH0.390.5611.286.74.35
NFT-Y0.360.8310.498.956.5
UBI0.360.856.136.512.3
ACT0.250.8110.254.351.68
Varying orange color brightness shows the most stable genes (light) and the least stable (bright).
Table 2. Ranking Rekordsem c.v HKGs in order of their expression stability, calculated by all algorithms.
GeneSD,
∆Ct
SD,
BestKeeper
GeNorm NormFinder Final Rank
NFT-Y0.861.539.856.962.63
TUB0.381.279.386.161.41
ELF0.272.817.978.396.48
PP2a0.191.593.387.542.78
ACT0.190.496.587.393.93
PGK0.131.174.568.525.6
GAPH0.0650.218.6711.116.26
UBI0.0390.963.388.073.63
Varying orange color brightness shows the most stable genes (light) and the least stable (bright).
Disclaimer/Publisher’s Note: The statements, opinions and data contained in all publications are solely those of the individual author(s) and contributor(s) and not of MDPI and/or the editor(s). MDPI and/or the editor(s) disclaim responsibility for any injury to people or property resulting from any ideas, methods, instructions or products referred to in the content.