Abstract
The dried herb of blue fenugreek is used as a spice in the alpine region for the preparation of traditional bread and cheese. After drying, the herb is stored for a period of six to twelve months. During this time, the herb is expected to undergo changes in the compositions of the major flavor- and odor-determining compounds. To identify eventual biochemical processes, we applied different growing (conventional and sterile) and drying (air- and freeze drying) conditions and subsequently conducted periodical analysis of key aroma constituents (α-keto acids and volatile compounds) by LC-MS and GC-MS. The amount of glyoxylic acid was drastically increased in the air-dried sample, while the freeze-dried sample showed significantly higher amounts of α-keto-glutaric acid and pyruvic acid, respectively. During storage, a decrease in sulfuric compounds and an increase in alkane aldehydes were observed when comparing conventional and sterile samples. However, this increase was even greater for monoterpenes (especially camphor and p-cymene), showing thrice as high amounts after storage. Interestingly, both compounds were only formed significantly during the storage under conventional conditions, indicating that their production is induced/caused by microbial organisms.
1. Introduction
Trigonella caerulea (L.) Ser., also known as blue fenugreek, is an annual flowering plant of the Fabaceae family mainly found in southern and south-eastern Europe and northern Africa, where it is widely cultivated in gardens and fields [1]. The usage of blue fenugreek seeds is mainly present in the regional cuisines of the Caucasian region [2], while the herbal material is used in the alpine region as an additive for the preparation of traditional Schabziger cheese or for bread, hence explaining the common names Schabzigerklee and Brotklee [3]. In a recent study on the phytochemical composition of the herb of T. caerulea, a complex mixture of carbohydrates, flavonoids, fatty acids, α-keto acids, aldehydes, and monoterpenes was determined [4]. After the first qualitative study on blue fenugreek some forty years ago [5], this was the first quantitative evaluation of T. caerulea, yielding contents of ten different α-keto acids and eleven volatiles contributing to its particular aromatic profile.
However, it is reported that the fresh herb has nearly no flavor and that the characteristic aroma only develops during the drying and storage process of T. caerulea [6]. Therefore, traditional farmers from South Tyrol (Italy) keep the herb aside for a period of six to twelve months before it is made commercially available. During this time, the aroma of blue fenugreek should become even more intense. The storage and drying of plant material has already been reported as a major factor in the formation of aroma compounds caused by a multifaceted array of different oxidative, biochemical, and microbial interactions [7,8]. While other studies on T. foenum-graecum leaves have shown that certain compounds degrade during storage conditions, those compounds were often not directly attributing to the aromatic profile of the plant [9,10].
With α-keto acids being considered rather stable under dry conditions and the reported increase in the smell of blue fenugreek during storage, we hypothesized that long-term storage might also lead to differentiation of the volatile constituents. Therefore, in this study, T. caerulea was conventionally cultivated, dried, and periodically analyzed to identify the relevant biochemical changes. In the second part of our study, an experimental design was developed to better determine the origin of these transformational processes. This time, plants were grown under both conventional and sterile conditions and again periodically analyzed, with, however, an optimized analytical setup. While the initial GC-method for the analysis of volatiles showed a cut-off at the peak for tiglic aldehyde, we extended the scope of analyzed compounds by using a specialized stationary phase. Thus, very volatile compounds, e.g., short-chain alkanes, were also assessed in the second part of our study.
2. Materials and Methods
2.1. Plant Cultivation and Post-Harvest Studies
For the conventional cultivation of blue fenugreek, the plants were sown in a greenhouse on 9 April 2021 at Laimburg Research Centre (Italy) and transplanted to a field on 19 May 2021. The field site was located in Meran/Labers (NE-Italy, Province of Bolzano) at an altitude of 620 m above sea level with the following geographic coordinates: 46°40′01.74″ N; 11°11′48.02″ E. A randomized complete block design with three replicates was used to minimize variations. Plants were harvested on 13 July 2021 at full flowering with some first ripe seeds already visible. Entire aerial parts of the conventionally grown plants were dried at 30 °C in an air flow drying chamber (Frigotherm Ferrari GmbH, Lana, Italy) for 7 days. After drying, the plant material was stored in double-layer paper bags away from light at a temperature of 14 °C. For freeze-drying, fresh plant material was transported in cooling bags to Laimburg Research Centre, frozen at −18 °C, and lyophilized for 72 h.
For the cultivation of sterile plants, seeds were soaked for 20 min in 70% (vol/vol) ethanol and for 10 min in 35% (vol/vol) hydrogen peroxide. After being washed with sterile water three times, the seeds were incubated in sterile water on a gyratory shaker (130 rpm) at 28 °C for 24 h. The seeds of the plants were germinated on sterile wet filter paper in glass Petri dishes kept in the dark for 2–3 days at room temperature. The seedlings were cultivated in climate chambers (with 16 h light and 8 h dark cycles; temperature 24 °C; relative humidity 50%). The sterile plants were dried after harvest in the same manner as the conventionally grown plants with an air flow drying chamber UI-80 (Memmert GmbH, Büchenbach, Germany) and a freeze-dryer ScanVac Coolsafge 100-9 Pro (Labogene A/S, Bjarkesvey, Denmark) before analysis and storage. The seeds used for the cultivation experiments were ordered at Deaflora (Werder, Germany), and for all experiments, the same batch of seeds was used. The seed survival rate of sterile cultivation was approximately 30%.
Samples were analyzed for their profile and content on α-keto acids and volatile constituents one week after harvest, as well as after two, four, and six months of storage using a mix of the three field replicates. Lyophilized samples were analyzed at the beginning and at the end of the study.
2.2. Analysis of α-Keto Acids
One thousand milligrams of dried and ground plant material was extracted with pressurized solvent extraction (70 °C, 100 bar, 1 min heat up, 5 min hold, 2 min discharge) using one cycle of n-hexane and three cycles of methanol. The methanol extract was evaporated to dryness and reconstituted in 1000 µL of methanol. Next, 5 µL of the solution (or standard solution) was mixed with 45 µL of a mixture of acetonitrile and 0.1% (w/w) NaOH solution (1:1). Then, 20 µL of this mixture was treated with a mixture of 10 mg/mL PFBHA and kept at room temperature for 30 min before adding 10 µL of acetone and 100 µL of acetonitrile-NaOH 0.1% (w/w) solution (1:1). Quantitation of α-keto acids by LC-MS/MS was applied in multiple reaction mode using external calibration with α-keto acid standard solutions over a range of 0.9 to 600 µmol/L. UHPLC-MS/MS analyses were carried out on a Shimadzu Nexera 2 liquid chromatograph connected to an LC-MS triple quadrupole mass spectrometer using electrospray ionization (Shimadzu, Kyoto, Japan). A Phenomenex Kinetex Biphenyl column (100 × 2.1 mm, 1.7 µm particle size, Phenomenex, Aschaffenburg, Germany) was employed. Transitions used for quantification and respective collision energies are reported in a previous study [4].
2.3. Qualitative Analysis of Volatile Constituents
One hundred milligrams of dried and ground plant material was directly weighed into a 20 mL headspace vial; the vial was incubated for 30 min at a temperature of 90 °C. Next, 1000 µL of the headspace was taken with a heated syringe (100 °C) and injected into the GC-MS. Headspace GC-MS analyses were performed on a Trace 1310 gas chromatograph equipped with a programmed temperature vaporization (PTV) inlet and a TSQ Duo mass spectrometer (ThermoFisher Scientific, Waltham, MA, USA). The GC program was as follows: 35 °C hold 1 min, 5 °C/min to 120 °C and hold 1 min, 30 °C/min to 300 °C, and hold 1 min. The MS Source was set to 280 °C and the Scan was performed from 30 to 450 m/z.
2.4. Semi-Quantitative and Quantitative Analysis of Volatile Constituents
One hundred milligrams of dried and ground plant material was directly weighed into a 20 mL headspace vial. Then, 100 ng of internal standard (10 µL of 10 mg/L toluene-d5 in methanol) was added, and the vial was incubated for 30 min at a temperature of 90 °C. After that, 1000 µL of the headspace was taken with a heated syringe (100 °C) and injected into the GC-FID. Headspace GC-FID analyses were performed on a Trace 1310 gas chromatograph equipped with a Split-Splitless inlet (SSL) and an FID (ThermoFisher Scientific, Waltham, MA, USA). The GC program was as described above, and the FID temperature was set to 300 °C. Semi-quantitation of compounds was achieved by comparison of peak areas of each time point to the freeze-dried (control) sample and expressed in % of control. Quantification of compounds was achieved by external calibration using original reference standards. Odor activity values for each compound were calculated by dividing the obtained concentration by the respective olfactory activity threshold [11].
2.5. Statistical Analysis
Results are expressed as mean ± SD. Statistical analyses were performed with GraphPad Prism version 10.5.0 (GraphPad Software, San Diego, CA, USA) using t-test and one-way analysis of variance (ANOVA) followed by Tukey’s multiple comparison test where appropriate. For t-test analysis results, significance is expressed with asterisks for p < 0.05 (*) and p < 0.001 (**), whereas for ANOVA results, significance is indicated by letters.
3. Results
3.1. Changes in the α-Keto Acids During Drying and Storage
α-keto acids were determined over a period of six months, and the total content (Figure 1A)—as well as the contents of the three major α-keto acids, namely glyoxylic acid, α-ketoglutaric acid, and pyruvic acid—(Figure 1B–D) was monitored. Immediately after drying, both the conventionally dried sample and the freeze-dried control sample showed comparable results with total contents of 85 mg/kg and 93 mg/kg, respectively (Figure 1A). The content of the conventionally dried sample was found in the same range after two months of storage before it decreased after four and six months with total contents of 73 and 64 mg/kg, respectively. A look at the dynamics of glyoxylic acid (Figure 1B) showed a similar decrease, which was observed neither for α-ketoglutaric acid (Figure 1C) nor for pyruvic acid (Figure 1D).
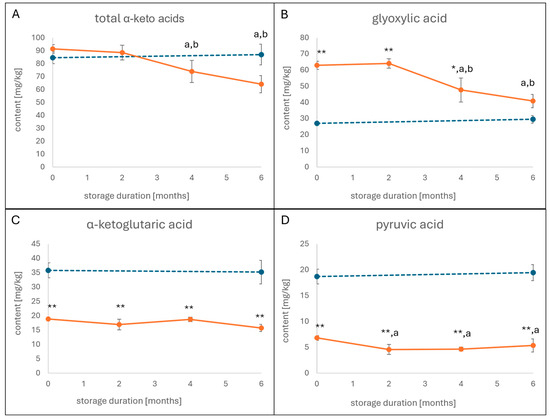
Figure 1.
Content of α-keto acids after conventional cultivation and drying over a storage period of six months (orange line). Total content of α-keto-acids (A) and the contents of glyoxylic acid (B), α-ketoglutaric acid (C), and pyruvic acid (D) were determined in two-month intervals and compared to the freeze-dried sample (blue dotted line). Error bars represent standard deviation. Statistical significance was calculated using a t-test between the conventionally dried and the freeze-dried samples, and here it is indicated with asterisks for p < 0.05 (*) and p < 0.001 (**), and statistical significance was calculated with ANOVA (p < 0.05 ) between time points, with significant differences expressed with letters (a = different from 0 months of storage; b = different from 2 months of storage).
Even more interesting was the comparison between the concentrations of the three major α-keto acids in the freeze-dried and the conventionally dried sample. In the conventionally dried sample, glyoxylic acid was present with a content of 63 mg/kg (Figure 1B), whereas the contents of α-ketoglutaric acid (Figure 1C) and pyruvic acid (Figure 1D) were at 19 and 6.8 mg/kg, respectively. The freeze-dried sample, in contrast, showed relatively low amounts of glyoxylic acid (27 mg/kg), while the concentrations of α-ketoglutaric acid and pyruvic acid were found at 36 and 19 mg/kg, thus being twice (α-ketoglutaric acid) and thrice (pyruvic acid) as high as in the conventionally dried sample. Of note, the observed excess of α-ketoglutaric acid and pyruvic acid in the freeze-dried sample amounted approximately to the difference in glyoxylic acid (Figure 1B–D).
3.2. Transformation of Volatile Constituents
Similarly to the results for the α-keto acids, the dynamics of the volatile constituents were investigated for eventual changes during drying and storage of blue fenugreek herb. The measuring intervals were as explained above. Compared to the commercial samples investigated in our previous study [4], the cultivated sample used for the post-harvest studies showed a higher overall content on volatiles. This was most evident for trans-menthone and camphor, with amounts of 14 and 24 mg/kg, respectively, and even more for p-cymene, which showed a concentration of 35 mg/kg. Interestingly, these three components were present at considerably lower amounts in the freeze-dried sample, which was therefore much richer in tiglic aldehyde, isobornyl acetate, and methyl benzoate.
A look at Figure 2 shows that in the case of tiglic aldehyde, most of the decrease occurs during drying, with less than half of the amount being present at the beginning of the storage (Figure 2A). However, during the time of storage, the amount of tiglic aldehyde was constantly decreasing, showing only about 15% of the control sample after six months. Another compound that was found to be slowly but constantly decreasing was methyl benzoate, with a loss of about 60% in six months of storage (Figure 2B). However, the content of methyl benzoate was not affected during drying.
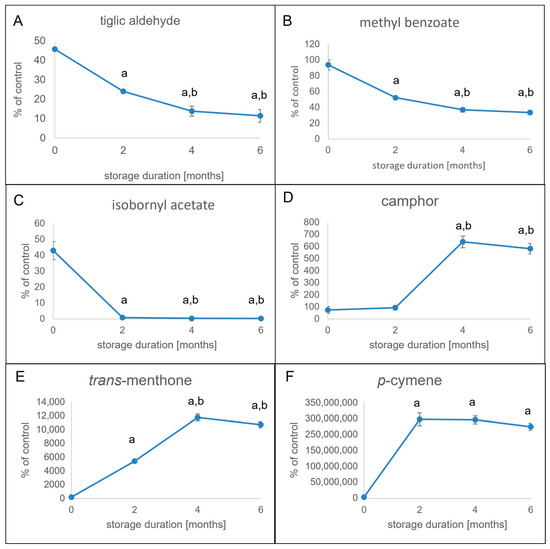
Figure 2.
Changes in volatiles after conventional cultivation and drying over a storage period of six months. Peak areas of volatiles were determined in two-month intervals and compared to those of the freeze-dried sample (control). Relative amounts are expressed in % of control. Error bars represent standard deviation. Statistical significance was calculated using ANOVA (p < 0.05) between time points and is expressed with letters (a = different from 0 months of storage; b = different from 2 months of storage). Tiglic aldehyde (A), methyl benzoate (B), isobornyl acetate (C), camphor (D), trans-menthone (E), and p-cymene (F) showed the most considerable changes and were therefore targets of the subsequent analyses.
A completely different result was observed for the relevant terpenoid volatiles in blue fenugreek herb. Isobornyl acetate was markedly present after drying but almost diminished after two months of storage (Figure 2C). At the same time, the amount of camphor was increasing and reached the initial concentration of isobornyl acetate after four months of storage (Figure 2D). Similar dynamics were observed for trans-menthone, which was scarcely present at the beginning of storage. However, the concentration during storage constantly rose and reached its final concentration after four months (Figure 2E). The dynamics of camphor and trans-menthone were even surpassed by p-cymene (Figure 2F). After not having been detected in the freeze-dried sample and only being scarcely present after conventional drying, the compound was found at its highest concentration after two months of storage.
3.3. Influence of Microbial Processes to the Aroma Profile
To assess the source of the above-mentioned changes in the aroma profile of T. caerulea, an experimental setup was designed to compare the changes in the volatile profile of the conventional stored herb with herbs grown under sterile conditions to better annotate the source of the transformational processes. Since secondary metabolites and especially volatile metabolites can differ on an enormous scale by natural variation already [12,13], the harvested herb was divided and analyzed before and after storage to further assess the transformational processes. While our previous work [4] and the first part of this study focused on the volatiles which could be easily separated via a semi-standard non-polar column in gas chromatography, for the second part of this study, a column with a cyanopropyl phenyl-modified dimethylpolysiloxane was used, allowing for the successful qualification and quantification of a series of even more volatile compounds (Figure 3, Table 1). Their presence was confirmed by comparing the mass spectra with public libraries. Retention indices (RI) were determined, since those compounds did not yet have been reported in terms of their RIs for the 624 stationary phase.
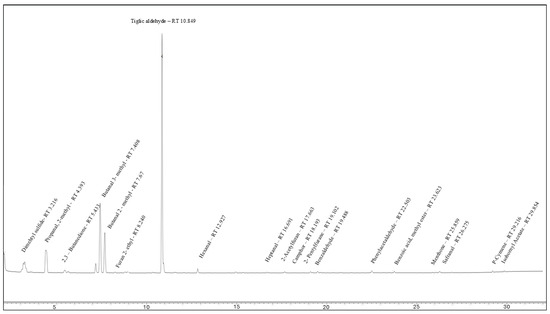
Figure 3.
GC-MS chromatogram of conventional dried herbs of T. caerulea, showing the superior separation of the volatiles on the 624 stationary phase and the excellent peak shape of the very volatiles.

Table 1.
Volatile compounds identified in T. caerulea herb, including their RIs on the 624 stationary phase. Compound classification was used for further analysis and based on the most prominent chemical feature of the compound.
Focusing on the compound classes in Table 1, changes in the volatile profile were monitored (Figure 4). Most notable were the changes in the monoterpene content and aromatic aldehyde, since they showed contrastive behavior during the drying processes under sterile and conventional conditions. The monoterpene content was raised significantly after storage under conventional conditions, though it did not change significantly under sterile conditions. The same behavior was observed for aromatic aldehydes, while alkane aldehydes, sulfuric compounds, and ketones showed similar patterns under conventional and sterile conditions. The changes in the content of furanes were also possibly contrastive, but the standard deviation is too big to properly annotate those changes to the different environments.
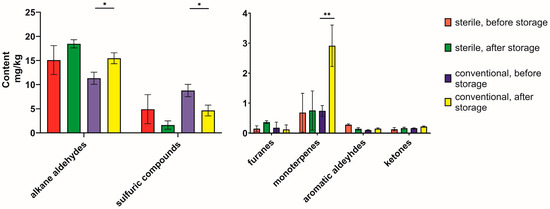
Figure 4.
Changes in content of volatiles during the six-month storage period under conventional vs. sterile conditions. The volatile compounds were grouped according to the classification in Table 1. Statistical significance was calculated using a t-test for each group (conventional or sterile) between the content before and after storage, and significant differences are indicated with asterisks for p < 0.05 (*) and p < 0.001 (**).
Additionally, the microbial influence on single compounds, i.e., the changes of the different monoterpenes, were evaluated (Figure 5 and Figure 6, Table 2). While a small camphor variability had already been observed before the storage period, in both cases and in both study lines, the amount only increased significantly under the conventional six-month storage period, while not being detectable in the sterile samples after the storage period (Figure 5). The change in the safranal content was more erratic and, therefore, most likely not dependent on microbial interactions. The trans-menthone content was problematic to evaluate since the content was below the limit of detection in three study lines (sterile, before storage; sterile, after storage; conventional, after storage). The decrease in isobornyl acetate as a likely precursor for the formation of camphor was visible but did not reach the significance threshold due to the high standard deviation. A clear influence of microbial influence was visible on the formation of p-cymene, which was only increased significantly under conventional conditions (Figure 6).
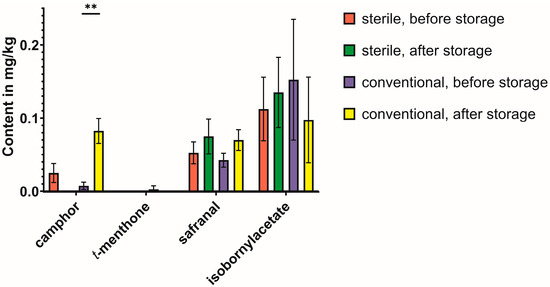
Figure 5.
Changes in content of monoterpenes (except p-cymene) during the six-month storage period under conventional vs. sterile conditions. The volatile compounds were grouped according to the classification in Table 1. Statistical significance was calculated using a t-test for each group (conventional or sterile) between the content before and after storage, and significant differences are indicated with asterisks for p < 0.001 (**).
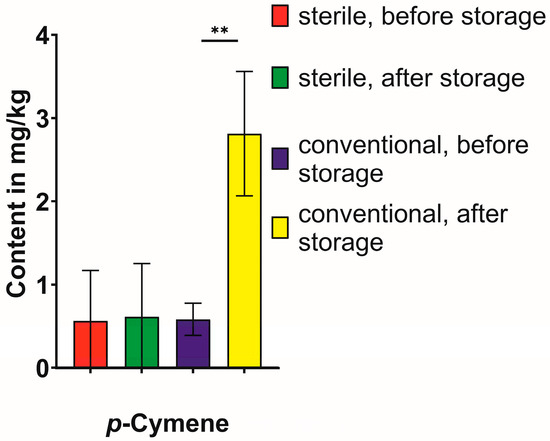
Figure 6.
Changes in content of p-cymene during the six-month storage period under conventional vs. sterile conditions. Statistical significance was calculated using a t-test for each group (conventional or sterile) between the content before and after storage, and significant differences are indicated with asterisks for p < 0.001 (**).

Table 2.
Quantification of the volatiles after a six-month storage period with a conventional storage method or a sterile method for the whole six-month storage period. The results are reported as the average content of the divided badges before and after storage (n = 6). Statistical significance was calculated using t-test for each group (conventional or sterile) between the content before and after storage, and significant differences are indicated with asterisks for p < 0.05 (*) and p < 0.001 (**).
4. Discussion
The transformational processes in T. caerulea herb show a complex mixture of decreases and increases in the contents of certain α-keto acids and volatiles, respectively. Therefore, α-keto acids not only represent flavor-contributing substances but also play a major role in biological systems, constituting the penultimate step in the biosynthesis of α-amino acids [14]. Conversely, they are the first degradation products in most microbial fermentation processes, before they are further metabolized to, e.g., aldehydes via decarboxylation [15]. This route of α-amino acid degradation also exists in plants, besides other routes, i.e., decarboxylation to primary amines or one-step transformation to aldehydes, respectively. When looking at the dynamics of α-keto acids during our post-harvest study, the degradation of α-amino acids via α-keto acids only seems to have been applied for glyoxylic acid (from glycine), as the compound was abundant in much lower amounts in the (freeze-dried) control sample. Pyruvic acid and α-ketoglutaric acid, in contrast, were present in much higher amounts in the control sample and thus in the living plant. Considering the abovementioned degradation pathway, their low amounts would result from decarboxylation reactions during the drying process, either mediated by microorganisms or the plant itself. In the case of glyoxylic acid, which starts to degrade after two months in the conventionally dried and stored sample, this process is more likely to be caused by microbial activity. However, glyoxylic acid has also been reported to play a major role in the conversion of α-amino acids into Strecker aldehydes, i.e., the formation of phenylacetaldehyde [16].
A better explanation for the increasing aroma intensity is biochemical processes within the measured volatiles during storage of the herb. In this regard, camphor, trans-menthone, and p-cymene were the most interesting constituents in the post-harvest study, with constantly increasing amounts during storage after being only slightly present (camphor, trans-menthone) or not even detected (p-cymene) after harvest. At the same time, the concentrations of tiglic aldehyde, methyl benzoate, and isobornyl acetate, as well as menthol, were found to decrease. However, the strong variety of the composition when setting up the sterile vs. conventional experiment showed that the standard deviation of some compounds is too high to certainly predict the faith of those compounds during the storage period. Still, the initial amounts of menthol and isobornyl acetate can be discussed as potential precusors for oxidative processes during storage to yield trans-menthone and camphor, respectively. For the conversion of isobornyl acetate to camphor, however, prior hydrolysis of the acid ester is necessary. Several microorganisms present on plant surfaces and/or in the soil are known to possess the respective hydrolases for this reaction, such as Moesziomyces antarcticus (syn. Candida antarctica/Pseudozyma antarctica, lipase A), Burkholderia gladioli (esterase B), or Rhodococcus rhodochrus (esterase C) [17,18,19,20]. However, as the amount of isobornyl acetate decreased to less than 50% during drying, this first step could result from residual plant enzymatic activity. The subsequent oxidation to camphor, in contrast, is less likely to be caused by the plant itself. Though there have been reports on plant species containing borneol dehydrogenases, e.g., Artemisia annua [21], Lavandula intermedia [22], or Salvia officinalis [23], the onset of camphor formation after two months of storage indicates microbial activity. Tsang et al. isolated a Pseudomonas strain from soil [24] which catalyzed the oxidation from borneol and isoborneol to camphor. The oxidation of menthol to trans-menthone might as well be mediated by microorganisms, as demonstrated for a Rhodococcus species isolated from sewage [25]. For p-cymene, instead, no potential conversion could be identified. Though more than 30 microorganisms have been reported to further metabolize p-cymene [26], no reports for the microbial formation of the compound were found. However, p-cymene is also known to undergo auto-oxidation [27], which could be a possible explanation for its rapid emergence compared to both camphor and trans-menthone. Still, this does not explain the high amount only being apparent in the conventionally grown sample. The role of metabolic pathways is only one explanation for the emergence of p-cymene, and what also has to be taken into account is the pure amount of p-cymene in the atmosphere and the emittance from neighboring plants and emission sites [28]. Cross-contamination during storage cannot be excluded by such a ubiquitous volatile organic contaminant.
In addition, our study revealed several very volatile constituents which also affect the aroma of blue fenugreek herb. These include acetaldehyde, an aldehyde with a pungent odor that has a reported odor detection threshold (ODT) of 0.05 mg/kg; propanal, with a fruity/pungent odor and an ODT of 0.002 mg/kg [29]; and 2-methyl-propanal, a branched aldehyde with a chocolate odor and an ODT of 0.001 mg/kg [30]. Other compounds contributing to the aromatic profile are dimethylsulfide, a sulfuric compound with a cabbage-like, rotten aroma and an ODT of 0.001 mg/kg [30]; 2,3-butanedione, a diketone with a buttery/sweet odor and an ODT of 0.025 µg/kg; and 3-methyl-butanal and 2-methyl-butanal, which are both reported to have a malty/chocolate odor and ODTs of 0.005 µg/kg and 0.004 mg/kg, respectively [30]. Concerning the previously reported content of aromatic compounds, it was reported that tiglic aldehyde, phenylacetaldehyde, n-hexanal, methyl benzoate, and trans-menthone were found to have a great impact on the aroma of blue fenugreek herb and that of traditional Schabziger cheese [4]. With respect to the very volatile components detected in this study, dimethylsulfide would reach the odor activity threshold when blue fenugreek is added in concentrations of 2.0 to 2.5%. However, it must be stated that dimethylsulfide is already one of the major aroma compounds in various cheeses [31,32]. Therefore, the very volatile compounds reported in this study will most probably not alter the aromatic profile of cheese, but it is possible that the dimethylsulfide aroma in the cheese is enhanced by the herb.
5. Conclusions
Using various analytical techniques, we deepened the understanding of the volatile profile of T. caerulea herb and tested the fate of key aroma compounds during drying and storage studies. While α-keto acids, as a key flavor contributor, were shifted towards the shorter types, the volatile compounds showed a more differentiated and drastic shift during drying and storage. The increase in monoterpenes and especially the contents of camphor and p-cymene was shown to most likely be influenced by microbial processes. Through the results of our study, a scientific explanation for the traditional agricultural practices in the alpine region is given, corroborating the aroma-increasing effect of storing the T. caerulea herb for a period of at least six months.
Author Contributions
Conceptualization, T.S. and S.S.Ç.; methodology, T.S. and S.S.Ç.; plant material, M.P.; plant cultivation A.C., S.K., D.O., and M.P.; resources, T.S., M.P., and S.S.Ç.; data curation, T.S., M.G.P., and S.S.Ç.; writing—original draft preparation, T.S. and S.S.Ç.; writing—review and editing, S.S.Ç.; visualization, T.S.; supervision, S.S.Ç.; project administration, S.S.Ç.; funding acquisition, M.P. and S.S.Ç. All authors have read and agreed to the published version of the manuscript.
Funding
We acknowledge the financial support provided by DFG within the funding program “Open-Access-Publikationskosten”, as well as the support provided by the Action Plan 2016–2022 for Research and Training in the Fields of Mountain Agriculture and Food Science of the Autonomous Province of Bolzano/Bozen.
Data Availability Statement
The raw data supporting the conclusions of this article will be made available by the authors on request.
Conflicts of Interest
The authors declare no conflicts of interest.
Abbreviations
The following abbreviations are used in this manuscript:
| SD | Standard Deviation |
| VOC | Volatile organic contaminant |
| LC/MS | Liquid chromatography/mass spectrometry |
| GC/MS | Gas chromatography/mass spectrometry |
| FID | Flame ionization detector |
References
- Seidemann, J. World Spice Plants, Economic Usages, Botany and Taxonomy; Springer: Berlin/Heidelberg, Germany, 2005. [Google Scholar]
- Rodov, V.; Vinokur, Y.; Gogia, N.; Chkhikvishvili, I. Hydrophilic and lipophilic antioxidant capacities of Georgian spices for meat and their possible health implications. Georgian Med. News 2010, 179, 61–66. [Google Scholar]
- Pramsohler, M.; Castellan, A.; Pérez, M.G.; Çiçek, S.S. Agronomische und phytochemische Charakterisierung von Brotklee-Landsorten. Julius-Kühn-Archiv. 2023, 4769, 60. [Google Scholar] [CrossRef]
- Ayvazyan, A.; Stegemann, T.; Galarza Pérez, M.; Pramsohler, M.; Çiçek, S.S. Phytochemical Profile of Trigonella caerulea (Blue Fenugreek) Herb and Quantification of Aroma-Determining Constituents. Plants 2023, 12, 1154. [Google Scholar] [CrossRef]
- Ney, K.H. Untersuchung des Aromas von Ziegerklee (Coerulea mellilotus), der Schluesselverbindungen des Aromas von Schabzieger (Schweizer Kraeuterkaese). Gordian 1986, 86, 9–10. [Google Scholar]
- Dachler, M.; Pelzmann, H. Arznei- und Gewürzpflanzen; Cadmos: Vienna, Austria, 2017. [Google Scholar]
- Azarnia, S.; Boye, J.I.; Warkentin, T.; Malcolmson, L. Changes in volatile flavour compounds in field pea cultivars as affected by storage conditions. Int. J. Food Sci. Technol. 2011, 46, 2408–2419. [Google Scholar] [CrossRef]
- Laksana, A.J.; Choi, Y.-M.; Kim, J.-H.; Kim, B.-S.; Kim, J.-Y. Real-Time Monitoring the Effects of Storage Conditions on Volatile Compounds and Quality Indexes of Halal-Certified Kimchi during Distribution Using Electronic Nose. Foods 2022, 11, 2323. [Google Scholar] [CrossRef]
- Yadav, S.K.; Sehgal, S. Effect of home processing and storage on ascorbic acid and beta-carotene content of Bathua (Chenopodium album) and fenugreek (Trigonella foenum graecum) leaves. Plant Foods Hum. Nutr. 1997, 50, 239–247. [Google Scholar] [CrossRef] [PubMed]
- Bonnie, T.P.; Choo, Y.M. Oxidation and thermal degradation of carotenoids. J. Oil Palm Res. 1999, 11, 62–78. [Google Scholar]
- Grosch, W. Detection of potent odorants in foods by aroma extract dilution analysis. Trends Food Sci. Technol. 1993, 4, 68–73. [Google Scholar] [CrossRef]
- Stegemann, T.; Kruse, L.H.; Brütt, M.; Ober, D. Specific Distribution of Pyrrolizidine Alkaloids in Floral Parts of Comfrey (Symphytum officinale) and its Implications for Flower Ecology. J. Chem. Ecol. 2019, 45, 128–135. [Google Scholar] [CrossRef]
- Mohammed, H.A.; Abd-Elraouf, M.; Sulaiman, G.M.; Almahmoud, S.A.; Hamada, F.A.; Khan, R.A.; Hegazy, M.M.; Abd-El-Wahab, M.F.; Kedra, T.A.; Ismail, A. Variability in the volatile constituents and biological activities of Achillea millefolium L. essential oils obtained from different plant parts and by different solvents. Arab. J. Chem. 2023, 16, 105103. [Google Scholar] [CrossRef]
- Song, Y.; Li, J.; Shin, H.; Liu, L.; Du, G.; Chen, J. Biotechnological production of alpha-keto acids: Current status and perspectives. Bioresour. Technol. 2016, 219, 716–724. [Google Scholar] [CrossRef]
- Gonda, I.; Bar, E.; Portnoy, V.; Lev, S.; Burger, J.; Schaffer, A.A.; Tadmor, Y.; Gepstein, S.; Giovannoni, J.J.; Katzir, N.; et al. Branched-chain and aromatic amino acid catabolism into aroma volatiles in Cucumis melo L. fruit. J. Exp. Bot. 2010, 61, 1111–1123. [Google Scholar] [CrossRef]
- Hidalgo, F.J.; Delgado, R.M.; Zamora, R. Intermediate role of α-keto acids in the formation of Strecker aldehydes. Food Chem. 2013, 141, 1140–1146. [Google Scholar] [CrossRef] [PubMed]
- Calderini, E.; Drienovská, I.; Myrtollari, K.; Pressnig, M.; Sieber, V.; Schwab, H.; Hofer, M.; Kourist, R. Simple Plug-In Synthetic Step for the Synthesis of (-)-Camphor from Renewable Starting Materials. ChemBioChem 2021, 22, 2951–2956. [Google Scholar] [CrossRef] [PubMed]
- Stoyanova, M.; Pavlina, I.; Moncheva, P.; Bogatzevska, N. Biodiversity and Incidence of Burkholderia Species. Biotechnol. Biotechnol. Equip. 2007, 21, 306–310. [Google Scholar] [CrossRef]
- Finnerty, W.R. The biology and genetics of the genus Rhodococcus. Annu. Rev. Microbiol. 1992, 46, 193–218. [Google Scholar] [CrossRef]
- Li, Y.-M.; Shivas, R.G.; Li, B.-J.; Cai, L. Diversity of Moesziomyces (Ustilaginales, Ustilaginomycotina) on Echinochloa and Leersia (Poaceae). MycoKeys 2019, 52, 1–16. [Google Scholar] [CrossRef]
- Polichuk, D.R.; Zhang, Y.; Reed, D.W.; Schmidt, J.F.; Covello, P.S. A glandular trichome-specific monoterpene alcohol dehydrogenase from Artemisia annua. Phytochemistry 2010, 71, 1264–1269. [Google Scholar] [CrossRef]
- Sarker, L.S.; Galata, M.; Demissie, Z.A.; Mahmoud, S.S. Molecular cloning and functional characterization of borneol dehydrogenase from the glandular trichomes of Lavandula × intermedia. Arch. Biochem. Biophys. 2012, 528, 163–170. [Google Scholar] [CrossRef]
- Drienovská, I.; Kolanović, D.; Chánique, A.; Sieber, V.; Hofer, M.; Kourist, R. Molecular cloning and functional characterization of a two highly stereoselective borneol dehydrogenases from Salvia officinalis L. Phytochemistry 2020, 172, 112227. Phytochemistry 2020, 172, 112227. [Google Scholar] [CrossRef] [PubMed]
- Tsang, H.-L.; Huang, J.-L.; Lin, Y.-H.; Huang, K.-F.; Lu, P.-L.; Lin, G.-H.; Khine, A.A.; Hu, A.; Chen, H.-P. Borneol Dehydrogenase from Pseudomonas sp. Strain TCU-HL1 Catalyzes the Oxidation of (+)-Borneol and Its Isomers to Camphor. Appl. Environ. Microbiol. 2016, 82, 6378–6385. [Google Scholar] [CrossRef] [PubMed]
- Shukla, O.P.; Bartholomus, R.C.; Gunsalus, I.C. Microbial transformation of menthol and menthane-3,4-diol. Can. J. Microbiol. 1987, 33, 489–497. [Google Scholar] [CrossRef]
- Jivishov, E.; Kırımer, N.; İşcan, G.; Demirci, F. Microbial transformation of p-cymene. Nat. Volatiles Essent. Oils 2016, 3, 18–22. [Google Scholar]
- Poulose, A.J.; Croteau, R. Biosynthesis of aromatic monoterpenes: Conversion of gamma-terpinene to p-cymene and thymol in Thymus vulgaris L. Arch. Biochem. Biophys. 1978, 187, 307–314. [Google Scholar] [CrossRef]
- Davoli, E.; Gangai, M.L.; Morselli, L.; Tonelli, D. Characterisation of odorants emissions from landfills by SPME and GC/MS. Chemosphere 2003, 51, 357–368. [Google Scholar] [CrossRef]
- Cometto-Muñiz, J.E.; Abraham, M.H. Odor detection by humans of lineal aliphatic aldehydes and helional as gauged by dose-response functions. Chem. Senses 2010, 35, 289–299. [Google Scholar] [CrossRef]
- Ranau, R.; Steinhart, H. Identification and evaluation of volatile odor-active pollutants from different odor emission sources in the food industry. Eur. Food Res. Technol. 2005, 220, 226–231. [Google Scholar] [CrossRef]
- Burbank, H.M.; Qian, M.C. Volatile sulfur compounds in Cheddar cheese determined by headspace solid-phase microextraction and gas chromatograph-pulsed flame photometric detection. J. Chromatogr. A 2005, 1066, 149–157. [Google Scholar] [CrossRef]
- Parliment, T.H.; Kolor, M.G.; Rizzo, D.J. Volatile components of Limburger cheese. J. Agric. Food Chem. 1982, 30, 1006–1008. [Google Scholar] [CrossRef]
Disclaimer/Publisher’s Note: The statements, opinions and data contained in all publications are solely those of the individual author(s) and contributor(s) and not of MDPI and/or the editor(s). MDPI and/or the editor(s) disclaim responsibility for any injury to people or property resulting from any ideas, methods, instructions or products referred to in the content. |
© 2025 by the authors. Licensee MDPI, Basel, Switzerland. This article is an open access article distributed under the terms and conditions of the Creative Commons Attribution (CC BY) license (https://creativecommons.org/licenses/by/4.0/).