Article

Image-Based Detection of Chinese Bayberry (Myrica rubra) Maturity Using Cascaded Instance Segmentation and Multi-Feature Regression

1
Fine Arts College, Henan University, Kaifeng 475000, China
2
State Key Laboratory for Managing Biotic and Chemical Threats to Quality and Safety of Agro-Products, Institute of Horticulture, Zhejiang Academy of Agricultural Sciences, 298 Desheng Road, Shangcheng District, Hangzhou 310021, China
3
Xianghu Laboratory, 168 Gengwen Road, Xiaoshan District, Hangzhou 311231, China
*
Authors to whom correspondence should be addressed.
Horticulturae 2025, 11(10), 1166; https://doi.org/10.3390/horticulturae11101166
Submission received: 19 August 2025 / Revised: 28 September 2025 / Accepted: 29 September 2025 / Published: 1 October 2025

Abstract

The accurate assessment of Chinese bayberry (Myrica rubra) maturity is critical for intelligent harvesting. This study proposes a novel cascaded framework combining instance segmentation and multi-feature regression for accurate maturity detection. First, a lightweight SOLOv2-Light network is employed to segment each fruit individually, which significantly reduces computational costs with only a marginal drop in accuracy. Then, a multi-feature extraction network is developed to fuse deep semantic, color (LAB space), and multi-scale texture features, enhanced by a channel attention mechanism for adaptive weighting. The maturity ground truth is defined using the a*/b* ratio measured by a colorimeter, which correlates strongly with anthocyanin accumulation and visual ripeness. Experimental results demonstrated that the proposed method achieves a mask mAP of 0.788 on the instance segmentation task, outperforming Mask R-CNN and YOLACT. For maturity prediction, a mean absolute error of 3.946% is attained, which is a significant improvement over the baseline. When the data are discretized into three maturity categories, the overall accuracy reaches 95.51%, surpassing YOLOX-s and Faster R-CNN by a considerable margin while reducing processing time by approximately 46%. The modular design facilitates easy adaptation to new varieties. This research provides a robust and efficient solution for in-field bayberry maturity detection, offering substantial value for the development of automated harvesting systems.

1. Introduction

Chinese bayberry (Myrica rubra), a subtropical evergreen fruit tree belonging to the Myricaceae family, is predominantly found in Southern China and other Asian countries [1]. The bayberry fruit, known for its distinctive taste and nutritional benefits, has gained significant economic value and consumer interest in recent years. Chinese bayberries are particularly recognized for their high content of anthocyanins and various flavonoid substances, which are critical secondary metabolites in plants [2]. Chinese bayberry requires precise maturity detection to optimize harvest timing, postharvest storage management, and commercial distribution [3,4]. Traditionally, maturity levels have been predominantly determined through manual assessment, which is a method constrained by inherent limitations, including subjectivity, inefficiency, and limited accuracy [5]. With rapid advancements in computer vision and deep learning, non-destructive inspection techniques based on image processing and machine learning have attracted increasing attention, providing viable solutions for intelligent and automated Chinese bayberry harvesting [6,7].
Research on Chinese bayberry maturity detection has primarily focused on machine vision and deep learning approaches [8]. In one study, an enhanced YOLOX-NANO algorithm incorporating channel attention modules and focal loss functions achieved a 92.67% recognition accuracy for Chinese bayberry at varying maturity stages. Alternatively, the integration of machine vision with electronic nose technology has been explored, demonstrating the feasibility of non-destructive quality assessments for external Chinese bayberry characteristics [9,10]. Internationally, fruit maturity detection technologies have advanced considerably, encompassing diverse non-destructive methods, including near-infrared spectroscopy, electronic noses, and machine vision [11,12,13]. For instance, quantitative analysis of internal fruit quality has been conducted using machine vision combined with partial least squares regression (PLSR) and least-squares support vector machines (LS-SVM) [14,15]. In addition, watermelon maturity classification has been investigated using fused audio and near-infrared spectral techniques, expanding the application scope of non-destructive detection methodologies [16,17,18].
However, several critical limitations persist in existing methodologies: (1) insufficient adaptability to complex orchard environments, where performance is significantly compromised under varying illumination and foliage occlusion [19,20,21]; (2) limited detection accuracy for overlapping fruits, which hinders precise differentiation of densely clustered specimens [22,23]; and (3) predominant reliance on discrete classification for maturity assessment, which fails to capture continuous ripening dynamics [24]. Therefore, a cascaded instance segmentation and multi-feature regression framework is proposed for Chinese bayberry maturity detection. The relevance and added value of this framework, compared to conventional end-to-end detection methods, are threefold: (1) It provides superior accuracy and robustness. Each module can be optimized independently by decoupling the complex task into two specialized stages. The instance segmentation stage accurately isolates individual fruits, even under occlusion and overlap, effectively eliminating background interference that often misleads single-stage detectors. The following regression stage, focusing only on the cropped fruit region, leverages a dedicated network (MFENet) to fuse heterogeneous features (semantic, color, texture) that are essential for fine-grained maturity assessment, resulting in more precise predictions than classification-based approaches. (2) It provides significant practical advantages through its modular and efficient design. The lightweight SOLOv2-Light model ensures high-speed processing, making the system suitable for real-time applications. (3) It enables a more informative, continuous output. Unlike methods that simply classify maturity into discrete stages, our regression approach provides a continuous maturity value. This approach integrates deep semantic features, color spatial distributions, and texture characteristics, enhanced through a channel attention mechanism for adaptive feature weighting, improving detection precision and environmental robustness. A modular design strategy is employed, decoupling segmentation and regression models to facilitate system extensibility and optimization.

2. Materials and Methods

This study was conducted in a Chinese bayberry (Myrica rubra) orchard in Taizhou City (120°34′ E, 28°50′ N), Zhejiang Province. The experimental variety was ‘Dong Kui’ Chinese bayberry. The study begins with a quantitative and qualitative evaluation of the Chinese bayberry segmentation model, followed by an ablation study conducted on the regression model, and concludes with the presentation of maturity recognition results achieved by the proposed algorithm.

2.1. Experimental Environment

Experiments were conducted on the following hardware platform: an NVIDIA GeForce RTX 4060 Ti GPU (8 GB VRAM), Intel i5-12400 CPU, and 32 GB RAM. The software environment was configured with Python 3.8.19, PyTorch 2.1.2, CUDA 12.8, and the Windows 11 Professional operating system.

2.2. Allocation of the Dataset

The CIELAB color space was separated into luminance (L) from color (a, b), making it more robust to illumination changes. This enables applying CLAHE only on the L channel without distorting color information, which is critical for maturity assessment. The experimental dataset was randomly divided into training, validation, and test sets at a 6:2:2 (train/val/test) ratio. Targeted data augmentation strategies were implemented to enhance model generalization capability. Augmentation strategies included random flipping, rotation (±15°), multi-scale training, and CLAHE preprocessing. For instance, in segmentation tasks, data diversity was increased through random horizontal flipping and multi-scale training, with scales set as (1333, 800), (1333, 768), (1333, 736), (1333, 704), (1333, 672), and (1333, 640). In maturity regression tasks, random flipping, rotation (±15°), and crop-scaling operations were applied to simulate real-world perspective variations. These augmentation techniques effectively expanded the training samples while improving environmental robustness.

2.3. Color Evaluation Indicators

The color of Chinese bayberry fruits was recorded using a handheld colorimeter (CR-10, Konica Minolta Holdings, Tokyo, Japan), providing maturity values. After the fruit ripens, the a*/b* ratio will enter a plateau stage. Subsequently, the value will rise slightly. We consider the average value of this plateau stage as the standard for fruit ripeness. For the instance segmentation model, transfer learning was applied using COCO pre-trained weights for fine-tuning. The SGD optimizer was configured with a momentum of 0.9 and a weight decay of 1 × 10⁻⁴. A learning rate scheduling strategy combining warmup and multi-step decay was implemented, with the initial rate set to 1.25 × 10⁻³. Focal Loss and Dice Loss were combined for the classification and segmentation tasks, respectively.
In the maturity regression model, the AdamW optimizer was employed, with weight decay set to 2 × 10⁻³. OneCycleLR scheduling was adopted, with the maximum learning rate set to 5 × 10⁻³ and dynamically adjusted using cosine annealing. SmoothL1Loss was used (β = 0.5), ensuring precise gradient information while maintaining convergence stability.
To ensure fair comparison and reproducibility, all models in this study were trained using carefully selected hyperparameters and data augmentation strategies, which are detailed below.

2.3.1. Instance Segmentation Model (SOLOv2-Light) Training

The SOLOv2-Light model was trained using a transfer learning strategy. The model was initialized with weights pre-trained on the COCO dataset [Citation for COCO or SOLOv2 paper here, if not already cited]. Optimizer: Stochastic Gradient Descent (SGD) with a momentum of 0.9 and weight decay of 1 × 10⁻⁴. Learning Rate Schedule: A warmup strategy was applied for the first 500 iterations, after which a multi-step decay policy was used. The initial learning rate was set to 1.25 × 10⁻³ and was reduced by a factor of 10 at epochs 24 and 33. Batch Size: Training was conducted with a batch size of 8 per GPU (1 GPU used). Epochs: The model was trained for a total of 36 epochs. Loss Function: The total loss is a combination of Focal Loss for the category classification branch and Dice Loss for the mask prediction branch, following the standard SOLOv2 framework. Data Augmentation: To enhance the model’s robustness and generalization, the following augmentations were applied during training: Random Horizontal Flipping: Applied with a probability of 0.5. Multi-scale Training: The shorter side of input images was randomly resized to one of the following scales: [640, 672, 704, 736, 768, 800] pixels, while the longer side was capped at 1333 pixels.

2.3.2. Maturity Regression Model (MFENet) Training

The MFENet was trained from scratch on the extracted single-bayberry dataset. Optimizer: AdamW was used with a weight decay of 2 × 10⁻³. Learning Rate Schedule: The OneCycleLR policy was employed with a maximum learning rate of 5 × 10⁻³. This scheduler anneals the learning rate using a cosine function after the warm-up phase. Batch Size: A batch size of 32 was used. Epochs: The model was trained for 100 epochs. Loss Function: Smooth L1 Loss (β = 0.5) was chosen for its robustness in regression tasks, as it is less sensitive to outliers than Mean Squared Error. Data Augmentation: The following augmentations were applied to the cropped fruit images to simulate variations in the field of view and orientation: Random Horizontal and Vertical Flipping: Applied with a probability of 0.5. Random Rotation: Images were rotated randomly within a range of ±15 degrees. Random Cropping and Scaling: Random crops covering between 80% and 100% of the original image area were taken, followed by resizing back to the model’s input size (224 × 224 pixels).

2.3.3. Dataset Partitioning

The entire dataset was randomly partitioned into three sets to ensure a rigorous evaluation: Training Set: 60% of the data (240 images for segmentation, ~526 images for regression) was used for model training. Validation Set: 20% of the data (80 images for segmentation, ~175 images for regression) was used for hyperparameter tuning and early stopping. Test Set: 20% of the data (80 images for segmentation and ~175 images for regression) was held out for the final evaluation reported in the results.

2.4. Performance Indicators

(1) Instance Segmentation Performance Evaluation
The main challenges (overlap and occlusion) in the orchard environment directly affect the model’s ability to generate complete and accurate masks. ISPE metrics (such as mAP under different IoU thresholds) can quantify the robustness of the model in these complex scenarios. Mask Mean Average Precision (mAP) was adopted as the primary evaluation metric for instance segmentation performance, calculated as follows:
m A P = 1 | I o U | r I o U A P r
The metric represents the average precision across various Intersection over Union (IoU) thresholds. The IoU threshold range was set from 0.5 to 0.95 with a step size of 0.05. In addition, AP50 and AP75 were reported to evaluate segmentation performance under different precision requirements.
(2) Maturity Recognition Performance Evaluation
Maturity recognition performance was evaluated using the Mean Absolute Error (MAE) and the Root Mean Square Error (RMSE). MAE represents the average absolute difference between predicted and observed values, whereas RMSE denotes the sample standard deviation of residuals (prediction errors), exhibiting greater sensitivity to outliers.
M A E = 1 n i = 1 n | y i y ^ i |
R M S E = 1 n i = 1 n ( y i y ^ i ) 2 ,
where y i is the true value, y ^ i is the predicted value, and n is the number of data points.
(3) Computational Efficiency Metrics
Model computational efficiency was assessed based on model size and computational complexity (FLOPs). Model size, expressed in megabytes (MB), quantifies architectural complexity, while FLOPs (Floating Point Operations) indicate the number of floating-point computations, serving as a measure of operational complexity.
Through this comprehensive metric framework, model performance was holistically evaluated across multiple dimensions: instance segmentation capability reflects contour delineation accuracy for Chinese bayberry; maturity recognition performance demonstrates prediction precision for ripeness stages; and computational efficiency metrics are assessed in terms of deployment practicality. Comparative analyses against established baseline methods will be presented in subsequent experiments to validate the proposed method’s effectiveness for Chinese bayberry maturity detection tasks.

2.5. Overall Design of the Cascading Framework

A cascaded architecture-based approach was developed for Chinese bayberry maturity detection. It enables end-to-end recognition from raw images to maturity prediction through the coordinated operation of two core modules: instance segmentation and maturity regression. Figure 1 indicates that a sequential processing pipeline was implemented.
An enhanced SOLOv2-Light model was applied in the instance segmentation phase to process input images. Instance masks were generated using dynamic convolution strategies, achieving precise segmentation of individual Chinese bayberry fruits. This mask-based approach effectively eliminated background interference while accurately handling complex scenarios involving overlapping fruits. The lightweight network design significantly reduced computational overhead, enhancing the feasibility of practical deployment.
The segmented Chinese bayberry instances were processed by the MFENet during the maturity regression stage. Multiple feature extraction branches were integrated to combine deep semantic features, color characteristics, and textural patterns, enabling accurate maturity prediction. A channel attention mechanism was incorporated to strengthen the perception of critical features, thus improving prediction accuracy and robustness.
This cascaded architecture provides advantages. First, task decoupling allows independent module optimization, enabling targeted problem-solving. Second, the sequential processing flow improves system efficiency. Finally, the modular design facilitates system extensibility, as new varieties can be accommodated by retraining only the corresponding regression model. These characteristics collectively ensure high adaptability and scalability in practical applications.

2.6. Lightweight Instance Segmentation Model

2.6.1. SOLOv2 Model Network Architecture

SOLOv2, an end-to-end single-stage instance segmentation model, is depicted in Figure 1. The architecture includes three main components: a ResNet50 backbone, a Feature Pyramid Network (FPN), and the SOLOv2 head. During inference, input images are first processed by the ResNet50 backbone to extract multi-scale features. These features are then fused and refined through the FPN. Finally, the SOLOv2 head produces category predictions and instance masks through its category branch and mask branch, respectively. Matrix Non-Maximum Suppression (Matrix NMS) is applied during post-processing, enhancing inference efficiency.

2.6.2. Dynamic Instance Segmentation Mechanism

SOLOv2 implements instance-level segmentation through a position-aware dynamic convolution strategy. The key components of this implementation are:
Category Branch
This branch is responsible for predicting the class of objects. The input feature map is divided into an S × S grid, where each grid cell predicts the category of objects within its region. The output dimension is S × S × C, where C is the number of classes (C = 1 in this study, distinguishing only Chinese bayberry from the background).
Mask Branch
The mask branch comprises a kernel branch and a feature branch. The kernel branch learns convolution kernel weights, whereas the feature branch integrates multi-level FPN features to produce a convolutional feature map. Features extracted by the FPN are fed into the kernel branch, which generates S × S × D kernel weights for subsequent convolution operations, where D is the kernel parameters (kernel width × kernel height × kernel depth). The feature branch outputs a feature map of dimensions H × W × E, where E is the number of mask feature channels. During prediction, convolution kernels are chosen based on positional information and applied to the feature map generated by the feature branch to produce the predicted mask.

2.6.3. Lightweight Improvement

Systematic lightweight modifications were applied to the mask branch of the SOLOv2 model in this study, focusing on three main aspects:
Convolutional Layer Simplification
The original 7-layer convolutional stack in the mask branch was reduced to 2 layers. The retained layers were configured as follows: first layer (kernel_size = 3, stride = 1, padding = 1), and second layer (kernel_size = 3, stride = 1, padding = 1). This reduction in convolutional layers significantly decreases computational complexity during feature extraction.
Feature Channel Compression
The output channel dimension E of the mask feature branch was reduced from 256 to 128. Simultaneously, the input channel dimension of the kernel branch was halved, significantly lowering the number of model parameters.
Detection Scale Optimization
The detection scales were adjusted from [40, 36, 24, 16, 12] to [16, 32, 64, 128, 256]. This modification reduces computational overhead while aligning the scale distribution more effectively with the actual size characteristics of Chinese bayberry fruits.

2.7. Multi-Feature Fusion Maturity Regression Model

2.7.1. MFENet Network Structure

The proposed MFENet adopts a multi-branch parallel architecture, as illustrated in Figure 1. An end-to-end cascade structure is implemented to predict fruit maturity directly from fruit instances. Single-fruit images extracted by SOLOv2-Light are fed into the network, where multimodal features are obtained through three parallel pathways: a backbone feature branch, a color feature branch, and a texture feature branch. A continuous maturity prediction value is ultimately generated.

2.7.2. Multimodal Feature Learning

Backbone Feature Branch
The backbone network employs a lightweight EfficientNet-B0 architecture as the primary feature extractor. Only the convolutional layers from the first four stages are retained to reduce computational complexity while preserving fine details. This strategy minimizes computational requirements while avoiding the excessive feature abstraction that deeper layers can induce, making the extracted features more suitable for assessing the maturity of red Chinese bayberries.
Chromatic Feature Branch
A dual-path parallel architecture is utilized in the color feature branch to extract features from the LAB and RGB color spaces, respectively. In particular, the LAB path emphasizes the a and b channels, as these channels indicate strong correlations with fruit maturity. In contrast, the RGB path preserves the complete three-channel information to capture conventional color characteristics. Both paths incorporate a Squeeze-and-Excitation (SE) attention module, which improves the representation of critical color features through adaptive feature reweighting while suppressing interference from irrelevant features. This dual-color-space approach facilitates the effective integration of complementary information from various color representations, enhancing the capture of maturity-related color features.
Textural Feature Branch
A multi-scale feature extraction module is designed for the texture feature branch to capture texture information at different scales through a parallel configuration of standard and dilated convolutions. Specifically, standard convolutions with a 3 × 3 kernel capture local texture details, while dilated convolutions with a 5 × 5 kernel expand the receptive field to capture broader contextual texture information. This multi-scale design effectively identifies granular texture patterns on Chinese bayberry surfaces, indicating a strong correlation with fruit maturity. Positioned downstream from the backbone network, the texture feature branch uses the shallow features already extracted by the backbone, simultaneously reducing computational overhead.

3. Results

3.1. Dataset Construction and Preprocessing

3.1.1. Data Collection and Annotation

A systematic data acquisition and processing pipeline was established to construct a high-quality Chinese bayberry maturity detection dataset. This workflow included four key stages: data collection, image preprocessing, instance segmentation annotation, and maturity labeling, each designed to provide a reliable data foundation for model training.
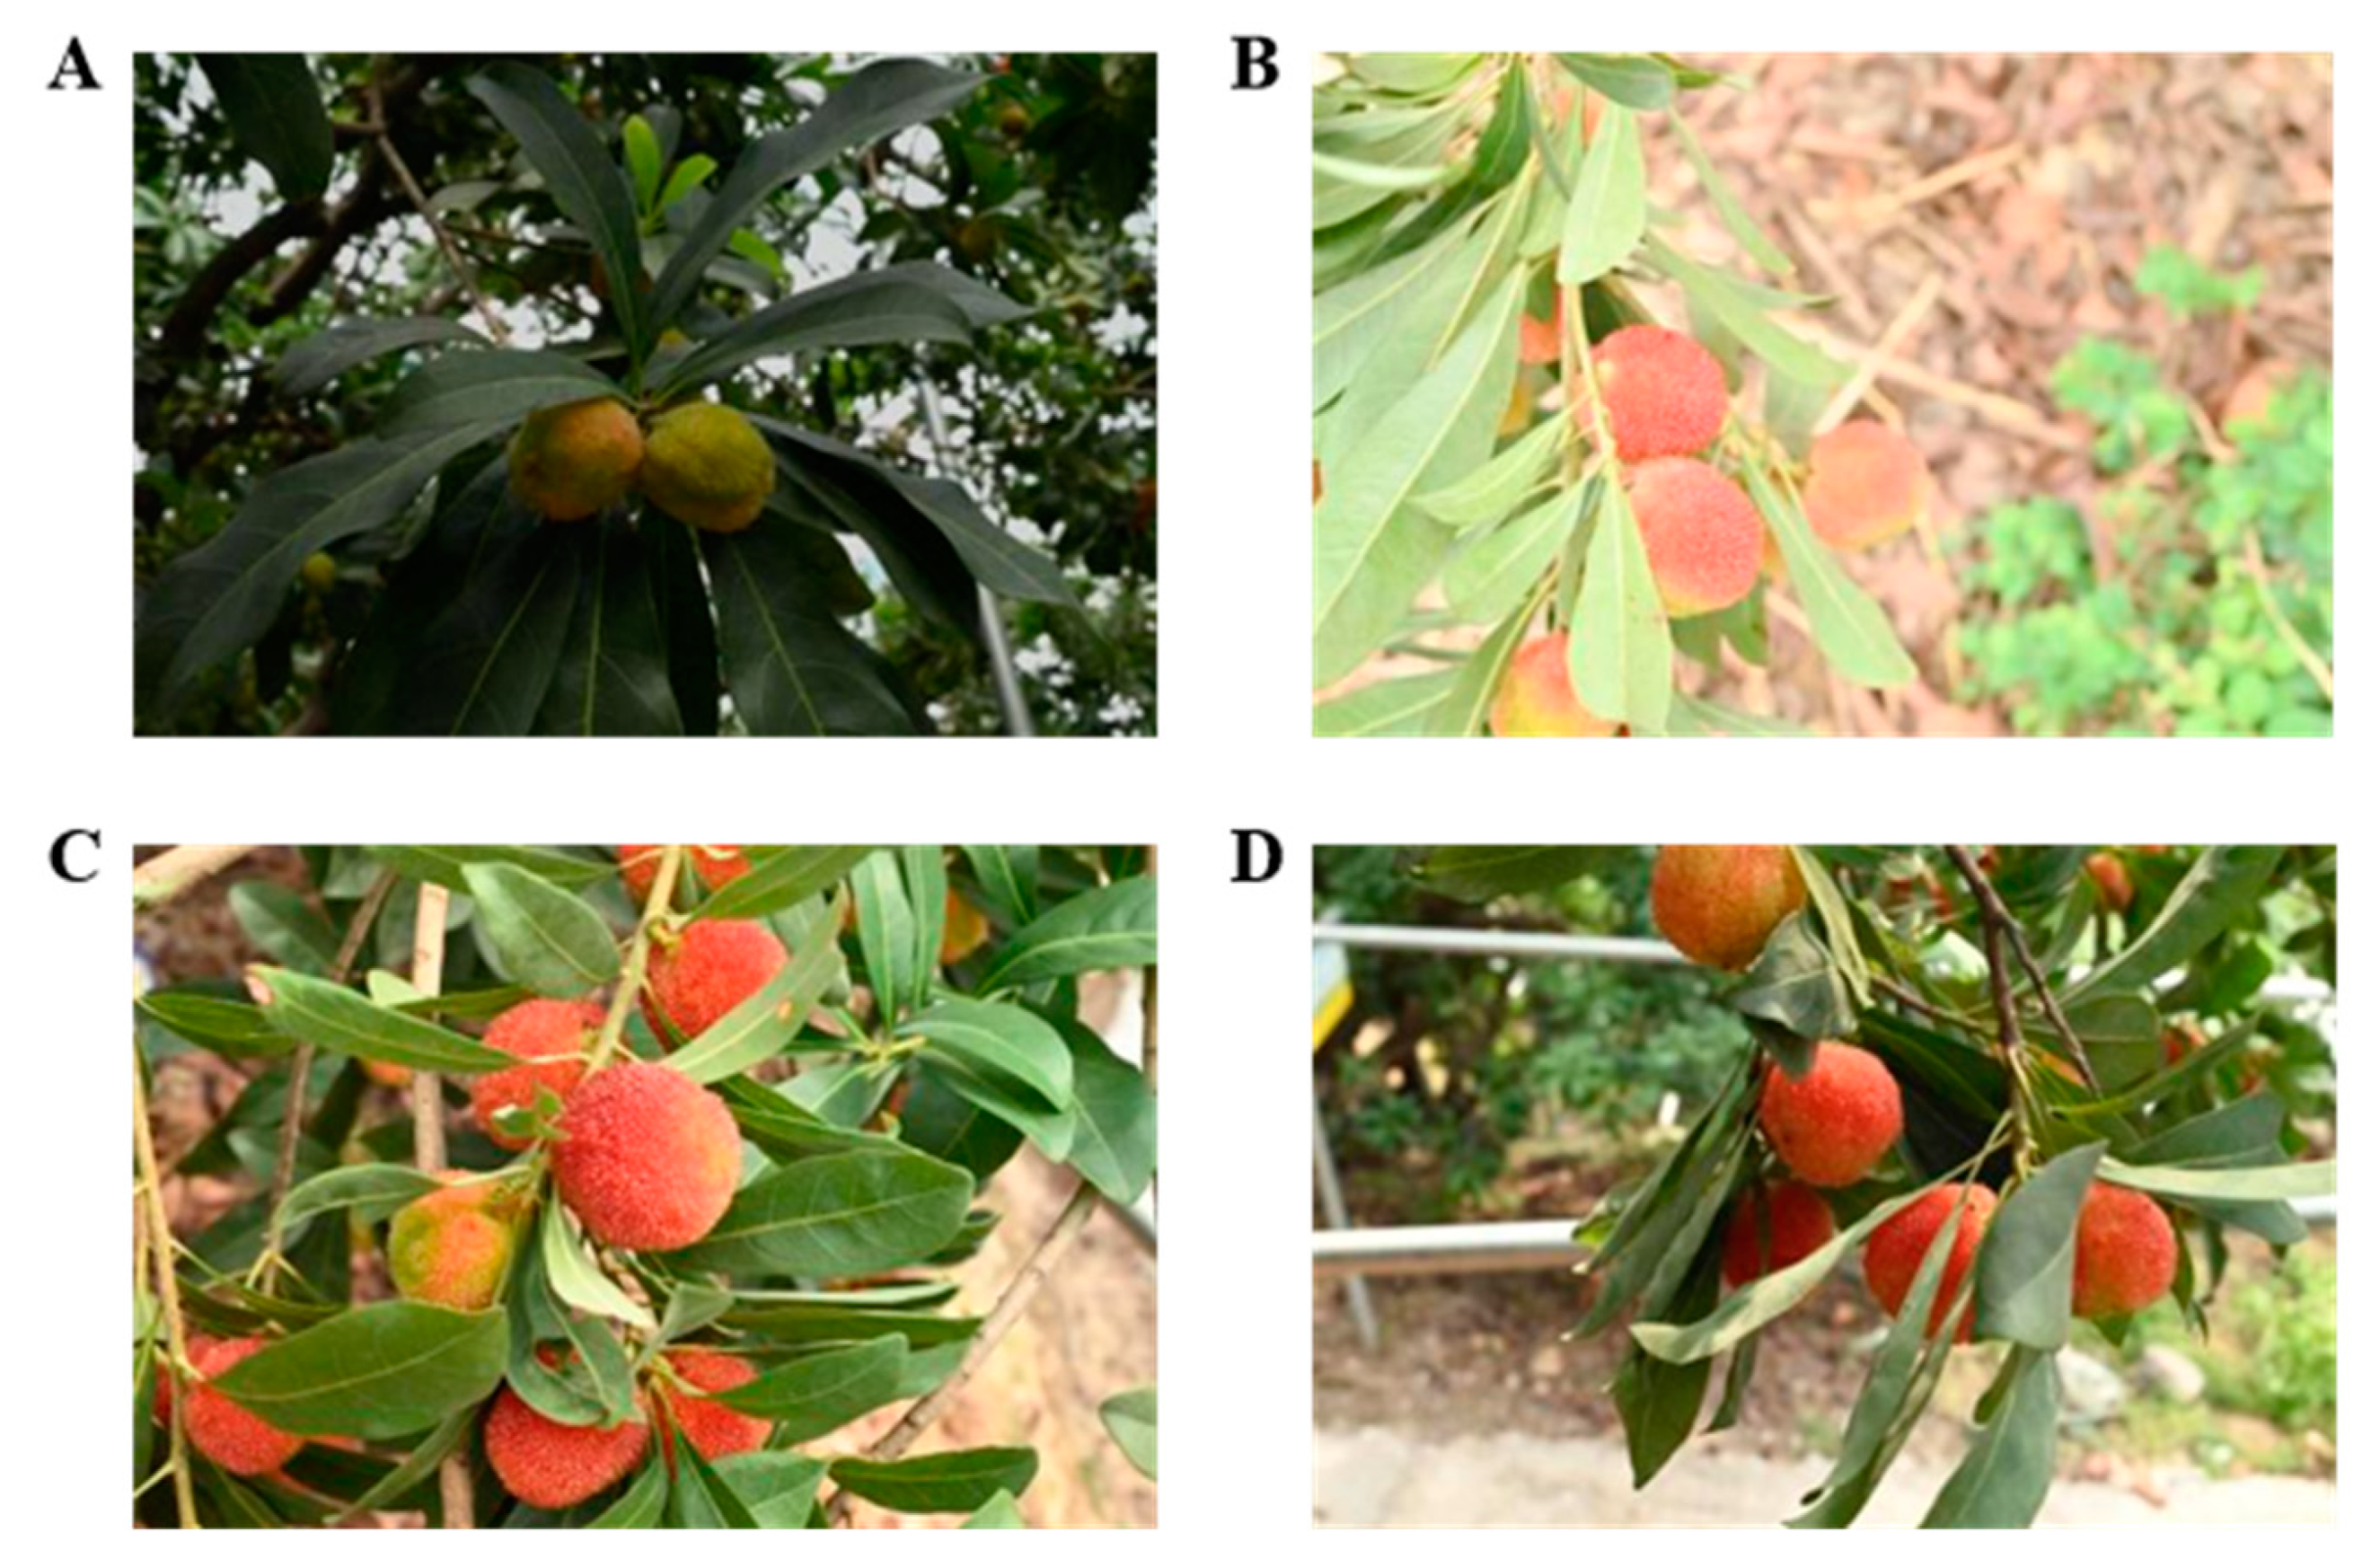
In the data acquisition phase, Chinese bayberry images were collected under operational orchard conditions. Environmental variations were deliberately incorporated, including diverse illumination conditions (low light, strong backlight, frontlight, and sidelight), spatial distribution patterns (sparse/dense clustering, stacking, and occlusion), and continuous maturity stages (from unripe to fully ripe) (Figure 2). CIELAB color space parameters were simultaneously measured using a colorimeter for individual fruits to ensure labeling objectivity. Through this systematic strategy, 400 high-resolution source images were obtained.

3.1.2. Illumination Invariance Enhancement Based on LAB Color Space

An adaptive preprocessing method based on the LAB color space was employed to address image quality degradation under complex illumination conditions. Specifically, Contrast Limited Adaptive Histogram Equalization (CLAHE) was applied to the luminance channel (L) of the LAB color space, with a clipLimit of 0.8 and a tileGridSize of (16, 16). This approach effectively suppressed noise amplification through contrast limitation while preserving local image features via adaptive tile-based processing. Figure 3 indicates that restricting enhancement to the luminance channel improved the visibility of image details while maintaining color fidelity.

3.1.3. Construction of the Chinese Bayberry Instance Segmentation Dataset

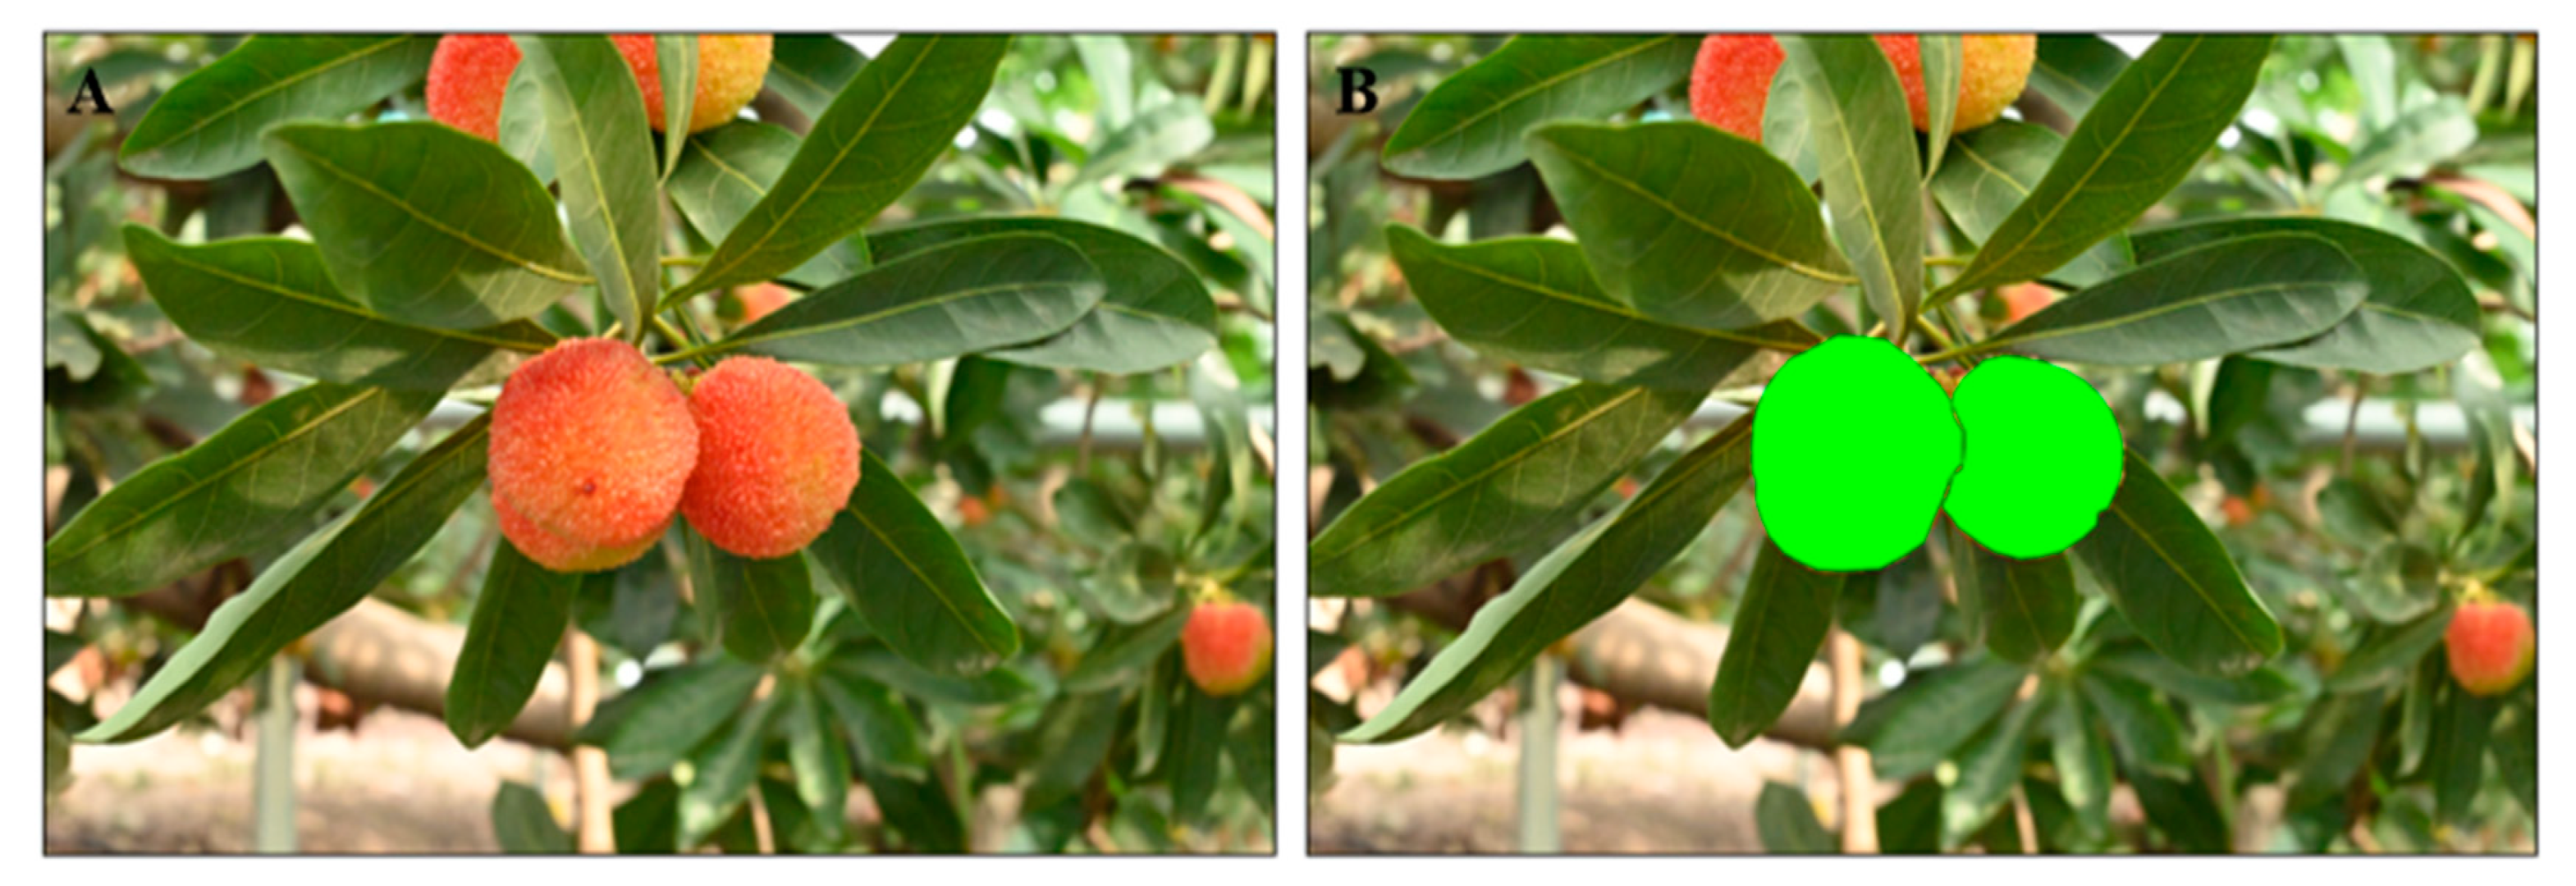
Labelme is a widely used open-source tool for image annotation, particularly for instance segmentation tasks. During dataset construction for instance segmentation, Labelme was used for instance-level annotation. The annotation process followed specific principles: only fully visible fruits were prioritized; partially occluded instances were annotated only when the occlusion level was below 30%; and contour annotations were aligned at the pixel level with fruit boundaries. This annotation strategy ensured high data quality while providing learning samples with partial occlusion. Ultimately, an instance segmentation dataset comprising 400 images was created, with representative samples shown in Figure 4.

3.1.4. Construction of the Chinese Bayberry Maturity Regression Dataset

The instance segmentation dataset was employed to extract individual Chinese bayberry fruit images using the annotated masks. The following processing steps were implemented: (1) fruit regions were extracted from the original images based on their corresponding masks; (2) samples exhibiting severe defects (area completeness < 70%) were excluded; and (3) the *a*/*b* values measured by a colorimeter were used as maturity labels. Ultimately, a maturity regression dataset comprising 876 single-fruit images, each annotated with a precise maturity label, was generated. The maturity labels covered a continuous range from 0 to 1. Through this dataset construction pipeline, a high-quality Chinese bayberry maturity detection dataset was developed. Representative samples are shown in Figure 5, providing a reliable basis for subsequent model training and evaluation.

3.2. Feature Fusion and Regression Prediction

3.2.1. Feature Fusion Strategy

An adaptive fusion mechanism is applied to integrate features extracted from the three branches. First, the three feature streams are concatenated along the channel dimension. Then, a 1 × 1 convolution is applied to reduce dimensionality and eliminate redundant information. Finally, a Squeeze-and-Excitation (SENet) channel attention mechanism recalibrates feature weights dynamically based on their importance, enhancing responses to discriminative features while suppressing less relevant ones.

3.2.2. Attention Mechanism

The channel attention mechanism first applies global average pooling to produce channel-wise feature descriptors. Then, a two-layer fully connected network is utilized to learn nonlinear interdependencies among channels. Finally, the feature maps are adaptively recalibrated based on the learned weights. This mechanism strengthens responses in channels essential for maturity assessment while reducing the impact of irrelevant channels, thus improving the discriminative capacity of the feature representation.

3.2.3. Regression Head Design

The regression head adopts a lightweight structure, in which spatial features are compressed into a global feature vector through adaptive average pooling, followed by mapping to maturity scores via a two-layer fully connected network:
y = W 2 ( D r o p o u t ( R e L U ( W 1 ( P o o l ( F a t t ) ) ) ) )
where W 1 R 64 × 32 and W 2 R 32 × 1 are learnable parameters. A Dropout layer (p = 0.3) is applied to mitigate overfitting. The final output is inversely transformed using learnable scaling parameters: y ^ = y × σ + μ . μ and σ are the mean and standard deviation of the training set maturity labels, respectively, ensuring predicted values conform to physical dimensionality. This design achieves a favorable balance between prediction accuracy and computational efficiency, meeting practical deployment requirements

3.3. Instance Segmentation Performance Evaluation

3.3.1. Lightweight Efficiency Validation of SOLOv2

This section systematically evaluates the effectiveness of the lightweight modifications applied to SOLOv2. Model computational complexity is reduced through strategies such as convolutional layer structure simplification, feature channel compression, and detection scale optimization. Specifically, compared to the original model, the streamlined SOLOv2-Light reduces computational cost (FLOPs) from 223 to 58 G (a 74.0% decrease); the number of parameters decreases from 46.233 MB to 31.161 MB (a 32.6% reduction); and inference speed increases from 17.3 FPS to 43.6 FPS (a 152.0% improvement). The mAP declines only slightly from 0.802 to 0.788, limiting performance degradation to 1.745% (Table 1). The experimental results indicate that the proposed lightweight strategy substantially reduces model complexity while largely preserving segmentation performance. This balance between computational efficiency and accuracy enhances the model’s suitability for practical deployment scenarios.

3.3.2. Instance Segmentation Quantitative Evaluation

This section includes a comparison of two mainstream instance segmentation models, Mask R-CNN and YOLACT, to comprehensively evaluate the segmentation performance of SOLOv2-Light. All models are trained under identical configurations, including a ResNet50 backbone, an initial learning rate of 1.25 × 10⁻³, and 36 training epochs, using pre-trained weights from the COCO dataset. A performance comparison of the three models on the Chinese bayberry instance segmentation dataset is listed in Table 2. Experimental results demonstrate that SOLOv2-Light achieves superior performance across all metrics. In terms of segmentation accuracy, it achieves a 4.2% higher mAP than Mask R-CNN and surpasses YOLACT by 2.7%. Particularly, its AP75 score indicates exceptional capability in high-precision segmentation tasks. Regarding computational efficiency, the parameter count is reduced by 29.1% compared to Mask R-CNN and by 10.3% relative to YOLACT. Computational complexity is lowered by 75.3% compared to Mask R-CNN while remaining comparable to YOLACT in FLOPs. With an inference speed of 43.6 FPS, real-time processing requirements are satisfied. These findings confirm the effectiveness of SOLOv2-Light for the Chinese bayberry instance segmentation task, demonstrating significantly reduced computational overhead while maintaining high segmentation accuracy, providing a strong foundation for subsequent maturity prediction tasks.

3.3.3. Instance Segmentation Qualitative Analysis

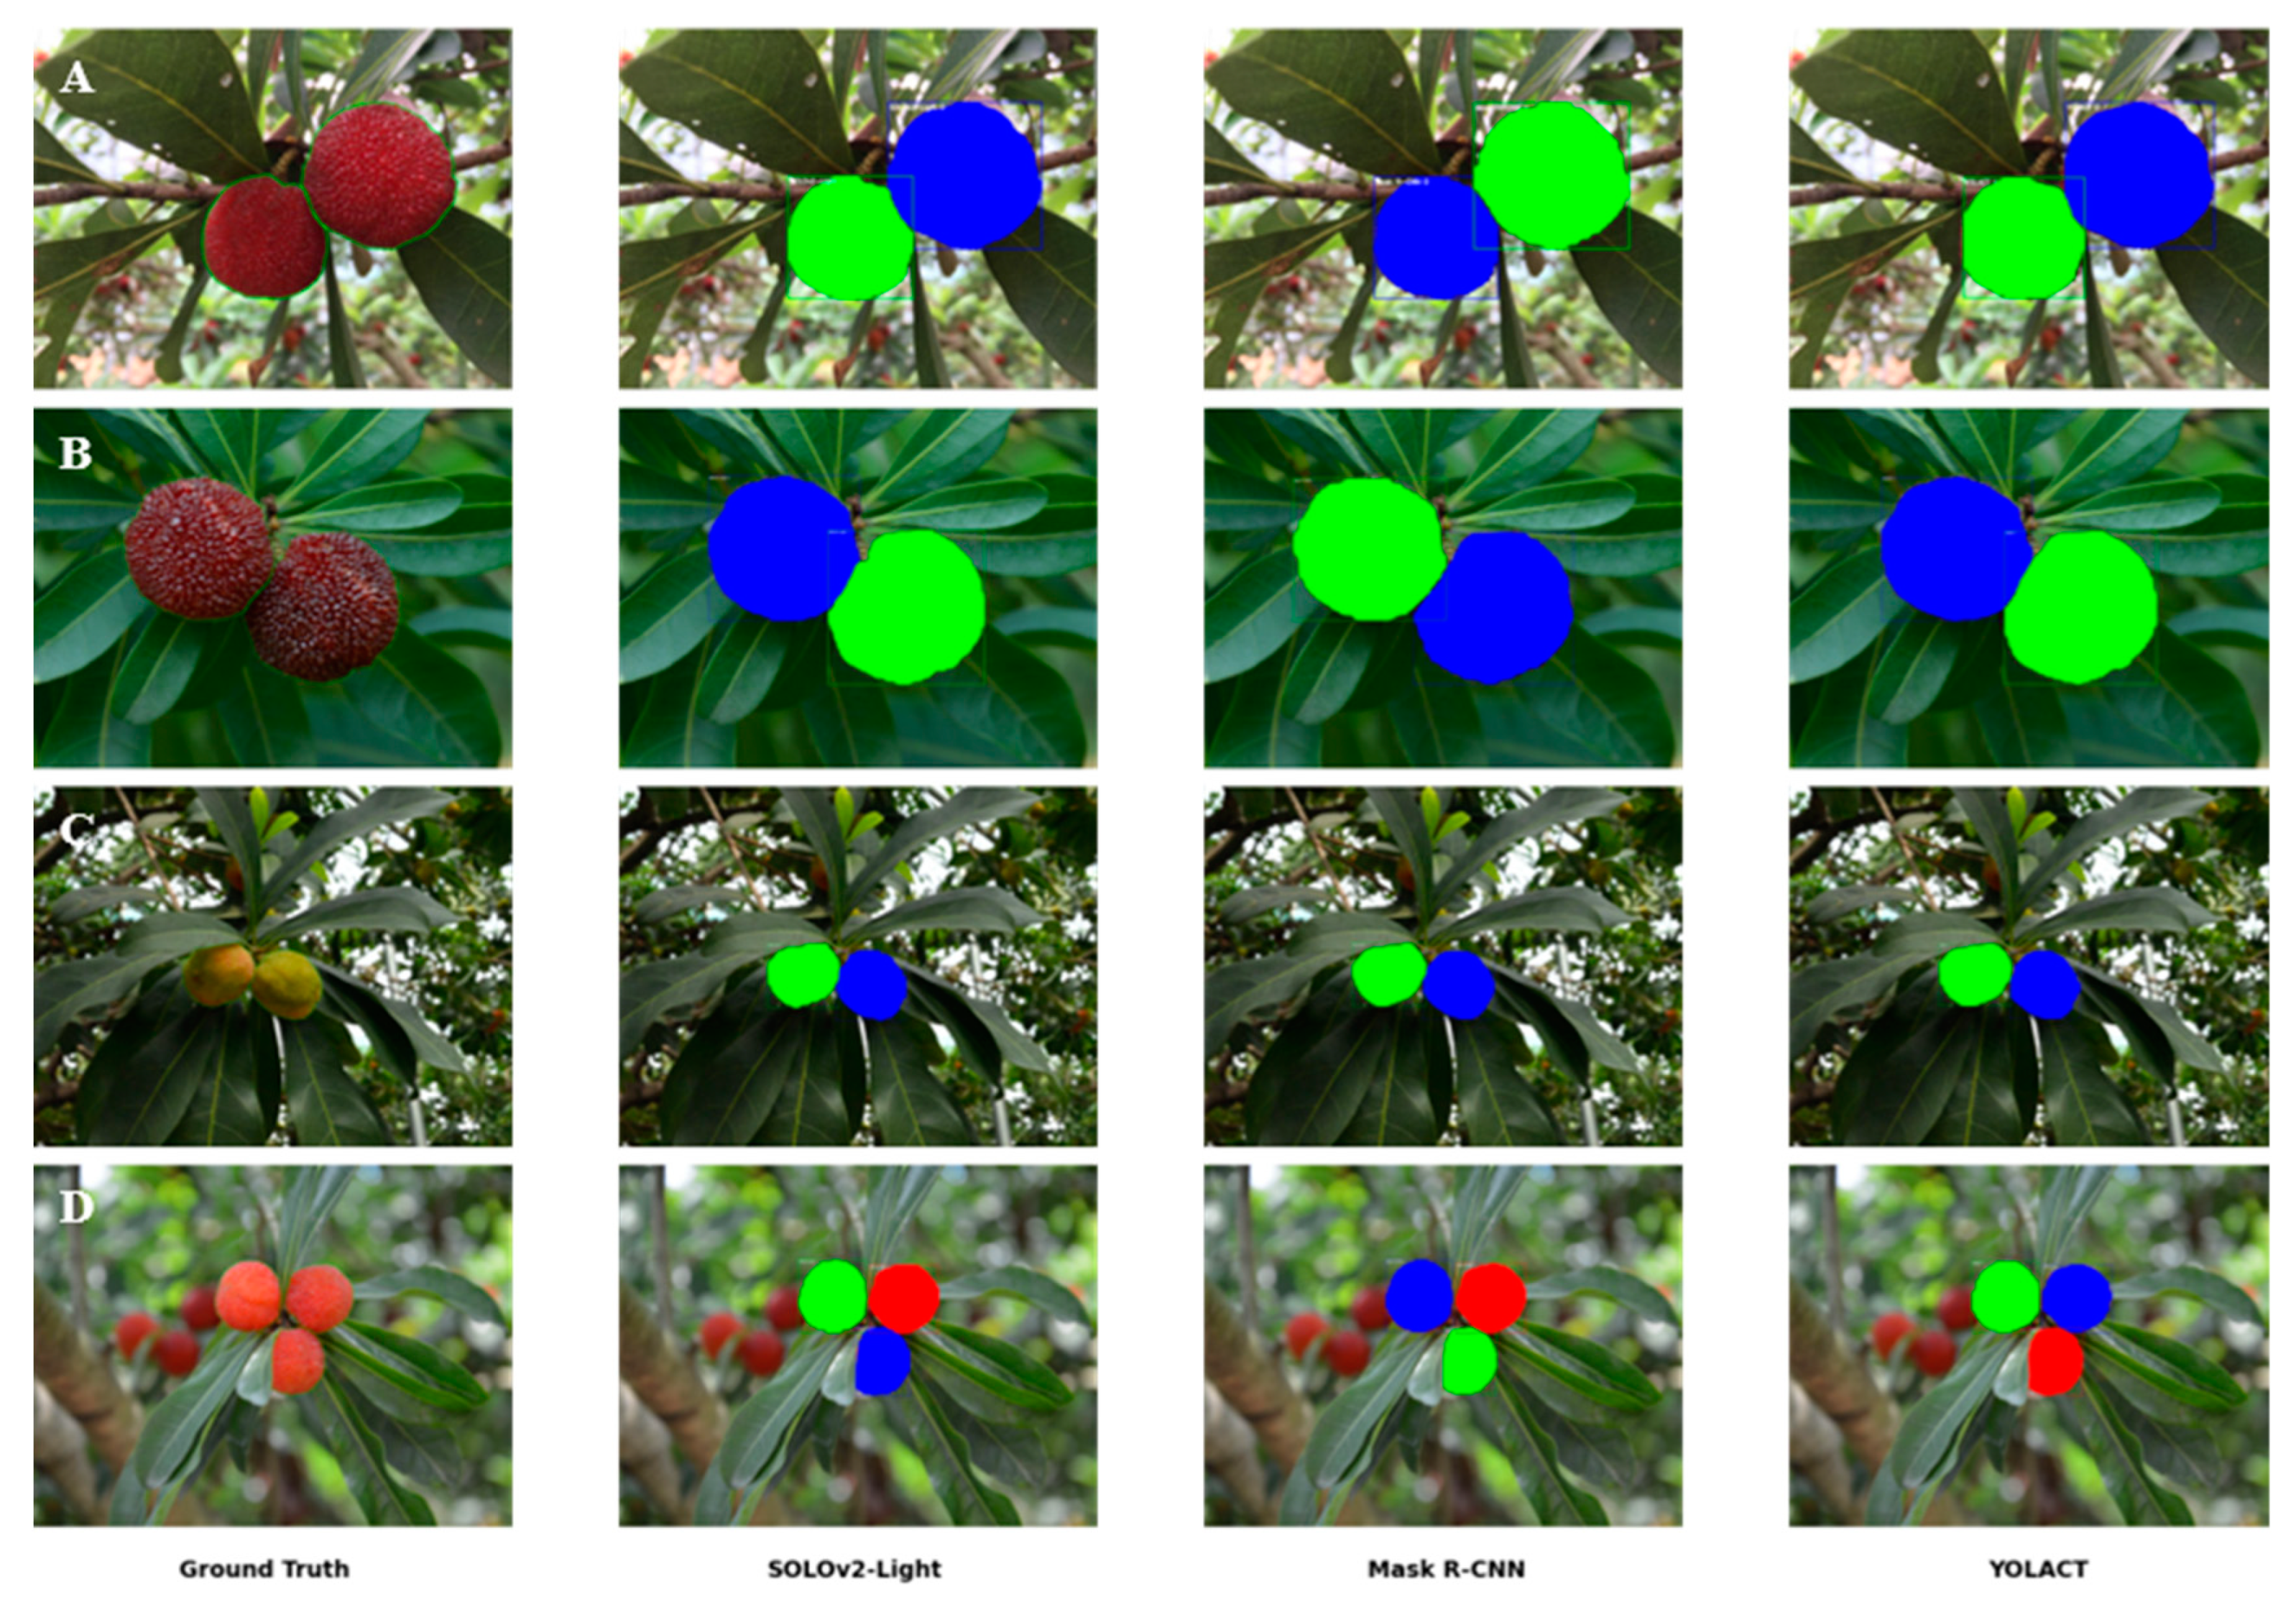
Four representative scenarios were selected in this section for qualitative comparative analysis of segmentation performance among SOLOv2-Light, Mask R-CNN, and YOLACT. Figure 6 exhibits that the segmentation results are arranged from left to right as Ground Truth, SOLOv2-Light, Mask R-CNN, and YOLACT, with distinct colors representing individual instances. The experimental findings consistently indicate superior segmentation performance by SOLOv2-Light across multiple scenarios. For densely clustered Chinese bayberry (Figure 6A,B), instance boundaries are accurately delineated, effectively reducing adhesion between adjacent instances. In contrast, irregular segmentation contours are observed along boundaries in Mask R-CNN results, whereas boundary blurring is evident in YOLACT outputs. Under complex occlusion caused by foliage (Figure 6C), the contour features of Chinese bayberry remain precisely captured by SOLOv2-Light, while the other methods exhibit segmentation deviations to varying degrees. When processing berries at different maturity stages (Row 4, Figure 6), robust adaptability is demonstrated through accurate segmentation of fruits with diverse colors and textures.
The advantages of SOLOv2-Light are primarily evident in three aspects: boundary refinement, instance discrimination accuracy, and environmental adaptability. Within granular texture regions on Chinese bayberry surfaces, more precise segmentation boundaries are produced. In overlapping areas, instance adhesion is effectively minimized through enhanced processing accuracy. Consistent segmentation performance is maintained under varying illumination conditions. However, minor instance confusion can occur under extreme overlap, and boundary completeness can be further improved for heavily occluded fruits. SOLOv2-Light exhibits exceptional capability for Chinese bayberry instance segmentation. Its segmentation accuracy and environmental adaptability satisfy practical application requirements, providing a reliable foundation for subsequent maturity prediction tasks.

3.4. Maturity Regression Performance Assessment

3.4.1. MFENet Module Ablation Experiments

A systematic ablation study was conducted on the Chinese bayberry maturity recognition dataset to validate the effectiveness of individual modules in the Multi-Feature Fusion Regression Network (MFENet). The contributions of both the color feature extraction module and the texture feature extraction module to model performance were evaluated. Quantitative results of the ablation experiments are listed in Table 3.
The experimental results show that the benchmark model utilizing only the EfficientNet-B0 backbone achieved a Mean Absolute Error (MAE) of 4.418% and a Root Mean Square Error (RMSE) of 5.698% in the maturity prediction task. With the integration of the texture feature extraction module, the MAE decreased to 4.174%, representing a 5.5% improvement. Similarly, the inclusion of the color feature extraction module reduced the MAE to 4.269%, corresponding to a 3.4% improvement. When both modules were incorporated simultaneously, model performance was significantly enhanced, with the MAE further reduced to 3.946%, a 10.7% improvement over the benchmark. A distinct complementary effect was observed between color and texture features, as the combined performance gain (10.7%) exceeded the sum of individual improvements (8.9%), validating the effectiveness of the multi-feature fusion strategy. Regarding error distribution, the use of either a single module reduced average prediction errors but introduced occasional larger deviations, reflected in a slight increase in RMSE. This limitation was effectively mitigated by the complete model, which achieved simultaneous reductions in both MAE and RMSE.
In terms of model complexity, the inclusion of feature extraction modules increased the number of parameters by approximately 62 MB relative to the benchmark. This parameter expansion is considered justified in light of the substantial performance improvements. The results conclusively demonstrate that the proposed color and texture feature extraction modules effectively capture critical features for Chinese bayberry maturity assessment, while their synergistic integration further optimizes model performance.

3.4.2. Recognition Performance Evaluation

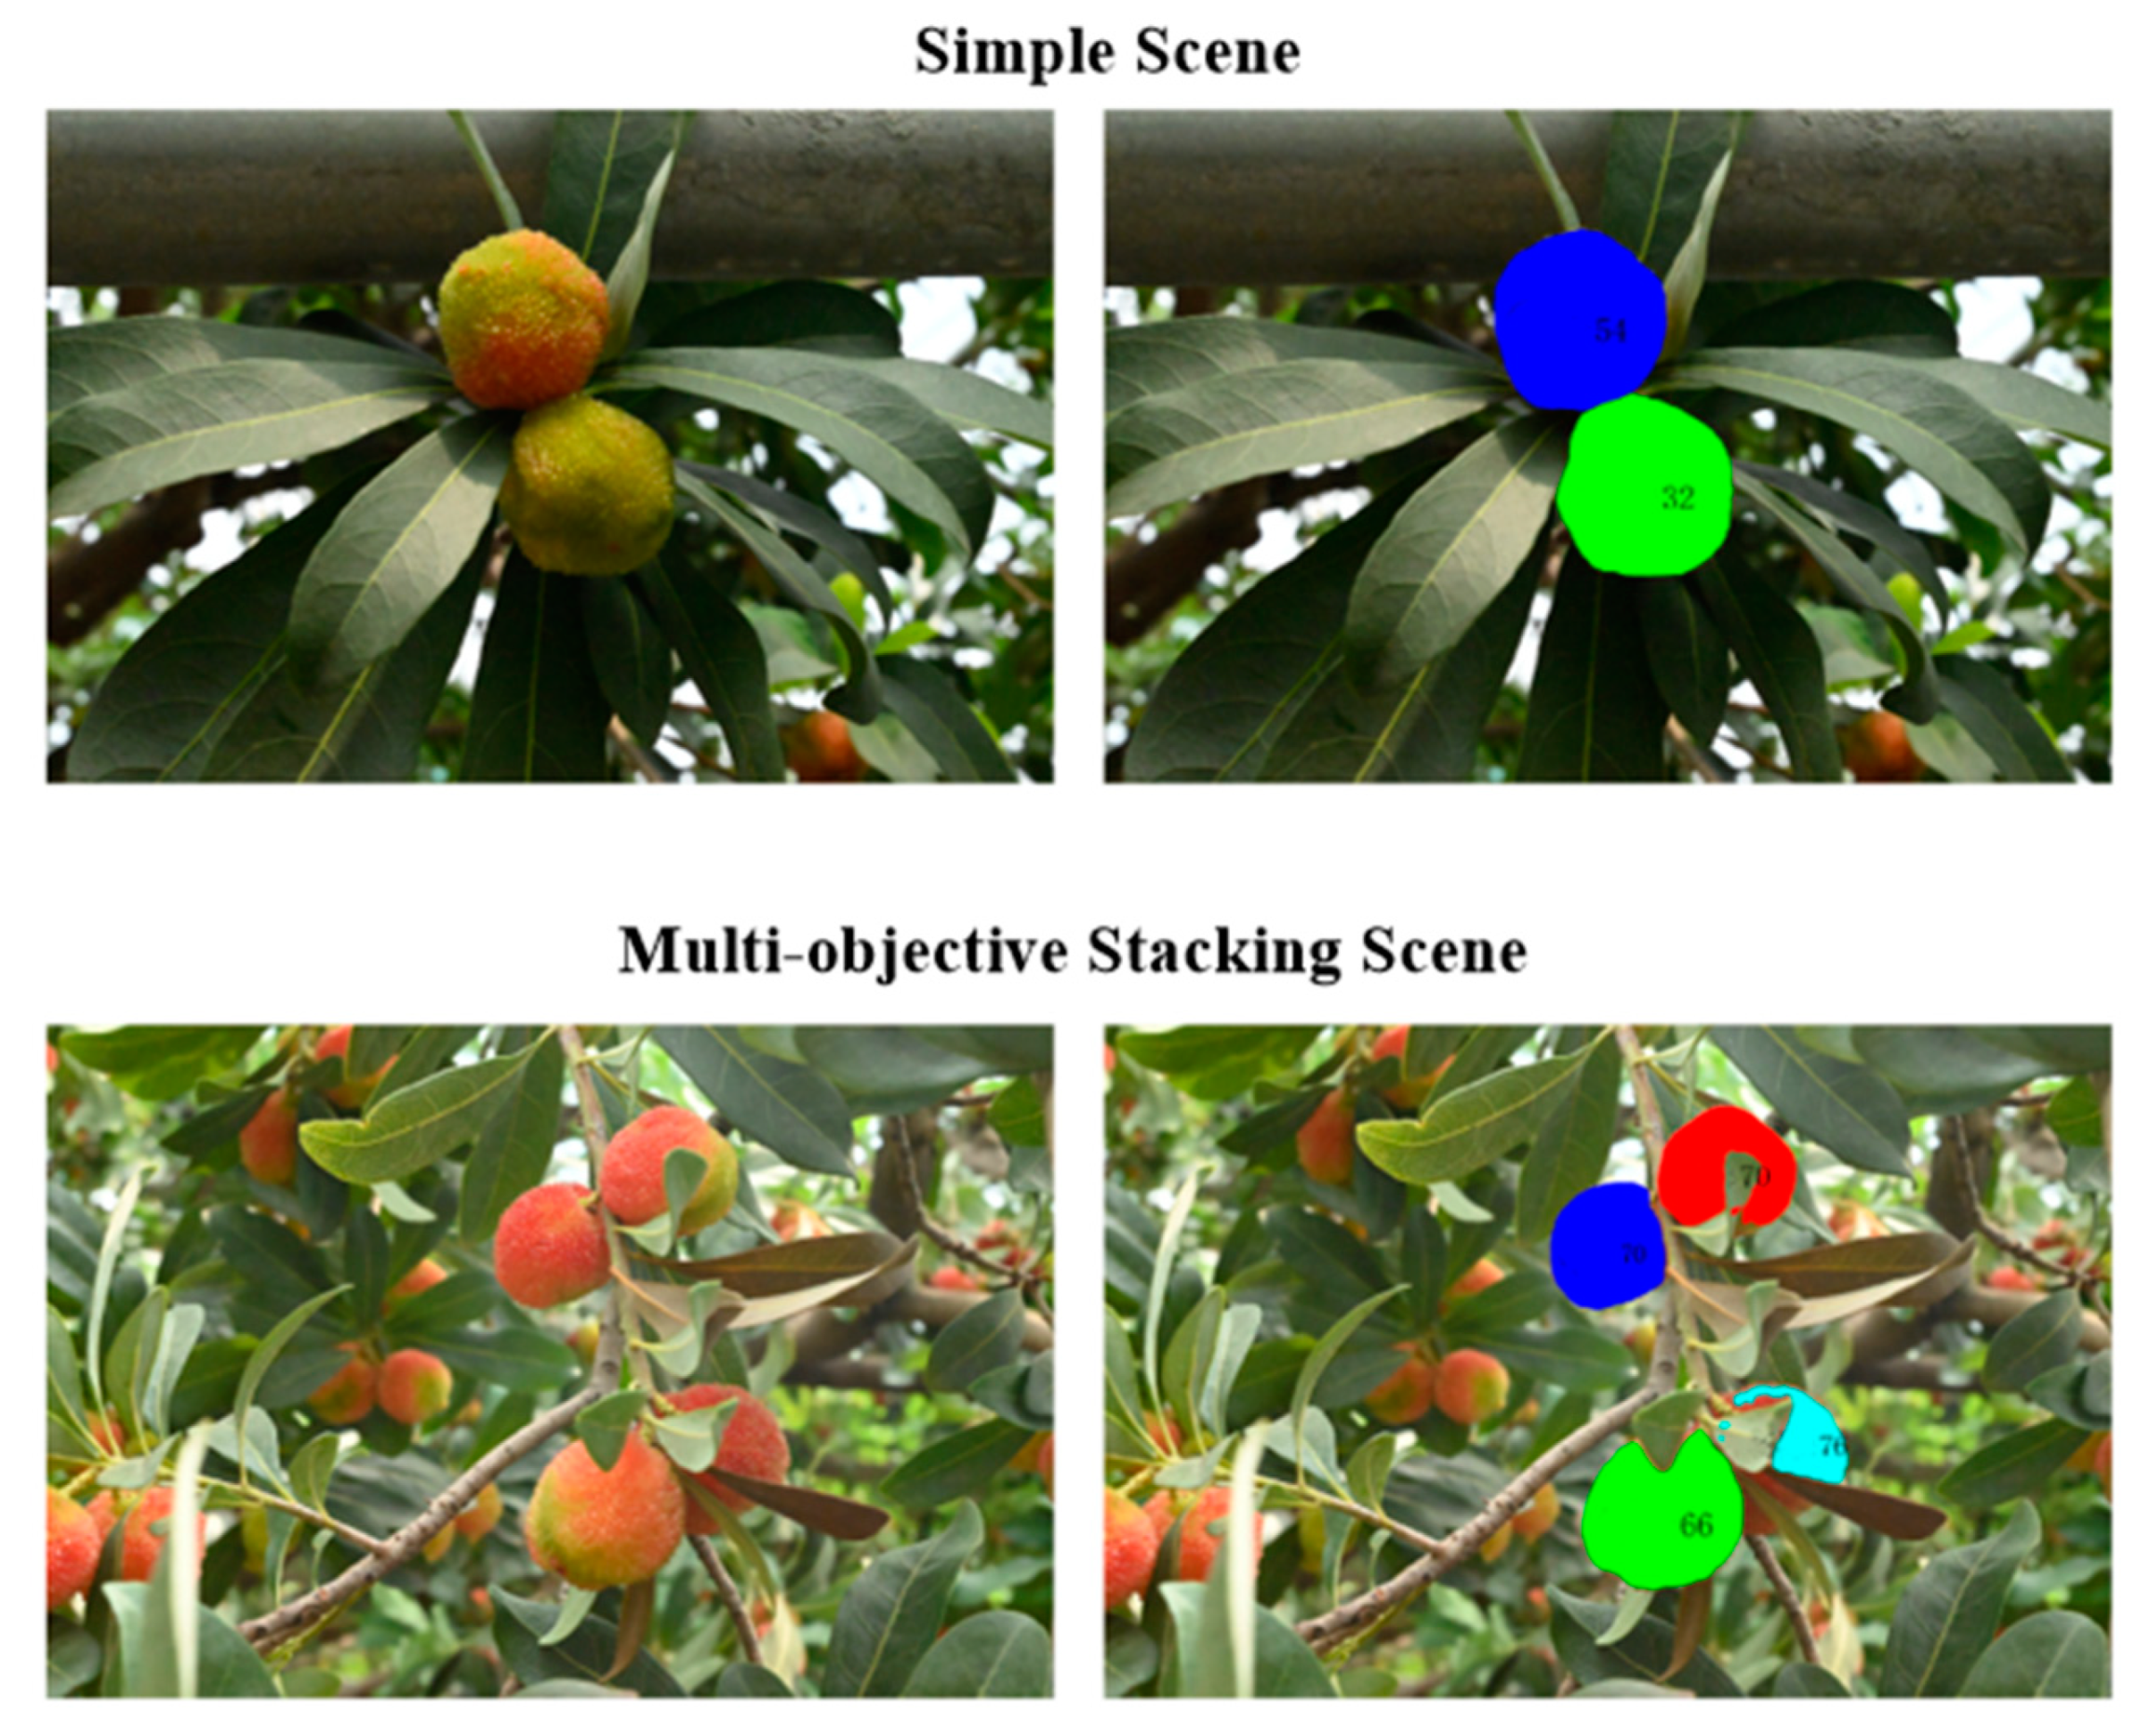
A systematic evaluation of the proposed cascaded Chinese bayberry maturity detection method was conducted. This approach first applies SOLOv2-Light for instance segmentation, followed by maturity prediction using MFENet. For the maturity prediction task, an MAE of 3.946% and an RMSE of 5.006% were achieved on the test set, confirming the model’s ability to predict Chinese bayberry maturity with high precision. Figure 7 indicates that a qualitative analysis was conducted in two representative scenarios. In the simple scenario (Figure 7), two Chinese bayberry fruits were successfully identified. The upper fruit, with a yellowish-red transitional hue, was assigned a predicted maturity of 51%, accurately representing its ripening state. The lower fruit, displaying a greenish color, was predicted to have 32% maturity, consistent with its unripe condition. This continuous-value prediction approach, in contrast to traditional discrete classification methods, allows for a more precise representation of the dynamic ripening process. In the multi-objective stacking scenario (Figure 7), robust detection performance was sustained despite significant occlusion among fruits. For the three fully visible target fruits, maturity values of 70%, 66%, and 40% were predicted, respectively. These predictions closely matched the actual maturity states: the higher values (70% and 66%) corresponded to red-colored mature fruits, while the lower value (40%) corresponded to a lighter-colored unripe fruit. Severely occluded and incomplete fruits were automatically excluded, a robustness characteristic regarded as highly advantageous for practical applications.
The experimental results highlight three key advantages of the proposed method. First, the instance segmentation module ensures accurate discrimination between adjacent and overlapping fruits, providing reliable target regions for subsequent maturity prediction. Second, the multi-feature fusion strategy enhances the accuracy and stability of maturity prediction, effectively addressing fruits under varying illumination and occlusion conditions. Finally, the continuous-value prediction provides more valuable decision support for precise harvesting management. These characteristics collectively confirm the method’s suitability for practical orchard environments, providing robust technical support for intelligent Chinese bayberry harvesting.

3.4.3. Compared to the Existing Methods

A systematic comparison was conducted with existing Chinese bayberry maturity detection approaches to comprehensively evaluate the performance advantages of the proposed method. Given that current studies primarily adopt discrete classification schemes (categorizing maturity into unripe, semi-ripe, and ripe stages), a formal evaluation framework was designed to ensure fair comparison by mapping the continuous prediction outputs into a discrete categorical space. Specifically, regression predictions y were transformed into discrete categories through the following mapping function:
C l a s s p r e d = 0 ,                         if   y p r e d < α 1               1 ,                 if   α 1 y p r e d < α 2 2 ,                       if   y p r e d α 2
where y p r e d is predicted value, α 1 and α 2 through the following mapping function, where the categorical thresholds were set at 0.4 and 0.8 during experimentation.
The overall classification accuracy is computed to account for potential instance segmentation omissions as follows:
A c c u r a c y t o t a l = N c o r r e c t N t o t a l = N c o r r e c t r e g + N m i s s e d c o r r e c t N t o t a l
where N c o r r e c t r e g is the number of samples correctly classified by the regression model, N m i s s e d c o r r e c t is the number of samples undetected by the segmentation model, and N t o t a l is the total number of samples in the dataset.
In addition, classification accuracy was computed per category to enable granular evaluation of model performance across maturity stages.
A c c u r a c y c l a s s i = T P i T P i + F P i
where i is different maturity categories (immature, semi-mature, and mature).
The performance comparison between the proposed method and mainstream object detection approaches (YOLOX-s and Faster R-CNN) is presented in Table 4. In terms of overall accuracy, the proposed method achieved 95.51%, representing improvements of 14.91 and 11.91 percentage points over YOLOX-s and Faster R-CNN, respectively. Consistently superior performance was observed across all maturity categories: recognition accuracy reached 97.22% for unripe Chinese bayberry, 98.84% for semi-ripe, and 80.77% for ripe specimens. A substantial advantage was demonstrated in semi-ripe stage identification, with a 24.24 percentage point improvement over YOLOX-s.
Regarding computational efficiency, an average processing time of 0.98 s per image was recorded for the proposed method, constituting reductions of 45.86% and 48.15% compared to YOLOX-s and Faster R-CNN. These efficiency gains were primarily attributed to the lightweight network architecture and the optimized feature extraction strategy. It should be noted that, despite employing a cascaded framework, faster processing speeds were maintained through deliberate model lightweighting.

4. Discussion

The cascaded architecture proposed in this study addresses three persistent limitations in fruit maturity detection: environmental sensitivity, occlusion handling, and discrete classification constraints. The framework enables specialized optimization that simultaneously enhances precision and efficiency by decoupling instance segmentation (SOLOv2-Light) and maturity regression (MFENet), a dual advantage rarely achieved in monolithic detection models [8,25]. Our results demonstrate that a balance between accuracy and efficiency is achieved, which is paramount for real-world agricultural applications.

4.1. Advantages of Cascaded Architecture

The performance gain of our method primarily stems from its decoupled design. Unlike end-to-end detectors like YOLOX or Faster R-CNN that perform localization and classification simultaneously [26], our two-stage approach allows each module to specialize. The SOLOv2-Light segmenter excels at the geometric task of instance separation, which is a known challenge for monocular vision in clustered fruits [19,22]. MFENet’s multimodal branches explicitly encode known phenological markers of Myrica rubra maturation. The LAB color path prioritizes *a*/b* channels correlated with anthocyanin accumulation, while multi-scale texture convolutions capture pericarp coarsening, biological processes often overlooked in conventional RGB-based approaches [25,27]. This design yields a 10.7% MAE reduction over single-branch regression (Table 3), validating that feature engineering grounded in plant physiology outperforms generic feature extractors. Despite employing a two-stage pipeline, SOLOv2-Light’s architectural simplifications (convolutional layer reduction and channel compression) reduce inference latency by 45–48% compared to YOLOX-s and Faster R-CNN (Table 4). This efficiency gain does not compromise segmentation fidelity, maintaining a 0.788 mAP, surpassing Mask R-CNN by 4.2% [26,28,29]. Such a balance resolves a key dilemma in agricultural robotics.

4.2. Practical Implications of Lightweight Design

The supra-additive performance gain from fusing color and texture features (Table 3) is not merely a statistical artifact but has a strong biological basis. The color change in bayberries, primarily driven by anthocyanin accumulation, is effectively captured by the LAB color space, particularly the a*/b* ratio [4,14]. The threshold-based discretization (α1 = 0.4, α2 = 0.8) establishes a standardized bridge for comparing regression and classification paradigms. This explains the method’s superior semi-ripe recognition (98.84% vs. YOLOX-s’s 74.6%), where traditional classifiers fail to capture transitional states [30]. The synergy between color and texture features produces supra-additive gains (10.7% MAE improvement > 5.5% + 3.4% individual gains), representing biological interdependence: maturity-driven hue shifts coincide with surface textural changes. This complementarity is inadequately exploited in single-modal studies [31,32].
LAB-based CLAHE preprocessing confers illumination invariance, maintaining chromatic fidelity under backlight or sidelight conditions (Figure 2). This explains the consistent accuracy in scenarios where RGB-based methods degrade >20% [33]. In addition, SOLOv2-Light’s mask-first approach eliminates bounding-box adhesion in clustered fruits (Figure 6), resolving a failure mode prevalent in sliding-window detectors. The system’s conservative occlusion handling, discarding heavily obscured fruits, mirrors the “grasp-then-detect” paradigm in EIS-integrated robotic harvesters, but avoids their physical contact requirement, reducing fruit damage risk [34].

4.3. Comparison with State-of-the-Art Trends

While this study demonstrates the superiority of our proposed framework over established methods like Mask R-CNN and YOLACT, we acknowledge the rapid evolution of object detection models, including the recent YOLOv8/YOLOv9 series and transformer-based approaches [35]. A direct comparison was not undertaken in this work primarily due to our focus on a cascaded segmentation-regression task rather than pure detection, and our emphasis on lightweight deployment for edge computing. Transformer-based models, while often achieving superior accuracy, are typically characterized by high computational complexity and memory demands, making them less suitable for real-time agricultural applications on resource-constrained devices [36]. Similarly, the latest YOLO models are highly optimized for detection, but their performance in pixel-accurate instance segmentation and subsequent per-instance regression tasks requires further investigation. Our work provides a strong, efficient, and practical baseline for this specific domain. Future studies could explore integrating the architectural advances of these newer models into the cascaded framework proposed here.

5. Conclusions

This study develops a cascaded instance segmentation and multi-feature regression framework to address the critical challenge of accurate and efficient maturity detection for Chinese bayberry. The proposed method demonstrates significant improvements over existing approaches in the following aspects: (1) The proposed method outperforms current state-of-the-art techniques. (2) The lightweight design of the framework provides a superior balance between speed and accuracy. (3) The proposed approach provides a more nuanced and practical solution compared to conventional discrete classification methods. These advancements in the system present a practical advantage for its adoption into industry. The decoupled design allows for flexible adaptation to new fruit varieties by only retraining the regression module. It significantly reduces the time and data required for customization. Future work will focus on extending this framework to more Chinese bayberry varieties and integrating it with a robotic harvesting platform to validate its performance in fully operational settings. This study provides a robust, efficient, and accurate algorithmic foundation for the intelligent harvesting of Chinese bayberry and potentially other horticultural products.

Author Contributions

Conceptualization, H.Z. and L.S.; methodology, H.Y.; data curation, Y.W.; writing—original draft preparation, H.Y.; writing—review and editing, S.Z.; project administration, S.Z.; funding acquisition, S.Z. All authors have read and agreed to the published version of the manuscript.

Funding

This research was funded by the special breeding program for new varieties in Zhejiang (2021C02066-2): the ‘Lingyan’ R&D in Zhejiang (2025C02158).

Data Availability Statement

Data is contained within the article.

Acknowledgments

During the preparation of this manuscript/study, the author(s) used Deepseek for the purposes of modification language. The authors have reviewed and edited the output and take full responsibility for the content of this publication.

Conflicts of Interest

The authors declare no conflicts of interest.

References

  1. Zhang, S.W.; Yu, Z.P.; Sun, L.; Liang, S.M.; Xu, F.; Li, S.J.; Zheng, X.L.; Yan, L.J.; Huang, Y.H.; Qi, X.J.; et al. T2T reference genome assembly and genome-wide association study reveal the genetic basis of Chinese bayberry fruit quality. Hortic. Res. 2024, 11, uhae033. [Google Scholar] [CrossRef]
  2. Ren, H.; He, Y.; Qi, X.; Zheng, X.; Zhang, S.; Yu, Z.P.; Hu, F.R. The bayberry database: A multiomic database for Myrica rubra, an important fruit tree with medicinal value. BMC Plant Biol. 2021, 21, 452. [Google Scholar] [CrossRef]
  3. Yang, H.; Li, X.; Wang, L.Q.; Zhang, H.; Kang, C.; Sun, C.; Cao, J.P. Research progress on postharvest preservation of Chinese bayberry fruit. J. Zhejiang Univ. 2023, 49, 200–212. [Google Scholar] [CrossRef]
  4. Yang, Z.F.; Zheng, Y.H.; Cao, S.F. Influence of harvest maturity on fruit quality, color development and phenylalanine ammonia-lyase (PAL) activities in Chinese bayberry during storage. Acta Hortic. 2013, 1012, 171–175. [Google Scholar] [CrossRef]
  5. Wendler, R. The maturity of maturity model research: A systematic mapping study. Inf. Softw. Technol. 2012, 54, 1317–1339. [Google Scholar] [CrossRef]
  6. Agrawal, P.; Bose, R.; Gupta, G.K.; Kaur, G.; Paliwal, S.; Raut, A. Advancements in Computer Vision: A Comprehensive Review. In Proceedings of the 2024 International Conference on Innovations and Challenges in Emerging Technologies (ICICET), Nagpur, India, 7–8 June 2024; pp. 1–6. [Google Scholar] [CrossRef]
  7. Mohammadi, S.; Sattarpanah Karganroudi, S.; Rahmanian, V. Advancements in Smart Nondestructive Evaluation of Industrial Machines: A Comprehensive Review of Computer Vision and AI Techniques for Infrastructure Maintenance. Machines 2025, 13, 11. [Google Scholar] [CrossRef]
  8. Xiang, X.J.; Zhou, K.; Fei, Z.S.; Zheng, Y.P.; Yao, J.N. Maturity detection method of Myrica rubra based on improved YOLOX algorithm. J. Chin. Agric. Mech. 2023, 44, 201–208. [Google Scholar] [CrossRef]
  9. Ye, Z.; Liu, Y.; Li, Q. Recent Progress in Smart Electronic Nose Technologies Enabled with Machine Learning Methods. Sensors 2021, 21, 7620. [Google Scholar] [CrossRef]
  10. Naik, S.K.; Murthy, C.A. Hue-preserving color image enhancement without gamut problem. IEEE Trans. Image Process. 2003, 12, 1591–1598. [Google Scholar] [CrossRef]
  11. Wang, A.; Qian, W.; Li, A.; Xu, Y.; Hu, J.; Xie, Y.; Zhang, L. NVW-YOLOv8s: An improved YOLOv8s network for real-time detection and segmentation of tomato fruits at different ripeness stages. Comput. Electron. Agric. 2024, 219, 108833. [Google Scholar] [CrossRef]
  12. Saedi, S.I.; Rezaei, M.; Khosravi, H. Dual-path lightweight convolutional neural network for automatic sorting of olive fruit based on cultivar and maturity. Postharvest Biol. Technol. 2024, 216, 113054. [Google Scholar] [CrossRef]
  13. Chen, W.; Liu, M.; Zhao, C.; Li, X.; Wang, Y. MTD-YOLO: Multi-task deep convolutional neural network for cherry tomato fruit bunch maturity detection. Comput. Electron. Agric. 2024, 216, 108533. [Google Scholar] [CrossRef]
  14. Feng, J.; Jiang, L.; Zhang, J.; Zheng, H.; Sun, Y.; Chen, S.; Yu, M.; Hu, W.; Shi, D.; Sun, X.; et al. Nondestructive determination of soluble solids content and pH in red bayberry (Myrica rubra) based on color space. J. Food Sci. Technol. 2020, 57, 4541–4550. [Google Scholar] [CrossRef]
  15. Shao, Y.N.; He, Y. Nondestructive measurement of the internal quality of bayberry juice using Vis/NIR spectroscopy. J. Food Eng. 2007, 79, 1015–1019. [Google Scholar] [CrossRef]
  16. Zou, X.; Zhang, J.; Huang, X.; Zheng, K.; Wu, S.; Shi, J. Distinguishing watermelon maturity based on acoustic characteristics and near infrared spectroscopy fusion technology. Trans. Chin. Soc. Agric. Eng. 2019, 35, 301–307. [Google Scholar] [CrossRef]
  17. Swamy, K.V.; Rajaneesh, S.; Mahalaxmi, S.; Revanth, P. Watermelon Classification using Machine Learning with Enhanced Features. In Proceedings of the 2025 International Conference on Advances in Modern Age Technologies for Health and Engineering Science (AMATHE), Shivamogga, India, 24–25 April 2025; pp. 1–5. [Google Scholar] [CrossRef]
  18. Lazim, S.S.R.; Nawi, M.N.; Bejo, S.K.; Shariff, A.R.M. Prediction and classification of soluble solid contents to determine the maturity level of watermelon using visible and shortwave near infrared spectroscopy. Int. Food Res. J. 2022, 29, 1372–1379. [Google Scholar] [CrossRef]
  19. Ranjan, S.; Rahul, H.C.; Ajay, S.; Manoj, K. RF-DETR Object Detection vs YOLOv12: A Study of Transformer-based and CNN-based Architectures for Single-Class and Multi-Class Greenfruit Detection in Complex Orchard Environments Under Label Ambiguity. Comp. Sci. 2025, 2504, 13099. [Google Scholar] [CrossRef]
  20. Lin, X.; Liao, D.; Du, Z.; Wen, B.; Wu, Z.; Tu, X. SDA-YOLO: An Object Detection Method for Peach Fruits in Complex Orchard Environments. Sensors 2025, 25, 4457. [Google Scholar] [CrossRef]
  21. Jin, T.; Han, X.; Wang, P.; Zhang, Z.; Guo, J.; Ding, F. Enhanced deep learning model for apple detection, localization, and counting in complex orchards for robotic arm-based harvesting. Smart Agri Technol. 2025, 10, 100784. [Google Scholar] [CrossRef]
  22. Jia, W.; Tian, Y.; Luo, R.; Zhang, Z.; Lian, J.; Zheng, Y. Detection and segmentation of overlapped fruits based on optimized mask R-CNN application in apple harvesting robot. Comp. Electr. Agric. 2020, 172, 105380. [Google Scholar] [CrossRef]
  23. He, L.; Wu, D.; Zheng, X.; Xu, F.; Lin, S.; Wang, S.; Ni, F.; Zheng, F. RLK-YOLOv8: Multi-stage detection of strawberry fruits throughout the full growth cycle in greenhouses based on large kernel convolutions and improved YOLOv8. Front. Plant Sci. 2025, 16, 1552553. [Google Scholar] [CrossRef] [PubMed]
  24. Al-Sai, Z.A.; Husin, M.H.; Syed-Mohamad, S.M.; Abdullah, R.; Zitar, R.A.; Abualigah, L.; Gandomi, A.H. Big Data Maturity Assessment Models: A Systematic Literature Review. Big Data Cogn. Comput. 2023, 7, 2. [Google Scholar] [CrossRef]
  25. Bao, Z.; Li, W.; Chen, J.; Chen, H.; John, V.; Xiao, C.; Chen, Y. Predicting and Visualizing Citrus Color Transformation Using a Deep Mask-Guided Generative Network. Plant Phenomics 2023, 5, 0057. [Google Scholar] [CrossRef] [PubMed]
  26. Júnior, M.R.B.; dos Santos, R.G.; de Azevedo Sales, L.; Vargas, R.B.S.; Deltsidis, A.; de Oliveira, L.P. Image-based and ML-drivenanalysis for assessing blueberry fruit quality. Heliyon 2025, 11, e42288. [Google Scholar] [CrossRef]
  27. Kang, S.; Fan, J.; Ye, Y.; Li, C.; Du, D.; Wang, J. Maturity recognition and localisation of broccoli under occlusion based on RGB-Dinstance segmentation network. Biosyst. Eng. 2025, 250, 270–284. [Google Scholar] [CrossRef]
  28. Kang, S.; Li, D.; Li, B. Maturity identification and category determination method of broccoli based on semantic segmentation models. Comp. Electr. Agric. 2024, 217, 108633. [Google Scholar] [CrossRef]
  29. Aguiar, F.P.L.; Nääs, I.A.; Okano, M.T. Bridging the Gap Between Computational Efficiency and Segmentation Fidelity in Object-Based Image Analysis. Animals 2024, 14, 3626. [Google Scholar] [CrossRef]
  30. Li, Y.; Li, J.; Luo, L.; Wang, L.; Zhi, Q. Tomato ripeness and stem recognition based on improved YOLOX. Sci. Rep. 2025, 15, 1924. [Google Scholar] [CrossRef]
  31. Li, X.; Xu, C.; Korban, S.S.; Chen, K. Regulatory Mechanisms of Textural Changes in Ripening Fruits. Crit. Rev. Plant Sci. 2010, 29, 222–243. [Google Scholar] [CrossRef]
  32. Chae, Y. Color appearance shifts depending on surface roughness, illuminants, and physical colors. Sci. Rep. 2022, 12, 1371. [Google Scholar] [CrossRef]
  33. Mo, Y.; Bai, S.; Chen, W. ASHM-YOLOv9: A Detection Model for Strawberry in Greenhouses at Multiple Stages. Appl. Sci. 2025, 15, 8244. [Google Scholar] [CrossRef]
  34. Sui, X.; Zou, J.; Geng, Z.; Yang, H.; Hou, J.; Feng, L. Electrochemical impedance spectroscopy for pear ripeness detection and integration with robotic manipulators. Food Control. 2025, 177, 111425. [Google Scholar] [CrossRef]
  35. Meng, Z.; Du, X.; Sapkota, R.; Ma, Z.; Cheng, H. YOLOv10-pose and YOLOv9-pose: Real-time strawberry stalk pose detection models. Comput. Ind. 2025, 165, 104231. [Google Scholar] [CrossRef]
  36. Ramu, T.B.; Kocherla, R.; Sirisha, G.N.V.G.; Lakshmi Chetana, V.; Vidya Sagar, P.; Balamurali, R.; Boddu, N. Transformer based models with hierarchical graph representations for enhanced climate forecasting. Sci. Rep. 2025, 15, 23464. [Google Scholar] [CrossRef]
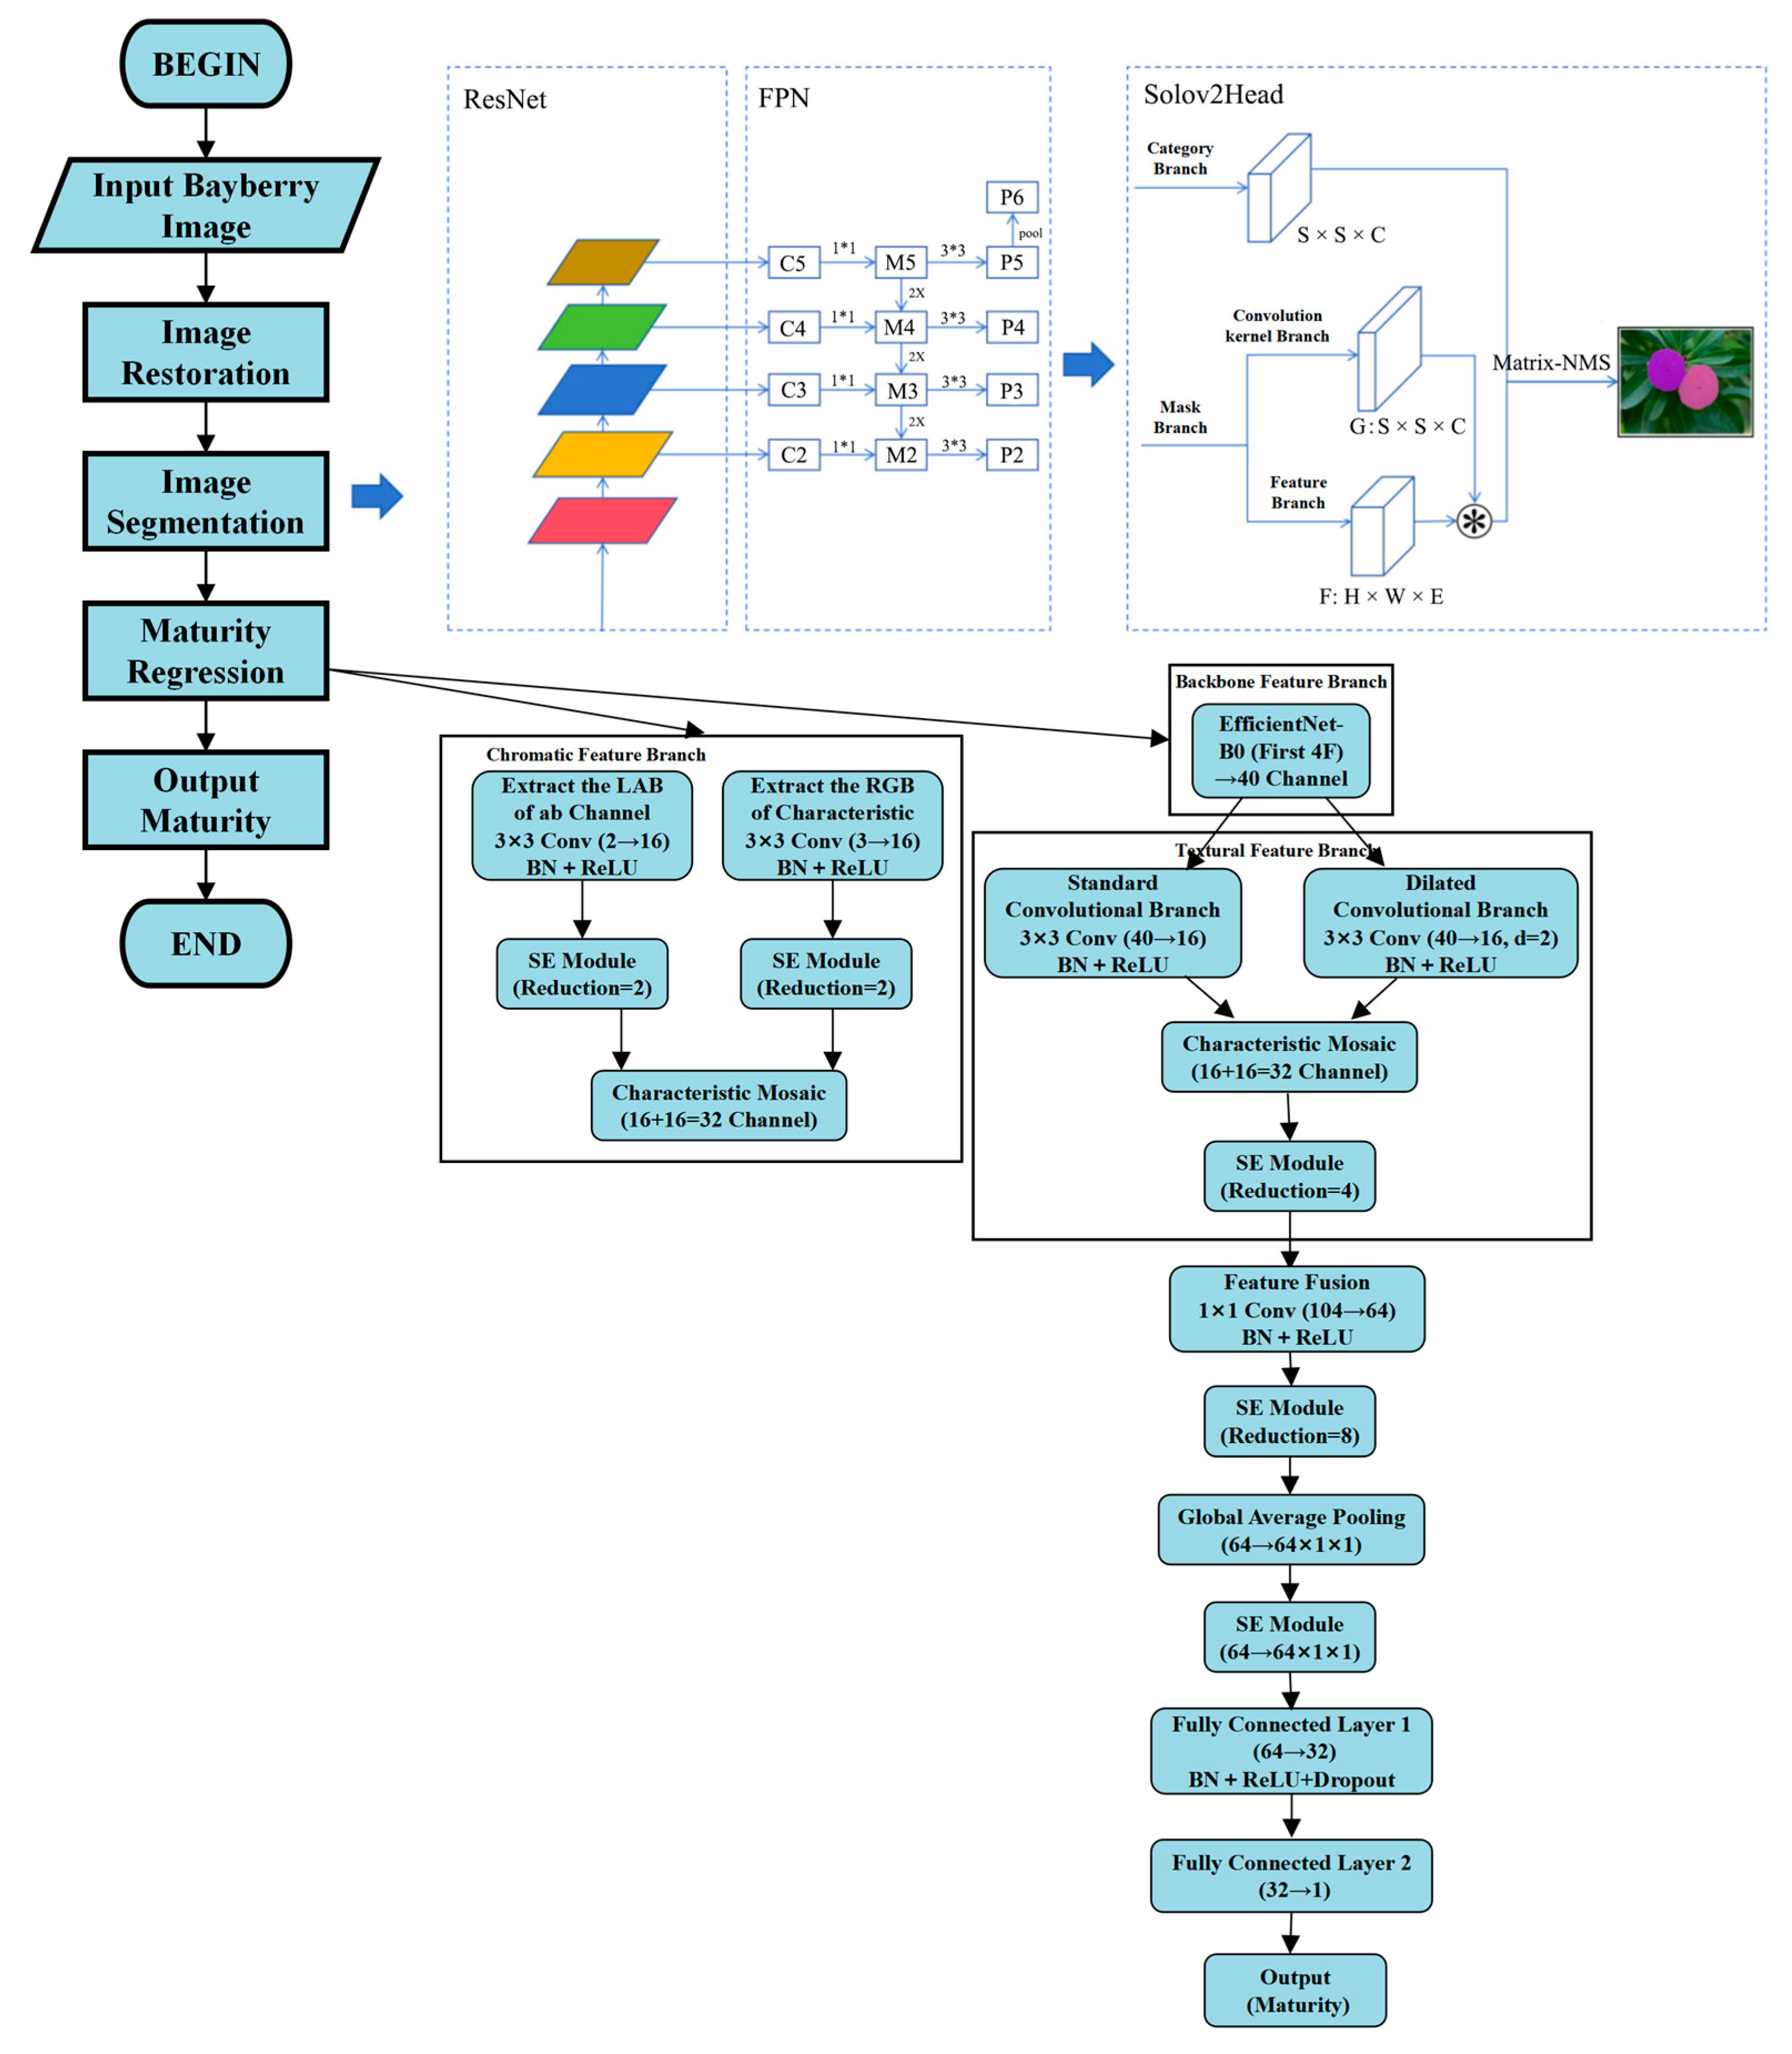
Figure 1. Flowchart of maturity detection. The colors represent different identifiable objects. Arrows represents the analysis process.
Horticulturae 11 01166 g001
Figure 2. Partial sample of the dataset. (A) Insufficient light, (B) High light exposure, (C) Fruit stacking, (D) Obscured by leaves.
Horticulturae 11 01166 g002
Figure 3. Comparison chart of CLAHE treatment effects. (A) Original image, (B) Processed image.
Horticulturae 11 01166 g003
Figure 4. Partial data samples of the Chinese bayberry instance segmentation dataset. (A) Original image, (B) Annotation result. The colors represent different identifiable objects.
Horticulturae 11 01166 g004
Figure 5. The sample data from the regression dataset of different maturity levels of Chinese bayberry. (A) Mature fruit; (B) green-ripe fruit; (C) veraison fruit; (D) sheltered fruits.
Horticulturae 11 01166 g005
Figure 6. Chinese bayberry instance segmentation: cross-scenario performance comparison. (A) Veraison fruit; (B) mature fruit; (C) green-ripe fruit; (D) sheltered fruits. From left to right: ground truth, predictions of our SOLOv2-Light, Mask R-CNN, and YOLACT. Each color represents a distinct instance mask.
Horticulturae 11 01166 g006
Figure 7. Prediction performance of the regression model. A simple scenario and a complex scenario with multiple stacked fruits. The predicted maturity percentage is shown above each fruit. Each color represents a distinct instance mask.
Horticulturae 11 01166 g007
Table 1. Instance segmentation performance on datasets.
ModelBackbone NetworkmAPAP50AP75Size/MBFlops
SOLOv2Resnet500.802 a0.792 a0.792 a46.233 a223G a
SOLOv2-LightResnet500.788 b0.782 a0.782 a31.161 b58G b
Bold font indicates the optimal results of each column. Different letters indicate statistically significant difference in one-way ANOVA analysis (p < 0.05).
Table 2. Quantitative comparison results of instance segmentation models on the Chinese bayberry instance segmentation dataset.
ModelBackbone NetworkmAPAP50AP75Size/MBFlops
SOLOv2-LightResnet500.788 a0.792 a0.792 a31.161 c58G c
Mask R-CNNResnet500.756 b0.782 a0.782 ab43.977 a235G a
YOLACTResnet500.767 b0.793 a0.761 b34.734 b62G b
Bold font indicates the optimal results of each column. Different letters indicate statistically significant difference in one-way ANOVA analysis (p < 0.05).
Table 3. Result MFENet Module Ablation Experiments.
ModelColor Feature ExtractionTextural Feature ExtractionMAErmseSize/MB
MFENet××4.4184 a5.6980 a118.82 b
MFENet×4.1745 ab5.7797 a119.84 b
MFENet×4.2696 a5.8487 a180.09 a
MFENet3.9466 b5.0061 b181.10 a
Bold text indicates the optimal results per column. √ and × symbols are module inclusion and exclusion, respectively. Different letters indicate statistically significant difference in one-way ANOVA analysis (p < 0.05).
Table 4. A comparison between the model and the object detection model.
ModelsAccuracytotal (%)AccuracyImmature (%)Accuracysemi-mature (%)Accuracymature (%)Time (s)
Model 95.51 a97.22 a98.84 a80.77 b0.98 b
YOLOX-s80.6 b83.4 b74.6 c83.8 a1.81 a
Faster R-CNN83.6 b85.9 b89.9 b75 c1.89 a
Bold text indicates the optimal results per column. Different letters indicate statistically significant difference in one-way ANOVA analysis (p < 0.05).
Disclaimer/Publisher’s Note: The statements, opinions and data contained in all publications are solely those of the individual author(s) and contributor(s) and not of MDPI and/or the editor(s). MDPI and/or the editor(s) disclaim responsibility for any injury to people or property resulting from any ideas, methods, instructions or products referred to in the content.