Article

Genetic Diversity and Structure of a Critically Endangered Ornamental Species, Rhododendron farinosum, with Extremely Small Populations

1
Institute of Highland Forest Science, Chinese Academy of Forestry, Kunming 650233, China
2
College of Landscape Architecture, Nanjing Forestry University, Nanjing 210037, China
3
Yunnan General Administration of Forestry Seeds and Seedlings, Kunming 650215, China
4
College of Landscape and Horticulture, Yunnan Agricultural University, Kunming 650500, China
5
Yunnan Jicheng Landscape Technology Co., Ltd., Mile 652399, China
6
Key Laboratory of Comprehensive Conservation for Extremely Small Populations of Wild Plants in Yunnan Province, Kunming Institute of Botany, Chinese Academy of Sciences, Kunming 650201, China
7
Key Laboratory of Resource Insect Cultivation and Utilization, State Forestry and Grassland Administration, Kunming 650233, China
*
Authors to whom correspondence should be addressed.
Horticulturae 2025, 11(1), 51; https://doi.org/10.3390/horticulturae11010051
Submission received: 27 October 2024 / Revised: 29 December 2024 / Accepted: 4 January 2025 / Published: 7 January 2025
(This article belongs to the Special Issue Germplasm, Genetics and Breeding of Ornamental Plants)

Abstract

:
A comprehensive study of the genetic characteristics of endangered species is a prerequisite for their effective conservation and management. Rhododendron farinosum is an endangered ornamental species with extremely small populations located in northeastern Yunnan Province. To unravel the reasons behind the endangerment of this species and provide guidance for the rational conservation of this species, this study obtained a large number of SNP loci by using double-digest restriction-site-associated DNA sequencing (ddRAD-seq) to evaluate the genetic diversity and genetic structure of R. farinosum, as well as to infer the population history of this species. Our findings reveal that, at the population level, R. farinosum exhibited a high genetic diversity (π = 0.1948 ± 0.0020, HE = 0.1880 ± 0.0020). The FST values (0.1383–0.2231) indicated high genetic differentiation among the three populations. The AMOVA revealed that 62.83% of the genetic variation originated within populations and 37.17% between populations. The PCA, Structure, and UPGMA consistently depicted that the three populations of R. farinosum are clearly distinguished into three clusters. Furthermore, the effective population size of R. farinosum was inferred to date back to 95,000 years ago using the stairway plot, with a continuous decline from 3292 years. Based on these findings, we propose conservation strategies and management measures for R. farinosum.

1. Introduction

The genetic diversity of a species is the result of its evolution and long-term adaptation to its external environment, and, at the same time, is a necessary prerequisite for the survival and development of the species [1]. It is also a critical factor for the survival and development of a species. The loss of genetic diversity diminishes a species’ adaptability and increases the risk of extinction [2]. The long-term survival of endangered species is largely dependent on being able to maintain sufficient genetic variation to adapt to long-term environmental change [3]. An increase in genetic diversity enhances a species’ adaptability to the environment, while a decrease can reduce both adaptability and reproductive capacity [4,5]. Over time, this decline may result in a loss of evolutionary potential and environmental adaptability [6]. Thus, maintaining genetic diversity is key to species conservation. Research should be conducted before formulating scientifically sound conservation strategies so that scientifically effective measures can be taken to save endangered species.
The use of molecular markers to study, among other things, the genetic diversity and genetic structure of species is one of the most efficient and precise methods in the field of research today [7]. It not only contributes to the kinship between and within individual populations but also reveals the evolutionary potential and adaptive mechanisms of species [8]. A single-nucleotide polymorphism (SNP) is a variation at a specific position in the DNA sequence, representing the most abundant form of genomic variation and the preferred marker for population analysis [9]. It is characterized by a low mutation rate, genome-wide distribution, high stability, easy detection, and low cost, making it valuable for genetic diversity and genome analysis [10]. With the advent of next-generation sequencing technologies has come a variety of new methods capable of identifying thousands of markers across virtually the entire target genome, increasing the validity of studies of genetic diversity and genetic structure [11]. Among them, RAD-seq is a sequencing method based on NGS technology, which is mainly digested by restriction endonucleases, such as EcoRI or SbfI, or a combination of the two enzymes, and then sequenced by restriction sites, which generates a wealth of reads and uncovers a large number of SNP markers within a species [12]. It has the advantages of generating a large amount of genomic data, low cost, simplified library construction process, and no need for a reference genome [13]. The technique is now widely used in conservation research and population genetics.
Rhododendron is a genus of flowering plants widely distributed throughout the world (except Africa and South America) and is one of the most widely distributed genera of the Ericaceae, with more than 1000 species. China has a total of 571 species, of which 409 are endemic [14]. The central area of diversification and differentiation of the genus Rhododendron is located in southwestern China and the Eastern Himalayan region [15]. It is a highly ornamental woody plant and also an important part of the alpine and subalpine vegetation of southwestern China [16]. Many Rhododendrons are at risk of extinction due to current habitat destruction and increasingly severe climatic conditions. Rhododendron farinosum is an evergreen shrub with high ornamental value distributed in northeastern Yunnan. At present, due to the excessive exploitation of human activities (mining, construction of houses and roads, grazing, etc.), natural factors (mudslides), and the species characteristics, the population of this species has continued to decline, and has been listed as an endangered species (EN) by The Red List of Rhododendrons [17], and is also a plant species with extremely small populations (PSESP) in Yunnan Province. Through the investigation of known distribution sites and possible distribution sites, it was found that there is one population in Qiaojia Yaoshan, Zhaotong, with less than 100 plants. Two populations in Lanniping Village, Xinglongping, Dongchuan District, Kunming City, and Lengjiaping, Zhaoyang District, Zhaotong City (Figure 1), with only more than 500 individuals, and the three populations have not been protected by protected areas, and are facing the challenge of being endangered. Therefore, given the current status of R. farinosum as an endangered species, research on its conservation biology and molecular genetics level is very important and can provide a scientific basis for the development of effective conservation strategies.
For endangered species, genetic information is critical to the continued development and management of the species. However, despite the endangered status of R. farinosum, there are gaps in the research to date on aspects of genetic diversity and the genetic structure of the species. In this study, the conservation genomics of 50 R. farinosum samples from three populations was investigated using SNP loci developed by double-digest restriction-site-associated DNA sequencing (ddRAD-seq). Genetic diversity and genetic structure were also assessed to identify populations with a high genetic diversity and prioritize them for conservation. Further, historical population dynamics are reconstructed to reveal the evolutionary history of the population and to predict future population trends. These analyses are also used to make reasonable recommendations for the conservation and scientific management strategies of R. farinosum.

2. Materials and Methods

2.1. Experimental Material and Extraction of DNA

The experimental materials were derived from 50 samples across three populations located in Lanniping, Yaoshan, and Lengjiaping (Table 1). Within each population, the distance between sampled plants was approximately 10 m, and fresh tender leaves were collected. After collection, the leaves were quickly preserved with silica gel. DNA was extracted from 50 samples using the cetyltrimethylammonium bromide (CTAB) method [18]. The integrity of the sample DNA was examined using 1.2% agarose gel electrophoresis. The concentration detection was carried out using a Qubit 3.0 fluorescence quantimeter. For the samples with severe degradation, the brightness of the master band marker was used to quantify the samples.

2.2. ddRAD Library Preparation and Sequencing

Library construction was performed according to the method described by Peterson [12]. The volume of each DNA sample extracted was adjusted to 10 μL and the total amount of DNA was 200 ng. To each DNA sample, 10 μL of pre-mixed double digestion mix (EcoRI + MseI) was added and mixed with 20 μL of lance pipetting, after which it was placed on the PCR instrument for digestion, 8 h of reaction at 37 °C, 20 min of reaction at 65 °C, and holding at 12 °C. Pipetting 5 μL of each sample of the digestion product was tested by agarose gel electrophoresis to verify the digestion effect. To the digested products of each sample, EcoRI end junction with specific label (barcode) and ligation mixture containing universal MseI junction were added, ligated with T4 DNA ligase (NEB), and mixed thoroughly by pipetting with a 200 μL lance tip, and then placed in a PCR instrument, and the reaction was carried out for 8 h at 16 °C, 20 min at 65 °C, and kept warm at 12 °C. After ligation was completed, cut gel recovery (Omega gel recovery kit) was performed under agarose gel electrophoresis, and fragments in the range of 350–550 bp were screened. The libraries were subsequently amplified to the concentration required for sequencing. Then, 150 bp double-ended sequencing was performed on the Illumina Novaseq platform (approximately 0.5 GB of raw data per sample).

2.3. SNP Calling

Raw data obtained from ddRAD library sequencing were processed and analyzed using Stacks v.2.55 [19]. First, the raw data were quality controlled using the process_radtags module, with len_limit set to 140 bp and rentain_header-t set to 135, to filter and multiplex low-quality reads. The ustacks module is run to cluster and de-emphasize the sequencing data of a single sample, identifying and constructing a specific region in the locus, the locus, with the main parameters set as follows—the number of mismatches allowed for two alleles in a heterozygous sample (-M), 5; and the depth value required to form the clusters (-m), 2—and, in addition to that, an ID number needs to be set for each sample. The catalog file is then generated using the default settings of the cstacks module for loci obtained for all loci. Using the sstacks module, the SNP, allele, and tag information of individual samples are compared with the catalog file to generate match files containing the comparison results. Run tsv2bam as well as the gstacks module for format conversion preparation before SNP calling. Finally, the population module was run for shared SNP calling, with the following parameter settings: minimum proportion of the locus in all individuals of a single population (-r): 0.7; the locus needs to be present in at least a few populations (-p): 3; specify minimum minor allele frequency (--min_maf): select the default value; and filtering for maximum observed heterozygosity (--max_obs_het): 0.5. Moreover, to avoid the impact of chaining imbalance on subsequent analyses, the data were analyzed considering only the first SNP (-write-single-SNP) at each locus.

2.4. Data Analysis

2.4.1. Analysis of Genetic Diversity and Structure

Using VCFtools 0.1.16 [20], a sliding window size of 3000 bp was set to calculate Tajima’s D values for R. farinosum, which was used to test the neutrality of the locus [21]. The Stacks v.2.55 software package contains analytical and statistical functions for genomics, and we used the populations module of Stacks v.2.55 to calculate several private allele counts (Private), expected heterozygosity (HE), observed heterozygosity (Ho), nucleotide diversity (π), the coefficient of inbreeding (FIS), the coefficient of genetic differentiation (FST), and other population genetics statistics. The significance between populations was tested using SPSS 26.0. Normality and variance homogeneity were first performed; nonparametric tests were performed between populations because the assumptions of one-way ANOVA were violated. In subsequent analyses, the group files that include the relationships between each sample and population, along with the VCF files, will be input into PGDSpider v2.1.1.5 [22] to convert the VCF files into the arp format, which will serve as the input files for Arlequin.
We imported arp format files into Arlequin v3.5.2.2 [23] and used the AMOVA module to conduct molecular variance analysis on all SNPs, to detect the levels of genetic variation within and among three R. farinosum populations. STRUCTURE v.2.3.4 [24] was used to estimate the number of genetic clusters in the population and the proportion of individuals belonging to different clusters. The number of genetic clusters K was set to 1–10, and attempts were made to classify the samples into 1–10 different clusters as a way of selecting the most appropriate number of clusters. The burn-in of the run was set to 5000 times, and the number of MCMC iterations was set to 10,000. The Structure results are then submitted to the online software Structure Harvester v.0.6.94 [25] for visualization, and the structure results are evaluated based on the delta’s value to select the best value of K. Latitude and longitude of the three populations was converted to geographic distances using the “geosphere” package for R.4.3.1. PCA clustering analysis, discriminant analysis of principal component (DAPC), and UPGMA phylogenetic tree construction were performed for all loci using the “Adegenet 2.1.10” package and “Poppr 2.9.6” package in R4.4.0.

2.4.2. Demographic History

Reconstructing Historical Population Dynamics and Inferring Contemporary Effective Population Sizes of R. farinosum using Stairway Plot v.2.1.2 [26]. The methodology evaluates the composite likelihood of observed site-frequency spectra (SFS) data as a means of revealing the historical population dynamics of effective population sizes [27]. Since the estimation of SFS does not allow for missing data, the site frequency spectrum (SFS) of R. farinosum was computed using downward projection via the Python script easySFS (https://github.com/isaacovercast/easySFS, Accessed on 4 June 2024), with the state of SFS specified as folded. The number of hit points was selected to maximize the SFS information output for as many projection values as possible, and the SFS information was entered into the blueprint file required for the stairway plot run. In this file, the number of random breakpoints per attempt (nrand) is set in the range of 14–58, nseq is set to 60, and pct_training is set to 0.67. It has been shown that Rhododendrons have a flowering time of about 10 a, as R. ponticum [28]. Therefore, the generation time for R. farinosum was set to 10 a. Given that the mutation rate of R. farinosum has not been clarified, and the mutation rate of R. weyrichii [29], R. cyanocarpum [30], and R. meddianum [31], which are in the same genus, was set to 1.581 × 10⁻⁹. Here, concerning the mutation rate of these species, the mutation rate of R. farinosum was also set to 1.581 × 10⁻⁹.

3. Results

3.1. ddRAD Sequencing and Data Processing

Using the process_radtags module inside stacks to perform data quality control on the downlinked data, a total of 6,754,399 no-rad tags and 20,929 low-quality sequences were discarded, and 238,817,410 high-quality sequences were retained. The single-sample data were clustered and de-emphasized using the ustacks module, and a total of 4,982,024 loci were obtained. The average depth of single locus sequencing was 13.9×, with a range of 7.22×~23.23×. For all loci obtained, they were merged using the cstacks module with default parameters, and a total of 1,825,550 catalog loci were obtained. By running the population module for shared SNP loci calling, a total of 9288 SNP loci were obtained.

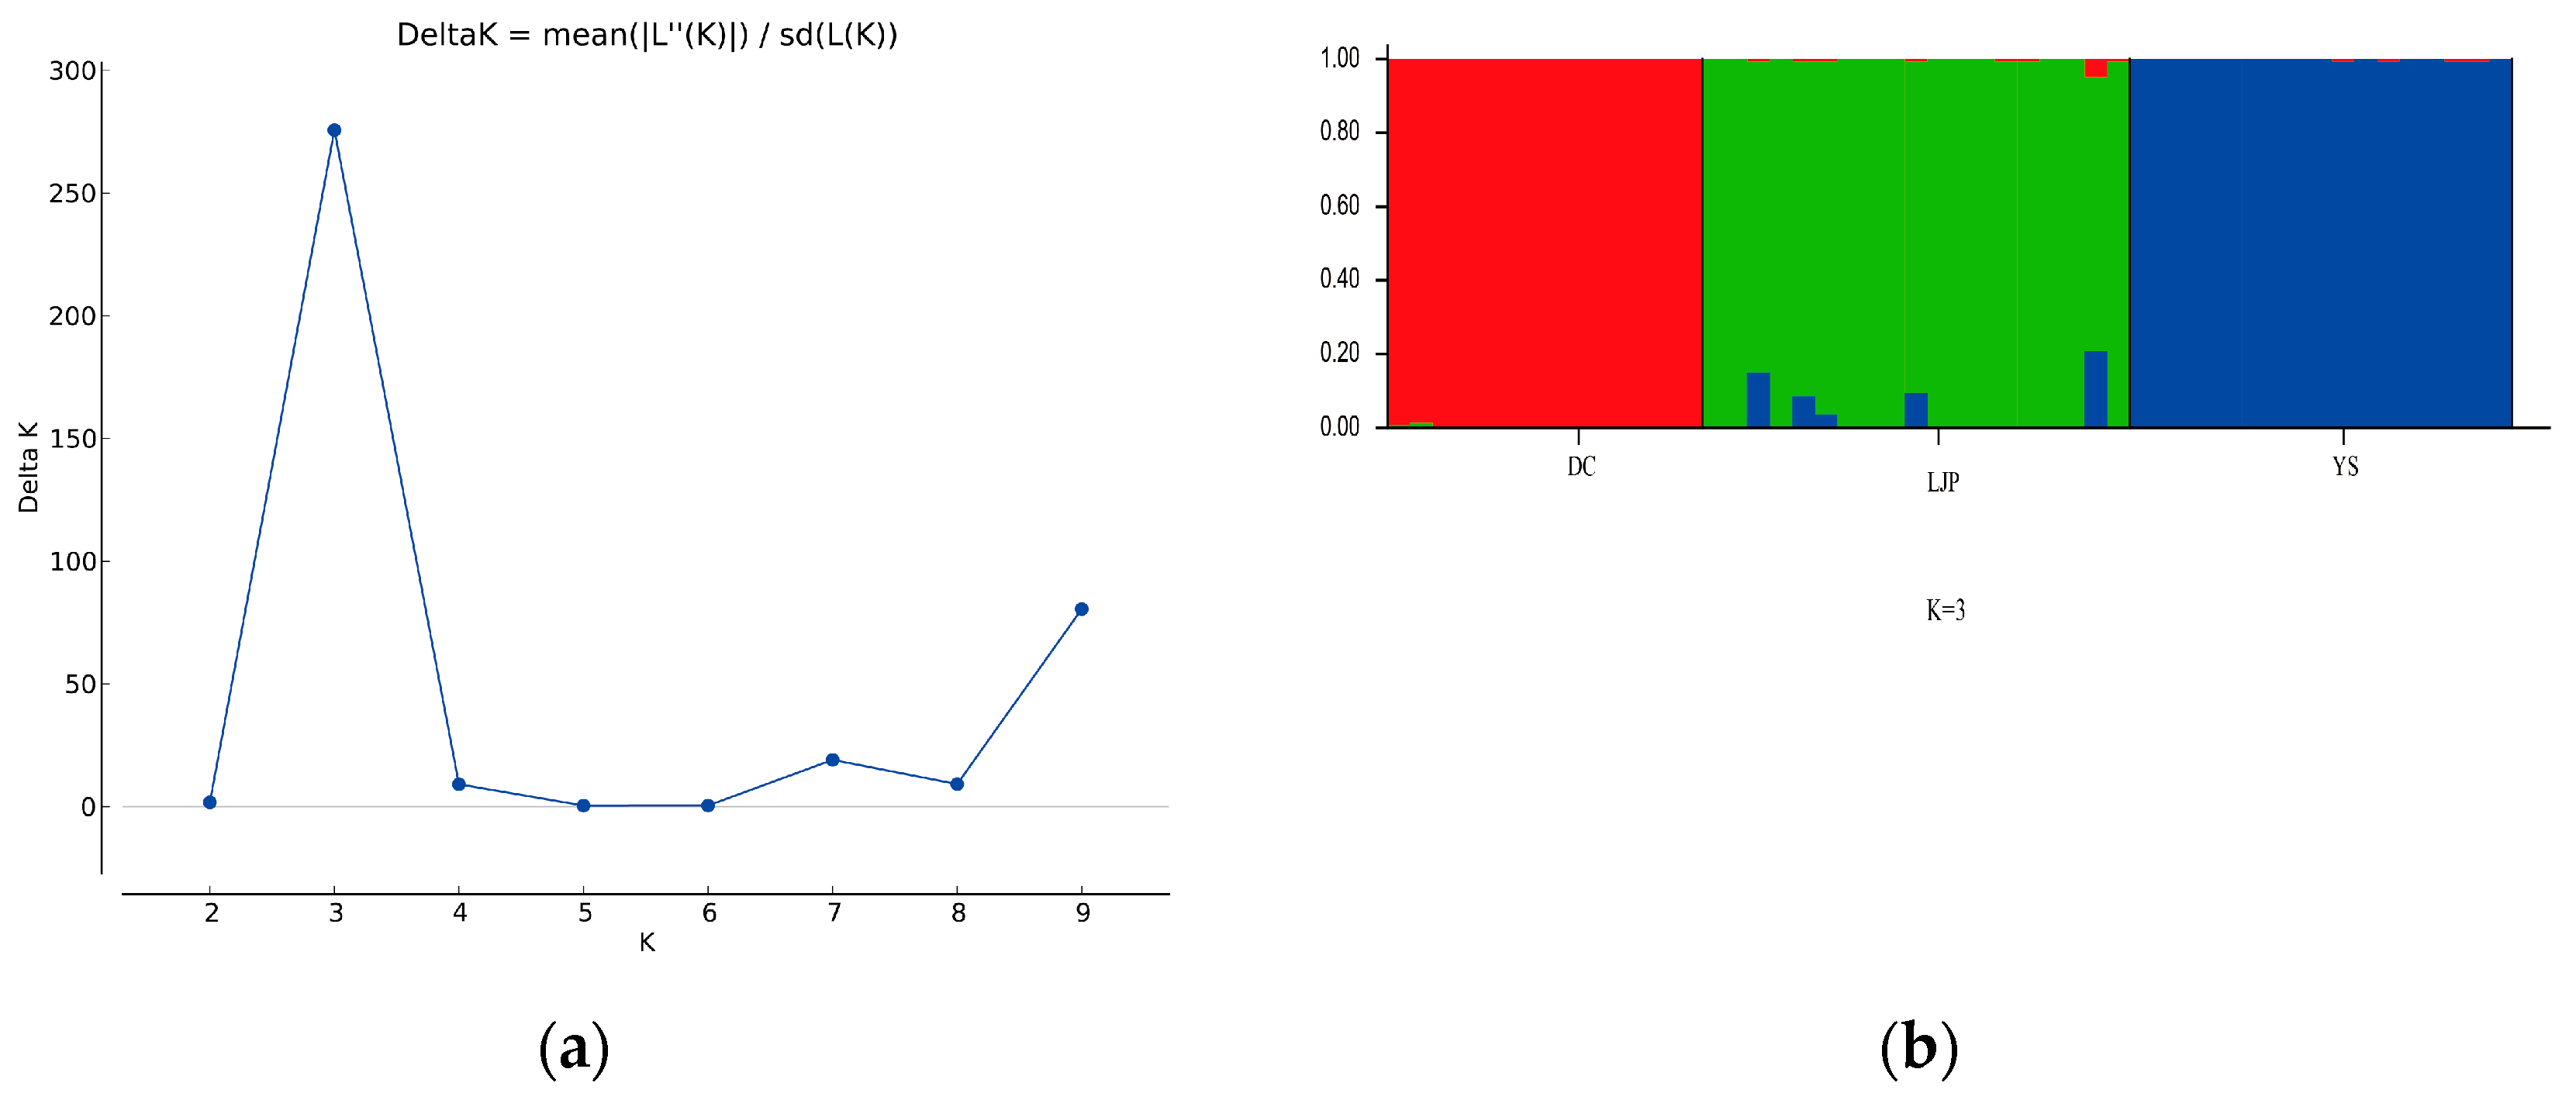
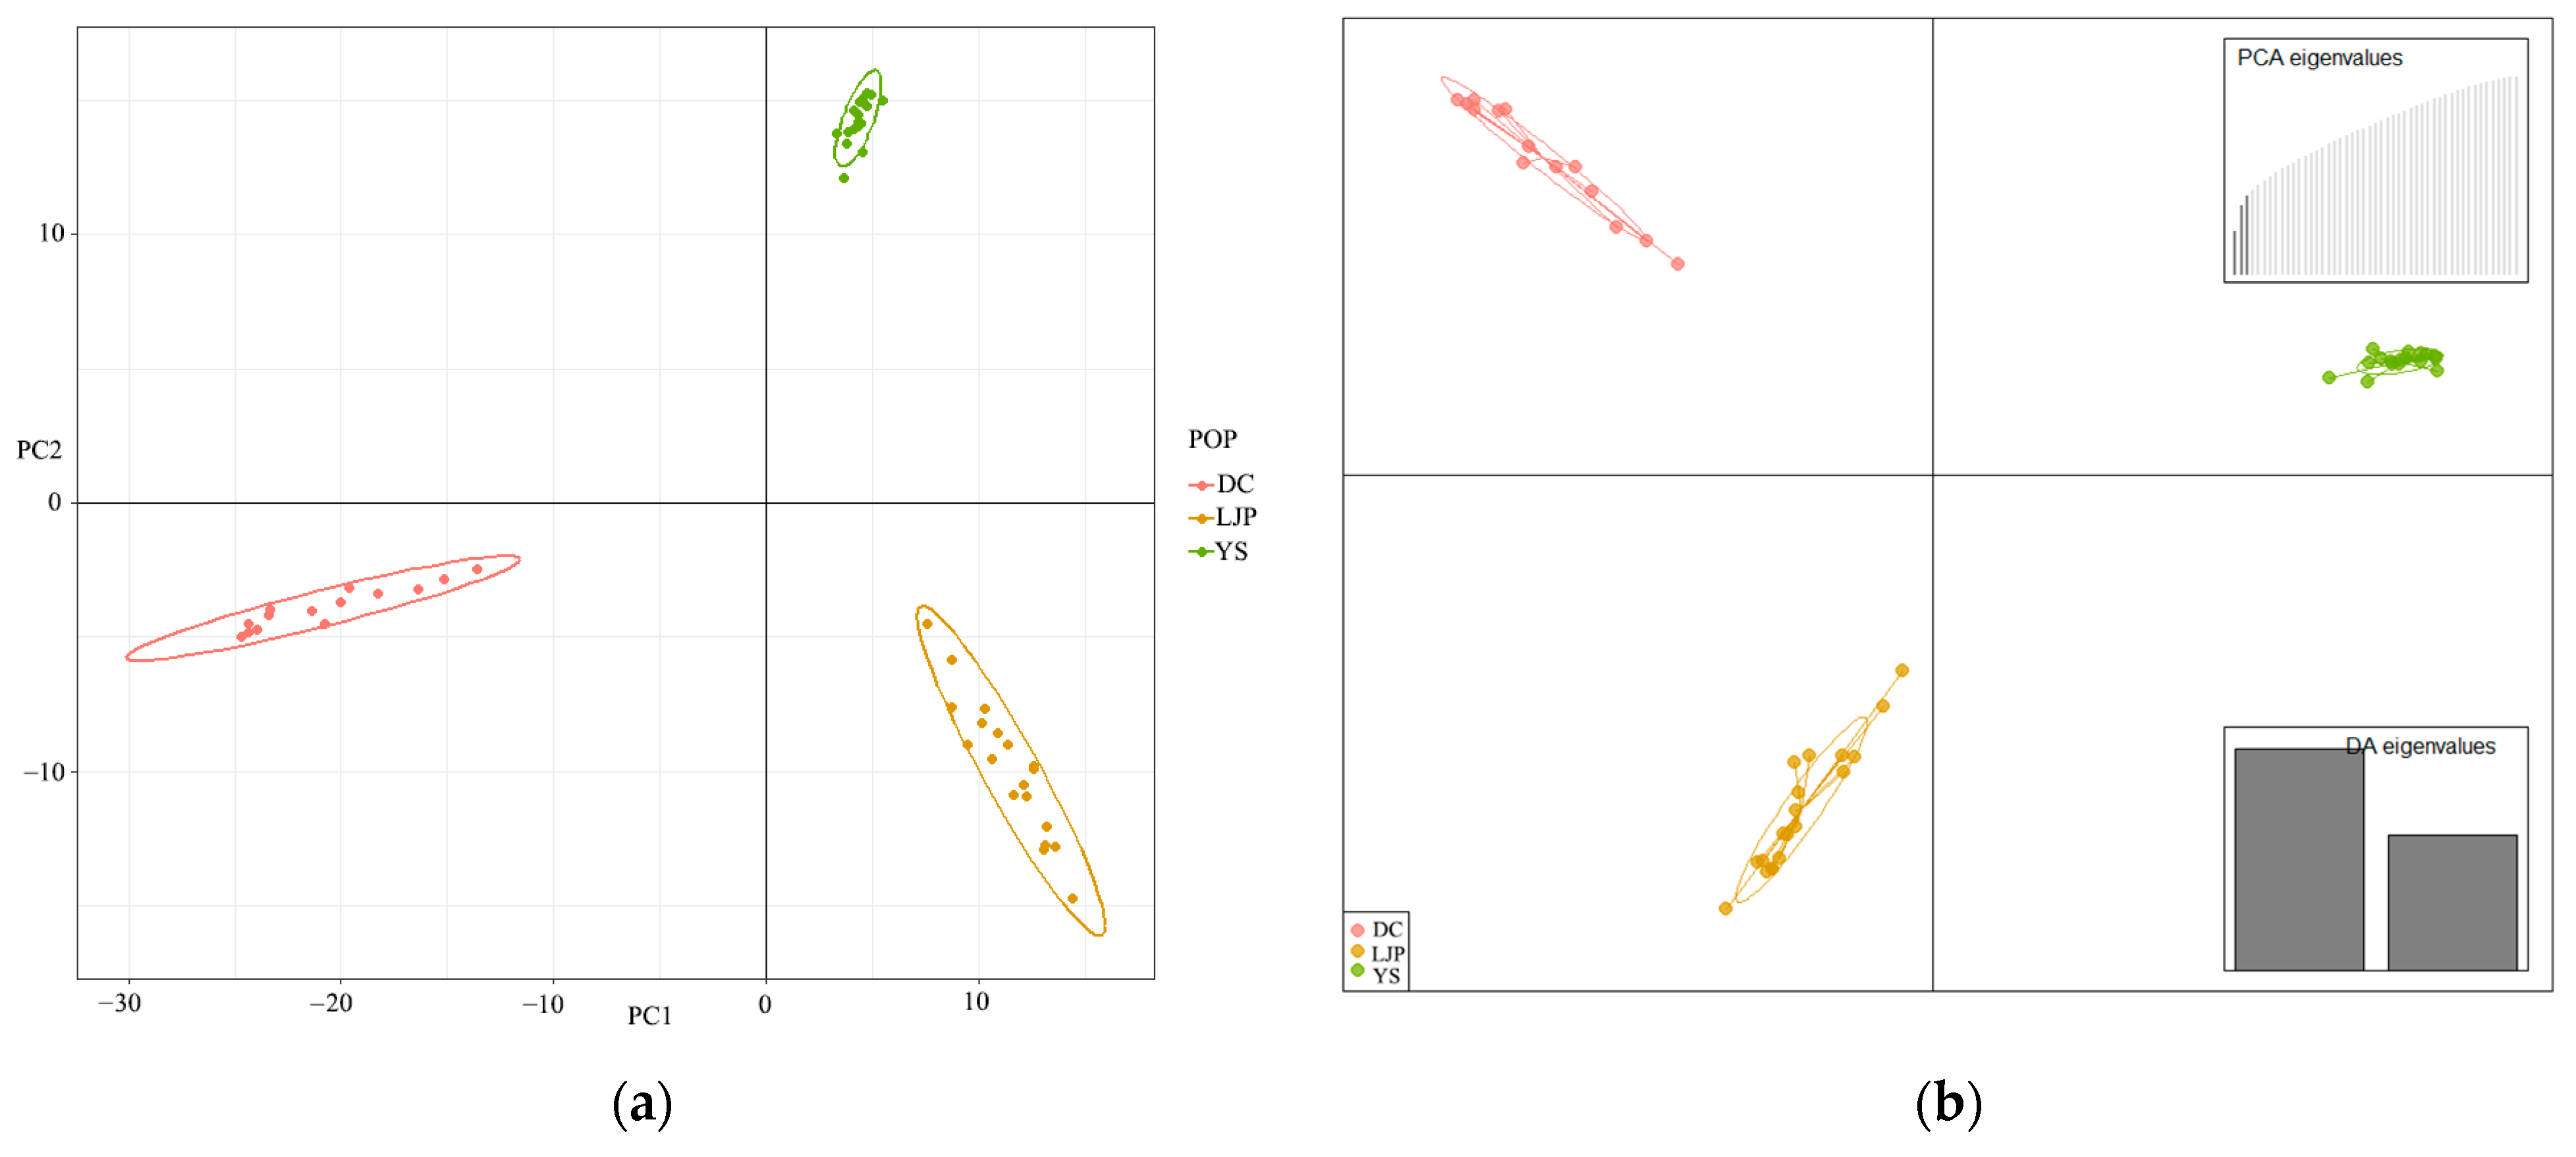
3.2. Genetic Diversity and Structure of R. farinosum

The result of Tajima’s D value for the three populations was 0.7541 (D > 0), indicating the presence of a high number of moderately frequent alleles, which may be the result of equilibrium selection or population contraction that the populations have experienced during their evolutionary history [32].
The genetic diversity of the populations all differed, and the results are shown in Table 2. The highest nucleotide diversity (π) was found in YS (π = 0.2140 ± 0.0020), followed by LJP (0.2089 ± 0.0020), and the lowest nucleotide diversity was found in DC (π = 0.1615 ± 0.0020), among the three populations, with a mean value of 0.1948 ± 0.0020. The observed heterozygosity (Ho) and expected heterozygosity (HE) of the population ranged from 0.0082 ± 0.0016~0.1461 ± 0.0020 and 0.1544 ± 0.0020~0.2069 ± 0.0020, with mean values of 0.1215 ± 0.0018 and 0.1880 ± 0.0020, respectively, and the observed heterozygosity was smaller than the expected heterozygosity. The data showed that the YS population had the highest genetic diversity (HE = 0.2069 ± 0.0020, π = 0.2140 ± 0.0020) and DC had the lowest genetic diversity (HE = 0.1544 ± 0.0020, π = 0.1615 ± 0.0020). LJP had the highest number of private alleles (1464) and DC had the lowest number of private alleles (1135). The FIS values were used to assess the self-fertilization of the R. farinosum, and the results were all positive, with a mean of 0.2130 ± 0.0151, which suggests that there is inbreeding in the three populations, leading to an elevated proportion of purebloods and that there may be a risk of inbreeding depression. The genetic parameters Ho, HE, π, and FIS showed significant genetic differences among the three populations (HE: p = 0.000, Ho: p = 0.000, π: p = 0.000, and FIS: p = 0.017).
Using FST values to measure the genetic differentiation among populations, the paired FST values among populations ranged from 0.1383 ~ 0.2231 in the three populations, with an FST of 0.2231 between DC and LJP, FST of 0.2074 between DC and YS, and 0.1383 between YS and LJP (Table 3), indicating that there was a large genetic differentiation (0.15 < FST < 0.25) and moderate genetic differentiation between YS and LJP (0.05 < FST < 0.15) [33]. An AMOVA analysis showed that the genetic variation (62.83%) (p < 0.01) of R. farinosum occurred mainly within populations and 37.17% (p < 0.01) among populations (Table 4), which may be the result of the long-term adaptation to local ecological conditions and population isolation. The Structure results show that ΔK is the largest when K = 3 (Figure 2a), indicating that 3 is the optimal number of clusters. When K = 3, the three populations were clearly distinguished into three taxa, with 14 individuals in DC clustered into one cluster (red), 19 individuals in LJP clustered into one cluster (green), and 17 individuals in YS clustered into one cluster (blue) (Figure 2b). The results of PCA coincided with the Structure results, clearly categorized into three clusters corresponding to DC, LJP, and YS, respectively (Figure 3a). The results of DAPC further confirmed this point (Figure 3b). The UPGMA tree showed similar clustering (Figure 4).

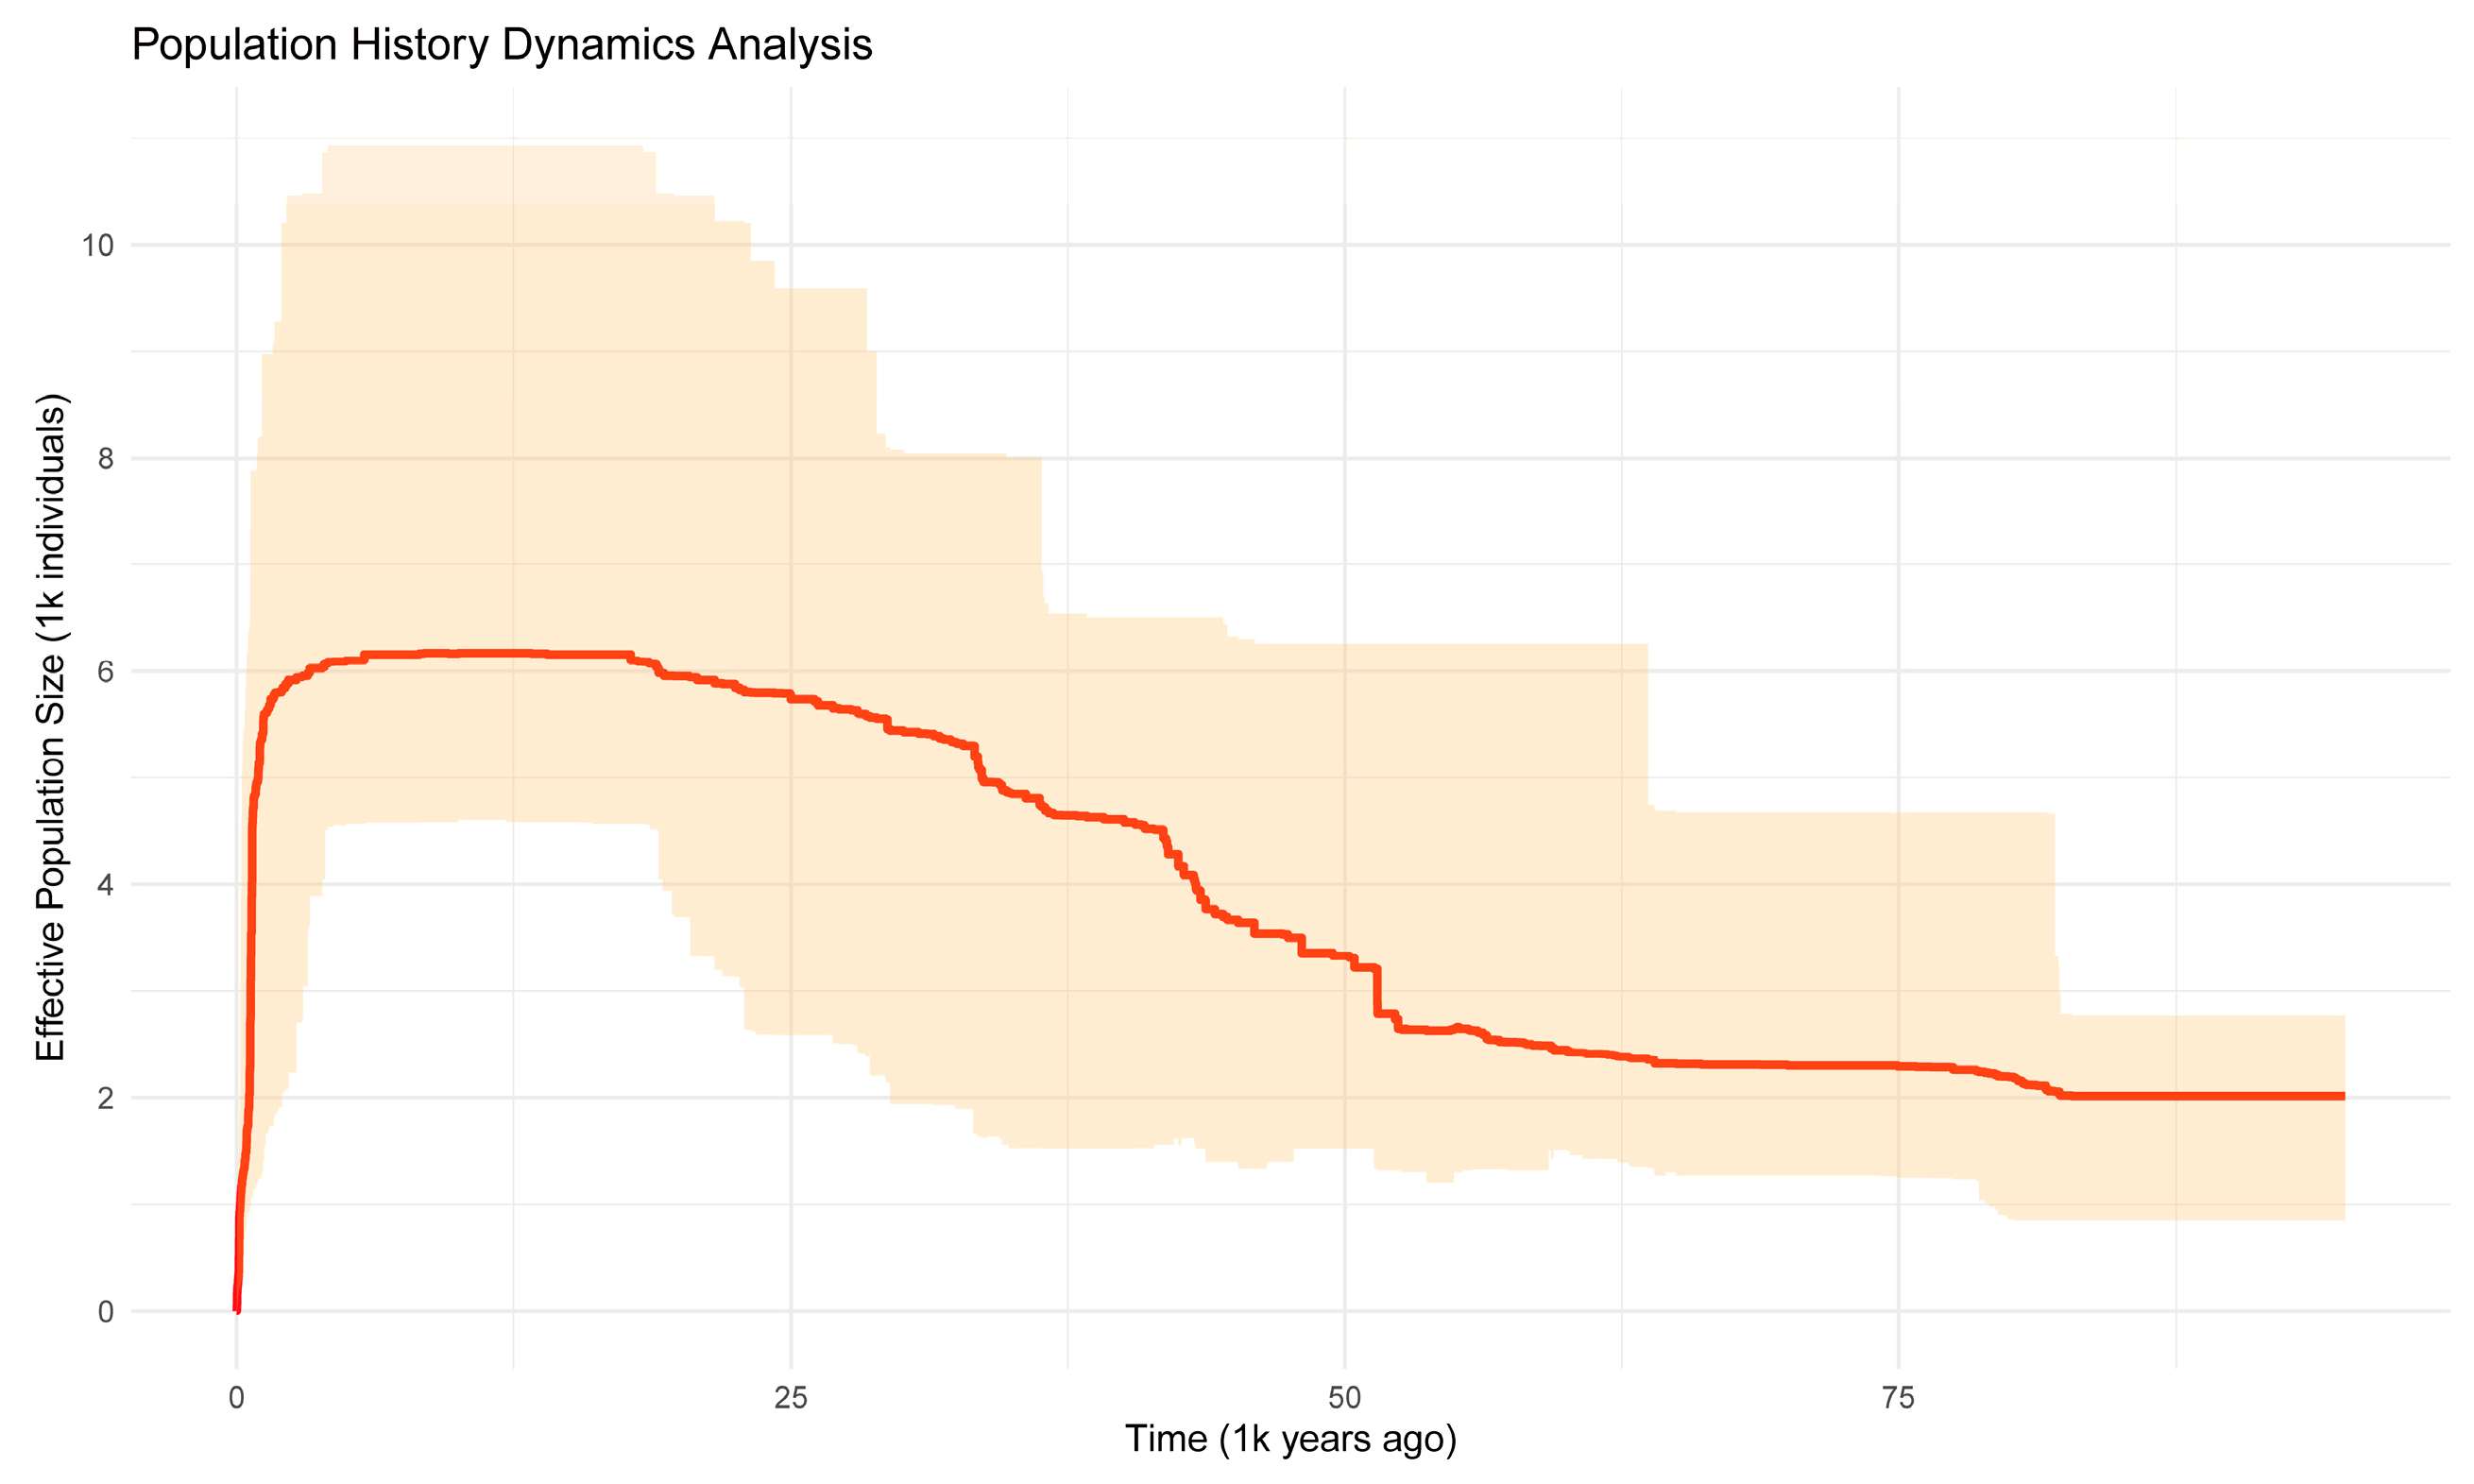
3.3. Population Demographic History of R. farinosum

The stairway plot extrapolated the historical population dynamics of the R. farinosum over time and showed (Figure 5) that the effective population size of the R. farinosum generally showed a pattern of expansion, followed by contraction. Beginning 95,000 years ago, in the Late Pleistocene (126–11.7 KaBp), there was a long and steady increase in effective population size, with a maximum number of 6172. During the period 17,000–3292 years, the population showed a relatively flat state. After this period, the effective population size showed a continuous downward trend until the present day.

4. Discussion

4.1. Genetic Diversity

Both the persistence and evolutionary potential of species depend on the genetic diversity [34], and exploring the genetic diversity of species is a top priority for the conservation of endangered species. The risk of loss of genetic diversity is greatly increased when the population of a species is fragmented into small segments with only a few individuals in each segment, which is more common in rare and endangered species [35]. Many studies have shown that endangered species tend to have lower levels of genetic diversity [36]. In contrast, in this study, the genetic diversity analysis indicates that the genetic diversity of R. farinosum was higher than that of other endangered species in the genera Cypripedium macranthos (HE = 0.0872~0.1749 π = 0.1119~0.1805) [37] and Eriodictyon capitatum (HE = 0.029~0.118 π = 0.031~0.127) [38], and species of the same genus R. cyanocarpum (HE = 0.0630 ± 0.0015 π= 0.0655 ± 0.0015) [30] and R. meddianum (HE = 0.0713 ± 0.0021 π = 0.0741 ± 0.0022) [31] were relatively high in genetic diversity. The high genetic diversity reflects the strong survival capabilities and tenacious adaptability of R. farinosum. Many factors affect the genetic diversity of plants. In general, biological traits, breeding systems, modes of reproduction, and the extent of habitat destruction are recognized as important factors influencing genetic diversity [39]. In most cases, long-lived perennial woody plants tend to lose genetic diversity at a relatively slow rate, at a reduced rate in the direction of weakening genetic variation, and are significantly less affected by genetic drift [40]. Meanwhile, although many studies have shown that the genetic diversity of species decreases in fragmented habitats [41], research has found that, in fragmented habitats, there are still populations that maintain a high genetic diversity [42]. This is because it takes several generations for the genetic signal of fragmentation to manifest itself, especially in long-lived species [43]. Rhododendrons are long-lived woody perennials [44]. We found in our field investigation that there have been large-scale mining areas, mining residential areas, and mining road construction activities in the surrounding environment of the DC population. The construction of houses and roads has led to the fragmentation of habitats and the destruction of vegetation in the area. The tail gas from smelting in mining areas can release toxic gases containing sulfides, which are limited by terrain conditions and are not easily diffused, causing them to settle on the surface and cause vegetation death [45]. In addition, there was a mudslide disaster in 1986 in the village of Lanniping, where the DC population is located, and the severely damaged ecological conditions led to a reduction in the amount of vegetation, but the DC population still retained a certain degree of genetic diversity, which is also higher compared to some other endangered species. The remaining two populations, LJP and YS, show a higher genetic diversity than DC but are also not protected by the reserve. It is speculated that the relatively high genetic diversity retained by the three populations may be due to the time lag in the loss of genetic diversity and fragmentation between habitats. The R. farinosum is a perennial, long-lived woody plant, and the signal of reduced genetic diversity takes longer to show [46].

4.2. Genetic Differentiation and Genetic Structure

Genetic structure is influenced by several factors, including genetic drift, seed size, breeding systems, gene flow, natural selection, and seed dispersal [47]. The results of both STRUCTURE and PCA reflect the formation of a clear separation between the three populations (DC, LJP, and YS) of the R. farinosum. This suggests that the three populations of R. farinosum have shown independence in their evolution. The population structure between the three populations is clear. The FST values ranged from 0.1383~0.223 among the three populations of R. farinosum, with moderate to high genetic differentiation. An AMOVA analysis showed that 37.17% of the genetic variation occurred between populations and 62.83% within populations. Genetic differentiation between populations may be caused by restricted gene exchange. Plants can exchange genes at the individual level through pollen and seed dispersal, which can lead to the migration of populations and reduce the degree of differentiation between populations [48]. Geographic distance, seed dispersers, and pollinators are all important factors that affect the ability of plants to exchange genes [49]. The pattern of genetic differentiation in this study is related to the limited dispersal distance of its pollen and seeds. Seeds of Rhododendron are dispersed over distances of 30–80 m, and pollen is generally dispersed by birds and bees over distances of 3–10 km [50]. The distance between DC, LJP, and YS is 165 km and 147 km, respectively, and the distance between LJP and YS is 24 km, which exceeds the distance over which seeds and pollen can be dispersed. It is hypothesized that distance, as well as biotic and abiotic factors in the inter-region, hindered the dispersal of pollen and seeds, which resulted in the limited gene exchange among the populations, and, thus, the three populations of the R. farinosum diverged. At the same time, the degree of genetic differentiation increased with increasing geographic distance [51], as verified by the differences in FST values among the three populations.

4.3. Population Dynamic History of R. farinosum

We investigated the historical population dynamics of the R. farinosum using the method of the stairway plot in conjunction with folded site-frequency spectroscopy (SFS). It was found that the effective population size of R. farinosum began to increase 95,000 years ago. Quaternary climatic oscillations had a profound effect on the population history and distribution of plants [52]. The climatic fluctuations of the Quaternary Ice Age, the breadth and depth of the ice sheet cover, and the significant drop in global temperatures have had a significant impact on the size and distribution of plant communities [53]. Studies have shown that many plant communities respond to glaciation by changing the altitude or latitude of their distribution and the size of their populations in response to glaciation [54]. This theory also applies to R. farinosum. It is documented that there are remnants of Quaternary glaciers in the area of Goblin Pond and Niudongping near Lanniping Village [55], the sampling site of the DC Resident Cluster, and in Yaoshan, the sampling site of the YS Resident Cluster, and the lowest elevations of these two glacial remnants are 3100 m and 3800 m, respectively, which are higher than the elevations of the three sampling sites. Therefore, to adapt to this change and respond to the action of glaciers, the R. farinosum community has migrated downwards along the local altitude at its original latitude [56], thus surviving and continuing to grow during the interglacial period. However, the effective population size of R. farinosum has continued to decline since 3292. This is perhaps because, at some point in time, the effective population size of R. farinosum decreased below a threshold that limits recovery, plunging it into an extinction spiral [57]. Secondly, it has also been shown that the loss of biodiversity and the mass extinction of species is directly linked to anthropogenic impacts [58]. After the end of the last glacial period, the warming of the climate and the disturbance of human activities (construction of roads, houses, mines, etc., and grazing) led to the fragmentation of habitats and the reduction in habitat area, which directly caused difficulties for the growth and spread of R. farinosum and its migration, and, consequently, the decline in the effective population size.

4.4. Conservation and Management Strategies

The loss of genetic diversity is currently the main threat faced by endangered species; therefore, protecting and restoring genetic diversity is an important measure for such species. The R. farinosum is an endangered species with extremely small populations, and protecting its genetic diversity is the top priority. Therefore, effective rescue and conservation measures should be taken to address the current threats to R. farinosum, as well as to expand the population size. In situ conservation is the most effective way to conserve the entire gene pool of endangered plants in their natural habitat. Natural populations of endangered species with a high genetic diversity are a rich resource for saving and conserving the species. We recommend the following conservation measures for R. farinosum based on the results of this study: (i) YS and LJP are two groups with a high genetic diversity, and, although the YS population is located in a protected area, some anthropogenic disturbances and damages cannot be avoided. To maximize the maintenance of their genetic variation, it is recommended that we implement in situ conservation for the two populations, to strengthen the management of the protected area and the region, carry out population monitoring, control anthropogenic disturbances, and make every effort to maintain the original habitat and the populations. (ii) In addition to in situ conservation, the establishment of a germplasm bank for endangered plants is recommended for ex situ conservation based on in situ conservation. (iii) For populations with a low genetic diversity, propagation materials such as branches and seeds should be collected and artificial cuttings and seedlings should be cultivated as a means of expanding existing populations, while human activities (land reclamation, grazing, etc.) should be restricted to minimize habitat destruction.

5. Conclusions

In summary, we systematically analyzed the genetic characteristics of three populations of R. farinosum using ddRAD-seq technology. The results indicate that all three populations of R. farinosum have a high genetic diversity, which may be due to the time lag between the loss of genetic diversity and habitat fragmentation. The degree of genetic differentiation is significant, and the three populations are clearly distinguished, with consistent results from Structure, PCA, and FST. In addition, the analysis of population historical dynamics shows that the effective population size of R. farinosum is continuously decreasing. Based on these analyses, we propose protection strategies.

Author Contributions

F.L.: experiments, data processing, thesis writing, and thesis revision; L.F.: experiments, and guidance; J.Z.: guidance; W.L. (Wen Liu): thesis revision; W.L. (Wei Li): guidance; Y.M.: collection of plant samples, guidance, and supervision; H.M.: funding acquisition, project administration, supervision, and thesis revision. All authors have read and agreed to the published version of the manuscript.

Funding

This research was funded by the Major Science and Technology Special Project of Yunnan Province (202302AE090018; 202203AP140153; 202202AE090012); the Science and Technology Project for Rural Revitalization (202404BI090014); Plant Species with Extremely Small Populations Conservation Project (2022SJ07X-03); Building Mile Rural revitalization science and technology innovation County (202304BT090021); and Xing Dian Talent Support Project (YNWRQNBJ-2019-010).

Data Availability Statement

The data will be made available upon request.

Acknowledgments

We thank all the colleagues who helped with different parts of this research.

Conflicts of Interest

Author Wei Li was employed by the company Wei Li Yunnan Jicheng Landscape Technology Co., Ltd. The remaining authors declare that the research was conducted in the absence of any commercial or financial relationships that could be construed as a potential conflict of interest.

References

  1. De Kort, H.; Prunier, J.G.; Ducatez, S.; Honnay, O. Life history, climate, and biogeography interactively affect the worldwide genetic diversity of plant and animal populations. Nat. Commun. 2021, 12, 516–527. [Google Scholar] [CrossRef] [PubMed]
  2. Hamabata, T.; Kinoshita, G.; Kurita, K.; Cao, P.L.; Ito, M.; Murata, J.; Komaki, Y.; Isagi, Y.; Makino, T. Endangered island endemic plants have vulnerable genomes. Commun. Biol. 2019, 2, 244–253. [Google Scholar] [CrossRef] [PubMed]
  3. Wang, Y.L.; Qin, Y.Y.; Du, Z.; Yan, G.Q. Genetic diversity and differentiation of the endangered tree Elaeagnus mollis Diels (Elaeagnus L.) as revealed by simple sequence repeat (SSR) markers. Biochem. Syst. Ecol. 2012, 40, 25–33. [Google Scholar] [CrossRef]
  4. Hamrick, J.L.; Godt, M.J.W.; Sherman-Broyles, S.L. Factors influencing levels of genetic diversity in woody plant species. New For. 1992, 6, 95–124. [Google Scholar] [CrossRef]
  5. Liu, X.F.; Ma, Y.P.; Wan, Y.M.; Li, Z.H.; Ma, H. Genetic diversity of Phyllanthus emblica from two different climate type areas. Front. Plant Sci. 2020, 11, 580812. [Google Scholar] [CrossRef] [PubMed]
  6. He, S.; Yuan, C.J.; Zhang, P.L.; Wang, H.D.; Luo, D.L.; Dai, X.Y. Study on the characteristics of genetic diversity of different populations of Guizhou endemic plant Rhododendron pudingense based on microsatellite markers. BMC Plant Biol. 2024, 24, 77–88. [Google Scholar] [CrossRef]
  7. Ruang-areerate, P.; Sonthirod, C.; Sangsrakru, D.; Waiyamitra, P.; Maknual, C.; Wanthongchai, P.; Chomriang, P.; Pootakham, W.; Tangphatsornruang, S. Elucidating SNP-Based Population Structure and Genetic Diversity of Bruguiera gymnorhiza (L.) Savigny in Thailand. Forests 2023, 14, 693. [Google Scholar] [CrossRef]
  8. Wang, Y.P.; Li, H.H.; Yang, Z.J.; Liu, B.Y.; Liu, Y.J.; Zhong, Y.D. Genotyping-by-Sequencing Study of the Genetic Diversity and Population Structure of the Endangered Plant Tsoongiodendron odorum Chun in China. Forests 2024, 15, 910. [Google Scholar] [CrossRef]
  9. Li, Z.; Ran, Z.H.; Zhang, Y.; An, M.T. Genetic Diversity and Structure of Geodorum eulophioides, a Plant Species with Extremely Small Populations in China. Diversity 2023, 15, 990. [Google Scholar] [CrossRef]
  10. Zhu, X.L.; Tang, J.M.; Jiang, H.D.; Yang, Y.S.; Chen, Z.Y.; Zou, R.; Xu, A.Z.; Luo, Y.J.; Deng, Z.H.; Wei, X. Genomic evidence reveals high genetic diversity in a narrowly distributed species and natural hybridization risk with a widespread species in the genus Geodorum. BMC Plant Biol. 2023, 23, 317–328. [Google Scholar] [CrossRef] [PubMed]
  11. Garcia, C.B.; Silva, A.V.; Carvalho, I.A.S.; Nascimento, W.F.D.; Ramos, S.L.F.; Rodrigues, D.P.; Zucchi, M.I.; Costa, F.M.; Alves-Pereira, A.; Araújo Batista, C.E.D. Low Diversity and High Genetic Structure for Platonia insignis Mart., an Endangered Fruit Tree Species. Plants 2024, 13, 1033. [Google Scholar] [CrossRef] [PubMed]
  12. Peterson, B.K.; Weber, J.N.; Kay, E.H.; Fisher, H.S.; Hoekstra, H.E. Double digest RADseq: An inexpensive method for de novo SNP discovery and genotyping in model and non-model species. PLoS ONE 2012, 7, e37135. [Google Scholar] [CrossRef] [PubMed]
  13. Cai, M.; Wen, Y.; Uchiyama, K.; Onuma, Y.; Tsumura, Y. Population genetic diversity and structure of ancient tree populations of Cryptomeria japonica var. sinensis based on RAD-seq data. Forests 2020, 11, 1192. [Google Scholar] [CrossRef]
  14. Wang, X.; Huang, Y.; Long, C. Cross-amplification and characterization of microsatellite loci for the genus Rhododendron. HortScience 2010, 45, 1394–1397. [Google Scholar] [CrossRef]
  15. Liu, N.Y.; Zhang, L.; Zhou, Y.L.; Tu, M.L.; Wu, Z.Z.; Gui, D.P.; Ma, Y.P.; Wang, J.H.; Zhang, C.J. The Rhododendron Plant Genome Database (RPGD): A comprehensive online omics database for Rhododendron. BMC Genom. 2021, 22, 376–385. [Google Scholar] [CrossRef] [PubMed]
  16. Li, K.J.; Liu, X.F.; Zhang, J.H.; Zhou, X.L.; Yang, L.; Shen, S.K. Complexity responses of Rhododendron species to climate change in China reveal their urgent need for protection. For. Ecosyst. 2023, 10, 100124. [Google Scholar] [CrossRef]
  17. Gibbs, D.; Chamberlain, D.; Argent, G. The Red List of Rhododendrons; Botanic Gardens Conservation International: Richmond, UK, 2011. [Google Scholar]
  18. Doyle, J.J.; Doyle, J.L. A rapid DNA isolation procedure for small quantities of fresh leaf tissue. Phytochem. Bull. 1987, 19, 11–15. [Google Scholar]
  19. Catchen, J.; Hohenlohe, P.A.; Bassham, S.; Amores, A.; Cresko, W.A. Stacks: An analysis tool set for population genomics. Mol. Ecol. 2013, 22, 3124–3140. [Google Scholar] [CrossRef] [PubMed]
  20. Danecek, P.; Auton, A.; Abecasis, G.; Albers, C.A.; Banks, E.; DePristo, M.A.; Handsaker, R.E.; Lunter, G.; Marth, G.T.; Sherry, S.T. The variant call format and VCFtools. Bioinformatics 2011, 27, 2156–2158. [Google Scholar] [CrossRef]
  21. Tajima, F. Statistical method for testing the neutral mutation hypothesis by DNA polymorphism. Genetics 1989, 123, 585–595. [Google Scholar] [CrossRef]
  22. Lischer, H.E.L.; Excoffier, L. PGDSpider: An automated data conversion tool for connecting population genetics and genomics programs. Bioinformatics 2012, 28, 298–299. [Google Scholar] [CrossRef] [PubMed]
  23. Excoffier, L.; Lischer, H.E.L. Arlequin suite ver 3.5: A new series of programs to perform population genetics analyses under Linux and Windows. Mol. Ecol. Resour. 2010, 10, 564–567. [Google Scholar] [CrossRef] [PubMed]
  24. Pritchard, J.K.; Stephens, M.; Donnelly, P. Inference of population structure using multilocus genotype data. Genetics 2000, 155, 945–959. [Google Scholar] [CrossRef] [PubMed]
  25. Earl, D.A.; VonHoldt, B.M. STRUCTURE HARVESTER: A website and program for visualizing STRUCTURE output and implementing the Evanno method. Conserv. Genet. Resour. 2012, 4, 359–361. [Google Scholar] [CrossRef]
  26. Liu, X.; Fu, Y.X. Stairway Plot 2: Demographic history inference with folded SNP frequency spectra. Genome Biol. 2020, 21, 280–288. [Google Scholar] [CrossRef]
  27. Walsh, C.A.J.; Momigliano, P.; Boussarie, G.; Robbins, W.D.; Bonnin, L.; Fauvelot, C.; Kiszka, J.J.; Mouillot, D.; Vigliola, L.; Manel, S. Genomic insights into the historical and contemporary demographics of the grey reef shark. Heredity 2022, 128, 225–235. [Google Scholar] [CrossRef] [PubMed]
  28. Cross, J.R. Rhododendron Ponticum L. J. Ecol. 1975, 63, 345–364. [Google Scholar] [CrossRef]
  29. Yoichi, W.; Tamaki, I.; Sakaguchi, S.; Song, J.S.; Yamamoto, S.I.; Tomaru, N. Population demographic history of a temperate shrub, Rhododendron weyrichii (Ericaceae), on continental islands of Japan and South Korea. Ecol. Evol. 2016, 6, 8800–8810. [Google Scholar] [CrossRef]
  30. Liu, D.T.; Zhang, L.; Wang, J.H.; Ma, Y.P. Conservation genomics of a threatened Rhododendron: Contrasting patterns of population structure revealed from neutral and selected SNPs. Front. Genet. 2020, 11, 757–766. [Google Scholar] [CrossRef] [PubMed]
  31. Zhang, X.J.; Liu, X.F.; Liu, D.T.; Cao, Y.R.; Li, Z.H.; Ma, Y.P.; Ma, H. Genetic diversity and structure of Rhododendron meddianum, a plant species with extremely small populations. Plant Divers. 2021, 43, 472–479. [Google Scholar] [CrossRef] [PubMed]
  32. Wachowiak, W.; Salmela, M.J.; Ennos, R.A.; Iason, G.; Cavers, S. High genetic diversity at the extreme range edge: Nucleotide variation at nuclear loci in Scots pine (Pinus sylvestris L.) in Scotland. Heredity 2011, 106, 775–787. [Google Scholar] [CrossRef] [PubMed]
  33. Wright, S. Evolution and the Genetics of Populations: A Treatise in Four Volumes: Volume 4: Variability Within and Among Natural Populations; University of Chicago Press: Chicago, IL, USA, 1978. [Google Scholar]
  34. Laikre, L.; Allendorf, F.W.; Aroner, L.C.; Baker, C.S.; Gregovich, D.P.; Hansen, M.M.; Jackson, J.A.; Kendall, K.C.; McKelvey, K.; Neel, M.C. Neglect of genetic diversity in implementation of the convention of biological diversity. Conserv. Biol. 2010, 24, 86–88. [Google Scholar] [CrossRef] [PubMed]
  35. Mondon, A.; Owens, G.L.; Poverene, M.; Cantamutto, M.; Rieseberg, L.H. Gene flow in Argentinian sunflowers as revealed by genotyping-by-sequencing data. Evol. Appl. 2018, 11, 193–204. [Google Scholar] [CrossRef]
  36. Xiao, L.Q.; Ge, X.J.; Gong, X.; Hao, G.; Zheng, S.X. ISSR variation in the endemic and endangered plant Cycas guizhouensis (Cycadaceae). Ann. Bot. 2004, 94, 133–138. [Google Scholar] [CrossRef]
  37. Wu, Q.; Dong, S.; Zhao, Y.; Yang, L.; Qi, X.J.; Ren, Z.H.; Dong, S.B.; Cheng, J. Genetic diversity, population genetic structure and gene flow in the rare and endangered wild plant Cypripedium macranthos revealed by genotyping-by-sequencing. BMC Plant Biol. 2023, 23, 254–266. [Google Scholar] [CrossRef] [PubMed]
  38. Guilliams, C.M.; Hasenstab-Lehman, K.E. Conservation Genetics of the Endangered Lompoc Yerba Santa (Eriodictyon capitatum Eastw., Namaceae), including Phylogenomic Insights into the Evolution of Eriodictyon. Plants 2023, 13, 90. [Google Scholar] [CrossRef] [PubMed]
  39. Wu, F.Q.; Shen, S.K.; Zhang, X.J.; Wang, Y.H.; Sun, W.B. Genetic diversity and population structure of an extremely endangered species: The world’s largest Rhododendron. AoB Plants 2015, 7, plu082. [Google Scholar] [CrossRef] [PubMed]
  40. Feyissa, T.; Nybom, H.; Bartish, I.V.; Welander, M. Analysis of genetic diversity in the endangered tropical tree species Hagenia abyssinica using ISSR markers. Genet. Resour. Crop Evol. 2007, 54, 947–958. [Google Scholar] [CrossRef]
  41. Miao, Y.C.; Zhang, Z.J.; Su, J.R. Low genetic diversity in the endangered following a population bottleneck, a low effective population size and increased inbreeding. Silvae Genet. 2016, 65, 59–66. [Google Scholar] [CrossRef]
  42. López-A, D.M.; Bock, B.C.; Bedoya, G. Genetic structure in remnant populations of an endangered Andean Magnolia. Biotropica 2008, 40, 375–379. [Google Scholar] [CrossRef]
  43. Kramer, A.T.; Ison, J.L.; Ashley, M.V.; Howe, H.F. The paradox of forest fragmentation genetics. Conserv. Biol. 2008, 22, 878–885. [Google Scholar] [CrossRef]
  44. Nybom, H. Comparison of different nuclear DNA markers for estimating intraspecific genetic diversity in plants. Mol. Ecol. 2004, 13, 1143–1155. [Google Scholar] [CrossRef] [PubMed]
  45. Du, Y.L.; Fan, W.X.; Liu, Y.L. Characteristic and cause of debris flow in Dongchuan copper mining area. Northwest Geol. 2010, 43, 130–136. [Google Scholar]
  46. Zhang, X.P.; Li, X.H.; Qiu, Y.X. Genetic diversity of the endangered species Kirengeshoma palmata (Saxifragaceae) in China. Biochem. Syst. Ecol. 2006, 34, 38–47. [Google Scholar] [CrossRef]
  47. Hamrick, J.L.; Godt, M.J.W. Effects of life history traits on genetic diversity in plant species. Philos. Trans. Biol. Sci. 1996, 351, 1291–1298. [Google Scholar]
  48. Ennos, R.A. Estimating the relative rates of pollen and seed migration among plant populations. Heredity 1994, 72, 250–259. [Google Scholar] [CrossRef]
  49. Slatkin, M. Gene flow in natural populations. Annu. Rev. Ecol. Syst. 1985, 16, 393–430. [Google Scholar] [CrossRef]
  50. Ng, S.; Corlett, R.T. Comparative reproductive biology of the six species of Rhododendron (Ericaceae) in Hong Kong, South China. Can. J. Bot. 2000, 78, 221–229. [Google Scholar] [CrossRef]
  51. Wright, S. Isolation by distance. Genetics 1943, 28, 114–138. [Google Scholar] [CrossRef] [PubMed]
  52. Wang, X.H.; Li, J.; Zhang, L.M.; He, Z.W.; Mei, Q.M.; Gong, X.; Jian, S.G. Population differentiation and demographic history of the Cycas taiwaniana Complex (Cycadaceae) endemic to South China as indicated by DNA sequences and microsatellite markers. Front. Genet. 2019, 10, 1238–1252. [Google Scholar] [CrossRef] [PubMed]
  53. Liang, L.Y. Impact of the Quaternary Ice Age on the flora and vegetation of China. Chin. Place Name 2020, 7, 51+53. [Google Scholar]
  54. Davis, M.B.; Shaw, R.G. Range shifts and adaptive responses to Quaternary climate change. Science 2001, 292, 673–679. [Google Scholar] [CrossRef] [PubMed]
  55. Kuang, M.S.; Li, J.Y.; Zhao, Y.; Chen, X.Q.; Zhang, Y.P.; Guo, T.X. A Study on the Quaternary Glacial Relics in the Gongwang Mountains in the Northeast Part of Yunnan Province. J. Glaciol. Geocryol. 1997, 19, 78–84. [Google Scholar]
  56. Hou, H.M.; Ye, H.; Wang, Z.; Wu, J.H.; Gao, Y.; Han, W.; Na, D.C.; Sun, G.L.; Wang, Y.L. Demographic history and genetic differentiation of an endemic and endangered Ulmus lamellosa (Ulmus). BMC Plant Biol. 2020, 20, 1–14. [Google Scholar] [CrossRef]
  57. Gilpin, M.E. Minimum viable populations: Processes of species extinction. Conserv. Biol. Sci. Scarcity Divers. 1986, 19–34. [Google Scholar]
  58. Ceballos, G.; Ehrlich, P.R.; Barnosky, A.D.; García, A.; Pringle, R.M.; Palmer, T.M. Accelerated modern human–induced species losses: Entering the sixth mass extinction. Sci. Adv. 2015, 1, e1400253. [Google Scholar] [CrossRef] [PubMed]
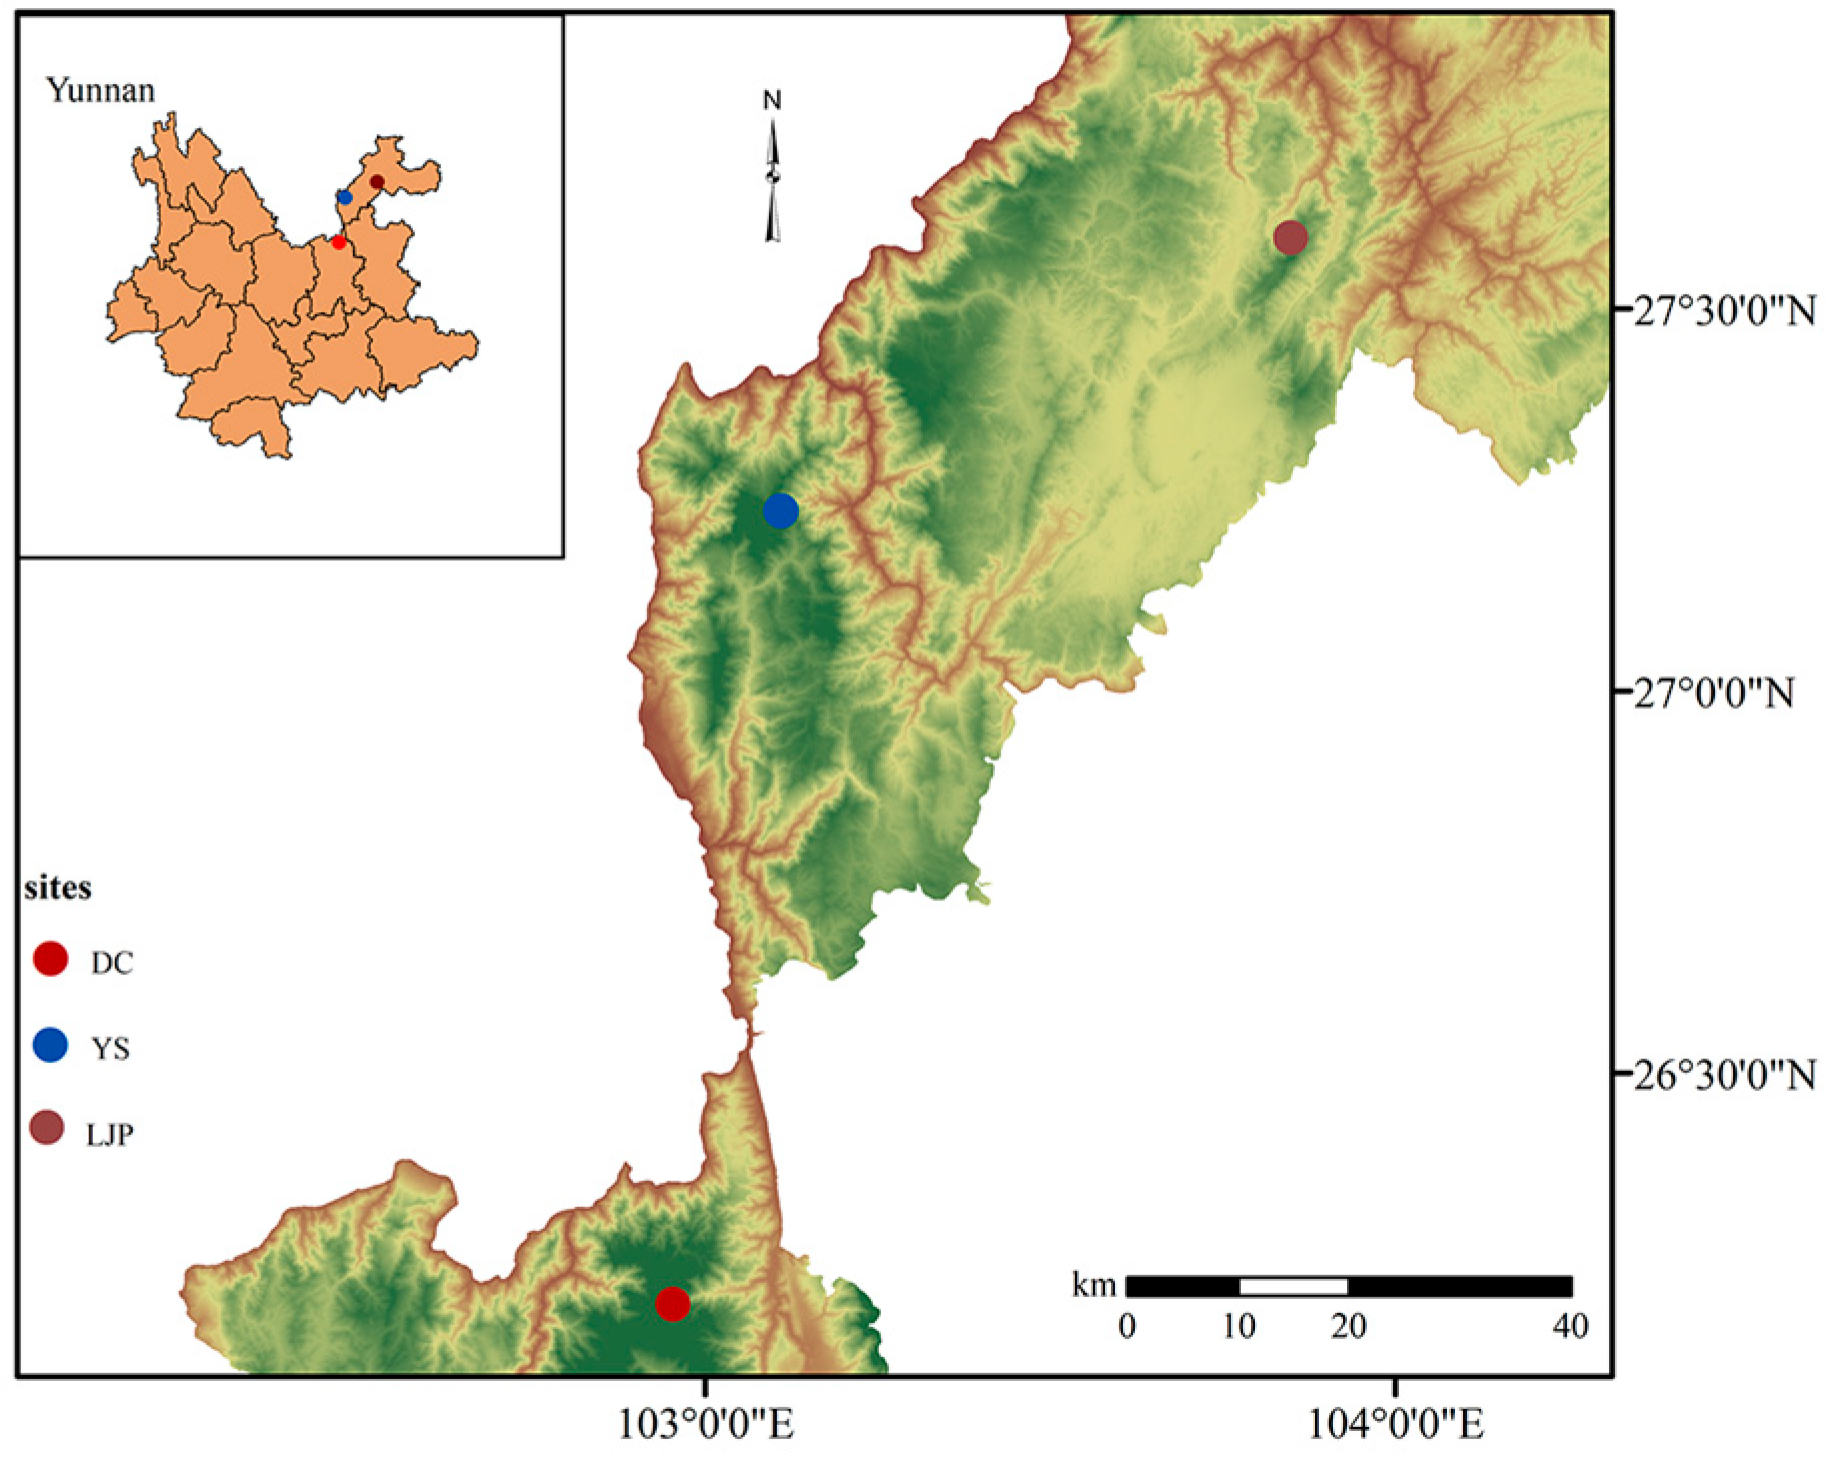
Figure 1. Geographical distribution map of three populations of R. farinosum.
Horticulturae 11 00051 g001
Figure 2. Genetic structure analysis of R. farinosum based on SNP variation: distribution of mean Delta K (a); and population structure plots with K = 3 (b).
Horticulturae 11 00051 g002
Figure 3. PCA analysis of 50 individuals of R. farinosum (a); and DAPC analysis of 50 individuals of R. farinosum (b).
Horticulturae 11 00051 g003
Figure 4. UPGMA tree of 50 individuals of R. farinosum.
Horticulturae 11 00051 g004
Figure 5. Use the stairway plot to infer the changes in the effective population size (Ne) of the R. farinosum over time, with a generation time of 10 years and a mutation rate of 1.581 × 10⁻⁹. The orange area represents the confidence interval, and the red line represents the planting.
Horticulturae 11 00051 g005
Table 1. Sample information of R. farinosum.
PopulationsGeographic LocalitiesSample SizeLongitude (E)Latitude (N)Altitude (m)
DCLanniping14102°57′6.53″26°11′3.48″3068
YSYaoshan17103°5′29.26″27°13′25.5″2757
LJPLengjiaping19103°50′3.19″27°35′22.96″2952
Table 2. Summary genetic statistics based on 9288 loci for the R. farinosum populations.
Pop IDPrivateHoHEπFIS
DC11350.082 ± 0.00160.1544 ± 0.00200.1615 ± 0.00200.222 0± 0.0131
LJP14640.1363 ± 0.00190.2026 ± 0.00200.2089 ± 0.00200.2155 ± 0.0162
YS12290.1461 ± 0.00200.2069 ± 0.00200.2140 ± 0.00200.2014 ± 0.0160
mean12760.1215 ± 0.00180.1880 ± 0.00200.1948 ± 0.00200.2130 ± 0.0151
R. farinosum based on 9288 SNP loci: private alleles (private), observed heterozygosity (Ho), expected heterozygosity (HE), genetic diversity (π), and inbreeding coefficients (FIS).
Table 3. The genetic distance (FST value, above the diagonal) and geographical distance (km, below the diagonal) between the three populations of R. farinosum.
DCLJPYS
DC0.22310.2074
LJP165.84580.1383
YS147.845024.5997
Table 4. AMOVA analysis of three populations of R. farinosum.
Source of Variationd.f.Sum of SquaresVariance ComponentsPercentage Variationp-Value
Among populations228,423.140408.72680 Va37.17<0.01
Within populations9767,016.100690.88763 Vb62.83<0.01
Total9995,439.2401099.61442
Disclaimer/Publisher’s Note: The statements, opinions and data contained in all publications are solely those of the individual author(s) and contributor(s) and not of MDPI and/or the editor(s). MDPI and/or the editor(s) disclaim responsibility for any injury to people or property resulting from any ideas, methods, instructions or products referred to in the content.

