Article

Hyperspectral Spatial Frequency Domain Imaging Technique for Soluble Solids Content and Firmness Assessment of Pears

1
School of Information Science and Engineering, Zhejiang Sci-Tech University, Hangzhou 310018, China
2
Key Laboratory of Transplanting Equipment and Technology of Zhejiang Province, Hangzhou 310018, China
3
Hangzhou Customs Technology Center, 398 Jianshe San Road, Xiaoshan District, Hangzhou 311202, China
*
Author to whom correspondence should be addressed.
Horticulturae 2024, 10(8), 853; https://doi.org/10.3390/horticulturae10080853
Submission received: 4 July 2024 / Revised: 2 August 2024 / Accepted: 9 August 2024 / Published: 12 August 2024
(This article belongs to the Section Postharvest Biology, Quality, Safety, and Technology)

Abstract

:
High Spectral Spatial Frequency Domain Imaging (HSFDI) combines high spectral imaging and spatial frequency domain imaging techniques, offering advantages such as wide spectral range, non-contact, and differentiated imaging depth, making it well-suited for measuring the optical properties of agricultural products. The diffuse reflectance spectra of the samples at spatial frequencies of 0 mm - 1 ( R d 0 ) and 0.2 mm - 1 ( R d 0 ) were obtained using the three-phase demodulation algorithm. The pixel-by-pixel inversion was performed to obtain the absorption coefficient ( μ a ) spectra and the reduced scattering coefficient ( μ s ) spectra of the pears. For predicting the SSC and firmness of the pears, these optical properties and their specific combinations were used as inputs for partial least squares regression (PLSR) modeling by combining them with the wavelength selection algorithm of competitive adaptive reweighting sampling (CARS). The results showed that μ a had a stronger correlation with SSC, whereas μ s exhibited a stronger correlation with firmness. Taking the plane diffuse reflectance R d 0 as the comparison object, the prediction results of SSC based on both μ a and the combination of diffuse reflectance at two spatial frequencies ( R d ) were superior (the best R p 2 of 0.90 and R M S E P of 0.41%). Similarly, in the prediction of firmness, the results of μ s , μ a × μ s , and R d 1 were better than that of R d 0 (the best R p 2 of 0.80 and R M S E P of 3.25%). The findings of this research indicate that the optical properties represented by HSFDI technology and their combinations can accurately predict the internal quality of pears, providing a novel technical approach for the non-destructive internal quality evaluation of agricultural products.

1. Introduction

In the field of agrotechnology, there is a rising demand and increasing acceptance of optical measurement techniques for evaluating the internal quality attributes of agricultural products. This is true for pears, with sweet, juicy, and nutritious flesh, making them one of the most popular fruits among consumers. Nevertheless, a fundamental concern lies in comprehending the extent to which the optical properties are associated with specific internal quality attributes. For instance, the soluble solids content (SSC) and flesh firmness are crucial parameters for assessing quality as they can reflect the taste of the fruit. These two indices have a direct impact on the commercial value of pears and consumer satisfaction. Therefore, there is a necessity for a more profound comprehension of the correlation between optical properties and the quality attributes of fruits.
The transmission of light in a turbid medium such as fruit tissues can be described by two fundamental mechanisms, namely absorption and scattering [1]. Absorption is primarily dictated by the chemical composition of the tissue (including water, sugars, acids, etc.), whereas scattering is contingent upon the density and structure of the tissue (such as cell size and cell distribution). Therefore, measuring these two optical properties can offer more accurate insights about the physical structure and composition characteristics of the samples. Absorption and scattering are typically quantified using the absorption coefficient μ a and the reduced scattering coefficient μ s . Assessing these two optical properties can offer more accurate insights into the physical structure and composition traits of the samples. Absorption and scattering are typically quantified by the absorption coefficient ( μ a ) and the reduced scattering coefficient ( μ s ).
At present, various methods have been employed to assess the optical properties of fruit tissues, including integrating sphere (IS) [2], spatial resolved (SR) [3], time resolved (TR) [4], and spatial frequency domain imaging (SFDI) [5]. The correlation of the optical properties obtained using these techniques with chemical substances and tissue structure was investigated.
Fang et al. utilized an automated single integrating sphere (SIS) system to determine the absorption and reduced scattering characteristics of ‘Korla’ pears. They examined the relationship between various physical and chemical parameters and μ a and μ s , as well as their principal component (PC1) scores within the 600–1500 nm wavelength range. This indicated that the μ a and μ s have the potential to present the characteristics of these indices of pears [6]. Tian et al. estimated the optical properties of kiwifruit using a SIS system and explored the connection between the absorption, reduced scattering properties, SSC, and flesh firmness. It shows that the μ a spectra had a superior capability in determining SSC, while μ s spectra were better in predicting the firmness of kiwifruit [7]. Nicolai et al. measured the TR near-infrared reflectance of pears and used the spectral data to construct calibration models of SSC and firmness. The results showed that reasonable SSC models can be obtained when using μ a in the range of 780–1700 nm. In this study, they found that despite the nonlinear correlation between μ s and firmness at 900 nm, μ s was not able to develop an effective firmness calibration model [8]. In 2020, Vanoli et al. compared the performance of TR and SR spectra of ‘Braeburn’ apple by analyzing the ripening process over a period of 21 days. They analyzed the relationship between a range of internal and external indicators of apple and optical properties. Their research revealed that alterations in pigments within the flesh and skin influenced absorption, while scattering reflected changes in flesh texture [9]. Joseph et al. employed SR to characterize the μ a and μ s of pears and investigated the relationship between fruit porosity and light scattering. Their study revealed a linear correlation between tissue porosity from the fruit skin to a depth of 3 mm with μ s spectra at 760 nm and 835 nm [10]. But the three techniques have their drawbacks. The IS technique is destructive as the detected samples need to be cut into thin sheets. The SR technique is limited to detecting only a small area due to the point light source. And the TR technique usually needs expensive equipment.
In contrast, SFDI uses spatially modulated structured light illumination to characterize the optical properties of the examined samples. Compared with other optical detection techniques, it replaces the point light source with a regional illumination of different frequencies and combines with specific light transmission models to evaluate the absorption and reduced scattering properties of biological tissues to obtain depth resolution information, such as the chemical composition and microstructure of biological tissues; it has a broad field of view, non-contact operation, depth discrimination in imaging, and effective signal enhancement [11].
SFDI technique was first proposed by Dognitz and Wagnieres et al. in 1998 [12]; then, a research group at the University of California carried out further research from 2005 [13]. Since then, many research teams have begun to improve the demodulation, inversion, and other related algorithms, and apply them for practical application in the biomedical field. In terms of agricultural science, there has been a delay in starting and developing the SFDI technique; thus, there are fewer related studies. Anderson et al. were the first to utilize the SFDI technique in agricultural product detection research, employing SFDI to identify hidden damage beneath the surface of apples [14]. In 2016, the first SFDI system in the agricultural field in China was built, which characterized the μ a and μ s of apple slice tissue through the way of damage detection. Since then, more and more scientific research teams at home and abroad have started to apply SFDI technique to the detection of agricultural products [15].
Regarding quality detection, Hu et al. put forward an improved stepwise method to optimize the spatial frequency interval, and used it to evaluate the optical transmission properties of milk samples and four kinds of apple tissues. This enhancement led to improved accuracy in estimating the optical transmission properties [16]. After that, they characterized the optical transmission properties of the fruit skin and flesh tissue of various fruits, such as apple, mango, and kiwifruit, respectively. The results showed that the absorption coefficient curves of the skin and flesh tissues could reflect the absorption peaks of pigments and other components at specific wavelengths, and the absorption coefficient and reduced scattering coefficient of the skin tissues were typically elevated compared to those of the flesh tissues [17,18]. Fu et al. detected the optical properties of tissues from different parts of pork, beef, and chicken, and classified them using a support vector machine (SVM) and the K-nearest neighbors (KNN) algorithm [19]. The study revealed significant variations in the optical properties of various types of meat, with the classification accuracy being higher when using μ a and μ s as features compared to using reflectance as the feature. Lohner et al. conducted a long-time and large-batch experiment on four varieties of apples, and used SFDI to extract images of optical properties to further show the different morphological characteristics inside the apple. It demonstrated that the μ s of apples in the ripening stage varied with the cell gap and starch content; it also examined the radial trend of μ a and μ s from the apple core to the apple skin, which illustrated the radial dependence of these two optical properties. It provided numerous novel perspectives for investigating the complex correlation between optical properties and physiological processes throughout the ripening stage [20].
In terms of damage detection, He et al. used the least squares support vector regression (LSSVR) method to effectively fit the fuzzy nonlinear relationship between the ( μ a , μ s ) vector and R d in high dimensional space. The image of μ s calculated using this method can clearly show the invisible damage on the surface of crown pear. By comparing the coefficient of variation (CV) at 527 nm, the damaged pears could be identified with 98.33% accuracy, and by comparing the average μ s ratio of the damaged area to the normal area, the damage of grade 1 (the lightest degree) could be distinguished from the damage of grade 2 and 3 (two more serious damage degrees). The results indicated that SFDI has the latent ability to detect the invisible sub-pericarp damage of crown pear [21]. Sun et al. combined SFDI and an artificial neural network (ANN) model to accelerate the high precision mapping of optical properties, which can measure the μ a and μ s of Golden Delicious apples efficiently and detect the early invisible damage of apples through μ s mapping [22]. Luo et al. used the independently developed SFDI system to detect pears with different bruising types, taking the image as the input to distinguish different damage types of crown pears via linear discriminant analysis (LDA) pattern recognition method [23].
It has been proved by previous studies that the SFDI technique can effectively characterize the optical properties of agricultural products, but there still exist some problems and difficulties to be solved. For example, the SFDI systems adopted in the previous studies generally used filters to select several individual wavelengths for detection. The hyperspectral spatial frequency domain imaging (HSFDI) system has since been developed, which can obtain continuous wave spectra of optical properties in the region of 360–1000 nm. The HSFDI system was applied for measuring the μ a and μ s of milk at continuous bands, which validated the association between the protein contents and μ a as well as the fat contents and μ s [23,24]. In order to realize practical applications such as quality analysis and grade sorting of fruits, this study intended to use the HSFDI system to obtain HSFDI data. Chemometric methods were used to establish quantitative models through diffuse reflectance R d and absorption coefficient μ a and reduced scattering coefficient μ s in the range of 360–1000 nm for predicting the soluble solid content and firmness of pear. The particular aims of this research were as follows:
(1)
To comprehensively describe the optical properties of pears at different wavelengths and provide basic data for subsequent analysis, obtaining HSFDI images of pears at 360–1000 nm and calculating the R d , μ a , and μ s of pears, respectively, based on three-phase demodulation and partial least squares (PLS) fitting;
(2)
To reveal how the optical properties reflect the internal quality of pears and to clarify the relationship between the spectral parameters and the internal quality parameters so as to provide a theoretical basis for non-destructive testing, discussing the correlation between the spectra of these optical parameters and the internal quality parameters of pears, including SSC and firmness;
(3)
To improve the accuracy and reliability of non-destructive testing, comparing different models to find the optimal combination of optical parameters, which includes the SSC and firmness prediction models built by optical properties ( R d 0 , reflectance at spatial frequencies of 0 mm - 1 ; R d 1 , reflectance at spatial frequencies of 0.2 mm - 1 ; μ a , and μ s ) and their specific combinations ( R d , reflectance at two spatial frequencies; and μ a ×   μ s ), respectively.

2. Materials and Methods

2.1. Samples

Pears that are similar in color and uniform in size were selected to avoid any differences in these factors affecting SSC and firmness measurements. The selected samples were intact in appearance and free of cracks and pests to ensure that the measurements were not affected by external damage. One hundred ‘Gong’ pears were acquired from a local wholesale market in Hangzhou, Zhejiang Province. To make the collected data closer to the actual situation, the samples with no obvious defects and uniform shapes were selected. After arrival at the laboratory, the samples were deposited at a temperature of 4 °C to ensure the stability of the same batch and to minimize experimental errors. The experiments were conducted for 18 days, and the samples to be tested were removed from the incubator before each experiment and placed in the laboratory environment (temperature ~24 °C, relative humidity ~65%) for 12 h. After that, the HSFDI data were collected and the quality parameters of SSC and firmness were measured. The temperature and humidity during measurement were kept consistent to avoid the influence of environmental factors on the results. After removing the pears that broke down in storage and the invalid data that were damaged during collection, finally, 96 valid samples were used. The pear samples were randomly split into two groups at the ratio of 3:1, with 72 samples allocated to the calibration set and the remaining 24 samples assigned to the prediction set. The range of the two data subsets were checked to ensure the calibration set contained the maximum and minimum values of the internal quality parameters.

2.2. Measurement of Raw HSFDI Data

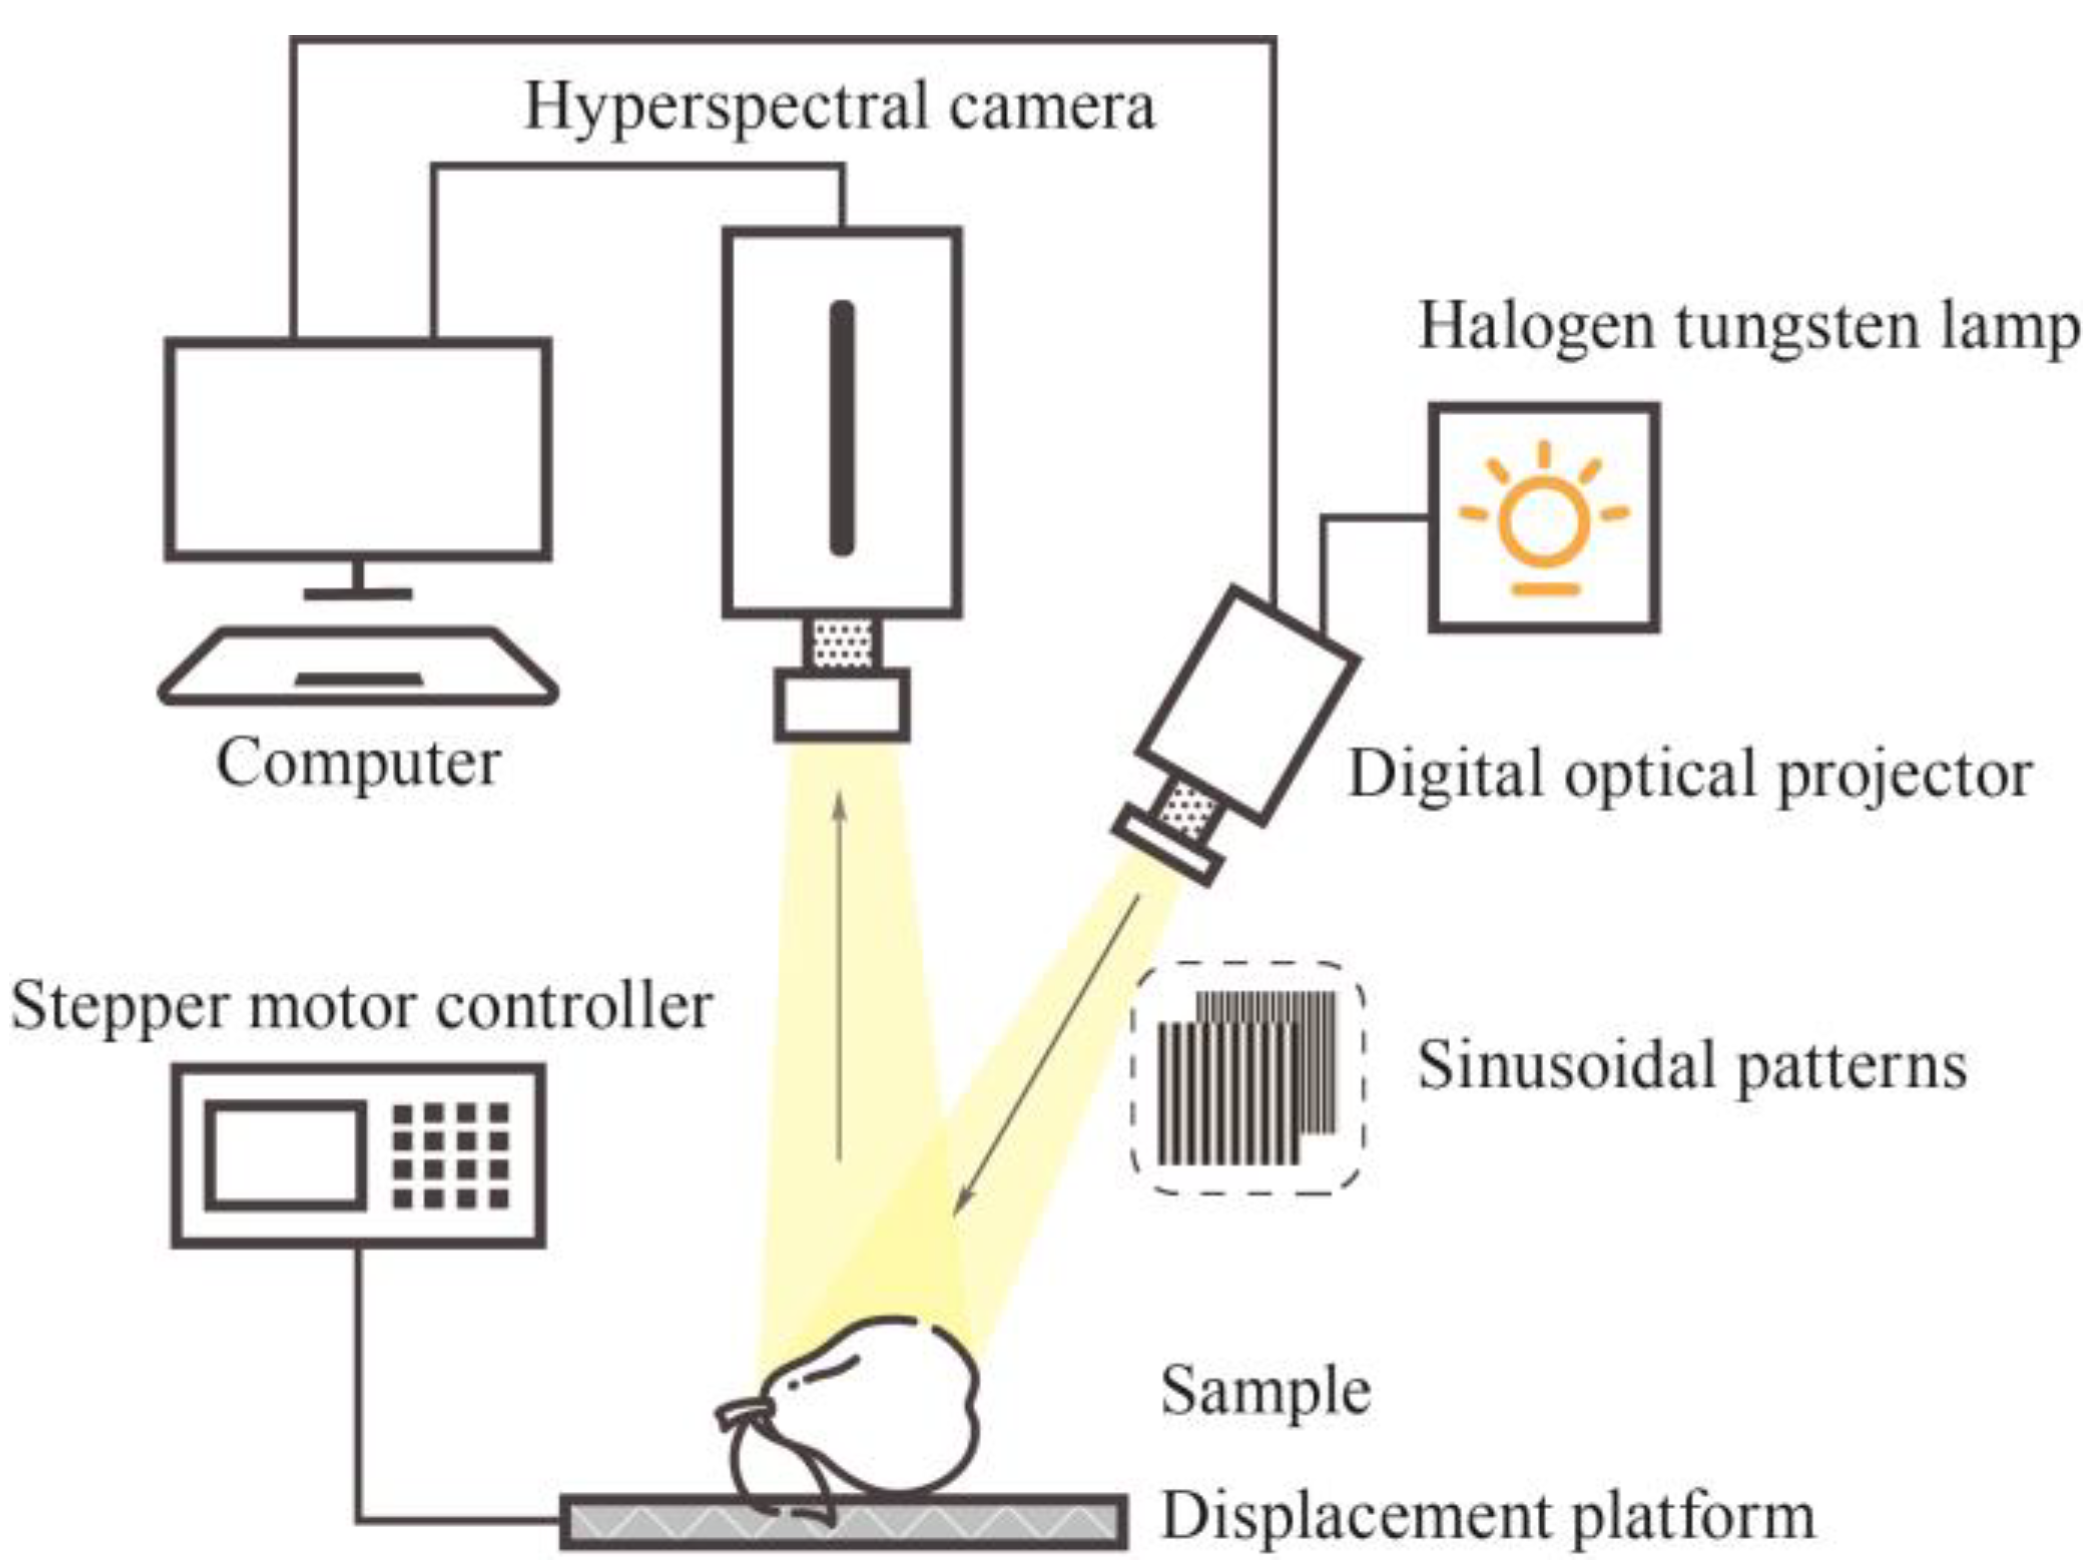
Hyperspectral spatial frequency domain images were acquired using the HSFDI system in the range of 360–1000 nm, which mainly consists of a halogen tungsten lamp and a light source power controller (150 W, 400–1200 nm, Changchun Ocean Electro-Optics Co., Ltd., Changchun, China), a digital optical projector (DLi CEL5500, Texas Instruments, Dallas, TX, USA), a line-scan hyperspectral camera with an optical fiber (GaiaField-V10E-AZ4, Dualix Spectral Imaging Technology Co., Ltd., Chengdu, China), a set of linear polarizers (OCZ203, BOCIC Co., Ltd., Beijing, China), an electric displacement platform for sample height adjustment (MTS303S, BOCIC Co., Ltd., Beijing, China), and a stepper motor controller (SC102S, BOCIC Co., Ltd., Beijing, China). The polarizers are placed before the hyperspectral camera and the DLP, respectively, to reduce direct reflections on the surface of fruit. The camera is directly above the platform, and the projector is in the top right corner of the sample at a 15-degree angle to the vertical line. The camera, projector, and platform are positioned within a black box to prevent interference from ambient light during the experiment. The 8-bit sinusoidal fringe patterns were projected using the CEL conductor control software accompanying the DLP projector, while the HSFDI images were captured with ‘Specview’ software (V1.0, Dualix Spectral Image Technology Co., Ltd., Chengdu, China) accompanying the hyperspectral camera. The specific construction, calibration, and verification process of this hyperspectral spatial frequency domain imaging joint system have been described in detail in the previous study [24].
To ensure a stable light source for the HSFDI system, the halogen tungsten lamp needed to be warmed up for 10 min. The system frequency was adjusted in synchronization with the camera calibration. The sinusoidal waveforms captured using the line-scan camera were filtered. The linearity of the system response was calibrated using a linear fit of the measured diffuse reflectance to a reference value. The constructed HSFDI system was subjected to validation experiments with the phantom of known optical parameters to ensure its measurement accuracy. In HSFDI experiments, there is a trade-off between spectral and spatial resolution. High spectral resolution provides fine spectral information but slows down imaging speed, while high spatial resolution improves image quality but increases the data processing load. Increasing both parameters at the same time will significantly increase the data volume, and the solution is that a reasonable balance needs to be found when setting the parameters to optimize the data volume and improve the processing efficiency. The spectral resolution in this study was set to 2.4 nm with 250 wavelengths while the spatial resolution was 800 × 769 .
In the case of SFDI, the spatial frequency of structured light directly affects the depth of light penetration into fruit tissues. In other words, in order to precisely detect the intrinsic quality of pears, it is essential to select the applicable spatial frequency of structured light. Light of different spatial frequencies penetrates biological tissues with different depths; the penetration depth decreases with increasing spatial frequency. Conversely, the resolution and contrast of the captured images exhibit an inverse relationship. Therefore, based on the pre-experiment, the selected spatial frequencies f x were 0 mm - 1 and 0.2 mm - 1 . Only one image is required when f x is 0 mm - 1 , and three images with different phases (0, 2 / 3 π , 4 / 3 π ) are required when f x is 0.2 mm - 1 . For each sample, four images were taken in total.
Figure 1 illustrates the schematic diagram of the HSFDI image system. Before the acquisition of all the data, the tungsten halogen lamp was turned on to preheat for 10 min, and then the two-dimensional grayscale sinusoidal patterns of various spatial frequencies were illuminated on the measured object, which was placed on the displacement platform. The hyperspectral images of the standard reflector (with 0.99 reflectivity) and the samples were required in sequence. During the collection process, the stepper motor was controlled to adjust the displacement platform so that the highest point of all the measured objects remains remained at the same horizontal height. The square standard reflector should cover the full area of the sample; therefore, the standard reflector and all samples were placed in the fixed position displacement platform to reduce the error and facilitate the selection of the region of interest (ROI). After all the shots were completed, the light and projection were turned off, and the dark image was collected in the dark environment.

2.3. Extraction of Optical Properties

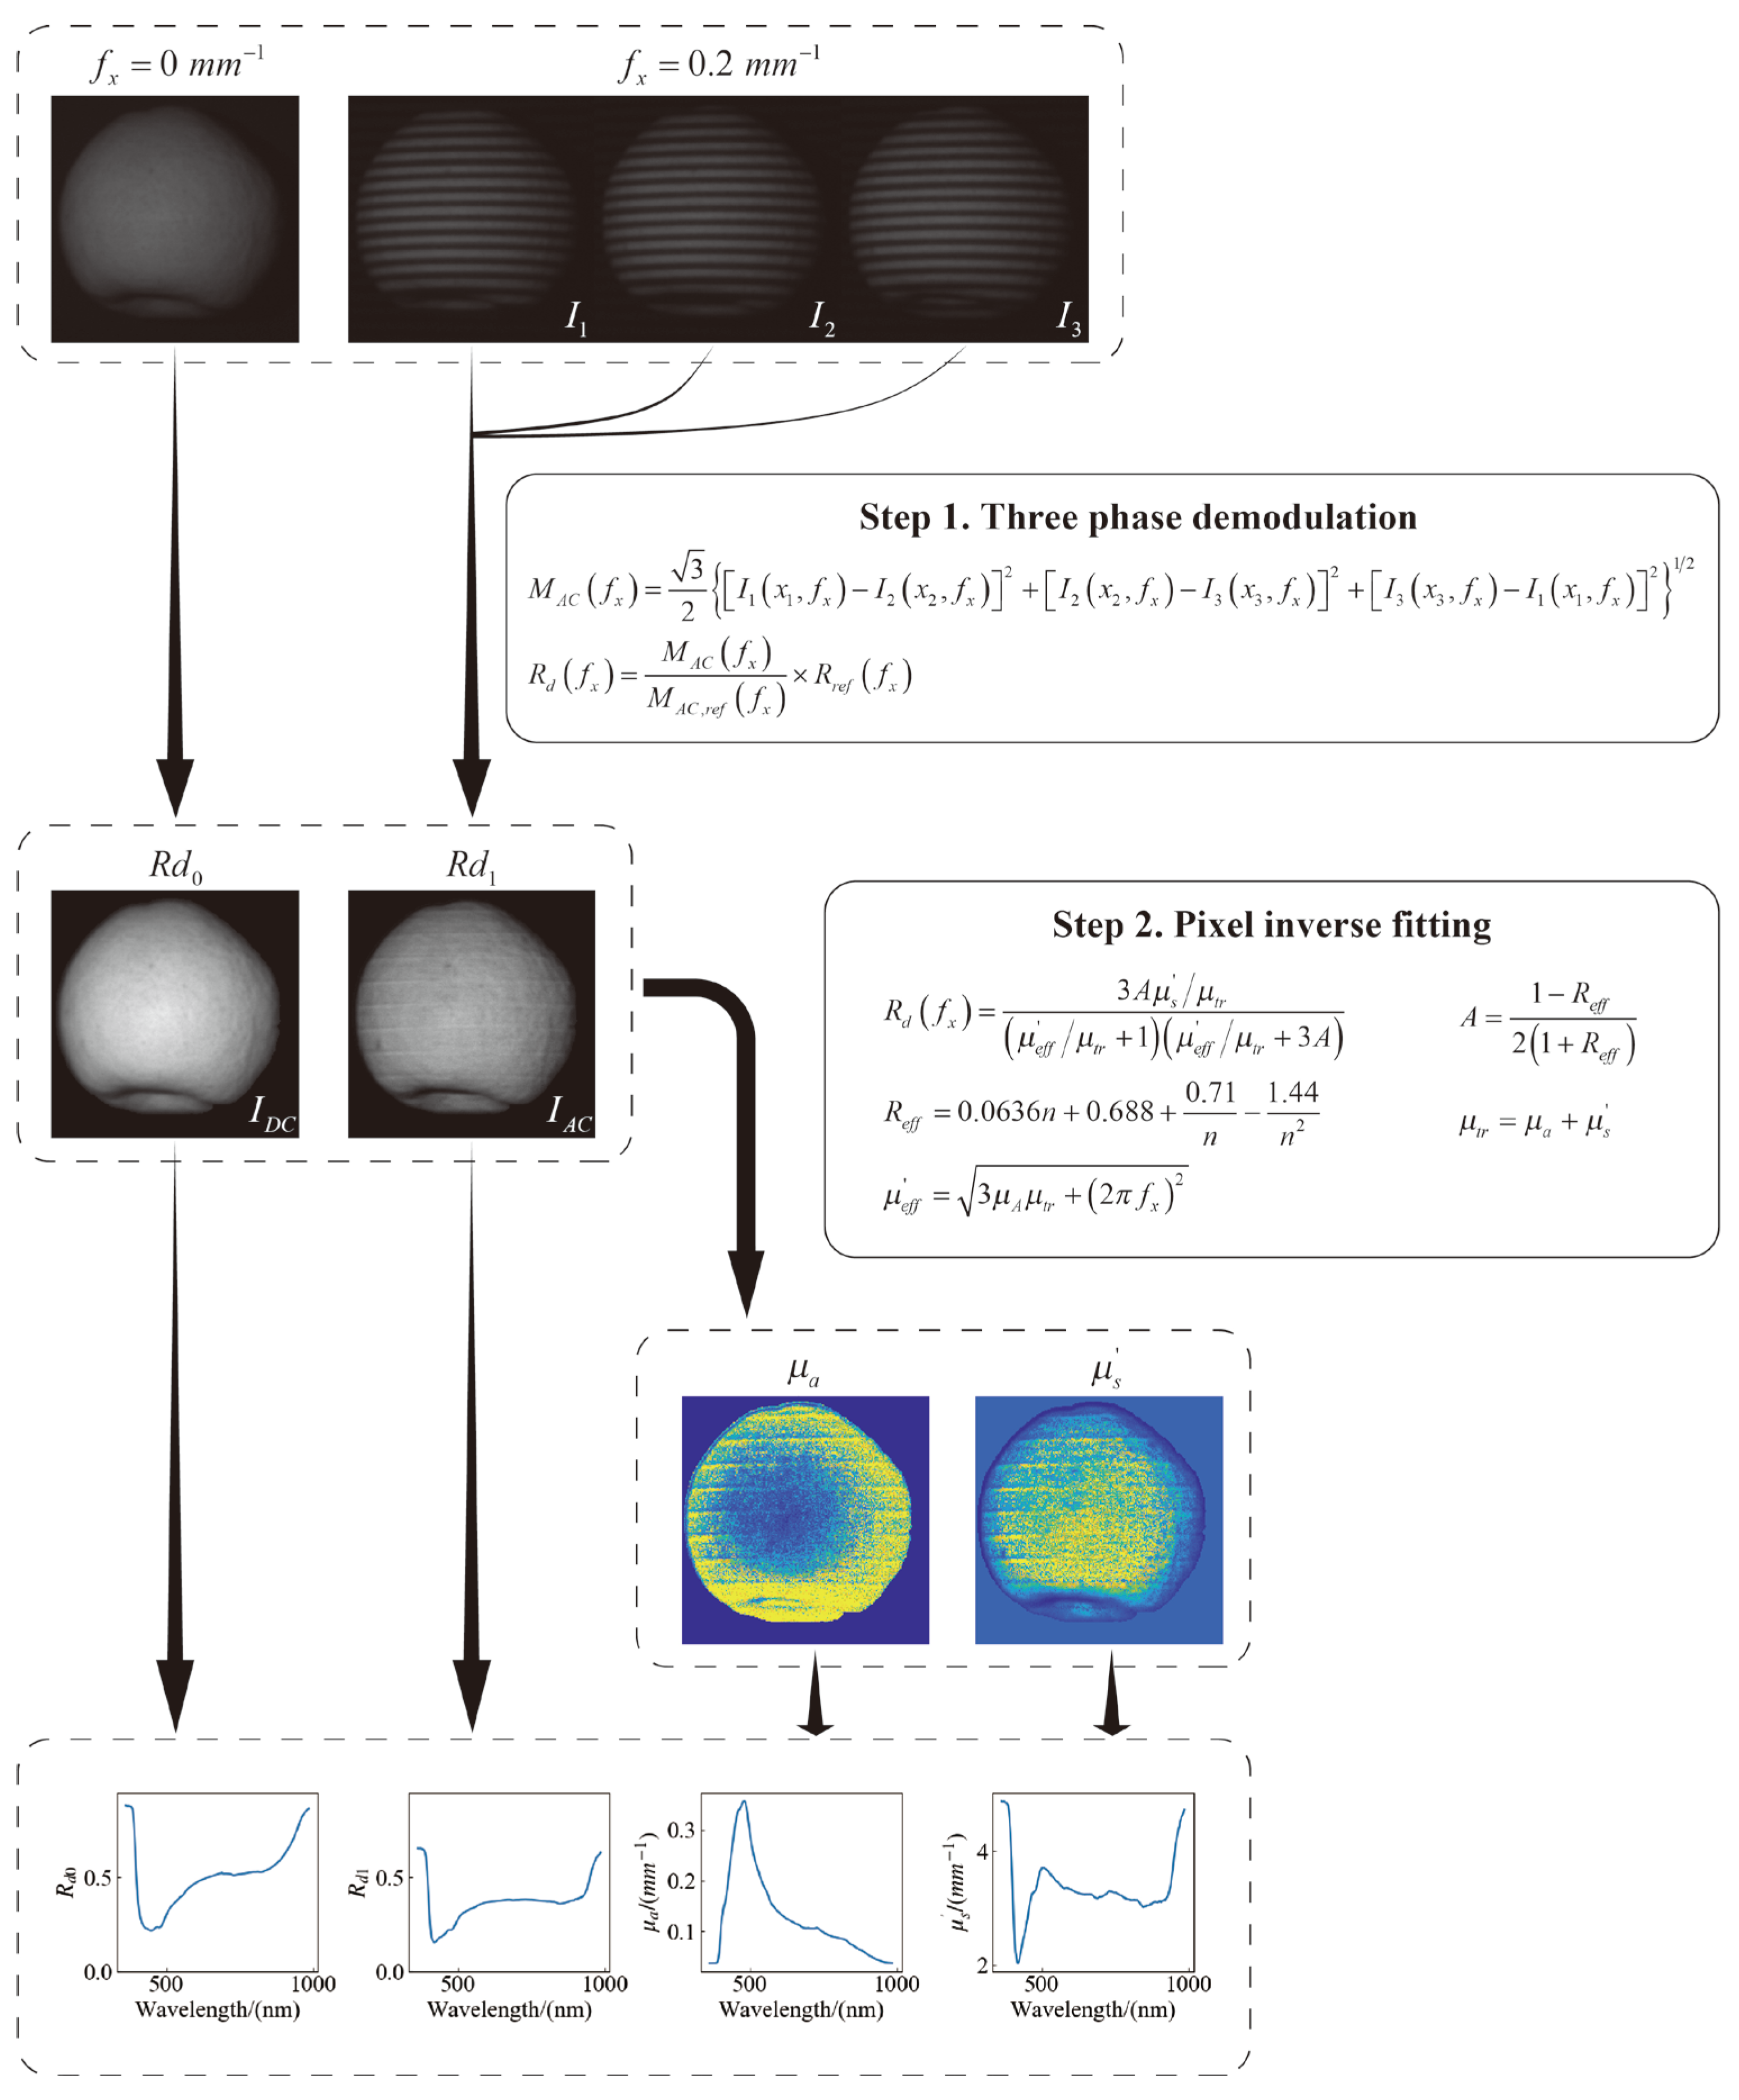
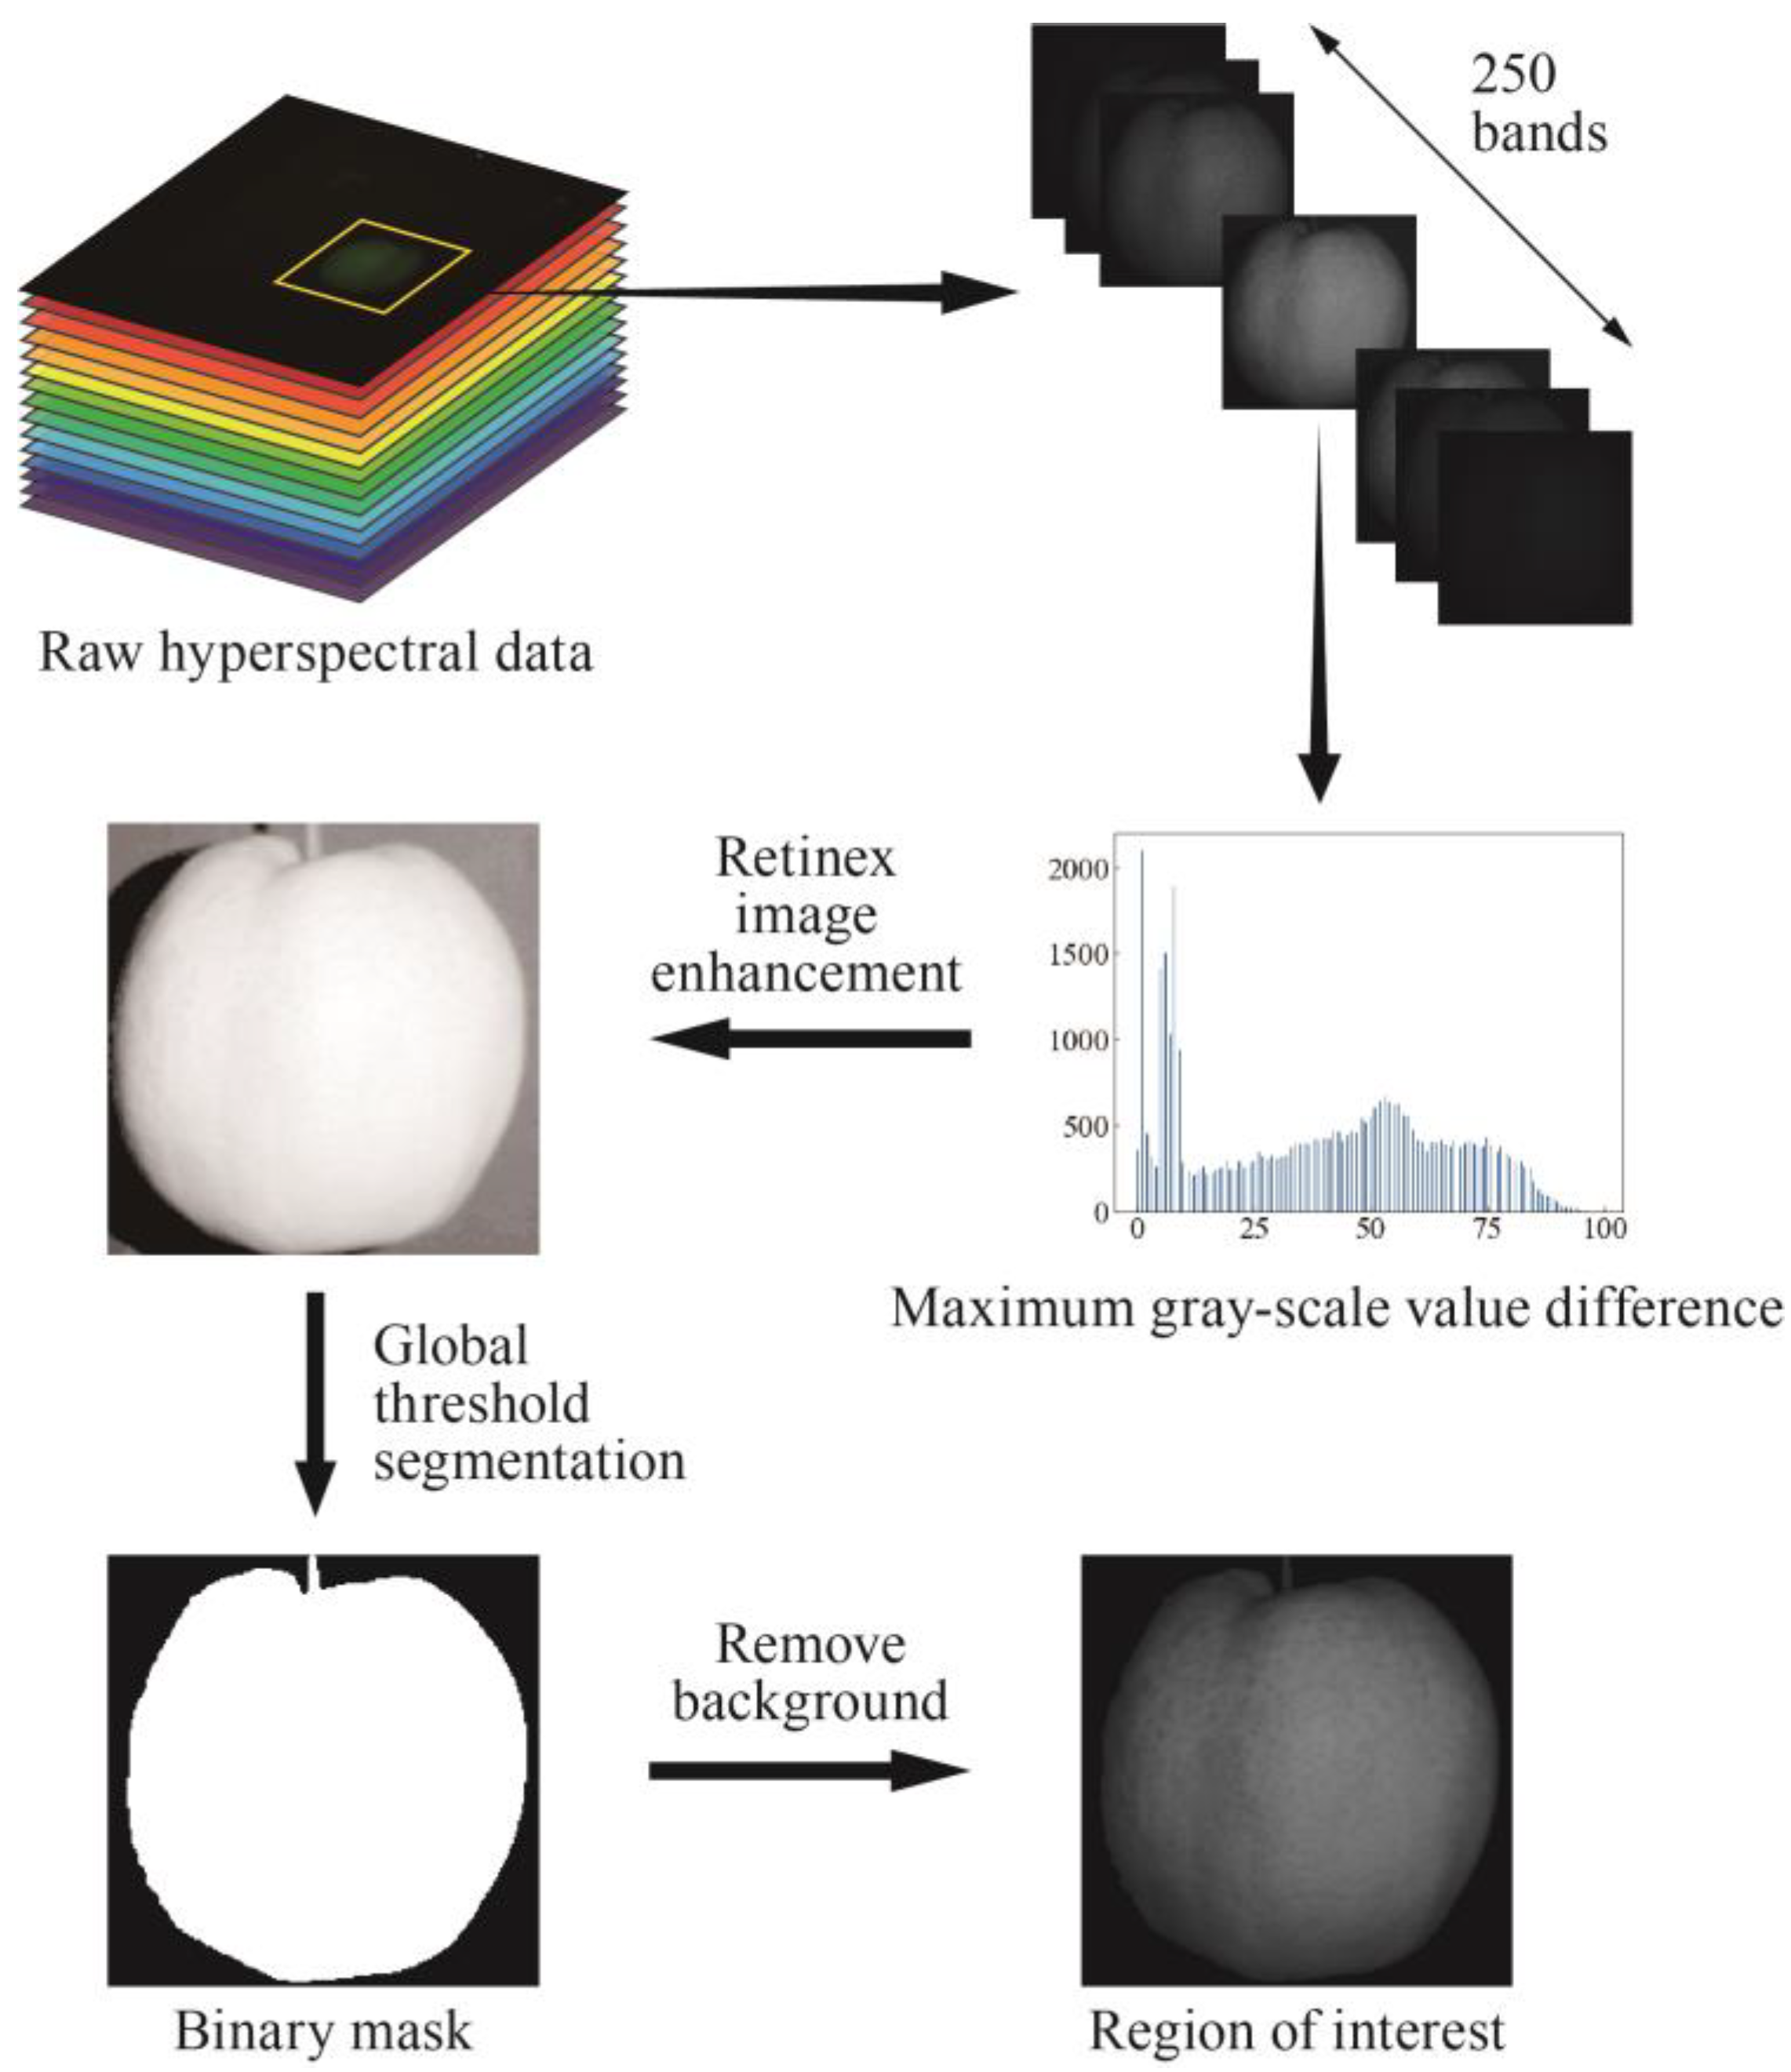
In an attempt to obtain the data of pears’ optical properties, a series of image processing was performed on the raw SFDI data. The image processing flow is shown in Figure 2.
Firstly, single wavelength images were extracted from the acquired hyperspectral data, and the images of total 250 wavelengths were separated. After the sample image was cropped out in each band, all the single wavelength images were traversed. The image with the largest gray difference between the fruit and the background was found at 636.3 nm, and the single scale Retinex image enhancement was performed for the image at this wavelength. The enhanced image was segmented by the global threshold, and the binary mask was obtained according to the optimal threshold value of the binarized sample image. Then, the region of each pear was segmented from the single wavelength image by the mask, and it was selected as the ROI.
The process of extracting the diffuse reflectance R d , absorption coefficient μ a and the reduced scattering coefficient μ s from the raw data is shown in Figure 3. The first step is to demodulate the single wavelength images. According to the three-phase demodulation (TPD) method proposed by Cuccia et al. [25], the illumination intensity of the structured light can be decomposed into a DC (plane) part I D C and an AC (space) part I A C . The DC image corresponds to the image captured with uniform illumination, while the AC image contains depth information specific to the spatial frequency of the sinusoidal illumination pattern. With the initial SFDI images at 0, 2 / 3 π , and 4 / 3 π phases (i.e., I 1 , I 2 and I 3 ), the corresponding diffuse reflectance R d ( f x ) is calculated to obtain the amplitude envelope M AC f x of the diffuse reflectivity photon density at that frequency f x . The diffuse reflectance of the target samples is then calibrated with the known reflectance of the standard reflector plate R ref ( f x ) and the diffuse reflectance intensity amplitude envelope of the standard reflector plate M AC ,   ref f x to minimize the systematic error.
The diffuse reflection image and reflectance can directly detect the surface defects and internal quality of agricultural products, but the further processing of diffuse images is required to obtain the optical transmission properties parameters that are more directly related to the pear fruit and its quality parameters. So, the second step is reverse inversion to solve the absorption coefficient μ a and reduced scattering coefficient μ s . The scattering of most of the agricultural products’ tissues are much larger than absorption, which is just in line with the constraints of the diffusion approximation equation (DAE) [26]. Therefore, DAE is the most commonly used light transmission model in the inversion for detection agricultural products. The parameters in DAE are described as follows: R eff is the effective reflection coefficient; n is the tissue refractive index; A is a proportional constant; μ t r is the full attenuation coefficient; μ eff is the approximate attenuation coefficient. The reciprocal of μ eff is the effective penetration depth of photons in the spatial frequency domain, and the intensity of the planar-structured light source s 0 decays exponentially with the penetrated depth. Based on the diffuse reflectance at different spatial frequencies, the μ a and μ s of each pixel within ROI can be obtained via pixel-by-pixel fitting using nonlinear partial least squares (PLS).

2.4. Measurement of Internal Quality

Before the image acquisition, external quality parameters such as the range of equatorial diameter, weight, and height at the image acquisition of each fruit were first measured using the digital vernier caliper (CR2032, Jinhua Shijian Tool Co., Ltd., Jinhua, China) and the electronic scale (CH-305, Deqing Baijie Electric Appliance Co., Ltd., Huzhou, China), respectively.
After the image acquisition was completed, the firmness of the peeled flesh was measured with the firmness tester (GY-4, Dongguan three precision measuring instrument Co., Ltd., Dongguan, China) on three points distributed in the equator of the pear fruit corresponding to the image data collection. The measurement process was as follows: Before each measurement, ensure that the zero position of the firmness tester is accurate. Hold in the pear firmly in place to avoid movement during the measurement. Slowly press the 11.1 mm diameter probe into the flesh, making sure that the indenter of the durometer was perpendicular to the surface of the pear, and apply uniform pressure until the indenter is completely embedded in the surface of the pear to a maximum depth of 10 mm of the indenter. Hold the indenter in the measuring position for a few seconds and wait for the reading to stabilize before recording the firmness value (in units of N). After each measurement, wipe the indenter with a soft cloth to ensure that no residue remains. Avoid vibration and external interference during the measurement.
The SSC of the samples was then measured using a hand-held refractometer (PAL-1, Alto Scientific Instruments Ltd., Tokyo, Japan). Pieces of pulp (about 20 mm thick) were cut from the point of firmness measurement separately and the juice was obtained using a clean knife and a squeezer to avoid contamination. A small amount of pear juice was evenly dripped onto the prismatic surface of the refractometer to ensure that there were no air bubbles or impurities, and the reading was stabilized for a few seconds before taking the reading. Before each measurement, the refractometer was calibrated with distilled water to ensure that the zero point of the refractometer was accurate. The measurements were taken at a constant room temperature to avoid temperature fluctuations affecting the reading. After each measurement, the prism was wiped with distilled water to ensure that there was no residue.
Once the measurements were completed, the mean and standard deviation (SD) of the quality parameters were calculated for each sample. Subsequent analyses will use the average of multiple measurements to increase the reliability of the data.

2.5. Data Analysis

2.5.1. Effective Wavelength Selection

A key step before establishing the physicochemical index prediction model based on optical properties is the feature wavelength extraction. Extracting the bands related to the sample properties is vital to establish the highly precise and stable models. Selecting appropriate features for the characteristic sample can significantly decrease the dimensionality and redundancy of the variables and enhance modeling efficiency. In this research, the competitive adaptive reweighted sampling algorithm (CARS) was employed to extract the effective wavelengths (EWs) of the preprocessed spectral data. The CARS algorithm can build a partial least squares model from the calibration set samples selected via Monte Carlo sampling and can also select the most competitive band combination using an adaptive reweighting sampling method [27].

2.5.2. Prediction Model Development

Partial least squares regression (PLSR) is commonly utilized in chemometrics research because of its fast computational speed and efficient extraction of useful information from high-dimensional data. PLSR was utilized as a modeling algorithm to determine the optimal number of latent variables (LVs) by the minimum root-mean-square error of 10-fold cross-validation. The effectiveness of the PLSR model was assessed by comparing the determination coefficient and the root-mean-square error of the calibration set ( R c 2 and RMSE c ), as well as the determination coefficient and the root-mean-square error of the prediction set ( R p 2 and RMSE p ). This comparison was carried out to determine the optimal pretreatment method and bands. A model’s quality and predictive accuracy improve with higher R 2 values and lower RMSE values. Furthermore, the model’s relative percent deviation (RPD), calculated as the ratio of the standard deviation to the RMSE p of pear samples, serves as an indicator of the model’s predictive capability. Therefore, an effective prediction model should exhibit low RMSE and high R 2 and RPD values.

2.6. Software

All the above image processing and optical properties data extraction and processing were completed by using PyCharm Community Edition (3.9.13, JetBrains s.r.o., Prague, Czech Republic) and MATLAB (R2021b, The Mathworks Inc., Natick, MA, USA).

3. Results

3.1. Statistics of Measured Quality Attributes

Table 1 shows the appearance attributes (including maximum diameter, minimum diameter at the equator, and fruit weight) and physicochemical quality attributes (SSC and firmness) of all the ‘Gong’ pear samples, which helps to understand the distribution and dispersion of these characteristic parameters. As can be seen from the table, the variability of the maximum diameter and the minimum diameter in all samples is relatively small; that is, most of the measured values are concentrated around the average value, indicating that the sizes of these pears are relatively uniform and differ little from each other. However, for the weight parameter, the standard deviation (SD) is 55.2 g and the coefficient of variation (CV) is 0.159. This indicates that the distribution of weight is relatively dispersed, and the differences between the samples are relatively large, which may be due to the difference in water content between individual samples.
In addition, the data on SSC and firmness also show certain variability, although their CV is relatively small (respectively, 0.125 and 0.120). These two physical and chemical indicators may be affected by a variety of factors, including the maturity of the samples, environmental conditions, or processing methods, etc. Most of the samples have an SSC ranging from 7% to 16%, with a peak distribution between 10.5% and 13.3%. The firmness is mainly distributed between 42 and 85 N, with a peak distribution between 52 and 67 N, which is similar to the previous research results and the reference values for the main varieties in the national standard GB/T 10650-2008 for fresh pears [28]. As shown in Figure 4, the probability density function (PDF) of the SSC and the firmness for all samples are approximately normally distributed at the three test positions, and the CV of the two indicators is also similar. The amplitude ratio of the two indicators fluctuating around the mean value is not high.

3.2. Spectral Analysis

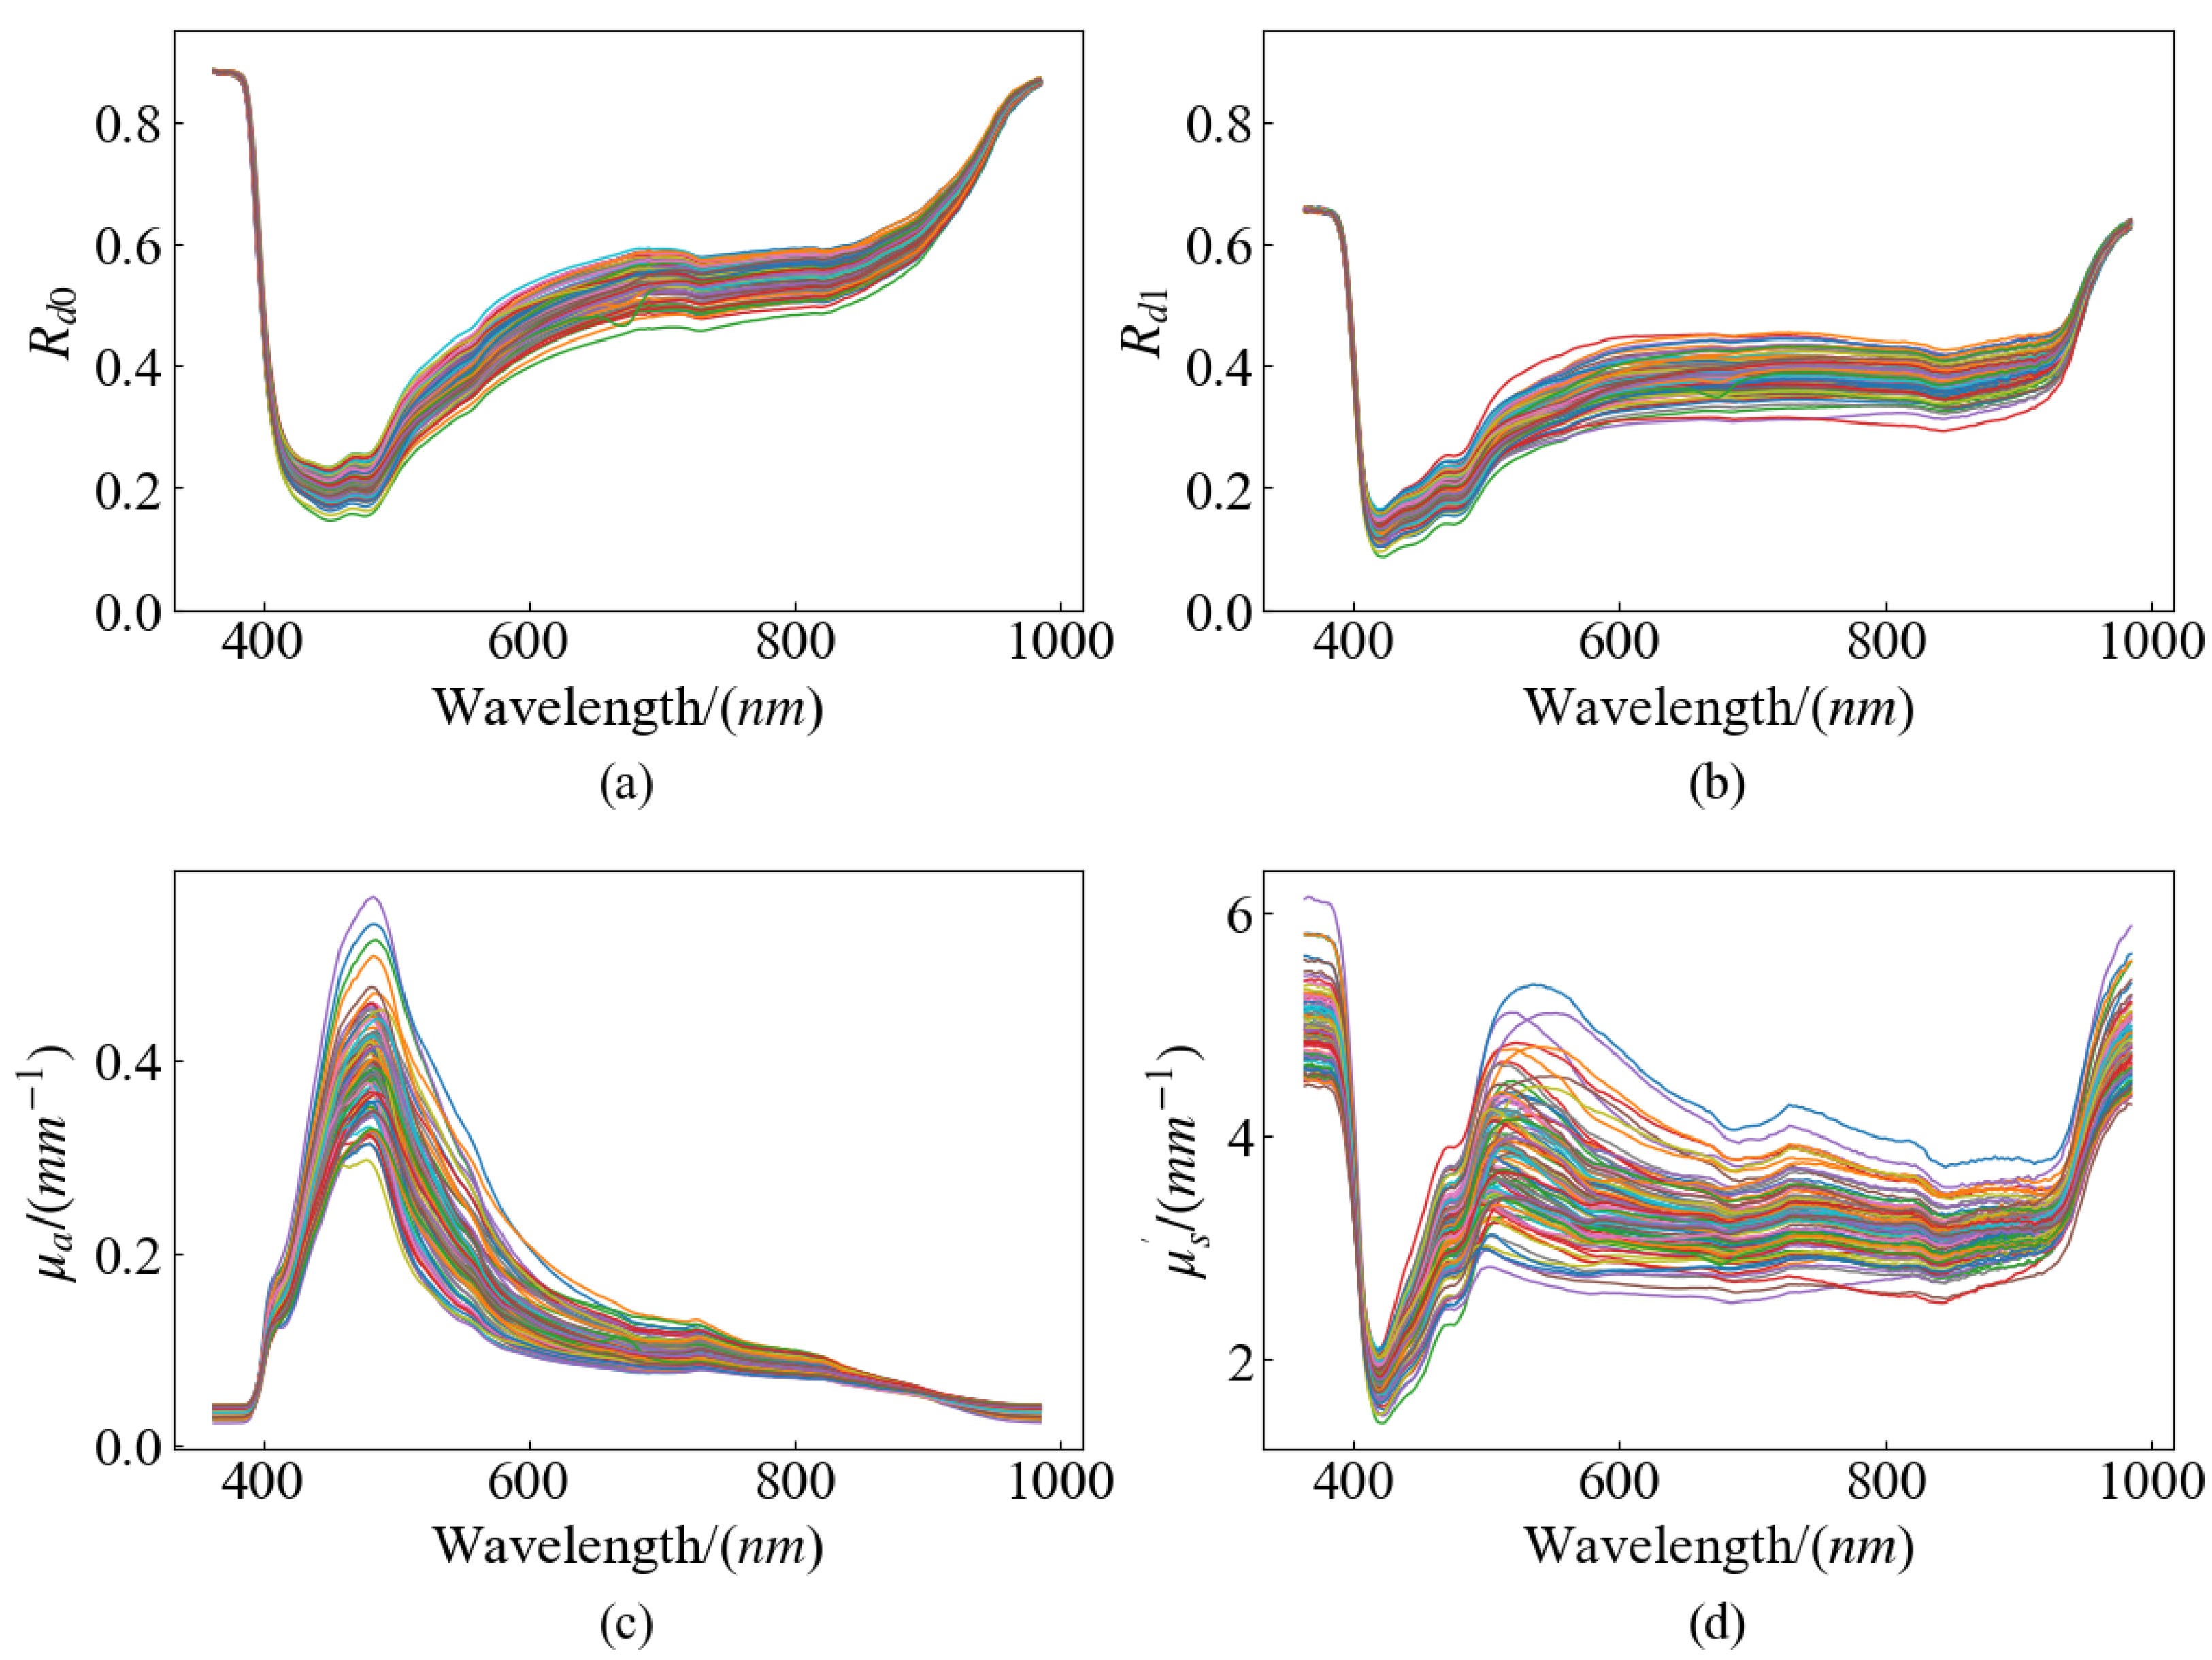
The reflectance R d 0 ( f x = 0   mm - 1 ) and R d 1 ( f x = 0.2   mm - 1 ), the absorption coefficient μ a , and the reduced scattering coefficient μ s of all the pear samples in the effective spectral region are shown in Figure 5. The latter part of the spectra contains a lot of noise, which was affected by various factors, such as uneven intensity distribution of the halogen tungsten lamp during image acquisition, the irregular shape of the pear samples, the algorithm used in demodulation and inversion, etc.
It is clear that the reflectance spectra at different spatial frequencies show the same trend overall. The reflectance values of R d 1 are lower than R d 0 , and show a flatter trend after 500 nm. Light penetration depth in biological tissues varies with different spatial frequencies; as the spatial frequency increases, the penetration depth of light decreases, leading to a reduction in the light reflected back. Therefore, for the HSFDI data at successive wavelengths, the value of high frequency reflectance is slower than that of low frequency reflectance. The μ a and μ s of ‘Redstar’ apples at individual wavelengths, such as 460 nm, 527 nm, and 630 nm, had the same characteristics [15].
As expected, the general trend in the μ a spectra obtained in this study is similar to that reported for absorption in previous studies of the ‘Gong’ pear [29]. As seen in Figure 5c, the μ a spectra have different absorption peaks depending on the different chemical composition. There is an obvious peak near 485 nm and a weak absorption peak corresponding to photopigments near 730 nm, and the other regions are relatively flat.
As shown in Figure 5d, the μ s increases with wavelength between 420 nm and 485 nm, then decreases gradually until around 930 nm, after which it slightly increases. Unlike the data obtained by He et al. at multiple single wavelengths [30], the μ s spectra obtained at continuous wavelengths have more subtle variations between different wavelengths. The value of μ s is significantly higher than the value of μ a , indicating that the propagation of light in the wavelength of 360–1000 nm through the pear tissue is mainly scattered, which is due to the nature of such a turbid medium as fruit tissue is. As mentioned earlier, the scattering coefficient is influenced by the organizational structure of the fruit, including factors such as cell structure, particle size, and density. In this study, the μ s of the ‘Gong’ pears is higher than that of peach, apple, and kiwifruit reported in other studies [7,20,31]. It may be caused by the fact that the graininess of the flesh of ‘Gong’ pear is coarser than that of the abovementioned several fruit.

3.3. Correlation between Optical Properties and Quality Attributes

3.3.1. Correlation between Optical Properties and SSC

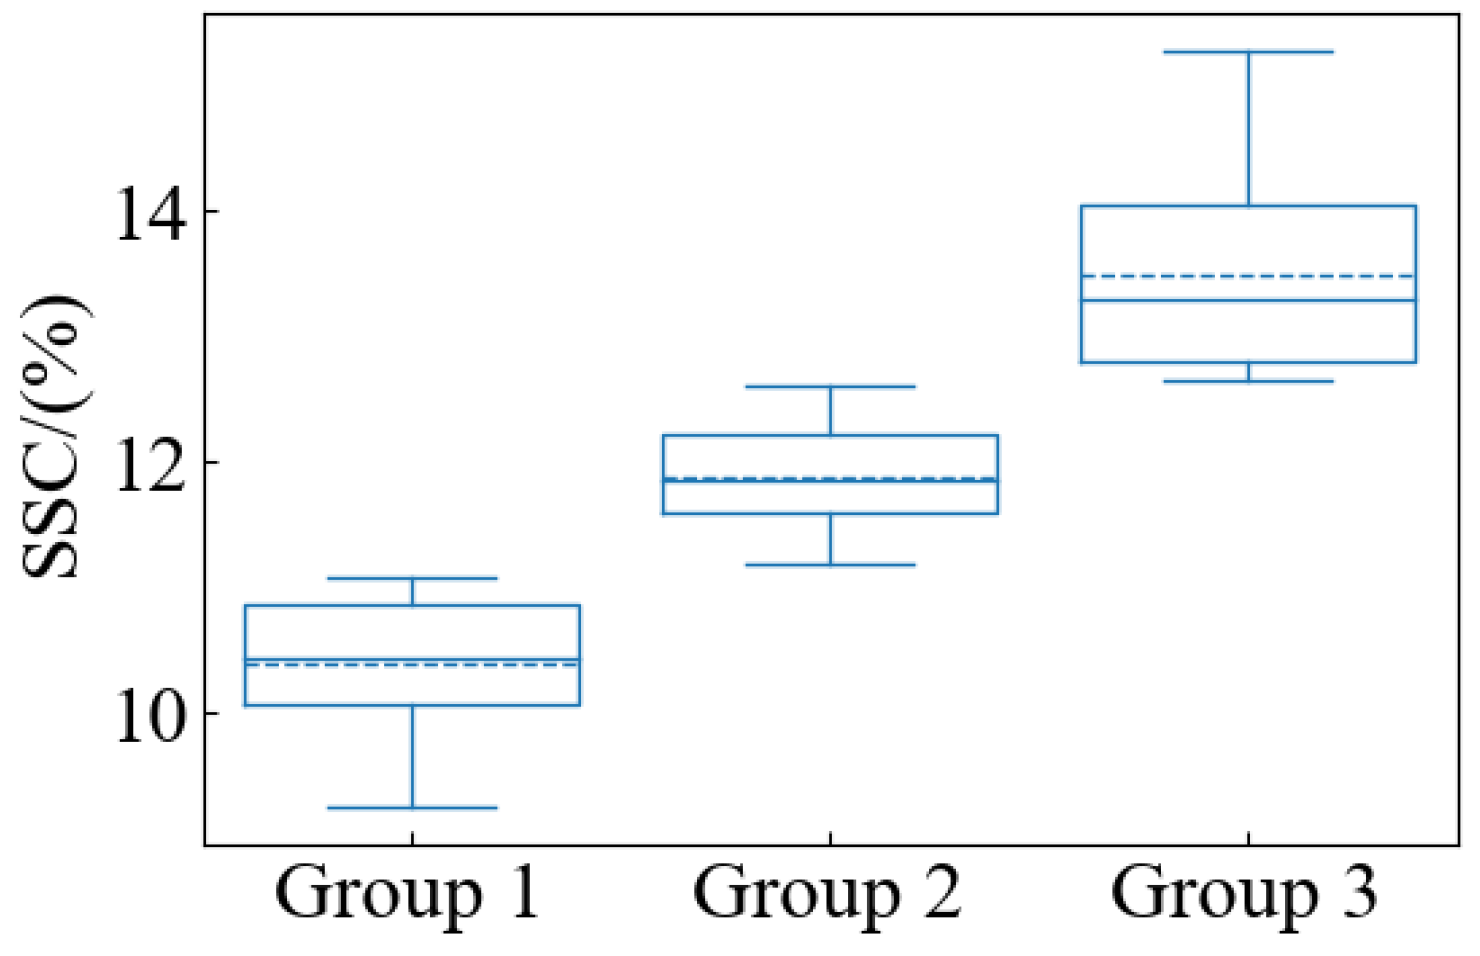
The 96 pear samples were categorized into three groups based on their SSC value, ranging from low to high: low SSC group (S-Group 1), medium SSC group (S-Group 2), and high SSC group (S-Group 3), which contained 32 samples, respectively. This grouping was carried out to compare the optical properties among the pear samples with different SSC levels. As shown in Figure 6, the average values and the SD of SSC for the three groups were 10.38 ± 0.51%, 11.87 ± 0.41%, and 13.47 ± 0.72%, respectively.
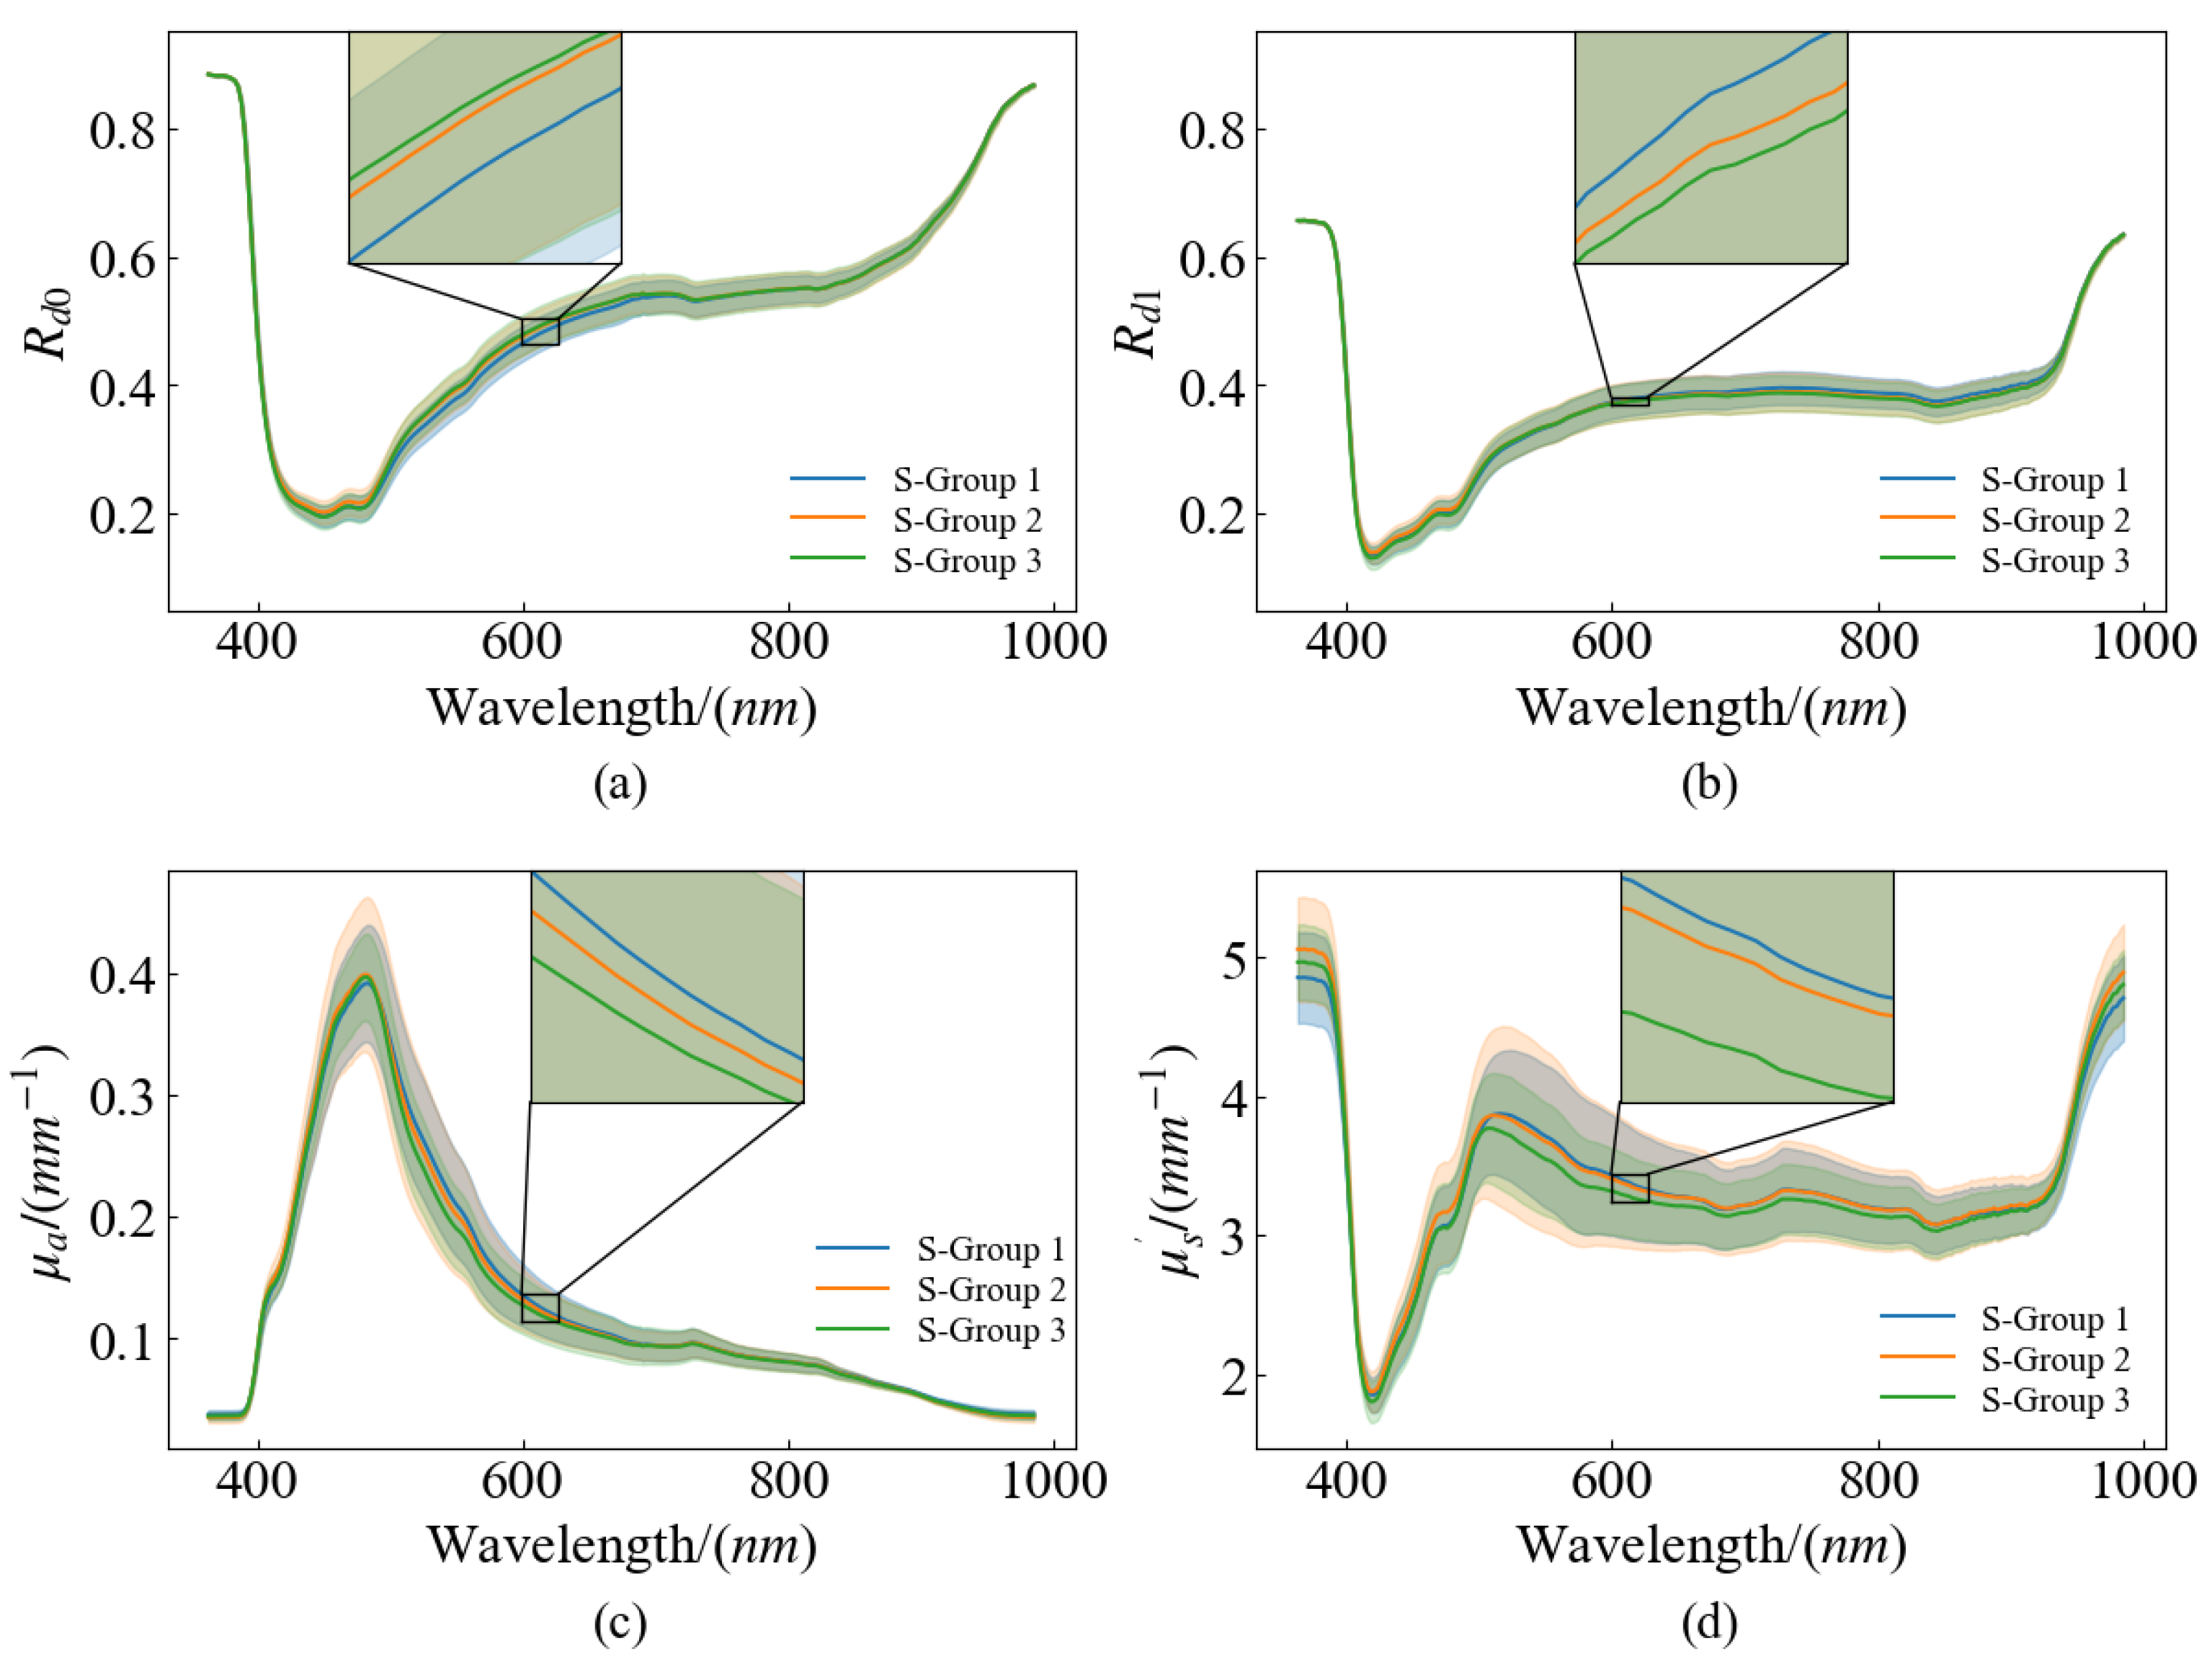
Figure 7 shows the average spectra of R d 0 , R d 1 , μ a , and μ s of pears with S-Group 1, S-Group 2, and S-Group 3. The spectra of these four parameters show significant differences and uniform trends among groups with different levels of SSC. As can be seen from Figure 7a, the R d 0 of pears in different SSC groups has a disparity between 520 nm and 635 nm. The values of R d 0 increase with the increase in the SSC values in these bands, and the R d 0 of the medium SSC group and the high SSC group (S-Group 2 and S-Group 3) are relatively close. In Figure 7b, the difference in R d 1 appears later between 580 nm and 890 nm, and it decreases as the SSC increases. For pears with different SSCs, μ a is distinct at 490 nm to 660 nm in Figure 7c, and the intervals are almost equidistant in these bands. There existed two characteristic peaks of μ a at 730 nm and 840 nm, on account of the hydrogen-containing group associated with water content. In other words, the values of μ a lessened with SSC, reflecting the correlation of SSC and moisture changes in the pear in these bands. In Figure 7d, the difference of μ s appears at 508–635 nm, and the change trend is similar to that of μ a . The difference is that the gap between low and medium SSC groups (S-Group 1 and S-Group 2) is not large. Previous research has indicated that μ s is associated with the cellular morphology of fruit tissue (the size, shape, inner construction, and organization of cells, for instance), so the accuracy of predicting SSC in these ranges with μ s may be low.

3.3.2. Correlation between Optical Properties and Firmness

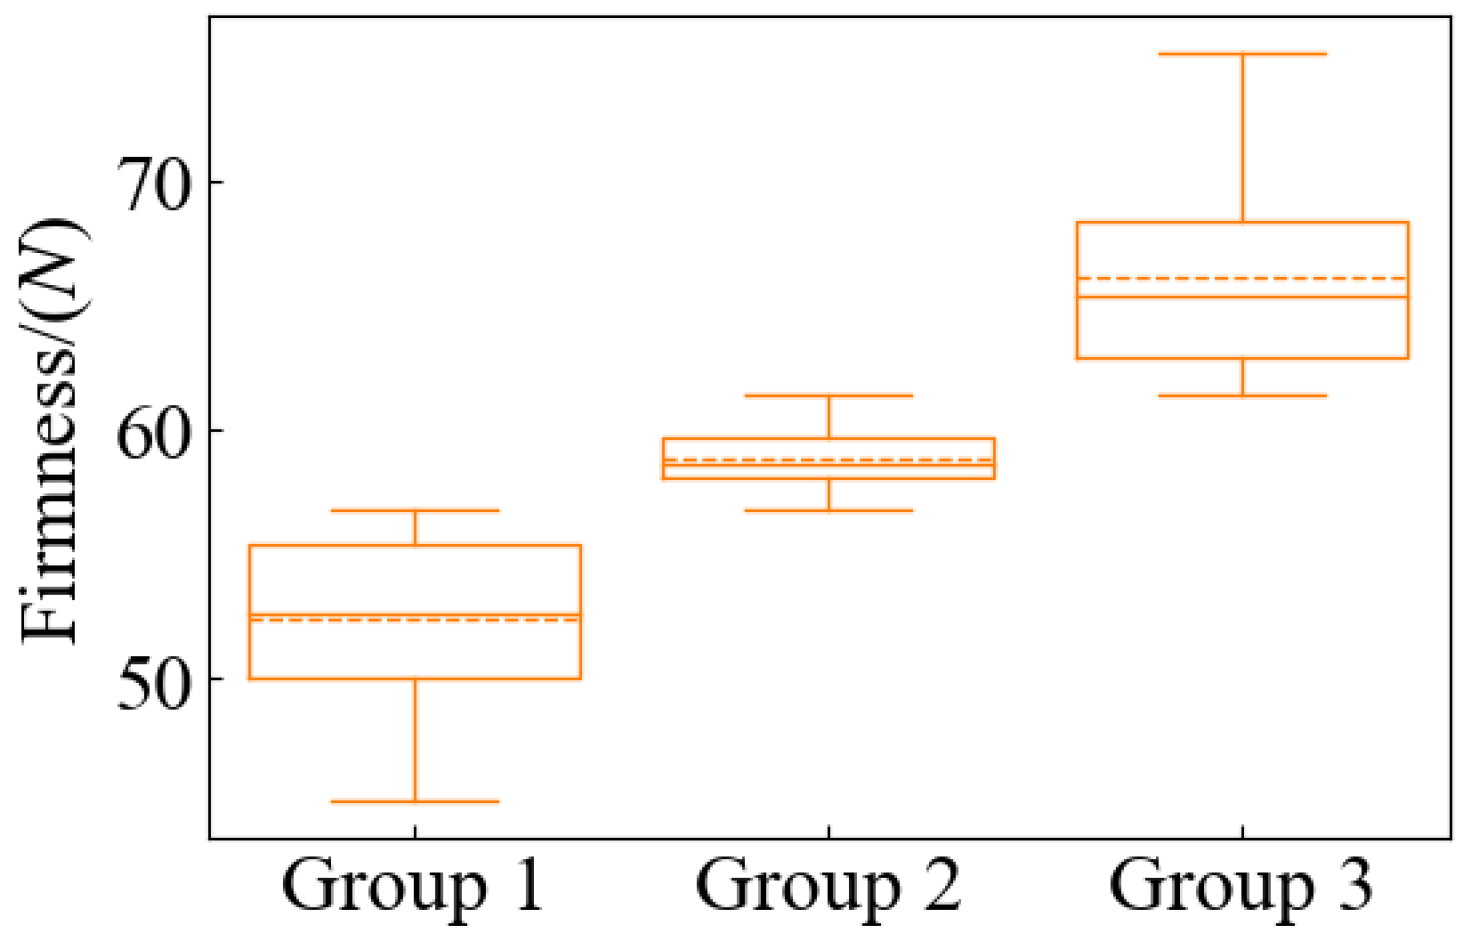
Similar to the SSC grouping, the 96 pear samples were categorized into three groups based on their firmness value, ranging from low to high: low firmness group (F-Group 1), medium firmness group (F-Group 2), and high firmness group (F-Group 3), which contained 32 samples respectively. The purpose of this grouping was to compare the differences in optical properties of pear samples with different firmness levels. As shown in Figure 8, the average values and the SD of firmness of the three groups are 52.34 ± 3.23 N, 58.83 ± 1.20 N, and 66.07 ± 4.03 N, respectively.
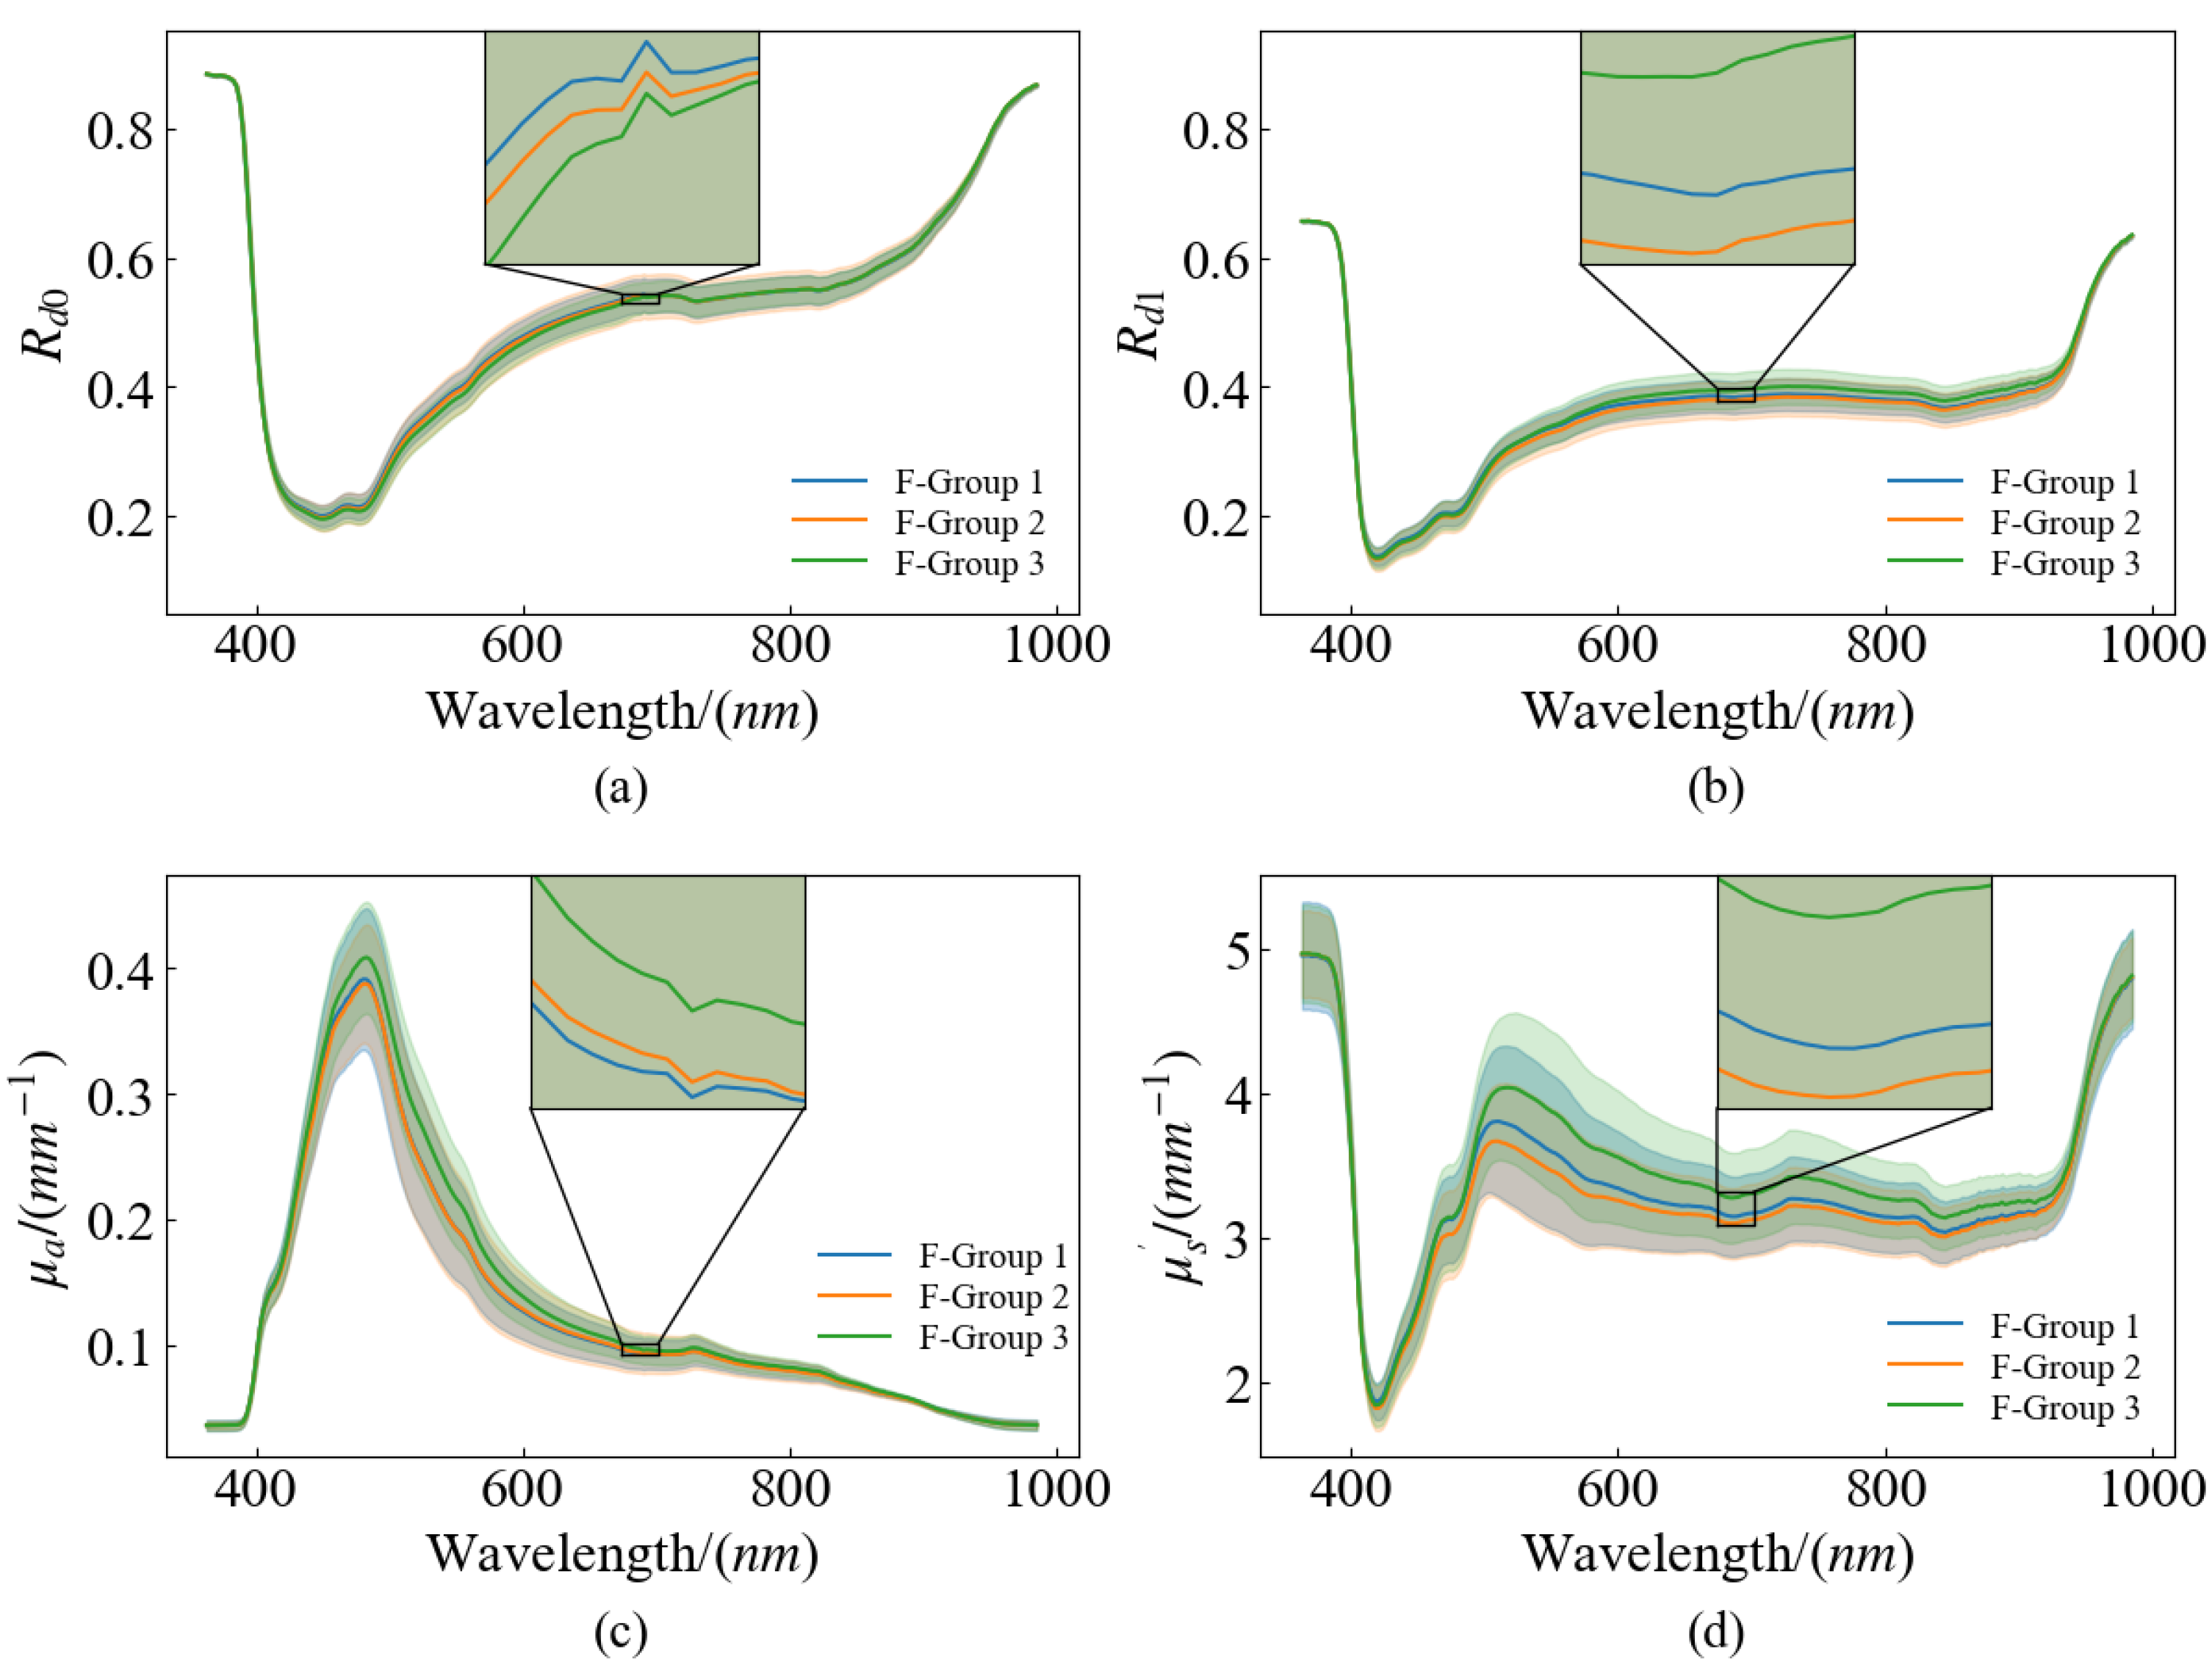
Figure 9 shows the average spectra of the R d 0 , R d 1 , μ a , and μ s of pears with F-Group 1, F-Group 2, and F-Group 3. Compared with the spectra after SSC grouping, the correlation between these four optical parameters and firmness is more irregular. It can be seen from Figure 9a,b that the R d 0 of pears in different firmness groups decreases with the increase in firmness value in the range of 435–695 nm. In Figure 9b, although the grouping of R d 1 is not regular, the R d 1 with different levels of firmness still has a large gap in the 545–890 nm band. In Figure 9c, the μ a between 610 and 695 nm increases with the increase in flesh firmness. There is a significant gap between the μ a of the high firmness group (F-Group 3) and the other two groups; the gap between the low firmness group and the medium firmness group (F-Group 1 and F-Group 2) is small, and the μ a of pears with different levels of firmness cannot be distinguished after 730 nm, indicating that the change in the hydrogen group content in this band has a small impact on the firmness.
Theoretically, the harder the fruit, the neater the shape and the closer the arrangement of cells. If the fruit softens enough, the relatively large parenchyma cells start to break down. This process, plasmatorrhexis, will enlarge the pores between the cells in the flesh tissue, and it will lead to apparent changes in the scattering properties of the pear tissue. As demonstrated in Figure 9d, the μ s in the 495–915 nm region of the pears of different firmness groups has more obvious differences, relatively. However, it did not show the rule that the greater the firmness, the higher the μ s . And the average μ s spectrum of the F-Group 2 did not lie between the other two groups. According to the firmness grouping boxplot in Figure 8, the medium firmness group had a small span of firmness values and contained only 32 pear samples. The pattern may be more obvious when the physicochemical values of the collected samples cover a wider range of firmness. Meanwhile, μ s shows greater deviation and a higher variation between 485 and 680 nm, possibly due to the incomplete separation of absorption and scattering or the crosstalk of these two optical properties [32].

3.4. SSC and Firmness Prediction with Different Optical Properties

3.4.1. Prediction of SSC

Table 2 displays the outcomes of the PLSR in forecasting the SSC of pear by utilizing diverse optical properties such as the input variables. The optical properties as input parameters include reflectance R d 0 ( f x = 0   mm - 1 ), R d 1 ( f x = 0.2   mm - 1 ), and their combination R d , the absorption coefficient μ a , the reduced scattering coefficient μ s , and the product μ a ×   μ s . The input form includes raw data and the data selected using CARS.
It can be found that in all the models with raw input, acceptable predictions are obtained except μ a ×   μ s . The PLSR model for soluble solid content prediction based on R d 0 obtained the best results ( R p 2 of 0.61 and RMSE p of 0.81%). Models based on the absorption coefficient μ a and reduced scattering coefficient μ s were followed, and these two results had comparable accuracy.
After subjecting the original input parameters to band selection using CARS, the CARS-PLSR model developed based on the combined reflectance R d spectra achieved the best SSC prediction results ( R p 2 of 0.90, RMSE p of 0.41%, and RPD of 3.23). To evaluate the pros and cons of the HSFDI technique versus traditional plane light for detecting physicochemical indices in pears, the reflectance at frequency 0 mm - 1 (equivalent to the plane light) of each sample was extracted as the data for the traditional plane light detection for comparison. The results show that although the SSC predictions obtained with R d 0 as an input were already acceptable, the prediction results are further improved by adding a high frequency reflectance R d 1 . Compared with the model using only diffuse reflectance, the R p 2 and RMSE p after adding high frequency reflectance improved by 5.88% and 18%, respectively. This suggests that adding more spatial frequencies may further improve the prediction effect.
In addition, among the models with the μ a , μ s , and μ a ×   μ s as inputs respectively, the SSC prediction results of μ a selected as feature bands were better than those of the other spectra. It proves that the correlation between the soluble solid content and light scattering was poor, and the scattering information interfered with the accuracy of SSC prediction. The chemical ingredients of pears (carbohydrate and liquid water content, for instance), directly affects the absorption property, and is largely independent of the scattering property. The CARS PLSR model with μ a ×   μ s as the input parameter yielded the prediction results with R p 2 of 0.80 and RMSE p of 0.57%, surpassing the model relying solely on the μ s . However, the performance of the model based on μ a ×   μ s was reduced compared to the model based on μ a . The prediction of strawberry SSC using the CARS-PLSR model based on μ a was also better than the μ a ×   μ s model [7]. This suggests that the product of optical properties preserves the absorption wavelength information of the μ a spectra, resulting in a richer spectral signature than the μ s alone, while the scattering information interferes with the accuracy of the SSC prediction model.
Meanwhile, the SSC prediction result of the PLSR model with μ a as the input parameter was also slightly higher than the model based on R d 0 . This was consistent with the results of Xia et al.’s external validation set for the pear SSC prediction model within 900–1700 nm [33], i.e., the μ a -based model outperformed the reflectance spectra model using the characteristic band selection. It showed that the optical absorption had great potential to predict the SSC of pears compared with the plane reflectance. The above results show that any of the spectra in diffuse reflectance R d 0 , multiple spatial frequency reflectance combinations R d , the absorption property μ a , and the product of optical properties μ a ×   μ s can be used for detecting SSC in pear flesh tissue.

3.4.2. Prediction of Firmness

Table 3 presents the PLSR model results for predicting pear firmness based on the input of different optical properties, where the input parameters and the input format were the same as described in Section 3.4.1.
The results show that when the input spectra were raw data, neither the reflectance nor the absorption and scattering properties can predict the firmness. This suggests that the relationship between pear firmness and the optical properties was not strong within the 360–1000 nm range. After the CARS band selection of the input data, all models showed significant improvement, indicating that there was a lot of complex information unrelated to firmness in the original data. Of all the models with reflectance as input, R d 1 predicted the firmness better than R d 0 . As the spatial frequency increased, the depth of light penetration into the pear flesh tissue became shallower. This suggests that high frequency reflectance is more effective in predicting fruit firmness, while low frequency reflectance has a negative impact on firmness prediction when combined with the results that the R d 0 model performs less well than the combined reflectance R d model.
Among the models with absorption and scattering properties as input, it can be seen that μ s predicted the firmness better than μ a . This reaffirmed that μ s , which is more connected with the interior structure of fruit tissue, reflects the variation in firmness better than μ a . Meanwhile, within all these models, μ a ×   μ s obtained the optimal forecast result ( R p 2 of 0.80, RMSE p of 3.25%, and RPD of 2.29). As mentioned above, μ s is conspicuous for the prediction of firmness, whereas μ a ×   μ s was considered in some studies to be a more effective predictor of fruit firmness attributes than individual μ s [7,34,35]. Multiplying μ a by μ s can accurately scale the μ s value at each band. At the same time, the peaks of the absorption at the characteristic wavelength were retained. This could be the reason why the product of two properties provided the optimal result.

4. Discussion

The present study provides a comprehensive analysis of the efficacy of various optical properties as input variables for predicting the SSC and firmness of pear flesh using PLSR. The results indicate that models based on reflectance at zero spatial frequency R d 0 achieved the best performance among those using raw input data for SSC prediction. This finding demonstrated that reflectance-based models could be employed due to their simplicity and effectiveness in non-destructive quality assessment of fruits. When the input data were subjected to CARS for feature selection, the combined reflectance spectra R d significantly improved prediction accuracy, suggesting that high-frequency reflectance data provide additional valuable information, thus enhancing the model’s predictive capability. This observation supports the hypothesis that incorporating multiple spatial frequencies can capture more comprehensive spectral features, thereby improving SSC prediction. The prediction of SSC from optical property spectra measured through hyperspectral spatial frequency domain imaging in this study is comparable or better than those reported in previous studies using a single integrating sphere [33,35]. For example, Xia et al. reported a R v 2 and RMSE v of 0.7757 and 0.5321, respectively, for the SSC prediction model for tomato when using the CARS-PLSR model to calculate reflectance measured using a single integrating sphere system in the 900–1700 nm spectral range [33].
Furthermore, the PLSR models for SSC prediction based on μ a yielded comparable and sometimes superior results to those using reflectance data alone. This is likely due to the absorption characteristics being directly influenced by the chemical composition of the pear, such as carbohydrates and water content, which are more directly related to SSC than scattering properties. The results based on absorption coefficient spectroscopy in predicting SSC in this study were superior to the prediction of the average μ a spectra of different parts of pear obtained by Liu et al. using the 500–1050 nm by integrating sphere measurements, with a R v 2 of 0.837 and RMSE v of 0.429 [29].
In parallel, the above findings on pear firmness reveal significant insights into predictive modeling using various optical properties. The raw spectral data in the 360–1000 nm range did not provide reliable firmness predictions, highlighting a weak intrinsic relationship between the optical properties and firmness within these wavelengths. This indicates that raw spectral data often contains noise and irrelevant information, which can obscure meaningful relationships. After implementing CARS for band selection, a marked improvement in the firmness model performance was observed, underscoring the effectiveness of CARS in isolating relevant spectral bands and removing extraneous information. However, the μ s -based prediction of CARS-PLSR hardness in this study is worse than that reported by Fang et al. [6], but better than the μ s results measured through Vis-NIR spatially resolved spectroscopy ( R p 2 = 0.76, RMSE p = 1.06) by Ma et al. [3].
Notably, reflectance models showed that R d 1 outperformed R d 0 , suggesting that high frequency reflectance has spectral features more related to tissue structure and is more effective for firmness prediction. Moreover, the model utilizing μ s demonstrated superior predictive capability over that of μ a . This reinforces the understanding that μ s , being more indicative of the internal structure, correlates better with firmness. The optimal model, combining μ a ×   μ s , achieved the best prediction accuracy, likely due to its ability to retain characteristic absorption peaks while scaling the scattering values appropriately, thus capturing structural and compositional nuances affecting firmness.
In contrast, the prediction results of quality indicators based on reflectance spectroscopy in this study were also superior to the results using only hyperspectral spectra [36,37]. For example, Xuan et al. developed a CARS-MLR model to predict the SSC of peaches, which resulted in R v 2 = 0.841, RMSE v = 0.546, and RPD = 2.51 [37]. For the same spatial frequency domain imaging technique, the prediction of fruit quality indexes based on continuous and high-resolution spectroscopy in this study is also superior to that of previous studies. He et al. detected the SSC and flesh hardness of pears using the optical property of multiwavelength SFDI measurements, with the results of R v 2 being 0.468 and 0.588 and RMSE v being 0.644 and 1.169, respectively [30]. It is demonstrated that the combination of hyperspectral and spatial frequency domain imaging techniques improves the accuracy of fruit quality detection to a great extent, while the wavelength selection in modeling may be another key factor in obtaining the satisfactory prediction accuracy of physicochemical indexes.
This study concentrates on how SSC and pear fruit firmness affect the characterization of spectral optical properties in the 360 to 1000 nm band. It is important to note that the percentage of moisture within the pear is equally important in the spectral information. In order to construct a model for spectral analysis that is less affected by changes in moisture content, the CARS algorithm was used in this study to screen out key spectral bands that are closely related to SSC and hardness, respectively, and the corresponding calibration models were created based on these bands. The next research work can evaluate in detail how moisture content specifically affects spectral properties by measuring the moisture content of pears.
Future research could also optimize the spatial frequency to improve detection accuracy for different fruits and their detection needs. Combining information from different spatial frequencies, the quality of fruits can be assessed more comprehensively. Capturing the shallow details of the fruit through high spatial frequencies while utilizing low spatial frequencies to obtain deeper information about the internal structure provides a comprehensive assessment of the fruit’s appearance and internal quality. In addition, exploring other fruits and expanding the dataset to include different varieties and growing conditions to build comprehensive assessment models that include multiple detection parameters such as sugar, acidity, hardness, and ripeness can provide valuable insights into the generalization of these models to provide a comprehensive fruit quality assessment system.
5. Conclusions

The optical properties were assessed using the HSFDI technique in this study, including the diffuse reflectance ( R d 0 and R d 1 in the spatial frequencies of 0 mm - 1 and 0.2 mm - 1 , respectively), the absorption coefficient μ a , and the reduced scattering coefficient μ s spectra of ‘Gong’ pears in the wavelength range of 360–1000 nm. The prediction model between optical properties and the physicochemical indicators (SSC and firmness) of pears were established. By grouping the physicochemical indices, the relationship between R d 0 , R d 1 , μ a , μ s , and quality attributes of pears has been studied. It was found that within specific wavelength bands, the larger the SSC, the larger the R d 0 , and the lower the R d 1 , μ a , and μ s ; the higher the firmness, the lower the R d 0 , and the larger the μ a and the R d 1 . And μ s did not show a specific linear pattern with firmness. Of all the CARS-PLSR prediction models for SSC, the models based on R d and μ a outperformed R d 0 . And among all the CARS-PLSR prediction models for firmness, the models based on the absorption and reduced scattering properties and their product ( μ s , μ a ×   μ s and μ a ) outperformed all the reflectance spectral models. This might suggest that μ a and μ s are more suitable than reflectance R d 0 and R d 1 for predicting the flesh firmness of pears. These results above showed that compared with single plane diffuse reflectance spectra, the HSFDI technique not only provides a rational and effective method to investigate the relationship between the internal quality of fruit and the optical properties, but also provides a new technical means for the non-destructive detecting of the internal quality of agricultural products with multiple indicators.

Author Contributions

Conceptualization, X.F.; methodology, Y.Y.; software, Y.Y.; validation, Y.Y., X.F. and Y.Z.; formal analysis, Y.Y. and X.F.; investigation, Y.Y. and X.F.; resources, X.F.; data curation, Y.Y.; writing—original draft preparation, Y.Y.; writing—review and editing, Y.Y., X.F. and Y.Z.; visualization, Y.Y.; supervision, X.F. and Y.Z.; project administration, X.F.; funding acquisition, X.F. All authors have read and agreed to the published version of the manuscript.

Funding

This research was supported by the National Natural Science Fund of China (32071904), the Natural Science Fund of Zhejiang Province (LY20C130008).

Data Availability Statement

The raw data supporting the conclusions of this article will be made available by the authors on request.

Acknowledgments

The authors thank the editors and anonymous reviewers for providing helpful suggestions for improving the quality of this manuscript.

Conflicts of Interest

The authors declare no conflicts of interest.

References

  1. Asllanaj, F.; Contassot-Vivier, S.; Hohmann, A.; Kienle, A. Light Propagation in Biological Tissue. J. Quant. Spectrosc. Radiat. Transf. 2019, 224, 78–90. [Google Scholar] [CrossRef]
  2. Zeng, S.; Cai, X.; Guo, W.; Zhang, Z.; Yang, S. Differences in Optical Properties and Internal Qualities of ‘Fuji’ Apple Produced in Different Areas of the Loess Plateau Region. Eur. J. Agron. 2022, 140, 126608. [Google Scholar] [CrossRef]
  3. Ma, T.; Xia, Y.; Inagaki, T.; Tsuchikawa, S. Rapid and Nondestructive Evaluation of Soluble Solids Content (SSC) and Firmness in Apple Using Vis–NIR Spatially Resolved Spectroscopy. Postharvest Biol. Technol. 2021, 173, 111417. [Google Scholar] [CrossRef]
  4. Tan, G.; Zhao, Y.; Wang, M.; Chen, X.; Wang, B.; Li, Q.X. Ultrasensitive Quantitation of Imidacloprid in Vegetables by Colloidal Gold and Time-Resolved Fluorescent Nanobead Traced Lateral Flow Immunoassays. Food Chem. 2020, 311, 126055. [Google Scholar] [CrossRef]
  5. Sun, Z.; Hu, D.; Zhou, T.; Sun, X.; Xie, L.; Ying, Y. Development of a Multispectral Spatial-Frequency Domain Imaging System for Property and Quality Assessment of Fruits and Vegetables. Comput. Electron. Agric. 2023, 214, 108251. [Google Scholar] [CrossRef]
  6. Fang, L.; Jiang, M.; Lan, W.; You, S.; Ding, F.; Tu, K.; Saeys, W.; Peng, J.; Xiao, H.; Pan, L. Assessing Sugar Composition and Tissue Structure Indices of ‘Korla’ Pear Cortex Using Bulk Optical Properties in the 500–1500 Nm. Postharvest Biol. Technol. 2023, 206, 112571. [Google Scholar] [CrossRef]
  7. Tian, S.; Tian, H.; Yang, Q.; Xu, H. Internal Quality Assessment of Kiwifruit by Bulk Optical Properties and Online Transmission Spectra. Food Control. 2022, 141, 109191. [Google Scholar] [CrossRef]
  8. Nicolaï, B.M.; Verlinden, B.E.; Desmet, M.; Saevels, S.; Saeys, W.; Theron, K.; Cubeddu, R.; Pifferi, A.; Torricelli, A. Time-Resolved and Continuous Wave NIR Reflectance Spectroscopy to Predict Soluble Solids Content and Firmness of Pear. Postharvest Biol. Technol. 2008, 47, 68–74. [Google Scholar] [CrossRef]
  9. Vanoli, M.; Van Beers, R.; Sadar, N.; Rizzolo, A.; Buccheri, M.; Grassi, M.; Lovati, F.; Nicolaï, B.; Aernouts, B.; Watté, R.; et al. Time- and Spatially-Resolved Spectroscopy to Determine the Bulk Optical Properties of ‘Braeburn’ Apples after Ripening in Shelf Life. Postharvest Biol. Technol. 2020, 168, 111233. [Google Scholar] [CrossRef]
  10. Joseph, M.; Van Cauteren, H.; Postelmans, A.; Nugraha, B.; Verreydt, C.; Verboven, P.; Nicolai, B.; Saeys, W. Porosity Quantification in Pear Fruit with X-Ray CT and Spatially Resolved Spectroscopy. Postharvest Biol. Technol. 2023, 204, 112455. [Google Scholar] [CrossRef]
  11. Travers, J.B.; Poon, C.; Bihl, T.; Rinehart, B.; Borchers, C.; Rohrbach, D.J.; Borchers, S.; Trevino, J.; Rubin, M.; Donnelly, H.; et al. Quantifying Skin Photodamage with Spatial Frequency Domain Imaging: Statistical Results. Biomed. Opt. Express 2019, 10, 4676. [Google Scholar] [CrossRef] [PubMed]
  12. Dognitz, N.; Wagnieres, G. Determination of Tissue Optical Properties by Steady-State Spatial Frequency-Domain Reflectometry. Laser. Med. Sci. 1998, 13, 55–65. [Google Scholar] [CrossRef]
  13. Cuccia, D.J.; Bevilacqua, F.; Durkin, A.J.; Tromberg, B.J. Modulated Imaging: Quantitative Analysis and Tomography of Turbid Media in the Spatial-Frequency Domain. Opt. Lett. 2005, 30, 1354. [Google Scholar] [CrossRef] [PubMed]
  14. Anderson, E.R.; Cuccia, D.J.; Durkin, A.J. Detection of Bruises on Golden Delicious Apples Using Spatial- Frequency-Domain Imaging. In Advanced Biomedical and Clinical Diagnostic Systems V; SPIE: Bellingham, WA, USA, 2007. [Google Scholar]
  15. Hu, D.; Fu, X.; He, X.; Ying, Y. Noncontact and Wide-Field Characterization of the Absorption and Scattering Properties of Apple Fruit Using Spatial-Frequency Domain Imaging. Sci. Rep. 2016, 6, 37920. [Google Scholar] [CrossRef] [PubMed]
  16. Hu, D.; Lu, R.; Ying, Y.; Fu, X. A Stepwise Method for Estimating Optical Properties of Two-Layer Turbid Media from Spatial-Frequency Domain Reflectance. Opt. Express 2019, 27, 1124. [Google Scholar] [CrossRef]
  17. Hu, D.; Lu, R.; Ying, Y. Spatial-Frequency Domain Imaging Coupled with Frequency Optimization for Estimating Optical Properties of Two-Layered Food and Agricultural Products. J. Food Eng. 2020, 277, 109909. [Google Scholar] [CrossRef]
  18. Hu, D.; Sun, T.; Ying, Y. Measurement of optical properties of fruit skin and flesh based on structured light reflection imaging. Trans. Chin. Soc. Agric. Eng. 2020, 36, 284–291. [Google Scholar] [CrossRef]
  19. Fu, X.; Jiang, X.; Dai, L.; Luo, Y. Study of Spatial Frequency Domain Imaging Technique for Turbid Media Optical Property Estimation and Application. In Optical Metrology and Inspection for Industrial Applications VII; SPIE: Bellingham, WA, USA, 2020. [Google Scholar]
  20. Lohner, S.A.; Biegert, K.; Nothelfer, S.; Hohmann, A.; McCormick, R.; Kienle, A. Determining the Optical Properties of Apple Tissue and Their Dependence on Physiological and Morphological Characteristics during Maturation. Part 1: Spatial Frequency Domain Imaging. Postharvest Biol. Technol. 2021, 181, 111647. [Google Scholar] [CrossRef]
  21. He, X.; Jiang, X.; Fu, X.; Gao, Y.; Rao, X. Least Squares Support Vector Machine Regression Combined with Monte Carlo Simulation Based on the Spatial Frequency Domain Imaging for the Detection of Optical Properties of Pear. Postharvest Biol. Technol. 2018, 145, 1–9. [Google Scholar] [CrossRef]
  22. Sun, Z.; Xie, L.; Hu, D.; Ying, Y. An Artificial Neural Network Model for Accurate and Efficient Optical Property Mapping from Spatial-Frequency Domain Images. Comput. Electron. Agric. 2021, 188, 106340. [Google Scholar] [CrossRef]
  23. Luo, Y.; Jiang, X.; Fu, X. Spatial Frequency Domain Imaging System Calibration, Correction and Application for Pear Surface Damage Detection. Foods 2021, 10, 2151. [Google Scholar] [CrossRef] [PubMed]
  24. Luo, Y. Research of Pear Optical Transmission Properties Detection Based on Hyperspectral-Spatial Frequency Domain Imaging. Master’s Thesis, Zhejiang Sci-Tech University, Hangzhou, China, 2023. [Google Scholar]
  25. Cuccia, D.J.; Bevilacqua, F.; Durkin, A.J.; Ayers, F.R.; Tromberg, B.J. Quantitation and Mapping of Tissue Optical Properties Using Modulated Imaging. J. Biomed. Opt. 2009, 14, 024012. [Google Scholar] [CrossRef] [PubMed]
  26. Paulsen, K.D.; Jiang, H. Spatially Varying Optical Property Reconstruction Using a Finite Element Diffusion Equation Approximation. Med. Phys. 1995, 22, 691–701. [Google Scholar] [CrossRef] [PubMed]
  27. Li, H.; Liang, Y.; Xu, Q.; Cao, D. Key Wavelengths Screening Using Competitive Adaptive Reweighted Sampling Method for Multivariate Calibration. Anal. Chim. Acta 2009, 648, 77–84. [Google Scholar] [CrossRef] [PubMed]
  28. GB/T 10650-2008; Fresh pear, State General Administration of the People’s Republic of China for Quality Supervision and Inspection and Quarantine. Standardization Administration of China: Beijing, China, 2008.
  29. Liu, Y.; Huo, Y.; Liao, J.; Lu, Y.; Yang, S. The Relationship between Optical Properties and Soluble Solid Contents of Gong Pear for Non-Destructive Internal Quality Inspection. Food Meas. 2024, 18, 2916–2925. [Google Scholar] [CrossRef]
  30. He, X.; Yang, X.; Fu, X.; Jiang, X.; Rao, X. Assessing Soluble Solid Content and Texture of Pear during Shelf-Life Period by Single Snapshot Spatial Frequency Domain Imaging. Biosyst. Eng. 2021, 212, 252–263. [Google Scholar] [CrossRef]
  31. Ma, C.; Feng, L.; Pan, L.; Wei, K.; Liu, Q.; Tu, K.; Zhao, L.; Peng, J. Relationships between Optical Properties of Peach Flesh with Firmness and Tissue Structure during Storage. Postharvest Biol. Technol. 2020, 163, 111134. [Google Scholar] [CrossRef]
  32. He, X.; Fu, X.; Rao, X.; Fang, Z. Assessing Firmness and SSC of Pears Based on Absorption and Scattering Properties Using an Automatic Integrating Sphere System from 400 to 1150 Nm. Postharvest Biol. Technol. 2016, 121, 62–70. [Google Scholar] [CrossRef]
  33. Xia, Y.; Tian, X.; Li, J.; Fan, S.; Huang, W. Prediction and Comparison of Models for Soluble Solids Content Determination in ‘Ya’ Pears Using Optical Properties and Diffuse Reflectance in 900–1700 Nm Spectral Region. IEEE Access 2019, 7, 179199–179211. [Google Scholar] [CrossRef]
  34. Huang, Y.; Lu, R.; Hu, D.; Chen, K. Quality Assessment of Tomato Fruit by Optical Absorption and Scattering Properties. Postharvest Biol. Technol. 2018, 143, 78–85. [Google Scholar] [CrossRef]
  35. Ma, T.; Zhao, J.; Inagaki, T.; Su, Y.; Tsuchikawa, S. Rapid and Nondestructive Prediction of Firmness, Soluble Solids Content, and PH in Kiwifruit Using Vis–NIR Spatially Resolved Spectroscopy. Postharvest Biol. Technol. 2022, 186, 111841. [Google Scholar] [CrossRef]
  36. Zhao, Y.; Zhang, C.; Zhu, S.; Li, Y.; He, Y.; Liu, F. Shape Induced Reflectance Correction for Non-Destructive Determination and Visualization of Soluble Solids Content in Winter Jujubes Using Hyperspectral Imaging in Two Different Spectral Ranges. Postharvest Biol. Technol. 2020, 161, 111080. [Google Scholar] [CrossRef]
  37. Xuan, G.; Gao, C.; Shao, Y. Spectral and Image Analysis of Hyperspectral Data for Internal and External Quality Assessment of Peach Fruit. Spectrochim. Acta Part Mol. Biomol. Spectrosc. 2022, 272, 121016. [Google Scholar] [CrossRef] [PubMed]
Figure 1. Schematic diagram of the HSFDI system.
Horticulturae 10 00853 g001
Figure 2. Image processing flow.
Horticulturae 10 00853 g002
Figure 3. Flow of data analysis for determining optical properties based on HSFDI technique.
Horticulturae 10 00853 g003
Figure 4. The statistical distribution of the (a) SSC and (b) firmness of the pear samples.
Horticulturae 10 00853 g004
Figure 5. Original spectra of the pears: (a) the reflectance R d 0 at f x = 0   mm - 1 ; (b) the reflectance R d 1 at f x = 0.2   mm - 1 ; (c) the absorption coefficient μ a ; (d) the reduced scattering coefficient μ s .
Horticulturae 10 00853 g005
Figure 6. The box diagrams of three sample groups with different SSC levels.
Horticulturae 10 00853 g006
Figure 7. The optical properties spectra of three sample groups with different SSC levels: (a) R d 0 , (b) R d 1 , (c) μ a , and (d) μ s ; the enlarged spectra are between 595 nm and 620 nm.
Horticulturae 10 00853 g007
Figure 8. The box diagrams of three sample groups with different firmness levels.
Horticulturae 10 00853 g008
Figure 9. The optical properties spectra of three sample groups with different firmness levels: (a) R d 0 , (b) R d 1 , (c) μ a , (d) μ s the enlarged spectra are between 671 nm and 696 nm.
Horticulturae 10 00853 g009
Table 1. The external and internal quality indices of pear samples.
ParametersIndexMaxMinAverageSDCV/(%)
Appearance
attributes
Max-diameter/(mm)106.481.190.04.90.055
Min-diameter/(mm)100.775.884.84.70.056
Weight/(g)538.7262.1346.555.20.159
Quality
attributes
SSC/(%)15.77.811.91.40.120
Firmness/(N)82.843.359.17.40.125
Table 2. The results of the PLSR models for SSC using the optical properties spectra in 360–1000 nm.
Optical
Parameters
Input
Format
EwsLvsCalibrationPrediction
R c 2 RMSE c R p 2 RMSE p RPD
R d 0 Raw25090.800.620.610.811.64
CARS69180.940.350.85 *0.502.66
R d 1 Raw250100.760.690.520.891.48
CARS29170.880.490.710.691.91
R d Raw25090.810.600.510.901.46
CARS41150.950.300.900.413.23
μ a Raw250110.780.660.560.851.54
CARS63150.930.380.870.472.80
μ s Raw250130.830.570.560.861.53
CARS63130.870.510.740.662.00
μ a ×   μ s Raw250100.720.740.111.221.08
CARS57200.940.340.800.572.31
* The bold type marked in the table indicates the acceptable prediction results.
Table 3. The results of the PLSR models for firmness using the optical properties spectra in 360–1000 nm.
Optical
Parameters
Input
Format
EwsLvsCalibrationPrediction
R c 2 RMSE c R p 2 RMSE p RPD
R d 0 Raw25030.185.420.136.791.10
CARS52170.772.900.495.191.43
R d 1 Raw25020.155.530.047.141.04
CARS29130.643.620.594.661.60
R d Raw25060.404.650.077.021.06
CARS46210.921.670.485.261.41
μ a Raw25030.185.430.017.261.02
CARS52150.921.650.664.241.76
μ s Raw25030.175.450.077.520.99
CARS42150.842.400.75 *3.662.03
μ a ×   μ s Raw25050.245.230.097.600.98
CARS35180.901.940.803.252.29
* The bold type marked in the table indicates the acceptable prediction results.
Disclaimer/Publisher’s Note: The statements, opinions and data contained in all publications are solely those of the individual author(s) and contributor(s) and not of MDPI and/or the editor(s). MDPI and/or the editor(s) disclaim responsibility for any injury to people or property resulting from any ideas, methods, instructions or products referred to in the content.