Abstract
To explore the effects of different preservation methods on the quality of loquat after fresh-keeping treatment, various preservation techniques were employed. These included natural preservation (NP), vacuum freezing preservation (VFP), vacuum at room temperature preservation (VP) and freezing preservation (FP). The quality assessment involved analyzing the effects of these preservation methods using physicochemical indexes, a colorimeter, an electronic nose (E-nose), an electronic tongue (E-tongue) and gas chromatography–mass spectrometry (GC–MS). The results showed minor differences in loquat quality under different preservation methods, with sensory scores ranging from 55 to 78 and ΔE values ranging from 11.92 to 18.59. Significant variations were observed in moisture content (ranging from 53.20 g/100 g to 87.20 g/100 g), calorie content (ranging from 42.55 Kcal/100 g to 87.30 Kcal/100 g), adhesion (ranging from 0.92 to 1.84 mJ) and hardness (ranging from 2.97 to 4.19 N) (p < 0.05). Additionally, the free amino acid content varied from 22.47 mg/g to 65.42 mg/g. GC–MS analysis identified a total of 47 volatile flavor substances in varieties of loquats, including 13 aldehydes, 9 esters, 6 ketones, 2 acids, 3 alcohols, 2 phenols, 3 pyrazines, 1 furan and 8 other substances. The relative content of aldehydes was significantly higher than that of other chemicals. The VFP and FP samples exhibited higher aldehyde content compared to the NP and VP samples. Moreover, Orthogonal Partial Least Squares-Discriminant Analysis (OPLS-DA) revealed 18 marked compounds that could differentiate between 5 loquat species. Analysis using E-nose and E-tongue indicated significant changes in the olfactory and gustatory senses of loquats following preservation. The VFP samples demonstrated the most effective preservation of loquat quality with minimal impact. This study provides some theoretical guidance for the home preservation of loquats.
1. Introduction
Loquat (Eriobotrya japonica Lindl.), a perennial fruit tree belonging to the Eriobotrya genus in the Rosaceae family, possesses both medicinal and edible properties [1,2,3]. However, it was not resistant to storage after picking and was highly perishable and deteriorated, attributed to its thin peel, tender flesh and fragile stalk [4,5]. Loquats undergo damage to a certain extent during transportation and storage, greatly reducing their quality, and in order to address these problems, the selection and research of preservation methods were crucial [6].
In recent years, research on loquats has deepened, highlighting the importance of understanding the effect of commonly used preservation methods on fruit quality to ensure long-term preservation. For example, Chen et al. [7] investigated that ultrasonic treatment combined with peroxyacetic acid (PA) treatment could reduce decay and maintain the quality of loquat fruits. They concluded that the combined treatment of UT and PA was a useful method to reduce the decay and browning of loquat fruits stored at room temperature. Yu et al. [8] investigated the effect of the phytosulfonic acid α-gene on sugar, proline and polyamine metabolism during the cold storage of loquat to explore the susceptibility of loquat to cold damage under low stress. Peng et al. [9] used low-temperature regulation to mitigate the cold damage in loquats, regulating the glycine content and energy status of loquats, and prolonging the shelf life of loquats. After picking loquat, complex physicochemical changes will occur in the storage process, and preservation methods on its quality characteristics have a great impact. Therefore, appropriate preservation methods can reduce the changes in loquat quality brought about by prolonged storage time [10].
Currently, analytical methods for food flavor evaluation include a human sensory evaluation and intelligent sensory evaluation. An intelligent sensory evaluation, such as gas chromatography–mass spectrometry (GC–MS), E-nose and E-tongue, etc., offers advanced approaches. GC–MS was a widespread and effective method for analyzing volatile compounds in food samples based on solid-phase microextraction, gas-phase separation and mass spectrometry [11,12,13,14]. E-nose technology was widely used in the food industry, effectively addressing the shortcomings of traditional manual evaluation, such as subjectivity and repeatability [15,16]. E-tongue technology was a new detection technology that is efficient and convenient to identify and analyze the taste of samples [17,18]. The physicochemical parameters were combined with intelligent senses to analyze the similarities and differences of loquat samples under different preservation methods [19]. The integration of various technologies provides more comprehensive and scientific information about the aroma of food [20].
Therefore, in this study, different preservation methods commonly used in home storage such as natural preservation (NP), vacuum frozen preservation (VFP), vacuum preservation (VP) and frozen preservation (FP) were applied to loquats. The sensory evaluation served as the primary method, supplemented by colorimeter analysis, textural property assessments, amino acid and organic acid analyses, GC–MS, E-nose and E-tongue evaluations, to comprehensively assess the changes and flavor differences in loquats. The study aimed to compare the effects of different preservation methods on the quality of loquats, offering theoretical guidance for identifying optimal home preservation methods for loquats.
2. Materials and Methods
2.1. Material and Sample Handling
The “Longquan No.1” loquats used for the experiment were purchased from the local fruit supermarket in Chengdu City, Sichuan Province, China, and these loquats were selected based on their uniform size, consistent appearance and fresh undamaged condition. About 18 (1 kg) ripe loquats were used for the preservation treatments at a time. The average diameter and weight of the loquat were measured at 4.56 ± 0.18 cm and 56.34 ± 2.71 g, respectively.
Fresh loquats of a relatively uniform size, weight and freshness were chosen for the study. Four different preservation methods were used: natural preservation (NP) at 20 ± 5 °C, vacuum freezing preservation (VFP) at 4 °C, vacuum preservation (VP) at 20 ± 5 °C and frozen preservation (FP) at 4 °C for seven days, with fresh loquat serving as the control group. (The temperature range during the ripening time of loquat was 20 ± 5 °C).
To prepare the samples, the loquats were peeled, split, cored and diced. Approximately 1 kg of loquat pieces were then placed in a wall-breaker and pulped for 2 min at a speed of 32,000 r/min to obtain a uniformly colored and flavored slurry sample. The resulting loquat slurry could be used for physicochemical indicators, GC–MS and intelligent sensory determination, or stored at −20 °C for later use [21].
2.2. Determination of Physicochemical Indicators
2.2.1. Sensory Evaluation
An evaluation panel consisting of 15 experienced food sensory evaluators was selected to assess the color, aroma, taste and completeness of fresh and preserved treated whole loquat fruits, with a maximum score of 100 points. (7 males and 8 females; Age: 20–30: 5, 31–40: 5, 41–50: 5). The sensory evaluation criteria are detailed in Table 1 [22].

Table 1.
Loquat sensory evaluation scoring criteria (100 points).
2.2.2. Colorimetric Analysis
A new fully automatic colorimeter (C-P3, Zhejiang Guangnian Zhixin Instrument Co., Ltd., ShaoXing, China) was used to determine the color values of different loquat samples. Healthy loquat flesh was selected randomly for measurements, three loquats were chosen for each sample and three replicate experiments were conducted to obtain L*, a* and b* data and take the average value [23]. Ensure that the sample covers the probe completely and no excess light passes through. ΔE represents the difference between two hues, and the larger the value, the greater the color difference between the experimental group and the control group. The formula for ΔE is shown in Equation (1).
ΔE = [(L0* − L*) + (a0* − a*) + (b0* − b*) 2](1/2)
2.2.3. Calories Analysis
Calory Answer (CA-HM, JWP, Tokyo, Japan) was used to determine the energy, carbohydrates, proteins and fat contents in loquat samples subjected to different preservation methods. First, a homogeneous and fine loquat slurry sample was selected, and then 5 g of the same mass of loquat slurry sample was sent for determination each time. The measurements were repeated three times for each sample [24].
2.2.4. Textural Properties Analysis
Texture profile analysis (TPA) was conducted using a texture analyzer (TMS-Pro, FTC, Los Angeles, CA, USA). The pre-test speed was set to 1.00 mm s−1, the test speed was 2 mm s−1, the post-test speed was 10 mm s−1, the measurement distance was 10 mm and the trigger value was 10 gf [25]. The hardness, toughness, chewability, adhesion and resilience of loquats were determined and analyzed by the P2 probe under the above measurement conditions. The measurements were repeated five times for each sample and the results were averaged.
2.2.5. Determination of Free Amino Acids (FAAs)
The free amino acid content was determined using an automated amino acid analyzer (S433D, Sykam, Munich, Germany). The samples were pretreated by hydrolysis with sulfosalicylic acid (Sinopharm Chemical Reagent Co., Ltd., Shanghai, China). A 20 g sample of loquat pulp was mixed with ultrapure water (resistivity ≥ 18.2 Ω) at a mass ratio of 1:1. After homogenization, filtration and centrifugation, 1 mL of the supernatant was filtered through a 0.22 μm microporous membrane (Sigma-Aldrich Trading Co., Ltd., Shanghai, China) into a sample bottle for testing. The analytical conditions were as follows: a PEEK analytical column (4.6 mm × 150 mm, 7 μm) with 10% cross-linking; column temperature ranging from 20 to 99 °C; reactor temperature of 130 °C; detection wavelengths of 570 and 440 nm; analytical time of 57 min; ninhydrin reagent (Merrill Biochemicals and Technology Co., Ltd., Shanghai, China) at a flow rate of 0.25 mL/min; and an injection volume of 40 μL [26]. The measurements were repeated three times for each sample and the results were averaged.
2.2.6. Determination of Organic Acids
HPLC (E2695, Waters, Milford, CT, USA) was used to determine the organic acids. The instrument was equipped with a 717+ autosampler, which injected 20 μL at a time, and a detector (PDA) set at a UV wavelength of 210 nm. The separation was carried out at 25 °C using an Agilent Zorbax SB-C18 column (5 μm, 4.6 mm × 250 mm). The mobile phase consisted of 20 mmol/L NaH2PO4 (prepared with 0.01 mol/L of potassium dihydrogen phosphate, pH 2.60) at a flow rate of 1.00 mL/min [27]. The measurements were repeated three times for each sample and the results were averaged.
2.3. Analysis of Volatile Compounds by GC–MS
Volatile compounds were analyzed by gas chromatography–mass spectrometry (GC–MS) (SQ680, PerkinElmer Instrument Co., Ltd., Waltham, MA, USA); 2.0 g of the slurry samples were placed in 15 mL vials, sealed and numbered, and each sample was subjected to three parallel experiments. The automated headspace sampling method with an injection volume of 100 μL, an incubation time of 15 min, an incubation temperature of 60 °C, an injection needle temperature of 85 °C and an incubation speed of 500 rpm was used [28]. The GC conditions included a DB-WAX capillary column (30 m × 0.25 mm, 0.25 μm), with an initial column temperature of 30 °C, ramped at 4 °C/min to 150 °C, followed by 5 °C/min to 240 °C, holding for 5 min. The inlet temperature was set at 250 °C, with helium as the carrier gas at a flow rate of 1.0 mL/min, and the injection was carried out in a non-split mode. The MS conditions comprised a mass spectrometry interface temperature of 250 °C, ion source temperature of 230 °C, electron ionization source with an energy of 70 eV, detector voltage of 0.2 kV, mass spectral scanning range m/z of 35–500 and a solvent delay time of 3 min [29].
2.4. Analysis of Intelligent Senses
2.4.1. Analysis of E-Nose
Olfactory analysis was conducted using the E-nose odor analyzer (FOX4000, Alpha MOS, Toulouse, France). A 2.0 g slurry sample was placed in a 20 mL headspace injection vial, sealed and numbered, and then tested using a PEN 3.5 E-nose. The E-nose operated with a carrier gas flow rate and injection flow rate of 0.30 L/min, a sensor cleaning time of 180 s, a waiting time of 15 s before sampling, and a sample testing time of 60 s [30].
2.4.2. Analysis of E-Tongue
Taste analysis was performed using the α-ASTREE E-tongue (Alpha MOS, Toulouse, France). Processed loquat pulp samples, weighing 50 g, were placed in a multifunctional wall-breaker. Then, 200 g of ultrapure water was added, crushed and mixed for 2 min. The mixture was filtered through four layers of gauze, and the filtrate was used for the E-tongue test [31]. The E-tongue was activated, calibrated and diagnosed under conditions that ensured the reliability and stability of the collected data [32].
2.5. Statistical Analysis
All data were analyzed using IBM SPSS Statistics 27.0 (SPSS Inc., Chicago, IL, USA), and p < 0.05 was considered statistically significant. The data are expressed as the mean ± standard deviation of multiple measurements. Origin 2021 (Origin Lab Corporation, Northampton, MA, USA) was used for radar plot analysis and histogram analysis. PCA analysis was performed by GenesCloud Tools (www.genescloud.cn. Access date: 1 April 2024). Correlation analyses such as OPLS-DA and VIP were conducted by SIMCA 14.1 (MKS Umetrics, Umea, Sweden).
3. Results and Discussion
3.1. Physicochemical Properties Analysis
3.1.1. Sensory Analysis of Loquat Samples
Figure 1A shows the treatment of loquat under the fresh, NP, VFP, VP and FP conditions. As depicted in Figure 1, VFP better preserved the color and appearance of the loquat. Under this condition, the color of the treated loquats closely resembled that of fresh ones, with minimal morphological changes and little damage [33]. The FP specimens exhibited a darker color, due to the surface oxidation of loquats upon exposure to air after freezing [34].
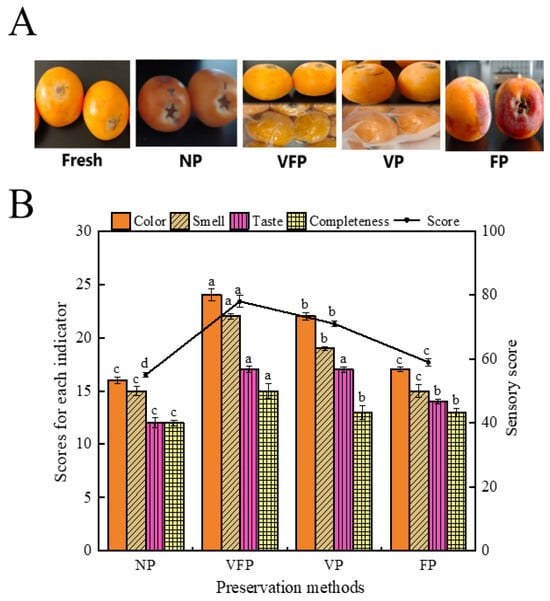
Figure 1.
Sensory analysis of loquat samples. (A) Loquat samples treated with different preservation methods. (B) Histogram of sensory evaluation results. Values marked with different letters in the histogram were significantly different (p < 0.05, n = 15).
As illustrated in Figure 1B, the sensory scores ranged from 55 to 78, with the VFP samples achieving the highest sensory scores. This indicates that the VFP samples exhibited few differences in color, flavor and loss after picking compared to fresh loquats [35]. The NP and FP samples show minimal difference, consistent with the results of the color difference principal component analysis and the E-nose principal component analysis. The lowest scores have been observed previously for the NP samples, indicating significant changes in color, flavor and integrity considerably during home preservation, likely influenced by the air temperature and humidity during preservation. VFP used a combination of vacuum packaging and freezing to better separate the loquats from the outside environment and reduce air oxidation, while reducing the activity of the loquat’s internal tissues when the temperature was 4 °C, preserving the freshness for a longer period of time [36].
3.1.2. Colorimetric Analysis
A new automatic colorimeter was used to determine the color values of the loquat samples. Therefore, the trichromatic values, chromaticity and hue of loquats were analyzed, and the data were plotted as histograms (Figure 2). The results indicated that L* (from 58.85 to 42.37), a* (from 17.01 to 12.03) and b* (from 29.84 to 11.84) were significantly lower (p < 0.05) compared to the fresh loquat samples in the four groups of NP, VFP, VP and FP samples. Among them, the FP samples showed the most significant change in values. This phenomenon could be explained by the increase in moisture content on the surface of loquats after freezing treatment, which accelerated the rate of darkening. The color difference values indicated that the VFP treatment had the least effect on the loquat color (ΔE of 11.92) while the FP treatment had the greatest effect on the loquat color (ΔE of 18.59). It is clear that vacuum packaging and a temperature of 4 °C reduced the possibility of browning [37].
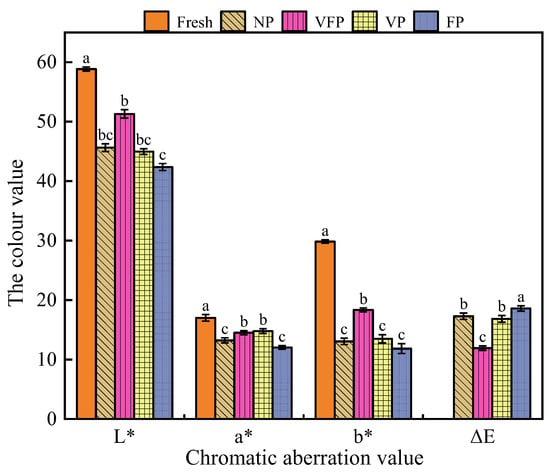
Figure 2.
Histogram of color aberration analysis of loquat. Values marked with different letters in the histogram were significantly different (p < 0.05, n = 3).
3.1.3. Nutritional Analysis
A physico-chemical analysis of loquat was carried out using four different methods, and the data were plotted as histograms (Table 2). The results indicated significant variations in energy (ranging from 39.40 kcal/100 g to 87.30 kcal/100 g), protein content (ranging from 0.80 g/100 g to 3.30 g/100 g) and carbohydrate content (increasing from 9.30 g/100 g to 17.8 g/100 g) with the varying preservation methods (p < 0.05). Conversely, moisture content decreased from 87.20 g/100 g to 53.20 g/100 g (p < 0.05), while fat content increased marginally (from 0.010 g/100 g to 1.40 g/100 g) (p < 0.05). Notably, the preservation effect of VFP on the protein, carbohydrate and water of loquat was obviously better than that of other preservation methods. The moisture content of fresh loquat gradually declined with the increase in the preservation time, and different preservation methods exhibited distinct effects on loquat water retention [38]. The results showed that the use of two methods of vacuum packaging treatment (VFP and VP) can better reduce the loss of water inside the loquats.

Table 2.
Calories analysis of loquat under different preservation methods.
3.1.4. Textural Properties Analysis
The textural quality of food is an organoleptic characterization of the textural and structural properties of food, and the adhesion and hardness of the loquat varied under different preservation methods (Figure 3). The results showed significant increases in the adhesion (ranging from 0.92 to 1.84 mJ) and hardness (ranging from 2.97 to 4.19 N) of loquats with changes in preservation methods (p < 0.05), which may be attributed to enhanced intermolecular interactions due to water evaporation and the prolonged shelf life of loquats. However, the cohesion (ranging from a 0.23 to 0.26 ratio), elasticity (ranging from 0.94 to 0.97 mm) and chewiness (ranging from 1.27 to 1.41 N) of loquats did not change significantly with alterations in the preservation method (p < 0.05), suggesting that different preservation methods altered the cohesion of loquats. Furthermore, there was no significant effect on elasticity and chewability [39]. The results showed that the two methods, VFP and FP, used at a temperature of 4 °C, better retained the original hardness of loquats.
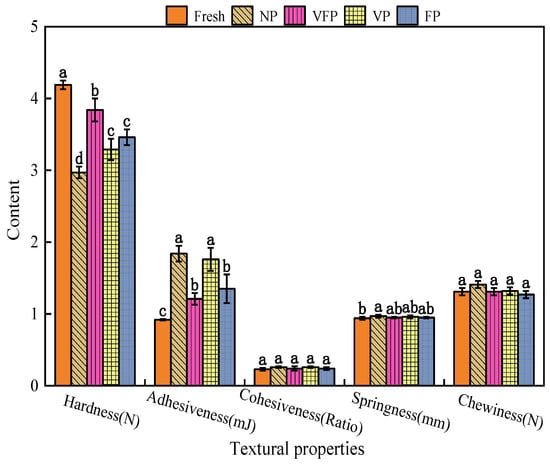
Figure 3.
Histogram of the qualitative analysis of loquat, values marked with different letters in the same histogram are significantly different (p < 0.05, n = 5).
3.1.5. Free Amino Acids Analysis
As shown in Table 3, the content of FAAs in loquats varied with different preservation methods. The highest total free amino acid content has been observed previously in NP (65.42 mg/g) and the lowest in fresh (22.47 mg/g). The free amino acids can be classified into fresh flavor amino acids (including Asp, Asn and Glu) (16.06–47.93 mg/g), sweet amino acids (including Ala, Gly, Pro, Thr and Ser) (4.74–13.07 mg/g), bitter amino acids (including His, Lys, Arg, Ile, Leu and Val) (1.33–3.49 mg/g) and astringent amino acids (including GABA) (0.27–0.69 mg/g). The loquat treated with five different preservation methods had the highest fresh amino acid content (Figure 4A), accounting for 71.48, 74.59, 75.67, 74.78 and 73.27% of the total free amino acids, respectively. The TAVs of FAAs were calculated to evaluate the contribution of FAAs to the taste of loquat (Figure 4B). The TAVs of Asn, Glu, Ala and GABA in loquats treated with five different preservation methods were all above 1.0, indicating their potential role in imparting freshness and sweetness to the loquat. The TAVs of Asp in NP, VP and FP were also greater than 1.0, suggesting variations in the taste of loquat among the different preservation methods. This indicates that different preservation methods bring about a greater effect on the amino acid content of loquats [40]. The increase in freshness amino acids and sweetness amino acids indicated that, within a certain time frame, the content of these two types of amino acids in loquats increased with the extension of storage time, which gave loquats a good flavor and texture.

Table 3.
Free amino acid content of different loquat samples.
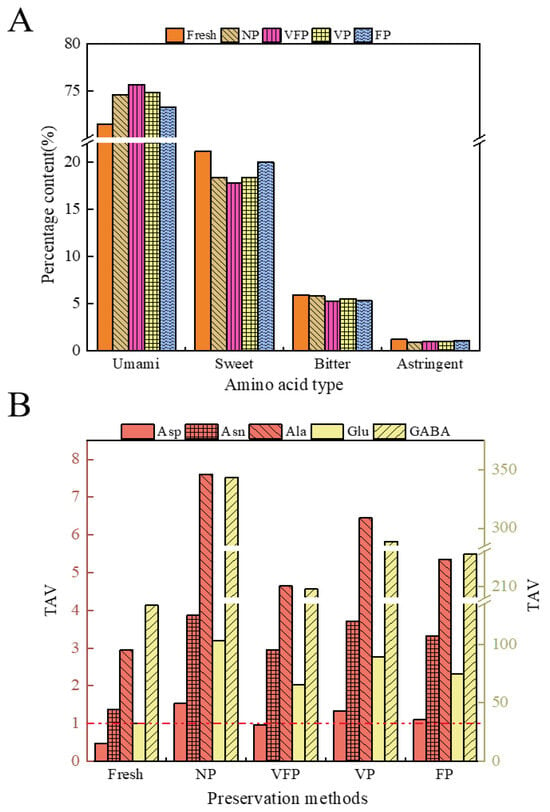
Figure 4.
(A) Percentage of different classes of free amino acids in loquat. (B) Taste Activity Value (TAV) of free amino acids. (Red dashed line: TAV equals 1). TAVs of free amino acids were calculated by the ratio of the concentration of a compound to its taste threshold.
3.1.6. Organic Acids Analysis
As shown in Figure 5A, the type of organic acids did not change with the change in the preservation method, but the content changed. The highest organic acid content has been found previously in VFP (9.07 mg/g), followed by FP (8.68 mg/g), VP (4.56 mg/g) and NP (2.91 mg/g), with fresh having the lowest (0.78 mg/g). To assess the contribution of organic acids to the flavor of loquats, the TAV of organic acids was calculated. As depicted in Figure 5B, the TAV of lactic and acetic acids was greater than 1.0 for all four loquats except fresh. The TAV of tartaric acid was greater than 1.0 for VFP, VP and FP, while the TAV of malic acid was greater than 1.0 for NP. Succinic acid and citric acid had lower TAVs than 1.0 for the five loquats. The results showed that tartaric, malic, lactic and acetic acids play significant roles in the taste of loquat, and are influenced by different preservation methods [41].
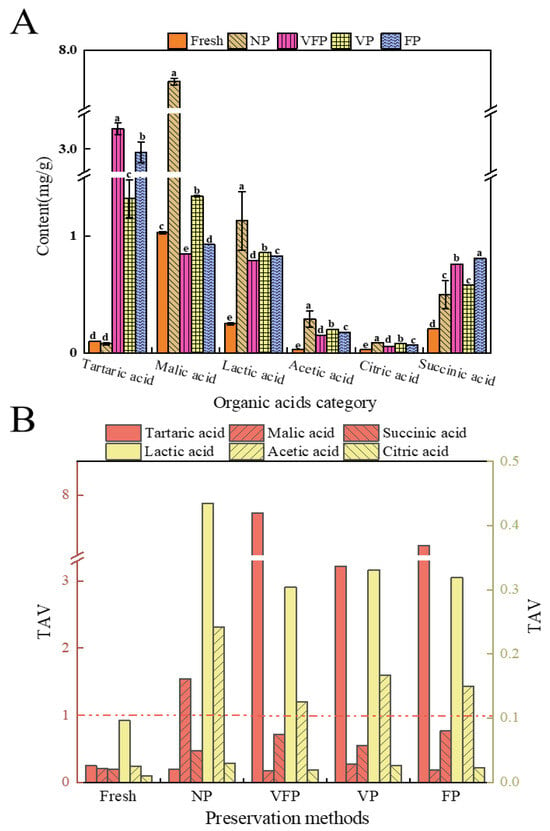
Figure 5.
Analysis of organic acids in loquat. (A) Concentrations of organic acids, values marked with different letters in the same histogram are significantly different (p < 0.05, n = 3) (B) TAVs of organic acids. (Red dashed line: TAV equals 1). TAVs of organic acids were calculated by the ratio of the concentration of a compound to its taste threshold.
3.2. Volatile Profile of Loquat Characterized by GC–MS
3.2.1. Differences in Flavor Substances in Loquat with Different Treatment Methods
The total concentration of volatile compounds varies depending on the preservation method. Among the flavor substances analyzed by GC–MS (Table 4), 47 peaks (including monomers and dimers) were identified for loquat volatile substances, including 13 aldehydes, 9 esters, 6 ketones, 2 acids, 3 alcohols, 2 phenols, 3 pyrazines, 1 furan, 1 pyrrole, 1 aromatic, 1 olefin, 1 thioether, 2 amines and 2 alkanes.

Table 4.
Volatile compounds found in loquat from five different preservation methods.
To better illustrate the differences between loquat treatments under different preservation methods, an approximate percentage of odorant species in loquat under different preservation methods was obtained (Figure 6A). The results showed that the volatile flavor compounds of the five loquat samples were mainly composed of aldehydes, esters and acids, accounting for 59.71–64%, 18.13–20.28% and 4.08–5.43%, respectively. Among the aldehydes, compared with fresh loquat, VFP and FP exhibited higher aldehyde content in the other four loquat samples. Moreover, the OAV value of VFP hexenal was significantly higher than that of other treatment methods, followed by VP, NP and FP, aligning with the conclusions in the table. During the preservation process, a substantial amount of esters was produced, significantly higher in loquat treated with NP, VFP, VP and FP than in fresh, due to the oxidation reaction of oxidase in loquat pulp upon contact with air [42]. Also, the reduction of Aldehydes may be due to the microbial growth of loquats during the preservation process, and it has been shown that the proliferation of Pseudomonas aeruginosa leads to significant changes in hexanal content [43].
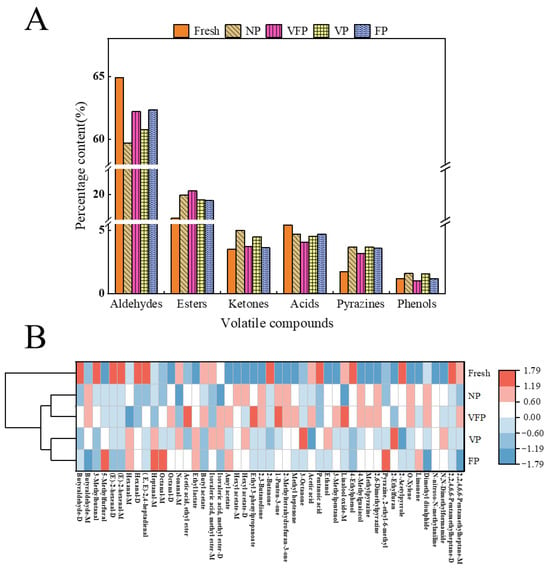
Figure 6.
Analysis of volatile compounds of the loquat identified by GC–MS. (A) Proportions of each group of volatiles. (B) Concentrations of volatile compounds and clustering results.
To further understand the differences in the volatile components of loquat under different preservation methods, a cluster analysis was conducted using heat maps (Figure 6B). The relative percentages of characteristic flavor compounds such as Butyraldehyde-D, 3-Methylbutanal, (E)-2-hexenal, Hexanal-D, 2-Butanone, pentanoic acid and 4-Ethylphenol in fresh are relatively high. Meanwhile, the concentrations of characteristic flavor substances such as acetic acid, ethyl ester, ethyl-3-phenylpropanoate, 1-Penten-3-one and Linalool oxide-M in NF were relatively high. The contents of characteristic flavor compounds such as 3-Octanone and 2-Ethylfuran were relatively high in VFP. The concentrations of 5-methylfurfural, octanal-M, heptanal-M, Pyrazine and 2-ethyl-6-methyl in FP were relatively high. Compared with fresh, the concentrations of many compounds in NP, VFP, VP and FP increased or decreased significantly, which can be intuitively reflected in the heat map of volatile compound concentrations. Based on the above results, it can be inferred that the volatile composition of loquat varies significantly due to different treatment methods, and NP, VFP and VP have a great influence on loquat volatility [44].
3.2.2. Principal Component Analysis and Orthogonal Partial Least Squares-Discriminant Analysis with Cross-Validation
Five loquat samples were quantified by GC–MS through principal component analysis (PCA). As shown in Figure 7A, NP is positioned farther away from the rest of the samples on PC1, whereas fresh was closer to VP and FP. Similarly, in PC2, the VFP was notably distant from the other samples. In the clustered heat map (Figure 7E), it can be seen that the volatile spectrum of fresh was significantly different from that of the other four loquats, while the volatile spectra of VFP and FP were highly similar and were grouped as NP and VP. Therefore, principal component analysis (PCA) and cluster similarity analysis (clustering) were used to distinguish the odor characteristics of the five loquat cultivars.
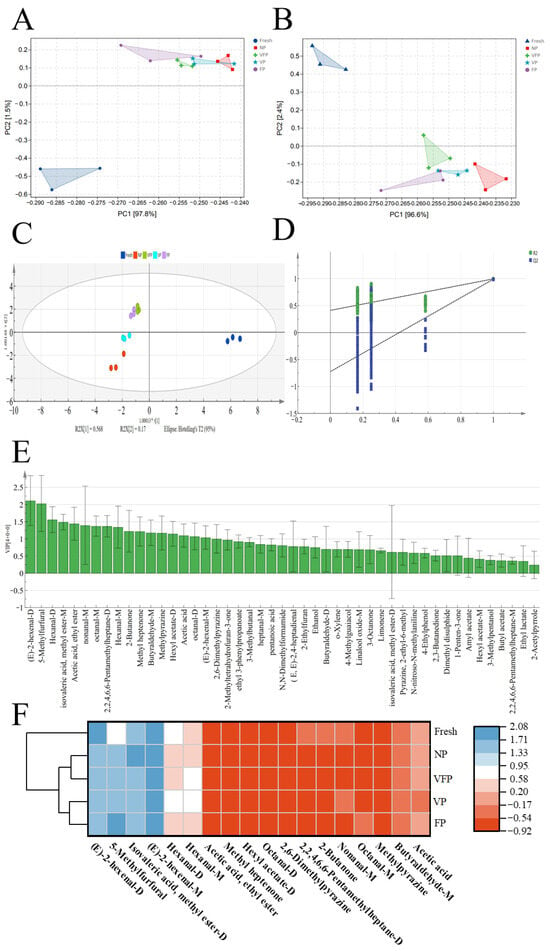
Figure 7.
(A) PCA scatter map of 47 volatile substances. (B) PCA scatter map of 18 differential volatile substances. OPLS-DA scatter plot (C) and trans-verifications by a rearrangement trial (D) of odor profiles in five loquats. VIP distribution (E) and clustering heatmap (F) of the differential volatile compounds screened from five loquat samples.
In Figure 7D, R2X and R2Y represent the rate at which the simulation interprets the X and Y vectors, respectively, and Q2 represents the predictive capability in the actual simulation. Parameters with R2 and Q2 above 0.5 and close to 1.0 were considered definitive results. As shown in Figure 7C, the model encapsulates a significant portion of the information on the volatile components in the five loquats. The results suggested that most of the loquat samples can be classified by the OPLS-DA diffusion plot, with the classification response closely resembling the PCA plot (Figure 7A). To mitigate overestimation, the accuracy of the OPLS-DA model was confirmed through rearrangement experiments, as depicted in Figure 7. Subsequently, 200 cross-validations were conducted, simulating the backtrace fringes of Q2 across the horizontal ordinates, with node increments representing negativity. All rearrangement experiments R2 and Q2 were smaller than the original data, indicating that the simulation equations were not over-adapted. Therefore, the results obtained from the established OPLS-DA simulations were consistent and reasonable [45].
After detecting 47 odor compounds in loquat samples treated with five different preservation methods using GC–MS, the VIP values (Figure 7E) obtained from establishing a reliable OPLS-DA match were used to estimate the involvement of each odorant compound in loquat. The study revealed 18 odor chemicals, including 5-methylfurfural, acetic acid, nonanal-M, (E)-2-hexenal, octanal-M, methyl isovalerate, hexyl acetate-D, butyraldehyde-M, 2,6-dimethylpyrazine, heptanal-M, hexanal-D, 2-ethyl-6-methylpyrazine and ethyl acetate. PCA was performed using these discriminatory indicator chemicals (Figure 7B). Moreover, the study confirmed that the combination of 18 indicator odor chemicals and PCA could effectively distinguish the variation among the five loquats [46].
3.3. Intelligent Senses Analysis
3.3.1. E-Nose Analysis
E-nose analysis was conducted on loquat samples preserved by five different methods, with the response values of the sensors at 120 s depicted as radargrams. In Figure 8A, significant variations in the response values of the dried samples were observed across most sensors, except for the LY2/LG sensors. The results indicated that the different preservation methods affected the aroma of loquat, and that the aroma of the VP loquat samples changed the most significantly. Comparing the fresh and VFP samples, the response values closely aligned with those of the T30/1, P10/1, P10/2, T70/2, P40/1, PA/2, P30/1, P40/2, P30/2 and T40/2 sensors, which were consistent with the chromatographic results. Notably, the response values of the fresh, NP, VFP, VP and FP samples were consistent with the LY2/G, LY2/AA, LY2/Gh, LY2/gCTl and LY2/gCT sensors, indicating a minimal change in the aroma before and after preservation. Significant differences were observed in the response values of VP and FP on the E-nose sensor. The method of preservation significantly affected the flavor of loquats, with VFP and fresh loquats exhibiting similar flavor qualities, indicating that the flavor profiles were highly similar within these groups.
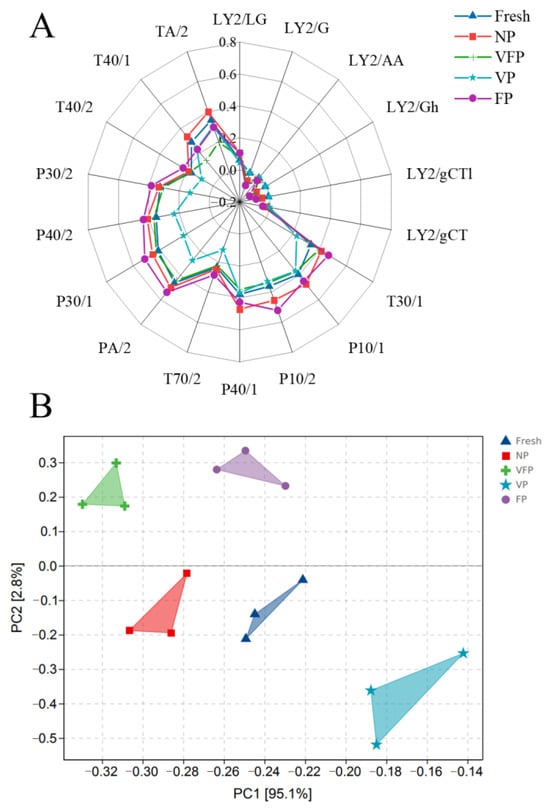
Figure 8.
E-nose analysis of the loquat. (A) Radar graph for the E-nose analysis. (B) PCA graph for the E-nose analysis.
This phenomenon was reflected in the PCA results (Figure 8B). VP was distributed in the first and second quadrants, while FP was in the fourth quadrant, indicating significant differences in an olfactory sense between the two preservation methods. The contribution of the first principal component (PC1) was 95.10% and the contribution of the second principal component (PC2) was 2.80%. The total contribution of the two principal components was 97.90%, indicating a better effect of dimensionality reduction. The E-nose effectively distinguished the odor of loquats treated with different preservation methods, further confirming that the electronic nose combined with PCA analysis could distinguish loquat samples treated by various preservation methods [47].
3.3.2. E-Nose and GC–MS Correlation Analysis
In the E-nose and GC–MS correlation analysis (Figure 9), the response values of the electronic nose sensor were compared with the differential volatile compounds detected by GC–MS. Moreover, compounds like (E)-2-hexanal-D (monomer and dimer) and 2-butanone showed positive correlations with the LY2/G, LY2/AA and LY2/LG sensors, while 5-methylfurfural exhibited a negative correlation. (E)-2-hexanal-M (monomer and dimer) was extremely negatively correlated with the LY2/G and LY2/LG sensors. Additionally, octanal correlated positively with the P10/1 sensor, while butanal showed a negative correlation. The GC–MS results indicated that these compounds were highly expressed in fresh. On the contrary, 5-methylfurfural was positively correlated with the LY2/gCT, LY2/gCT1, LY2/Gh, LY2/AA and LY2/G sensors and negatively correlated with the LY2/LG sensor. Thus, combining E-nose and GC–MS could distinguish loquats treated with five different preservation methods based on olfaction.
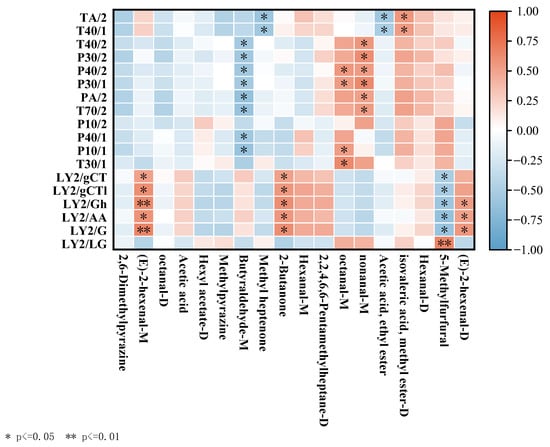
Figure 9.
Heat map of the correlation between the response values of the E-nose sensors and the levels of differential volatile compounds.
3.3.3. E-Tongue Analysis
The E-tongue method was used to evaluate the differences in the taste attributes of loquat under different preservation methods [48]. The basic sensory taste indices were presented as radar images (Figure 10A). The greatest differences in response values were observed between FP and the other four sensors for loquat acidity (AHS), sweetness (ANS) and freshness (NMS). The highest values were observed for NP (118.67) in AHS and freshness (714.92) in ANS. The bitter (SCS) and savory (CTS) flavors showed little variability. The PCA results (Figure 10B) depicted NP, VFP, VP and FP as relatively independent and far away from fresh. The results indicated that the intensity of loquat flavor gradually changed due to the change in preservation methods, and fresh was significantly different from the other four loquat samples. The results suggested the effect of different preservation methods on loquats’ texture.
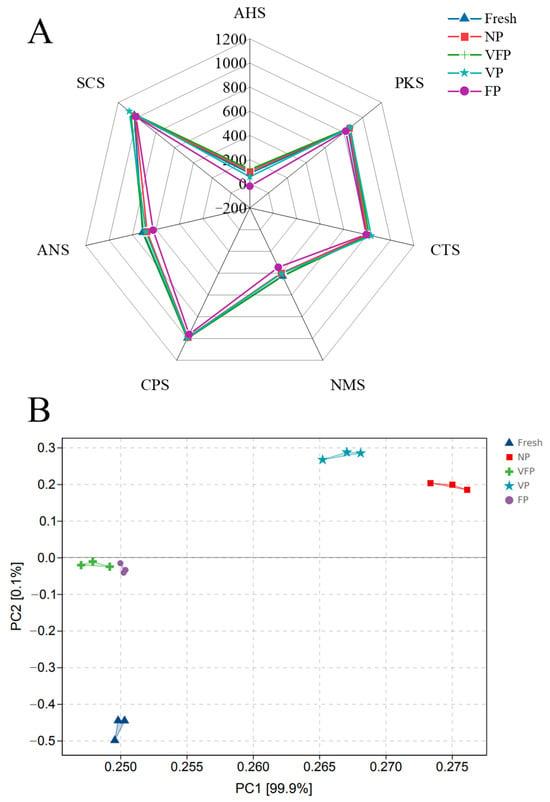
Figure 10.
E-tongue analysis of the loquat. (A) Radar graph for the E-tongue analysis. (B) PCA graph for the E-tongue analysis.
4. Conclusions
To address the issue of loquats being prone to oxidation and blackening after picking, and being damaged by microorganisms, resulting in a serious loss of quality such as color, aroma, flavor and shape, different preservation methods were adopted to treat loquat from the perspective of feasibility analysis of loquat preservation. The effects of different preservation methods on the quality of loquat were analyzed using physical and chemical indicators, such as a colorimeter, E-nose, E-tongue and GC–MS. The sensory scores ranged from 55 to 78, and ΔE ranged from 11.92 to 18.59. Moisture content, heat, adhesion and hardness varied significantly (p < 0.05) with the change in preservation methods. Free amino acid and organic acid contents also varied. Moreover, a total of 47 volatile flavor substances were detected by the GC–MS method, including 13 aldehydes, 9 esters, 6 ketones, 2 acids, 3 alcohols, 2 phenols, 3 pyrazines, 1 furan and 8 other substances. Aldehydes were found to be the most abundant, significantly contributing to the flavor substances of loquat. Furthermore, the OPLS-DA model analysis identified 18 marker compounds capable of distinguishing between the five loquat species. Both the E-nose and E-tongue PCA results showed that the VFP samples were the closest to fresh loquat in the olfactory and gustatory senses. When the preservation method was FP, both the olfactory and gustatory sensations of loquat changed significantly. This indicates that the FP preservation treatment at 4 °C alone had a bigger effect on loquats compared to the combination of vacuum packaging and low temperature treatment at 4 °C. Based on physicochemical indexes, color differences, E-nose, E-tongue, GC–MS and intelligent sensory analyses, when the preservation temperature was 4 °C, and also after using vacuum packaging, loquats were the most similar to fresh loquats in color, aroma, taste and shape, with less loss of volatiles. Therefore, VFP could be the best method of home loquat preservation.
Author Contributions
M.Q. (Writing—original draft, Conceptualization, Funding acquisition, Supervision, Writing—review and editing), S.L. (Investigation, Data curation, Formal analysis, Writing—original draft, Methodology, Validation), Z.Z. (Investigation, Data curation), X.C. (Methodology, Resources, Writing—review and editing), X.Z. (Writing—review and editing), Y.J. (Resources, Writing—review and editing), and B.M. (Project administration, Funding acquisition). All authors have read and agreed to the published version of the manuscript.
Funding
This study was supported jointly by the Natural Science Foundation project of Sichuan Tourism University (No. 22SCTUTG01 and No. 2023SCTUZD07), the Major science and technology project of Yunnan Province (No. 202202AE090061), the Agricultural Science and Technology Innovation Program (No. ASTIP2023-34-IUA-05), the Science and Technology Talents and Platform Program (Academician Expert Workstation) of Yunnan Province (No. 202205AF150036) and Chengdu Green and Low-carbon Development Research base (LD2024Z28).
Data Availability Statement
Data are contained within the article.
Conflicts of Interest
The authors declare that they have no conflicts of interest.
References
- Zhang, H.F.; Pu, J.; Liu, H.; Wang, M.; Du, Y.; Tang, X.F.; Luo, X.; Wang, Y.Q.; Deng, Q.X. Effects of L-Cysteine and γ-Aminobutyric Acid Treatment on Postharvest Quality and Antioxidant Activity of Loquat Fruit during Storage. Int. J. Mol. Sci. 2023, 24, 10541. [Google Scholar] [CrossRef] [PubMed]
- Su, J.Y.; Cao, Z.X.; Mao, Y.Y.; Shen, W.; Wang, X.Y.; Zhang, S.Y.; Chen, Y.Q.; Ge, X.M. Preparation of eugenol/1−methylcyclopropene composite microsphere by S/O/W method and study on the postharvest quality of loquat. J. Stored Prod. Res. 2024, 105, 102252. [Google Scholar] [CrossRef]
- Huang, G.L.; Liu, T.T.; Mao, X.M.; Quan, X.Y.; Sui, S.Y.; Ma, J.J.; Sun, L.X.; Li, H.C.; Shao, Q.S.; Wang, Y.N. Insights into the volatile flavor and quality profiles of loquat (Eriobotrya japonica Lindl.) during shelf-life via HS-GC-IMS, E-nose, and E-tongue. Food Chem. X 2023, 20, 100886. [Google Scholar] [CrossRef] [PubMed]
- Liu, Y.L.; Zhang, W.N.; Xu, C.J.; Li, X. Biological Activities of Extracts from Loquat (Eriobotrya japonica Lindl.): A Review. Int. J. Mol. Sci. 2016, 17, 1983. [Google Scholar] [CrossRef] [PubMed]
- Cao, S.; Ma, C.; Ba, L.J.; Ji, N.; Wang, R.; Jiang, P.; Tan, G.X. Effect of different cling paper on shelf-life quality and physiological characteristics of loquat. Sci. Technol. Food Ind. 2021, 42, 272–276. [Google Scholar]
- Wang, H.; Zheng, Y.; Tang, X.Y.; Zhang, T. Formulation of a Stable Oil-in-Water Microemulsion of Torreya grandis cv. Merrillii Aril Essential Oil and Its Application in Loquat Fruit Preservation. Foods 2023, 12, 4005. [Google Scholar] [CrossRef] [PubMed]
- Ling, C.; Xu, J.; Shao, S.; Wang, L.; Jin, P.; Zheng, Y.H. Effect of Ultrasonic Treatment Combined with Peracetic Acid Treatment Reduces Decay and Maintains Quality in Loquat Fruit. J. Food Qual. 2018, 2018, 7564056. [Google Scholar] [CrossRef]
- Liu, Y.; Hou, Y.Y.; Yi, B.H.; Zhao, Y.Q.; Bao, Y.Q.; Wu, Z.G.; Zheng, Y.H.; Jin, P. Exogenous phytosulfokine α alleviates chilling injury of loquat fruit via regulating sugar, proline, polyamine and γ-aminobutyric acid metabolisms. Food Chem. 2023, 436, 137729. [Google Scholar] [CrossRef] [PubMed]
- Jin, P.; Zhang, Y.; Shan, T.M.; Huang, Y.P.; Xu, J.; Zheng, Y.H. Low-temperature conditioning alleviates chilling injury in loquat fruit and regulates glycine betaine content and energy status. J. Agric. Food Chem. 2015, 63, 3654–3659. [Google Scholar] [CrossRef]
- Qiao, M.F.; Xiong, H.; Cai, X.M.; Jiang, Y.Q.; Zhao, X.X.; Miao, B.H. Evaluation of Loquat Jam Quality at Different Cooking Times Based on Physicochemical Parameters, GC-IMS and Intelligent Senses. Foods 2024, 13, 340. [Google Scholar] [CrossRef]
- Zhang, K.Y.; Zhang, C.; Zhuang, H.N.; Liu, Y.; Feng, T.; Nie, B. Characterization of Volatile Component Changes in Peas under Different Treatments by GC-IMS and GC-MS. J. Food Qual. 2021, 2021, 6533083. [Google Scholar] [CrossRef]
- Cristea, R.M.; Sava, C.; Căpățână, C.; Kanellou, A. Phytochemical Analysis and Specific Activities of Bark and Flower Extracts from Four Magnolia Plant Species. Horticulturae 2024, 10, 141. [Google Scholar] [CrossRef]
- Radulović, J.; Lučić, M.; Onjia, A. GC-MS/MS and LC-MS/MS analysis followed by risk ranking of mepiquat and pyrethroids in coffee. J. Food Compos. Anal. 2024, 129, 106100. [Google Scholar] [CrossRef]
- Piergiovanni, M.; Gosetti, F.; Rocío-Bautista, P.; Termopoli, V. Aroma determination in alcoholic beverages: Green MS-based sample preparation approaches. Mass Spectrom. Rev. 2022, 18, 21802. [Google Scholar] [CrossRef]
- Zhou, C.C.; Fan, J.J.; Tan, R.N.; Peng, Q.; Cai, J.H.; Zhang, W.X. Prediction of Linalool Content in Osmanthus fragrans Using E-Nose Technology. J. Sens. 2022, 2022, 7349030. [Google Scholar] [CrossRef]
- Xia, H.L.; Chen, W.; Hu, D.; Miao, A.Q.; Qiao, X.Y.; Qiu, G.J.; Liang, J.H.; Guo, W.Q.; Ma, C.Y. Rapid discrimination of quality grade of black tea based on near-infrared spectroscopy (NIRS), electronic nose (E-nose) and data fusion. Food Chem. 2023, 440, 138242. [Google Scholar] [CrossRef] [PubMed]
- Chi, X.L.; Zhang, Y.D.; Zheng, N.; Wang, J.Q.; Liu, H.M. HS-GC-IMS and HS-SPME/GC-MS coupled with E-nose and E-tongue reveal the flavors of raw milk from different regions of China. Curr. Res. Food Sci. 2024, 8, 100673. [Google Scholar] [CrossRef]
- Zhao, X.; Feng, J.Y.; Luca, L.; Deng, J.; Dao, X.F.; Tang, J.N.; Ji, L.L.; Zhu, C.L.; Gianfranco, P. Characterization of Flavor Profile of “Nanx Wudl” Sour Meat Fermented from Goose and Pork Using Gas Chromatography-Ion Mobility Spectrometry (GC-IMS) Combined with Electronic Nose and Tongue. Foods 2023, 12, 2194. [Google Scholar] [CrossRef]
- Nadia, H.; Abdelhamid, N.; Ayoub, M.; Mustapha, E.A.E.; Safa, M.; Mohammed, M.; Abderrahim, J.; Mostafa, M. Effect of Preservation Methods on Physicochemical Quality, Phenolic Content, and Antioxidant Activity of Stevia Leaves. J. Food Qual. 2021, 2021, 5378157. [Google Scholar]
- Zhong, N.; Zhao, X.; Yu, P.H.; Huang, H.; Bao, X.C.; Li, J.; Zheng, H.F.; Xiao, L.Z. Characterization of the Sensory Properties and Quality Components of Huangjin Green Tea Based on Molecular Sensory-Omics. Foods 2023, 12, 3234. [Google Scholar] [CrossRef] [PubMed]
- Zheng, W.; Zhang, X.Z.; Deng, X.F.; Ma, J.W.; Lu, Z.M. Optimization of color protection formula of loquat puree and quality change during storage. Food Ind. Technol. 2023, 1–14, 100886. [Google Scholar]
- Giuseppe, N.; Graziana, D.; Maria, C.; Giuseppe, C.; Francesco, C.; Michele, F. Evolution of VOC and Sensory Characteristics of Stracciatella Cheese as Affected by Different Preservatives. Foods 2020, 9, 1446. [Google Scholar] [CrossRef] [PubMed]
- Arunachalam, V.; Salgaonkar, D.C.; Vasantlal, K.N.; Vinod, W.B.; Bappa, D. Quantification of betacyanin content variation of amaranth varieties by an Android App, colorimeter, and infrared spectroscopy. Chin. J. Anal. Chem. 2022, 50, 100145. [Google Scholar] [CrossRef]
- Onyekachi, I.A.; Obiora, N.V.I.; Joshua, S.K. Influence of drying process variables on the effective moisture diffusivity and activation energy of African oil bean seed. Sci. Afr. 2023, 22, 01895. [Google Scholar]
- Mahsa, H.; Sedigheh, Y. The Effects of Gum Cordia on the Physicochemical, Textural, Rheological, Microstructural, and Sensorial Properties of Apple Jelly. J. Food Qual. 2020, 2020, 8818960. [Google Scholar]
- Li, J.; Ma, J.M.; Fan, S.F.; Mi, S.Q.; Zhang, Y. Comparison of the Nutritional and Taste Characteristics of 5 Edible Fungus Powders Based on the Composition of Hydrolyzed Amino Acids and Free Amino Acids. J. Food Qual. 2022, 2022, 3618002. [Google Scholar] [CrossRef]
- Yang, F.F.; Wang, Q.J.; Liu, W.Y.; Xiao, H.W.; Hu, J.Q.; Duan, X.J.; Sun, X.Y.; Liu, C.J.; Wang, H.O. Changes and correlation analysis of volatile flavor compounds, amino acids, and soluble sugars in durian during different drying processes. Food Chem. X 2024, 21, 101238. [Google Scholar] [CrossRef]
- Cecchi, L.; Ieri, F.; Vignolini, P.; Mulinacci, N.; Romani, A. Characterization of Volatile and Flavonoid Composition of Different Cuts of Dried Onion (Allium cepa L.) by HS-SPME-GC-MS, HS-SPME-GC×GC-TOF and HPLC-DAD. Molecules 2020, 25, 408. [Google Scholar] [CrossRef]
- Yan, J.; He, L.Z.; Huang, Z.W.; Wang, H.; Yu, L.; Zhu, W.M. Investigating the Impact of Origins on the Quality Characteristics of Celery Seeds Based on Metabolite Analysis through HS-GC-IMS, HS-SPME-GC-MS and UPLC-ESI-MS/MS. Foods 2024, 13, 1428. [Google Scholar] [CrossRef]
- Li, L.Q.; Dong, S.; Cao, S.; Chen, Y.R.; Shen, J.F.; Li, M.H.; Cui, Q.Q.; Zhang, Y.; Huang, C.X.; Dai, Q.Y.; et al. E-nose and colorimetric sensor array combining homologous data fusion strategy discriminating the roasting degree of large-leaf yellow tea. Food Chem. X 2024, 21, 101124. [Google Scholar] [CrossRef]
- Xiao, Z.B.; Niu, M.X.; Niu, Y.W. Comparative Study on Volatile Compounds and Taste Components of Different Durian Cultivars Based on GC-MS, UHPLC, HPAEC-PAD, E-Tongue and E-Nose. Molecules 2022, 27, 1264. [Google Scholar] [CrossRef]
- Peng, Q.; Li, S.S.; Zheng, H.J.; Meng, K.; Jiang, X.; Shen, R.; Xue, J.R.; Xie, G.F. Characterization of different grades of Jiuqu hongmei tea based on flavor profiles using HS-SPME-GC-MS combined with E-nose and E-tongue. Food Res. Int. 2023, 172, 113198. [Google Scholar] [CrossRef]
- Agroambiental, A.E.; Orihuela, E.P.S.; Elche, U.M.H.; Beniel, C. Hydroxycinnamic Acids and Carotenoids of Dried Loquat Fruit cv. ‘Algar’ Affected by Freeze-, Convective-, Vacuum-Microwave- and Combined-Drying Methods. Molecules 2020, 25, 3643. [Google Scholar] [CrossRef]
- Zhou, D.T.; Yang, G.J.; Tian, Y.Q.; Kang, J.Y.; Wang, S.J. Different effects of radio frequency and heat block treatments on multi-scale structure and pasting properties of maize, potato, and pea starches. Food Hydrocoll. 2023, 136, 108306. [Google Scholar] [CrossRef]
- Liu, L.; Zhang, Y.C.; Jiang, F.Q.; He, Q.W.; Lin, B.F. A co-type ductile film with high tensile strength and fast self-healing properties for shaped fruit preservation. J. Mater. Chem. B 2024, 12, 3262–3272. [Google Scholar] [CrossRef]
- Mohammad, S.; Mahmood, E.A.; Hassan, T.T. Impacts of salicylic acid, chitosan, and salicyloyl chitosan on quality preservation and microbial load reduction in strawberry fruits during cold storage. J. Food Process. Preserv. 2022, 46, 16710. [Google Scholar]
- Athoo, T.O.; Yegon, D.; Owino, W.O.; Knoche, M. Bagging prevents russeting and decreases postharvest water loss of mango fruit cv. ‘Apple’. Postharvest Biol. Technol. 2024, 211, 112804. [Google Scholar] [CrossRef]
- Du, L.N.; Kou, L.L.; Liu, D.D.; Hu, W.J.; Yu, Y.L.; Luo, G.J.; Lai, B.; Cai, J.H. Integrated analysis of nutritional quality changes and molecular regulation in ‘Qingcui’ plum fruit treated with 1-MCP during storage. Postharvest Biol. Technol. 2024, 207, 112591. [Google Scholar] [CrossRef]
- Li, Y.; Zhao, H.; Xiang, K.X.; Li, D.J.; Liu, C.J.; Wang, H.O.; Pang, W.Q.; Niu, L.Y.; Yu, R.; Sun, X.Y. Factors affecting chemical and textural properties of dried tuber, fruit and vegetable. J. Food Eng. 2024, 365, 111828. [Google Scholar] [CrossRef]
- Song, J.X.; Bi, J.F.; Chen, Q.Q.; Wu, X.Y.; Lyu, Y.; Meng, X.J. Assessment of sugar content, fatty acids, free amino acids, and volatile profiles in jujube fruits at different ripening stages. Food Chem. 2019, 270, 344–352. [Google Scholar] [CrossRef] [PubMed]
- Zhu, W.Z.; Wang, Q.Y.; Xu, Y.; Hui, Z.Y.; Liu, J.; Zhou, X.Y. Effects of fat-to-lean ratio and cooking time on the water distribution, nutritional quality and fatty acid composition of traditional Chinese pork meatballs. Int. J. Food Prop. 2023, 26, 139–154. [Google Scholar] [CrossRef]
- Marrufo-Hernández, N.A.; Nájera, H.; Chávez, F.G.; Beltrán, H.I. Polyphenol oxidase inactivation from apple juice by Al-based metal–organic frameworks: New anti-browning strategy in fruits and vegetables. Food Chem. 2024, 439, 138178. [Google Scholar] [CrossRef] [PubMed]
- Flavio, R.T.; Vanderlei, B.; Fabio, R.T.; Auri, B.; Erani, E.S.; Magno, R.P.B.; Francis, J.S.; Lucas, M.W.; Airton, F.; Roger, W.; et al. Interaction of oxygen and moisture content on ‘Barton’ and ‘Jackson’ pecan storage. Postharvest Biol. Technol. 2021, 179, 111584. [Google Scholar]
- Huang, J.F.; Yan, T.Y.; Yang, J.F.; Xu, H. Aroma Components Analysis and Origin Differentiation of Black Tea Based on ATD-GC-MS and E-Nose. Horticulturae 2023, 9, 885. [Google Scholar] [CrossRef]
- Mabuchi, R.; Ishimaru, A.; Tanaka, M.; Kawaguchi, O.; Tanimoto, S. Metabolic Profiling of Fish Meat by GC-MS Analysis, and Correlations with Taste Attributes Obtained Using an Electronic Tongue. Metabolites 2018, 9, 1. [Google Scholar] [CrossRef] [PubMed]
- Liu, M.J.; Yang, Y.; Zhao, X.B.; Wang, Y.; Li, M.Y.; Wang, Y.; Tian, M.; Zhou, J. Classification and characterization on sorghums based on HS-GC-IMS combined with OPLS-DA and GA-PLS. Curr. Res. Food Sci. 2024, 8, 100692. [Google Scholar] [CrossRef] [PubMed]
- Ruojin, L.; Yaran, L.; Yuxuan, Z.; Maaria, K.; Baoqing, Z.; Hehe, L. Aromatic Characteristics of Passion Fruit Wines Measured by E-Nose, GC-Quadrupole MS, GC-Orbitrap-MS and Sensory Evaluation. Foods 2022, 11, 3789. [Google Scholar] [CrossRef]
- Yuan, N.; Chi, X.L.; Ye, Q.Y.; Liu, H.M.; Zheng, N. Analysis of Volatile Organic Compounds in Milk during Heat Treatment Based on E-Nose, E-Tongue and HS-SPME-GC-MS. Foods 2023, 12, 1071. [Google Scholar] [CrossRef]
Disclaimer/Publisher’s Note: The statements, opinions and data contained in all publications are solely those of the individual author(s) and contributor(s) and not of MDPI and/or the editor(s). MDPI and/or the editor(s) disclaim responsibility for any injury to people or property resulting from any ideas, methods, instructions or products referred to in the content. |
© 2024 by the authors. Licensee MDPI, Basel, Switzerland. This article is an open access article distributed under the terms and conditions of the Creative Commons Attribution (CC BY) license (https://creativecommons.org/licenses/by/4.0/).