
Experiment on the Uniformity of Internal Lighting in Zigzag Photovoltaic Greenhouses by Grating Plates


Abstract
1. Introduction
2. Materials
2.1. Zigzag PV Greenhouse
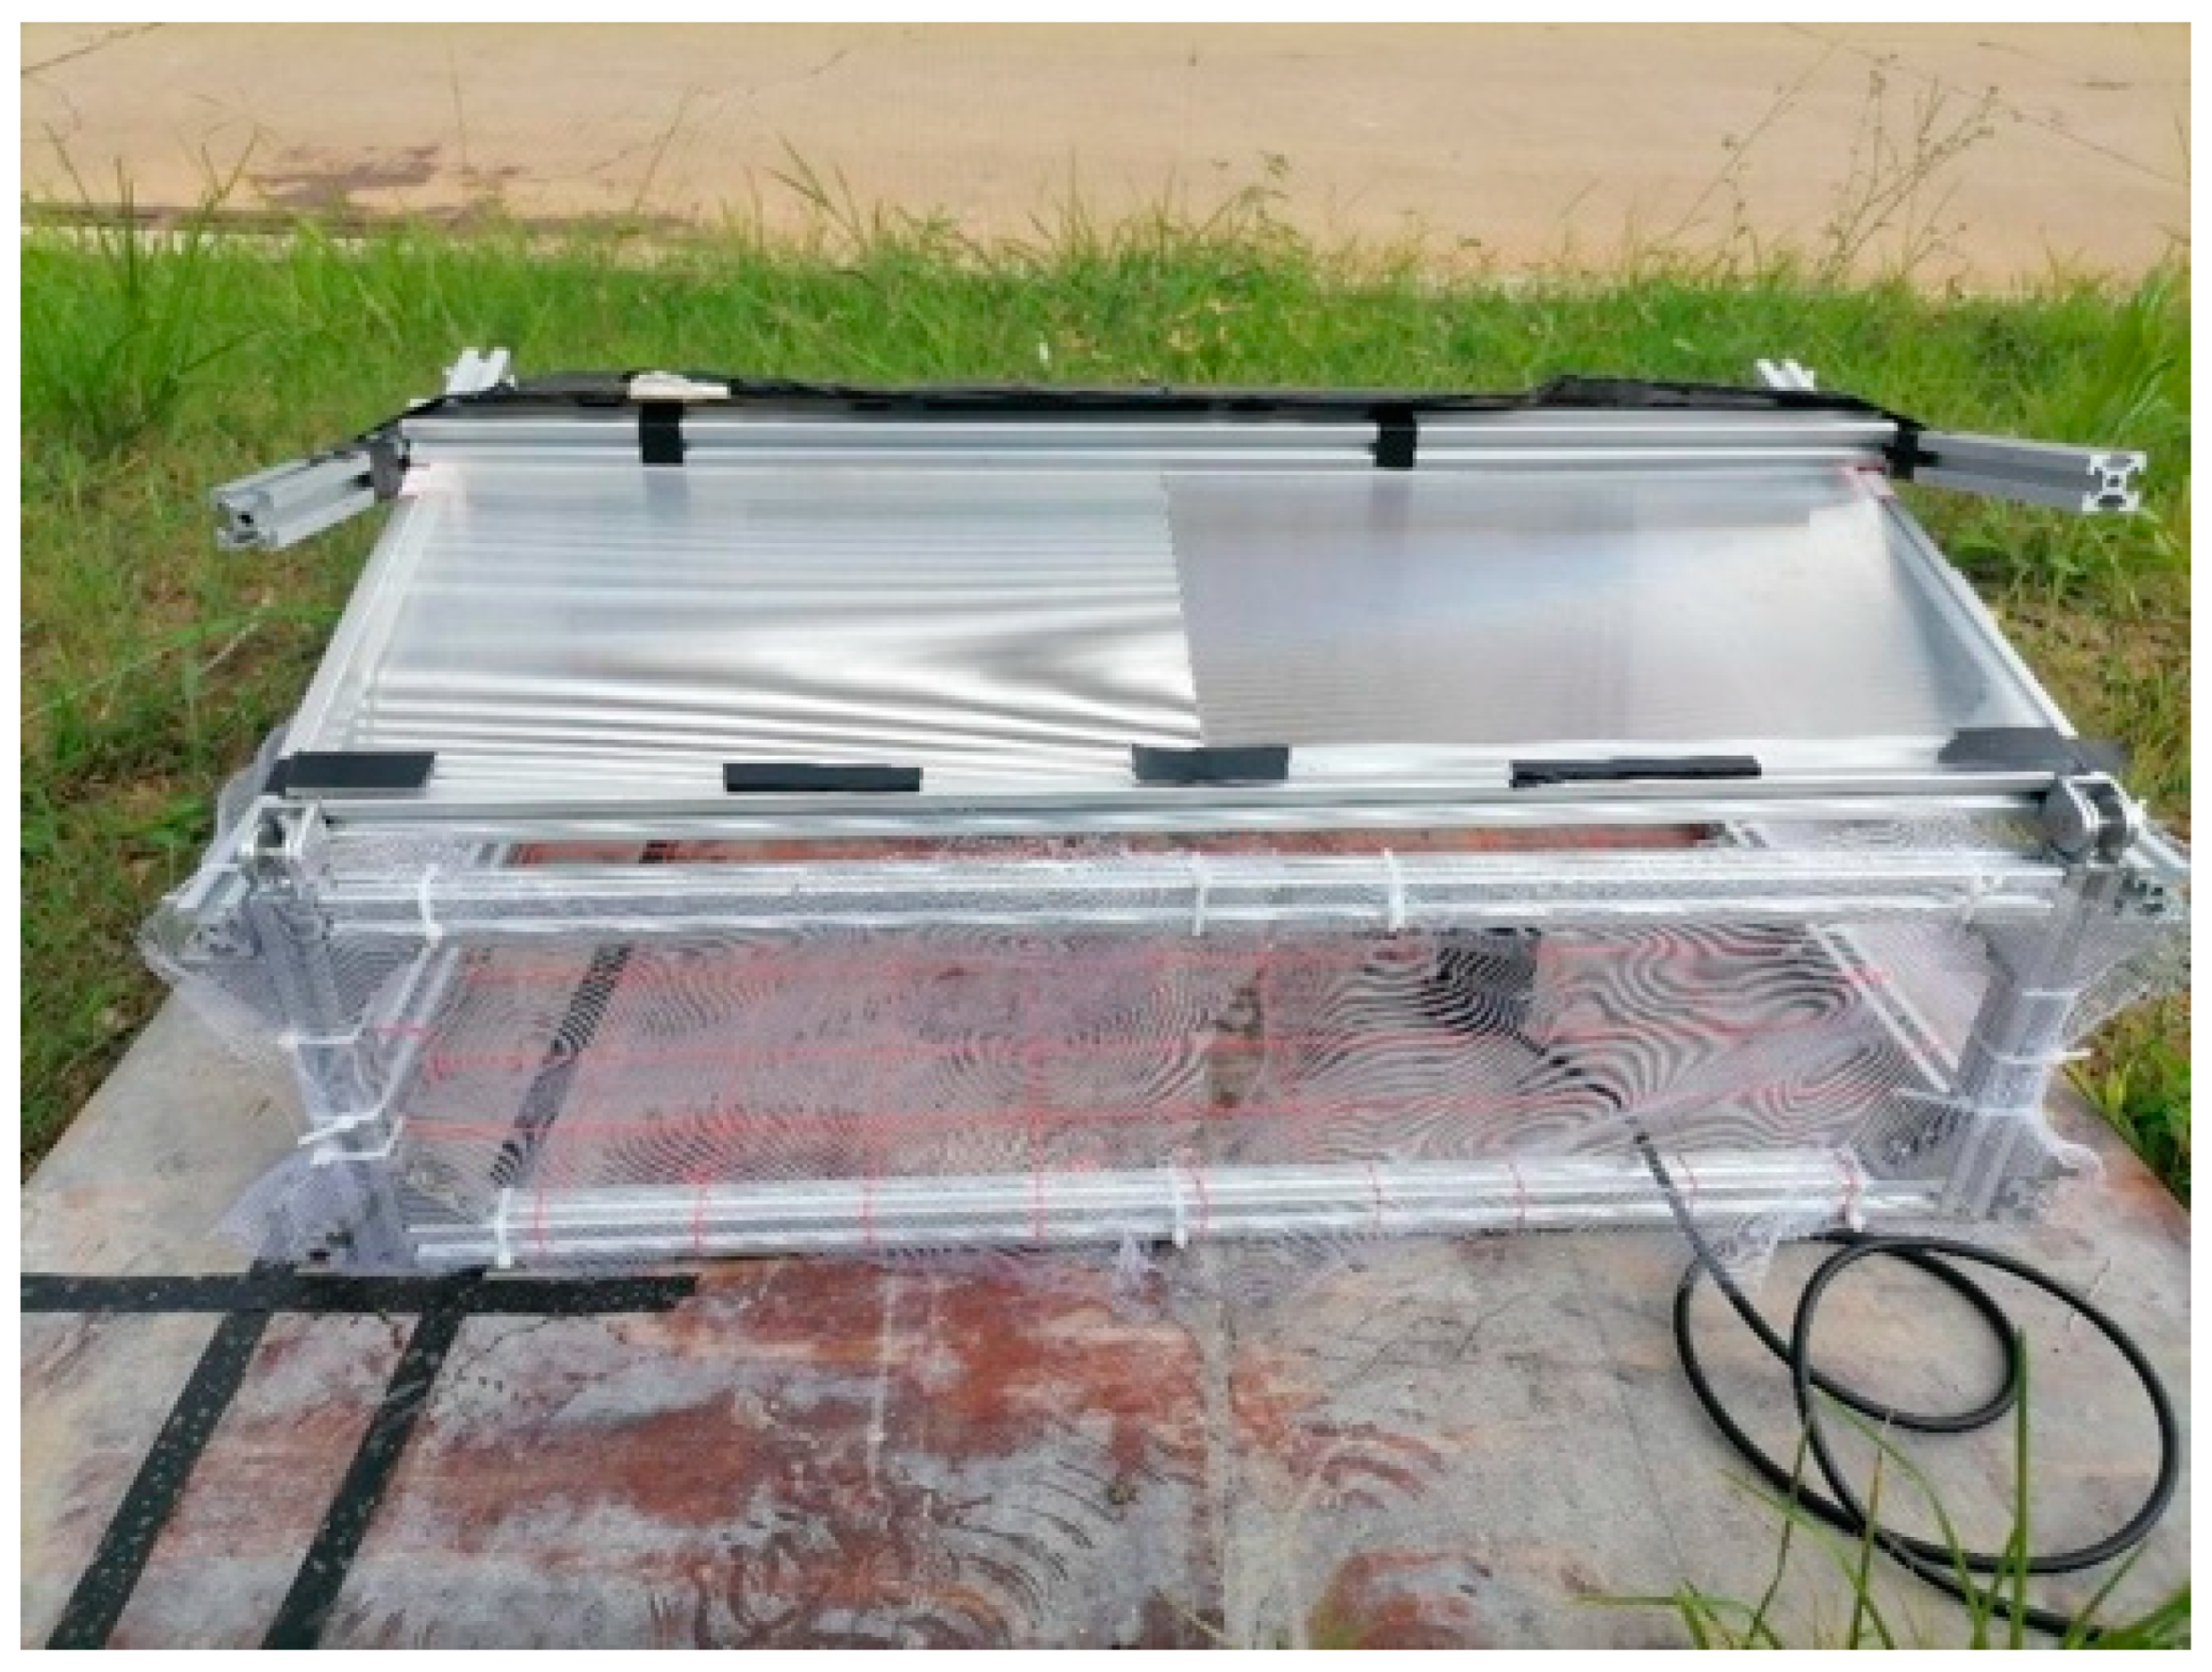
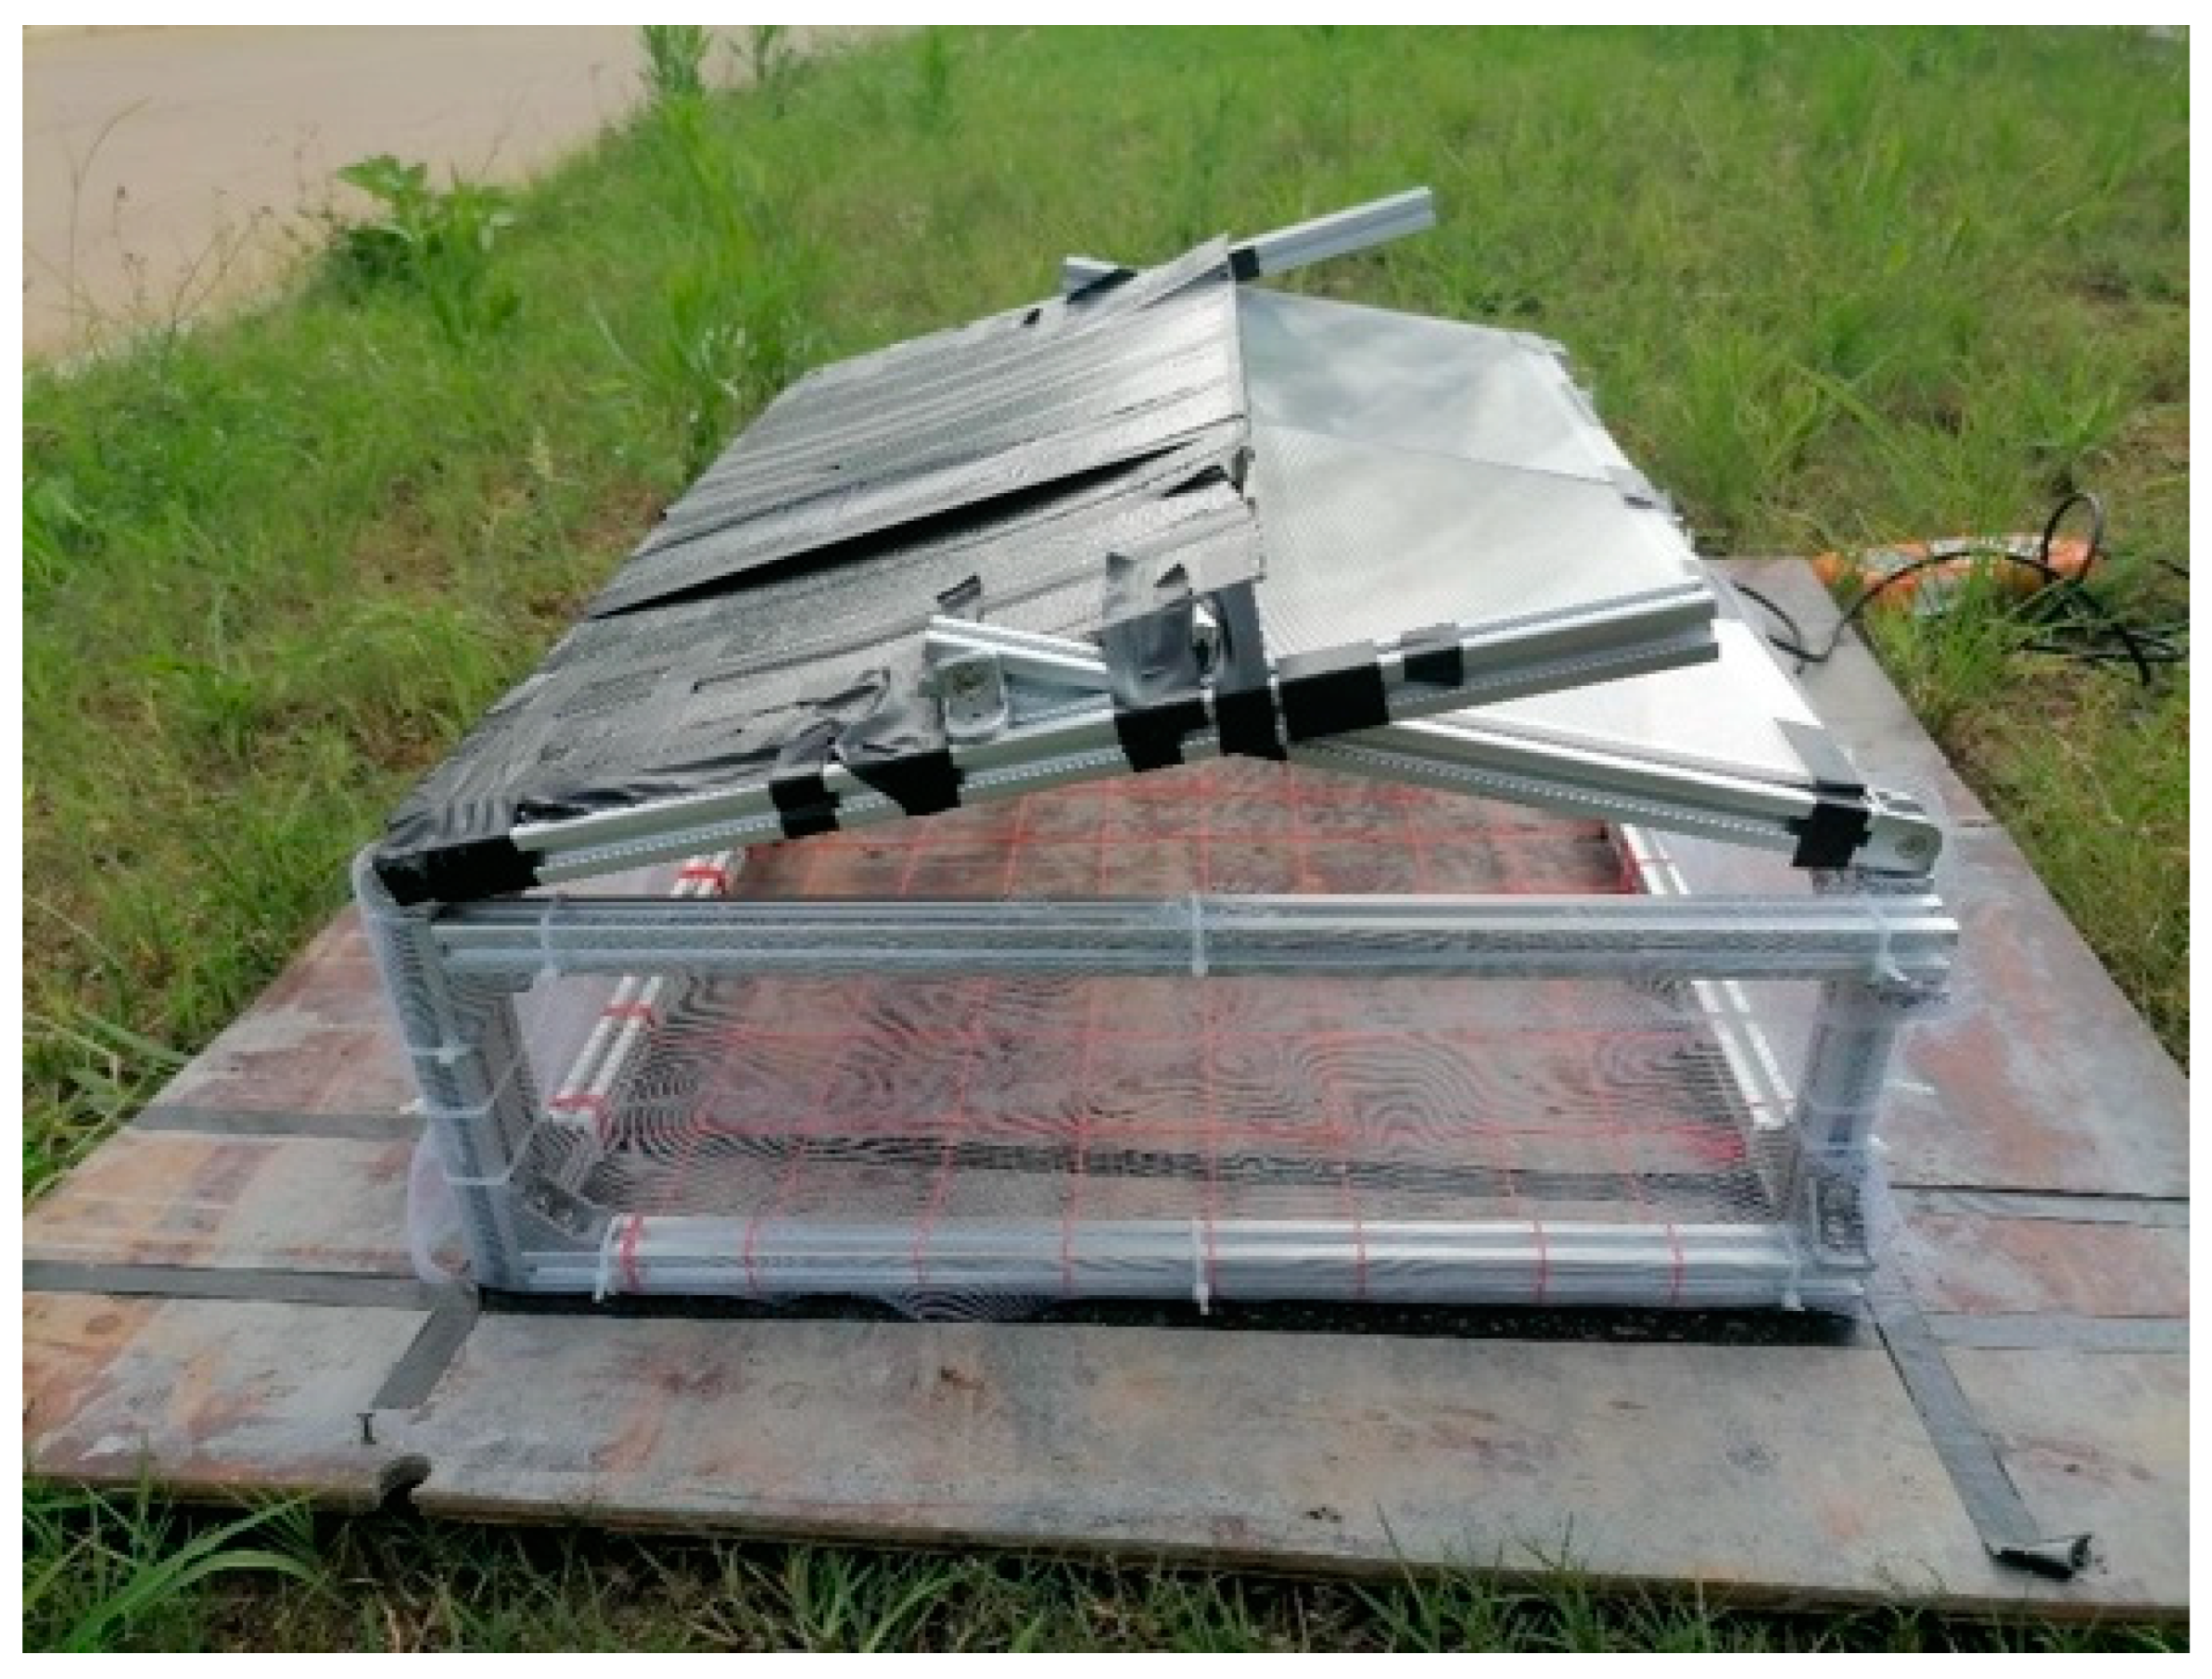
2.2. Zigzag PV Greenhouse Model
3. Experimental Design and Field Management
3.1. Selection of Test Measurement Sites
3.2. Experimental Time
3.3. Experimental Process
4. Results
4.1. Light Distribution Characteristics of the Corresponding Area of the Light-Transmitting Material in the Greenhouse
4.1.1. Characteristics of Light Distribution in the North–South Direction of the Greenhouse
4.1.2. North–South Light Distribution in the Greenhouse
4.2. Data Processing and Analysis
4.3. Light Uniformity in the Greenhouse
Light Uniformity and Variation Coefficient
5. Discussion
- The use of a grating plate as the light transmitting module can improve the light uniformity of the light and dark zone junction area in the low light area caused by the shading of PV modules in the zigzag PV greenhouse. However, the light transmittance of the grating plate is lower than that of the translucent glass, and the light entering through the translucent roof will be reduced, causing a low utilization rate of sunlight and lower light intensity under the grating plate in the greenhouse compared with ordinary translucent glass. From the perspective of light distribution characteristics, the grating plate has a high scattering feature to refract the light to an area larger than its own size, which improves the light intensity of some dark band areas, and the increased intensity would decrease with distance. Therefore, grating plates are a good way to deal with the need to block a part of the light and increase the light intensity near the band area. At the same time, it provides ideas for improving the light environment in the greenhouse by using the optical path of light transmitting materials to light.
- In addition to this experiment, the greenhouse model that can change the inclination angle of the roof can also be used to determine the lighting environment in the greenhouse under different roof coverage rates. Since the model greenhouse is based on the size of the actual greenhouse and is scaled down, the light intensity in the room is affected by the skeleton. At the same time, due to the volume of the measuring instrument, the existing model fails to measure the light intensity in the greenhouse from different heights. The model of the measuring instrument illuminometer is TES-1330A.
6. Conclusions
- (1)
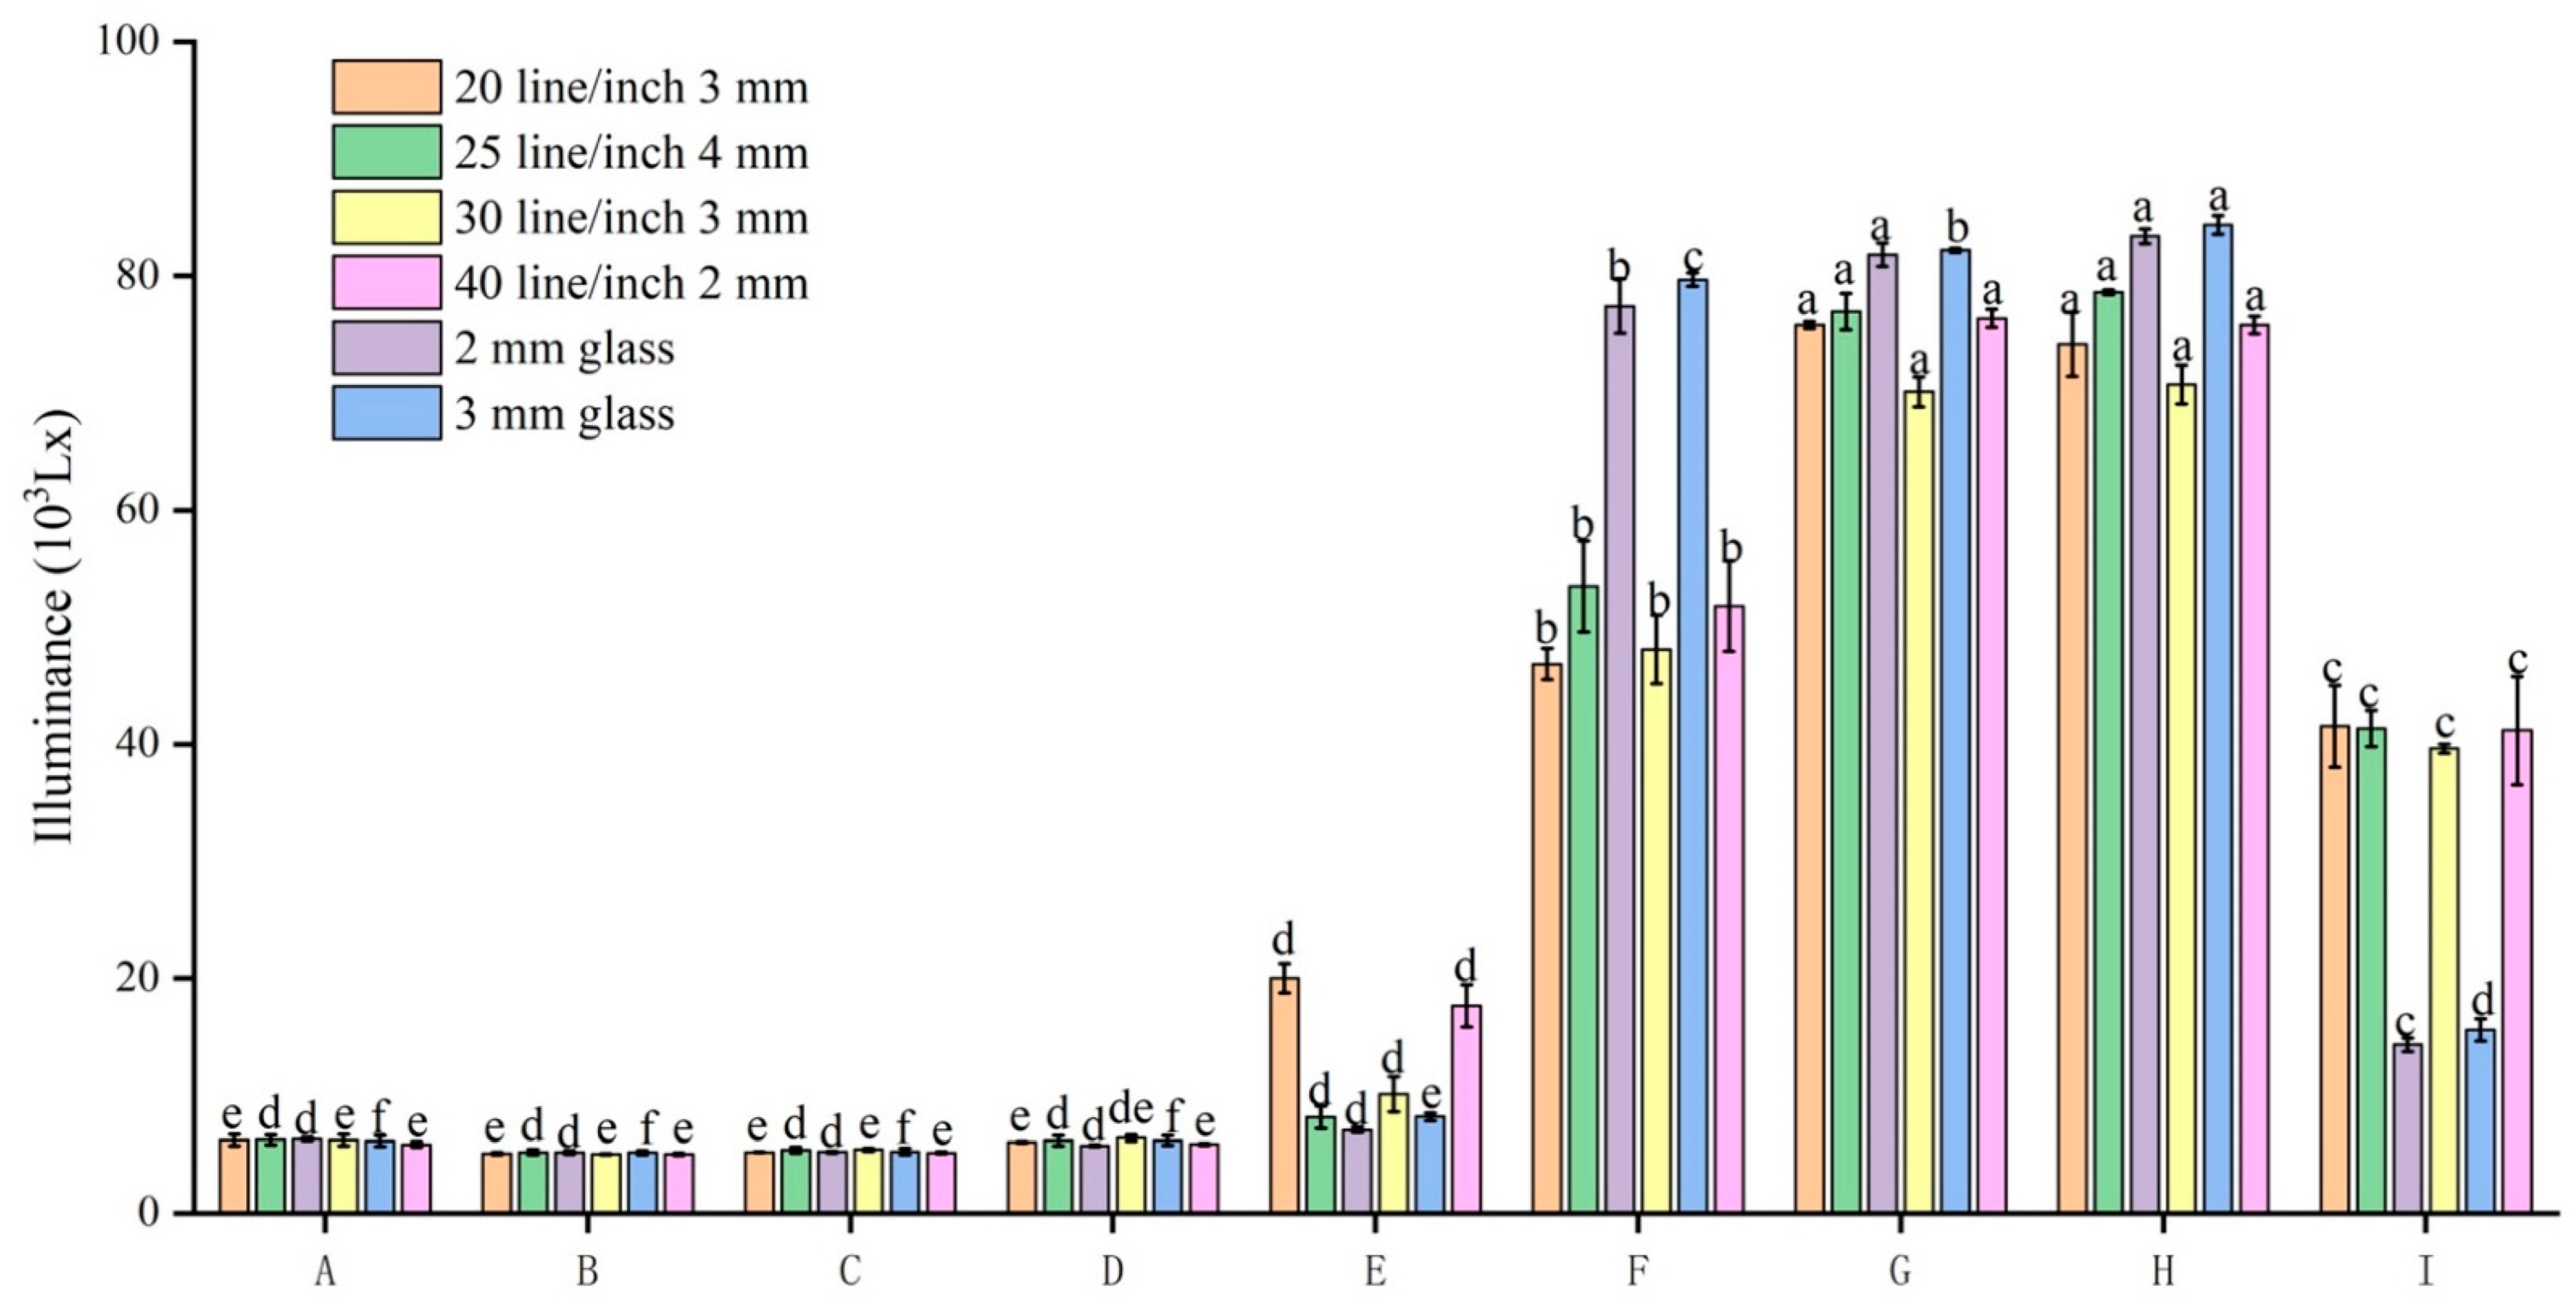
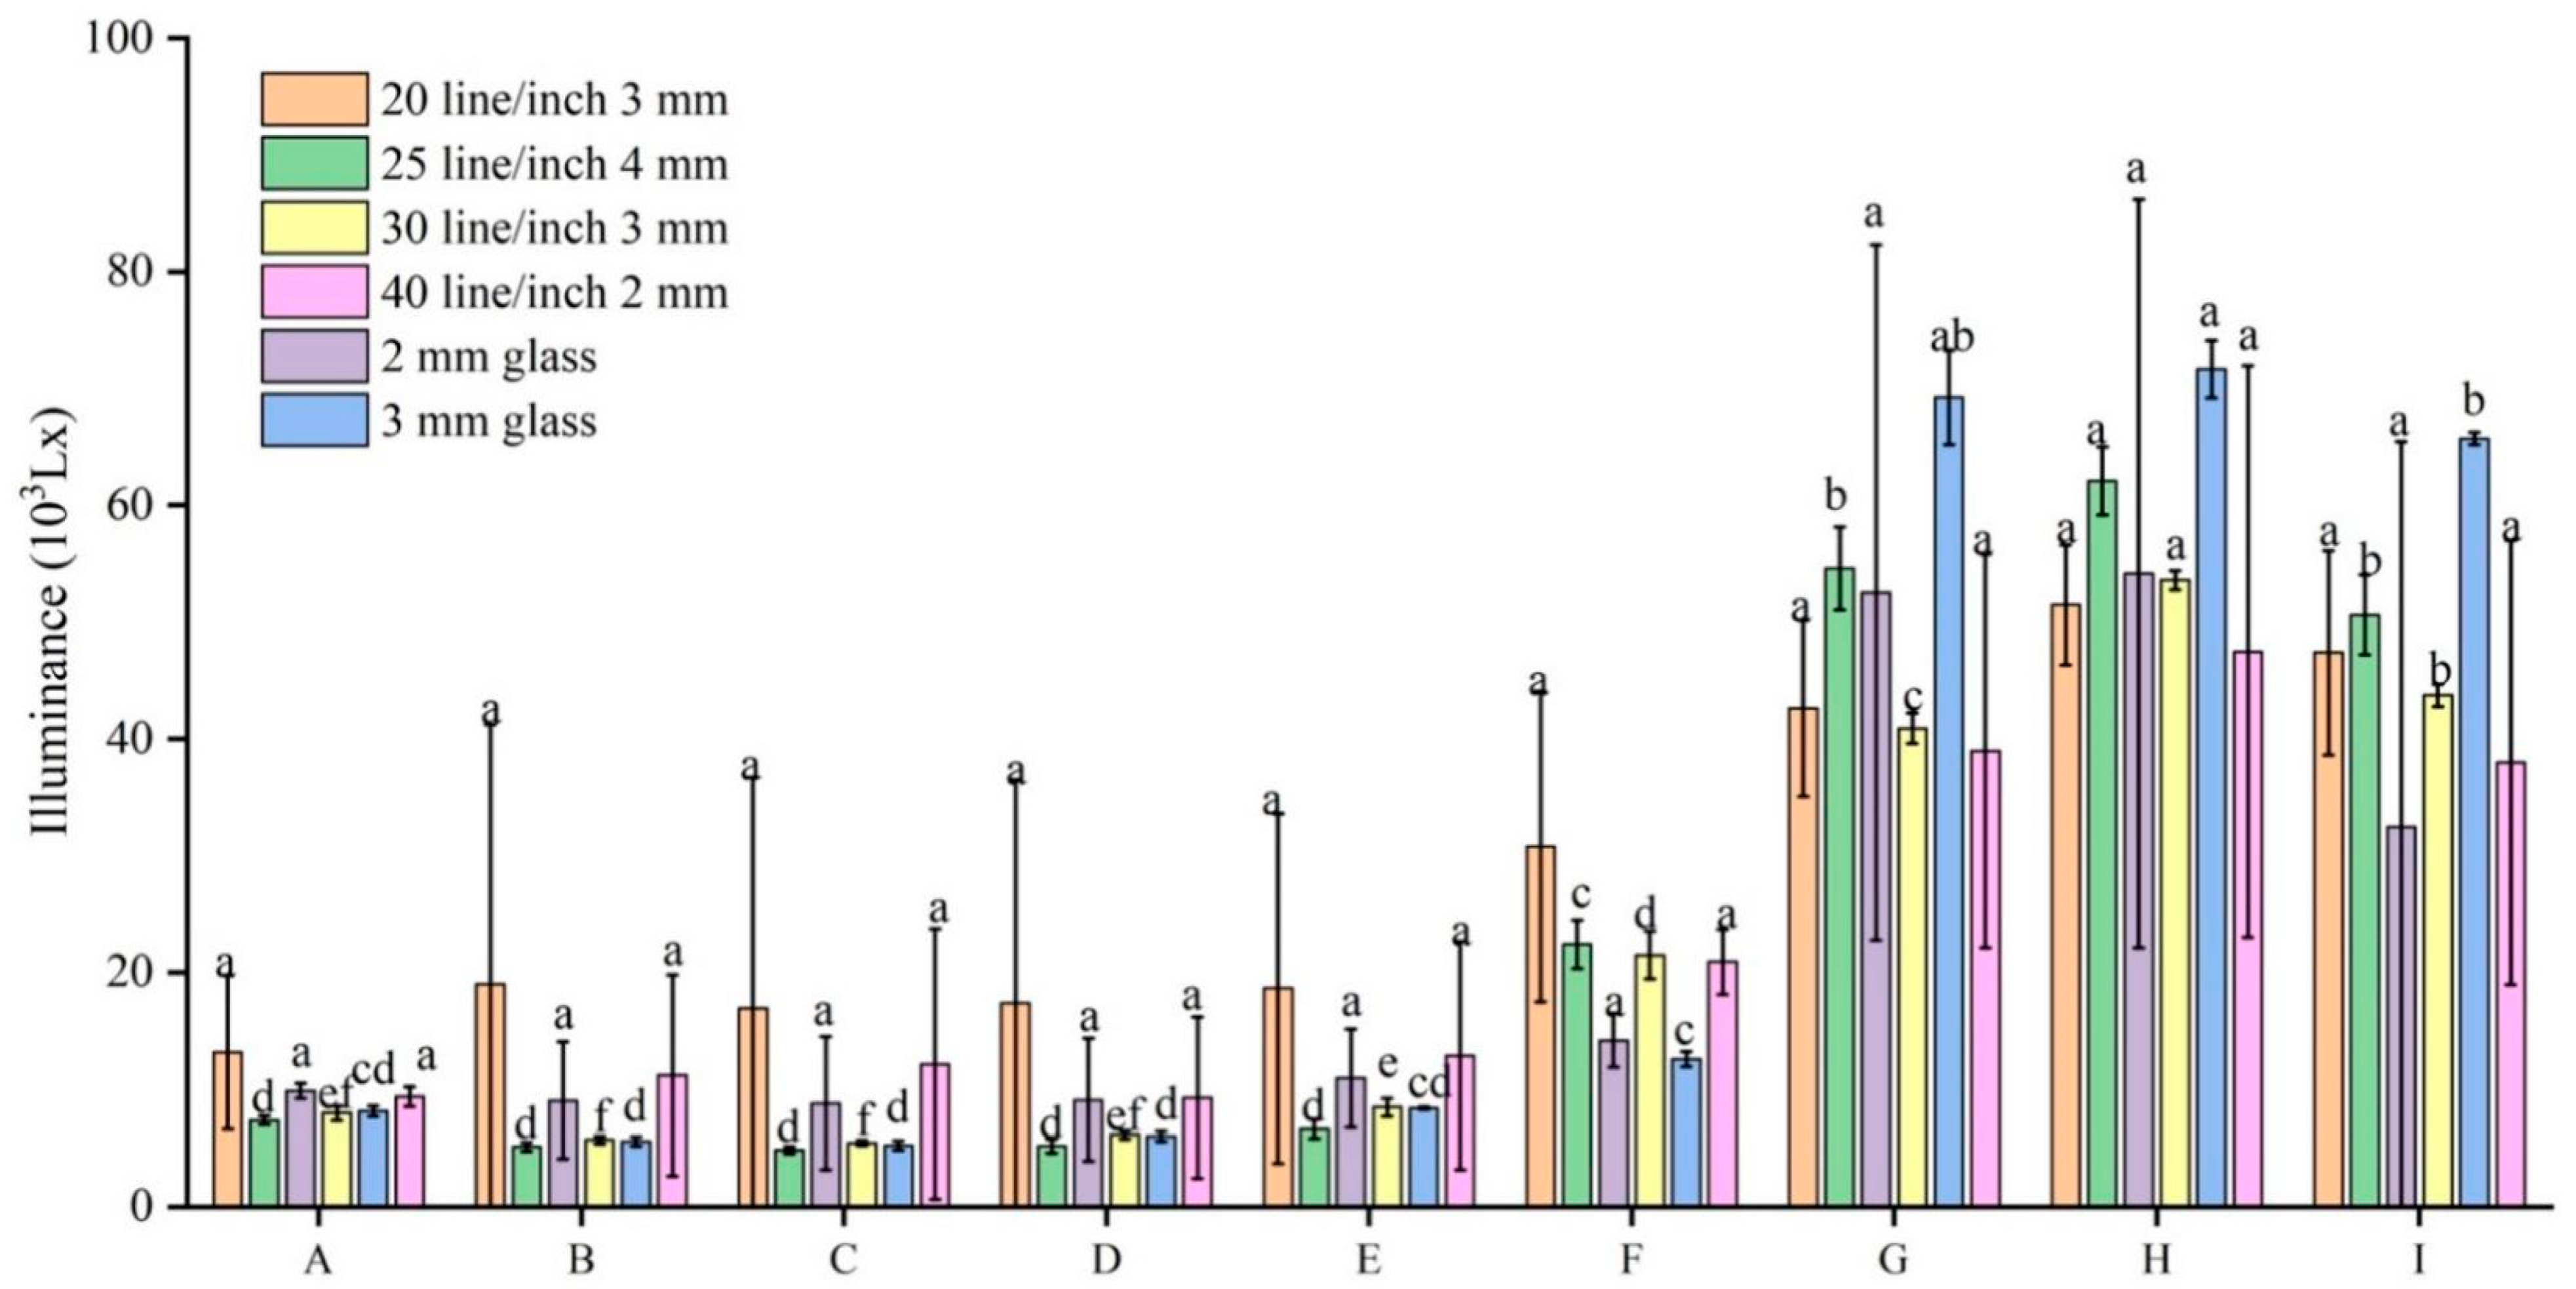
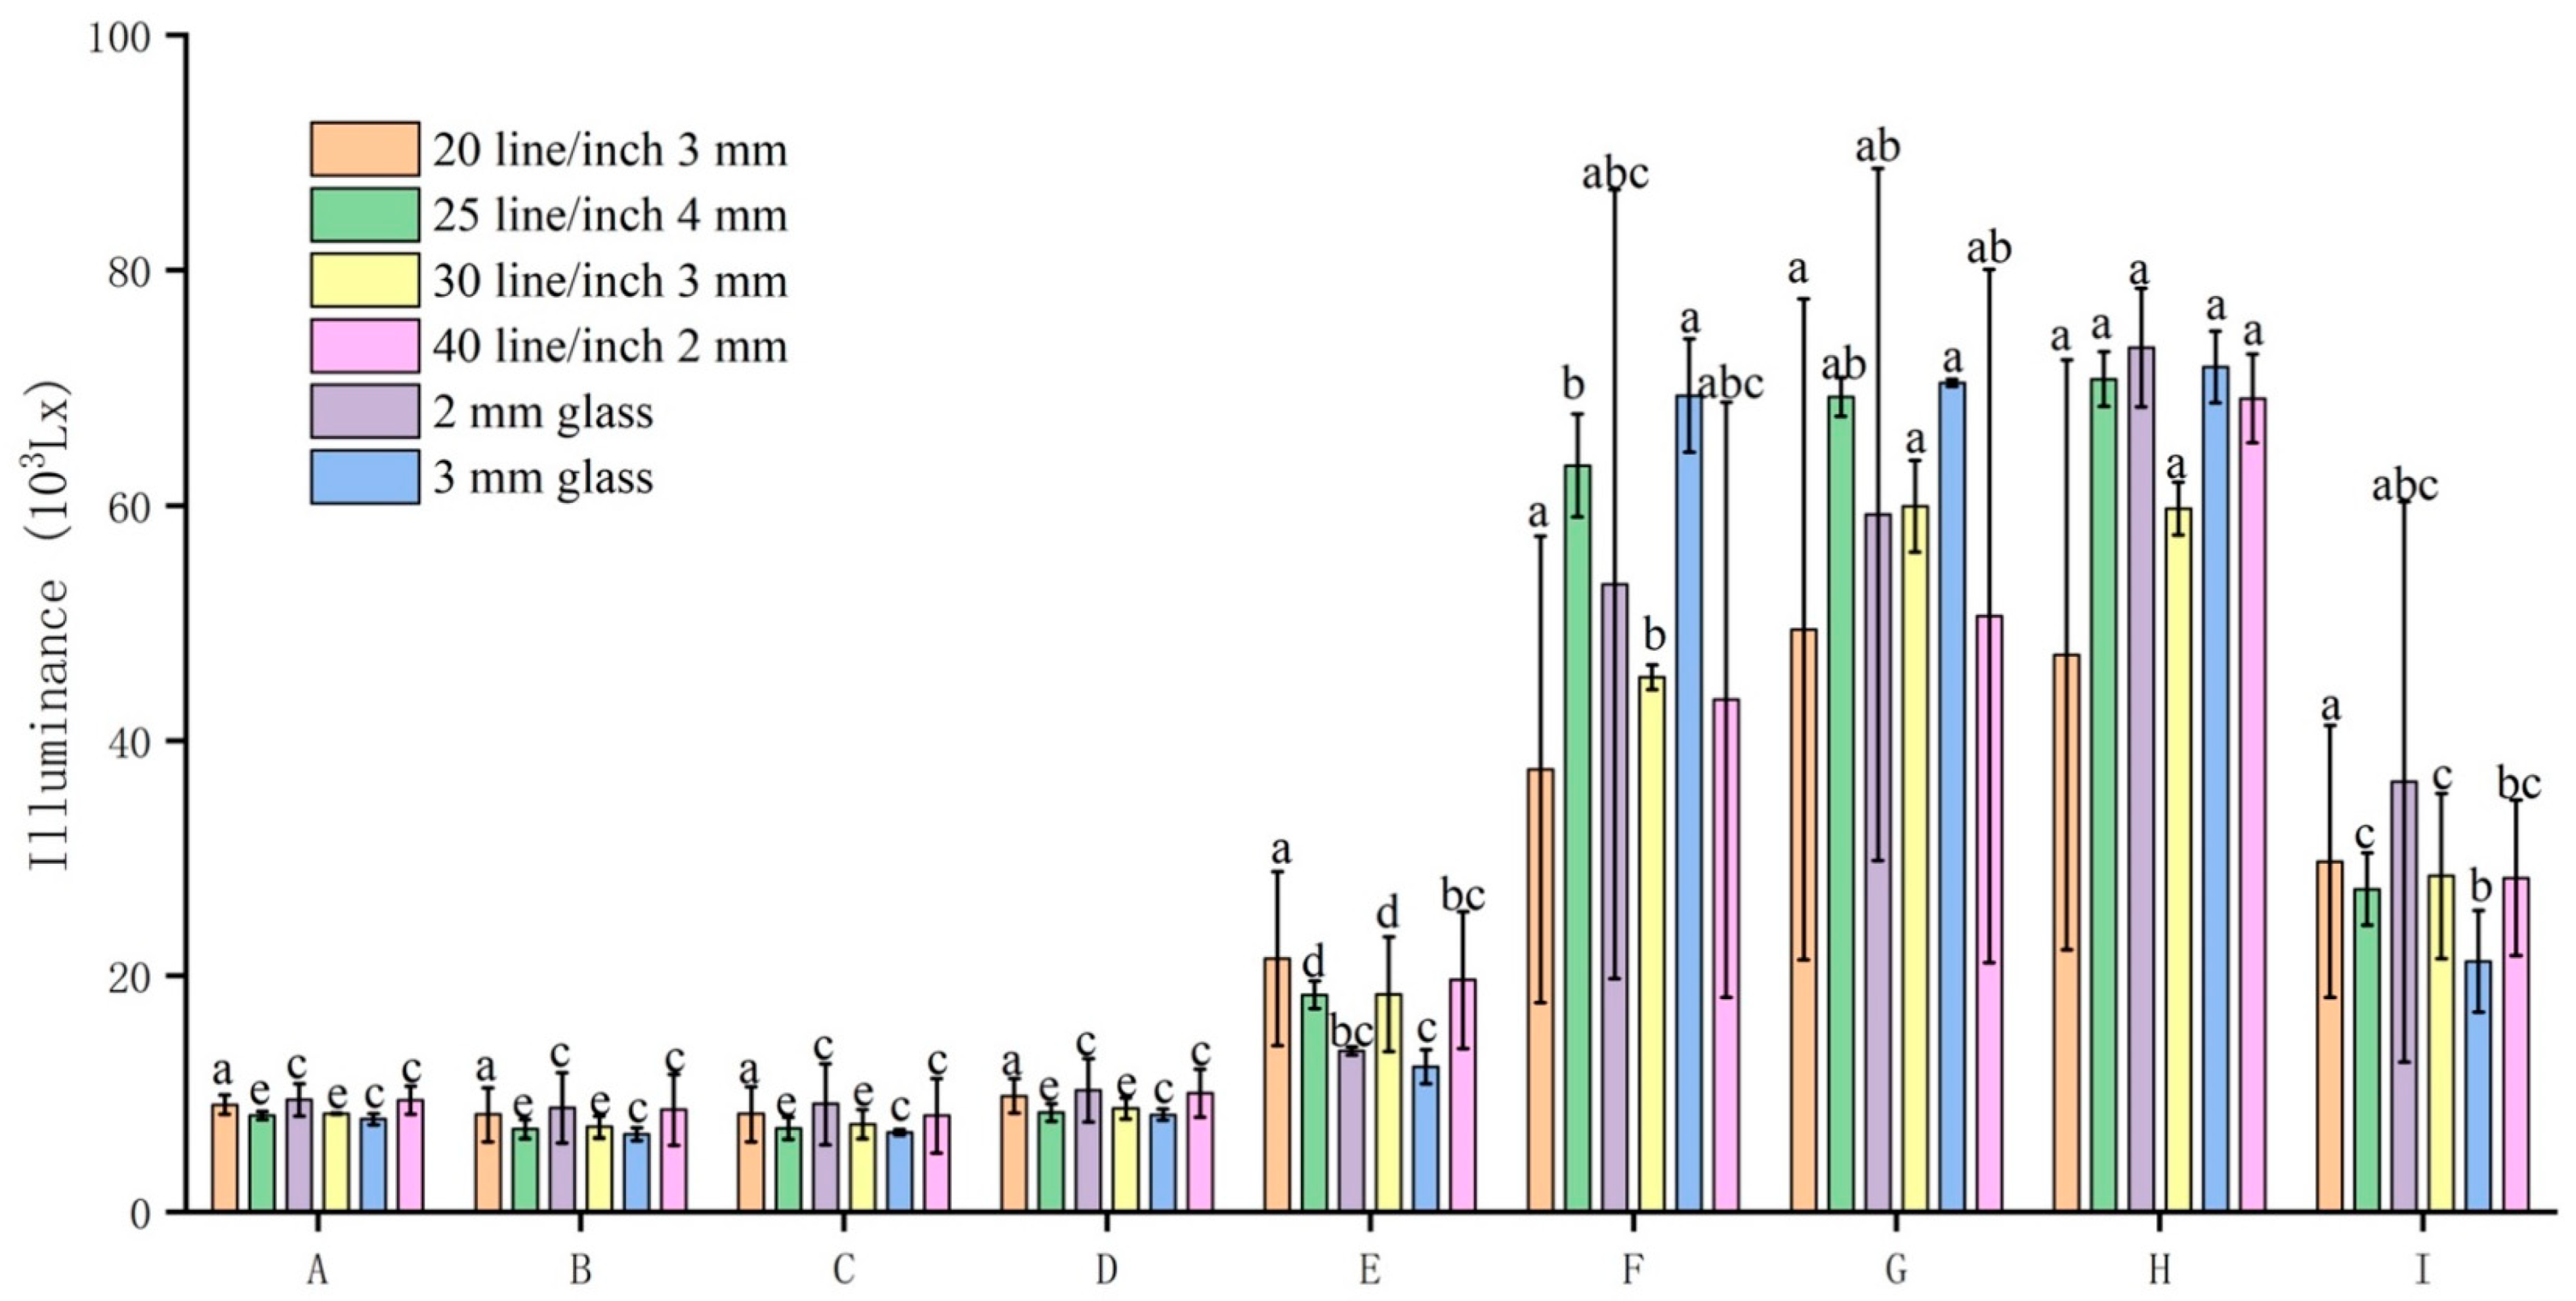
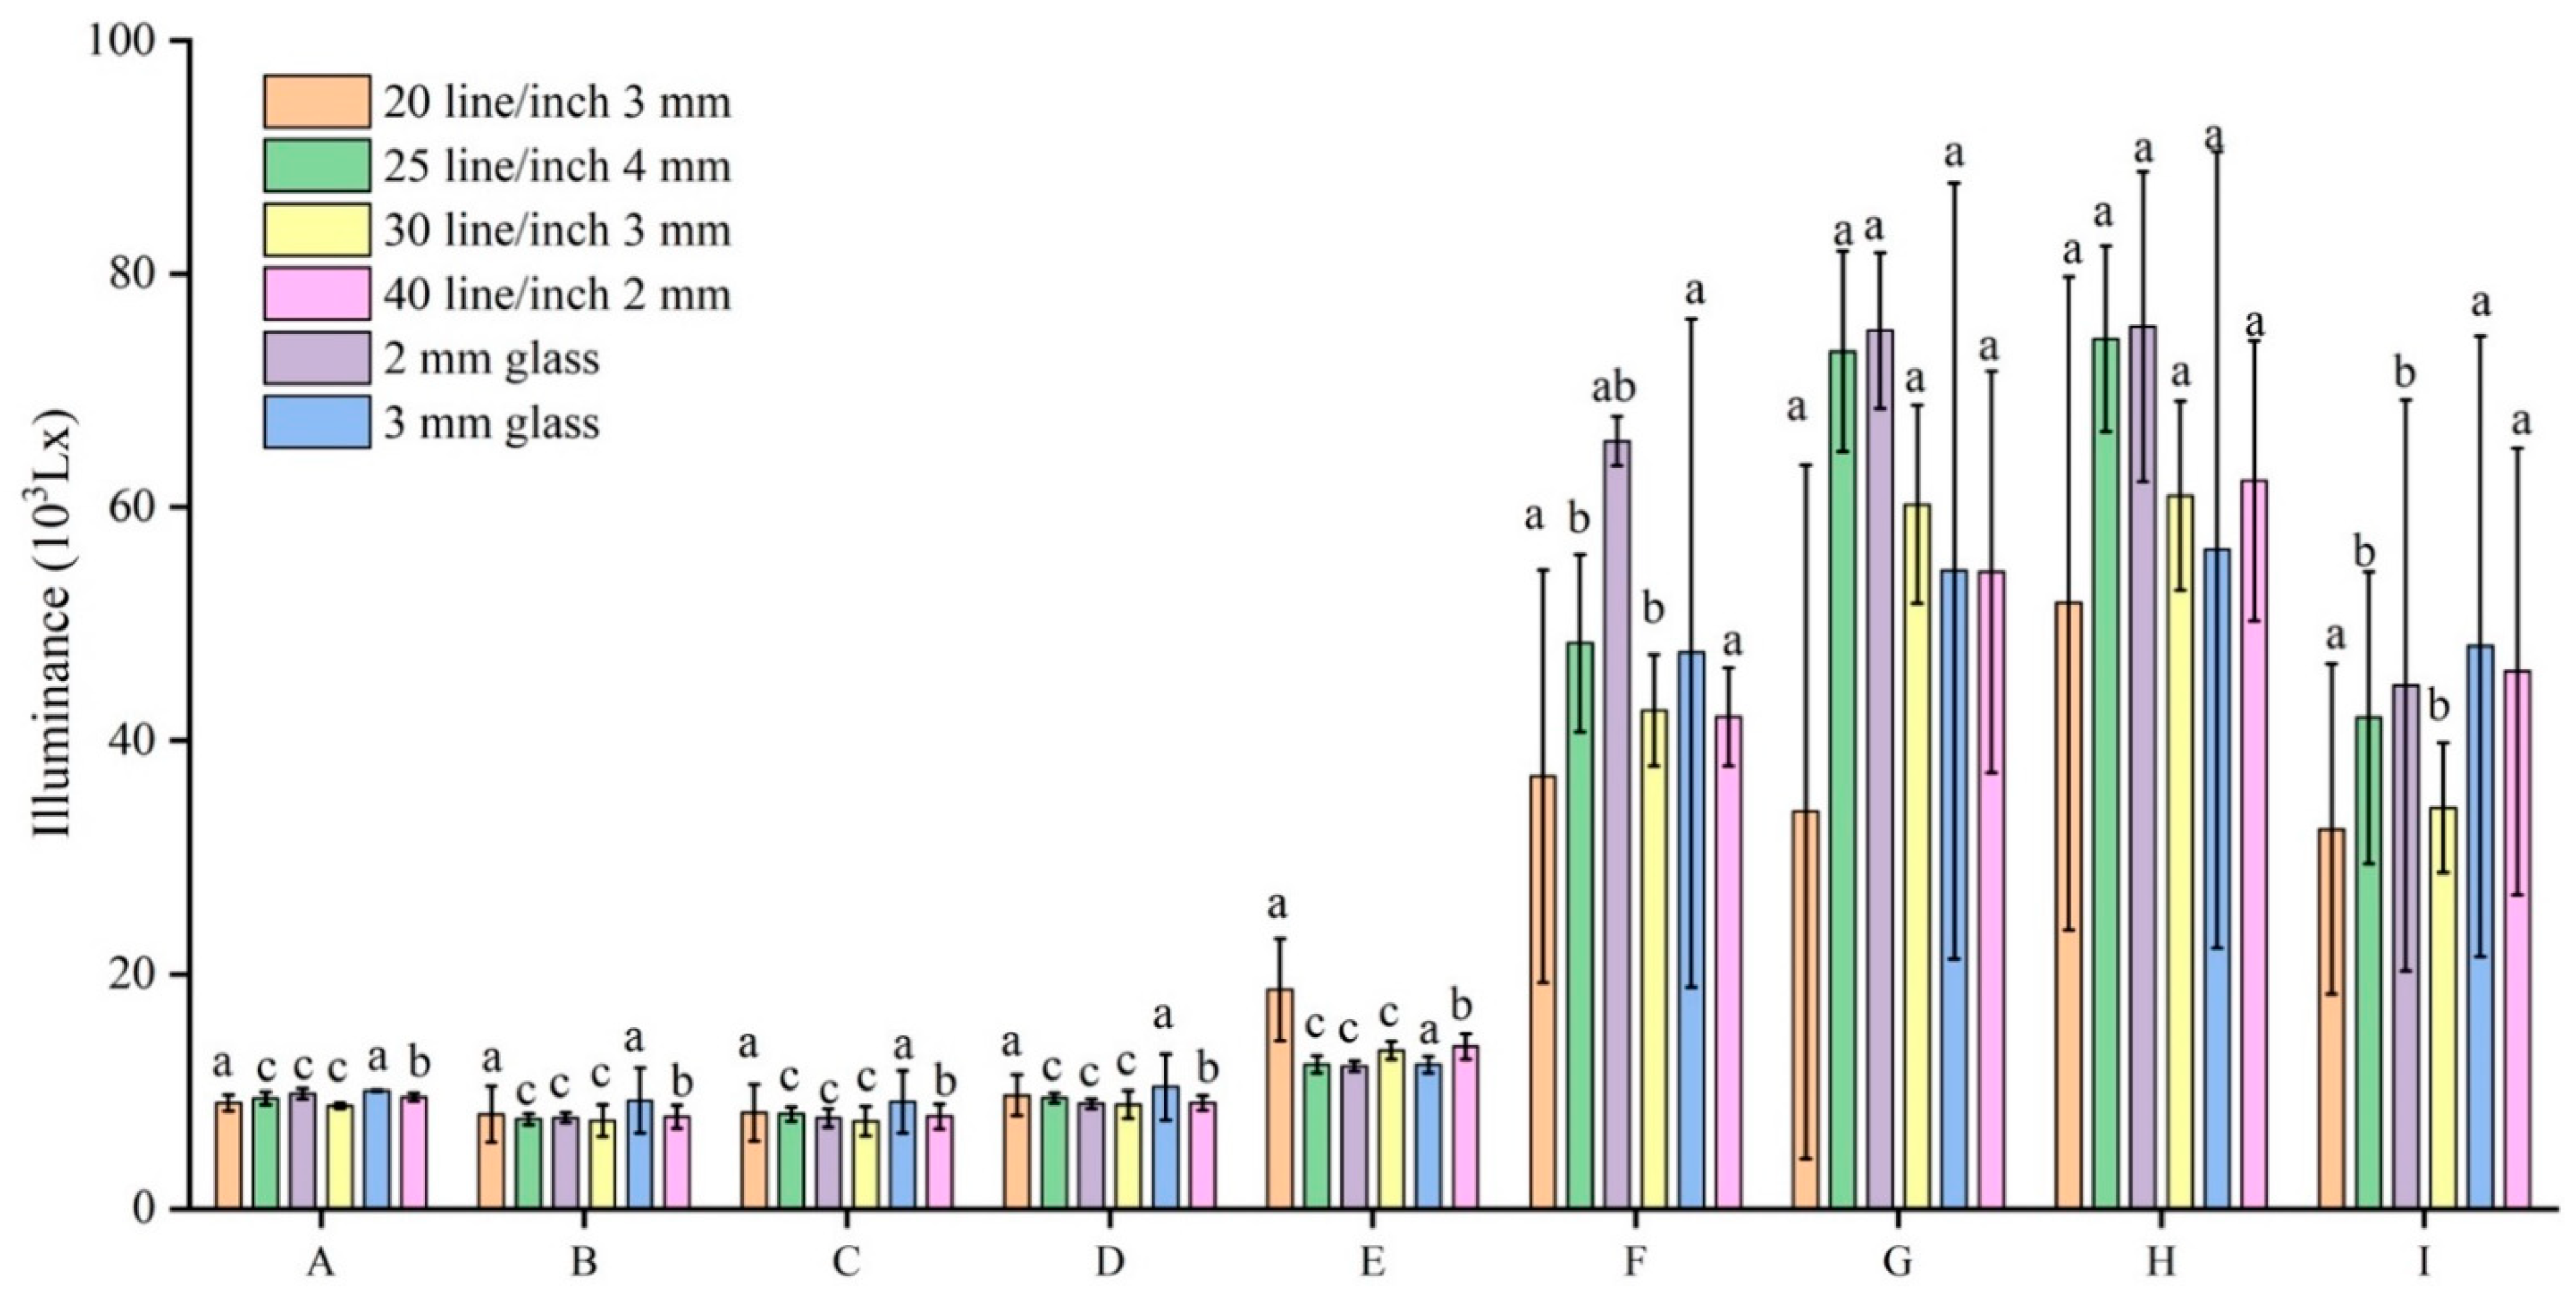
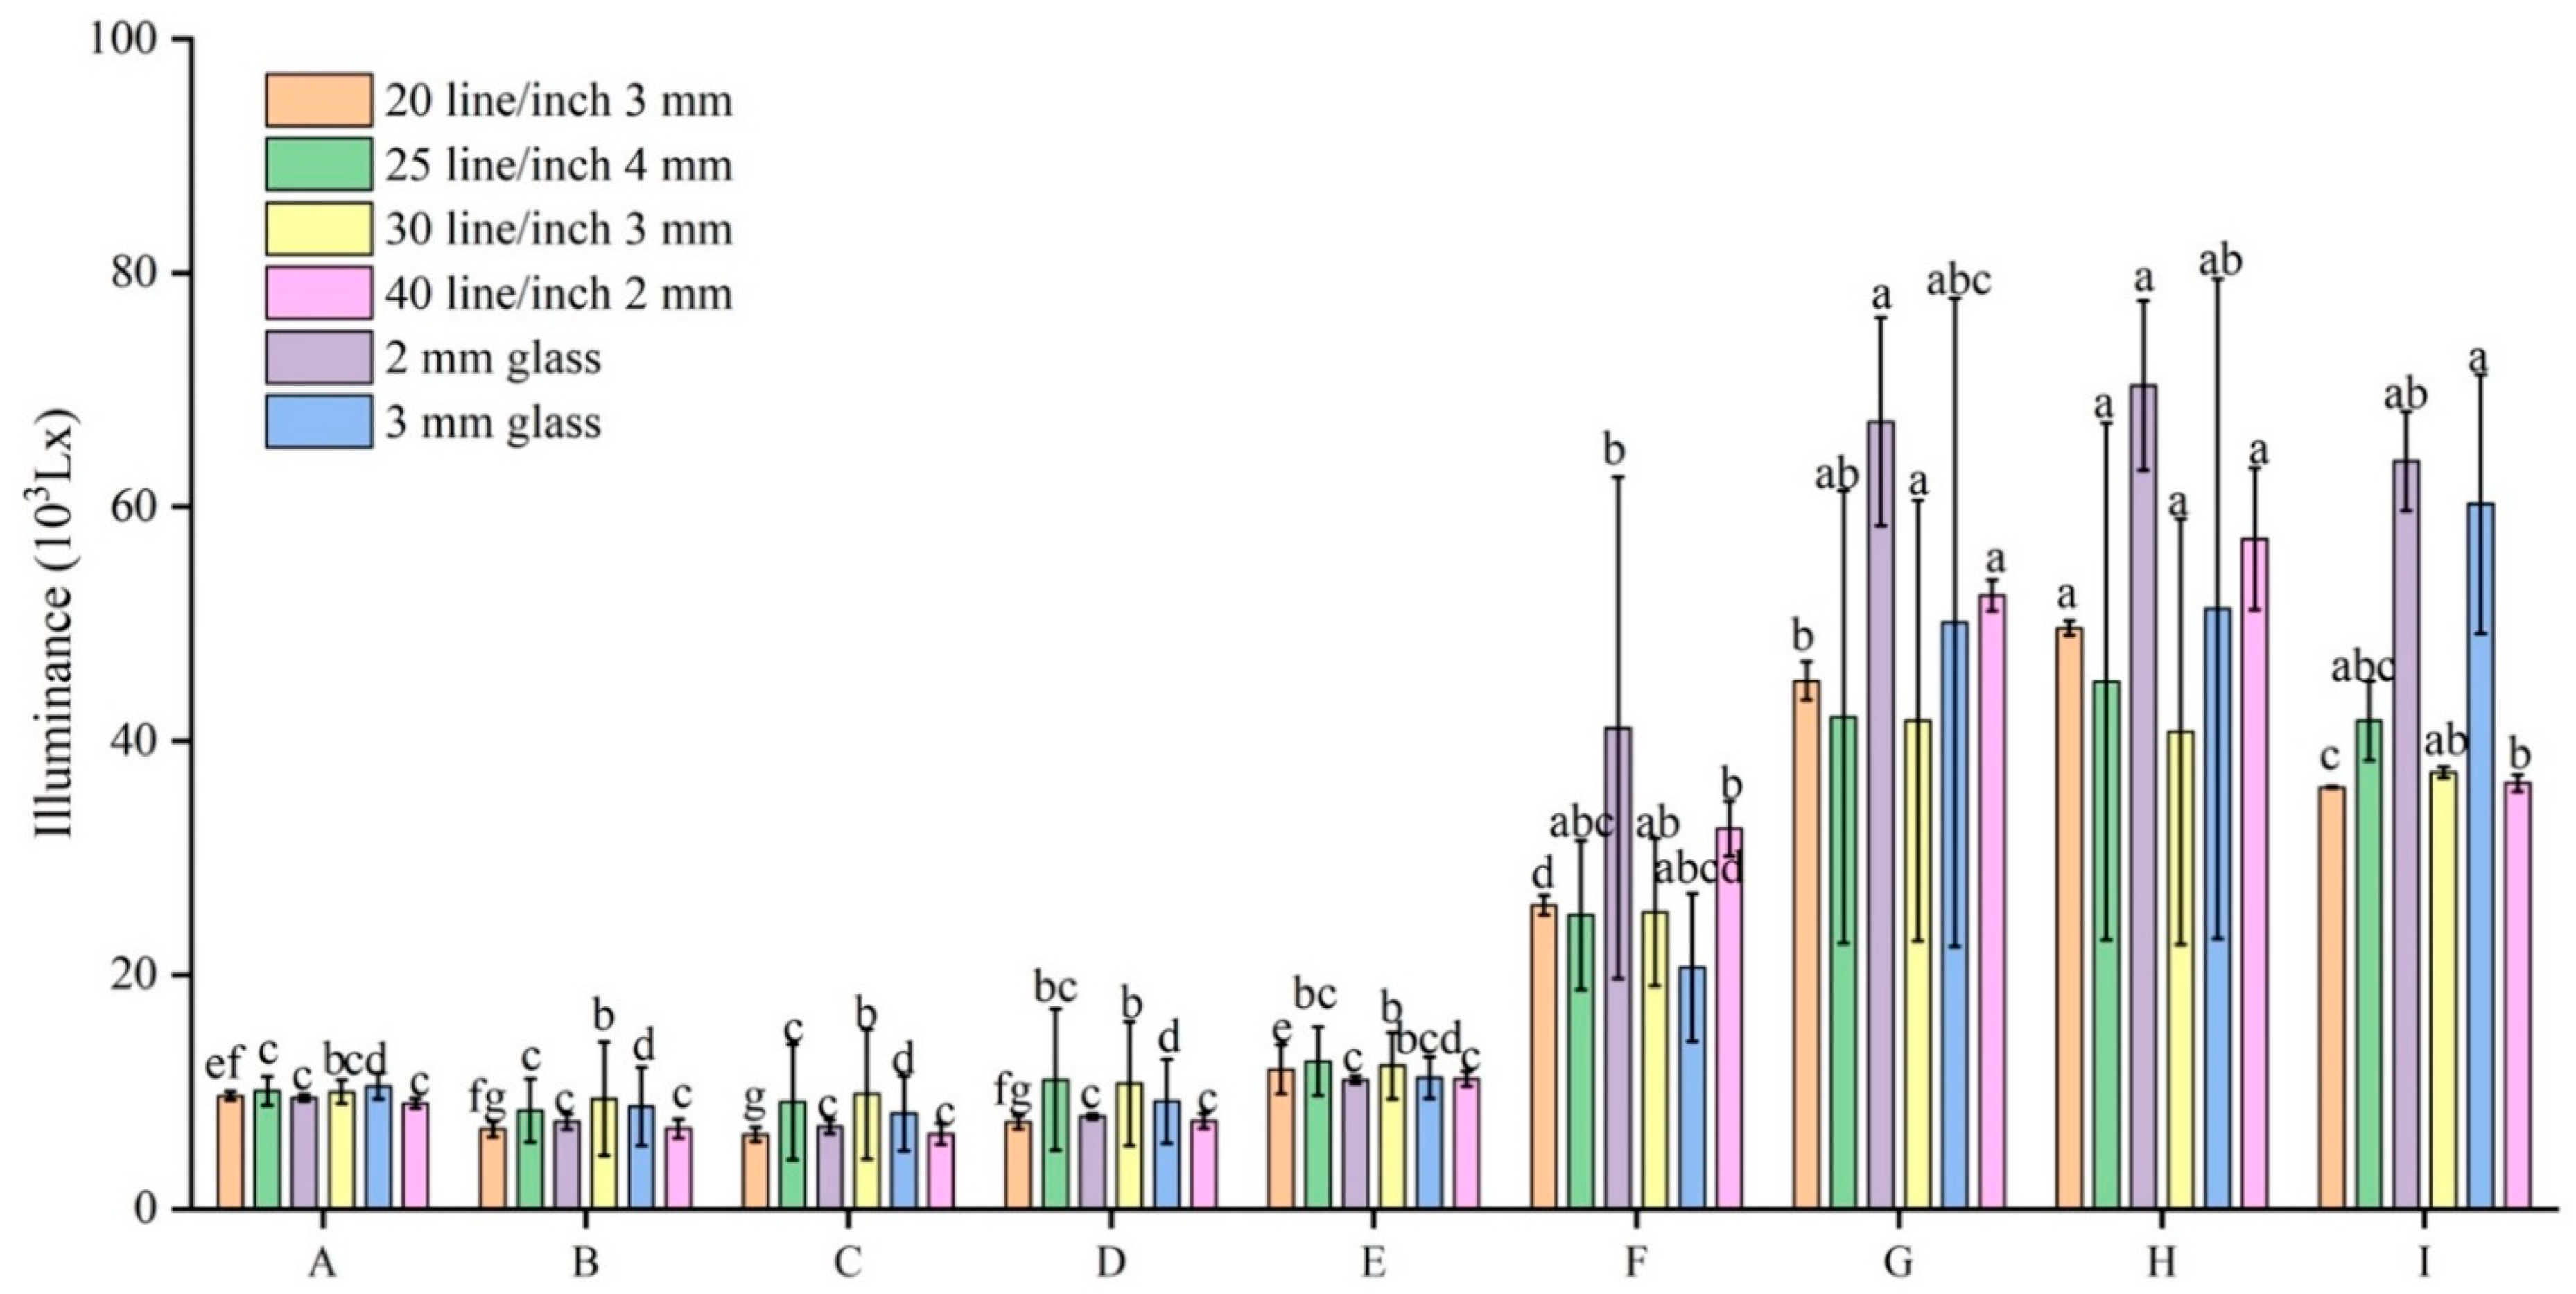
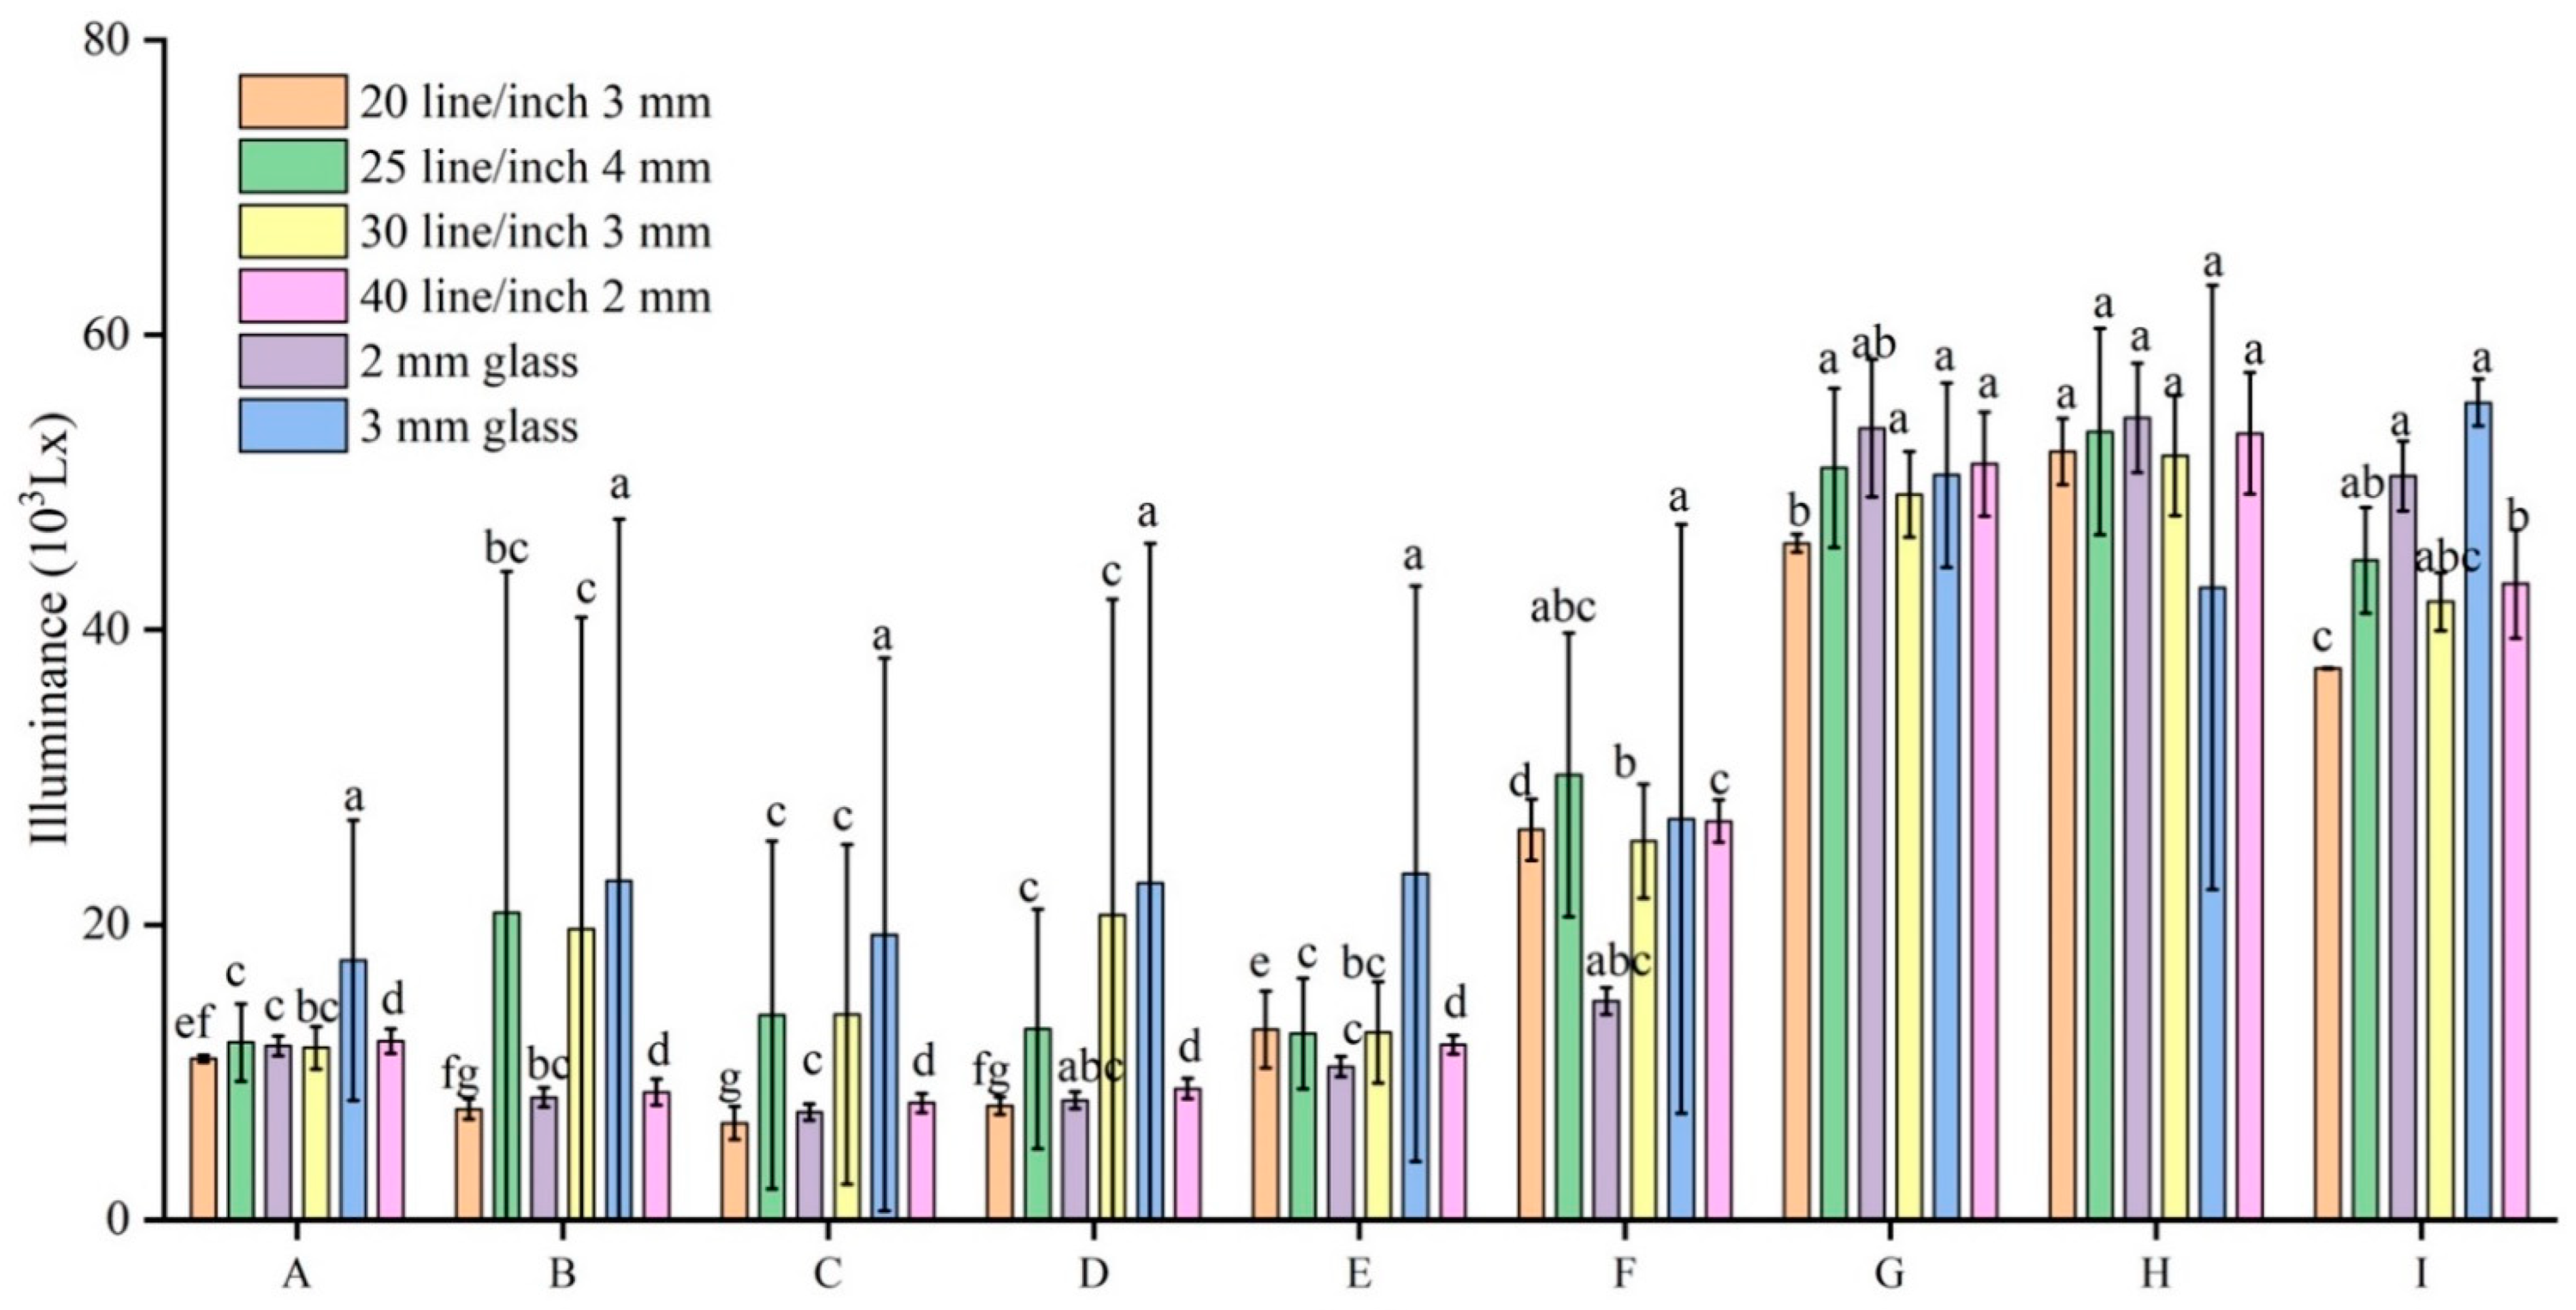
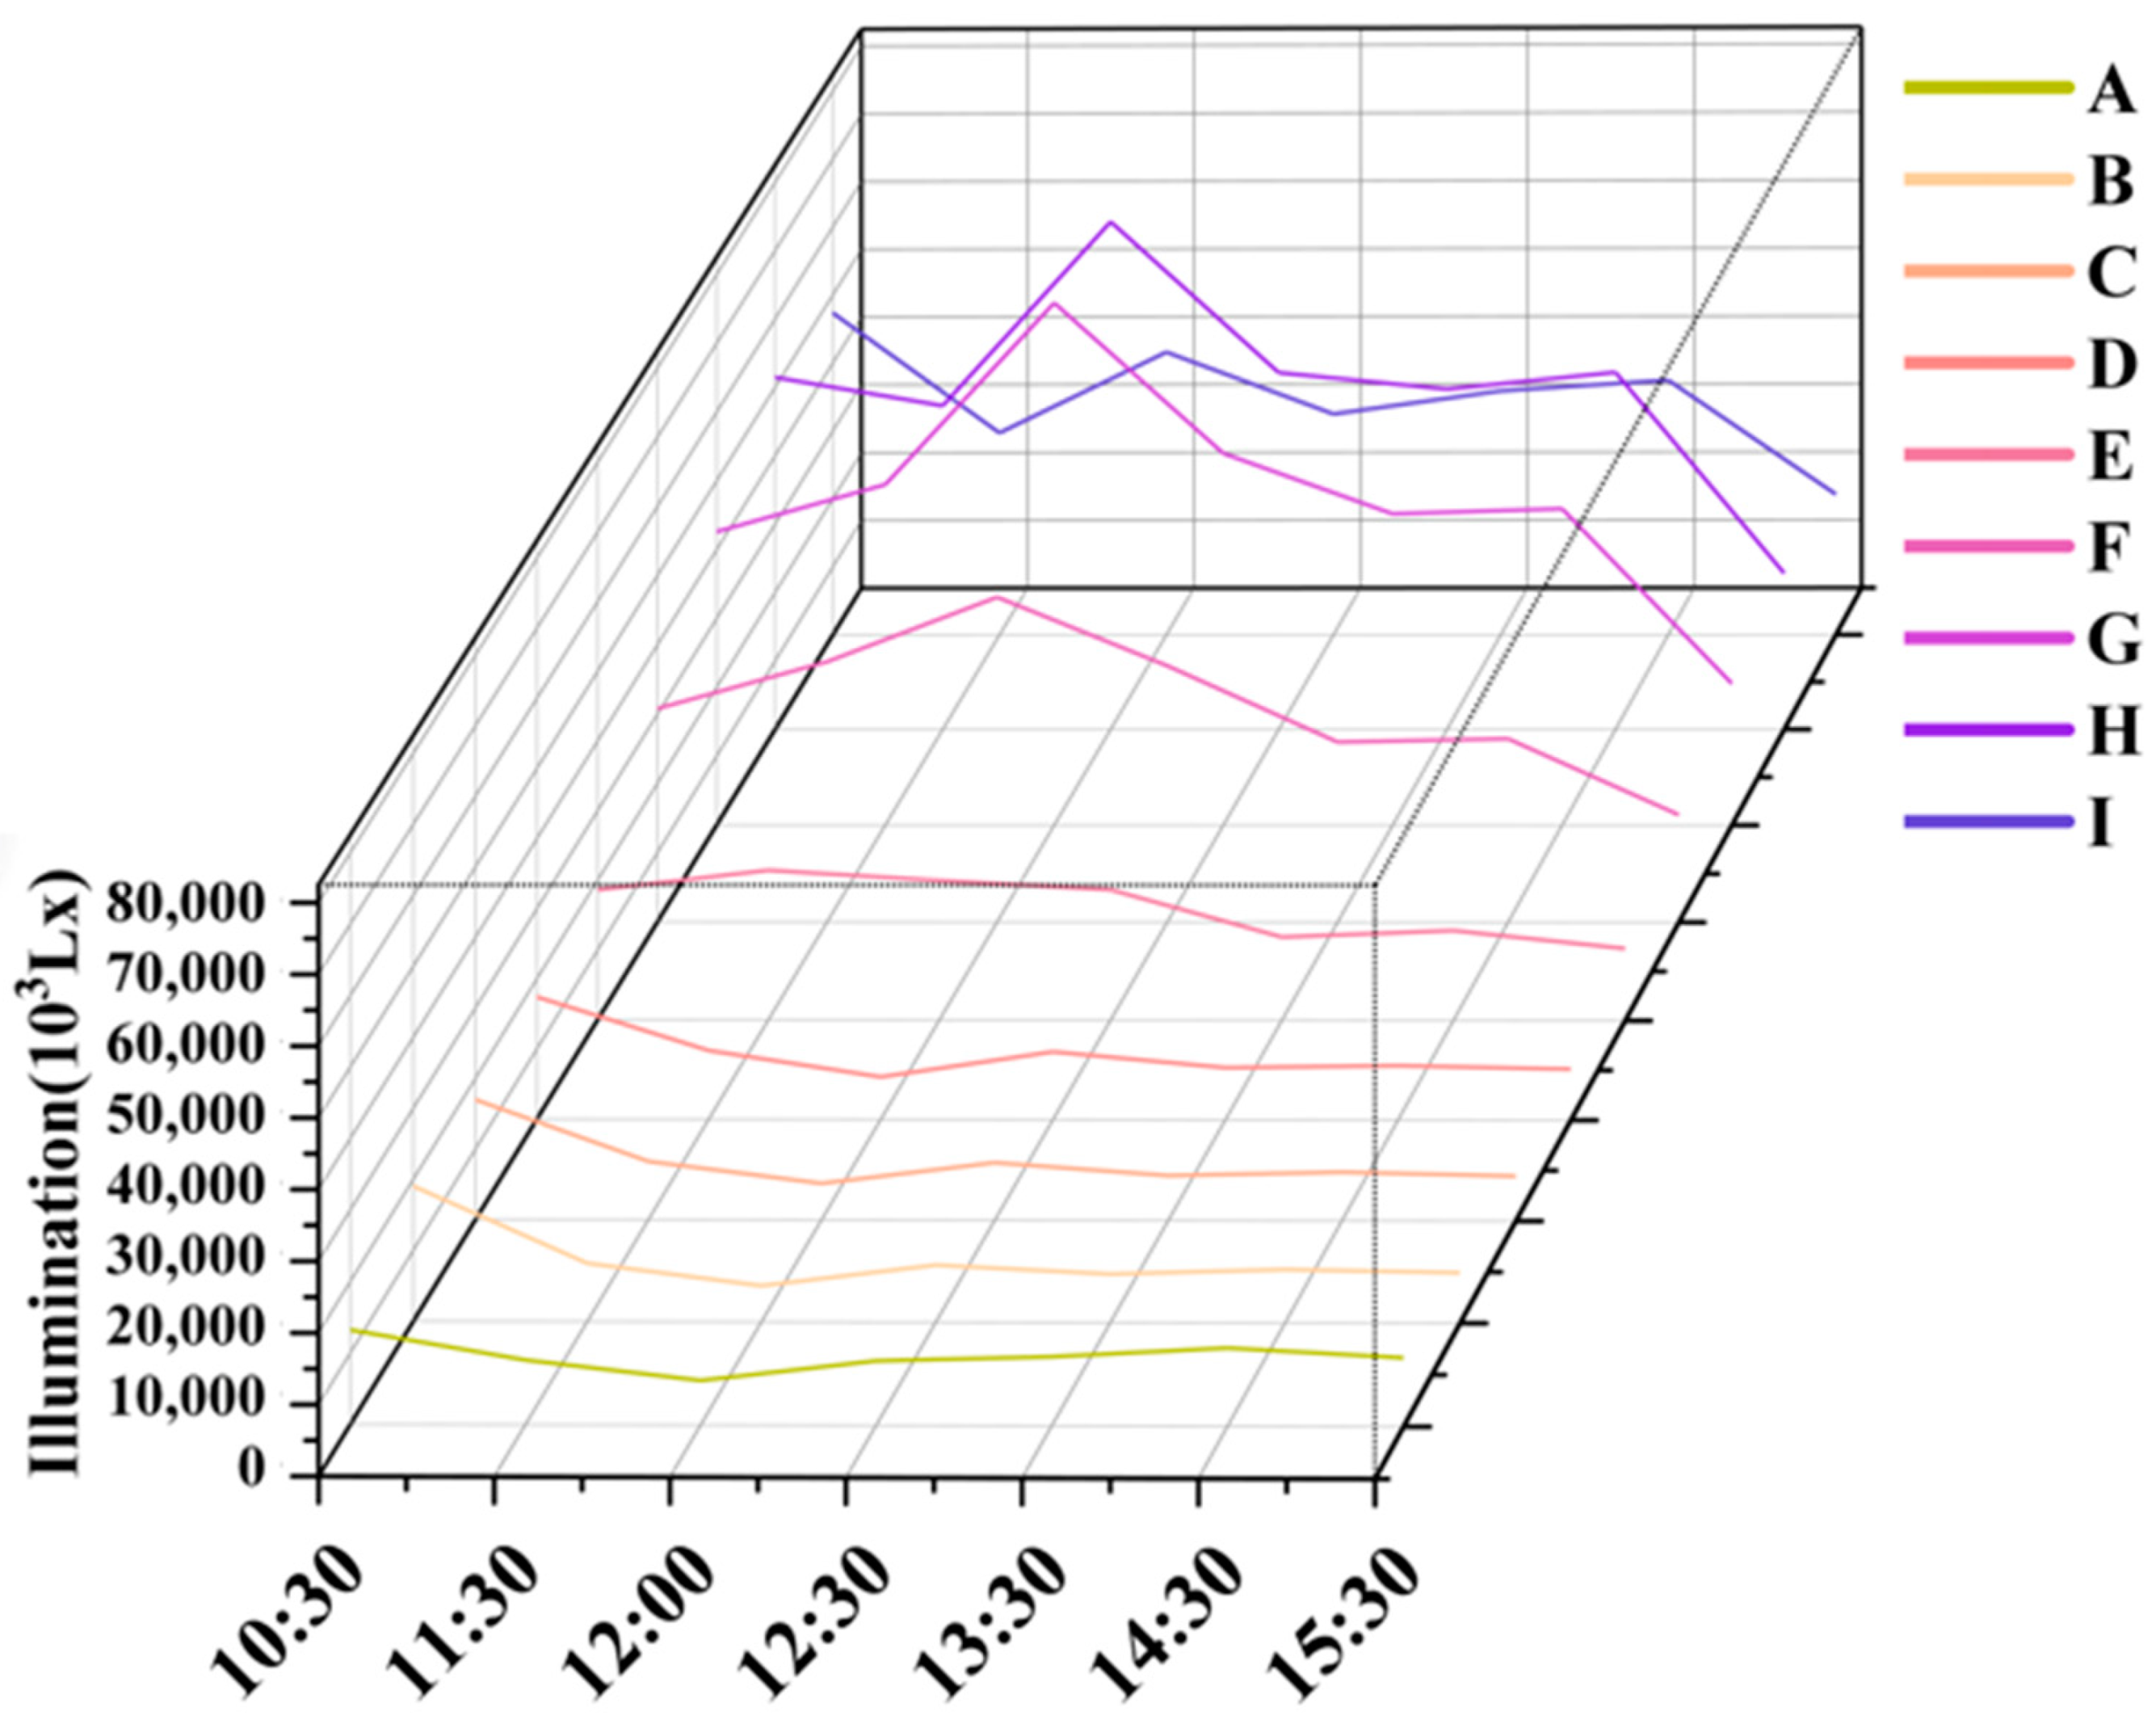
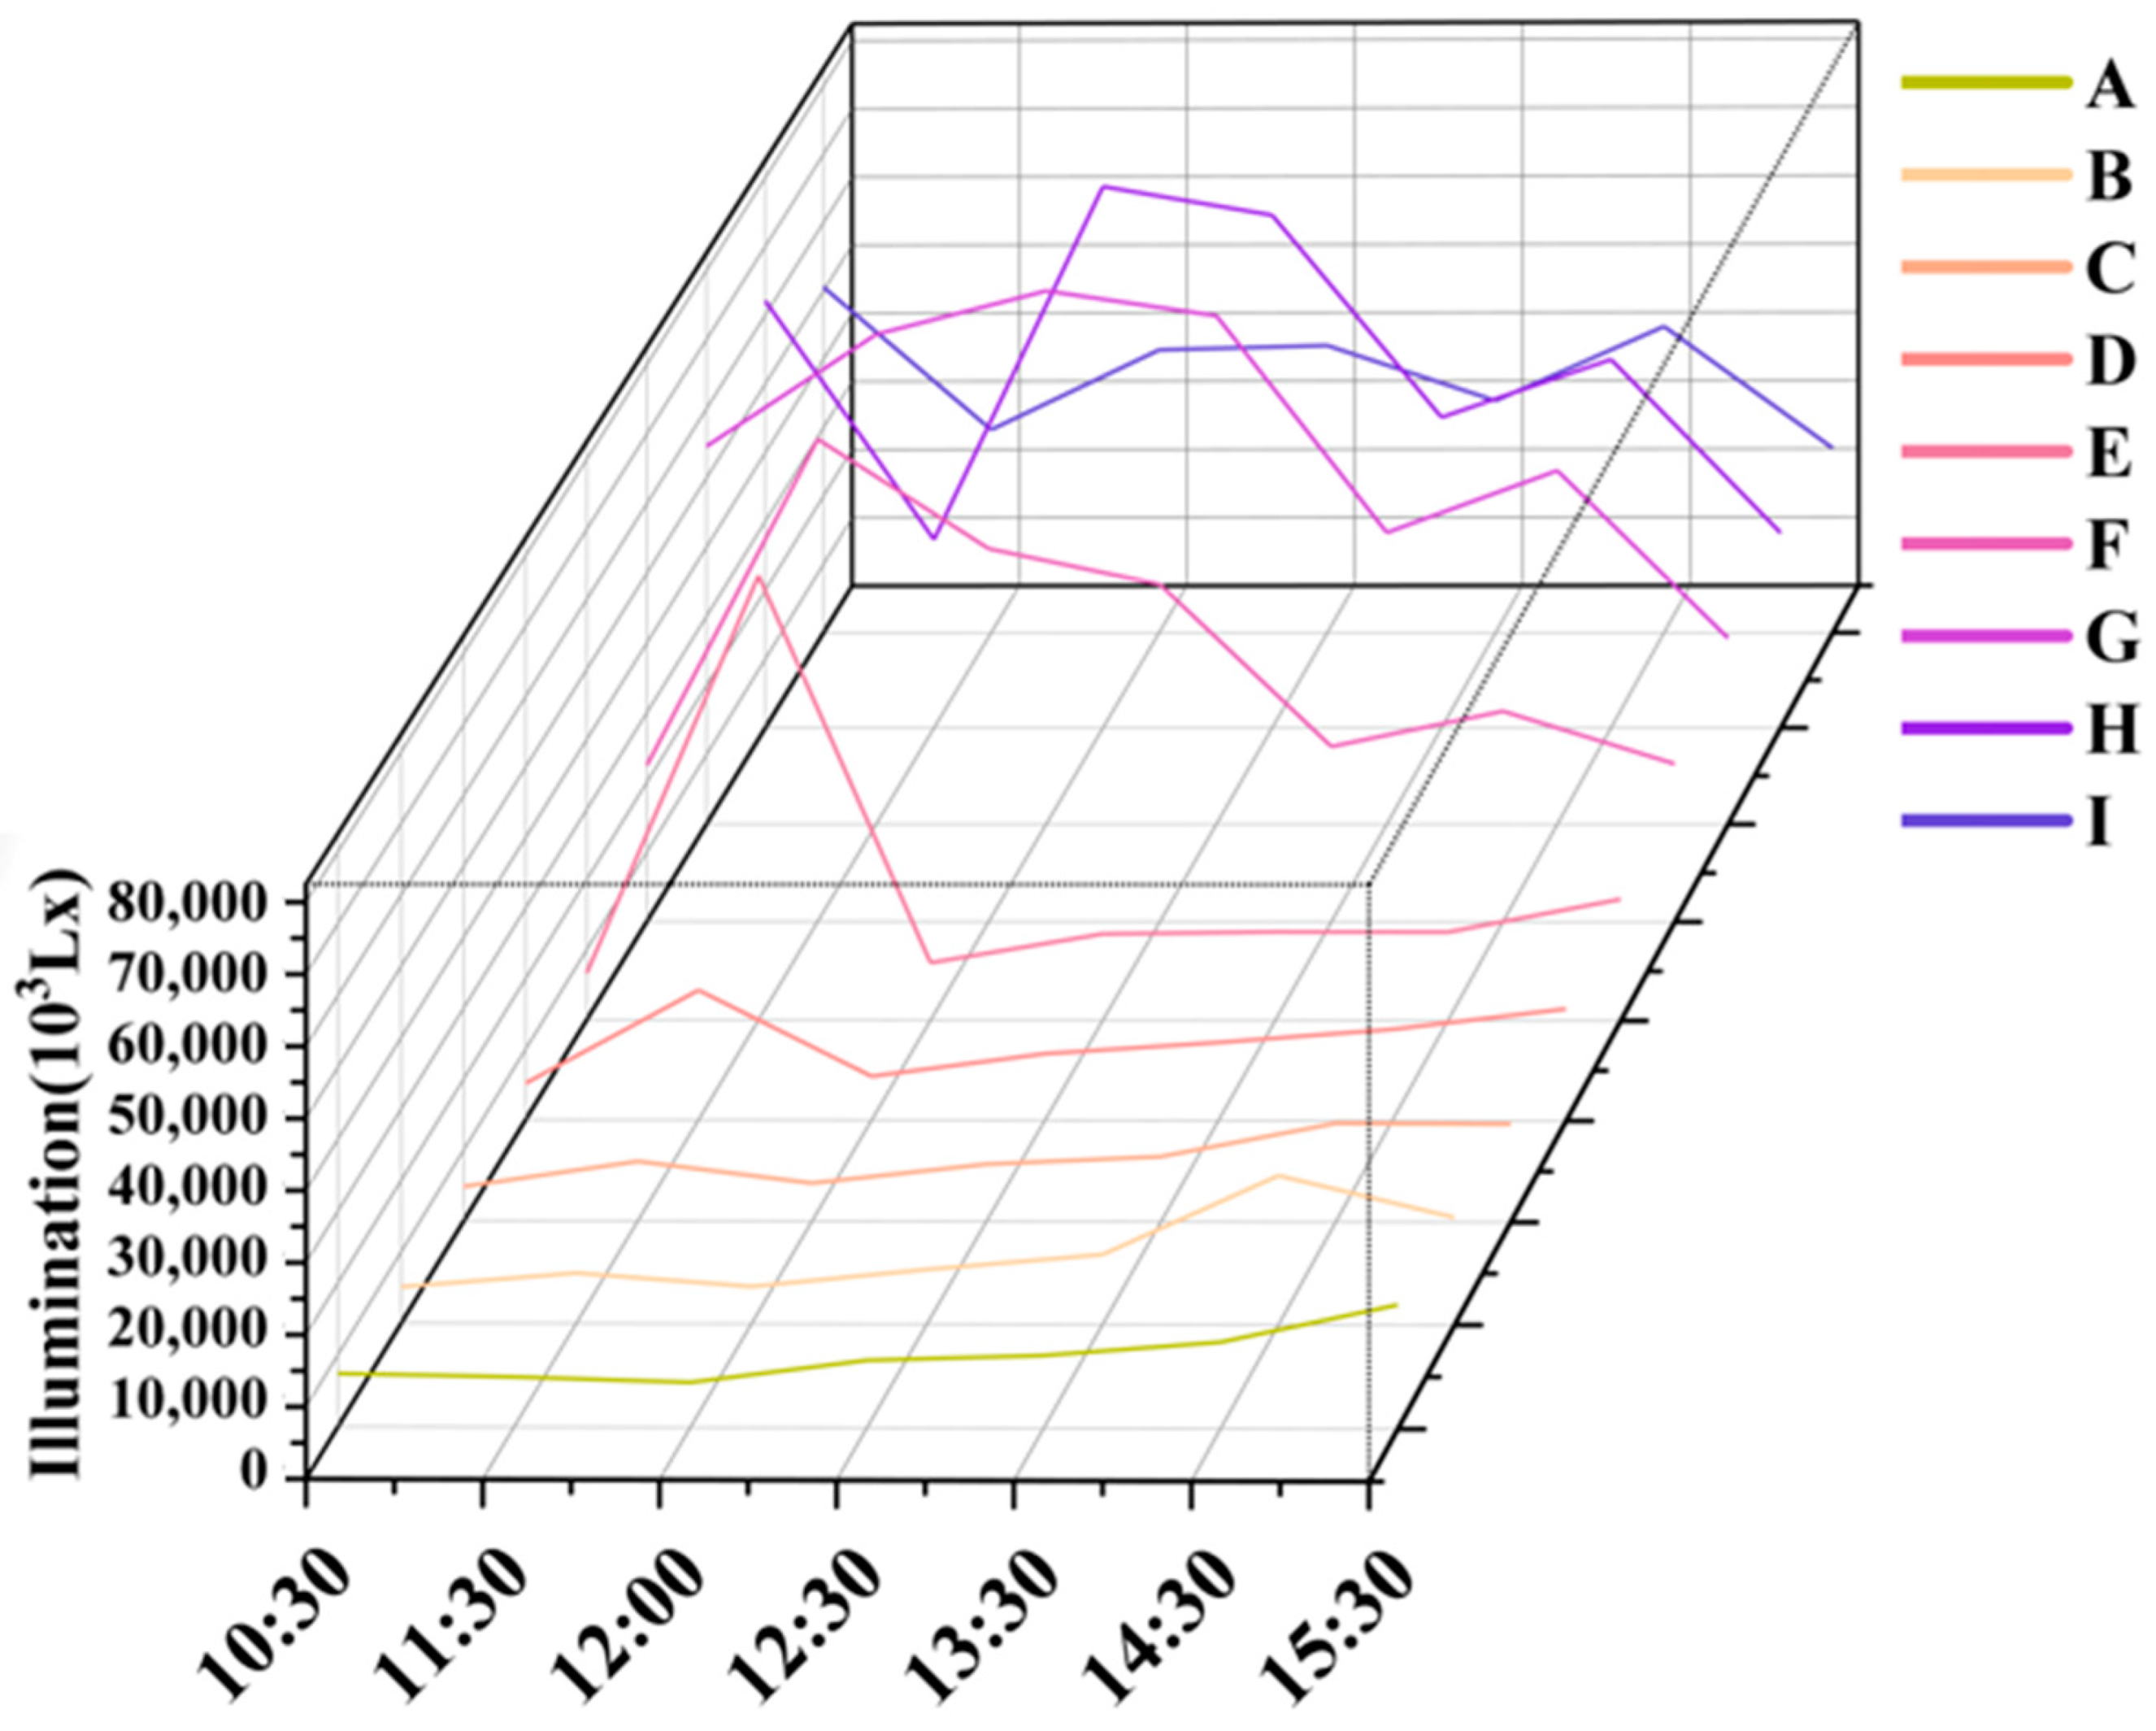
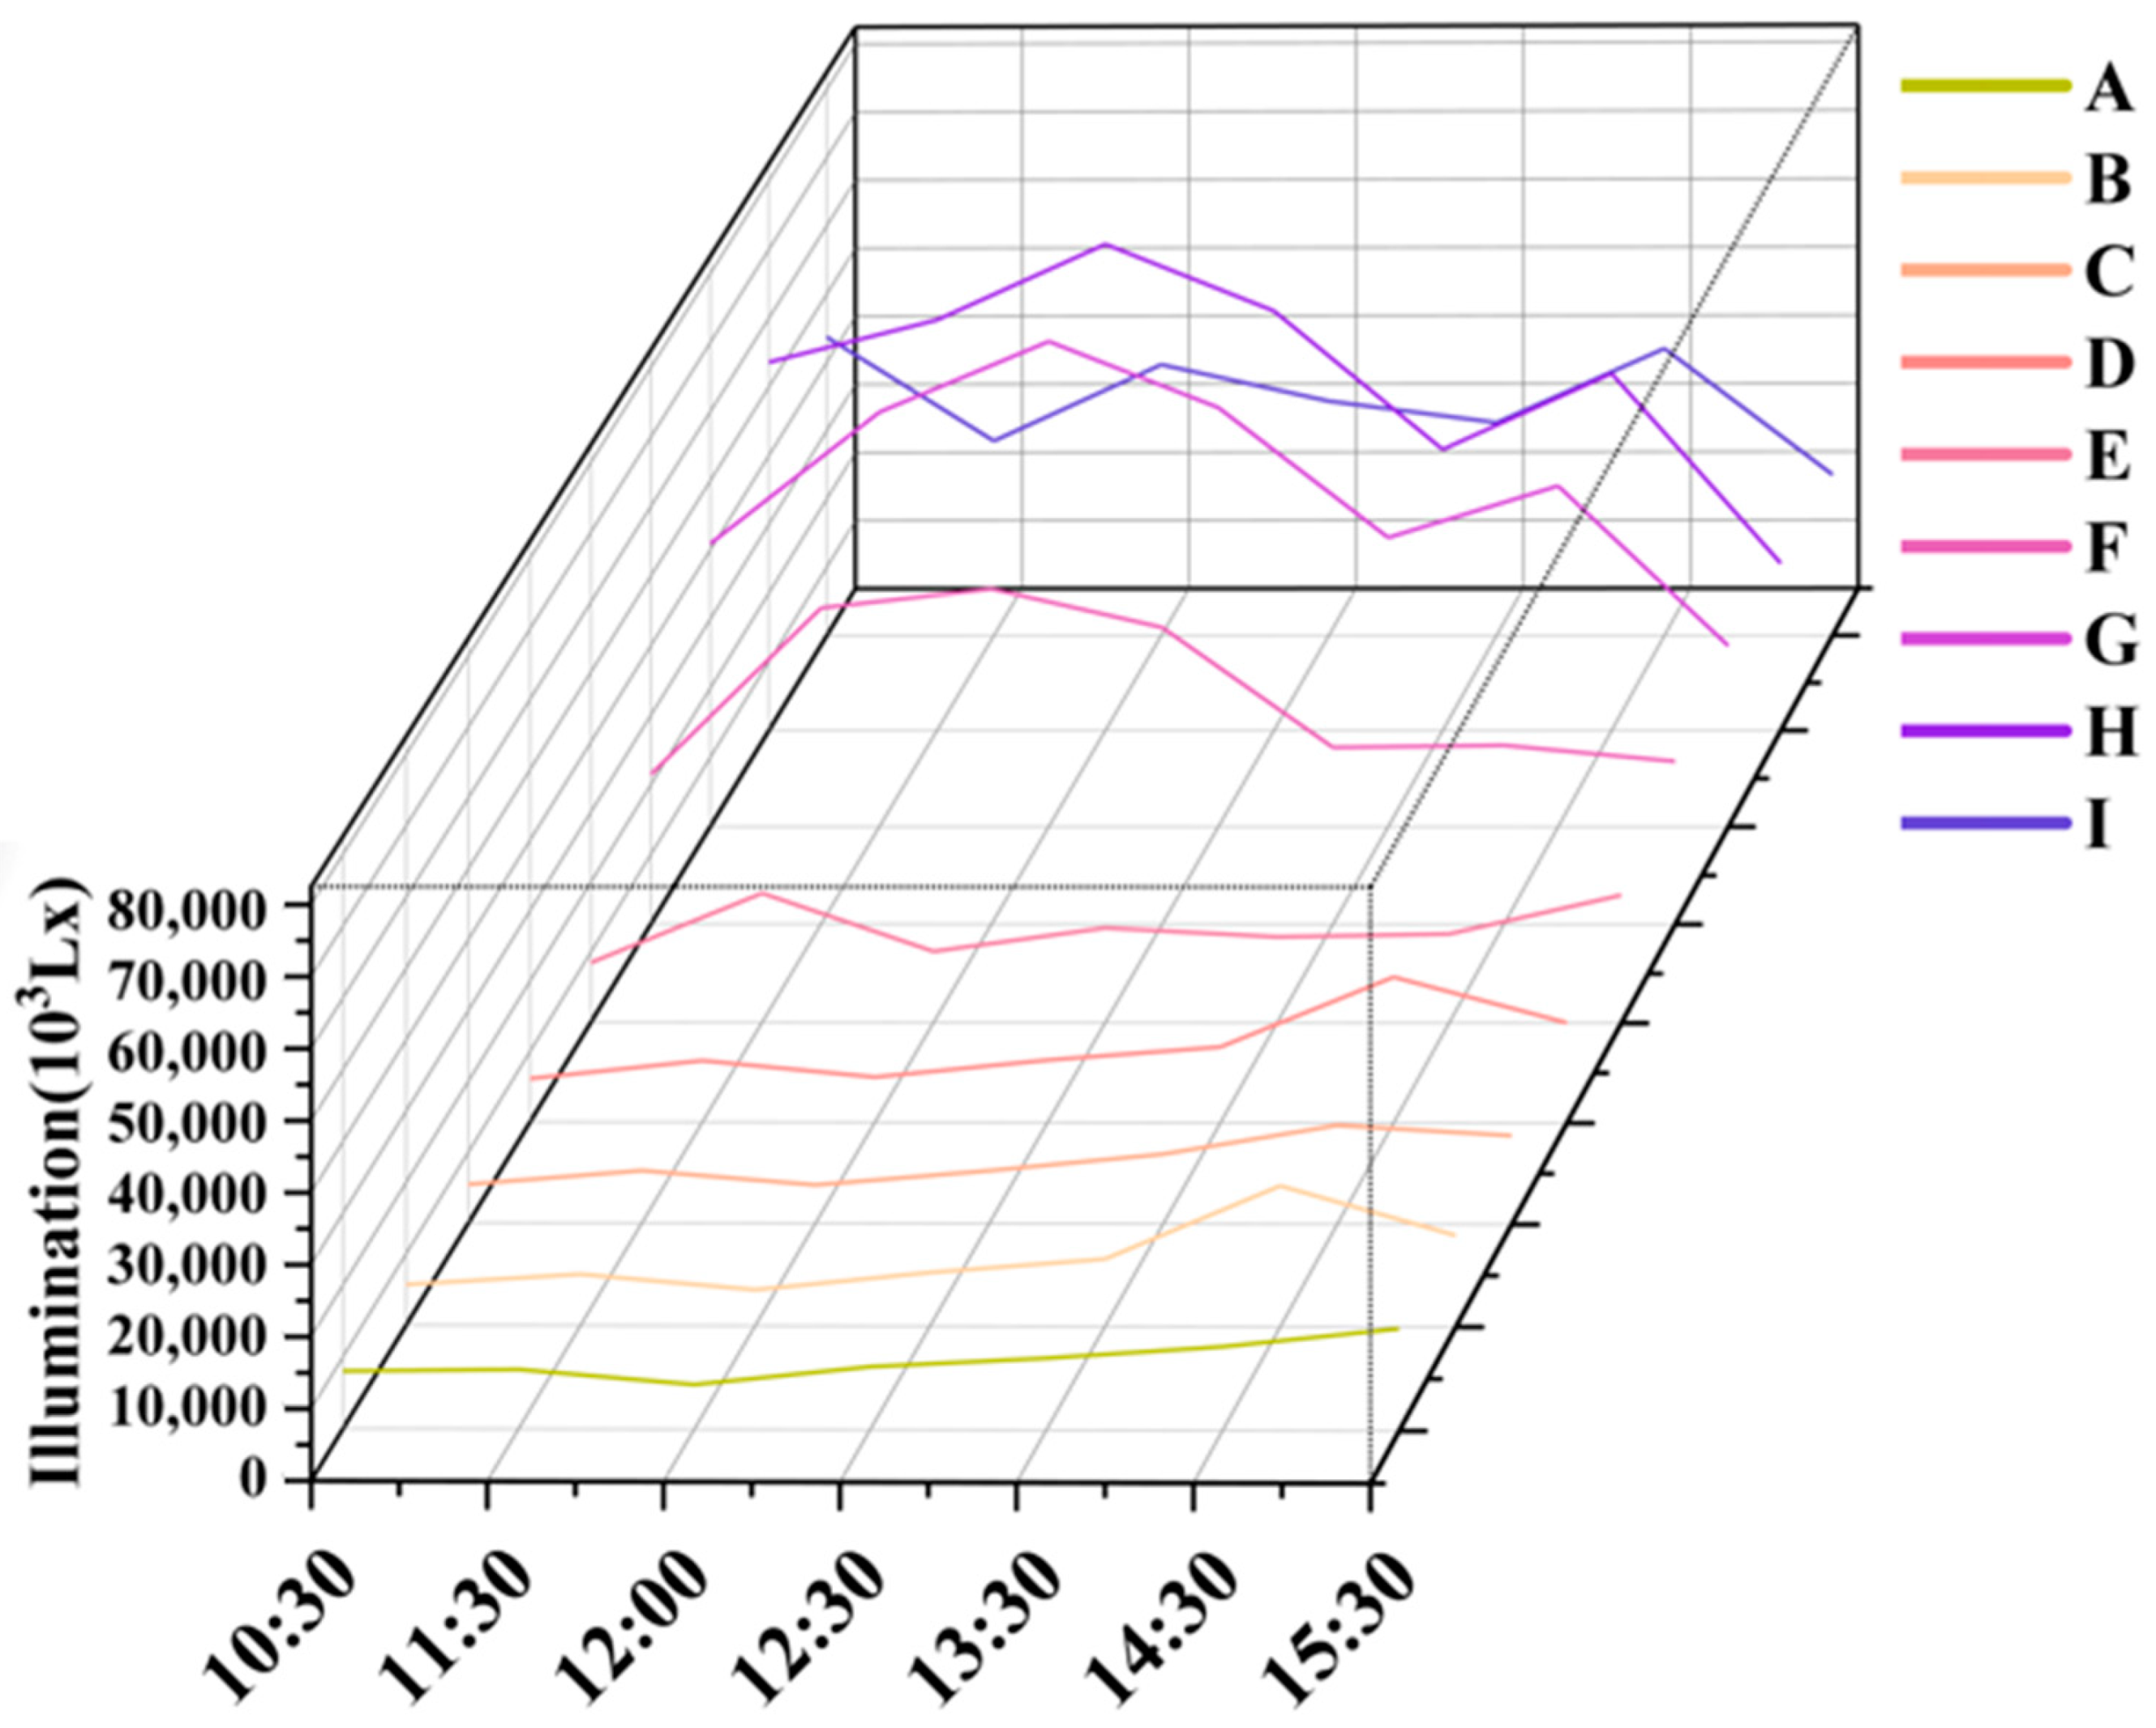
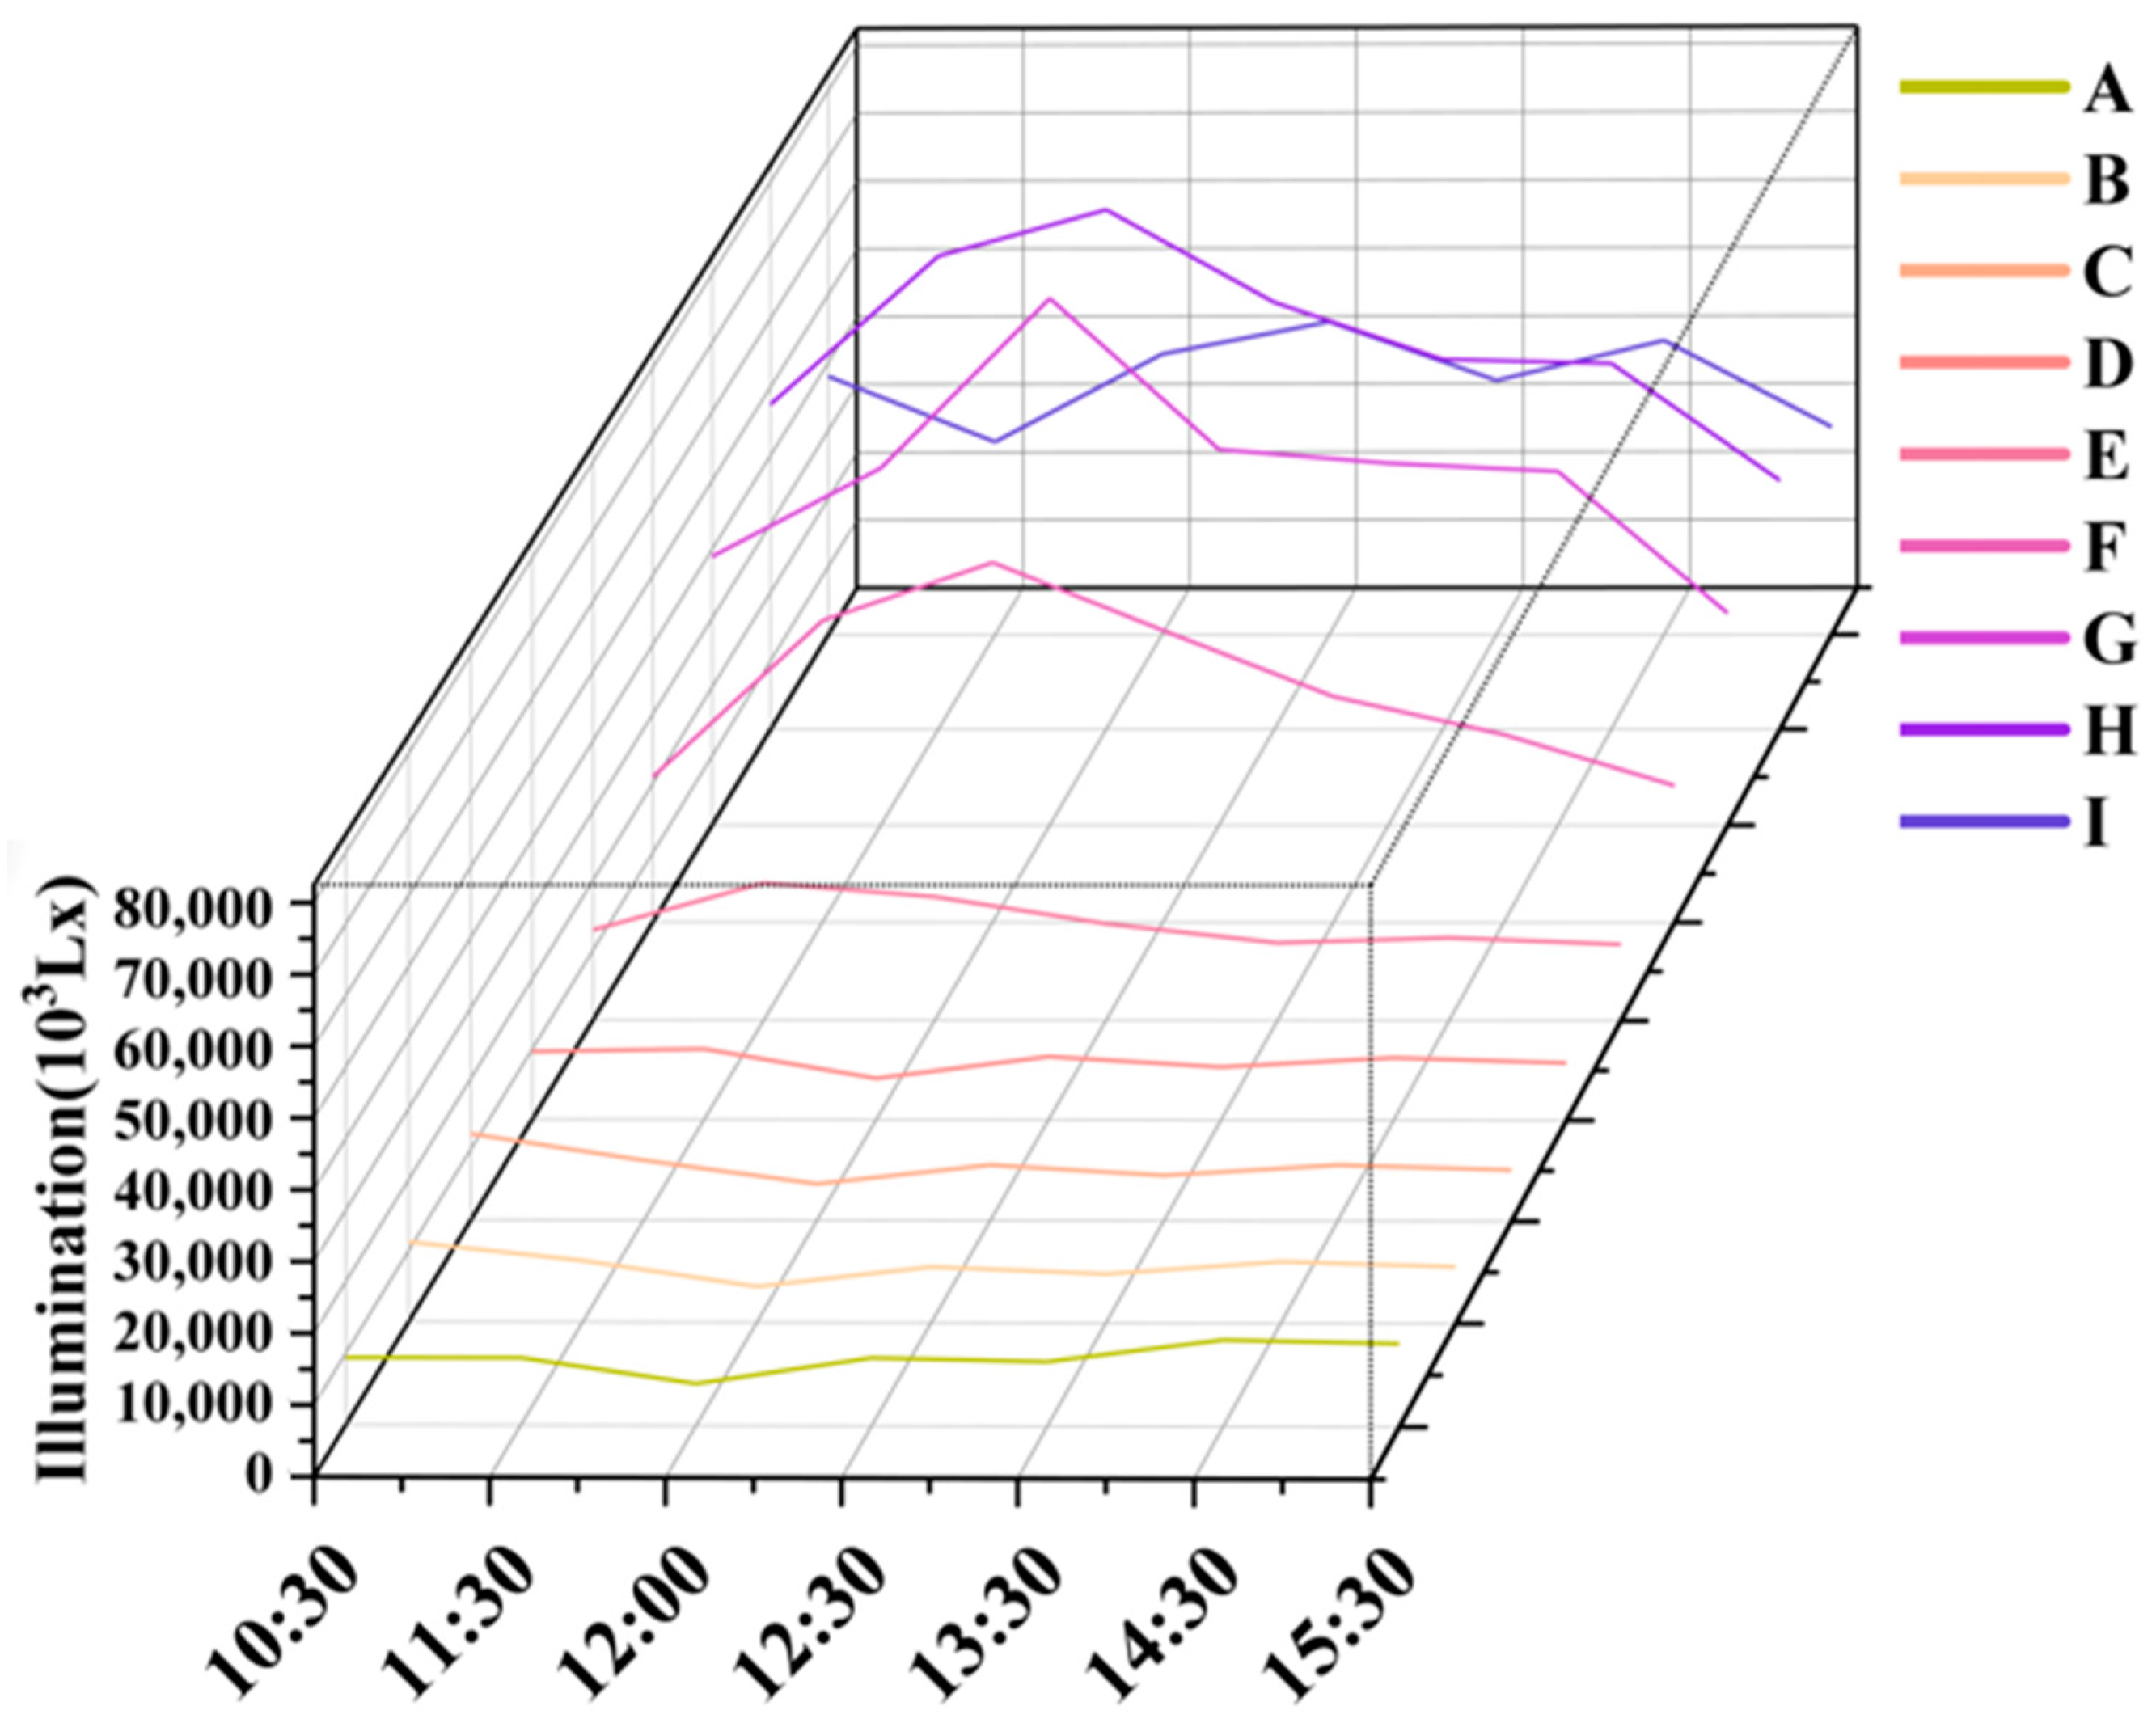
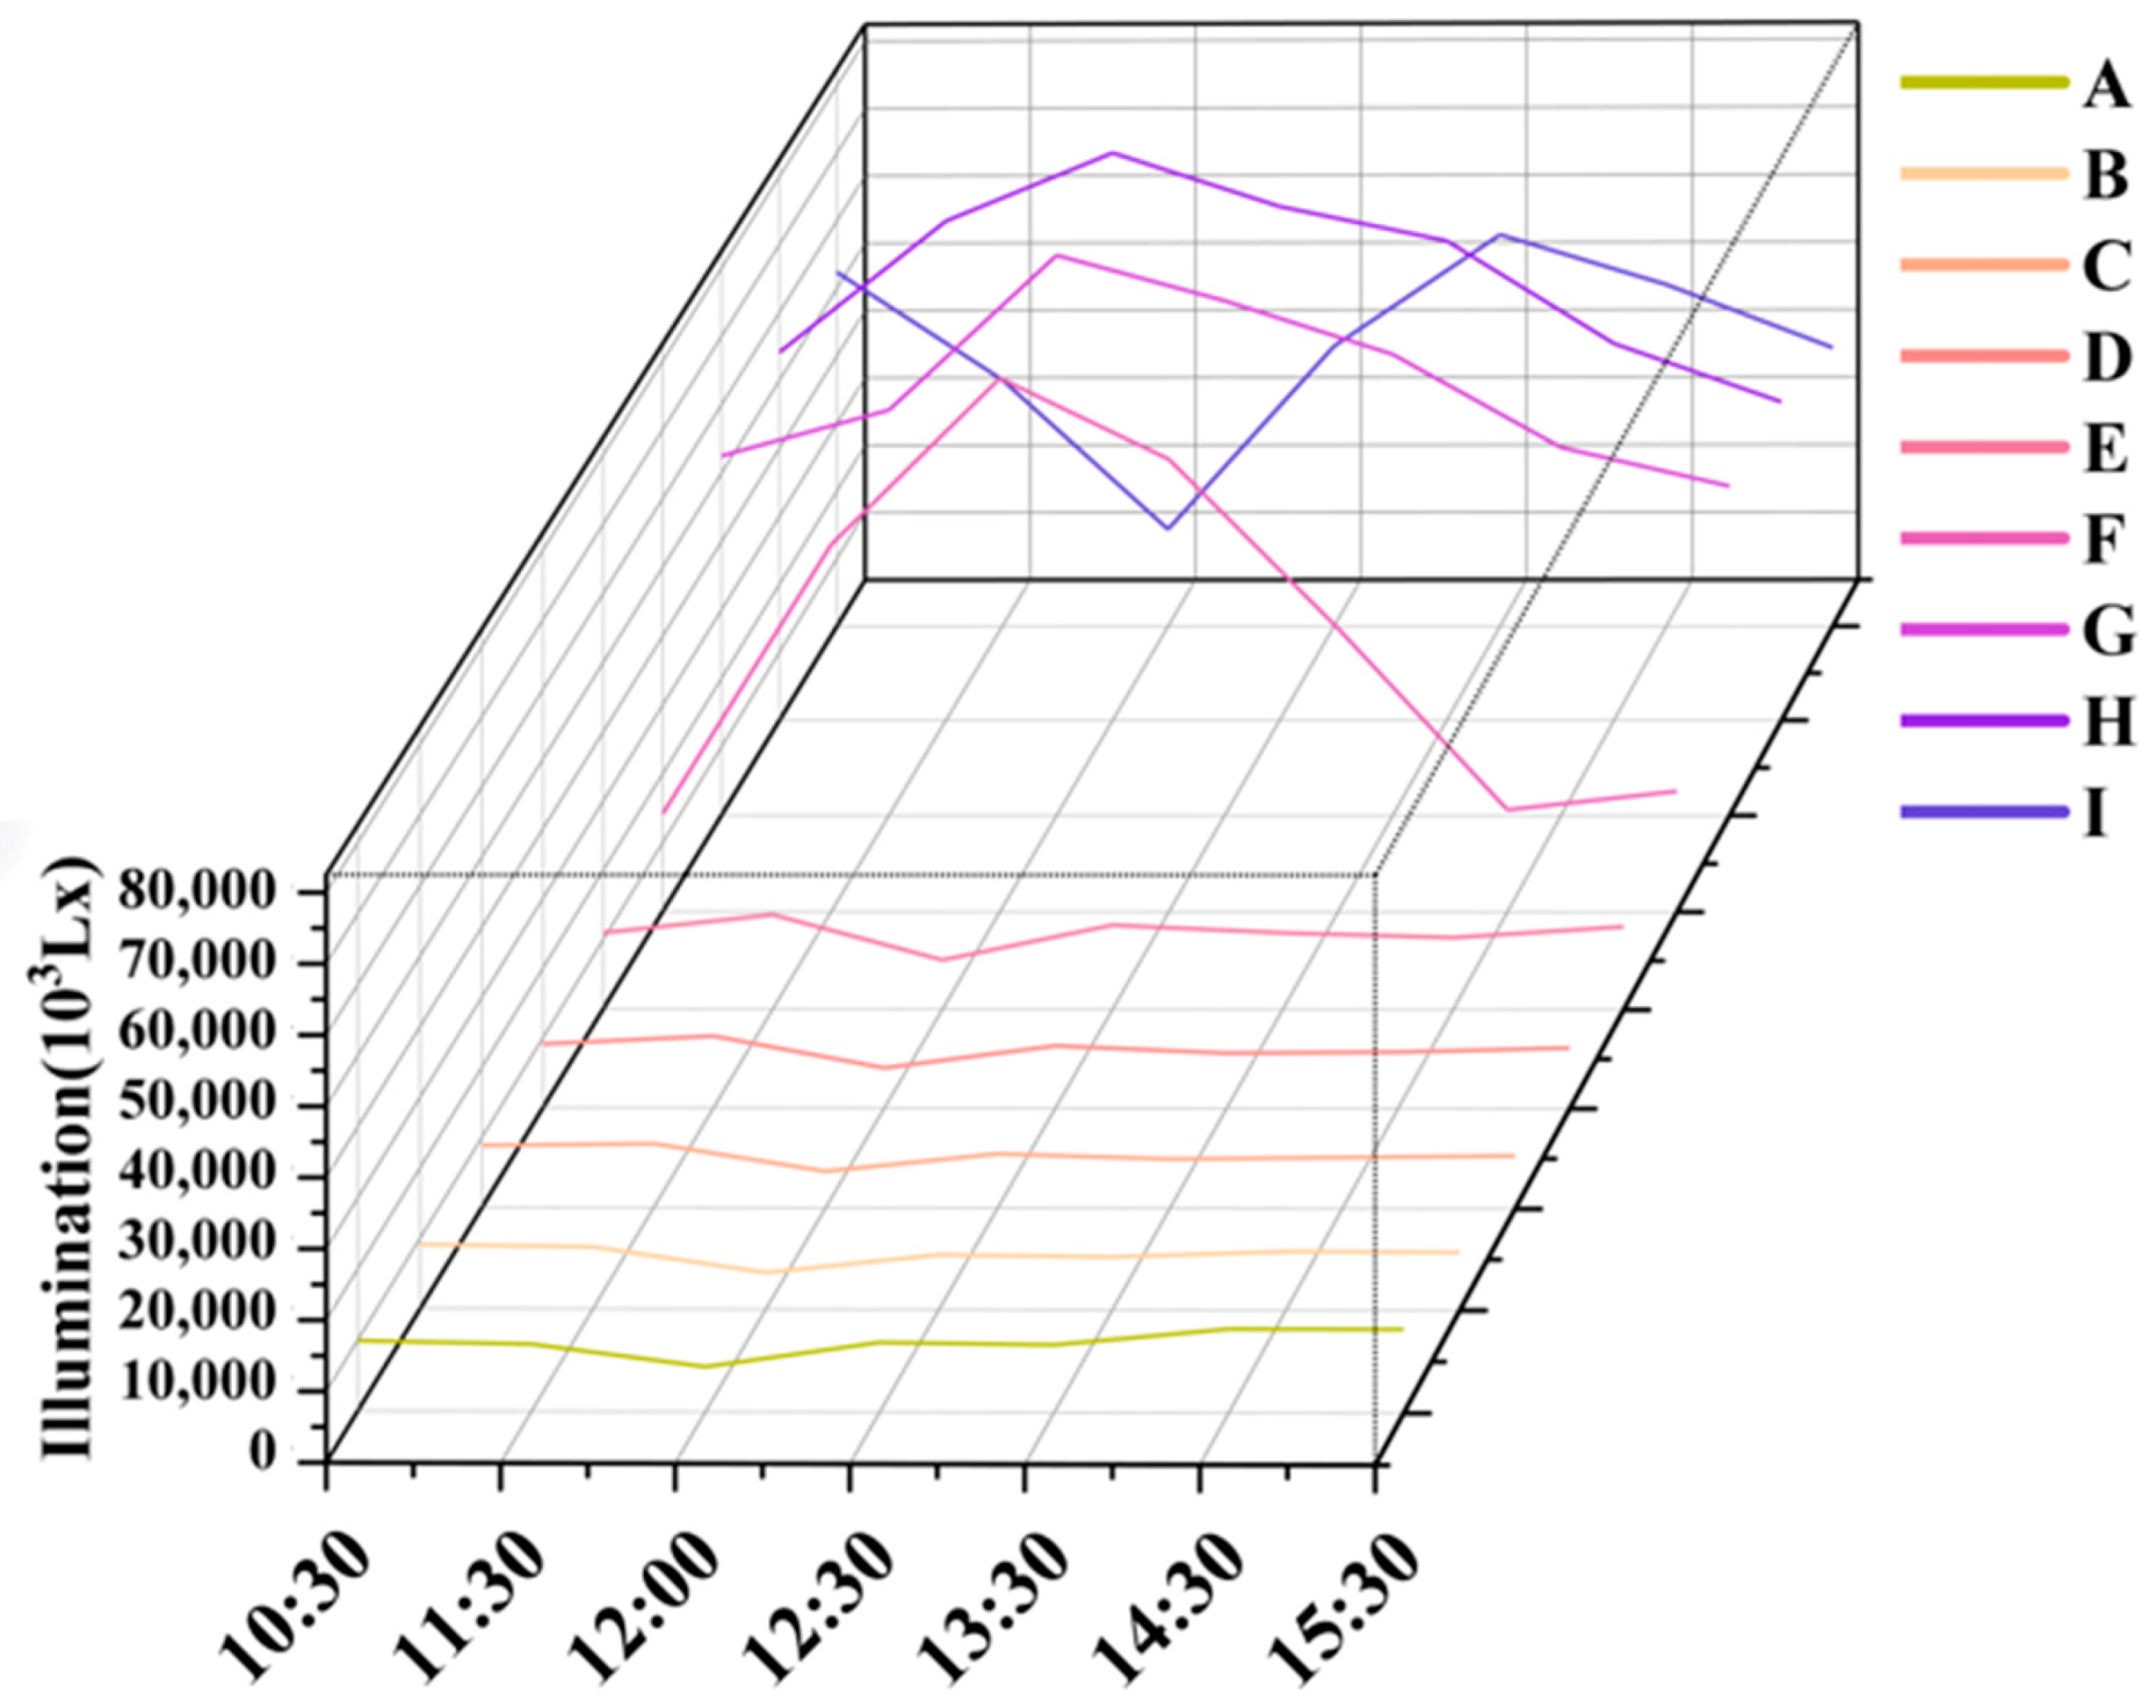
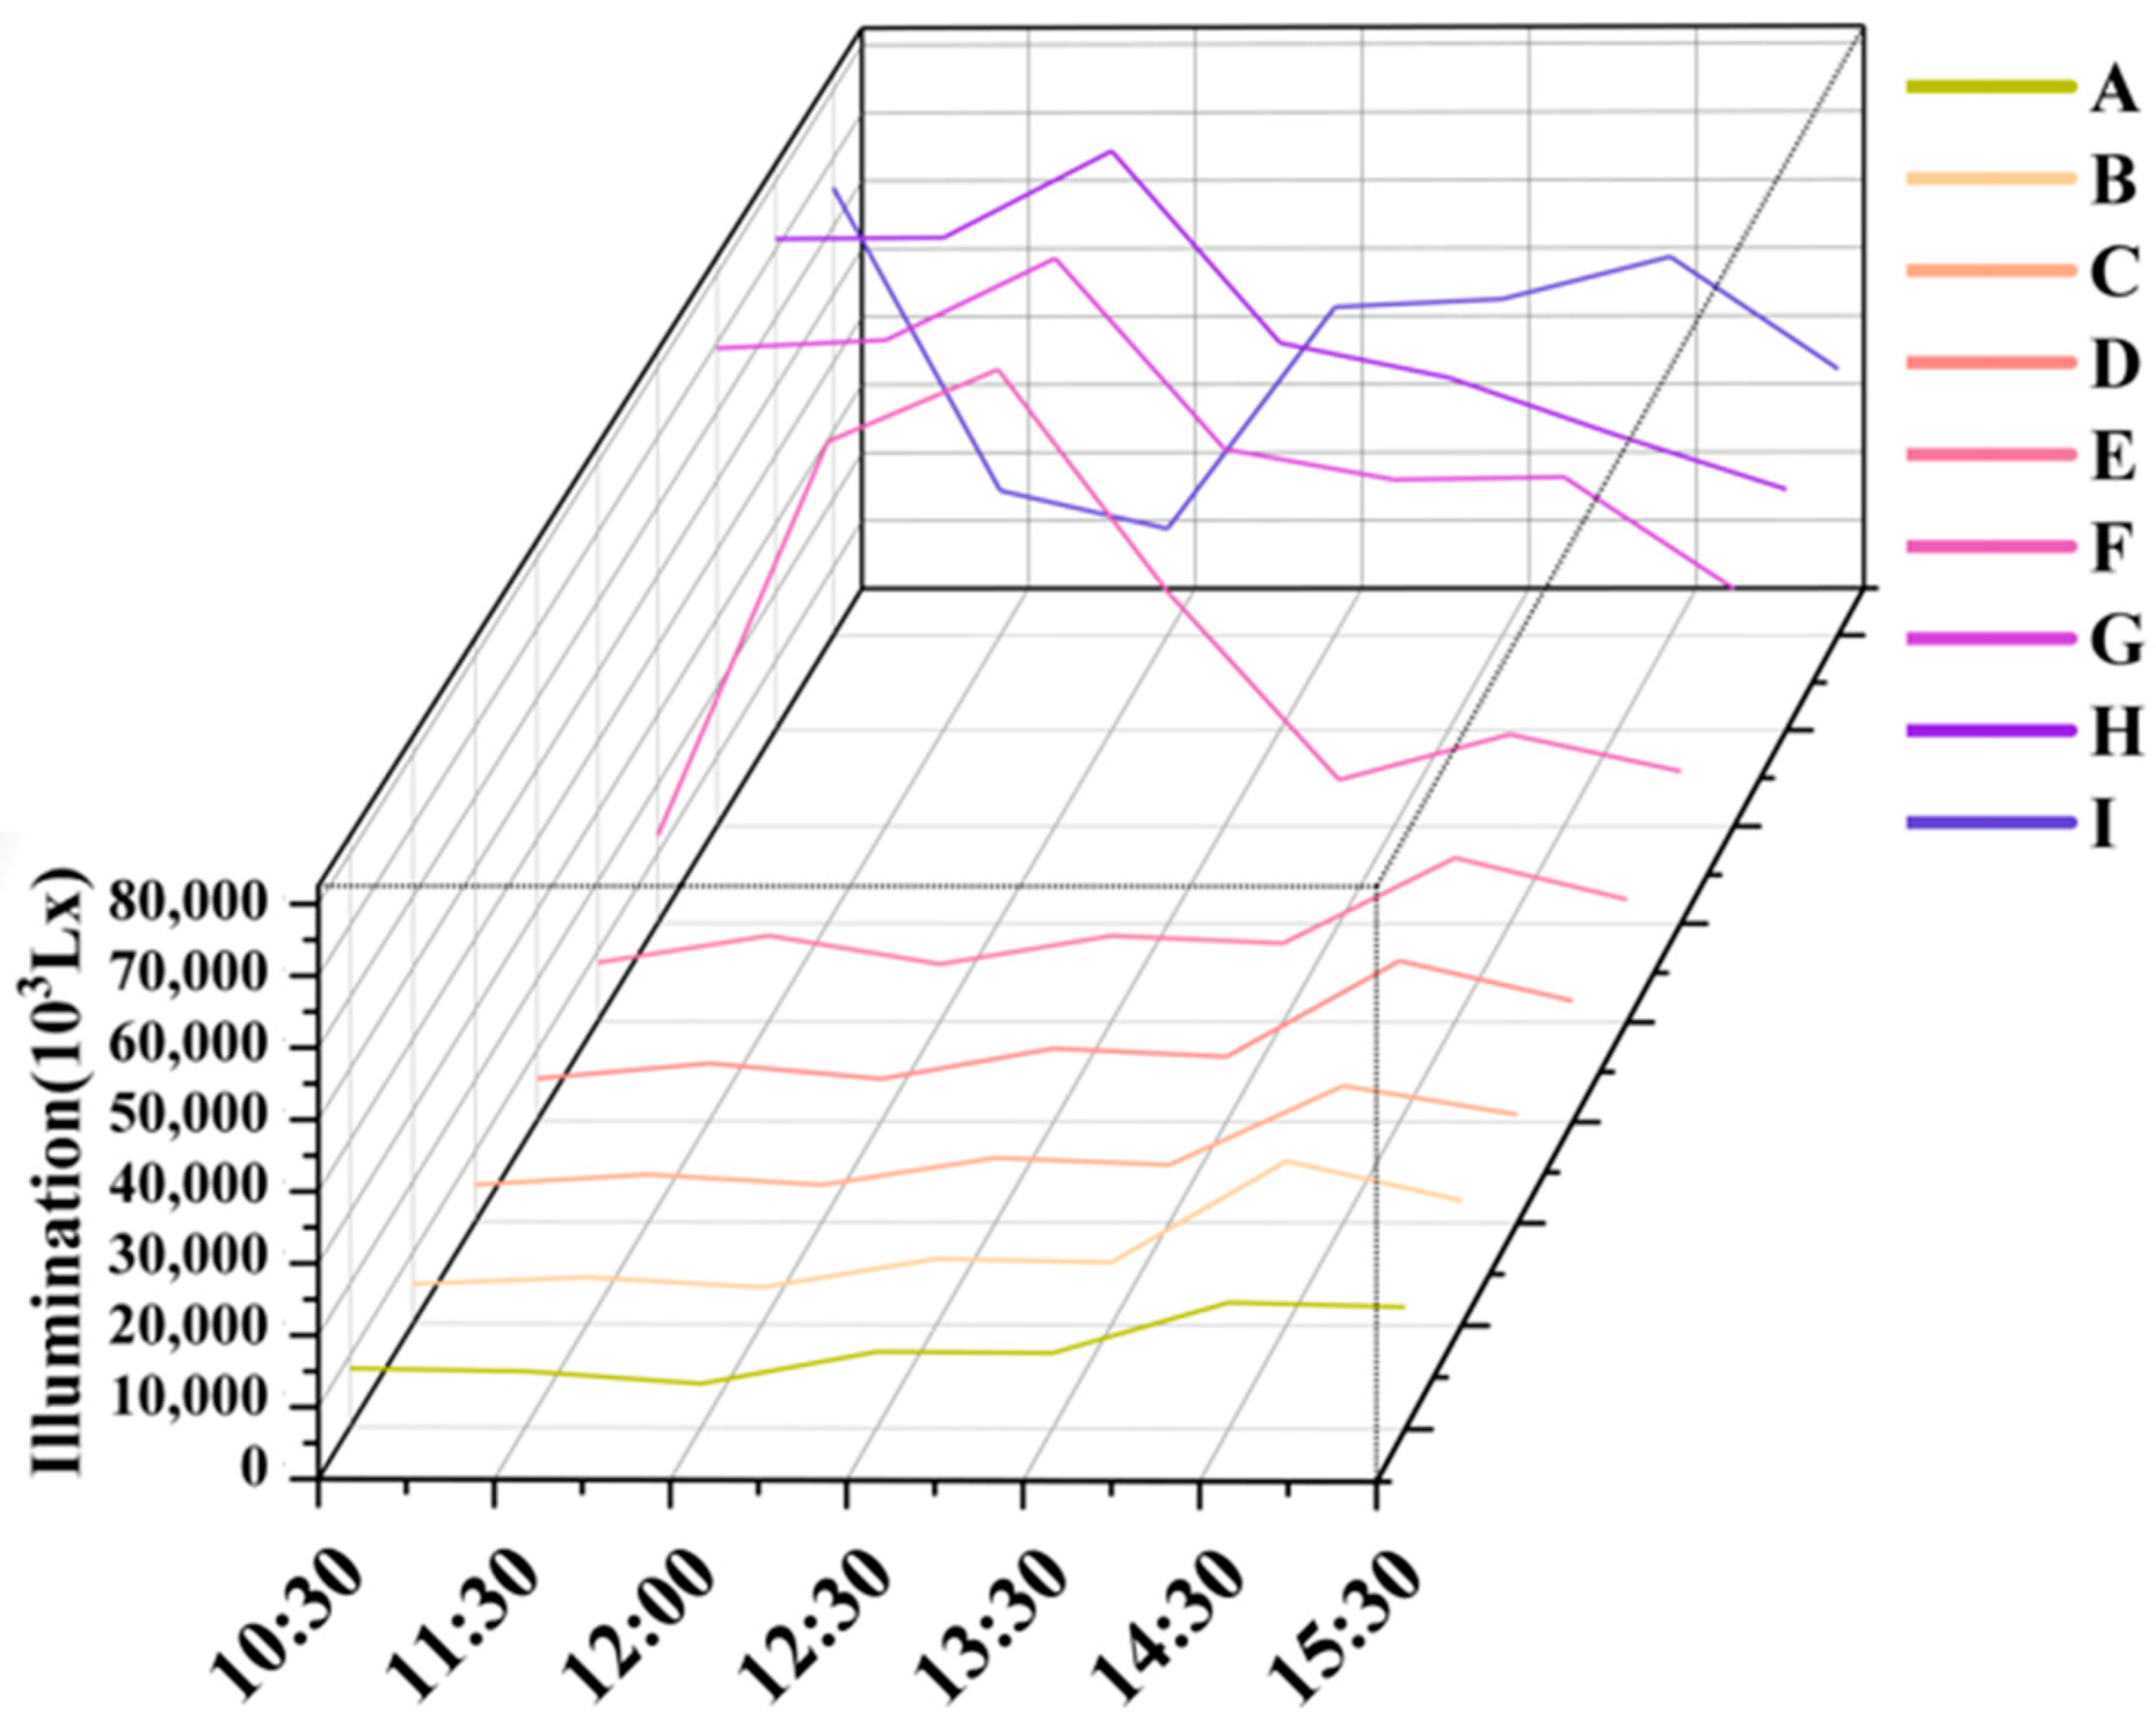
- In the outdoor experiment, the roof inclination angle of the model greenhouse is 12 degrees, and the roof coverage rate is 41.92%. From the experimental results, it is not difficult to see that the light in the greenhouse with the light transmitting component is ordinary glass, the dark band is concentrated in the front end (A, B, C points) area, the bright band is concentrated in the rear end (G, H, I points) area, and the middle (D, E, F points) area belongs to the light and dark junction zone. At noon, when the grating plate is used as the light-transmitting component, the uniformity of the points (A to I) in the north–south direction is the same as in the east–west direction. The light intensity in the front area of the greenhouse is the same as that of the grating group and the glass group. The grating plate can be used as the light transmitting module to reduce the light intensity of the bright belt, improve the light intensity at the intersection of light and dark, and expand the planting area in the PV greenhouse.
- (2)
- When the grating plate is used as the light transmitting module, the light intensity from point G to point I in the greenhouse is greater than 20,000 Lx, and the light environment in other areas is less than 20,000 lx and greater than 5000 Lx, which is suitable for planting shade-loving crops, and the light intensity of the 40-line specification with a thickness of 2 mm can be maximized to improve the light intensity of the greenhouse. At present, the cost of grating plates on the market is about 90–120 CNY per square meter, which is roughly the same as the cost of glass, and there is the possibility of actual production. Why is this specification of grating most suitable for improving indoor lighting? It may be because the diffraction effect brought on by the grating itself leads to an increase in indoor lighting, which is very interesting.
7. Patents
Author Contributions
Funding
Institutional Review Board Statement
Informed Consent Statement
Data Availability Statement
Acknowledgments
Conflicts of Interest
Nomenclature
| U0 | Illumination uniformity |
| Emin | Minimum illumination value |
| Eav | Average illuminance value |
References
- Zhou, C. Dr. Zhou inspected and visited the greenhouse facilities at the Arava scientific research base in Israel. Agric. Eng. Technol. 2016, 36, 65–68. [Google Scholar]
- Lee, J.H.; Hong, E.; Lee, S.I.; Jeong, Y.; Seo, B.H.; Seo, Y.J.; Kim, D.; Kwon, H.-J.; Choi, W. Experimental study for the reproduction of particulate matter deposition on greenhouse plastic films. Biosyst. Eng. 2022, 223, 189–205. [Google Scholar] [CrossRef]
- Peng, Y.; Ma, X.; Wang, Y.; Li, M.; Gao, F.; Zhou, K.; Aemixay, V. Energy performance assessment of photovoltaic greenhouses in summer based on coupled optical-electrical-thermal models and plant growth requirements. Energy Convers. Manag. 2023, 287, 117086. [Google Scholar] [CrossRef]
- Si, Y.; Wang, Y.; Cao, Y.; Si, D. Comprehensive Utilisation and Performance Optimisation of Agro-electricity and Agro-photovoltaic Complementary Systems in Agricultural Production. Trans. Econ. Bus. Manag. Res. 2024, 4, 38–43. [Google Scholar] [CrossRef]
- Singh, R.; Gite, L. Technological Change in Paddy Production: A Comparative Analysis of Traditional and Direct Seeding Methods of Cultivation. AMA-Agric. Mech. Asia Afr. Lat. Am. 2012, 43, 41–46. [Google Scholar]
- Liu, C.; Yang, H.; Lai, M. Evaluation of ecological compensation standards for county PV poverty alleviation in the context of agricultural modernization. J. Agric. Eng. 2020, 36, 300–309. [Google Scholar]
- Semple, L.; Carriveau, R.; Ting, S.K. Assessing heating and cooling demands of closed greenhouse systems in a cold climate. Int. J. Energy Res. 2017, 41, 1903–1913. [Google Scholar] [CrossRef]
- Lee, B.-J. The Illumination Simulation in the Greenhouse using Daylight and Artificial Light for Energy Saving. Trans. Korean Inst. Electr. Eng. 2017, 66, 1359–1363. [Google Scholar] [CrossRef]
- Liu, J.; Wang, B.; Sun, F.; Chen, Y.; Wu, X. Practice and innovation of structural design of multi-building PV vegetable greenhouse in hot zone. Agric. Eng. Technol. 2022, 42, 22–29. [Google Scholar]
- Li, J.; Zuo, S.; Wu, F. The Tianlai Cylinder Pathfinder array: System functions and basic performance analysis. Chin. Sci. Phys. Mech. Astron. Engl. Ed. 2020, 63, 27. [Google Scholar] [CrossRef]
- Zou, Z.; Shao, X. Environmental Engineering in Facility Agriculture; China Agriculture Press: Beijing, China, 2006; p. 19. [Google Scholar]
- Seifert, E. OriginPro9.1: Scientific Data Analysis and GraphingSoftware Software Review. J. Chem. Inf. Model. 2014, 54, 1552. [Google Scholar] [CrossRef]
- Li, H.; Ji, D.; Hu, X. Comprehensive evaluation of combining CFD simulation and entropy weight to predict natural ventilation strategy in a sliding cover solar greenhouse. Int. J. Agric. Biol. Eng. 2021, 14, 213–221. [Google Scholar] [CrossRef]
- Zhang, J.; Shen, K.; Chen, D. Analysis of spatiotemporal changes in canopy characteristic temperature of solar greenhouses based on the Internet of Things. J. Agric. Mach. 2021, 52, 335–342. [Google Scholar]
- Choab, N.; Allouhi, A.; El Maakoul, A. Review on greenhouse microclimate and application: Design parameters, thermal modeling and simulation, climate controlling technologies. Sol. Energy 2019, 191, 109–137. [Google Scholar] [CrossRef]
- Piacentini, R.; García, B.; Micheletti, M.; Salum, G.; Freire, M.; Maya, J.; Mancilla, A.; Crinó, E.; Mandat, D.; Pech, M.; et al. Selection of astrophysical/astronomical/solar sites at the Argentina East Andes range taking into account atmospheric components. Adv. Space Res. Off. J. Comm. Space Res. 2016, 57, 2559–2574. [Google Scholar] [CrossRef]
- Parisi, A.V.; Downs, N.; Igoe, D.; Turner, J. Characterization of cloud cover with a smart phone camera. Instrum. Sci. Technol. Des. Appl. Chem. Biotechnol. Environ. Sci. 2016, 44, 23–34. [Google Scholar] [CrossRef]
- Ayet, A.; Tandeo, P. Nowcasting solar irradiance using an analog method and geostationary satellite images. Sol. Energy 2018, 164, 301–315. [Google Scholar] [CrossRef]
- Zhou, B.; Sun, W.; Guo, W.L. Analysis of the impact of the gutter structure of a multi-span glass greenhouse on the light environment in cultivation areas. J. Agric. Mach. 2021, 52, 286–292. [Google Scholar]
- Giovannini, L.; Goia, F.; Lo, V. A Comparative Analysis of the Visual Comfort Performance between a PCM Glazing and a Conventional Selective Double Glazed Unit. Sustainability 2018, 10, 3579. [Google Scholar] [CrossRef]
- Xu, M.; Bu, X.; Yu, J. Compensation method of cloud infrared radiation interference based on a spinning projectile’s attitude measurement. J. Appl. Remote Sens. 2018, 12, 016031. [Google Scholar] [CrossRef]
- Lindh, U.; Jgerbrand, A.K. Perceived Lighting Uniformity on Pedestrian Roads: From an Architectural Perspective. Energies 2021, 14, 3647. [Google Scholar] [CrossRef]
- Hoda, R. Socio-Technical Grounded Theory for Software Engineering. IEEE Trans. Softw. Eng. 2021, 48, 3808–3832. [Google Scholar] [CrossRef]
- Li, X.; Lu, Z.; Zhou, Q. A Cloud Detection Algorithm with Reduction of Sunlight Interference in Ground-Based Sky Images. Atmosphere 2019, 10, 640. [Google Scholar] [CrossRef]
- Yang, Y.; Chen, Z.; Xu, T. Comparing the Uniformity of Light Glass Fiber Felt Based on Process Improvement, Microstructural Forming Mechanism and Physical Properties; SAGE Publications Sage UK: London, UK, 2019; Volume 17. [Google Scholar] [CrossRef]
- Lopez-Cruz, I.; Efrén, F.; Salazar-Moreno, R. Development and analysis of dynamical mathematical models of greenhouse climate: A review. Eur. J. Hortic. Sci. 2018, 83, 269–279. [Google Scholar] [CrossRef]
- Bubolz, K.; Schenk, H.; Hirsch, T. Influence of spatiotemporally distributed irradiance data input on temperature evolution in parabolic trough solar field simulations. In Proceedings of the SolarPACES: International Conference on Concentrating Solar Power and Chemical Energy Systems, Cape Town, South Africa, 13–16 October 2015. [Google Scholar] [CrossRef]
- Lõhmus, M.; Bowlan, P.; Piksarv, P.; Valtna-Lukner, H.; Trebino, R.; Saari, P. Diffraction of ultrashort optical pulses from circularly symmetric binary phase gratings. Opt. Lett. 2012, 37, 1238–1240. [Google Scholar] [CrossRef]
- Sahin, M.; Oguz, Y.; Buyuktumturk, F. ANN-based estimation of time-dependent energy loss in lighting systems. Energy Build. 2016, 116, 455–467. [Google Scholar] [CrossRef]
- Shaik, S.; Bhardwaj, M.; Agarwal, S. Evaluation of Optical Transmissivity of Transparent Materials on the Performance of Solar Flat Plate Collectors. J. Sol. Energy Eng. 2021, 143, 054501. [Google Scholar] [CrossRef]


| Roof Inclination Angle/° | Point | Translucent Components | Data Acquisition (Time) |
|---|---|---|---|
| 12 | A | Translucent glass: | 10:30 |
| B | 2 mm glass | 11:30 | |
| C | 3 mm glass | 12:00 | |
| D | Grating plate: | 12:30 | |
| E | 20 line/inch 3 mm | 13:30 | |
| F | 30 line/inch 3 mm | 14:30 | |
| G | 25 line/inch 4 mm | ||
| H | 40 line/inch 2 mm | ||
| I |
| Time | 20 Line/Inch 3 mm | A | B | C | D | E | F | G | H | I |
|---|---|---|---|---|---|---|---|---|---|---|
| 10:30 | Average (Lux) | 13,204 | 19,023 | 16,967 | 17,407 | 18,648 | 30,788 | 42,619 | 51,477 | 47,391 |
| Variance | 6540 | 22,226 | 19,731 | 19,084 | 14,952 | 13,310 | 7521 | 5145 | 8753 | |
| Cv | 0.495 | 1.168 | 1.163 | 1.096 | 0.802 | 0.432 | 0.176 | 0.100 | 0.185 | |
| Illumination (%) | 68.27 | 29.86 | 31.12 | 33.93 | 47.29 | 69.89 | 88.47 | 93.12 | 87.35 | |
| 11:30 | Average (Lux) | 9048 | 8280 | 8264 | 9791 | 21,463 | 37,555 | 49,452 | 43,701 | 29,714 |
| Variance | 829 | 2293 | 2334 | 1469 | 7380 | 19,831 | 28,091 | 25,080 | 11,564 | |
| Cv | 0.092 | 0.279 | 0.282 | 0.150 | 0.344 | 0.528 | 0.568 | 0.530 | 0.389 | |
| Illumination (%) | 94.48 | 81.46 | 81.24 | 86.97 | 61.38 | 39.35 | 34.41 | 38.78 | 55.07 | |
| 12:30 | Average (Lux) | 9028 | 8038 | 8154 | 9658 | 18,696 | 36,957 | 53,929 | 52,073 | 32,435 |
| Variance | 691 | 2395 | 2417 | 1724 | 4369 | 17,637 | 30,407 | 29,221 | 14,127 | |
| Cv | 0.077 | 0.298 | 0.296 | 0.178 | 0.234 | 0.477 | 0.564 | 0.542 | 0.436 | |
| Illumination (%) | 94.50 | 79.81 | 81.84 | 89.51 | 75.73 | 45.28 | 35.27 | 37.43 | 50.33 | |
| 13:30 | Average (Lux) | 9658 | 6819 | 6363 | 7419 | 11,937 | 25,959 | 45,146 | 46,941 | 35,807 |
| Variance | 371 | 661 | 623 | 557 | 2081 | 847 | 1631 | 620 | 403 | |
| Cv | 0.038 | 0.097 | 0.098 | 0.075 | 0.174 | 0.033 | 0.036 | 0.012 | 0.011 | |
| Illumination (%) | 97.25 | 90.36 | 94.24 | 95.22 | 80.80 | 96.31 | 96.94 | 98.56 | 98.71 | |
| 14:30 | Average (Lux) | 10,925 | 7501 | 6888 | 7732 | 12,879 | 26,428 | 45,861 | 52,064 | 37,354 |
| Variance | 236 | 672 | 680 | 587 | 2602 | 2088 | 598 | 2253 | 44 | |
| Cv | 0.022 | 0.090 | 0.099 | 0.076 | 0.202 | 0.079 | 0.013 | 0.043 | 0.001 | |
| Illumination (%) | 98.40 | 91.94 | 93.22 | 94.86 | 79.45 | 91.40 | 99.02 | 95.20 | 99.92 |
| Time | 25 Line/Inch 4 mm | A | B | C | D | E | F | G | H | I |
|---|---|---|---|---|---|---|---|---|---|---|
| 10:30 | Average (Lux) | 7396 | 5065 | 4822 | 5164 | 6655 | 22,408 | 54,588 | 62,107 | 50,615 |
| Variance | 355 | 339 | 292 | 612 | 845 | 2064 | 3541 | 2908 | 3423 | |
| Cv | 0.048 | 0.067 | 0.060 | 0.119 | 0.127 | 0.092 | 0.065 | 0.047 | 0.068 | |
| Illumination (%) | 95.54 | 92.42 | 93.06 | 87.17 | 85.35 | 94.28 | 94.56 | 95.85 | 93.81 | |
| 11:30 | Average (Lux) | 8112 | 6979 | 7042 | 8397 | 18,387 | 63,385 | 69,224 | 70,738 | 27,373 |
| Variance | 347 | 800 | 918 | 745 | 1173 | 4378 | 1649 | 2320 | 3084 | |
| Cv | 0.043 | 0.115 | 0.130 | 0.089 | 0.064 | 0.069 | 0.024 | 0.033 | 0.113 | |
| Illumination (%) | 96.59 | 90.7 | 89.51 | 92.99 | 95.94 | 92.03 | 97.35 | 96.22 | 87.24 | |
| 12:30 | Average (Lux) | 9381 | 7627 | 8062 | 9429 | 12,317 | 48,343 | 73,348 | 74,430 | 41,962 |
| Variance | 540 | 468 | 615 | 412 | 755 | 7606 | 8581 | 7972 | 12,486 | |
| Cv | 0.058 | 0.061 | 0.076 | 0.044 | 0.061 | 0.157 | 0.117 | 0.107 | 0.298 | |
| Illumination (%) | 94.52 | 95.11 | 94.92 | 95.22 | 94.04 | 83.84 | 87.28 | 88.4 | 65.64 | |
| 13:30 | Average (Lux) | 10,104 | 9750 | 9164 | 11,042 | 12,616 | 25,106 | 42,049 | 45,063 | 33,875 |
| Variance | 1211 | 4999 | 4936 | 6048 | 2943 | 6374 | 19,338 | 22,079 | 13,807 | |
| Cv | 0.120 | 0.513 | 0.539 | 0.548 | 0.233 | 0.254 | 0.460 | 0.490 | 0.408 | |
| Illumination (%) | 91.56 | 69.21 | 64.09 | 64.40 | 81.90 | 70.71 | 47.25 | 44.30 | 53.65 | |
| 14:30 | Average (Lux) | 12,001 | 20,822 | 13,874 | 12,921 | 12,601 | 30,164 | 50,966 | 53,427 | 44,685 |
| Variance | 2623 | 23,121 | 11,788 | 8119 | 3735 | 9618 | 5415 | 6994 | 3589 | |
| Cv | 0.219 | 1.110 | 0.850 | 0.628 | 0.296 | 0.319 | 0.106 | 0.131 | 0.080 | |
| Illumination (%) | 82.33 | 34.12 | 49.32 | 59.76 | 78.10 | 79.42 | 87.79 | 85.88 | 92.01 |
| Time | 30 Line/Inch 3 mm | A | B | C | D | E | F | G | H | I |
|---|---|---|---|---|---|---|---|---|---|---|
| 10:30 | Average (Lux) | 8011 | 5681 | 5429 | 6154 | 8516 | 21,483 | 40,911 | 53,604 | 43,729 |
| Variance | 623 | 314 | 221 | 369 | 762 | 2041 | 1320 | 810 | 943 | |
| Cv | 0.078 | 0.055 | 0.041 | 0.060 | 0.089 | 0.095 | 0.032 | 0.015 | 0.022 | |
| Illumination (%) | 91.18 | 93.62 | 95.44 | 94.21 | 93.37 | 94.32 | 97.12 | 98.94 | 97.83 | |
| 11:30 | Average (Lux) | 8284 | 7163 | 7400 | 8724 | 18,439 | 45,389 | 59,922 | 59,721 | 28,496 |
| Variance | 32 | 910 | 1243 | 910 | 4871 | 1065 | 3915 | 2257 | 7023 | |
| Cv | 0.004 | 0.127 | 0.168 | 0.104 | 0.264 | 0.023 | 0.065 | 0.038 | 0.246 | |
| Illumination (%) | 99.76 | 92.24 | 88.06 | 93.97 | 74.35 | 97.44 | 92.46 | 95.64 | 74.01 | |
| 12:30 | Average (Lux) | 8766 | 7496 | 7453 | 8850 | 13,514 | 42,574 | 60,516 | 60,966 | 34,265 |
| Variance | 257 | 1370 | 1240 | 1178 | 743 | 4757 | 8019 | 8106 | 5524 | |
| Cv | 0.029 | 0.183 | 0.166 | 0.133 | 0.055 | 0.112 | 0.133 | 0.133 | 0.161 | |
| Illumination (%) | 97.58 | 87.98 | 90.22 | 91.38 | 94.96 | 87.65 | 85.8 | 86.97 | 81.71 | |
| 13:30 | Average (Lux) | 10,004 | 9421 | 9822 | 10,729 | 12,250 | 25,349 | 41,733 | 40,815 | 31,104 |
| Variance | 1007 | 4856 | 5564 | 5299 | 2827 | 6305 | 18,830 | 18,184 | 10,752 | |
| Cv | 0.101 | 0.516 | 0.566 | 0.494 | 0.231 | 0.249 | 0.451 | 0.446 | 0.346 | |
| Illumination (%) | 93.45 | 66.27 | 63.77 | 66.86 | 84.47 | 73.61 | 47.95 | 48.83 | 60.1 | |
| 14:30 | Average (Lux) | 11,645 | 19,694 | 13,903 | 20,654 | 12,680 | 25,656 | 41,968 | 51,813 | 41,898 |
| Variance | 1454 | 21,146 | 11,520 | 21,417 | 3433 | 3852 | 2897 | 4085 | 1971 | |
| Cv | 0.125 | 1.074 | 0.829 | 1.037 | 0.271 | 0.150 | 0.059 | 0.079 | 0.047 | |
| Illumination (%) | 92.41 | 35.91 | 48.63 | 37.28 | 80.91 | 84.56 | 95.57 | 91.14 | 96.06 |
| Time | 40 Line/Inch 2 mm | A | B | C | D | E | F | G | H | I |
|---|---|---|---|---|---|---|---|---|---|---|
| 10:30 | Average (Lux) | 9405 | 11,212 | 12,172 | 9641 | 12,899 | 20,918 | 38,975 | 47,467 | 37,986 |
| Variance | 845 | 8610 | 11,568 | 6609 | 9737 | 2795 | 16,851 | 24,483 | 19,033 | |
| Cv | 0.091 | 0.768 | 0.950 | 0.686 | 0.755 | 0.134 | 0.432 | 0.516 | 0.501 | |
| Illumination (%) | 90.85 | 50.88 | 41.87 | 56.51 | 50.87 | 85.18 | 50.30 | 40.44 | 42.14 | |
| 11:30 | Average (Lux) | 9427 | 8627 | 8439 | 10,027 | 19,644 | 43,479 | 51,796 | 69,087 | 28,332 |
| Variance | 1190 | 2989 | 2872 | 2065 | 5843 | 25,311 | 30,460 | 3758 | 6618 | |
| Cv | 0.126 | 0.346 | 0.340 | 0.206 | 0.297 | 0.582 | 0.588 | 0.054 | 0.234 | |
| Illumination (%) | 91.34 | 78.53 | 78.16 | 86.61 | 66.10 | 32.85 | 32.10 | 94.25 | 73.18 | |
| 12:30 | Average (Lux) | 9503 | 7830 | 7856 | 9000 | 13,836 | 42,032 | 54,445 | 62,260 | 45,913 |
| Variance | 348 | 1001 | 1058 | 655 | 1104 | 4201 | 17,210 | 12,000 | 19,112 | |
| Cv | 0.037 | 0.128 | 0.135 | 0.073 | 0.080 | 0.100 | 0.316 | 0.193 | 0.416 | |
| Illumination (%) | 97.71 | 90.29 | 89.38 | 92.20 | 92.94 | 90.50 | 69.21 | 82.21 | 55.49 | |
| 13:30 | Average (Lux) | 9021 | 6865 | 6417 | 7534 | 11,112 | 32,497 | 52,424 | 53,927 | 37,280 |
| Variance | 428 | 800 | 912 | 655 | 634 | 2331 | 1324 | 1066 | 1625 | |
| Cv | 0.047 | 0.117 | 0.142 | 0.087 | 0.057 | 0.072 | 0.025 | 0.020 | 0.044 | |
| Illumination (%) | 96.76 | 93.04 | 87.64 | 91.52 | 94.55 | 93.54 | 97.31 | 97.84 | 96.26 | |
| 14:30 | Average (Lux) | 12,096 | 8644 | 7912 | 8880 | 11,863 | 27,015 | 51,228 | 53,309 | 43,105 |
| Variance | 832 | 899 | 653 | 684 | 623 | 1454 | 3546 | 4118 | 3685 | |
| Cv | 0.069 | 0.104 | 0.083 | 0.077 | 0.053 | 0.054 | 0.069 | 0.077 | 0.085 | |
| Illumination (%) | 92.34 | 90.60 | 93.81 | 95.33 | 94.91 | 95.22 | 94.57 | 95.50 | 91.58 |
| Time | 2 mm Glass | A | B | C | D | E | F | G | H | I |
|---|---|---|---|---|---|---|---|---|---|---|
| 10:30 | Average (Lux) | 9902 | 9074 | 8832 | 9122 | 10,991 | 14,192 | 52,549 | 54,144 | 52,454 |
| Variance | 628 | 5010 | 5686 | 5235 | 4189 | 2291 | 29,768 | 32,019 | 31,339 | |
| Cv | 0.063 | 0.522 | 0.644 | 0.574 | 0.381 | 0.161 | 0.566 | 0.591 | 0.597 | |
| Illumination (%) | 93.99 | 65.98 | 59.89 | 62.86 | 75.45 | 90.64 | 34.62 | 31.72 | 31.01 | |
| 11:30 | Average (Lux) | 9456 | 8788 | 9121 | 10,278 | 13,611 | 53,302 | 59,227 | 73,413 | 36,486 |
| Variance | 1367 | 2964 | 3416 | 2708 | 346 | 33,545 | 29,411 | 5037 | 23,825 | |
| Cv | 0.145 | 0.337 | 0.375 | 0.263 | 0.025 | 0.629 | 0.497 | 0.069 | 0.653 | |
| Illumination (%) | 91.16 | 78.5 | 76.51 | 84.28 | 97.50 | 28.08 | 42.81 | 93.06 | 48.73 | |
| 12:30 | Average(Lux) | 9793 | 7747 | 7734 | 8933 | 12,144 | 65,639 | 75,127 | 75,470 | 41,387 |
| Variance | 434 | 400 | 791 | 405 | 441 | 2096 | 6677 | 13,279 | 21,467 | |
| Cv | 0.044 | 0.052 | 0.102 | 0.045 | 0.036 | 0.032 | 0.089 | 0.176 | 0.519 | |
| Illumination (%) | 94.97 | 96.91 | 92.75 | 97.03 | 95.86 | 96.79 | 90.76 | 83.68 | 40.41 | |
| 13:30 | Average (Lux) | 9494 | 7467 | 7027 | 7905 | 11,045 | 41,105 | 67,277 | 70,382 | 57,833 |
| Variance | 300 | 663 | 586 | 210 | 326 | 21,427 | 8882 | 7255 | 10,947 | |
| Cv | 0.032 | 0.089 | 0.083 | 0.027 | 0.030 | 0.521 | 0.132 | 0.103 | 0.189 | |
| Illumination (%) | 96.94 | 93.44 | 94.97 | 96.99 | 96.60 | 42.86 | 85.33 | 88.23 | 78.97 | |
| 14:30 | Average (Lux) | 11,773 | 8288 | 7283 | 8085 | 10,378 | 14,806 | 53,669 | 55,271 | 50,436 |
| Variance | 667 | 651 | 561 | 562 | 707 | 915 | 4657 | 3782 | 2368 | |
| Cv | 0.057 | 0.079 | 0.077 | 0.070 | 0.068 | 0.062 | 0.087 | 0.068 | 0.047 | |
| Illumination (%) | 94.77 | 91.89 | 91.11 | 92.19 | 93.22 | 95.10 | 91.45 | 92.38 | 96.20 |
| Time | 3 mm Glass | A | B | C | D | E | F | G | H | I |
|---|---|---|---|---|---|---|---|---|---|---|
| 10:30 | Average (Lux) | 8165 | 5556 | 5200 | 5998 | 8404 | 12,613 | 69,234 | 71,640 | 65,709 |
| Variance | 439 | 380 | 397 | 463 | 110 | 643 | 4043 | 2468 | 510 | |
| Cv | 0.054 | 0.068 | 0.076 | 0.077 | 0.013 | 0.051 | 0.058 | 0.034 | 0.008 | |
| Illumination (%) | 93.93 | 96.01 | 94.71 | 93.46 | 99.10 | 95.32 | 93.36 | 96.47 | 99.40 | |
| 11:30 | Average (Lux) | 7820 | 6548 | 6691 | 8200 | 12,278 | 69,336 | 70,410 | 71,778 | 21,230 |
| Variance | 473 | 527 | 222 | 491 | 1446 | 4832 | 299 | 3039 | 4317 | |
| Cv | 0.060 | 0.0800 | 0.033 | 0.060 | 0.118 | 0.070 | 0.004 | 0.042 | 0.203 | |
| Illumination (%) | 94.76 | 90.96 | 96.24 | 93.52 | 93.10 | 93.04 | 99.52 | 96.29 | 83.32 | |
| 12:30 | Average (Lux) | 10,639 | 9223 | 9104 | 10,371 | 12,292 | 47,526 | 52,557 | 56,379 | 48,093 |
| Variance | 1032 | 2777 | 2676 | 2827 | 727 | 28,626 | 33,213 | 34,108 | 26,582 | |
| Cv | 0.097 | 0.301 | 0.294 | 0.273 | 0.059 | 0.602 | 0.609 | 0.605 | 0.553 | |
| Illumination (%) | 94.15 | 81.45 | 82.24 | 83.67 | 93.61 | 33.56 | 33.61 | 33.59 | 36.9 | |
| 13:30 | Average (Lux) | 10,511 | 8768 | 81.2 | 9220 | 11,238 | 20,650 | 50,111 | 51,299 | 48,239 |
| Variance | 1093 | 3339 | 3201 | 3593 | 1783 | 6321 | 27,683 | 28,179 | 27,861 | |
| Cv | 0.104 | 0.381 | 0.393 | 0.390 | 0.159 | 0.306 | 0.552 | 0.549 | 0.566 | |
| Illumination (%) | 91.42 | 76.30 | 76.20 | 76.97 | 89.80 | 77.44 | 36.36 | 37.09 | 35.00 | |
| 14:30 | Average (Lux) | 17,584 | 22,986 | 19,327 | 22,834 | 23,440 | 27,171 | 50,479 | 42,862 | 55,392 |
| Variance | 9495 | 24,502 | 18,756 | 22,999 | 19,510 | 19,982 | 6235 | 20,472 | 1599 | |
| Cv | 0.540 | 1.066 | 0.970 | 1.007 | 0.832 | 0.735 | 0.124 | 0.478 | 0.092 | |
| Illumination (%) | 68.53 | 38.23 | 42.01 | 39.32 | 48.24 | 55.98 | 87.98 | 44.88 | 96.68 |
Disclaimer/Publisher’s Note: The statements, opinions and data contained in all publications are solely those of the individual author(s) and contributor(s) and not of MDPI and/or the editor(s). MDPI and/or the editor(s) disclaim responsibility for any injury to people or property resulting from any ideas, methods, instructions or products referred to in the content. |
© 2024 by the authors. Licensee MDPI, Basel, Switzerland. This article is an open access article distributed under the terms and conditions of the Creative Commons Attribution (CC BY) license (https://creativecommons.org/licenses/by/4.0/).
Share and Cite
Wang, B.; Si, Y.; Liu, J. Experiment on the Uniformity of Internal Lighting in Zigzag Photovoltaic Greenhouses by Grating Plates. Horticulturae 2024, 10, 323. https://doi.org/10.3390/horticulturae10040323
Wang B, Si Y, Liu J. Experiment on the Uniformity of Internal Lighting in Zigzag Photovoltaic Greenhouses by Grating Plates. Horticulturae. 2024; 10(4):323. https://doi.org/10.3390/horticulturae10040323
Chicago/Turabian StyleWang, Baolong, Yehua Si, and Jian Liu. 2024. "Experiment on the Uniformity of Internal Lighting in Zigzag Photovoltaic Greenhouses by Grating Plates" Horticulturae 10, no. 4: 323. https://doi.org/10.3390/horticulturae10040323
APA StyleWang, B., Si, Y., & Liu, J. (2024). Experiment on the Uniformity of Internal Lighting in Zigzag Photovoltaic Greenhouses by Grating Plates. Horticulturae, 10(4), 323. https://doi.org/10.3390/horticulturae10040323