Article

Non-Destructive Near-Infrared Moisture Detection of Dried Goji (Lycium barbarum L.) Berry

1
College of Mechanical and Electrical Engineering, Henan Agricultural University, Zhengzhou 450002, China
2
Shanxi Jinrongyueheng Science and Trade Limited Company, Taiyuan 030000, China
3
Graduate School of Bioagricultural Sciences, Nagoya University, Furo-Cho, Chikusa, Nagoya 464-8601, Japan
4
College of Mechanical and Electronic Engineering, Northwest A&F University, Yangling, Xianyang 712100, China
*
Author to whom correspondence should be addressed.
Horticulturae 2024, 10(3), 302; https://doi.org/10.3390/horticulturae10030302
Submission received: 15 February 2024 / Revised: 18 March 2024 / Accepted: 19 March 2024 / Published: 20 March 2024
(This article belongs to the Section Fruit Production Systems)

Abstract

:
To detect the moisture of dried Goji (Lycium barbarum L.) berries nondestructively, a near-infrared (NIR) hyperspectral imager was used for experiments. NIR hyperspectral data were obtained and processed by standard normal variate (SNV) calculation using the MATLAB software v.R2016a. On the basis of the actual moisture of dried Goji berries, the predicted moisture was obtained based on the partial least squares (PLS) algorithm and a prediction model for the moisture of dried goji berries was established. It was found that the moisture of dried Goji berries was responsive to the NIR hyperspectral imager. The established prediction model could accurately predict the moisture of dried goji berries, and its R2-value was 0.9981. The results provide a theoretical basis for the design of non-destructive moisture-detecting equipment for dried Goji berries.

1. Introduction

Goji berries, because of their rich nutritional value, such as Lycium barbarum L. (L. barbarum) polysaccharides and phenolics, including caffeic acid, p-coumaric acid, rutin, scopoletin, N-trans-feruloyl tyramine, and N-cis-feruloyl tyramine, have become the world’s favorite medicine and food dual-use product [1,2,3,4]. They have demonstrated their effects on improving renal function and acting against cancer, and are often used in traditional Chinese medicine [3,4,5]. In addition to medicinal uses, they can also be made into food or juice, or used for drinking wine [5]. Goji berries are becoming popular in Europe in snacks, muesli bars, or additives, and hair shampoo. There are few countries and regions in the world that use Goji berries as a cash crop via wild domestication, large-scale cultivation, and comprehensive development and utilization [6,7]. These countries are mainly China and South Korea, and there are a few wild varieties in Japan. Goji berries are drought-tolerant, salt-tolerant, and barren-tolerant, and their agricultural water demand is low. Expanding the planting area of goji berries in Northwest China does not waste valuable land and water resources. On the contrary, it can provide the functions of windbreaking and sand fixation, soil and water conservation, air purification, and other functions, significantly increase the economic income of goji berry growers, and provide a new path for sustainable and healthy agricultural development in arid and desertification areas and stable and continuous income increases for goji berry growers. At the same time, goji berries have infinite inflorescence, their fruits are ovate or oval ovoid berries, and undergo intermittent maturation; that is, flowering and fruiting occur at the same time [8,9]. Goji berries ripen from July to October and can be picked as they ripen. Goji berry harvesting is intermittent, generally once every 5 to 7 days. According to the different harvesting times of Goji berries, they can be divided into summer fruits and autumn fruits. Some researchers have developed a lot of Goji berry-harvesting machines, and the problem of Goji berry harvesting has been alleviated to a certain extent [10,11,12,13,14,15,16,17,18,19,20]. However, the harvested goji berries face the problem of drying.
Dried Goji berries must be completely dried before being sold. If the drying is not thorough, mildew easily forms on the dried Goji berries. Processing is a major factor affecting the quality of fruit in the supply chain [21]. At the same time, the General Administration of Quality Supervision, Inspection and Quarantine of the People’s Republic of China and the Standardization Administration of China jointly issued the National Standard of the People’s Republic of China GB/T18672-2014 “Wolfberry” (2014), which pointed out that the moisture of dried goji berries that reach the grade and above should not be more than 13.0 g/100 g. As for dried goji berries, moisture is a very important indicator, but also a very important biomechanical property. The Agricultural Industry Standard of the People’s Republic of China NY/T2966-2016 “Technical Specifications for Wolfberry Drying” (2016) issued by the Ministry of Agriculture of the People’s Republic of China stated that Goji berries need to be washed with water before drying, dewaxing with no more than 2% food-grade sodium carbonate or sodium bicarbonate aqueous solution, natural leaching. or mechanical air drying. Then, Goji berries should be dried in a hot-air-temperature dryer set at 65 °C. However, the near-infrared (NIR) is sensitive to moisture. Non-destructive NIR detecting has been applied in detecting the internal quality or composition of wood [22] and fruits, like wine grapes [23] and kiwifruits [24,25,26,27,28], and good results have been achieved [22,23,24,25,26,27,28]. The detection accuracy is high and the speed is fast. In addition, moisture is absorbed at 1450 nm and 1930 nm in NIR hyperspectral data, and some researchers have successfully predicted moisture by establishing a prediction model based on a NIR hyperspectral imager. Therefore, the non-destructive NIR moisture detection of dried Goji berries is feasible.
In this study, to detect the moisture content of dried Goji berries nondestructively, a NIR hyperspectral imager was used for the experiments. NIR hyperspectral data were obtained and processed using SNV in the MATLAB software. On the basis of the actual moisture content of dried Goji berries, the predicted moisture content was obtained based on the PLS algorithm and a prediction model for the moisture content of dried Goji berries was established. The results will provide a theoretical basis for the design of non-destructive moisture-detecting equipment for dried Goji berries.

2. Materials and Methods

2.1. Non-Destructive NIR Moisture Experiments on Dried Goji Berries

All experiments were carried out on 15–16 July 2021 at the Near-Infrared Hyperspectral Laboratory, Graduate School of Bioagricultural Sciences, Nagoya University, Furo-cho, Chikusa-ku, Nagoya, Japan. It was very important to ensure that all dried Goji berries were completely dried in the experiments. At the same time, in order to study the NIR hyperspectral characteristics of dried Goji berries under different moisture levels, it was necessary to design different temperature gradients. Therefore, according to the Agricultural Industry Standard of the People’s Republic of China NY/T2966-2016 “Technical Specifications for Wolfberry Drying” (2016) issued by the Ministry of Agriculture of the People’s Republic of China, 250 regular and undamaged Goji berries were selected as the samples to be dried and tested under three gradients of 50 °C, 65 °C, and 80 °C. All Goji berries were processed in strict accordance with the above-mentioned standards. That is, all Goji berries were continuously dried in the dryer for 20 h at the specified temperature. During this time, the moisture of each dried Goji berry was measured every two hours. To be specific, a Mettler balance was used to weigh the berries each time, and the difference between the two times was the moisture content. Then, they were tested with a NIR hyperspectral imager, as shown in Figure 1.
Before the experiments, it was necessary to prepare the NIR hyperspectral imager. First, the NIR hyperspectral imager was preheated and turned on for an hour under a stable-voltage state. Then, the system was configured. Through debugging, when the frequency was selected as 200 Hz and the exposure time was selected as 4.5 ms, dried Goji berries could be observed more clearly. Then, black and white calibration was performed. A black and white grid board was placed in the field of view, leaving enough field of view space. Then, the focal length was adjusted. When the grid could be clearly observed, the focal length was determined to be the focal length in the experiments. Then, the whiteboard calibration was carried out. The whiteboard was placed in the field of view. The relevant parameters were determined under the condition that the brightness was not higher than the maximum threshold and not lower than the visual limit. Finally, the scanning speed was calculated. Through adjustment, it was determined that the size of the field of view was 100 mm in the experiments. According to the size of the field of view and relevant parameters, the pixel size could be calculated as 0.3125 mm/pixel. According to the relationship between frequency and pixel size, the scanning speed could be calculated as 62.5 mm/s, and the parameters were adjusted in the software of the NIR hyperspectral imager. Before the experiments, all dried Goji berries were cleaned and placed on the sample table in a stable state. In the meantime, NIR hyperspectral data of the blackboard and whiteboard should be obtained before the experiments for the subsequent calculation of reflectivity.
After the above operations, the experiments were carried out. In order to ensure that the results were not affected by environmental conditions as much as possible, NIR hyperspectral data of 25 dried Goji berries were obtained at the same time, as shown in Figure 1. In order to obtain zero-moisture dried Goji berries, after each experiment, all dried Goji berries were continuously dried until the moisture content did not change, and they were weighed and their NIR hyperspectral data were obtained.

2.2. Processing of NIR Hyperspectral Data of the Moisture of Dried Goji Berries

In order to construct an accurate prediction model for the moisture content of dried Goji berries, it was necessary to make use of the characteristics of NIR hyperspectral data. Therefore, it was necessary to process NIR hyperspectral data first. Firstly, in the MATLAB software, the invoking function of NIR hyperspectral data for the moisture of dried Goji berries was compiled. In other words, NIR hyperspectral data were obtained by using the Specim_ReadRaw function. As all suffixes of obtained NIR hyperspectral data were .raw, only data with the same suffix were invoked during the invoking process. However, before processing the NIR hyperspectral data, it was necessary to find the segmentation values of the background and dried Goji berries so as to segment dried Goji berries from the background one-by-one and carry out the following processing. Through repeated tests, on the basis of the NIR hyperspectral image of the 30th band of dried Goji berries, it was easy to segment the dried Goji berries from the background. Therefore, the Image_band function was used here to create a new matrix of NIR hyperspectral data. However, as the NIR hyperspectral data were three-dimensional, it was necessary to carry out dimensionality reduction. In the MATLAB software, the reshape function is a function that can transform a specified matrix into a matrix of a specific dimensionality and ensure that the number of elements in the matrix remains unchanged. This function can readjust the numbers of rows, columns, and dimensionalities of a matrix. Using the reshape function for dimensionality reduction could effectively retain the characteristics of NIR hyperspectral data. Here, the reshape function was used to reduce three-dimensional NIR hyperspectral data into two-dimensional NIR hyperspectral data. Then, it was necessary to find the segmentation value of the background and dried Goji berries. Here, a rectangular frame was first used to separate the dried Goji berries from the background, and the Imagesc function was used for imaging in the MATLAB software, as shown in Figure 2. In the MATLAB software, the Imagesc function can convert the value of elements in a matrix into different colors according to its size and stain the corresponding positions of the coordinate axis with this color. This allows for more intuitively observing the size of each element’s numerical value and discovering its boundary value. At the same time, in imaging process, the axis image command was used to lock the coordinates of the image. This could ensure comparison under the same coordinate scale, and it was easier to find the segmentation values for the background and dried Goji berries.
On the basis of finding the segmentation value of the background and dried Goji berries, the NIR hyperspectral data of the 30th band of the dried Goji berries after dimensionality reduction were divided by the segmentation value. A new matrix could be obtained. In the new matrix, the region where the value of every data point was not less than 1 was the region of dried Goji berries, and the region where the value of every data point was less than 1 was the region of the background. Therefore, at this time, the binary processing could separate the dried Goji berries from the background one-by-one. In the MATLAB software, the im2bw function in the DIP toolbox could convert the grayscale image into the binary image using the threshold transform method. Therefore, the im2bw function was used here to binarize the new matrix, and the result was named BW. BW obtained at this time was the area of dried Goji berries. Next, it was necessary to find the number of “1” in BW, that is, to search for the number of “1”. In this way, the area of dried Goji berries could be obtained. In the MATLAB software, the Find function was commonly used to locate a string in the original data to determine its position. In particular, when the Find function located a string, it always started from the specified position and returned the position of the first matching string found, regardless of whether there was a matching string after it, which could prevent the number of “1” from being lost. After obtaining the region of dried Goji berries, the matrix of NIR hyperspectral data of the 30th band for dried Goji berries after binarization was multiplied by the original matrix of the NIR hyperspectral data of the moisture of dried Goji berries. Because the matrix of NIR hyperspectral data of the 30th band for dried Goji berries after the binarization was processed by the dimensionality reduction, it was two-dimensional. However, the original matrix of NIR hyperspectral data of the moisture of dried Goji berries was three-dimensional. In the MATLAB software, it was impossible to multiply these matrices because of the different dimensionalities. Therefore, before multiplication, the matrix of NIR hyperspectral data for the moisture of dried Goji berries after binarization, the dimensionality should be increased first to ensure that it has the same dimensionality. In the MATLAB software, the Repmat function, also known as the repeat matrix function, was mainly used to copy matrices. Its definition format was: B = repmat(A, m, n), where A is the original matrix to be copied, m is the number of rows to be copied, n is the number of columns to be copied, and B is the new obtained matrix to be copied. It was necessary to use the Repmat function to increase the dimensionality of the matrix of NIR hyperspectral data of the 30th band for dried Goji berries after binarization. Because the dimensionality of the obtained matrix after increasing the dimensionality at this time was inconsistent with the original matrix of NIR hyperspectral data of the moisture of dried Goji berries, it was also necessary to transpose the original matrix of NIR hyperspectral data of the moisture of dried Goji berries. In the MATLAB software, the permute function could rearrange the dimensionalities of the matrix in the specified order. Here, the permute function was used to transpose the original matrix. Specifically, the second dimensionality was placed in the position of the original first dimensionality, the third dimensionality was placed in the position of the original second dimensionality, and the first dimensionality was placed in the position of the original third dimensionality. On this basis, the reflectivity was calculated. Specifically, (NIR hyperspectral data of dried Goji berries–NIR hyperspectral data of blackboard)/(NIR hyperspectral data of whiteboard–NIR hyperspectral data of blackboard). At this time, for the matrix of NIR hyperspectral data of the 30th band of dried Goji berries after the transposition, the hyperspectral value of the region of the background was 0. Then, this matrix was multiplied by the original matrix to obtain the matrix of NIR hyperspectral data for the moisture of dried Goji berries. The NIR hyperspectral values of the moisture of dried Goji berries were calculated by the summation. The result was the summation of NIR hyperspectral values. In the MATLAB software, the sum function is one of the most commonly used functions, which can calculate the sum of elements of a vector or matrix. Therefore, the sum function was used here to calculate the sum of NIR hyperspectral values of the moisture of dried Goji berries in each page of 256. Finally, the summation of NIR hyperspectral values was divided by the region of dried Goji berries obtained above. The result was the average NIR hyperspectral data.

3. Results and Discussion

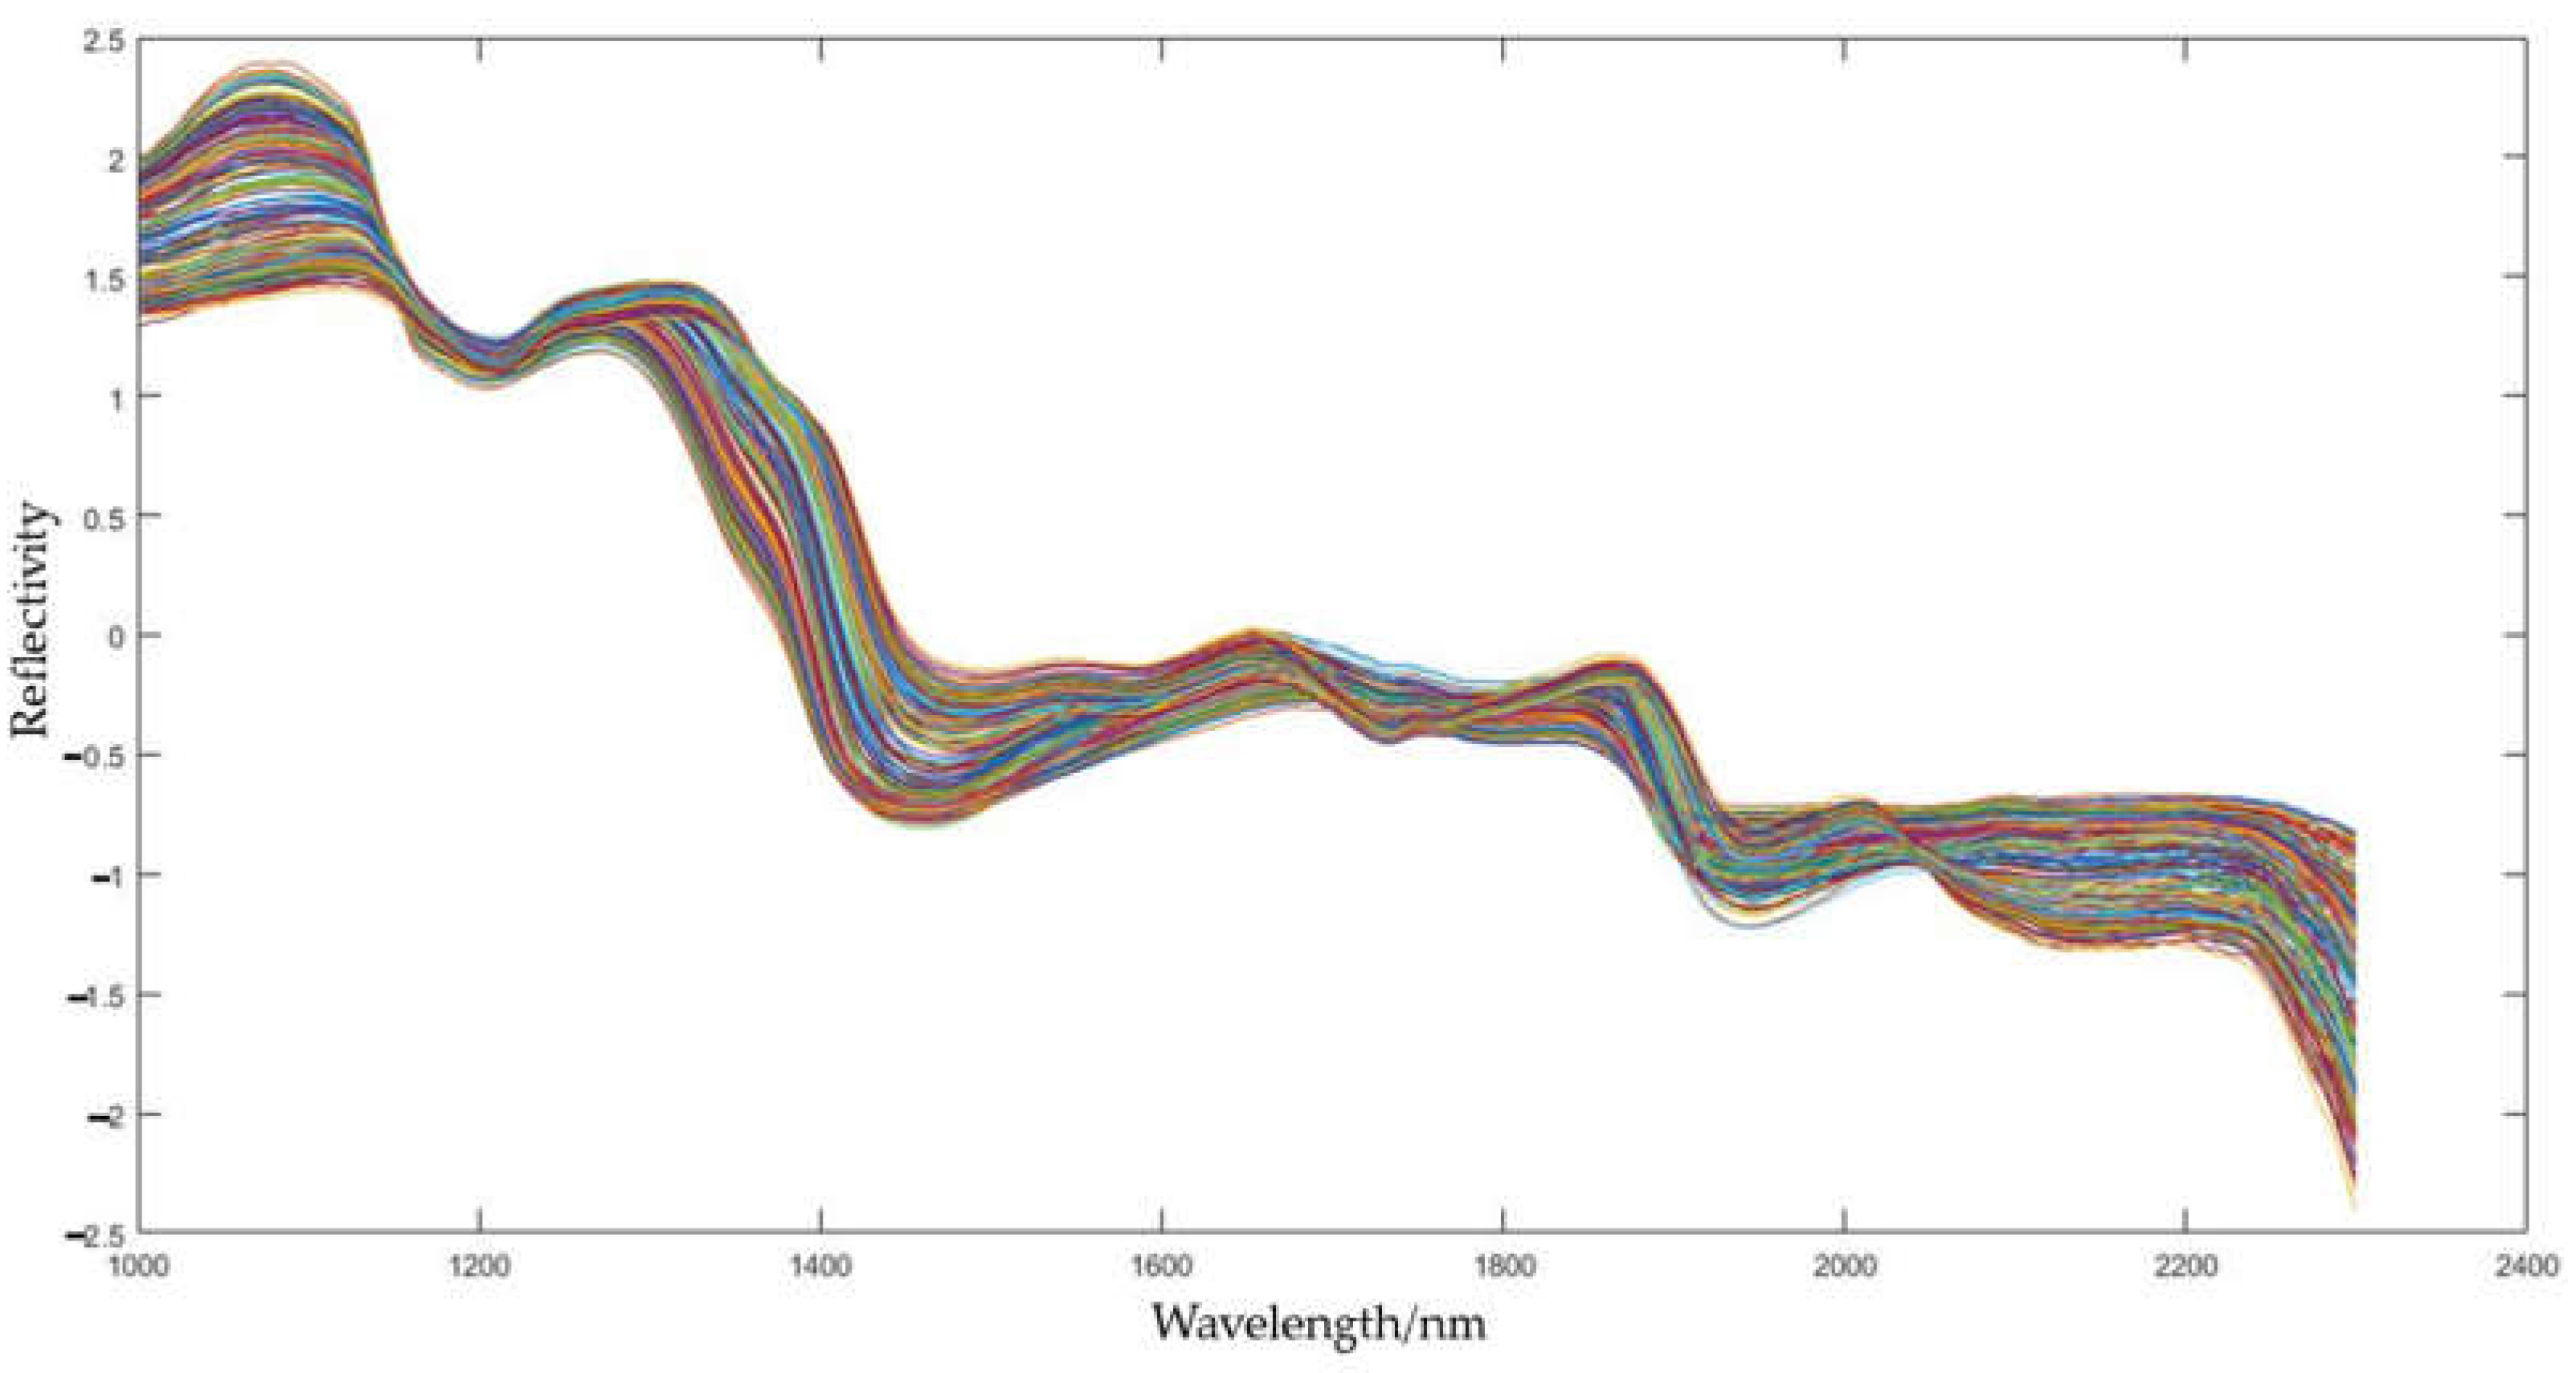
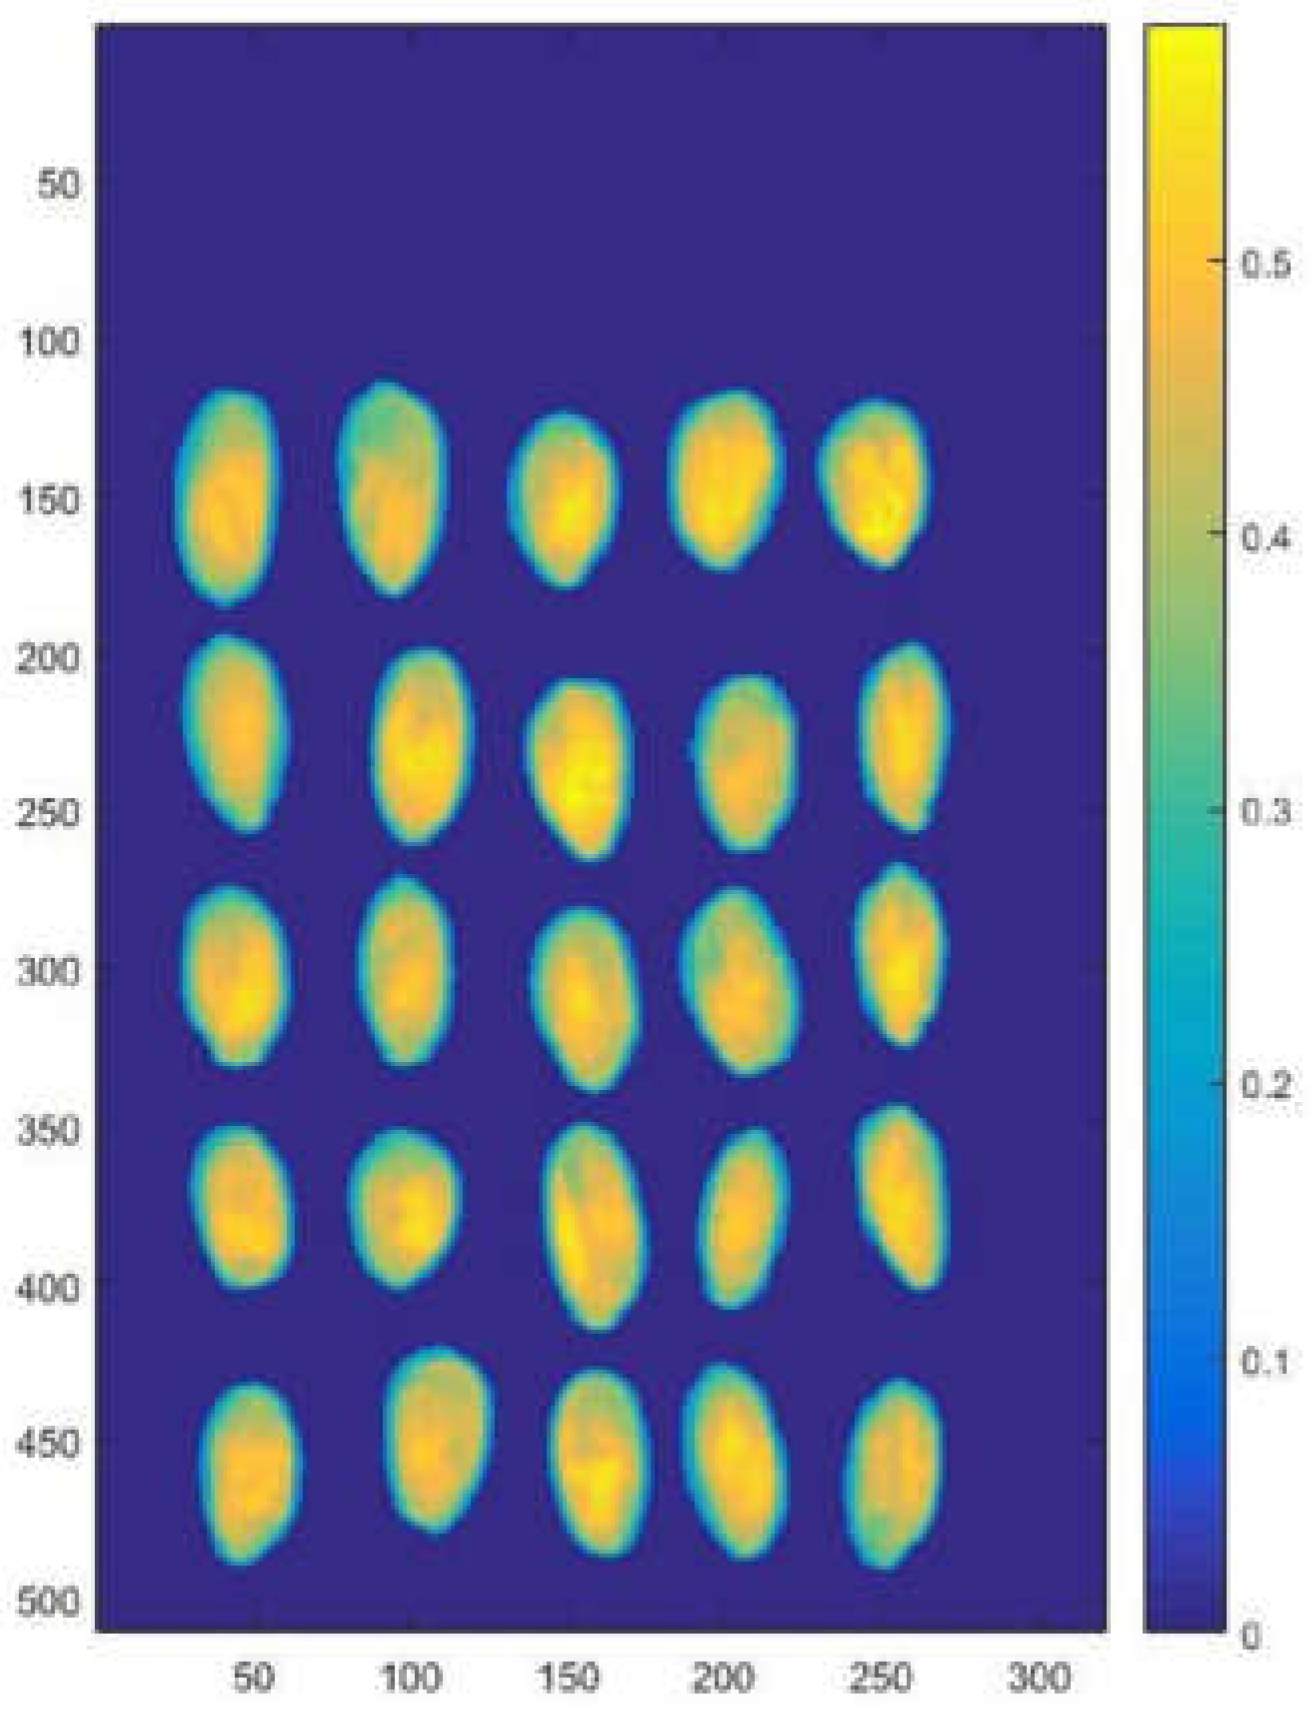
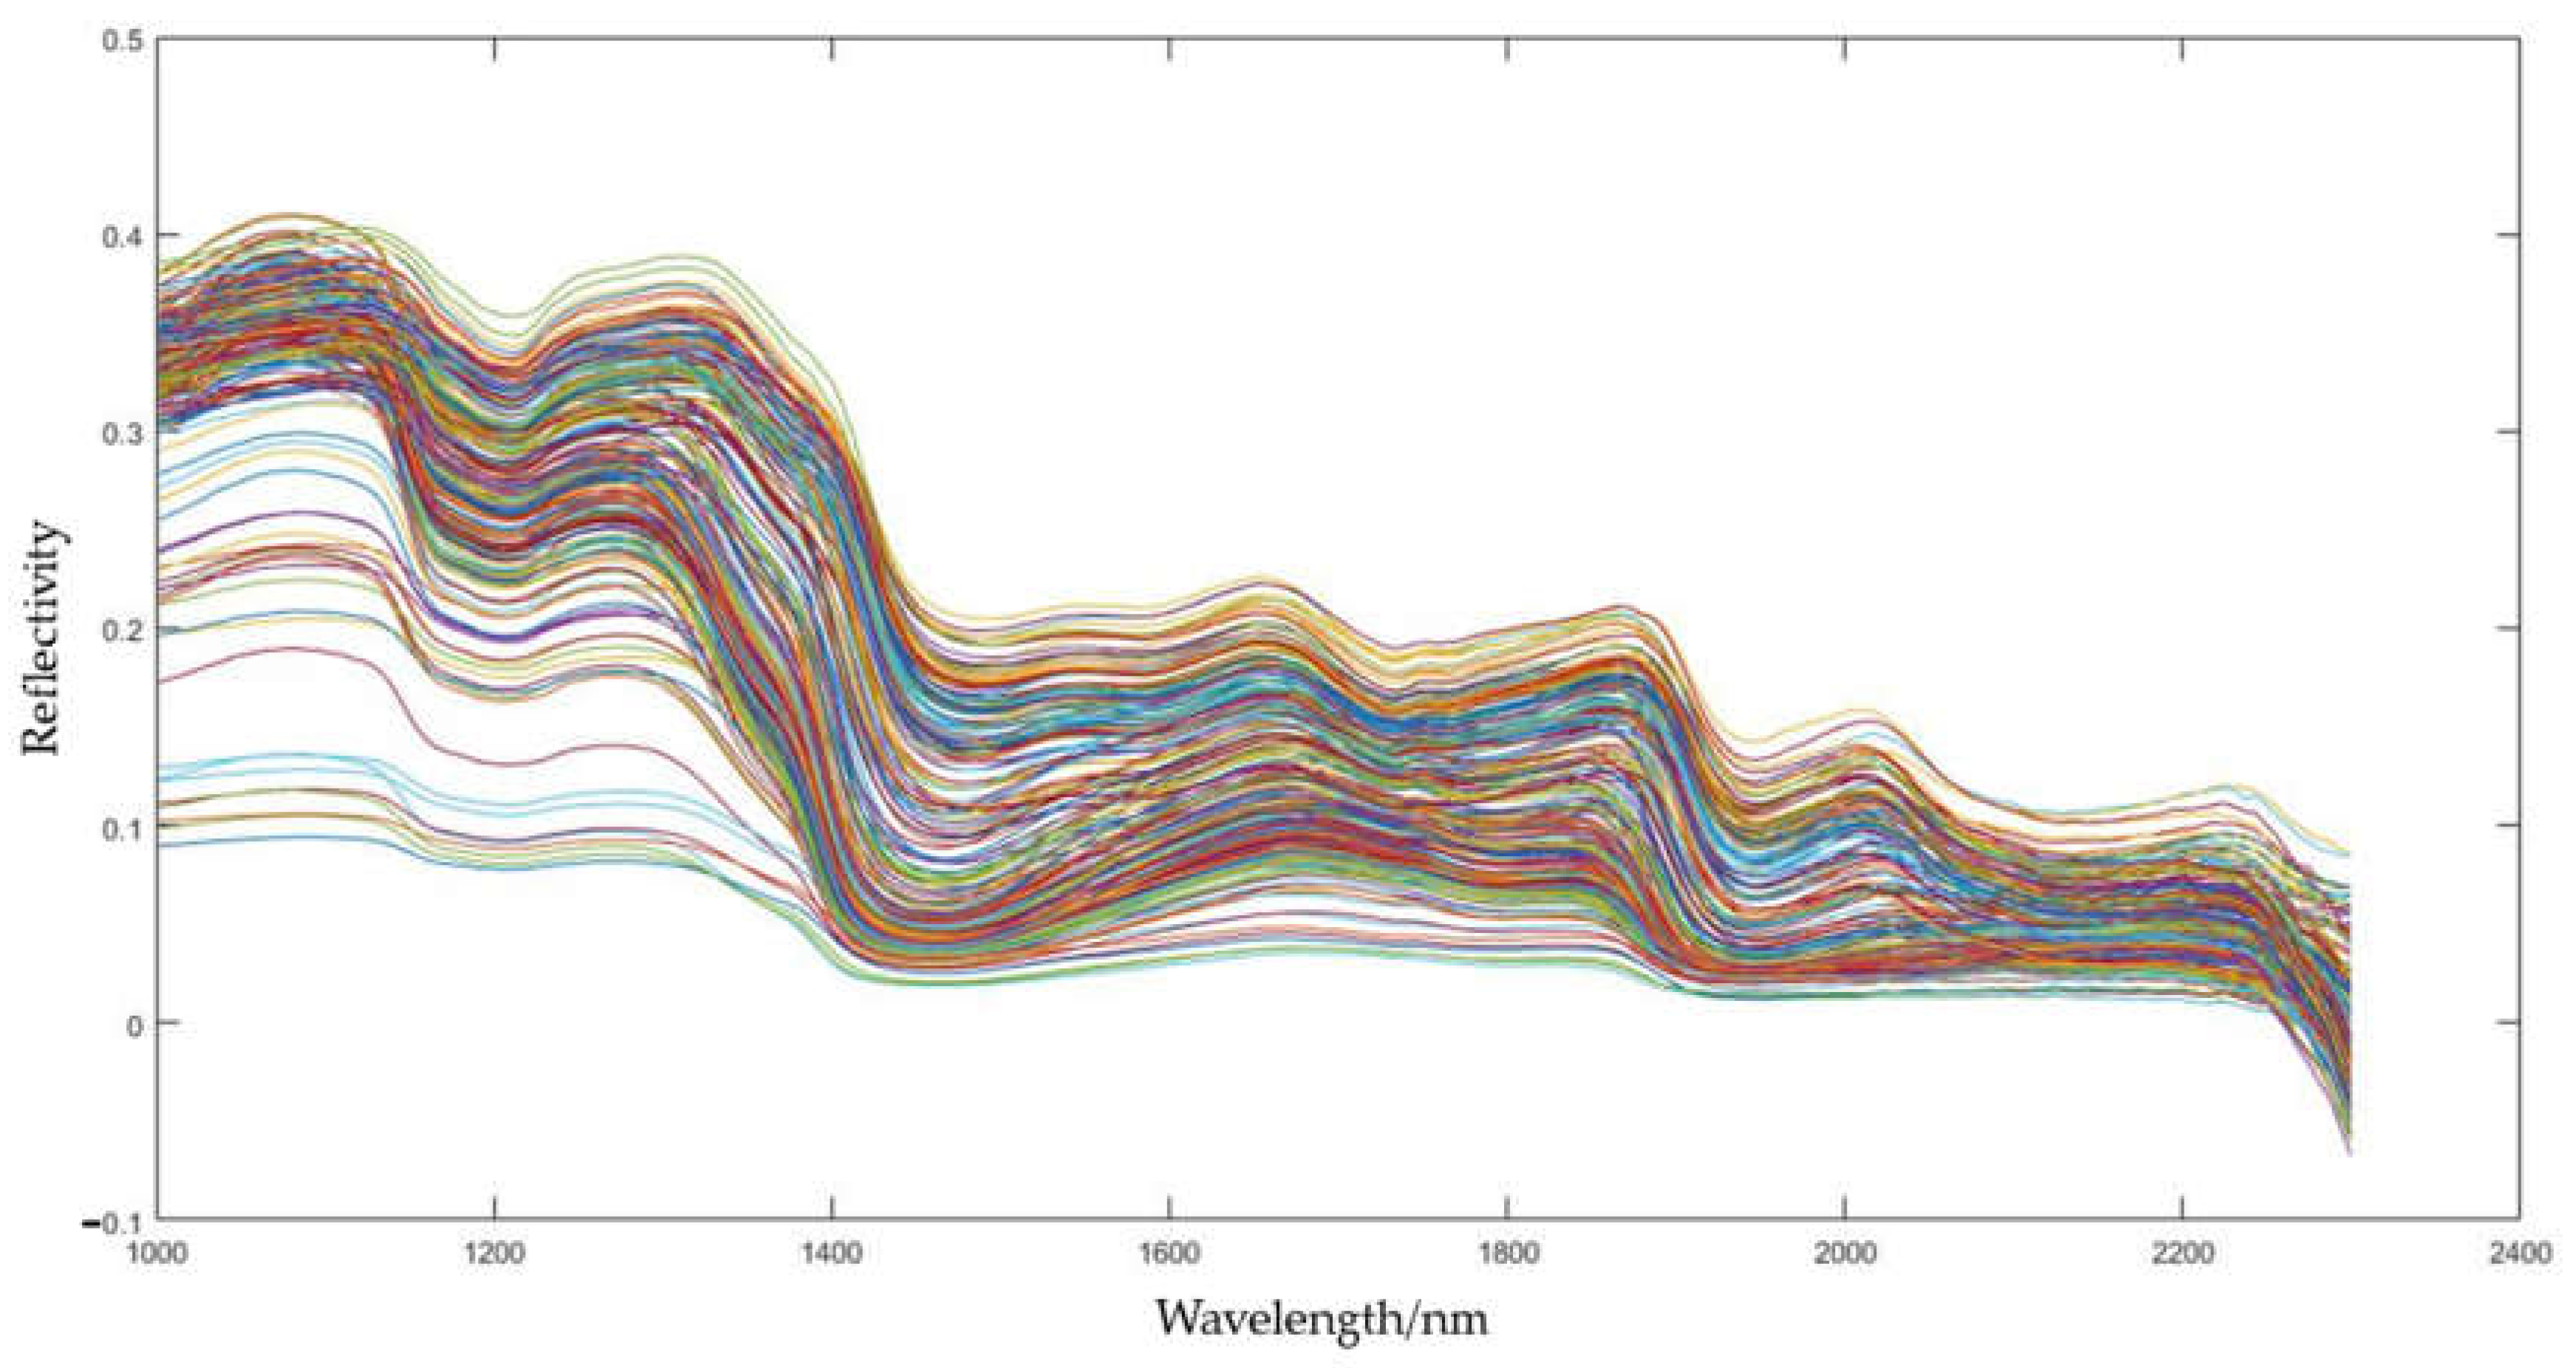
3.1. Analysis of NIR Hyperspectral Data of the Moisture of Dried Goji Berries

On the basis of obtaining average NIR hyperspectral data, an analysis was carried out. Here, average NIR hyperspectral data could be also referred to as the reflectivity. The plot function was used to plot the wavelength as the horizontal coordinate and the reflectivity as the vertical coordinate, as shown in Figure 3.
Different reflectivity values represented the absorption degree of NIR hyperspectral data, and the absorption of the moisture could also be reflected. It could be seen from Figure 3 that the average NIR hyperspectral data had good characteristics, and all dried Goji berries had relatively uniform NIR hyperspectral absorption characteristics. In order to better explore the significant relationship between the average NIR hyperspectral data and the moisture content, the average NIR hyperspectral data needed to be processed. SNV is a common data preprocessing method, which is mainly used to process NIR hyperspectral data. It could center and standardize NIR hyperspectral data, so that NIR hyperspectral data were better comparable and interpretable. Here, the SNV function was used to process the average NIR hyperspectral data. The plot function was used to plot the wavelength as the horizontal coordinate and average NIR hyperspectral data by SNV as the vertical coordinate, as shown in Figure 4. As shown in Figure 4, the NIR hyperspectral data exhibit absorption phenomena at 1450 nm and 1930 nm. This was consistent with the known absorption phenomena of the moisture. This also showed that a NIR hyperspectral imager could be used to detect the moisture content of dried Goji berries.

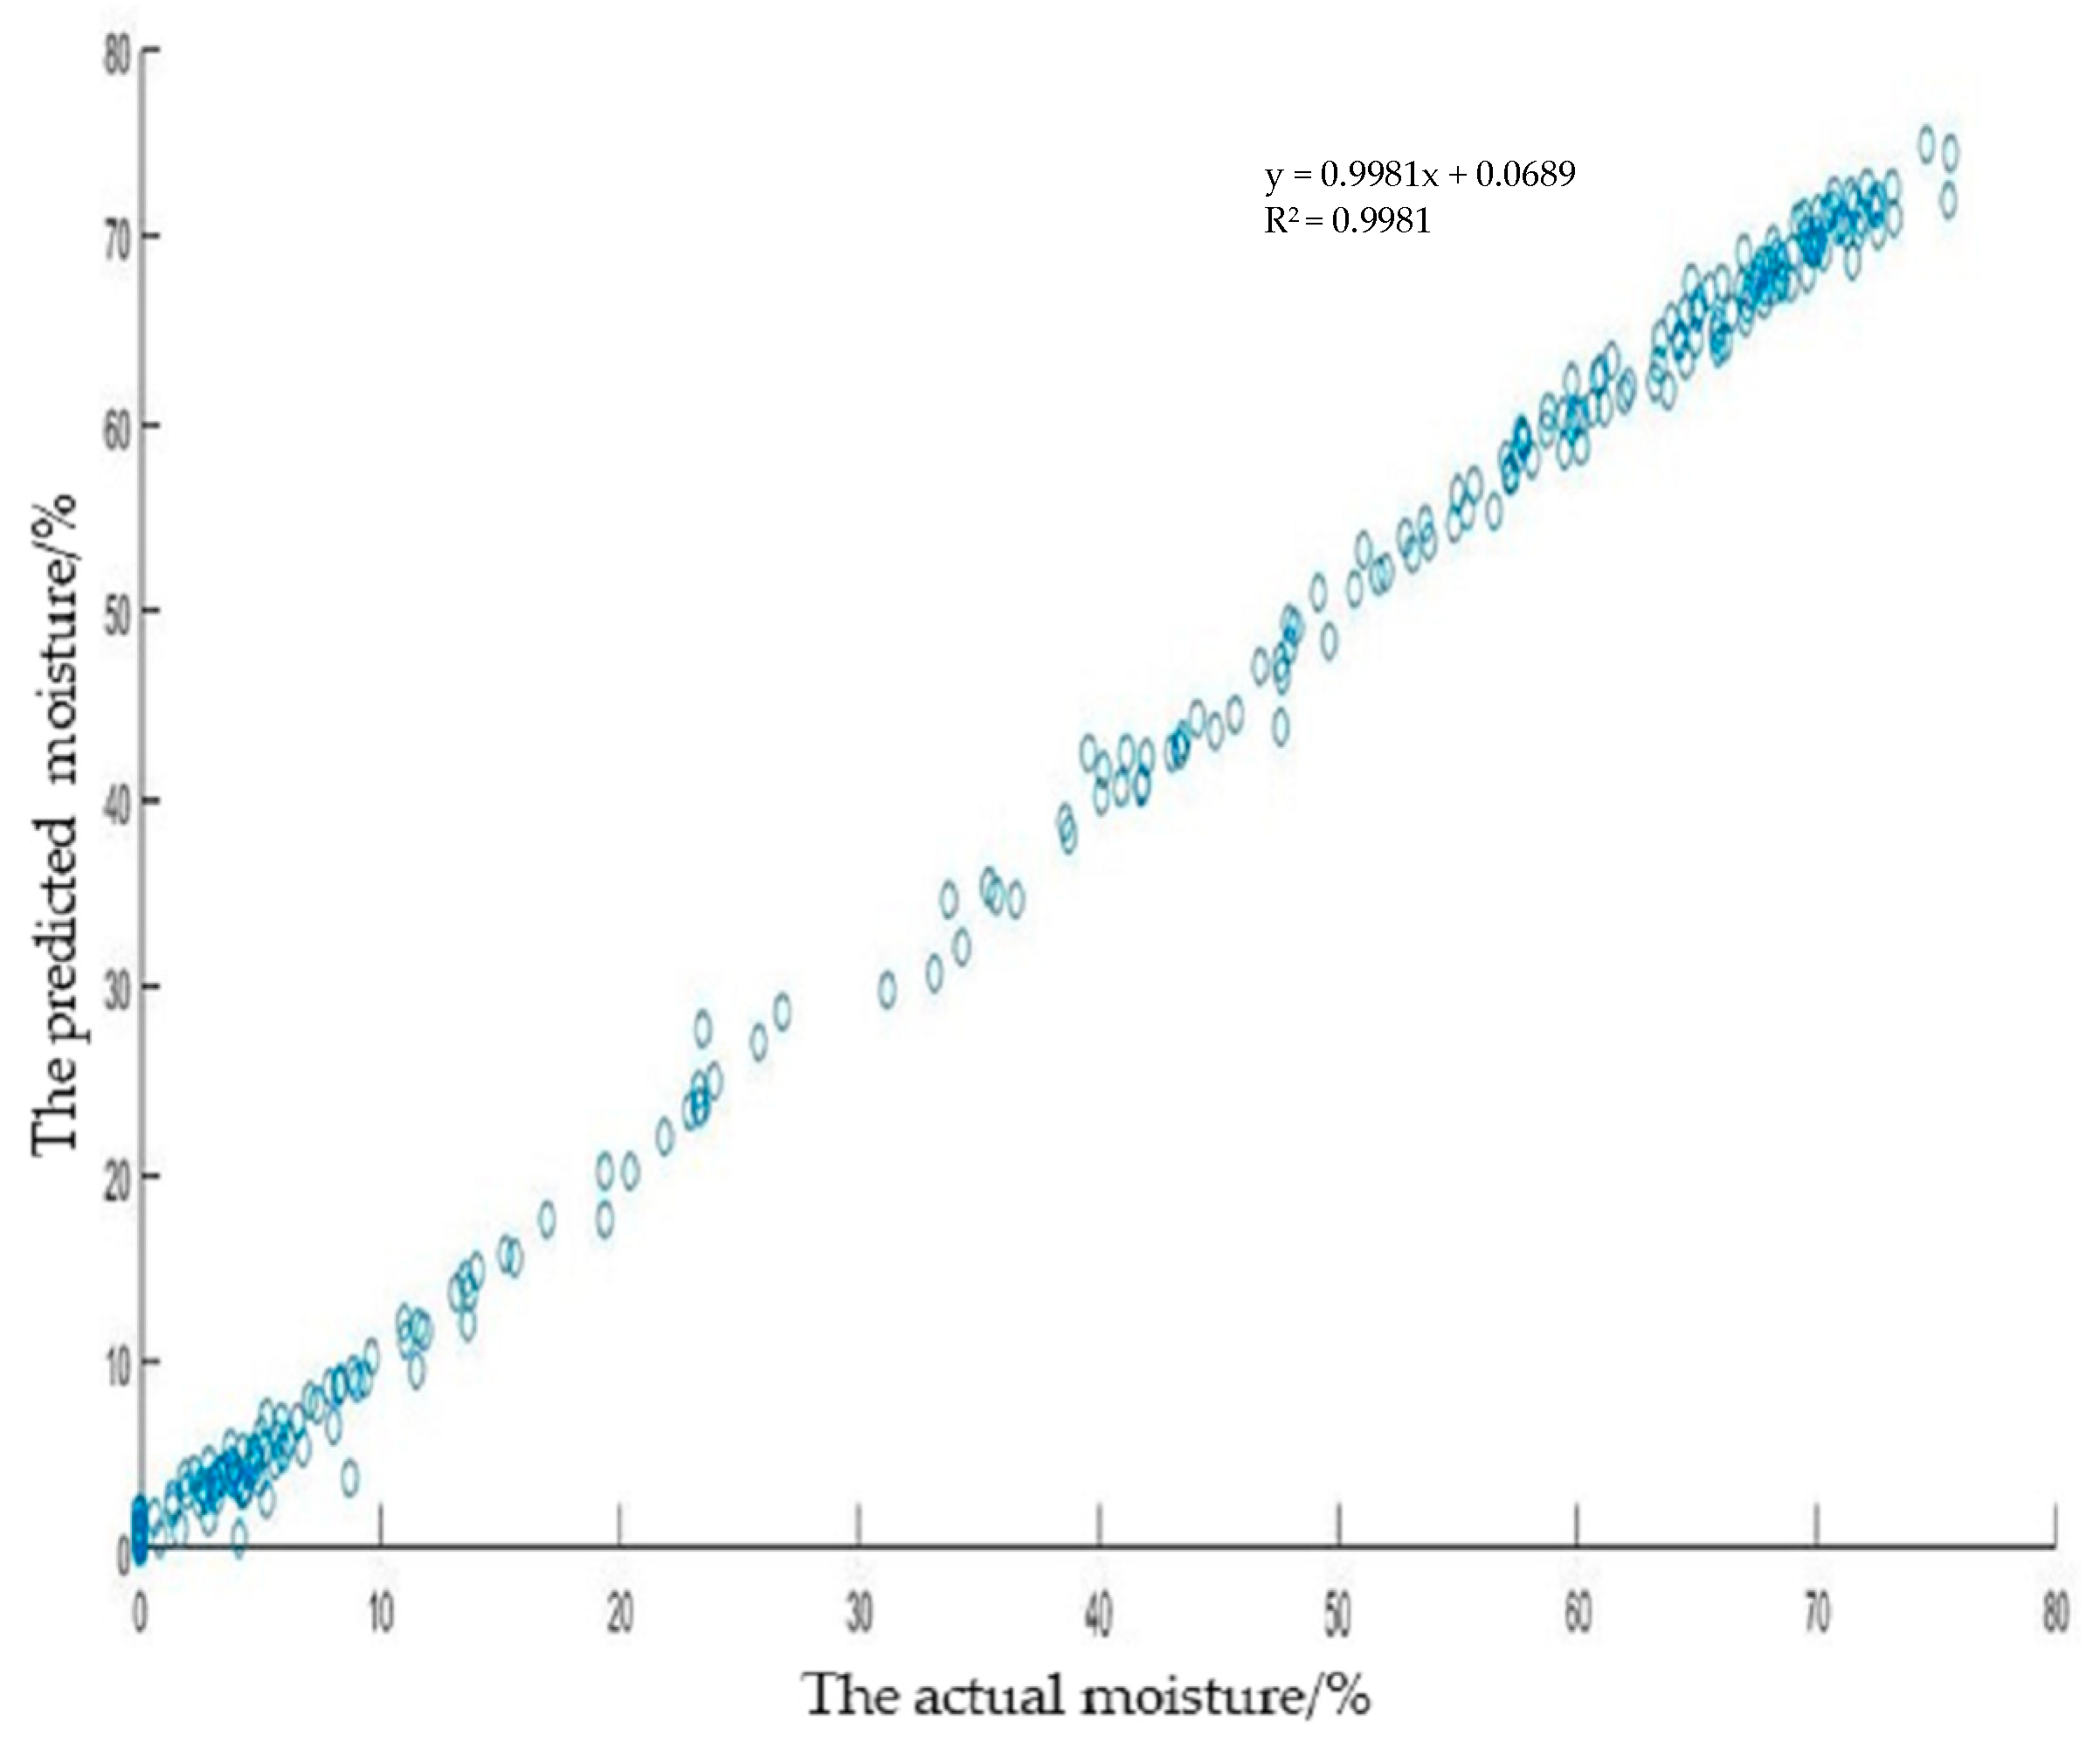
3.2. Establishment of Prediction Model of the Moisture of Dried Goji Berries

The research and development of non-destructive detecting equipment for the moisture content of dried Goji berries was based on the establishment of an accurate prediction model for the moisture content of dried Goji berries. The PLS algorithm is a nonlinear algorithm, generally referred to as the PLS algorithm. It uses the least-squares regression method to fit data by minimizing the residual sum of squares. In previous studies, some researchers used the PLS algorithm to model NIR hyperspectral data and predict the moisture [22]. They achieved good prediction results. In the experiments, NIR hyperspectral data were obtained using a NIR hyperspectral imager, and the corresponding relationship between NIR hyperspectral characteristics and the moisture content was intended to be found in the obtained NIR hyperspectral data. Therefore, the PLS algorithm could be used for the establishment of an accurate prediction model. First, NIR hyperspectral data after SNV were extracted using the MATLAB software. Then, PLS modeling was carried out between NIR hyperspectral data after SNV and the moisture content. It could be known from the program that PLS modeling was conducted between the NIR hyperspectral data after SNV and the moisture content. Since the number of dried Goji berries for the PLS modeling was 250, the PLS parameter was set to 250. In the process of PLS modeling, because BETA was a relational parameter, the coefficient whose first row in BETA was similar to the intercept. It was necessary to create a new Excel sheet and set all the first columns to 1, thus creating a new matrix named Data_original_with_BETA. Then, the moisture content of dried Goji berries was predicted. The predicted moisture was obtained by multiplying the newly created matrix named Data_original_with_BETA by the relational parameter BETA. Finally, the actual and predicted moisture contents of dried Goji berries were processed in the MATLAB software to plot a scatter graph of the actual and predicted moisture contents of dried Goji berries, as shown in Figure 5.
Through statistical software processing, the fitting equation of the prediction model for the moisture content of dried Goji berries was y = 0.9981x + 0.0689, its slope was 0.9981, and its intercept was 0.0689. In the regression model, the existence of the intercept could make the prediction model have better fitting performance. The intercept could adjust the base value of the prediction result and played an important role in linear regression. The intercept directly affected the position of the fitting equation on the vertical coordinate (dependent variable). This was because, when determining the fitting equation of the prediction model, the vertical distance between all data points and the fitting equation was calculated first, that is, the residual. All residuals were squared and were then summed to obtain the sum of squared errors. Then, the slope and intercept of the fitting line were adjusted to minimize the sum of the squared errors. Finally, after several iterations, the slope and intercept of the best-fitting equation were obtained. If the intercept was positive, then, when the independent variable was 0, the predicted value of the dependent variable would be high. If the intercept was negative, then the predicted value of the dependent variable would be low. In the prediction model of the moisture of dried Goji berries established in the experiments, the intercept was 0.0689. However, the absolute value of 0.0689 was very small, which indicated that the prediction model was very effective in fitting the equation; that is, the predicted moisture content was very close to the actual moisture content.
In the experiments, the good and bad parts of the prediction model should to be evaluated by the fitting degree test. The fitting degree test was conducted to test the prediction model that had been developed and compare the degree of agreement between the prediction results and actual results. The commonly used fitting degree test method was R2 (R-squared). R2, also known as the decision coefficient, is a measure used to assess how well a linear regression model fits. Specifically, the R2 value represents the proportion of the total variation in the dependent variable that is explained by the model, and can also be understood as how well the model fits the actual data. It typically ranges from 0 to 1, with a higher value indicating a better fit and a value of 1 indicating a perfect fit. In general, if a linear regression model has an R2 value close to 1, it means that the model can explain most of the variance in the data, that is, the model is relatively reliable. If the R2-value is small, it means that the model cannot explain the changes in the data well, and it is necessary to change the model or find other variables to further improve the explanatory power of the model. In general, the R2 value was between 0 and 1, and the larger the value, the better the model fit. In general, if the R2 value is greater than 0.8, the model fits the data very well. If the R2 value is between 0.6 and 0.8, the model has a good fit. If the R2 value is between 0.4 and 0.6, the model has a moderate fit. If the R2 value is less than 0.4, the model has a poor fit. It should be noted that the R2 value is only suitable for models with linear relationships, and it would give incorrect results for nonlinear problems. In addition, the R2 value does not prove causation, and sometimes a high R2 value might only indicate that there is a common influence between two related variables. To sum up, as an indicator of linear regression model evaluation, the R2 value could help us to understand the degree of fit of the model, but it was necessary to comprehensively evaluate the model in conjunction with other indicators in actual analysis. In the experiments, the fitting equation of the prediction model of the moisture content of dried Goji berries was y = 0.9981x + 0.0689, which was linear. Through the fitting degree test, its R2 value was 0.9981, indicating that the prediction model perfectly fitted the actual results.
It was found that the moisture of dried Goji berries was responsive to the NIR hyperspectral imager. The established prediction model of the moisture content of dried Goji berries could accurately predict the moisture content.

4. Conclusions

In this study, to detect the moisture content of dried Goji berries nondestructively, a NIR hyperspectral imager was used for the experiments. NIR hyperspectral data were obtained and processed in the MATLAB software by SNV. On the basis of the actual moisture content of dried Goji berries, the predicted moisture content was obtained based on the PLS algorithm and a prediction model for the moisture of dried Goji berries was established. It was found that the moisture content of dried Goji berries was responsive to the NIR hyperspectral imager. The established prediction model could accurately predict the moisture content of dried Goji berries and its R2 value was 0.9981. Compared with manually observing whether dried Goji berries are completely dried, the accuracy of this detection method is high and the speed is fast. Because the price of dried Goji berries is very high, this detection can avoid very large economic losses for industrial food production. The results provide a theoretical basis for the design of non-destructive moisture detection equipment for dried Goji berries.

Author Contributions

Conceptualization, R.K., S.T., J.C. and G.C.; methodology, T.M., T.I. and J.Z.; software, R.K., J.Z. and D.L.; validation, T.M. and J.Z.; resources, G.C.; writing—original draft preparation, R.K.; writing—review and editing, S.T., J.C. and G.C.; funding acquisition, J.C. and G.C. All authors have read and agreed to the published version of the manuscript.

Funding

This research and APC were funded by the National Natural Science Foundation of China, grant number 32272001; Henan Province Postdoctoral Funding Project, grant number 307923; and Henan Agricultural University High-level Talent Project, grant number 30501381.

Data Availability Statement

The data presented in this study are available on request from the corresponding author. The data are not publicly available due to privacy.

Conflicts of Interest

Rui Kang is employed by the Shanxi Jinrongyueheng Science and Trade Limited Company. The authors declare no conflicts of interest.

References

  1. Forino, M.; Tartaglione, L.; Dell’Aversano, C.; Ciminiello, P. NMR-based identification of the phenolic profile of fruits of Lycium barbarum (goji berries). Isolation and structural determination of a novel N-feruloyl tyramine dimer as the most abundant antioxidant polyphenol of goji berries. Food Chem. 2016, 194, 1254–1259. [Google Scholar] [CrossRef] [PubMed]
  2. Po, K.K.; Leung, J.W.; Chan, J.N.; Fung, T.K.; Sánchez-Vidaña, D.I.; Sin, E.L.; So, K.; Lau, B.W.; Siu, A.M. Protective effect of Lycium Barbarum polysaccharides on dextromethorphan-induced mood impairment and neurogenesis suppression. Brain Res. Bull. 2017, 134, 10–17. [Google Scholar] [CrossRef] [PubMed]
  3. Ceccarini, M.R.; Vannini, S.; Cataldi, S.; Moretti, M.; Villarini, M.; Fioretti, B.; Albi, E.; Beccari, T.; Codini, M. Effect of Lycium barbarum berries cultivated in Umbria (Italy) on human hepatocellular carcinoma cells. J. Biotechnol. 2016, 231S, S26–S27. [Google Scholar] [CrossRef]
  4. Zhao, Q.; Li, J.; Yan, J.; Liu, S.; Guo, Y.; Chen, D.; Luo, Q. Lycium barbarum polysaccharides ameliorates renal injury and inflammatory reaction in alloxan-induced diabetic nephropathy rabbits. Life Sci. 2016, 157, 82–90. [Google Scholar] [CrossRef] [PubMed]
  5. Amagase, H.; Farnsworth, N.R. A review of botanical characteristics, phytochemistry, clinical relevance in efficacy and safety of Lycium barbarum fruit (Goji). Food Res. Int. 2011, 44, 1702–1717. [Google Scholar] [CrossRef]
  6. Ma, Y.; Zhang, W.; Qureshi, W.S.; Gao, C.; Zhang, C.; Li, W. Autonomous navigation for a wolfberry picking robot using visual cues and fuzzy control. Inf. Process. Agric. 2021, 8, 15–26. [Google Scholar] [CrossRef]
  7. Zhao, J.; Sugirbay, A.; Chen, Y.; Zhang, S.; Liu, F.; Bu, L.; Chen, Y.; Wang, Z.; Chen, J. FEM explicit dynamics simulation and NIR hyperspectral reflectance imaging for determination of impact bruises of Lycium barbarum L. Postharvest Biol. Technol. 2019, 155, 102–110. [Google Scholar] [CrossRef]
  8. Zhao, J.; Chen, J. Detecting maturity in fresh Lycium barbarum L. fruit using color information. Horticulturae 2021, 7, 108. [Google Scholar] [CrossRef]
  9. Xu, L.; Chen, J.; Wu, G.; Yuan, Q.; Ma, S.; Yu, C.; Duan, Z.; Xing, J.; Liu, X. Design and operating parameter optimization of comb brush vibratory harvesting device for wolfberry. Trans. CSAE 2018, 34, 75–82. [Google Scholar] [CrossRef]
  10. Wang, Y. Research on Key Technology of Wolfberry Vibration Harvest. Master’s Thesis, Northwest A&F University, Yangling, China, 2018. [Google Scholar]
  11. Zhao, J.; Ma, T.; Inagaki, T.; Chen, Y.; Hu, G.; Wang, Z.; Chen, Q.; Gao, Z.; Zhou, J.; Wang, M.; et al. Parameter optimization of vibrating and comb-brushing harvesting of Lycium barbarum L. based on FEM and RSM. Horticulturae 2021, 7, 286. [Google Scholar] [CrossRef]
  12. Li, Q.; Ye, L.; An, W. The suitable working of Wolfberry harvest machine. J. Agric. Mech. Res. 2009, 31, 126–128. [Google Scholar] [CrossRef]
  13. Wang, J.; Mei, S.; Xiao, H.; Zhao, Y.; Zhou, H. Research on mechanized harvesting methods of Lycium barbarum fruit. IFAC-PapersOnLine 2018, 51, 223–226. [Google Scholar] [CrossRef]
  14. Zhou, B.; He, J. Design of simulate hand wolfberry picking machine. Trans. CSAE 2010, 26 (Suppl. S1), 13–17. [Google Scholar]
  15. So, J.D. Vibration characteristics of boxthorn (Lycium chinense Mill) branches. Appl. Eng. Agric. 2001, 17, 755–760. [Google Scholar] [CrossRef]
  16. So, J.D. Vibratory harvesting machine for boxthorn (Lycium chinense Mill) berries. Trans. ASAE 2003, 46, 211–221. [Google Scholar] [CrossRef]
  17. Zhang, Z.; Xiao, H.; Ding, W.; Mei, S. Machanism simulation analysis and prototype experiment of Lycium barbarum harvest by vibration mode. Trans. CSAE 2015, 31, 20–28. [Google Scholar] [CrossRef]
  18. Zhang, W.; Zhang, M.; Zhang, J.; Li, W. Design and experiment of vibrating wolfberry harvester. Trans. CSAM 2018, 49, 97–102. [Google Scholar] [CrossRef]
  19. He, M.; Kan, Z.; Li, C.; Wang, L.; Yang, L.; Wang, Z. Mechanism analysis and experiment on vibration harvesting of wolfberry. Trans. CSAE 2017, 33, 47–53. [Google Scholar] [CrossRef]
  20. Zhang, W.; Li, Z.; Tan, Y.; Li, W. Optimal design and experiment on variable pacing combing brush picking device for Lycium barbarum. Trans. CSAM 2018, 49, 83–90. [Google Scholar] [CrossRef]
  21. Rodjanatham, T.; Rabgyal, T. Quality assurance of international fruit supply chains via techno-management. Agriculture 2020, 10, 107. [Google Scholar] [CrossRef]
  22. Ma, T.; Morita, G.; Inagaki, T.; Tsuchikawa, S. Moisture transport dynamics in wood during drying studied by long-wave near-infrared hyperspectral imaging. Cellulose 2022, 29, 133–145. [Google Scholar] [CrossRef]
  23. Cheng, Y.; Yang, S.; Liu, X.; Zhang, E.; Song, Z. Identification of wine grape varieties based on near-infrared hyperspectral imaging. Appl. Eng. Agric. 2019, 35, 959–967. [Google Scholar] [CrossRef]
  24. Ciccoritti, R.; Paliotta, M.; Amoriello, T.; Carbone, K. FT-NIR spectroscopy and multivariate classification strategies for the postharvest quality of green-fleshed kiwifruit varieties. Sci. Hortic. 2019, 257, 108622. [Google Scholar] [CrossRef]
  25. Fu, X.; Ying, Y.; Lu, H.; Xu, H.; Yu, H. FT-NIR diffuse reflectance spectroscopy for kiwifruit firmness detection. Sens. Instrum. Food Qual. Saf. 2007, 1, 29–35. [Google Scholar] [CrossRef]
  26. McGlone, V.A.; Clark, C.J.; Jordan, R.B. Comparing density and VNIR methods for predicting quality parameters of yellow-fleshed kiwifruit (Actinidia chinensis). Postharvest Biol. Technol. 2007, 46, 1–9. [Google Scholar] [CrossRef]
  27. Moghimi, A.; Aghkhani, M.H.; Sazgarnia, A.; Sarmad, M. Vis/NIR spectroscopy and chemometrics for the prediction of soluble solids content and acidity (pH) of kiwifruit. Biosyst. Eng. 2010, 106, 295–302. [Google Scholar] [CrossRef]
  28. Santagapita, P.R.; Tylewicz, U.; Panarese, V.; Rocculi, P.; Dalla Rosa, M. Nondestructive assessment of kiwifruit physico-chemical parameters to optimise the osmotic dehydration process: A study on FT-NIR spectroscopy. Biosyst. Eng. 2016, 142, 101–109. [Google Scholar] [CrossRef]
Figure 1. NIR hyperspectral imager.
Horticulturae 10 00302 g001
Figure 2. NIR hyperspectral image of dried Goji berries.
Horticulturae 10 00302 g002
Figure 3. Average NIR hyperspectral data.
Horticulturae 10 00302 g003
Figure 4. Average NIR hyperspectral data by SNV.
Horticulturae 10 00302 g004
Figure 5. Scatter graph of the actual and predicted moisture of dried Goji berries.
Horticulturae 10 00302 g005
Disclaimer/Publisher’s Note: The statements, opinions and data contained in all publications are solely those of the individual author(s) and contributor(s) and not of MDPI and/or the editor(s). MDPI and/or the editor(s) disclaim responsibility for any injury to people or property resulting from any ideas, methods, instructions or products referred to in the content.

