Article

Seed Morphological Analysis in Species of Vitis and Relatives

by
José Javier Martín-Gómez
1,
José Luis Rodríguez-Lorenzo
2,
Diego Gutiérrez del Pozo
3,
Félix Cabello Sáez de Santamaría
4,
Gregorio Muñoz-Organero
4,
Ángel Tocino
5 and
Emilio Cervantes
1,*
1
Instituto de Recursos Naturales y Agrobiología, Consejo Superior de Investigaciones Científicas, Cordel de Merinas 40, 37008 Salamanca, Spain
2
Plant Developmental Genetics, Institute of Biophysics v.v.i, Academy of Sciences of the Czech Republic, Královopolská 135, 612 65 Brno, Czech Republic
3
Herbario Amazónico del Ecuador ECUAMZ, Universidad Estatal Amazónica, Carretera Tena a Puyo Km. 44, Carlos Julio Arosemena Tola 150950, Ecuador
4
Finca El Encín, Instituto Madrileño de Investigación y Desarrollo Rural Agrario y Alimentario (IMIDRA), Autovía de Aragón Km, 38.2, Alcalá de Henares, 28800 Madrid, Spain
5
Departamento de Matemáticas, Facultad de Ciencias, Universidad de Salamanca, Plaza de la Merced 1-4, 37008 Salamanca, Spain
*
Author to whom correspondence should be addressed.
Horticulturae 2024, 10(3), 285; https://doi.org/10.3390/horticulturae10030285
Submission received: 19 February 2024 / Revised: 4 March 2024 / Accepted: 8 March 2024 / Published: 16 March 2024
(This article belongs to the Section Propagation and Seeds)

Abstract

:
Seed shape descriptions of species of Vitis have traditionally been based on adjectives comparing overall shape with geometric figures, such as oval, elongated oval, and pear-shaped, corresponding to higher values of the Stummer index (lower aspect ratio) for oval, and lower values of the Stummer index for pear shape (or elongated seeds, with a higher aspect ratio). Analytical, quantitative descriptions of shape have recently been applied to diverse genera of Vitaceae and cultivated varieties of Vitis. Here, we present the application of three quantitative methods to the seed shape description of ten species of the genus Vitis and three species of related genera (Ampelopsis, Cissus and Parthenocissus). First, general seed shape was described through comparisons using geometric models. For this, the average silhouettes of representative seed populations were used as models for shape quantification. Two additional quantitative methods were based on the measurement of bilateral symmetry and curvature analysis in the apex. Quantitative methods for shape description based on similarity with the models give an accurate account of the relationships between Vitis species. The resulting dendrogram is like the dendrogram obtained from a combined analysis using the data from general measurements and curvature and symmetry analyses. The original methods presented here for seed morphology are useful for analyzing the phylogenetic relationships between species of Vitis.

1. Introduction

Grapevines are economically important fruit crops produced from hundreds of varieties traditionally cultured worldwide and belonging to the genus Vitis L. (Vitaceae Juss.), which comprises eighty-one species of climbers and shrubs of wide distribution in America, Africa, Asia and Europe [1,2,3,4,5]. Although the European varieties of Vitis vinifera L. were traditionally considered to proceed from the domestication of V. vinifera subsp. (or var.) sylvestris, recent work presents a more complex panorama, with most of the wild European specimens of grapevines belonging to a complex group of foreign invader taxa, including true and hybrid species of V. riparia Michx., V. rupestris Scheele, V. berlandieri Planch. and others [6,7,8], whose rootstocks, mostly coming from North America, were used as graftstock to defend the European grapevine against the phylloxera disease that invaded European cultures in the late decades of the 19th century [6,7,8].
The morphological description of Vitis seeds may contribute to the taxonomy of species in this genus, as well as to the description of its varieties. As for other plant species, seed morphology has relied traditionally on diverse measurements as well as on the qualitative appreciation of overall seed shape based on adjectives reflecting similarity with geometric forms, such as cordate, globose, oval, pear-shaped, rounded, squat or triangular [9,10,11,12,13,14,15,16], assuming generally smaller and more rounded seeds in wild specimens and more elongated, pear-shaped seeds in cultivated varieties [17]. Quantitative analytical methods include those based on the Fourier transform [18,19,20,21,22,23], and also the direct comparison with reference images, and to this end, a series of geometric models have been applied for the seeds in the Vitaceae [24,25], and more specific models have been adjusted to define seed shape in varieties of Vitis representative of the biodiversity in the Spanish germplasm collection stored at the Instituto Madrileño de Investigación Agraria y Desarrollo Rural, Agrario y Alimentario (IMIDRA), Finca “El Encin”, Alcalá de Henares, Madrid [25].
In addition to overall seed shape description, other quantitative aspects in the analysis of seed morphology comprise the measurement of symmetry and curvature in the apex. Both aspects have been recently applied to seeds of representative species of the Cucurbitaceae [26]. The curvature of a plane curve is a magnitude that measures the rate at which the tangent line turns per unit distance moved along the curve. To determine curvature in the curve formed by the image of a natural organ, such as the root or the seed apex, first, Bézier curves are obtained, representing the corresponding silhouettes. Curvature was measured in the root apex of Arabidopsis Heinh. (Brassicaceae), showing reduced values in ethylene-insensitive mutants (etr1-1 and ein2-1) [27], as well as under hydrogen peroxide treatment [28]. In addition, curvature analysis allowed for the differentiation of morphotypes in wheat kernels [29] and the definition of three groups of seeds in cultivated grapevine varieties, depending on the shape of the seed apex [30]. While in most cultivars, the seed apex is plane, others have an acute seed apex, with a single maximum of curvature, or intermediate types. The variation found in curvature types, together with the similarity to models, may contribute to the establishment of relationships in the taxonomy of Vitis. Increases in the sizes of berries and seeds, a consequence of the process of domestication, are accompanied by increased carbohydrate accumulation, cuticle deposition and seed thickening, resulting in a broader seed apex. The original methods reported here for seed morphological analysis can be an interesting complement in the description, identification, and classification of the species of the genus in the study of phylogenetic relationships between the species and varieties of Vitis, which are currently being investigated via molecular analysis.

2. Materials and Methods

2.1. Seeds of Vitis Species and Relatives

Table 1 presents a list of the species analyzed in this work. These include Ampelopsis aconitifolia Bunge, Cissus verticillata (L.) Nicolson and C.E. Jarvis, Parthenocissus quinquefolia (L.) Planch, nine species of Vitis L. and the hybrid Vitis x doaniana Munson ex Viala, resulting from the cross V. acerifolia × V. mustangensis [5]. Seeds were obtained from plants grown at IMIDRA, except for Cissus verticillata. Seeds of C. verticillata were collected at Pastaza (Ecuador) in disturbed areas and, after being photographed, the seeds were returned to the wild.

2.2. Photography

Photographs were captured using a Sony ILCE 5100 digital camera equipped with an AF-S Micro NIKKOR 60 mm 1:2.8 G ED objective (Nikon, Tokio, Japan). They were organized in groups of 20 seeds per species as JPEG images (300 ppp). Color photographs were converted to grayscale silhouettes and kept as images of 20 seeds per species for the analyses of general morphological characters and symmetry, and comparison with models. Both the seed images and silhouettes are available in Zenodo (See Supplementary Materials).

2.3. General Morphological Descriptors

Photographs were used to derive data on seed area (A), perimeter (P), length of the major axis (L), length of the minor axis (W), aspect ratio (AR is the ratio L/W), circularity (C), roundness (R), and solidity (S). These measurements were conducted using the Image J program (version v1.8.0) [32]. The seeds were vertically oriented, with length and width corresponding, respectively, with the vertical and horizontal Feret diameters. Feret, or caliper diameters, are the distances between two parallel planes restricting the object. The circularity index and roundness were calculated as described [33,34,35].

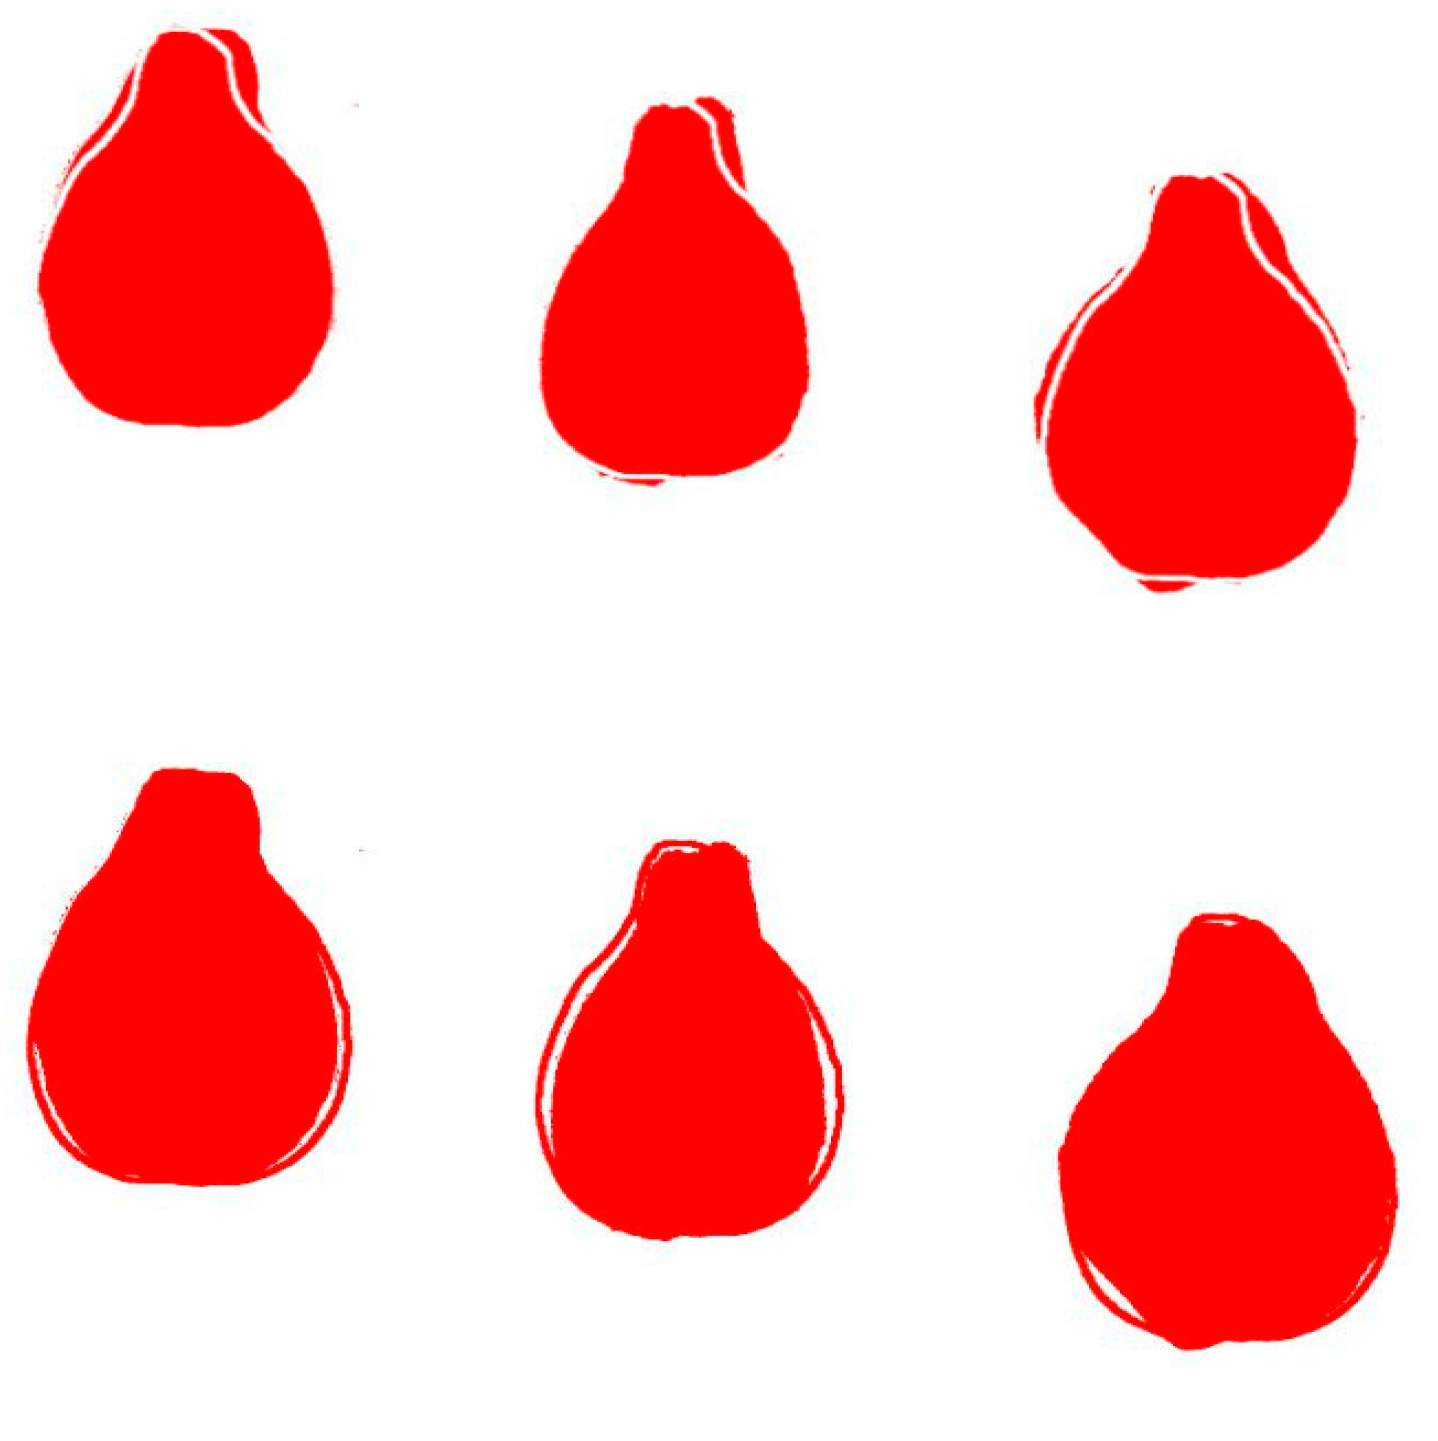
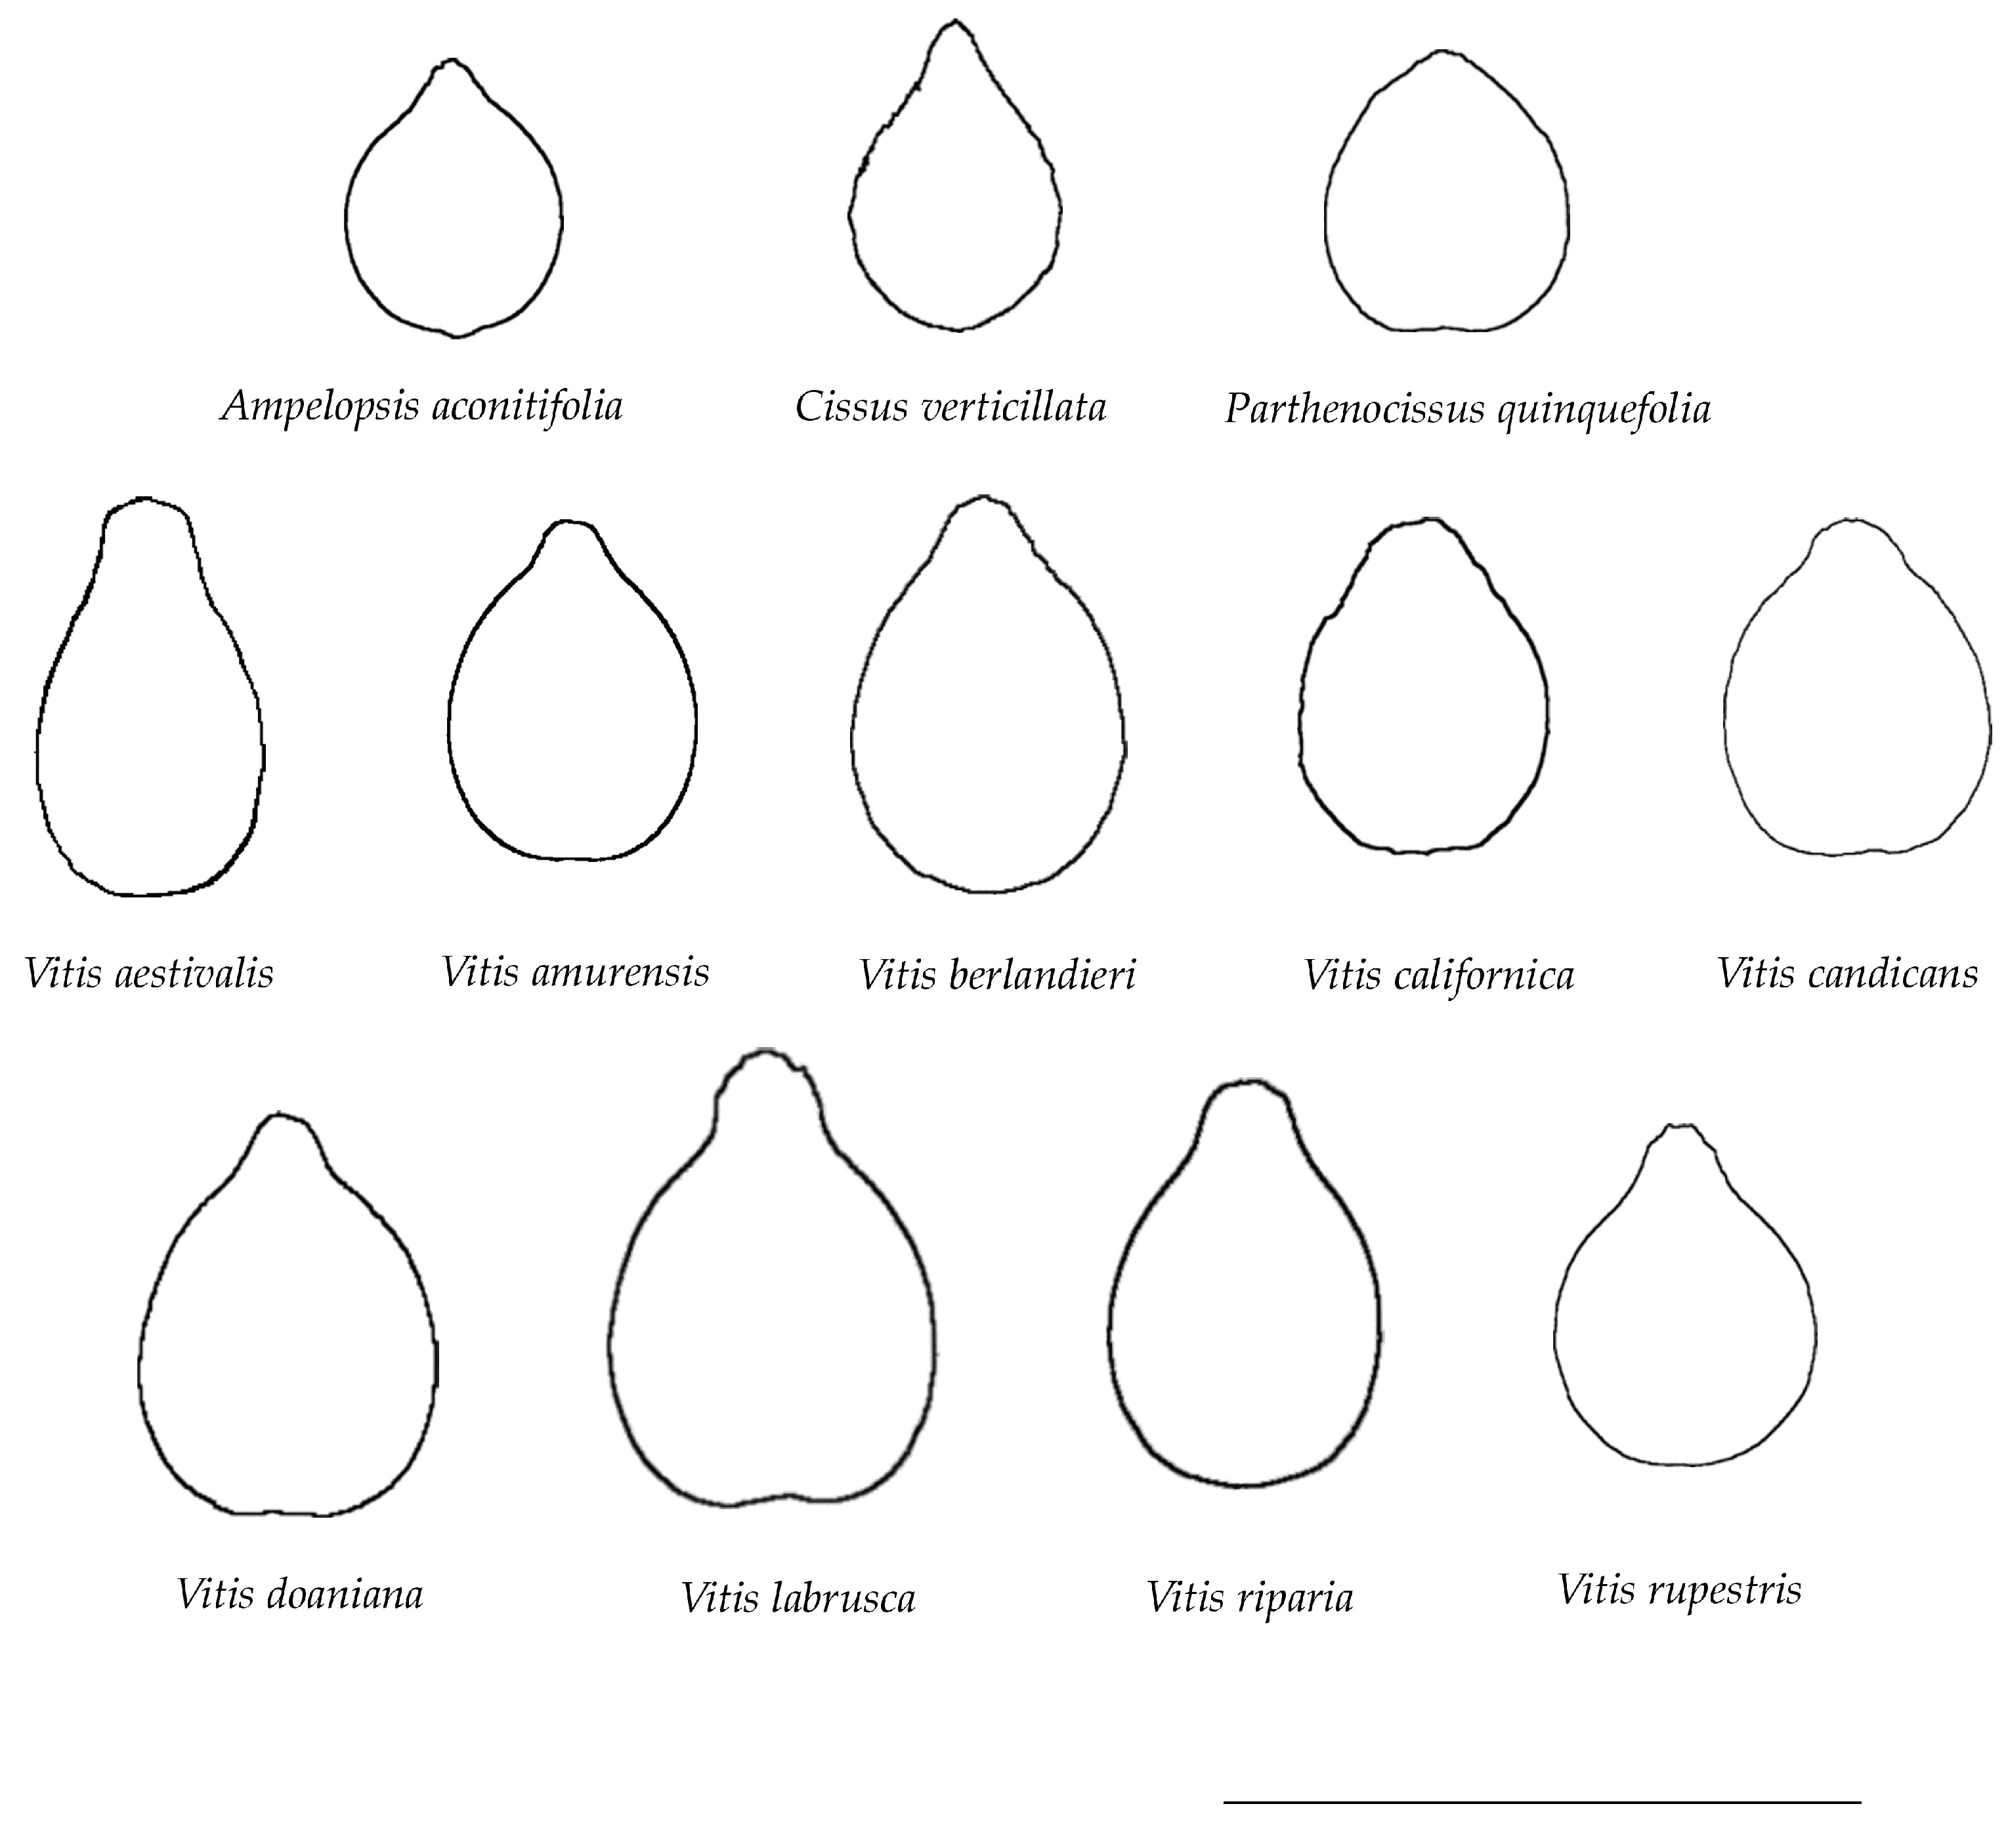
2.4. Average Silhouettes for Each Species

Average silhouettes represent the typical shape of each set of 20 silhouettes of every species. The protocol used to extract average silhouettes from a set of images has been described by Cervantes et al. [25] (See Supplementary Materials). Average silhouettes were used as models for comparisons with images of all species. Models were denoted with the initial “M” followed by the first four letters corresponding to genera or species such as Maest, Mamur, Mberl, etc., for Vitis species and MAmpe, MCiss, and MPart for the models corresponding to Ampelopsis aconitifolia, Cissus verticillata and Parthenocissus quinquefolia, respectively.

2.5. Quantification of Seed Shape by the J Index

Average silhouettes were used as models for shape quantification. For this purpose, the average silhouette for each species was compared to 20 seed silhouettes of all species.
The J index was calculated as the percentage of similarity between each seed image and the corresponding model. To perform this calculation, the model was superimposed upon the seed image, and two copies of the combined image were created: one with the model in white and the other with the model in black (Figure 1). The areas of both regions were quantified with Image J. The area with the model in black is the total area, and the area with the model in white is the area shared between each image and the model. J index is the percent of similarity between the seed image and the model and is calculated as follows:
J   i n d e x = S h a r e d   a r e a T o t a l   a r e a × 100
The images used for J index calculations are available at Zenodo (See Supplementary Materials).
Figure 1. Figures resulting from the superposition of models to seed images and treatment with Image J. In the three seeds above, the models are stored in white, and only the common region between seed and model is measured (shared area), while in the seed images below, the models are stored in black (red after thresholding), thus the area measured is the sum of the area occupied by the seed and that occupied by the model (Total area). The image corresponds to three seeds of V. aestivalis with the average silhouette of this species. J indices for these seeds are 90.0, 88.1 and 88.3, respectively.
Horticulturae 10 00285 g001

2.6. Symmetry Analysis

Similar to the calculation of J index, the quantification of bilateral symmetry involved comparing two images. In this case, the model used was the silhouette of the horizontal reflection of each seed. The images used for symmetry calculations are available at Zenodo (See Supplementary Materials).

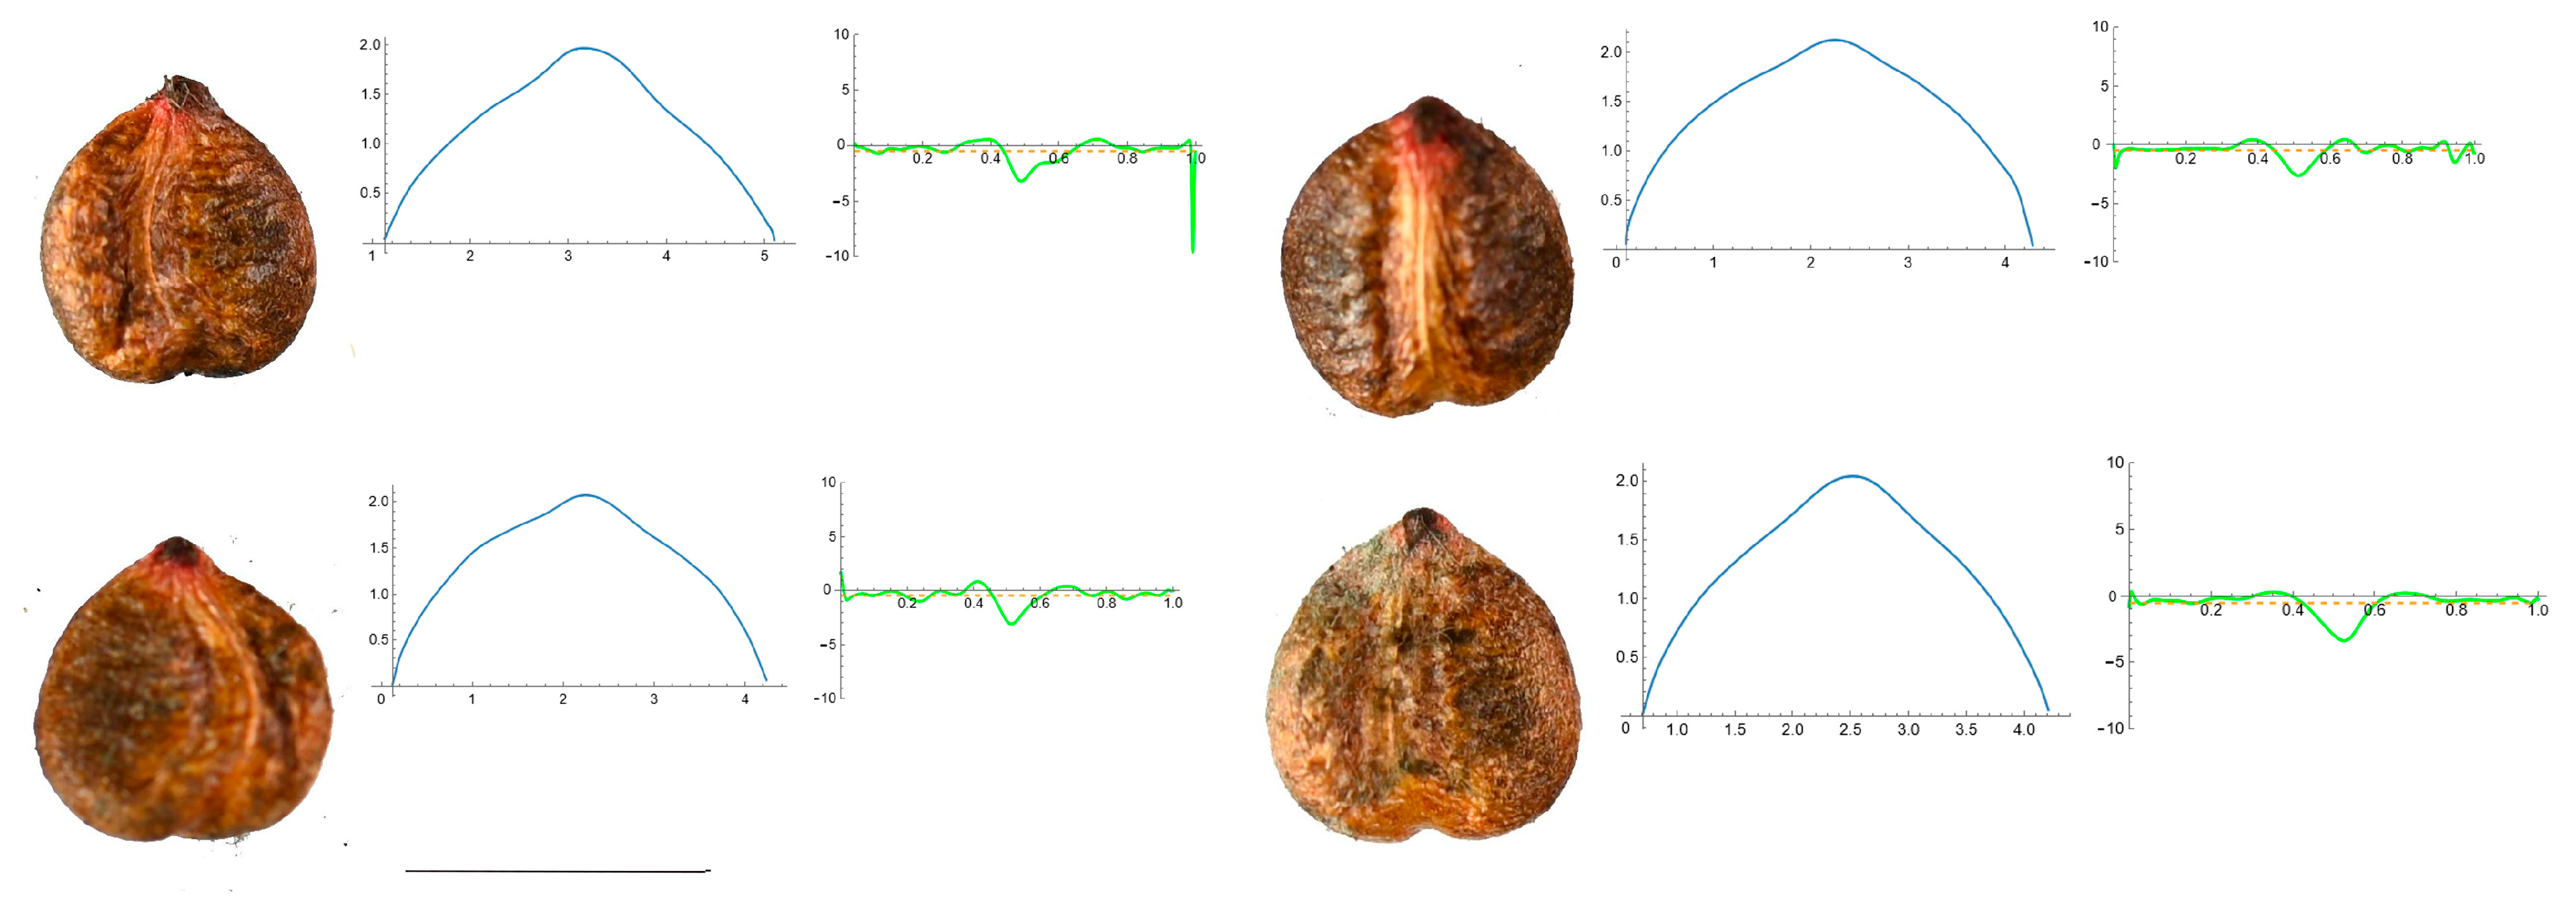
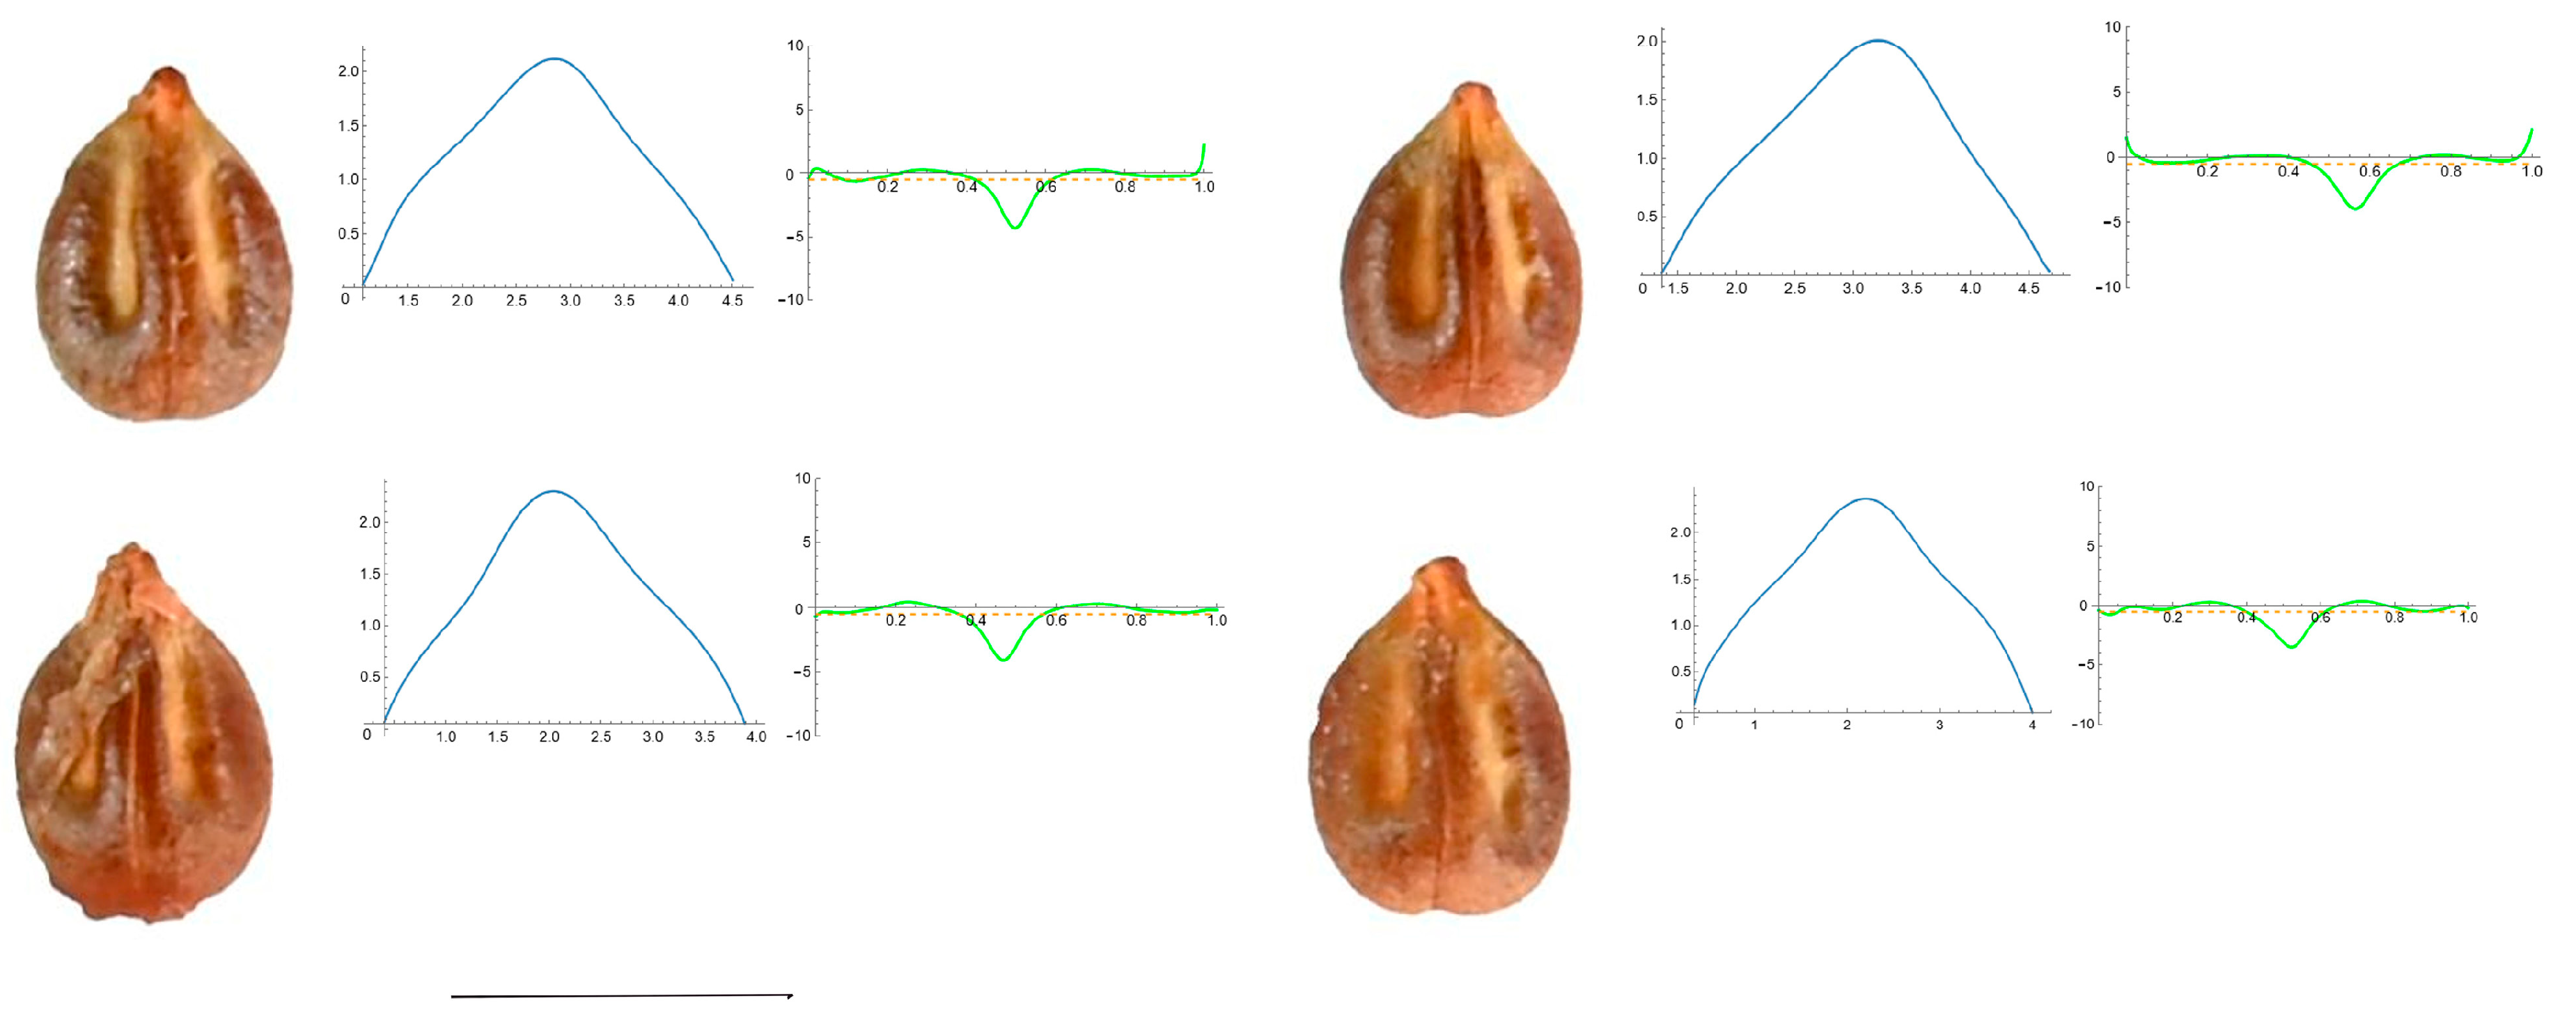
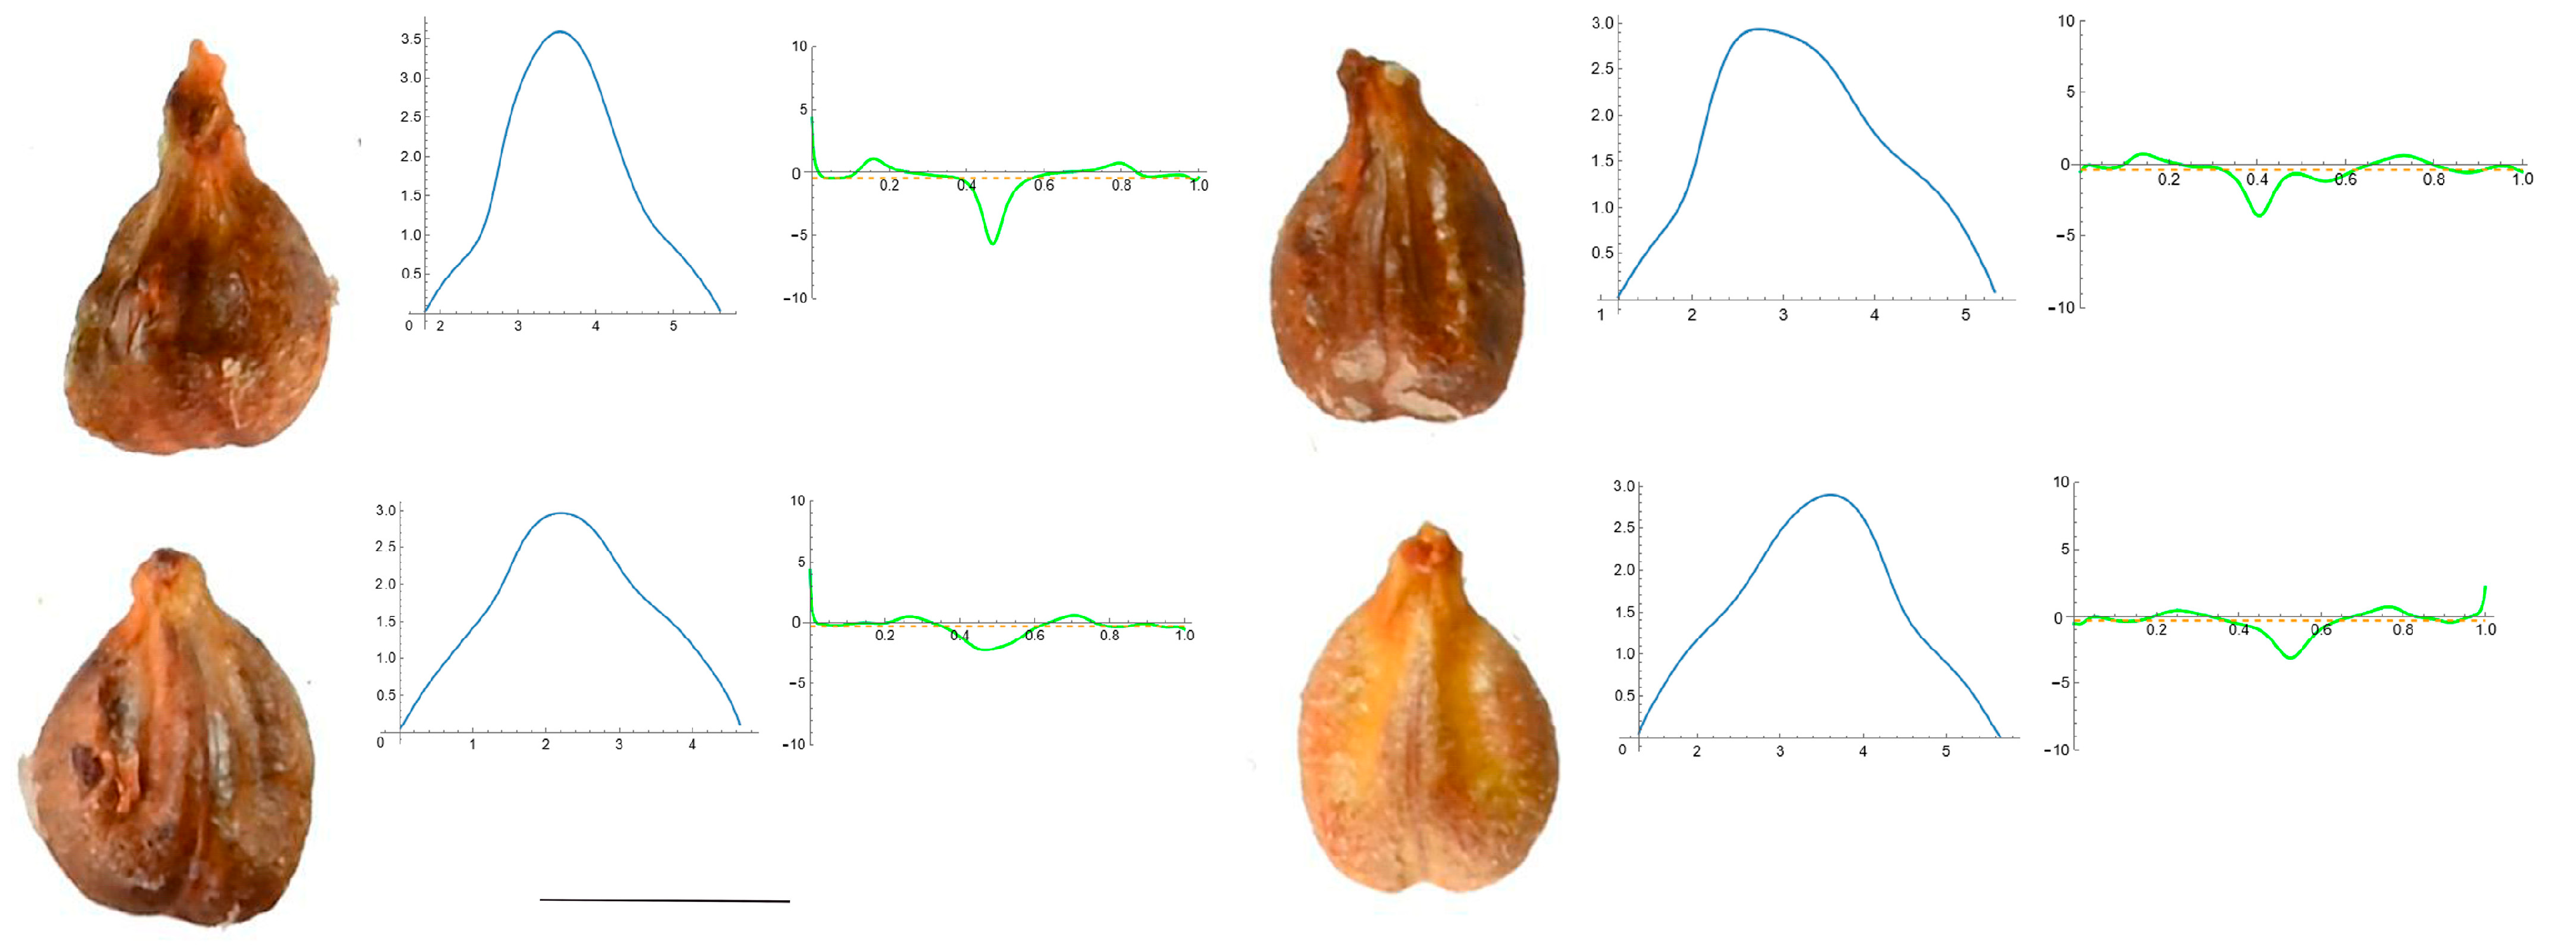
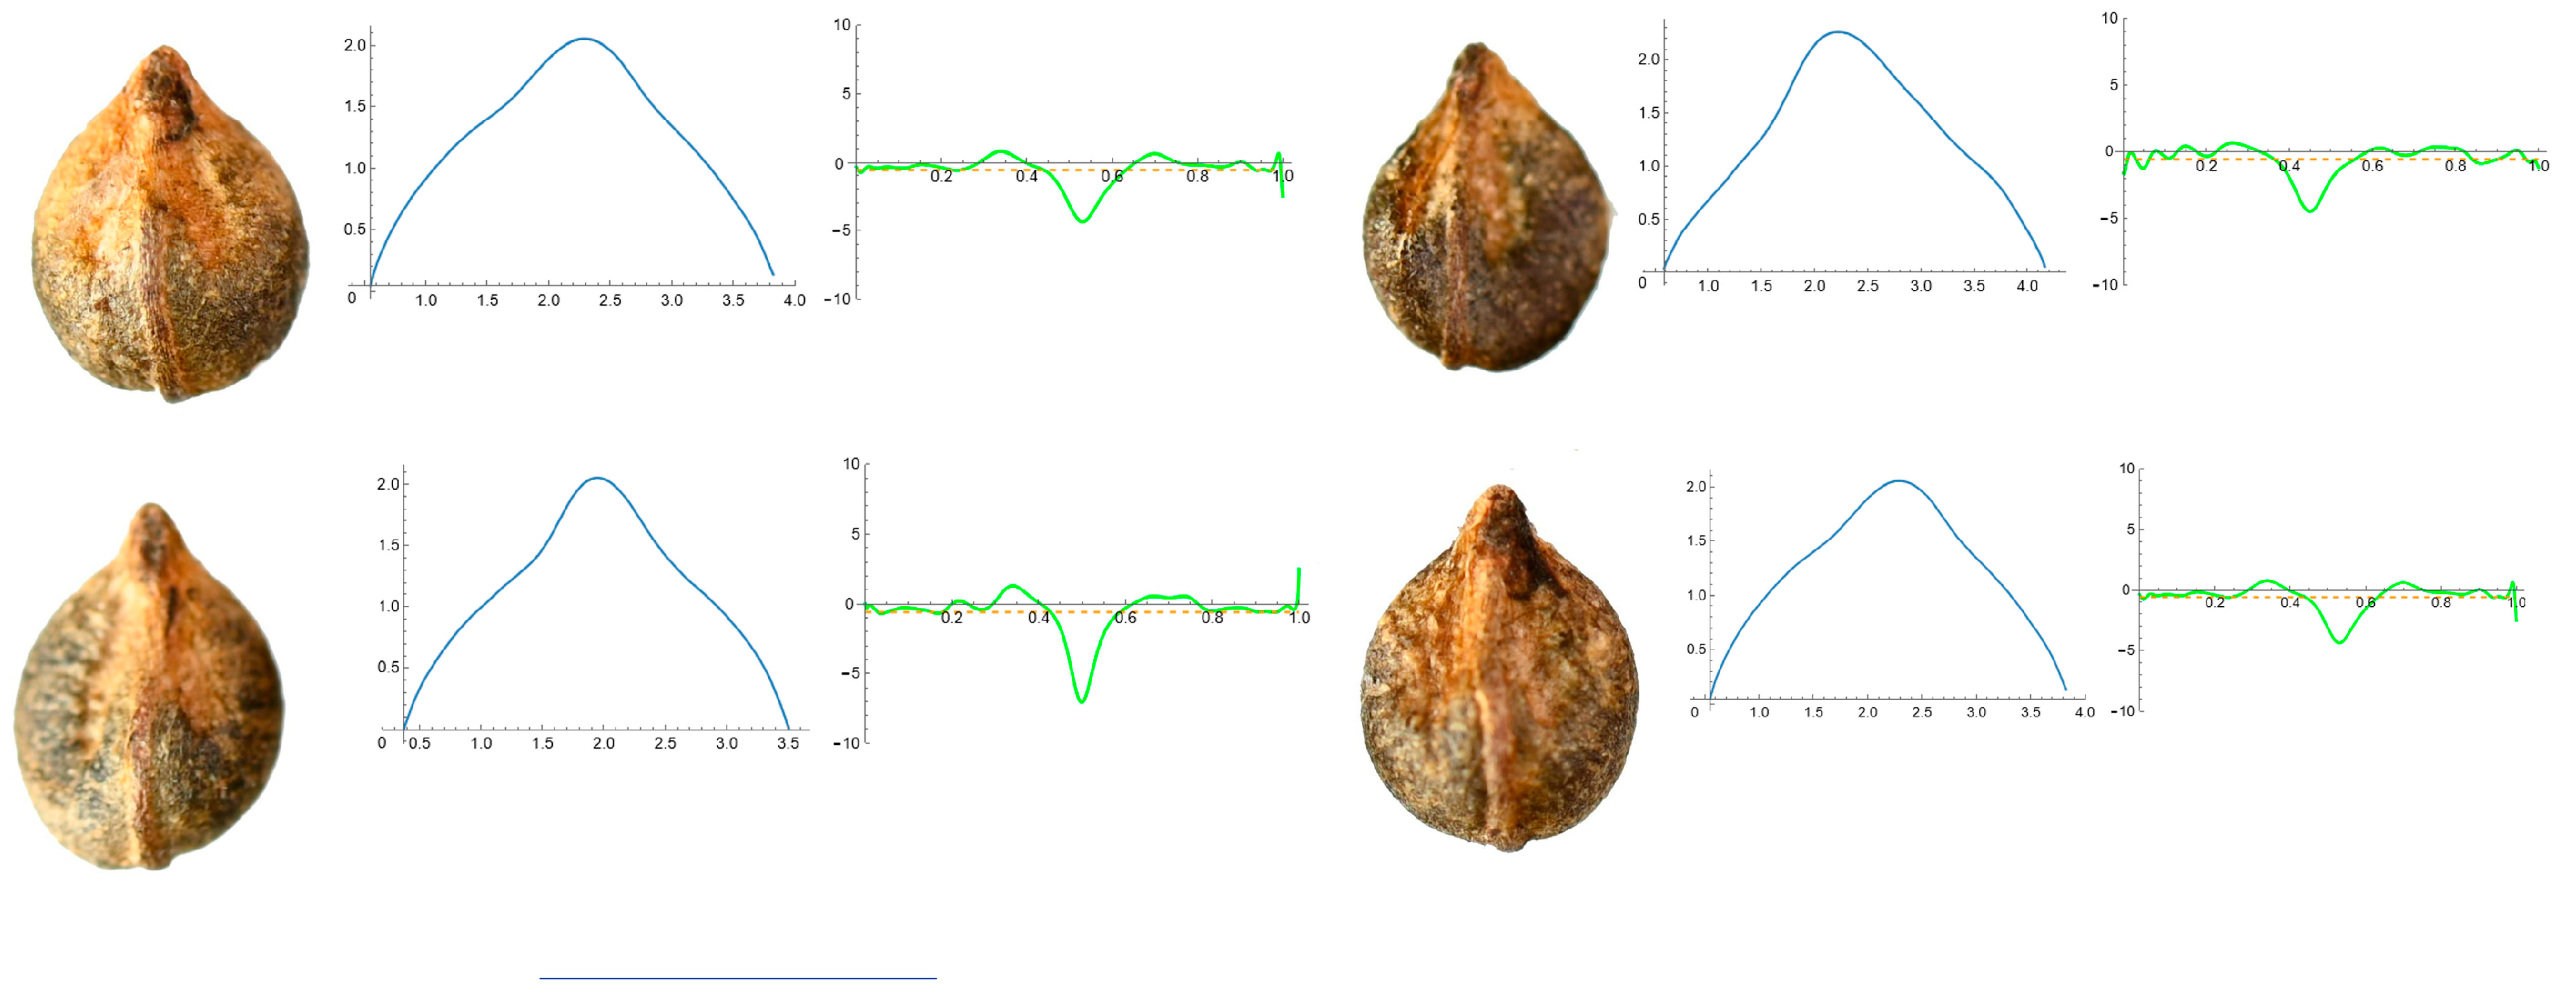
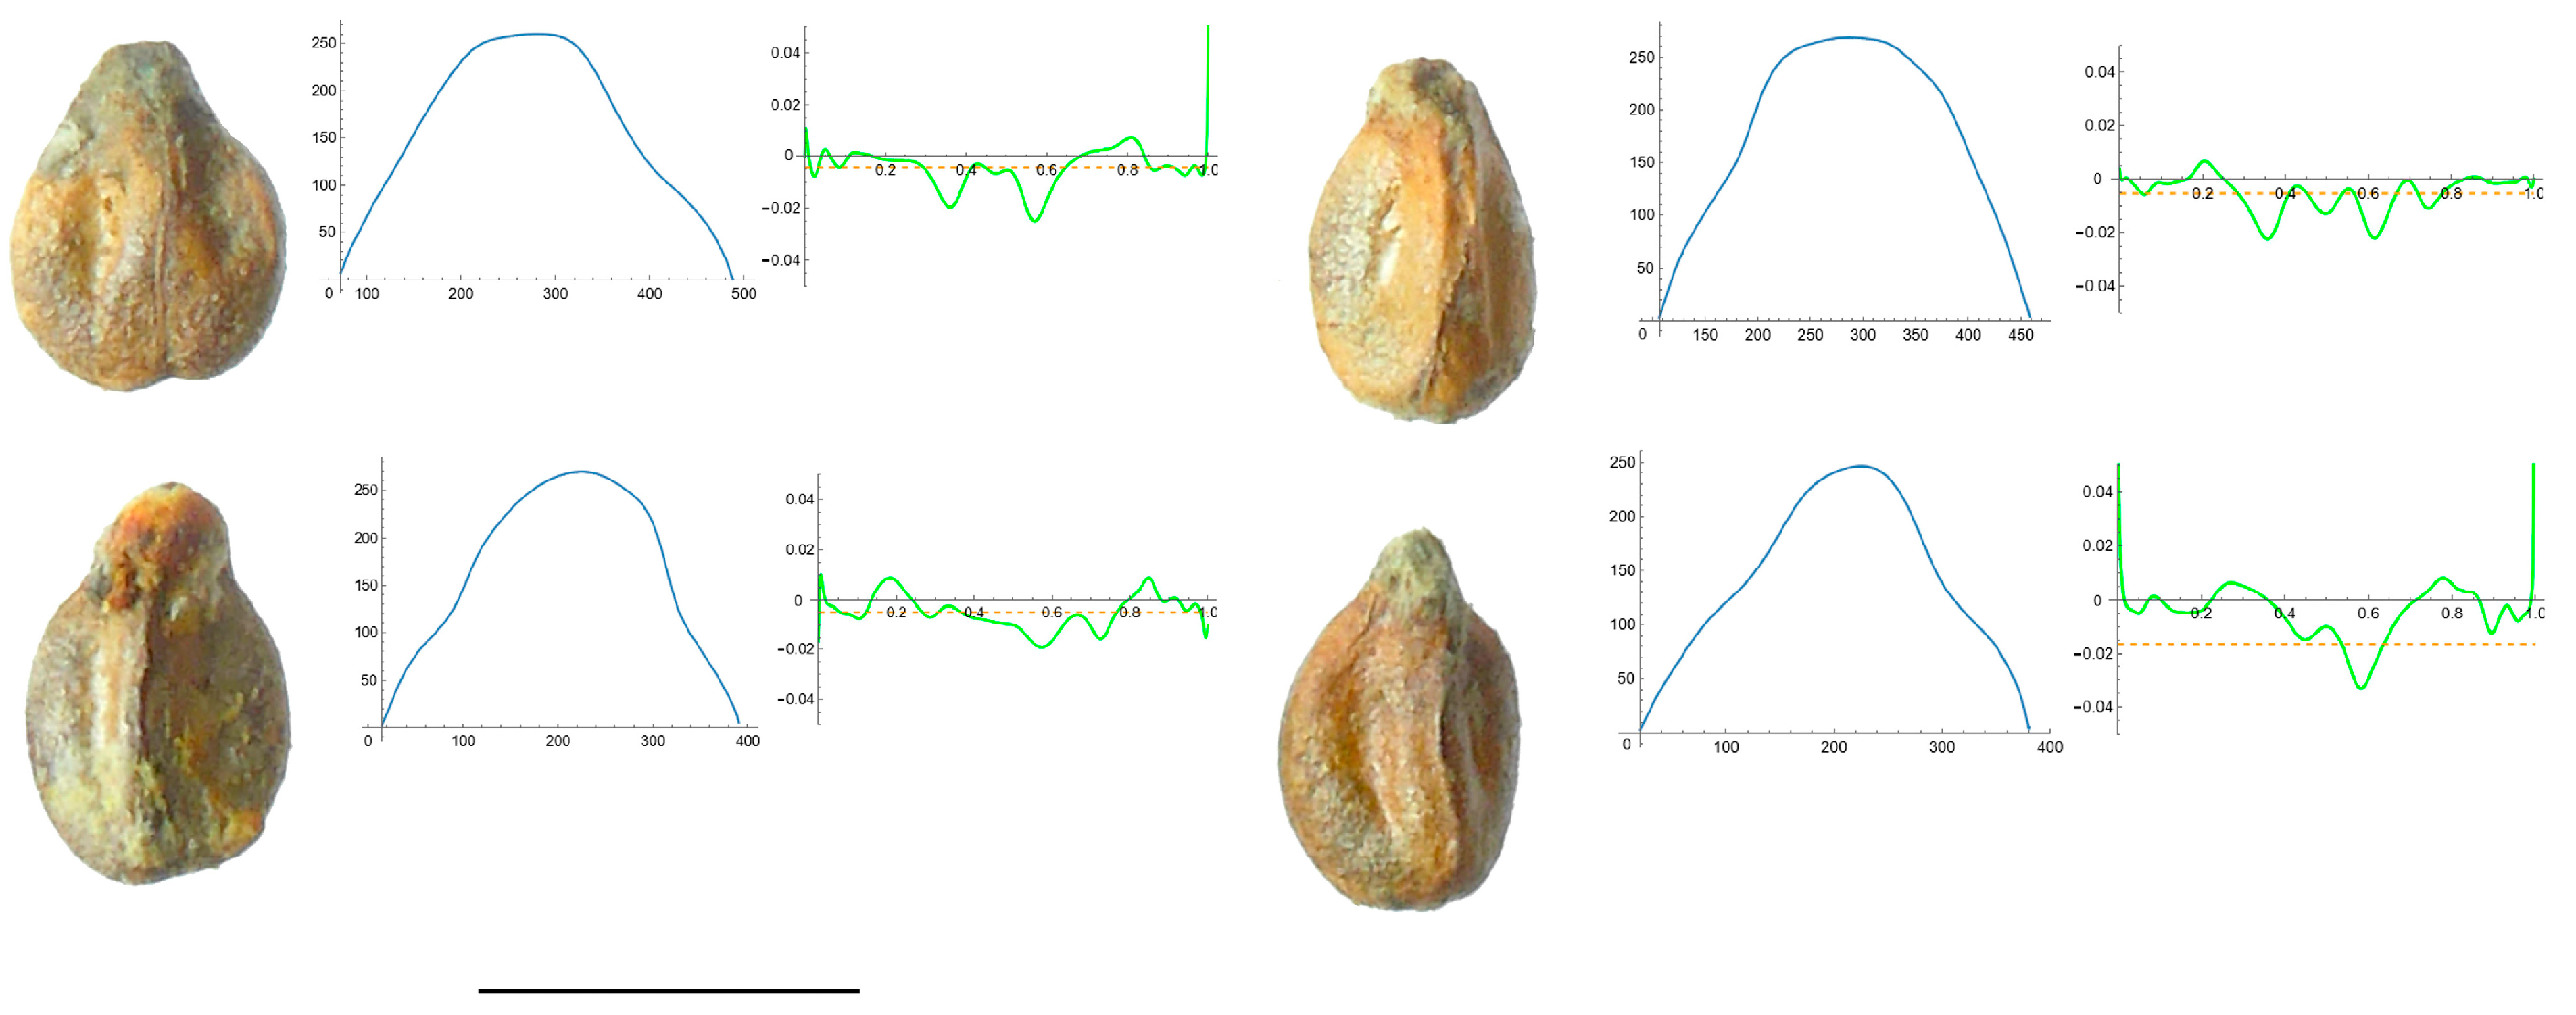
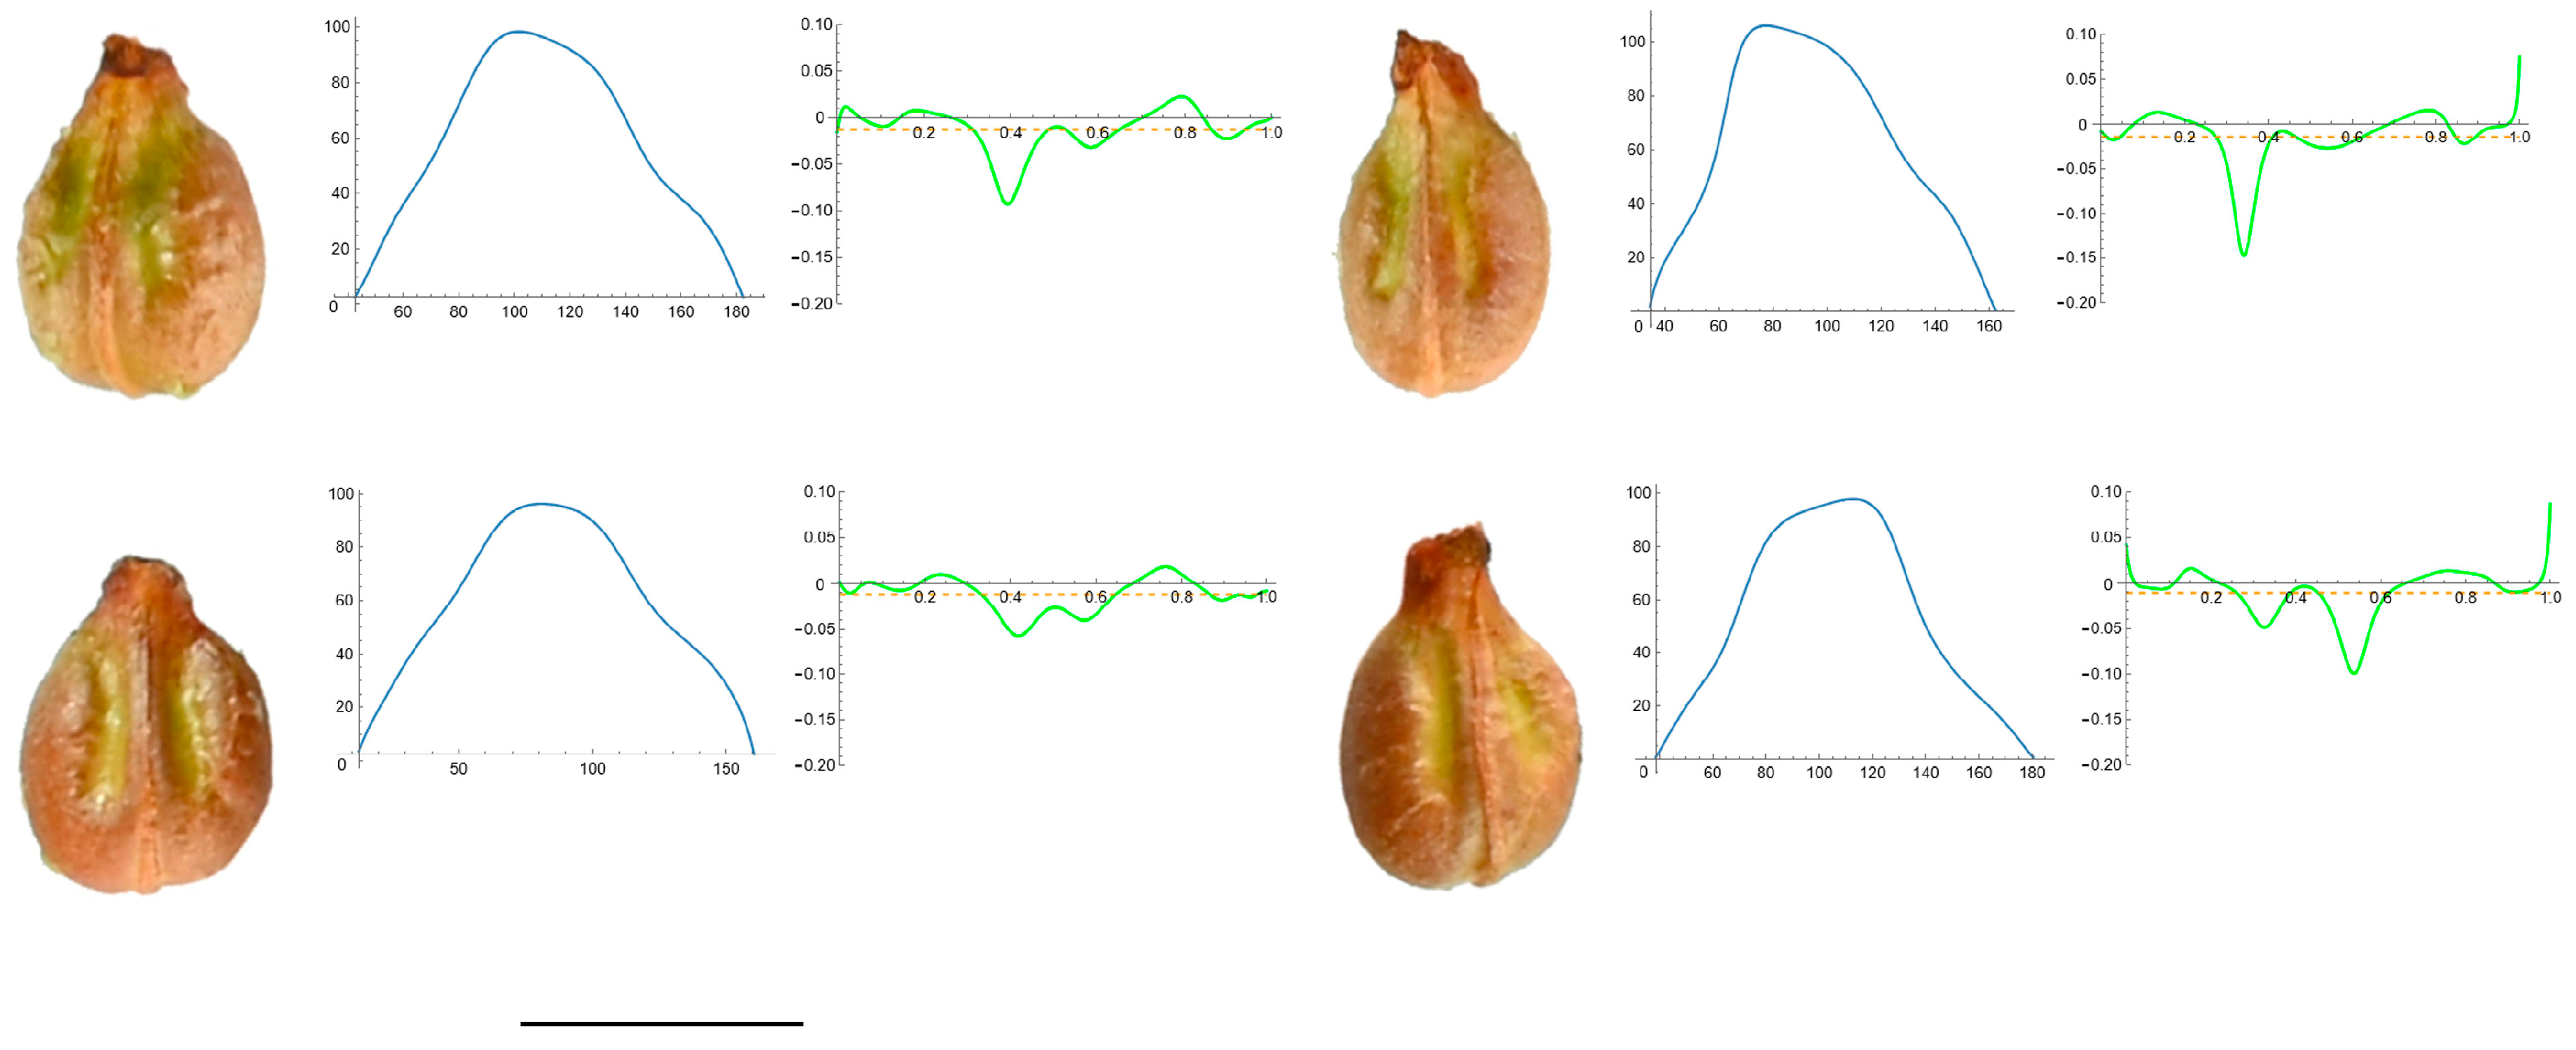
2.7. Curvature Analysis

Maximum and mean curvature values, along with the ratio between maximum and mean curvature, were determined for the apical side of seeds for each species following established procedures [27,28,29,30] (see Supplementary Materials). Curvature measurements were conducted automatically with the function Analyze line graph of Image J. Between 20 and 25 representative seeds were analyzed for each species. Vertically oriented images (JPEG) were opened in Image J and converted to 8-bit, and threshold values were then adjusted. The curve corresponding to the seed apex was selected from the outlines, and a new threshold was defined before the corresponding line graph was analyzed to give the x and y coordinates. The coordinates served as the basis for calculating the Bézier curves and the corresponding curvature values in Mathematica according to published protocols [27,28,29,30]. Curvature was given in micron−1 × 1000; thus, a curvature of 20 corresponds to a circumference of 50 microns (1/50 × 1000) and a curvature of 2 corresponds to a circumference of 0.5 mm. A quotient from the maximum and mean curvatures close to 1 indicates a curve approaching the arc of a circumference with radius equal to the inverse of mean curvature value.

2.8. Statistical Analysis

Due to heterogeneity in sample sizes or in their distributions, Kruskal Wallis test was used to analyze differences between populations for the measurements. Statistical analyses were conducted with IBM SPSS statistics v28 (SPSS 2021). Coefficients of variation were calculated according to [36].

3. Results

3.1. General Morphological Measurements

Table 2 contains a summary of the mean values for area (A), perimeter (P), length (L), width (W), circularity (C), aspect ratio (AR), roundness (R) and solidity (S) for seeds of the species analyzed. There were significant differences in all measurements and, as reported in the analysis of seed shape in other plant families [37], the lowest coefficients of variation were found in solidity. With the exceptions of V. amurensis, V. californica, and V. rupestris, the species of Vitis were larger than those of the other three genera. The lowest values of size measurements (A, P, L, W) corresponded to Ampelopsis aconitifolia, followed by Cissus verticillata. The largest size was found for V. labrusca, followed by V. doaniana. The lowest circularity was observed in C. verticillata and V. aestivalis, followed by a second group including V. labrusca and V. riparia. The aspect ratio varied between 1.14 (Parthenocisus quinquefolia) and 1.69 (Vitis aestivalis). Among Vitis species, V. amurensis, V. californica, V. candicans, V. doaniana, V. labrusca and V. rupestris had similar aspect ratio values between 1.29 and 1.35. The values of aspect ratio are inverse to those of the Stummer index, a traditional measurement used in Viticulture. For the Vitis species used in this study, the Stummer index is indicated in the footer of Table 2. Significant differences were found in the variable solidity with the highest values corresponding to the group formed by Parthenocisus quinquefolia, V. californica, and V. candicans, whereas the lowest value was found for V. labrusca.

3.2. Average Silhouettes of Representative Species

Figure 2 shows the average silhouettes for each species. A total of twelve average silhouettes were compared with 20 seeds representative of each species.

3.3. Comparison of Seed Shape between Species by the J Index

The average silhouette for each species was used to calculate the mean J index values against the 20 seed images of each species, and the results are shown in Table 3. Despite all models showing the highest value for the species, some models display maximum values for other species. In the case of the model derived from the average silhouette of V. californica, maximum values resulted from all the combinations except for that with V. aestivalis. This is the result of a large variation in seed shape in this species. The difference between the value given by a model for its own species and the value for another species indicates species-specific shape, and this was remarkable in A. aconitifolia, C. verticillata, P. quinquefolia, V. aestivalis, and V. riparia. This difference did not appear in the other species. In particular, the models of V. berlandieri, V. californica, V. candicans, V. doaniana and V. rupestris gave relatively high values of J index with different species. The dendrogram resulting from the comparisons is shown in Figure 3. A similar dendrogram resulted from the combined analysis with data resulting from general measurements, as well as curvature and symmetry analyses.
The dendrogram in Figure 3 shows the hierarchical relationship between species. The species of Vitis are categorized into two main groups, with five and three species, respectively. The position of V. aestivalis outside of these two groups requires further confirmation. In the major group, V. riparia and V. berlandieri appear closely related, while V. amurensis and V. doaniana are close together in another branch.

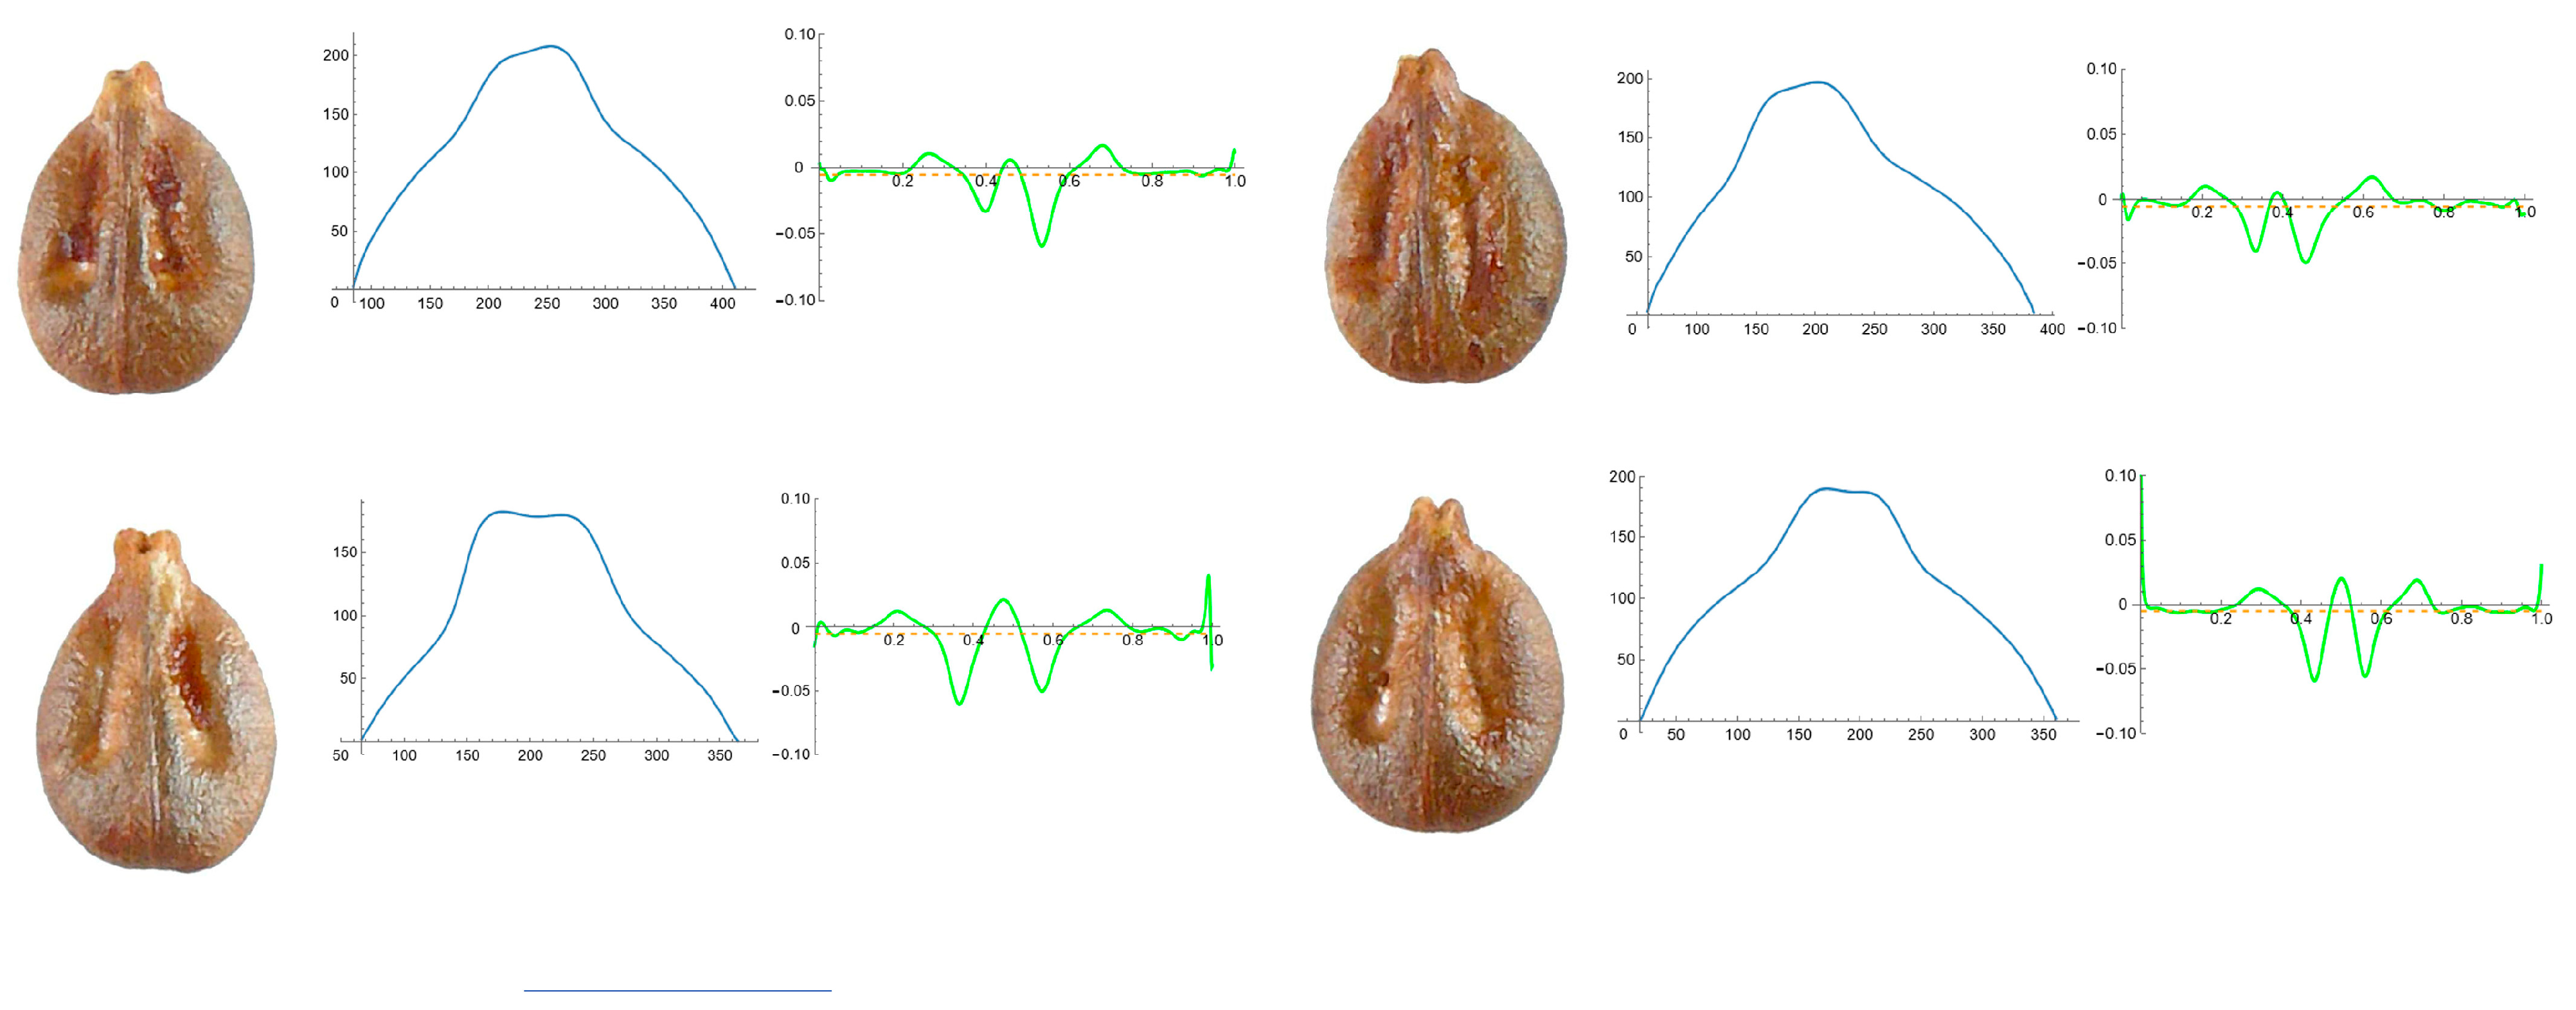
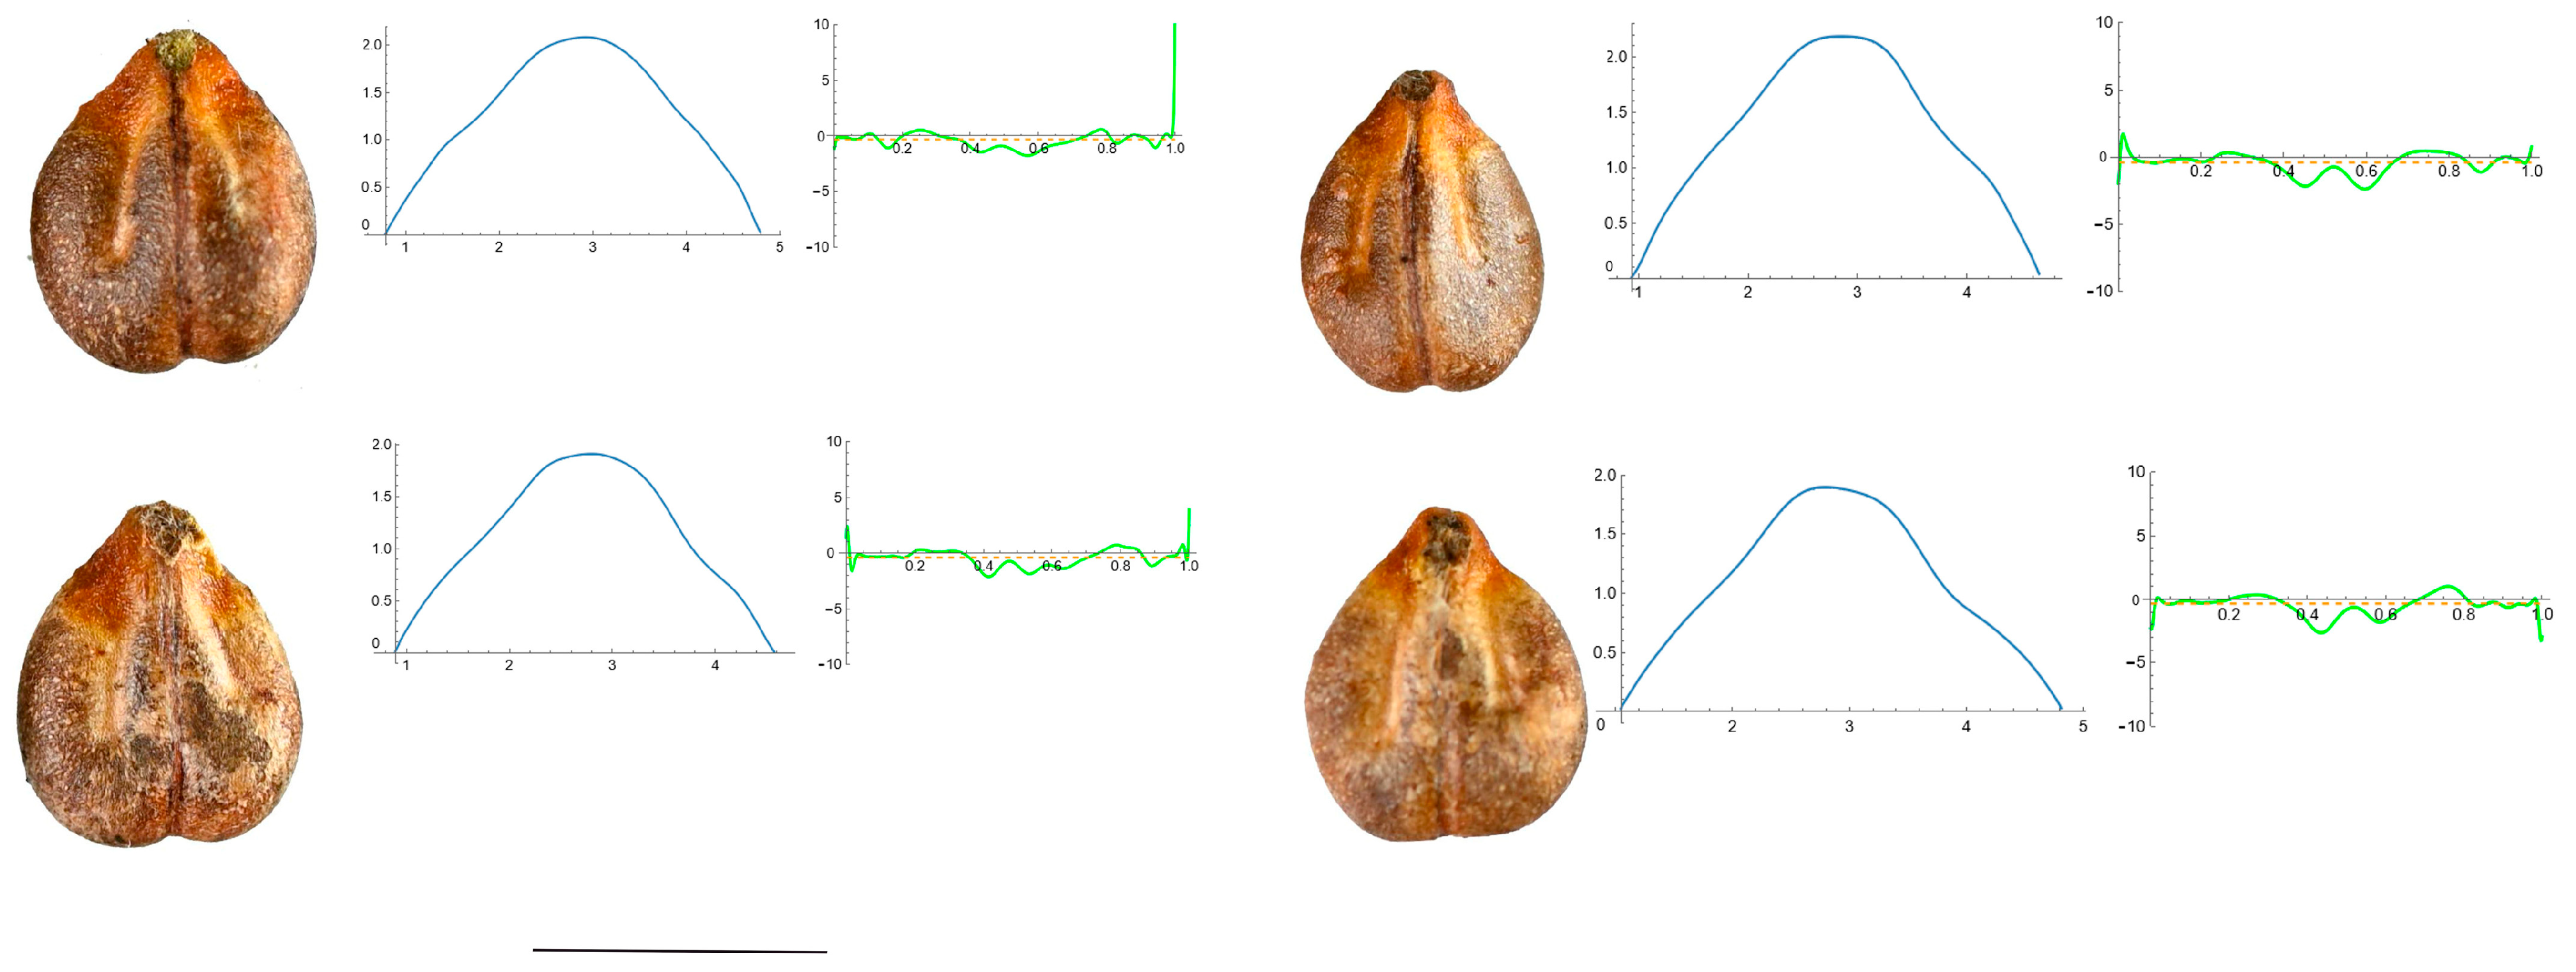
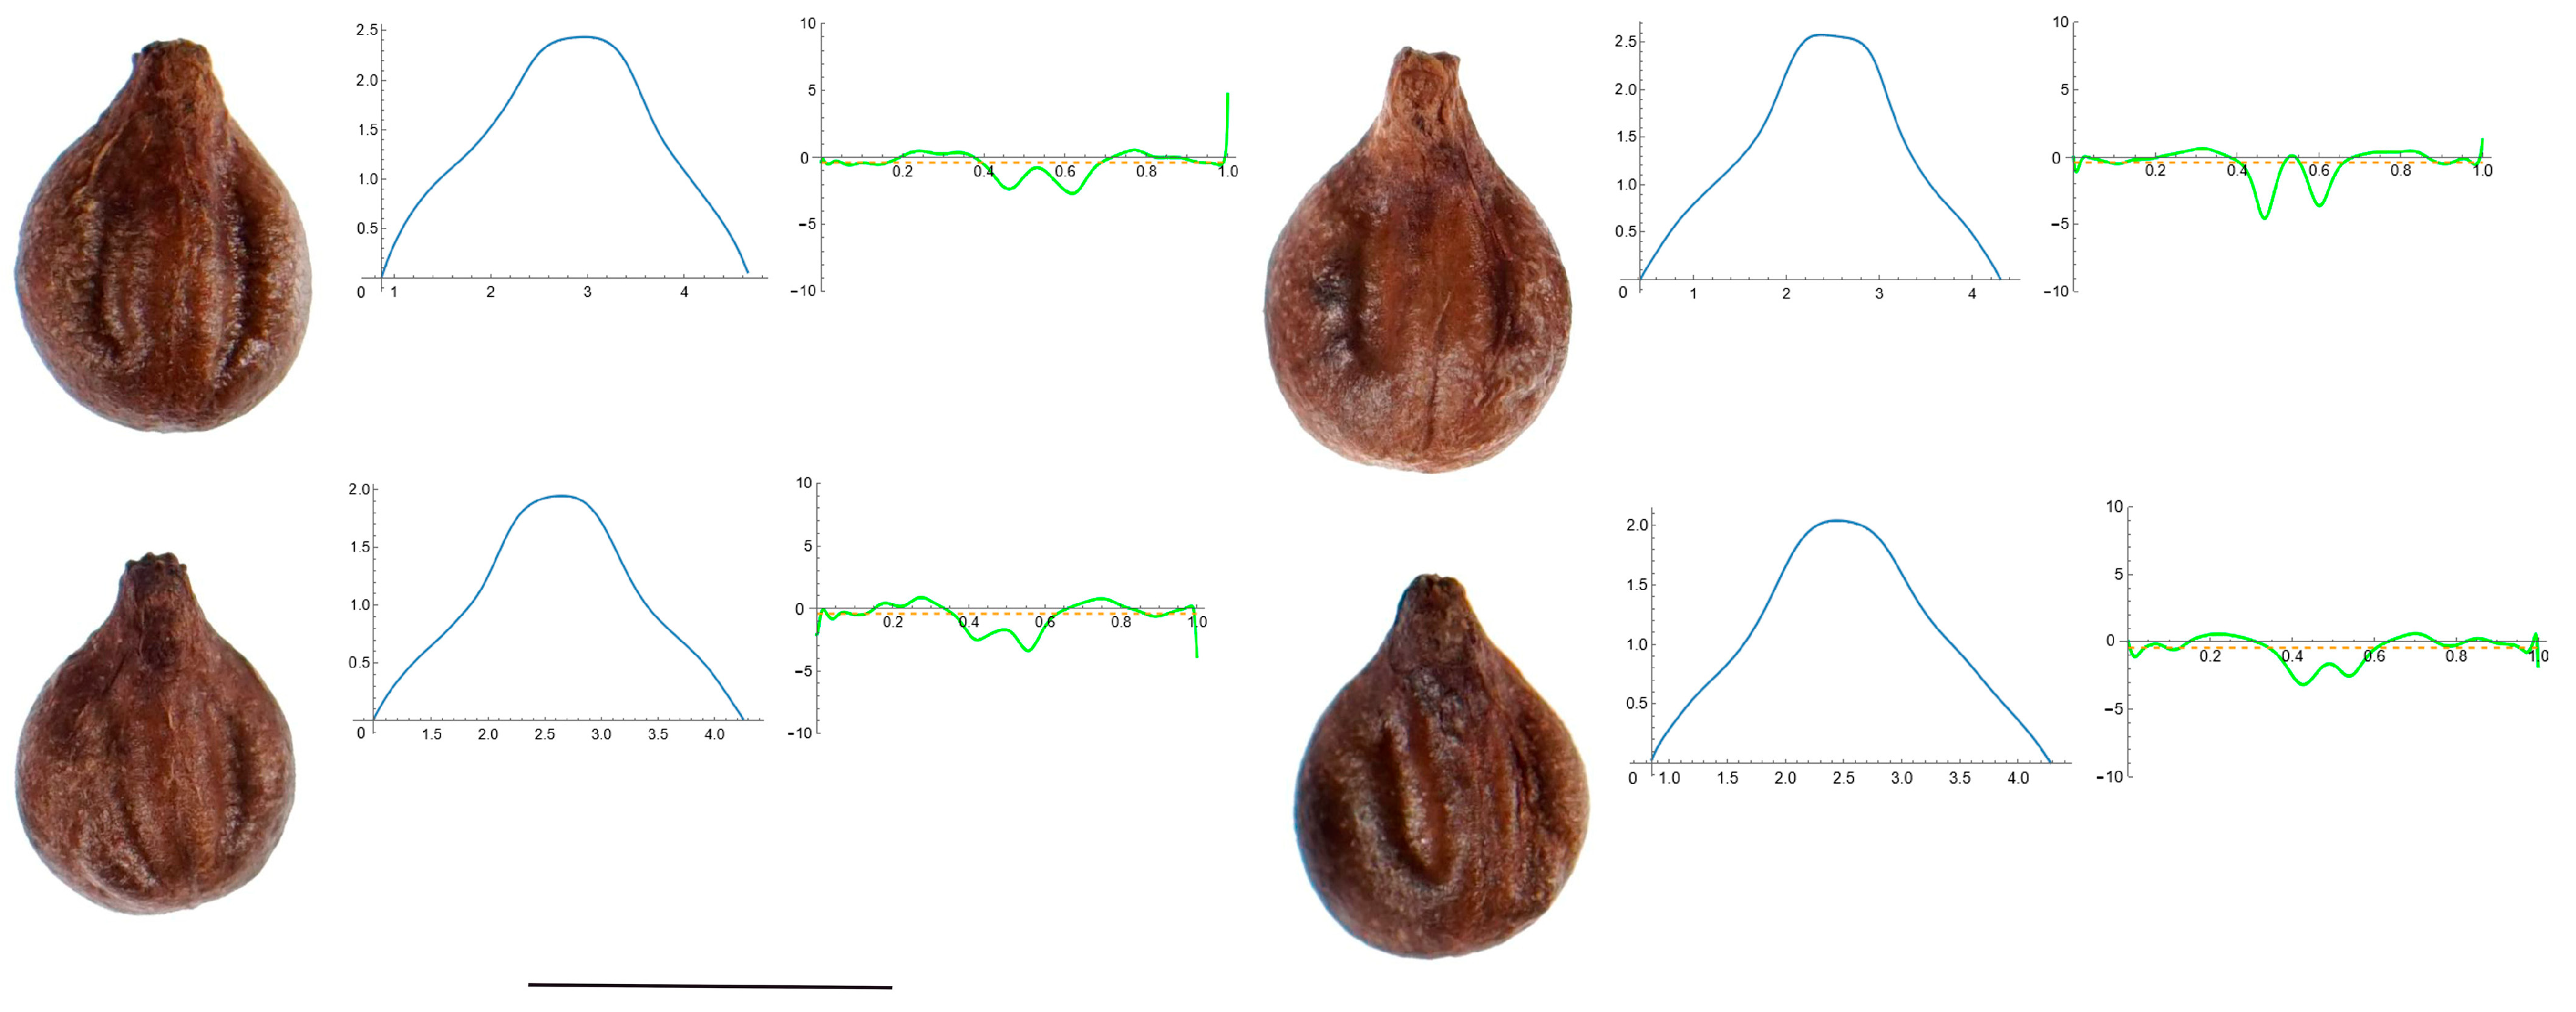
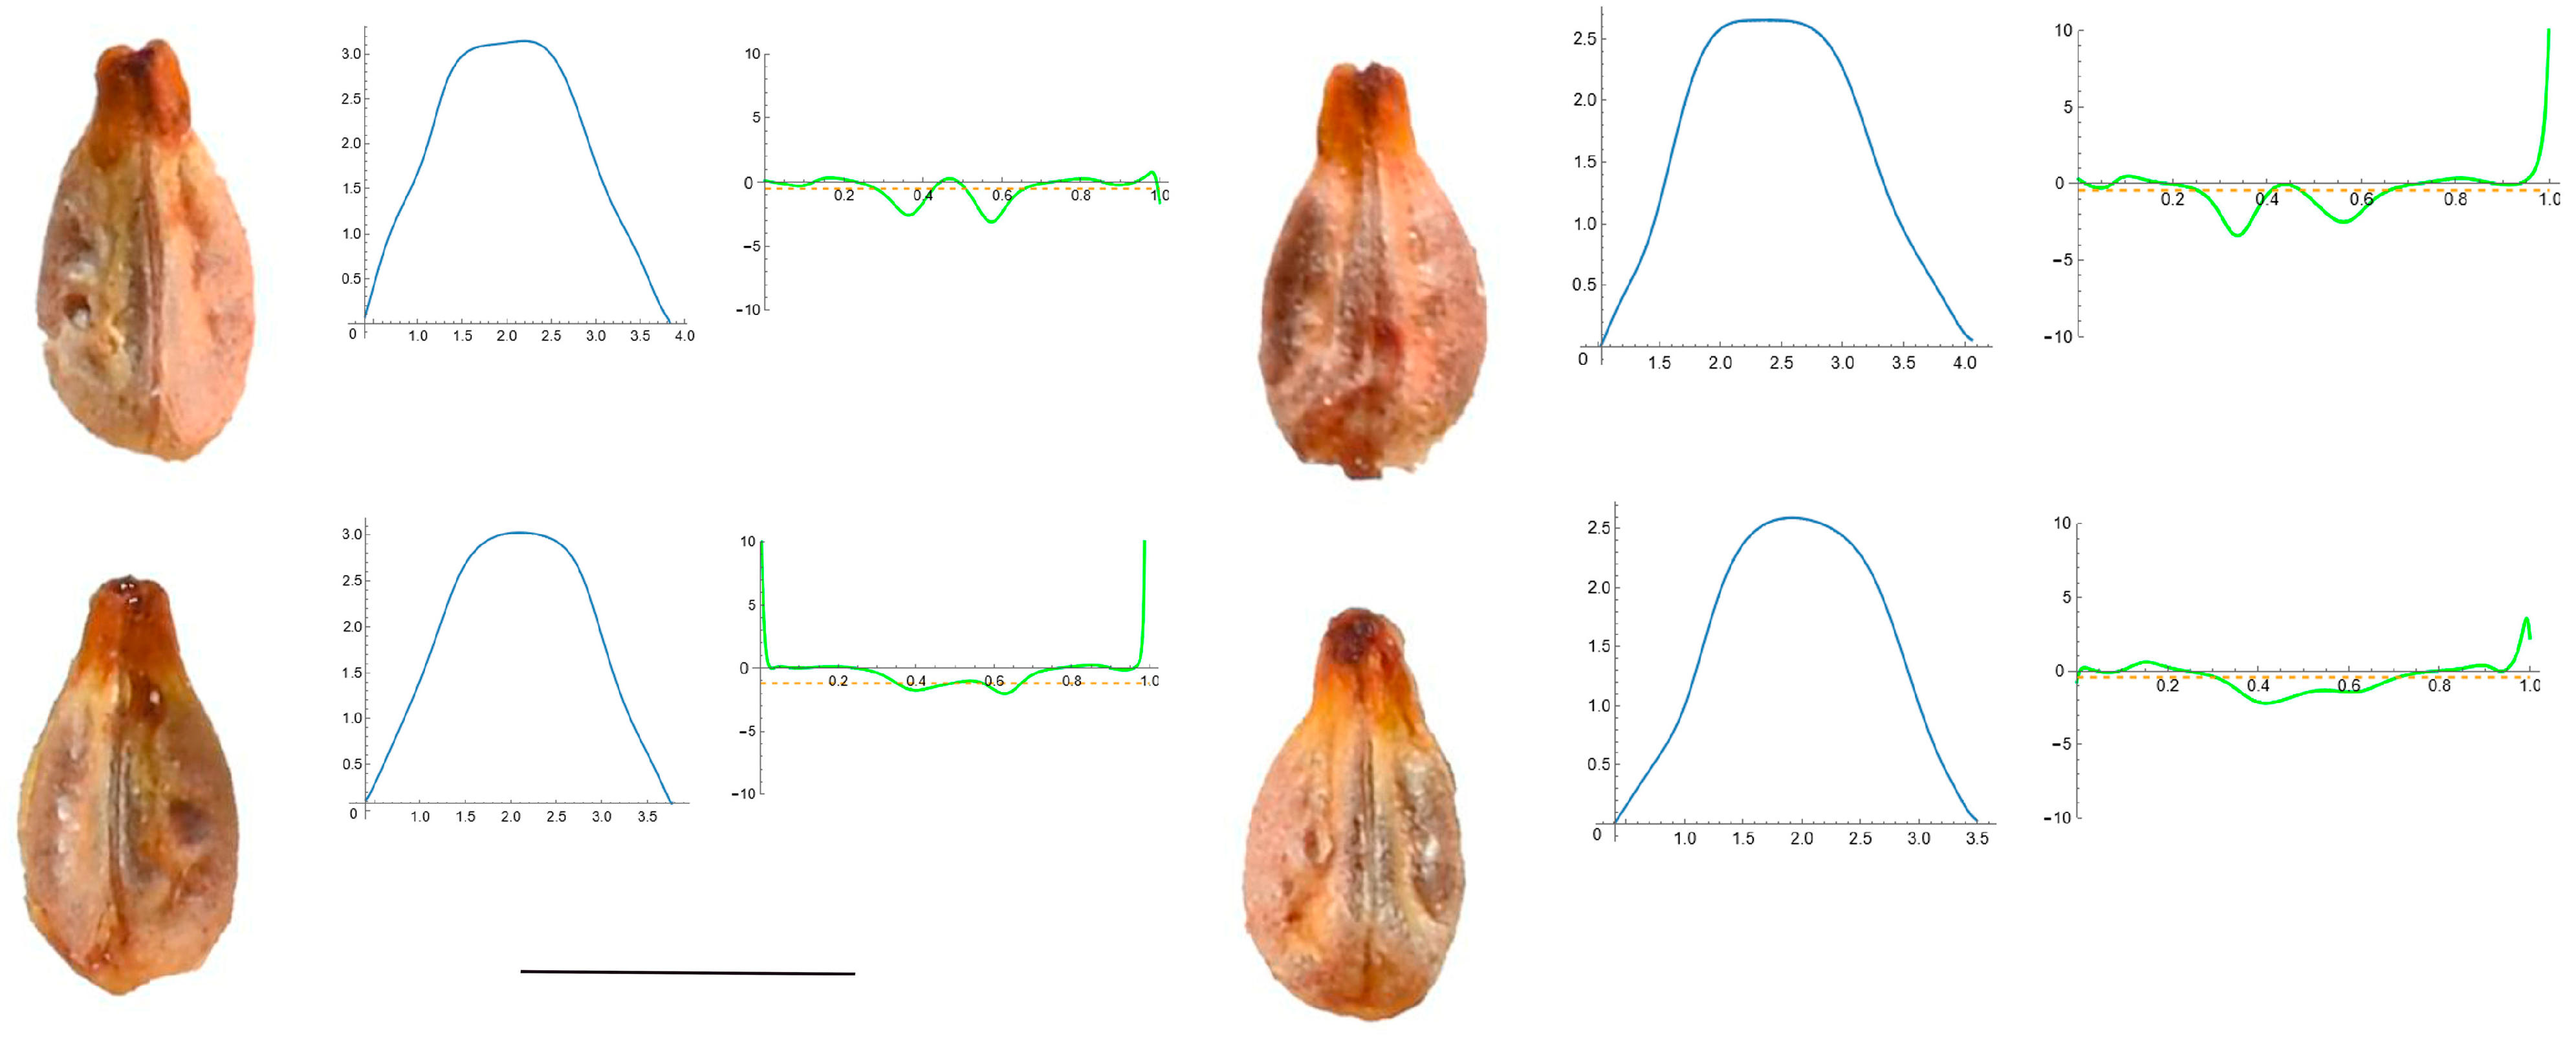
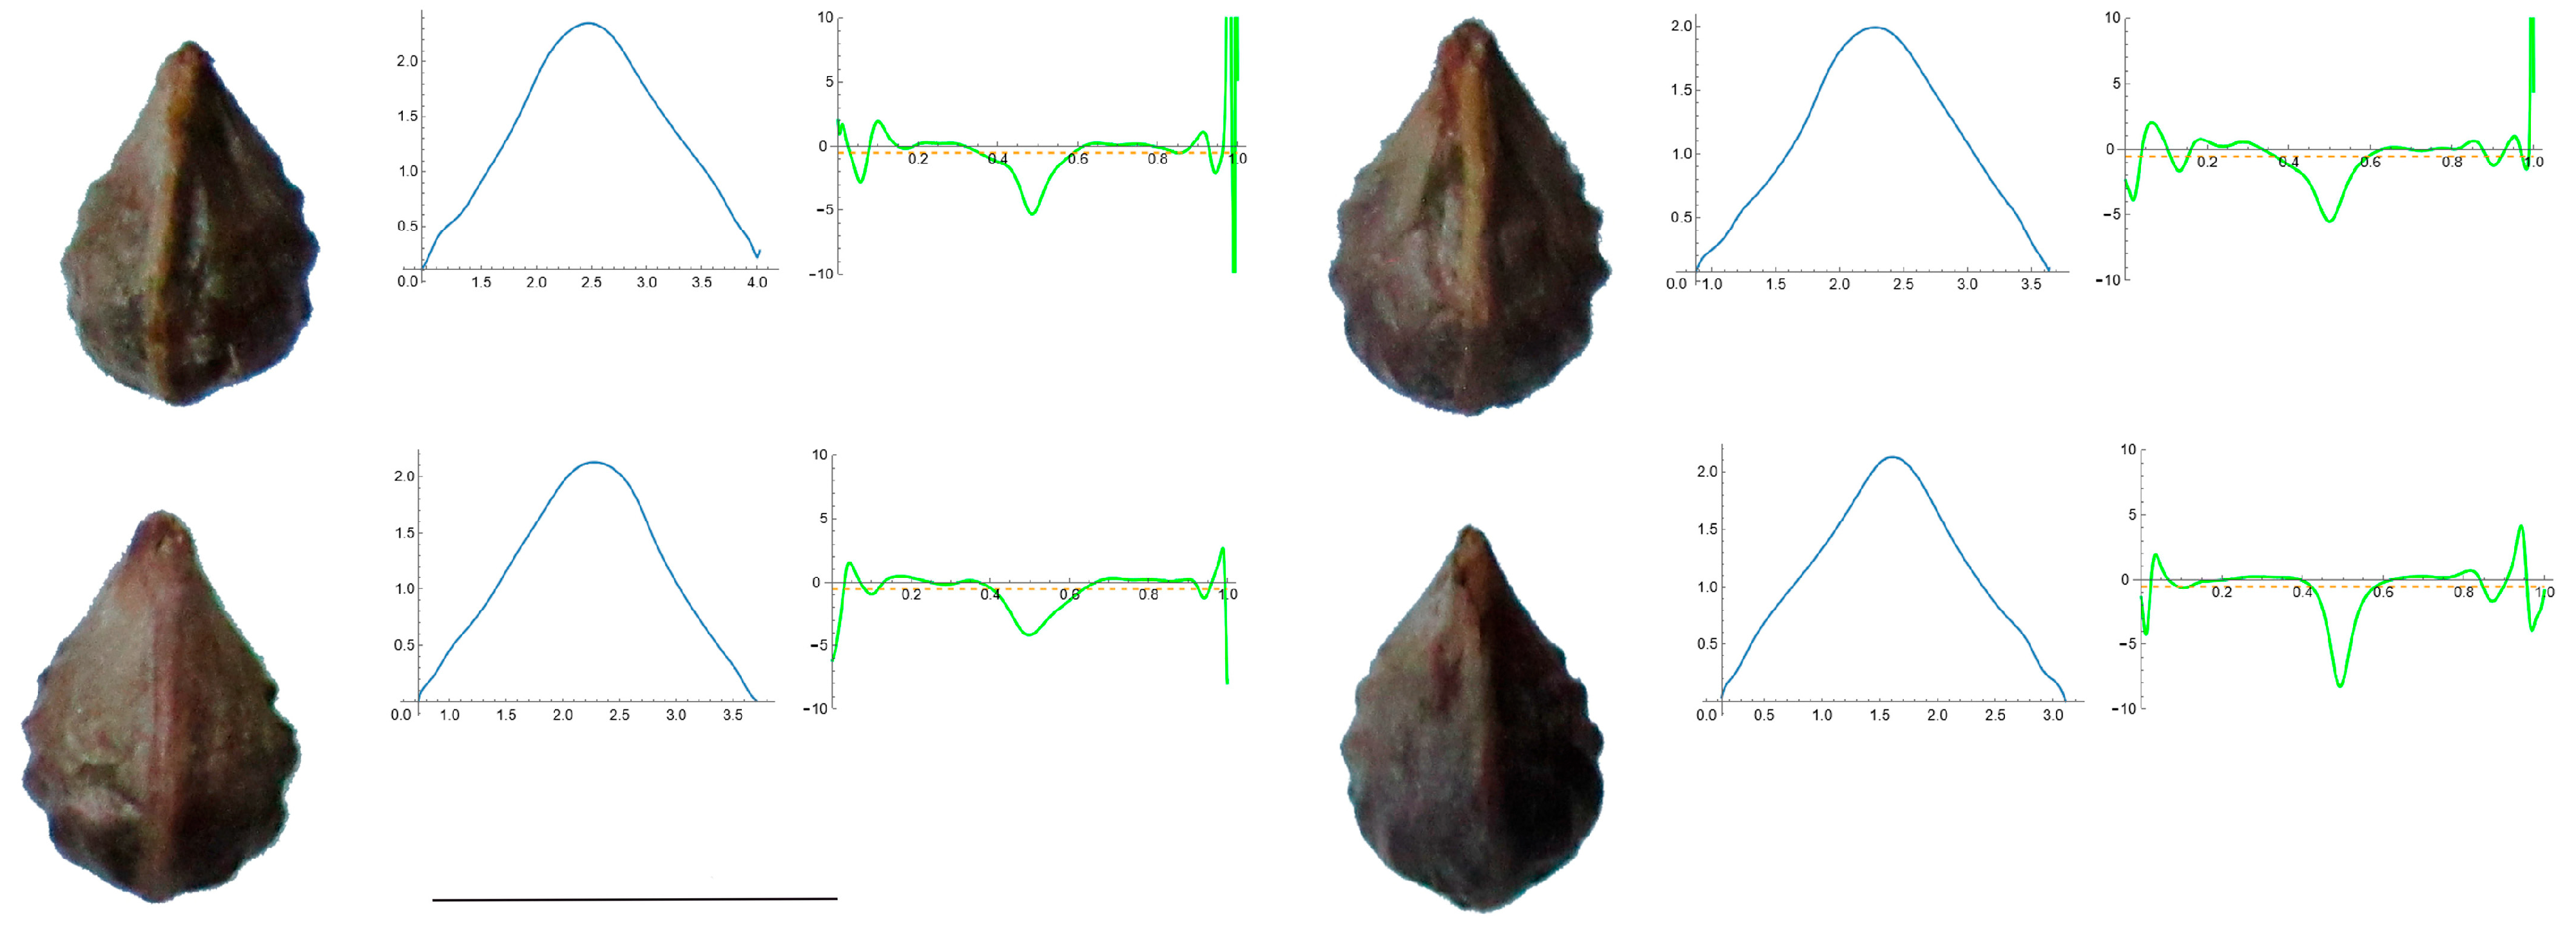
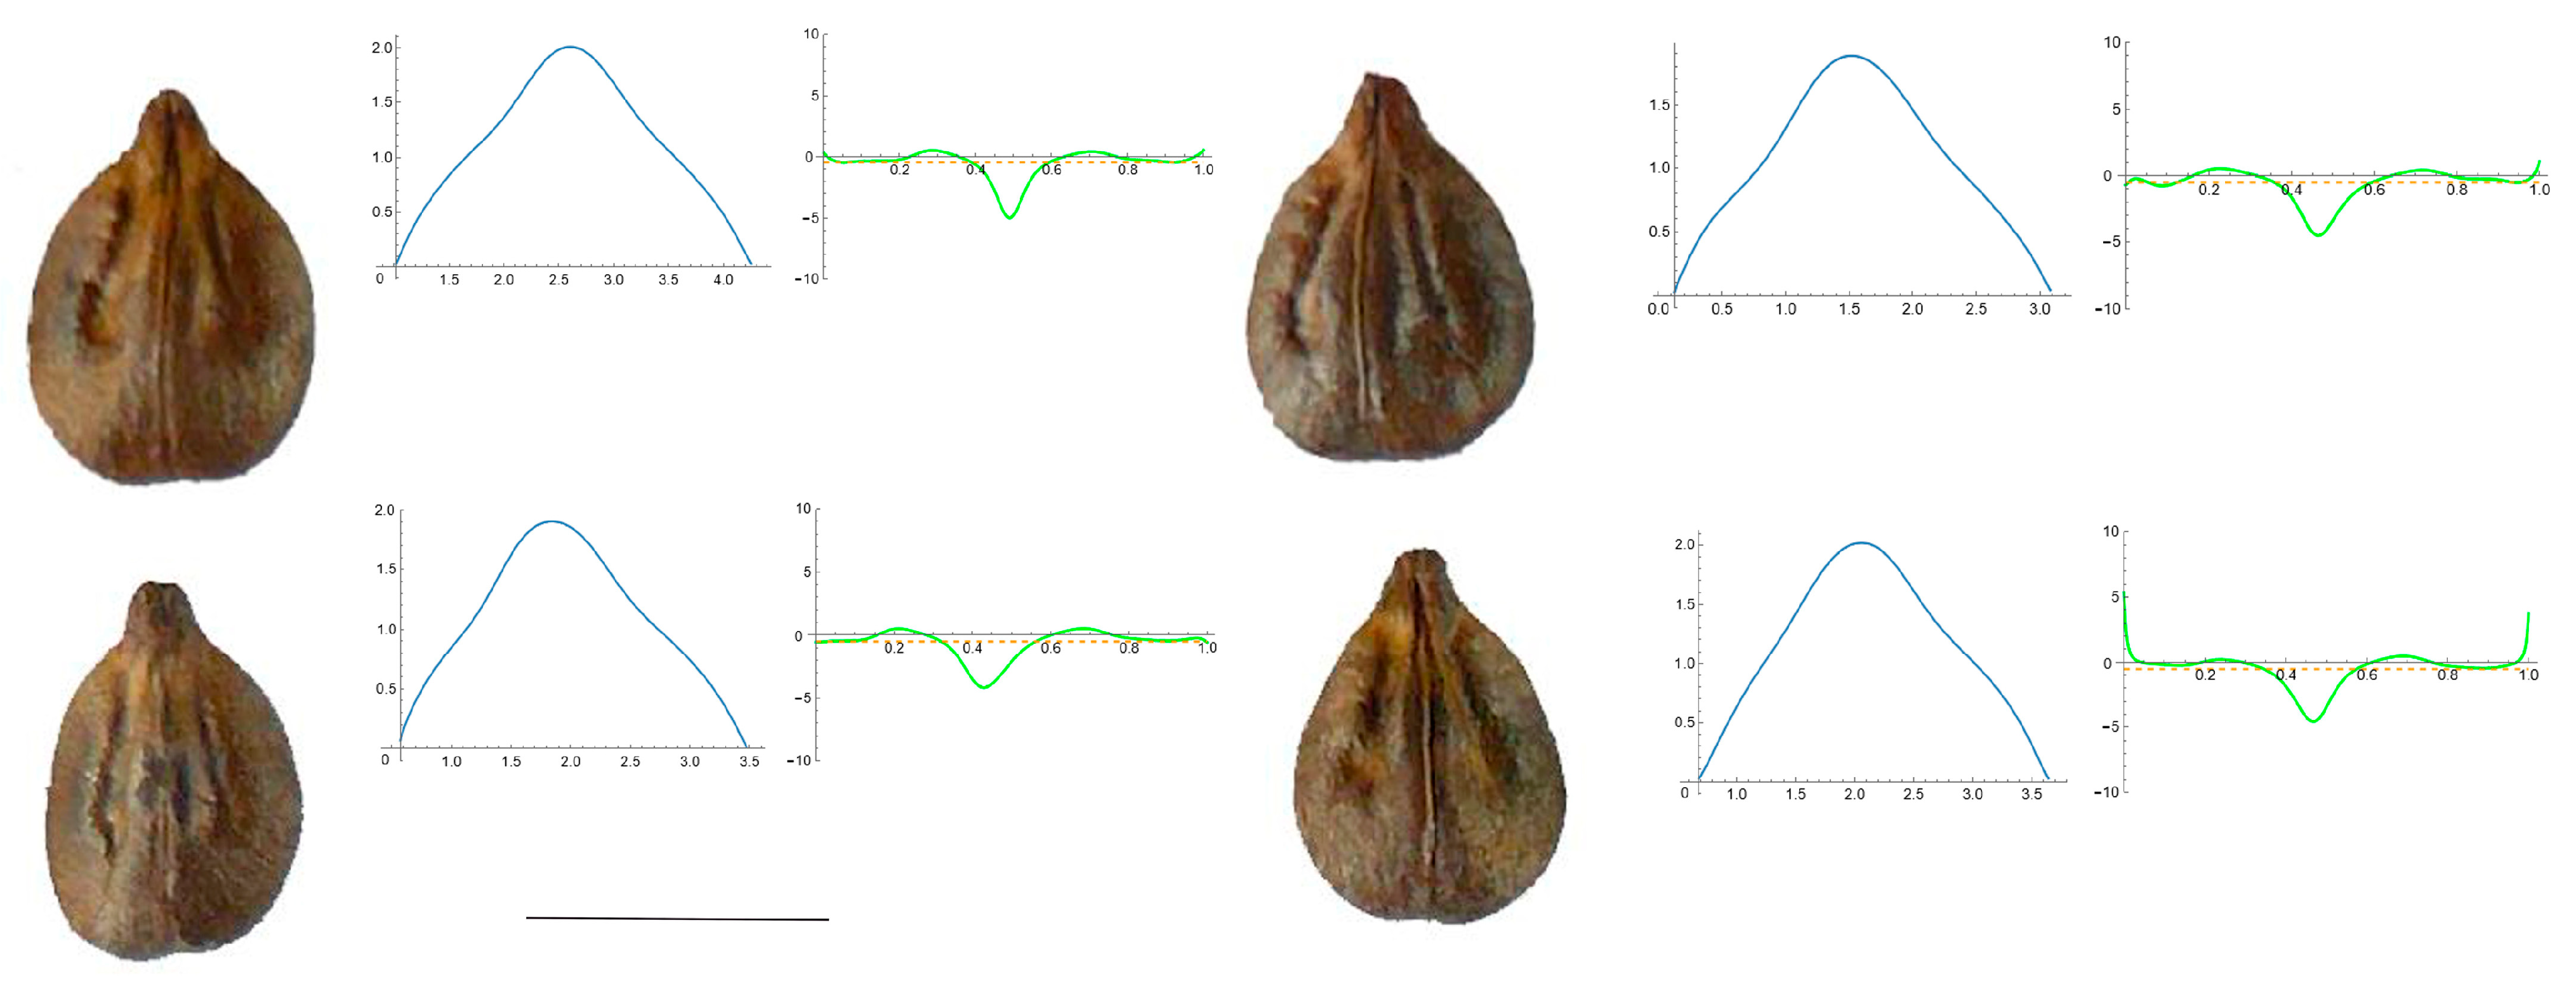
3.4. Curvature Analysis

3.4.1. Curvature Measurements

Table 4 presents the maximum and mean curvature values and maximum to mean rate for 12 species. The maximum curvature was between 2.16 and 5.07 and distributed in the species forming five groups with significant differences between them. The highest values were observed in Ampelopsis aconitifolia, Cissus verticillata and V. berlandieri, followed by V. amurensis and V. doaniana; a third group included Parthenocissus quinquefolia, V. labrusca and V. rupestris. Intermediate low values were found for V. aestivalis, and the lowest values were found in V. californica. V. candicans had values between those of V. aestivalis and V. riparia, and this species had values close to that of P. quinquefolia. Mean curvature values were between 0.35 (V. labrusca) and 0.65 (Cissus verticillata), and split the species into five groups, with some intermediate values between them. The highest mean curvature corresponded to Ampelopsis aconitifolia and Cissus verticillata, followed by V. aestivalis. A third group was formed by V. berlandieri and V. doaniana, followed by V. riparia, and finally the lowest mean curvature values corresponded to V. labrusca. Ratio max. to mean curvature values were between 4.57 (V. californica) and 10.08 (V. berlandieri), indicating that the mean curvature values were considerably lower than the maximum values.

3.4.2. Seed Morphological Analysis

Depending on the shape of the apex, the seeds were divided into three groups: seeds with one point of maximum curvature (acute), seeds with two peaks (plane) and seeds of a mixed type with one or two peaks, variable among the seeds. The first group (see Section 1) includes A. aconitifolia, C. verticillata, P. quinquefolia and three species of Vitis: V. amurensis, V. doaniana, and V. labrusca. The second group (see Section 2) is composed of four species of Vitis: V. aestivalis, V. berlandieri, V. candicans and V. rupestris. The group of species with mixed types of seed peaks includes V. californica and V. riparia; see Section 3. The following sub-sections contain images with a representative example of each of these three types. The remaining are given in Appendix A.

Section 1: Genera and Species with One Point of Maximum Curvature at Their Seed Apex (Acute)

Figure 4 shows the images of four seeds of A. aconitifolia with the Bézier curves representing their apex and the corresponding curvature values. Similar figures were obtained for the other species in this group (Figure A1, Figure A2, Figure A3, Figure A4 and Figure A5 in Appendix A).

Section 2: Species with Two Points of Maximum Curvature at Their Apex (Plane)

This group is composed of V. aestivalis, V. berlandieri, V. candicans and V. rupestris. Seed images, Bézier curves and curvature values for V. aestivalis are shown in Figure 5, and for the other three species they are shown in Figure A6, Figure A7 and Figure A8 in Appendix A.

Section 3: Species of an Intermediate or Mixed Type at Their Apex (Acute and Plane)

The intermediate-type seeds included those of V. californica and V. riparia, as shown in Figure 6 and Figure 7, respectively.

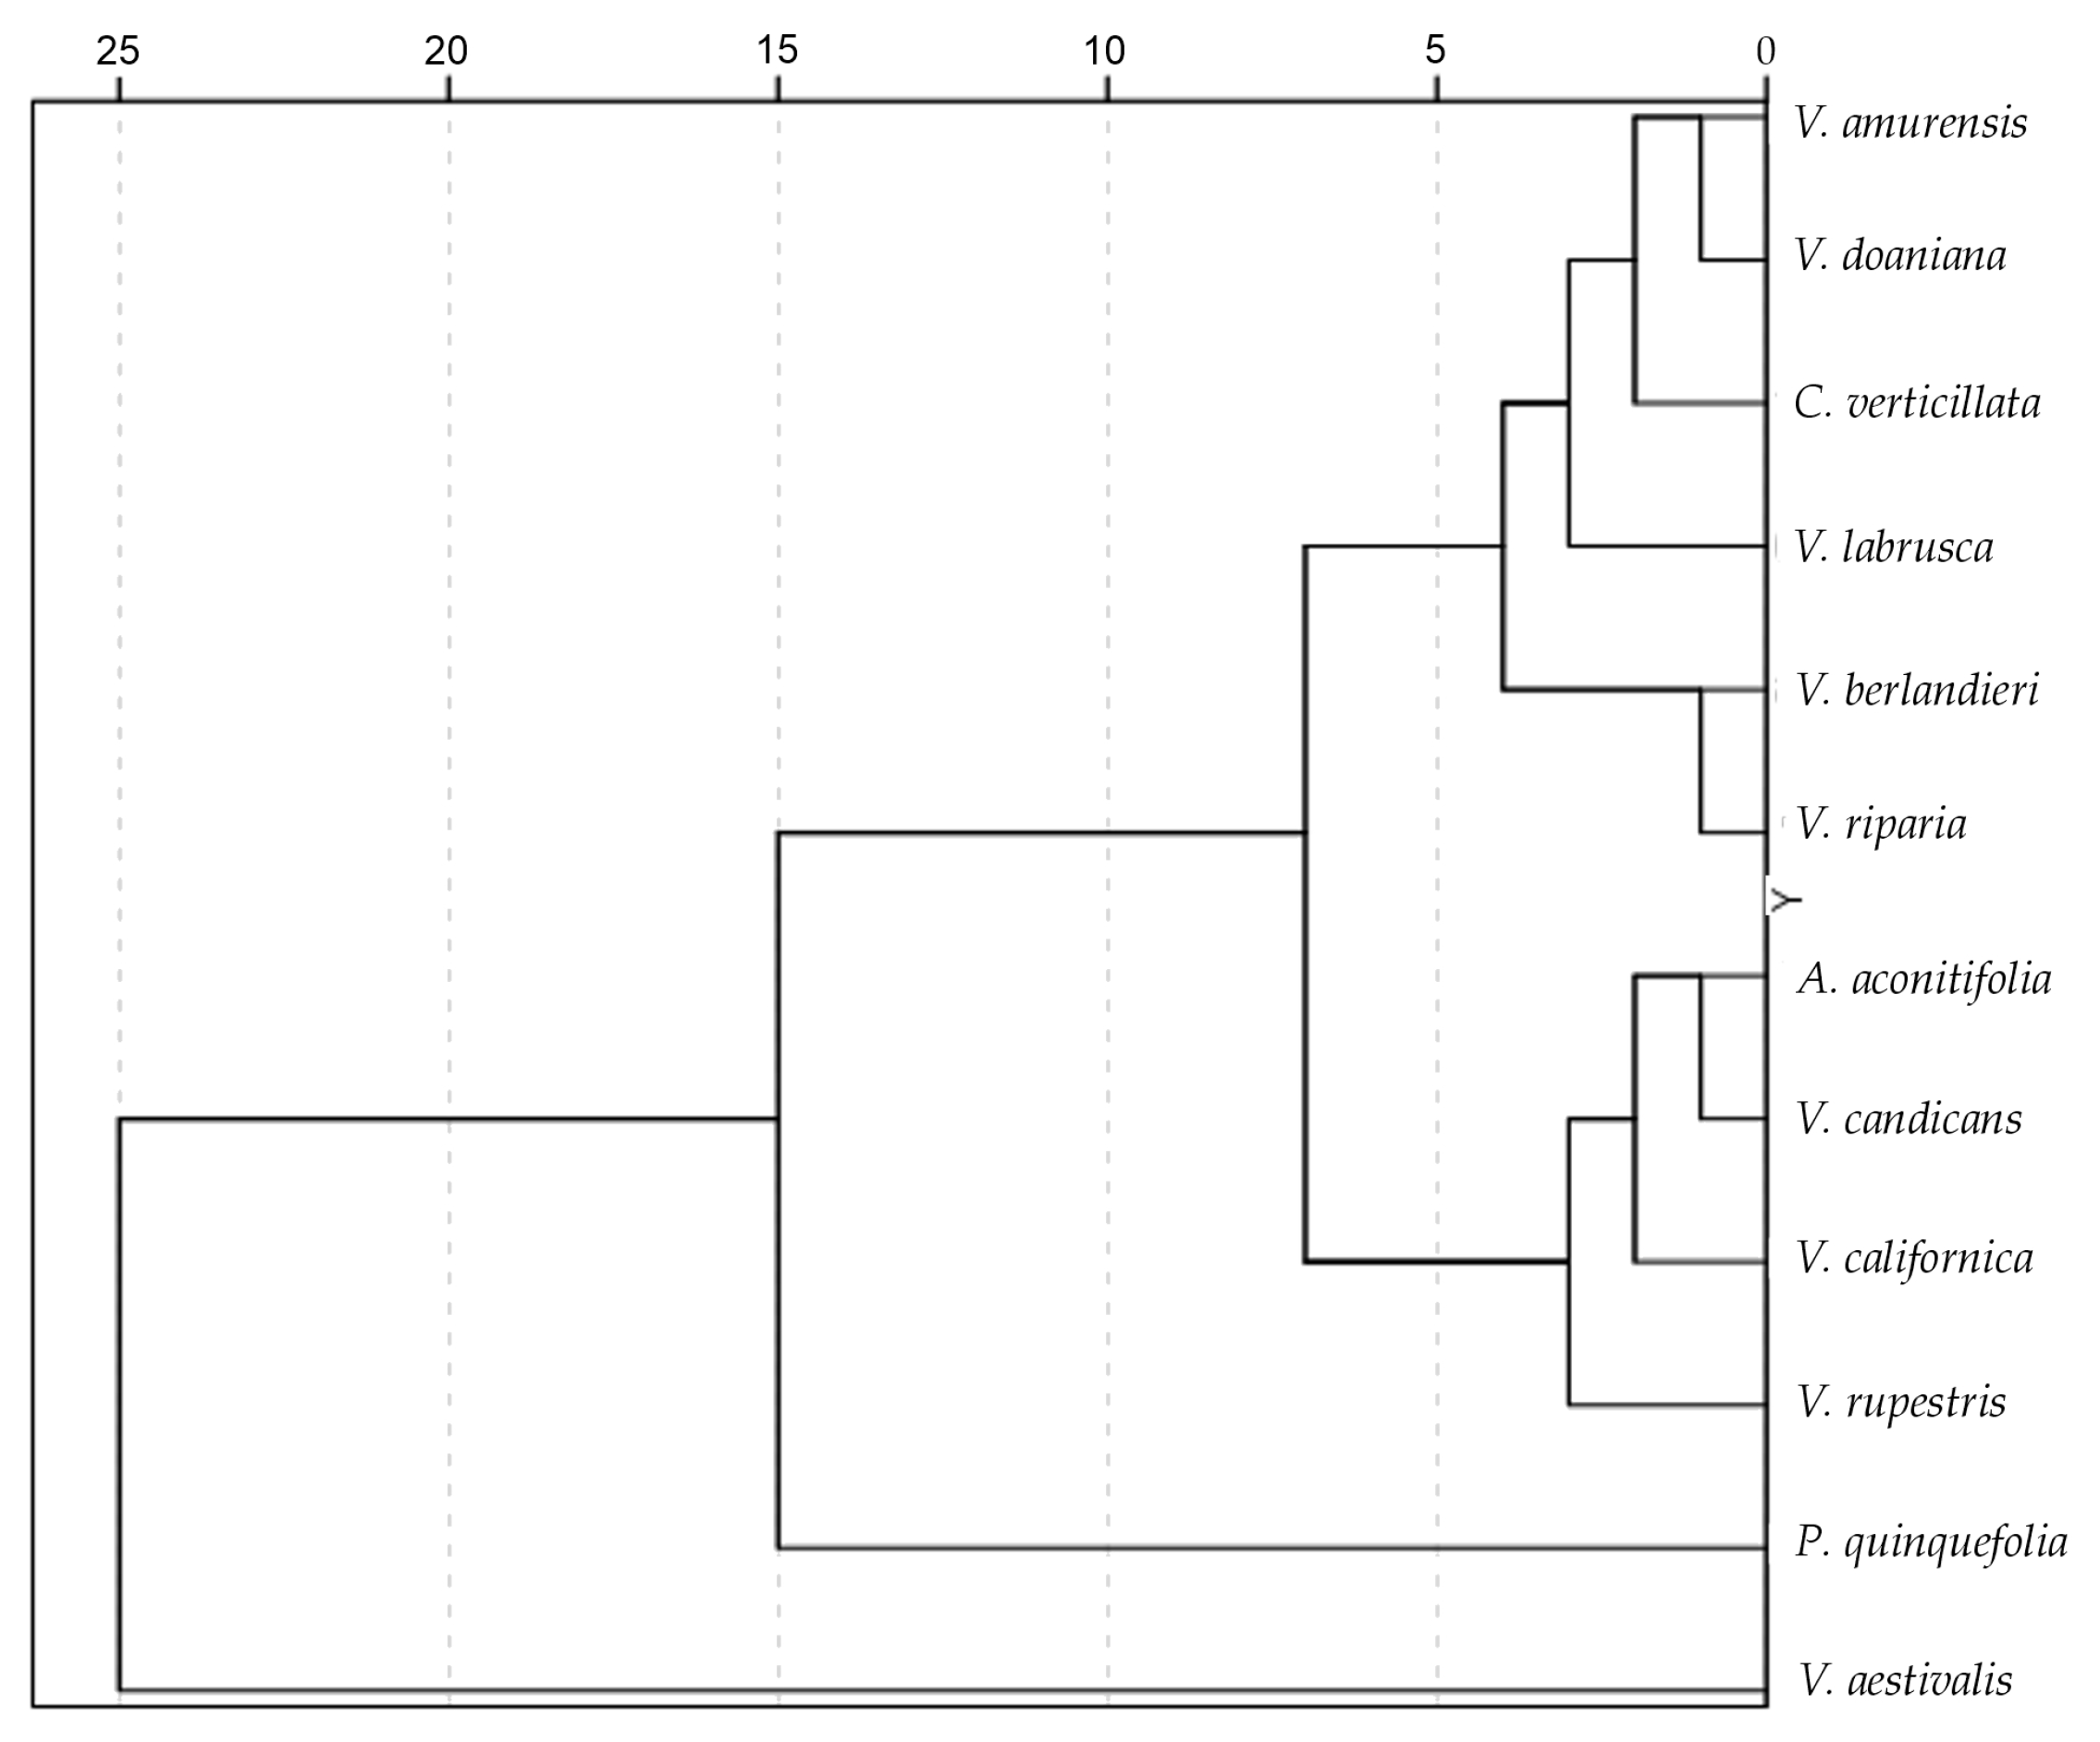
3.5. Symmetry Analysis

The results of symmetry quantification in nine species of Vitis and three related species are presented in Table 5. The highest values of symmetry were found in P. quinquefolia, and the lowest were found in V. labrusca. Among the Vitis species, significant differences were found between V. labrusca and all the other species, as well as between V. rupestris (with higher values) and V. aestivalis and V. amurensis (with lower values).

4. Discussion

Seeds within the Vitaceae family exhibit a diverse range of shapes, often featuring protrusions of varying sizes and shapes on their surfaces across different genera [38]. In genera such as Vitis and its relatives, seeds typically possess a slightly compressed, rounded shape with a discernible polarity in length. This polarity distinguishes an apical side, where they attach to the berry pedicel, from a free basal side, which tends to be more rounded. Variable bilateral symmetry is observed along the major axis, while in the third dimension (height), the dorsal side tends to be more rounded compared to the ventral side, which may contain a rib. Consequently, seeds may exhibit characteristic forms, ranging from a water drop to a heart shape [24,25,38].
An often-overlooked aspect in seed shape analysis is the stability of shape within populations, whether within defined populations at specific stages or across populations of the same species grown under different geographical or climatic conditions. Low J index values for seeds within a population, when tested against the average silhouette of the same population, indicate significant shape variation. This phenomenon was observed in populations of V. californica and V. aestivalis in this study, with respective J index values of 86.5 and 87.5, and, to a lesser extent, in V. riparia, V. rupestris and V. labrusca (88.1, 88.3, and 88.6 respectively). High coefficients of variation for general morphological measurements in these populations further support the notion of shape variation. Other populations corresponding to different species exhibited J index values close to or over 90, indicating shape homogeneity within those populations. Another significant aspect concerns the similarity of seed shapes between different populations of the same species. For instance, seed images of V. aestivalis shown on the University of Michigan website [39] are different from those in our study (see later). Similarly, the seeds of V. labrusca in Ardeghi et al. [40] are also slightly different than those here and in our previous work [24]. It remains to be investigated whether these variations are due to environmental factors and the extent of shape variation between populations of each species. Considering the scarcity of recent morphological studies compared to molecular analyses, further research is warranted to enhance our understanding of shape variation in seed populations.
The results of shape comparison with models derived from average silhouettes have been expressed in terms of J index, representing the percentage of similarity between seed images and the average silhouette of each species. These relationships were visualized in a dendrogram. Phylogenetic dendrograms of Vitis and related species have been elaborated using various DNA sequence-based methods, generally indicating clear separation between genera such as Cissus, Ampelopsis and Parthenocissus from Vitis species [41,42,43,44]. In our dendrogram, the species of different genera, Ampelopsis aconitifolia, Cissus verticillata, and Parthenocissus quinquefolia, were dispersed among the species of Vitis. From the point of view of shape analysis, it may be interesting to note the increased similarity with Ampelopsis, Cissus or Parthenocissus in the different species of Vitis, as was recently observed in Cucurbitaceae [26]. However, as observed in Cucurbitaceae, these results underscore the limitations of using the J index with geometric models in taxonomy beyond the genus level. The application of seed shape analysis to taxonomic categories higher than genera results in a high degree of homoplasy, where a parallel evolution of a given character in different groups does not necessarily reflect a phylogenetic relationship [45]. Nevertheless, the dendrogram based on the J index was very similar to the dendrogram resulting from the analysis performed using data from the general measurements, as well as curvature and symmetry analysis, indicating the applicability of J index as a general measurement for taxonomic purposes at the infra-generic level. Additionally, our results align with the relationship between Vitis species observed in dendrograms based on molecular analysis, particularly the associations between V. riparia and V. berlandieri, as well as between V. amurensis and V. doaniana [43].
In the dendrogram, species of Vitis could be grouped into two distinct clusters. One included V. rupestris, V. californica and V. candicans, associated to Ampelopsis aconitifolia, and the other was formed from the remaining species, associated with Cissus verticillata. The first group (associated with Ampelopsis) had, in general, lower curvature values, while species with higher curvature values (V. berlandieri, V. amurensis, V. doaniana, V. labrusca, V. riparia) were found in the second group. The species with the highest value of aspect ratio, V. aestivalis, gave lowest values of J index when compared to other species. In consequence, this species was clearly divergent in the dendrogram based on all J index values.
An intriguing aspect is the comparison of seed morphology between Vitis species and varieties and cultivars of V. vinifera. Most species described here displayed low aspect ratios between 1.28 and 1.5 (Stummer index between 0.74 and 0.78). In archeobotany, the seeds found with these values are sometimes described as V. sylvestris [17], and in fact, their average silhouettes resemble the model described for this species [25]. On the other hand, lower values of Stummer index are attributed to cultivated V. vinifera varieties. However, the values observed for V. aestivalis seeds in this study, corresponding to a Stummer index of 0.54, indicate elongated seeds in some species other than V. vinifera, at least under cultivation. Nevertheless, this finding contradicts data from other sources [39,43], where V. aestivalis seeds had a higher Stummer index, and must be interpreted with caution, until the results of further analysis with other populations of V. aestivalis are available.
It is widely accepted that most European Vitis cultivars originated from the domestication of V. vinifera ssp. sylvestris (C.C.Gmel.) Hegi (wild grape) [46,47,48]. Nevertheless, the possibility that some cultivated varieties had their origin in other species remains open as a subject of further investigation. Among the species assessed in this work, V. aestivalis, V. berlandieri, V. labrusca, and V. rupestris have already been recognized as allochthonous and naturalized in Europe [49]. The adscription of a given shape to a Vitis species, variety or form requires the analysis of many seeds with multiple origins and diverse growth conditions.

5. Conclusions

The comparative analysis of seed shapes across genera within different tribes of the Vitaceae family indicates a high degree of homoplasy in this family that probably prevents taxonomic application in categories higher than genus. Nevertheless, within the same genus, there can be a quantitative application, as demonstrated here in the case of Vitis. As Vitis is a genus with species both wild and domesticated in the Mediterranean area, with hard seeds and frequently found in archeological sites, the use of seed morphological methods based on shape quantification and comparison is a promising technique in paleobotany and archeology, as well as for the phenotyping of varieties. The protocols developed here contribute to establishing relationships between Vitis species and varieties, and allow us to check hypotheses, such as whether the origin of the cultivated varieties was within V. vinifera var. sylvestris, as is currently accepted, or whether other species of Vitis may be at the origin of some cultivars.

Supplementary Materials

The following are available at Zenodo (https://zenodo.org/uploads/10628169; accessed on 18 February 2024): (1) Seed images of all species analyzed (JPEG, color, used in curvature analysis; JPEG, black and white, used for general morphological measurements, symmetry and J index calculation). (2) Images used for J index calculation. (3) Images used for symmetry analysis. (4) Mathematica files for curvature analysis. The protocol to derive average silhouettes is described in: https://zenodo.org/record/4478344#.YBPOguhKiM8; accessed on 18 February 2024.

Author Contributions

Conceptualization, E.C.; methodology, J.J.M.-G., J.L.R.-L., D.G.d.P., F.C.S.d.S., G.M.-O., Á.T. and E.C.; software, J.J.M.-G.; validation, J.J.M.-G., J.L.R.-L., D.G.d.P., F.C.S.d.S., G.M.-O., Á.T. and E.C. formal analysis, J.J.M.-G., J.L.R.-L., F.C.S.d.S., G.M.-O., Á.T. and E.C.; investigation, J.J.M.-G., J.L.R.-L., D.G.d.P., F.C.S.d.S., G.M.-O., Á.T. and E.C.; resources, J.J.M.-G., J.L.R.-L., D.G.d.P., F.C.S.d.S., G.M.-O., Á.T. and E.C.; data curation, J.J.M.-G.; writing—original draft preparation, E.C.; writing—review and editing, J.J.M.-G., J.L.R.-L., D.G.d.P., F.C.S.d.S., G.M.-O., Á.T. and E.C. All authors have read and agreed to the published version of the manuscript.

Funding

Project “CLU-2019-05-IRNASA/CSIC Unit of Excellence”, funded by the Junta de Castilla y León and co-financed by the European Union (ERDF “Europe drives our growth”).

Institutional Review Board Statement

Not applicable.

Informed Consent Statement

Not applicable.

Data Availability Statement

The original contributions presented in the study are included in the article and Supplementary Material, further inquiries can be directed to the corresponding author.

Conflicts of Interest

The authors declare no conflicts of interest.

Appendix A

Figure A1, Figure A2, Figure A3, Figure A4 and Figure A5. Curvature analysis in seeds representative of the acute type (one point of maximum curvature). Figure A1, Figure A2, Figure A3, Figure A4 and Figure A5 contain four representative seeds of C. verticillata, P. quinquefolia, V. amurensis, V. doaniana and V. labrusca, respectively, with the Bézier curves representing their apex and the corresponding curvature values.
Figure A1. Four representative seeds of Cissus verticillata with their respective Bézier curves representing their apex and the corresponding curvature values. Bar represents 5 mm. Solid lines in blue: Bézier curve. Solid lines in green: curvature. Dashed lines: mean curvature.
Horticulturae 10 00285 g0a1
Figure A2. Four representative seeds of Parthenocissus quinquefolia with their respective Bézier curves representing their apex and the corresponding curvature values. Bar represents 5 mm. Solid lines in blue: Bézier curve. Solid lines in green: curvature. Dashed lines: mean curvature.
Horticulturae 10 00285 g0a2
Figure A3. Four representative seeds of Vitis amurensis with their respective Bézier curves representing their apex and the corresponding curvature values. Bar represents 5 mm. Solid lines in blue: Bézier curve. Solid lines in green: curvature. Dashed lines: mean curvature.
Horticulturae 10 00285 g0a3
Figure A4. Four representative seeds of Vitis x doaniana with their respective Bézier curves representing their apex and the corresponding curvature values. Bar represents 5 mm. Solid lines in blue: Bézier curve. Solid lines in green: curvature. Dashed lines: mean curvature.
Horticulturae 10 00285 g0a4
Figure A5. Four representative seeds of Vitis labrusca with their respective Bézier curves representing their apex and the corresponding curvature values. Bar represents 5 mm. Solid lines in blue: Bézier curve. Solid lines in green: curvature. Dashed lines: mean curvature.
Horticulturae 10 00285 g0a5
Figure A6. Four representative seeds of Vitis berlandieri with their respective Bézier curves representing their apex and the corresponding curvature values. Bar represents 5 mm. Solid lines in blue: Bézier curve. Solid lines in green: curvature. Dashed lines: mean curvature.
Horticulturae 10 00285 g0a6
Figure A7. Four representative seeds of Vitis candicans with their respective Bézier curves representing their apex and the corresponding curvature values. Bar represents 5 mm. Solid lines in blue: Bézier curve. Solid lines in green: curvature. Dashed lines: mean curvature.
Horticulturae 10 00285 g0a7
Figure A8. Four representative seeds of Vitis rupestris with their respective Bézier curves representing their apex and the corresponding curvature values. Bar represents 5 mm. Solid lines in blue: Bézier curve. Solid lines in green: curvature. Dashed lines: mean curvature.
Horticulturae 10 00285 g0a8

References

  1. FAO. Food and Agriculture Organization of the United Nations. Available online: http://faostat.fao.org (accessed on 18 February 2024).
  2. OIV. Office International de la Vigne et du Vin. Available online: http://www.oiv.int/ (accessed on 18 February 2024).
  3. Vivier, M.A.; Pretorius, I.S. Genetically tailored grapevines for the wine industry. Trends Biotechnol. 2002, 20, 472–478. [Google Scholar] [CrossRef]
  4. Wen, J. Vitaceae. In The Families and Genera of Vascular Plants; Kubitzki, K., Ed.; Springer: Berlin/Heidelberg, Germany, 2007; Volume 9, pp. 467–479. [Google Scholar]
  5. POWO. Plants of the World Online. Facilitated by the Royal Botanic Gardens, Kew. Published on the Internet. 2023. Available online: http://www.plantsoftheworldonline.org/ (accessed on 18 February 2024).
  6. Arrigo, N.; Arnold, C. Naturalised Vitis Rootstocks in Europe and consequences to native wild grapevine. PLoS ONE 2007, 2, e521. [Google Scholar] [CrossRef]
  7. Pipia, I.; Gogniashvili, M.; Tabidze, V.; Beridze, T.; Gamkrelidze, M.; Gotsiridze, V.; Melyan, G.; Musayev, M.; Salimov, V.; Beck, J.; et al. Plastid DNA sequence diversity in wild grapevine samples (Vitis vinifera subsp. sylvestris) from the Caucasus region. Vitis 2012, 51, 119–124. [Google Scholar]
  8. Laguna Lumbreras, E. Sobre las formas naturalizadas de Vitis L. (Vitaceae) en la Comunidad Valenciana, I. Especies. Flora Montiberica 2003, 23, 46–82. [Google Scholar]
  9. Jacquat, C.H.; Martinoli, D. Vitis vinifera L.: Wild or cultivated? Study of the grape pips found at Petra, Jordan; 150 B.C.-A.D. 40. Veget. Hist. Archaeobot. 1999, 8, 25–30. [Google Scholar] [CrossRef]
  10. Gitea, M.A.; Bungau, S.G.; Gitea, D.; Pasca, B.M.; Purza, A.L.; Radu, A. Evaluation of the phytochemistry-therapeutic activity relationship for grape seeds Oil. Life 2023, 13, 178. [Google Scholar] [CrossRef]
  11. Barbagallo, M.G.; Patti, D.; Pisciotta, A. Phenotypic traits of berries and seeds of Sicilian grape cultivars (Vitis vinifera L.). Sci. Hortic. 2020, 261, 109006. [Google Scholar] [CrossRef]
  12. Sharafan, M.; Malinowska, M.A.; Kubicz, M.; Kubica, P.; Gémin, M.; Abdallah, C.; Ferrier, M.; Hano, C.; Giglioli-Guivarc’h, N.; Sikora, E.; et al. Shoot Cultures of Vitis vinifera (Vine Grape) Different cultivars as a promising innovative cosmetic raw material—Phytochemical profiling, antioxidant potential, and whitening activity. Molecules 2023, 28, 6868. [Google Scholar] [CrossRef]
  13. Rivera, D.; Miralles, B.; Obón, C.; Carreño, E.; Palazón, J.A. Multivariate analysis of Vitis subgenus Vitis seed morphology. Vitis 2007, 46, 158–167. [Google Scholar]
  14. Planchon, J.E. Ampelideae, Monographie des Ampélidées Vraies. In Monographiae Phanerogamarum; De Candolle, A.P., Ed.; Treuttel et Würtz: Paris, France, 1887; Volume 5, pp. 305–368. [Google Scholar]
  15. Viala, P.; Péchoutre, P. Morphologie externe de la graine In Ampélographie; Viala, P., Vermorel, V., Eds.; Masson et Cie.: Paris, France, 1910; pp. 156–166. [Google Scholar]
  16. Ocete, R.; Cantos, M.; López, M.A.; Gallardo, A.; Pérez, M.A.; Troncoso, A.; Lara, M.; Failla, O.; Ferragut, F.J.; Liñán, J. Caracterización y Conservación del Recurso Fitogenético vid Silvestre en Andalucía; Consejería de Medio Ambiente, Junta de Andalucía: Seville, Spain, 2007. [Google Scholar]
  17. Hajnalová, M.; Látková, M.; Kajanová, M.; Eliáš jun, P.; Ďurišová, Ľ. Wild or cultivated? A study of Vitis sylvestris in natura in Slovakia and implications for archaeology and archaeobotany (morphometric approach). Veg. Hist. Archaeobotany 2023, 32, 321–337. [Google Scholar] [CrossRef]
  18. Orrú, M.; Grillo, O.; Lovicu, G.; Venora, G.; Bacchetta, G. Morphological characterisation of Vitis vinifera L. seeds by image analysis and comparison with archaeological remains. Veget. Hist. Archaeobot. 2012, 22, 231–242. [Google Scholar] [CrossRef]
  19. Orrú, M.; Grillo, O.; Venora, G.; Bacchetta, G. Seed morpho-colorimetric analysis by computer vision: A helpful tool to identify grapevine (Vitis vinifera L.) cultivars. Grape Wine Res. 2015, 21, 508–519. [Google Scholar] [CrossRef]
  20. Sonka, M.; Hlavac, V.; Boyle, R. Image Processing Analysis and Machine Vision, 3rd ed.; Thomson Learning: Toronto, ON, Canada, 2008; 829p. [Google Scholar]
  21. Ucchesu, M.; Orrú, M.; Grillo, O.; Venora, G.; Usai, A.; Serreli, P.F.; Bacchetta, G. Earliest evidence of a primitive cultivar of Vitis vinifera L. during the Bronze Age in Sardinia (Italy). Veget. Hist. Archaeobot. 2015, 24, 587–600. [Google Scholar] [CrossRef]
  22. Ucchesu, M.; Orrú, M.; Grillo, O.; Venora, G.; Paglietti, G.; Ardu, A.; Bacchetta, G. Predictive Method for Correct Identification of Archaeological Charred Grape Seeds: Support for Advances in Knowledge of Grape Domestication Process. PLoS ONE 2016, 11, e0149814. [Google Scholar] [CrossRef]
  23. Milanesi, C.; Costantini, L.; Firmati, M.; Antonucci, F.; Faleri, C.; Buracchi, A.; Cresti, M. Geometric morphometry and archaeobotany: Characterisation of grape seeds (Vitis vinifera L.) by analysis of form. Open Access Libr. J. 2014, 1, e634. [Google Scholar] [CrossRef]
  24. Martín-Gómez, J.J.; Gutiérrez del Pozo, D.; Ucchesu, M.; Bacchetta, G.; Cabello Sáenz de Santamaría, F.; Tocino, Á.; Cervantes, E. Seed morphology in the Vitaceae based on geometric models. Agronomy 2020, 10, 739. [Google Scholar] [CrossRef]
  25. Cervantes, E.; Martín-Gómez, J.J.; Espinosa-Roldán, F.E.; Muñoz-Organero, G.; Tocino, Á.; Cabello-Sáenz de Santamaría, F. Seed morphology in key Spanish grapevine cultivars. Agronomy 2021, 11, 734. [Google Scholar] [CrossRef]
  26. Martín-Gómez, J.J.; Gutiérrez del Pozo, D.; Rodríguez-Lorenzo, J.L.; Tocino, Á.; Cervantes, E. Geometric analysis of seed shape diversity in the Cucurbitaceae. Seeds 2023, 3, 40–55. [Google Scholar] [CrossRef]
  27. Cervantes, E.; Tocino, A. Geometric analysis of Arabidopsis root apex reveals a new aspect of the ethylene signal transduction pathway in development. J. Plant Physiol. 2005, 162, 1038–1045. [Google Scholar] [CrossRef]
  28. Noriega, A.; Tocino, A.; Cervantes, E. Hydrogen peroxide treatment results in reduced curvature values in the Arabidopsis root apex. J. Plant Physiol. 2009, 166, 554–558. [Google Scholar] [CrossRef]
  29. Martín-Gómez; Rewicz; Goriewa-Duba; Wiwart; Tocino; Cervantes Morphological Description and classification of wheat kernels based on geometric models. Agronomy 2019, 9, 399. [CrossRef]
  30. Cervantes, E.; Martín-Gómez, J.J.; Espinosa-Roldán, F.E.; Muñoz-Organero, G.; Tocino, Á.; Cabello Sáenz de Santamaría, F. Seed apex curvature in key Spanish grapevine cultivars. Vitic. Data J. 2021, 3, e66478. [Google Scholar] [CrossRef]
  31. Wen, J.; Lu, L.-M.; Nie, Z.-L.; Liu, X.-Q.; Zhang, N.; Ickert-Bond, S.; Gerrath, J.; Manchester, S.R.; Boggan, J.; Chen, Z.-D. A new phylogenetic tribal classification of the grape family (Vitaceae). J. Syst. Evol. 2018, 56, 262–272. [Google Scholar] [CrossRef]
  32. Ferreira, T.; Rasband, W. Imagej User Guide-Ij1.46r. 2012; 186 p. Available online: http://imagej.nih.gov/ij/docs/guide (accessed on 19 May 2020).
  33. Cox, E.P. A method of assigning numerical and percentage values to the degree of roundness of sand grains. J. Paleontol. 1927, 1, 179–183. [Google Scholar]
  34. Riley, N.A. Projection sphericity. J. Sediment. Pet. 1941, 11, 94–97. [Google Scholar]
  35. Schwartz, H. Two-dimensional feature-shape indexes. Mikroskopie 1980, 37, 64–67. [Google Scholar]
  36. Sokal, R.R.; Braumann, C.A. Significance tests for coefficients of variation and variability profiles. Syst. Zool. 1980, 29, 50. [Google Scholar] [CrossRef]
  37. Martín-Gómez, J.J.; Rodríguez-Lorenzo, J.L.; Tocino, Á.; Janoušek, B.; Juan, A.; Cervantes, E. The outline of seed silhouettes: A morphological approach to Silene (Caryophyllaceae). Plants 2022, 11, 3383. [Google Scholar] [CrossRef] [PubMed]
  38. Cervantes, E.; Martín-Gómez, J.J.; Gutiérrez del Pozo, D.; Tocino, Á. Seed Geometry in the Vitaceae. Plants 2021, 10, 1695. [Google Scholar] [CrossRef]
  39. Burnham, R.J. Climbers. Censusing Lianas in Mesic Biomes of Eastern Regions. Vitis aestivalis Michx. Available online: https://climbers.lsa.umich.edu/vitis-aestivalis/ (accessed on 18 February 2024).
  40. Ardenghi, N.M.G.; Galasso, G.; Banfi, E.; Cauzzi, P. Vitis × novae-angliae (Vitaceae): Systematics, distribution and history of an “illegal” alien grape in Europe. Willdenowia 2015, 45, 197–207. [Google Scholar] [CrossRef]
  41. Wan, Y.; Schwaninger, H.R.; Baldo, A.M.; Labate, J.A.; Zhong, G.Y.; Simon, C.J. A phylogenetic analysis of the grape genus (Vitis L.) reveals broad reticulation and concurrent diversification during neogene and quaternary climate change. BMC Evol. Biol. 2013, 13, 141. [Google Scholar] [CrossRef] [PubMed]
  42. da Costa, A.F.; Teodoro, P.E.; Bhering, L.L.; Tardin, F.D.; Daher, R.F.; Campos, W.F.; Viana, A.P.; Pereira, M.G. Molecular analysis of genetic diversity among vine accessions using DNA markers. Genet. Mol. Res. 2017, 16, gmr16029586. [Google Scholar] [CrossRef]
  43. Péros, J.P.; Launay, A.; Peyrière, A.; Berger, G.; Roux, C.; Lacombe, T.; Boursiquot, J.M. Species relationships within the genus Vitis based on molecular and morphological data. PLoS ONE 2023, 18, e0283324. [Google Scholar] [CrossRef]
  44. Kerekes, A.; Tóth-Lencsés, K.A.; Kiss, E.; Szőke, A. Phylogeny of Vitis species based on a VvMybA1 marker analysis. Acta Hortic. 2019, 1248, 135–140. [Google Scholar] [CrossRef]
  45. Hall, B.K. Homology and homoplasy. In Handbook of the Philosophy of Science, Philosophy of Biology; Matthen, M., Stephens, C., Eds.; Elsevier: Amstercam, The Netherlands, 2007; pp. 429–453. [Google Scholar]
  46. Olmo, H. The origin and domestication of the Vinifera grape. In The Origins and Ancient History of Wine; McGovern, P.E., Fleming, S.J., Katz, S.H., Eds.; Gordon and Breach: Amsterdam, The Netherlands, 1995; pp. 31–43. [Google Scholar]
  47. Cunha, J.; Baleiras-Couto, M.; Cunha, J.P.; Banza, J.; Soveral, A.; Carneiro, L.C.; Eiras-Dias, J.E. Characterization of Portuguese populations of Vitis vinifera L. ssp. sylvestris (Gmelin) Hegi. Genet. Resour. Crop. Evol. 2007, 54, 981–988. [Google Scholar] [CrossRef]
  48. Arroyo-García, R.; Lefort, F.; De Andrés, M.; Ibáñez, J.; Borrego, J.; Cabello, F.; Martínez-Zapater, J.M. Haplotypic polymorphisms for chloroplast microsatellites analysis in Vitis. Genome 2002, 45, 1142–1149. [Google Scholar] [CrossRef] [PubMed]
  49. Webb, D.A. Vitis. In Flora Europaea 2; Tutin, T.G., Heywood, V.H., Burges, N.A., Moore, D.M., Valentine, D.M., Walters, S.M., Webb, D.A., Eds.; Cambridge University Press: Cambridge, UK, 1968; Volume 246. [Google Scholar]
Figure 2. Average seed silhouettes of species analyzed. Bar represents 1 cm.
Horticulturae 10 00285 g002
Figure 3. Dendrogram showing the relationship between species analyzed based on their similarity with the models from average silhouettes of each species.
Horticulturae 10 00285 g003
Figure 4. Four representative seeds of Ampelopsis aconitifolia with their respective Bézier curves representing their apex and the corresponding curvature values. Bar represents 5 mm. Solid lines in blue: Bézier curve. Solid lines in green: curvature. Dashed lines: mean curvature.
Horticulturae 10 00285 g004
Figure 5. Four representative seeds of Vitis aestivalis with their respective Bézier curves representing their apex and the corresponding curvature values. Bar represents 5 mm. Solid lines in blue: Bézier curve. Solid lines in green: curvature. Dashed lines: mean curvature.
Horticulturae 10 00285 g005
Figure 6. Four representative seeds of Vitis californica with their respective Bézier curves representing their apex and the corresponding curvature values. Bar represents 5 mm. Solid lines in blue: Bézier curve. Solid lines in green: curvature. Dashed lines: mean curvature.
Horticulturae 10 00285 g006
Figure 7. Four representative seeds of Vitis riparia with their respective Bézier curves representing their apex and the corresponding curvature values. Bar represents 5 mm. Solid lines in blue: Bézier curve. Solid lines in green: curvature. Dashed lines: mean curvature.
Horticulturae 10 00285 g007
Table 1. Species analyzed in this work. Tribes are major clades in the Vitaceae as recognized in [31].
SpeciesTribe
Ampelopsis aconitifolia BungeAmpelopsideae
Cissus verticillata (L.) Nicolson and C.E. JarvisCisseae
Parthenocissus quinquefolia (L.) Planch.Parthenocisseae
Vitis aestivalis Michx.Viteae
Vitis amurensis Rupr.Viteae
Vitis berlandieri Planch.Viteae
Vitis californica ParryViteae
Vitis candicans Engelm. ex A.GrayViteae
Vitis x doaniana Munson ex VialaViteae
Vitis labrusca L.Viteae
Vitis riparia A. GrayViteae
Vitis rupestris ScheeleViteae
Table 2. Results of the comparison (Kruskal–Wallis test) of general morphological measurements, indicating the mean values (coefficients of variation between parentheses) for area (A), perimeter (P), length (L), width (W), circularity (C), aspect ratio (AR), roundness (R) and solidity (S) of the seed images for 10 species of Vitis and three related species. P, L and W are given in mm; A is given in mm2. Different super index letters indicate significant differences between numbers in each column.
SpeciesAPLWCARRS
Ampelopsis aconitifolia Bunge9.71 a
(6.4)
12.37 a
(4.4)
3.90 a
(4.1)
3.17 a
(3.7)
0.80 efg
(4.0)
1.23 b
(4.5)
0.81 e
(4.5)
0.975 e
(0.8)
Cissus verticillata (L.) Nicolson and C.E. Jarvis11.65 b
(5.5)
14.44 b
(3.6)
4.55 b
(3.1)
3.26 b
(3.1)
0.70 a
(5.5)
1.40 d
(2.8)
0.72 c
(2.7)
0.957 b
(0.6)
Parthenocisus quinquefolia (L.) Planch.14.84 d
(6.3)
15.24 c
(3.2)
4.64 b
(4.9)
4.07 f
(5.0)
0.80 fg
(2.8)
1.14 a
(7.6)
0.88 f
(7.6)
0.982 f
(0.4)
Vitis aestivalis Michx.17.92 f
(8.5)
17.87 f
(4.3)
6.21 gh
(6.0)
3.68 c
(6.4)
0.70 a
(4.1)
1.69 f
(9.4)
0.60 a
(9.8)
0.961 bc
(1.62)
Vitis amurensis Rupr.13.95 c
(4.90)
14.73 b
(3.0)
4.85 c
(3.3)
3.66 c
(3.4)
0.81 g
(2.6)
1.32 c
(4.4)
0.76 d
(4.4)
0.973 de
(0.42)
Vitis berlandieri Planch.17.40 ef
(5.2)
15.95 e
(3.0)
5.70 e
(4.2)
3.89 de
(4.7)
0.76 c
(3.0)
1.47 e
(7.2)
0.68 b
(7.2)
0.971 d
(0.5)
Vitis californica Parry14.67 cd
(10.0)
15.19 c
(5.5)
4.99 c
(7.7)
3.75 cd
(7.7)
0.80 defg
(3.7)
1.34 c
(12.1)
0.76 de
(11.7)
0.981 f
(0.5)
Vitis candicans Engelm. ex A.Gray16.85 e
(7.9)
16.62 de
(4.4)
5.26 d
(4.2)
4.08 ef
(7.1)
0.77 cd
(7.1)
1.30 bc
(8.9)
0.78 def
(8.7)
0.981 f
(0.46)
Vitis doaniana Munson ex Viala22.21 h
(5.3)
18.46 g
(2.5)
5.96 f
(3.4)
4.54 g
(4.3)
0.78 cdef
(2.7)
1.32 c
(5.8)
0.76 d
(5.6)
0.975 e
(0.4)
Vitis labrusca L.23.81 i
(6.6)
20.25 h
(5.1)
6.39 h
(5.0)
4.75 h
(3.9)
0.73 b
(5.9)
1.35 c
(5.9)
0.75 d
(5.9)
0.949 a
(1.4)
Vitis riparia A. Gray19.35 g
(7.4)
18.09 f
(3.8)
6.07 fg
(4.5)
4.06 f
(5.0)
0.74 b
(3.4)
1.50 e
(6.1)
0.67 b
(6.1)
0.963 c
(0.8)
Vitis rupestris Scheele15.62 d
(13.8)
15.90 cd
(7.7)
5.05 c
(9.0)
3.93 def
(6.0)
0.77 cde
(3.8)
1.29 bc
(6.4)
0.78 de
(6.2)
0.965 c
(0.9)
Values of aspect ratio are inverse to those of Stummer index (SI). The SI for 9 species of Vitis was as follows: V. aestivalis, 0.59; V. amurensis, 0.76; V. berlandieri, 0.68; V. californica, 0.75; V. candicans, 0.77; V. doaniana, 0.76; V. labrusca, 0.74; V. riparia, 0.67; V. rupestris, 0.78.
Table 3. Results of the comparison (Kruskal–Wallis test) of J index values in the seed images of different species with average silhouettes as models (coefficients of variation between parentheses). Different super index letters indicate significant differences between numbers in each column. Detached in bold are the values corresponding to seeds of a given species with their average silhouette included as the model. Abbreviations refer to the average silhouette of each species.
SpeciesModel
MAacMCveMPquMVaeMVamMVbeMVcaMVcanMVdoMVlaMVriMVru
A. aconitifolia90.0 f
(1.6)
83.9 abc
(3.2)
88.7 e
(1.9)
73.2 b
(4.3)
88.5 cdef
(2.8)
86.5 bcd
(2.7)
87.3 cde
(1.5)
90.9 e
(1.7)
89.1 cd
(2.2)
84.6 bc
(3.3)
81.7 b
(3.8)
90.4 e
(1.7)
C. verticillata86.1 cd
(1.8)
89.3 g
(0.9)
82.1 c
(2.0)
80.1 d
(2.0)
89.3 ef
(1.3)
89.8 fg
(1.2)
87.9 de
(0.9)
89.1 c
(1.1)
89.6 d
(1.2)
88.6 f
(1.0)
87.6 f
(1.0)
90.0 e
(1.6)
P. quinquefolia87.5 de
(2.4)
80.5 a
(5.6)
90.2 f
(1.9)
66.6 a
(5.2)
84.2 ab
(5.5)
79.2 a
(6.3)
83.6 b
(4.7)
88.6 cde
(4.6)
85.7 b
(4.9)
81.6 a
(4.4)
77.7 a
(5.6)
85.2 b
(3.9)
V. aestivalis76.9 a
(6.2)
83.5 abc
(3.8)
71.7 a
(6.7)
87.5 f
(4.3)
81.8 a
(5.6)
84.0 b
(4.8)
80.6 a
(5.3)
79.9 a
(6.0)
81.6 a
(5.3)
83.1 ab
(4.7)
84.9 cde
(3.8)
81.0 a
(5.2)
V. amurensis87.8 e
(2.1)
87.1 f
(1.2)
85.4 d
(2.8)
77.1 c
(2.9)
91.1 g
(1.1)
89.3 efg
(2.1)
88.3 e
(1.0)
91.2 e
(1.7)
91.2 e
(1.0)
87.9 ef
(1.8)
86.1 de
(1.8)
90.3 e
(1.1)
V. berlandieri84.8 c
(3.8)
86.3 def
(1.6)
80.4 bc
(5.0)
81.9 d
(4.4)
89.0 ef
(3.1)
89.9 g
(2.5)
86.9 cde
(3.0)
87.9 bc
(3.7)
88.4 cd
(3.6)
86.3 cde
(2.6)
87.0 ef
(1.9)
86.9 bcd
(3.6)
V. californica86.4 cde
(4.0)
82.6 ab
(4.0)
85.6 de
(6.5)
75.6 bc
(8.3)
86.7 bc
(2.5)
85.7 bcd
(4.1)
86.5 bcde
(3.3)
88.8 cde
(3.9)
86.9 b
(2.4)
84.4 b
(2.7)
81.8 bc
(6.1)
86.4 bc
(2.9)
V. candicans87.9 e
(2.3)
84.4 bcd
(2.6)
87.0 de
(4.1)
75.6 bc
(5.2)
89.0 def
(2.6)
86.1 bcde
(4.6)
87.4 de
(2.0)
91.4 e
(2.0)
89.0 cd
(2.0)
85.6 bcd
(2.7)
83.2 bcd
(4.1)
88.8 d
(1.7)
V. doaniana87.9 e
(2.2)
86.4 ef
(2.7)
85.3 d
(3.6)
77.2 c
(4.3)
90.4 fg
(1.8)
87.8 cdef
(2.9)
87.7 de
(1.7)
90.9 e
(1.8)
90.7 e
(2.0)
87.5 def
(2.3)
84.8 cd
(3.0)
90.0 e
(2.0)
V. labrusca85.0 c
(3.2)
85.4 cde
(2.2)
81.9 c
(4.4)
77.9 c
(3.1)
87.4 cde
(3.3)
85.3 bc
(3.1)
85.3 bc
(2.9)
88.9 cd
(2.6)
88.7 cd
(2.6)
88.6 f
(2.1)
83.6 bc
(2.7)
87.9 cd
(3.1)
V. riparia82.5 b
(3.2)
87.3 f
(1.6)
78.0 b
(3.5)
84.5 e
(3.4)
87.5 cd
(2.7)
89.3 fg
(1.8)
86.2 bcd
(2.0)
86.4 b
(3.0)
87.3 bc
(2.5)
86.9 de
(2.2)
88.1 g
(1.6)
85.9 b
(2.9)
V. rupestris88.3 e
(2.4)
86.8 ef
(2.6)
87.3 de
(2.0)
77.2 c
(3.7)
89.3 ef
(1.3)
88.3 def
(2.4)
87.7 de
(1.4)
90.8 de
(1.3)
90.3 de
(1.1)
87.8 ef
(2.2)
85.0 cd
(3.3)
90.9 e
(1.4)
Table 4. Results of the comparison (Kruskal–Wallis test) of curvature in the seed apex, indicating the mean values (coefficients of variation between parentheses) for maximum curvature (Max C.), mean curvature (Mean C.) and Max to mean curvature ratio (Ratio) for 10 species of Vitis and 3 related species. Different super index letters indicate significant differences between means for the same measurement (same column). N is the number of seeds analyzed. Curvature values are given in mm−1.
SpeciesNMax C.Mean C.Ratio
Ampelopsis aconitifolia Bunge205.07 f (22.87)0.59 g (4.58)8.60 def (25.05)
Cissus verticillata Nicolson and C.E. Jarvis205.03 f (26.65)0.65 g (30.73)10.0 ef (25.26)
Parthenocisus quinquefolia (L.) Planch.213.08 d (15.87)0.47 de (14.66)6.56 c (12.73)
Vitis aestivalis Michx.182.53 b (17.92)0.64 f (57.89)4.98 b (57.81)
Vitis amurensis Rupr.204.15 e (14.31)0.52 ef (5.38)7.94 de (12.91)
Vitis berlandieri Planch.104.79 f (8.72)0.48 d (3.25)10.08 f (10.63)
Vitis californica Parry202.16 a (66.69)0.50 def (17.75)4.57 a (91.66)
Vitis candicans Engelm. ex A.Gray202.54 bc (19.13)0.37 ab (11.03)6.91 c (19.31)
Vitis doaniana Munson ex Viala194.13 e (14.43)0.48 d (11.00)8.74 ef (17.32)
Vitis labrusca L.193.39 d (41.78)0.35 a (15.70)9.91 ef (45.46)
Vitis riparia A. Gray223.12 cd (38.34)0.44 c (12.85)7.03 cd (34.27)
Vitis rupestris Scheele223.30 d (21.17)0.40 b (15.15)8.39 def (22.97)
Table 5. Percent of symmetry in nine species of Vitis and three related species (coefficients of variation between parentheses). Different super index letters indicate significant differences between means for the same measurement (same column).
SpeciesSymmetry
Ampelopsis aconitifolia Bunge92.28 cde (2.1)
Cissus verticillata (L.) Nicolson and C.E. Jarvis91.23 bcd (1.6)
Parthenocissus quinquefolia (L.) Planch.92.40 e (1.8)
Vitis aestivalis Michx.90.85 b (1.6)
Vitis amurensis Rupr.91.25 bc (0.8)
Vitis berlandieri Planch.91.70 bcde (1.7)
Vitis californica Parry92.13 bcde (1.9)
Vitis candicans Engelm. ex A.Gray91.33 bcd (1.3)
Vitis doaniana Munson ex Viala90.99 bcde (3.0)
Vitis labrusca L.88.57 a (2.6)
Vitis riparia A. Gray91.53 bcde (1.6)
Vitis rupestris Scheele92.51 de (1.4)
Disclaimer/Publisher’s Note: The statements, opinions and data contained in all publications are solely those of the individual author(s) and contributor(s) and not of MDPI and/or the editor(s). MDPI and/or the editor(s) disclaim responsibility for any injury to people or property resulting from any ideas, methods, instructions or products referred to in the content.

