Article

Genome-Wide Identification of the PEBP Family Gene in Three Cymbidium Species and Its Expression Patterns Analysis in C. ensifolium

Key Laboratory of National Forestry and Grassland Administration for Orchid Conservation and Utilization at Landscape Architecture and Art, Fujian Agriculture and Forestry University, Fuzhou 350002, China
*
Authors to whom correspondence should be addressed.
These authors contributed equally to this work.
Horticulturae 2024, 10(3), 252; https://doi.org/10.3390/horticulturae10030252
Submission received: 1 February 2024 / Revised: 29 February 2024 / Accepted: 5 March 2024 / Published: 6 March 2024

Abstract

:
The PEBP gene family is involved in many biological processes in plants, including plant growth and development, flowering regulation, light response, and abiotic stress response. But there is little information about the role of the PEBP gene family in Cymbidium species. In this study, we identified 11, 9, and 7 PEBP genes in C. ensifolium, C. sinense, and C. goeringii, respectively, and mapped them to the chromosomes. We also studied the physicochemical characteristics of the proteins encoded by these PEBPs and analyzed their intra-species collinearity, gene structure, conserved motifs, and cis-acting elements. Furthermore, a total of forty PEBP genes from C. sinense, C. ensifolium, C. goeringii, Phalaenopsis, and Arabidopsis were divided into three clades based on the phylogenetic tree. The expression patterns of 11 PEBP genes in different tissues and organs of C. ensifolium were analyzed based on transcriptome data, indicating that the CePEBPs might play an important role in the growth and development, especially in the flower bud organs (1–5 mm). CePEBP5 plays an indispensable role in both the vegetative and reproductive growth cycles of C. ensifolium. CePEBP1 is essential for root development, while CePEBP1, CePEBP3, CePEBP5, and CePEBP10 regulate the growth and development of different floral organ tissues at various stages. The findings of this study can do a great deal to understand the roles of the PEBP gene family in Cymbidium.

1. Introduction

Phosphatidylethanolamine-binding proteins (PEBPs) contain a conserved PEBP structural domain and exhibit a strong affinity for phosphatidylethanolamine [1]. They play an important role in regulating flowering, seed development, and germination in plants [1,2,3,4]. The PEBP gene family can be divided into three clades in angiosperms: MOTHER OF FT AND TFL1-like (MFT-like), FLOWERING LOCUS T-like (FT-like), and TERMINAL FLOWERING 1-like (TFL1-like) [5]. FT-like and TFL1-like genes are reported only in gymnosperms and angiosperms, whereas MFT-like genes can be traced back to the origin of land plants. Therefore, MFT-like genes are the common ancestor of FT-like and TFL1-like genes [4,5,6].
Despite the high degree of sequence similarity between members of the PEBP gene family, their functions are not identical. MFT-like genes play an important role in the regulation of the development, germination, and dormancy of seeds [7,8,9]. It has been demonstrated that the regulation of flowering time and morphogenesis can be controlled by most members of the FT-like gene and TFL1-like genes [10]. The proteins encoded by FT-like genes act as flowering promoters in plants [8,11,12]. In Arabidopsis thaliana, FT acts as a floral signal transducer, moving from leaves, passing through the phloem to the shoot apical meristem, and binding to Floring Locus D (FD) proteins. It promotes the expression of downstream flowering-related genes (such as AP1), thereby regulating the flowering process in plants. The TFL1 subfamily consists of TFL1, CENTRORADIALIS (CEN), and BROTHER OF FT AND TFL1 (BFT). TFL1-like genes have high sequence similarity to FT-like genes, but they have opposite functions. They inhibit flowering by binding to the bZIP-type transcription factor FD and maintain the infinite growth of inflorescence meristematic tissue [13,14,15,16,17]. There is 60% homology in the amino acid sequences between FT and TFL1, but only a few amino acids need to be changed to convert FT from a floral promoter to TFL1, a floral repressor. This is mainly due to inconsistencies in two key amino acid sites, Tyr85 in FT and His88 in TFL1 [18,19]. In addition, the 14 amino acid fragment LGRQTVYAPGWRQN and the triplet LYN in exon 4 of FT/TFL1-like also play important roles in the opposite function of FT/TFL1-like [20].
C. ensifolium, C. goeringii, and C. sinense are the most significant ornamental orchids because of their beautiful and unique flowers. They have a long history of cultivation and are loved by consumers in China [21]. The PEBP gene family has not yet been systematically analyzed by bioinformatics, although some members have been identified and studied in Cymbidium. Given the considerable role of PEBP genes in regulating plant flowering, seed development, and germination, this study utilized bioinformatics methods to perform genome-wide identification of three Cymbidium species in Orchidaceae. In this study, we identified twenty-seven members of the PEBP gene family in three Cymbidium species, determined their chromosomal localization, constructed phylogenetic trees, and analyzed the gene structure, conserved motifs, and cis-acting element types. Additionally, we analyzed 11 members of the CePEBP genes in different tissues of C. ensifolium. Our findings further elucidate the functions of PEBP genes in the flowering and vegetative development of three Cymbidium species and provide suggestions for improvement and the creation of new varieties.

2. Materials and Methods

2.1. Data Sources

The genome sequences and annotation information of C. ensifolium, C. goeringii, and C. sinense were retrieved from their whole-genome sequencing data [22,23,24]. The protein sequence of PEBP gene family of A. thaliana was retrieved from the Arabidopsis Information Resource (TAIR, https://www.arabidopsis.org/, accessed on 20 August 2023). The Phalaenopsis ‘Little Gem Stripes’ data (PhFT1 (Peq009747), PhFT2 (Peq006920), PhFT3 (Peq017805), PhFT4 (Peq012163), PhFT5 (Peq006349), PhFT6 (Peq009750), and PhMFT (Peq004653)) were downloaded from National Center for Biotechnology Information (NCBI, https://www.ncbi.nlm.nih.gov/, accessed on 20 August 2023) [25].

2.2. Identification and Physicochemical Properties of PEBP Genes from Three Cymbidium Species

The conserved domain of PEBP (PF01161) was downloaded from Pfam. Using the BLAST and Simple HMM Search functions of TBtools (version 1.132). The PEBP family members of three Cymbidium species were identified from the genome databases [26,27]. The screening parameter had an E-value lower than 1 × 10⁻⁵. Then, NCBI CD-Search (https://www.ncbi.nlm.nih.gov/Structure/cdd/wrpsb.cgi, accessed on 20 August 2023) [28,29,30] and SMART (http://smart.embl.de/, accessed on 20 August 2023) [31] websites were used to analyze the structure of candidate PEBP proteins and eliminate incomplete and redundant protein sequences. The PEBP genes were named and classified according to the naming rules of A. thaliana. Finally, the ExPASy website (https://www.expasy.org/, accessed on 20 August 2023) was used to calculate the amino acid (aa), isoelectric point (pI), molecular weight (MW), grand average hydrophilicity (GRAVY), instability index (II), and lipid index (AI) of the PEBP proteins [32,33].

2.3. Phylogenetic Analysis of PEBP Genes

The protein sequences of 7 PEBPs from C. goeringii, 11 PEBPs from C. ensifolium, 9 PEBPs from C. sinense, 6 PEBPs from A. thaliana, and 7 PEBPs from Phalaenopsis ‘Little Gem Stripes’ were imported in MEGA 7.0 software [34]. A total of 40 protein sequences were aligned using the MUSCLE program with default parameters. The phylogenetic tree of PEBPs was constructed based on maximum likelihood (ML), with Bootstrap parameters set to 1000 and partial deletion to 75% [34]. For better visualization, the phylogenetic tree was processed using the online software iTOL 6.8.2 (https://itol.embl.de/itol.cgi, accessed on 20 August 2023) [35].

2.4. Chromosome Distribution and Collinear Correlation of PEBP Genes in Three Cymbidium Species

The visualization and analysis of chromosomal localization of PEBP genes in three Cymbidium were conducted using Tbtools software, utilizing the genome and annotation files of C. ensifolium, C. goeringii, and C. sinense. In addition, the genomic data of the three Cymbidium species were analyzed in collinearity analysis using the One-Step MCScanx program in Tbtools [27]. In Tbtools, the replication patterns of three Cymbidium species were visualized using Advance Circos [27].

2.5. Gene Structure and Conserved Motif Analysis of PEBP Gene

The conserved domains of the PEBP genes of three Cymbidium species were predicted using the CDD website (https://www.ncbi.nlm.nih.gov/cdd, accessed on 20 August 2023) [29,30], and the motifs of these PEBP genes were analyzed using the MEME website (https://meme-suite.org/meme/tools/meme, accessed on 20 August 2023) [36]. Ten motifs were followed, and the other was the default value.

2.6. Sequence Analysis of PEBP Gene Promoter

The sequence of 2000 bp upstream of the transcription start site was extracted using Tbtools as the promoter sequence of the PEBP genes in three Cymbidium species [26,27]. Additionally, potential cis-acting elements on the promoter sequences were predicted using PlantCARE website (https://bioinformatics.psb.ugent.be/webtools/plantcare/html/, accessed on 20 August 2023) [37]. Then, the prediction results were classified and analyzed using Excel 2019 and Tbtools software.

2.7. Expression Pattern and qRT-PCR Analysis

The expression patterns of 11 CePEBP genes were analyzed to investigate the potential impact of PEBP genes across different organs of C. ensifolium. The sampled organs for investigation included the root, leaf, buds of various sizes (1–5 mm, 6–10 mm, and 11–15 mm), petal, lip, sepal, pedicel, and gynostemium. Three biological replicates were analyzed, each of which was a pooled sample from five plants. We conducted transcriptome analysis on all ten samples, calculating the fragments per kilobase of transcript per million mapped reads (FPKM) [22]. The heatmap showed the patterns of expression using TBtools (version 1.132) [27].
Quantitative real-time PCR (qRT-PCR) was used to further analyze the expression patterns of the CePEBPs. The root, leaf, buds of various sizes (1–5 mm, 6–10 mm, and 11–15 mm), petals, lip, sepal, pedicel, and gynostemium at blooming period were sampled from C. ensifolium ‘Longyansu’ planted at the Fujian Agriculture and Forestry University. Primer Premier 5.0 software was used to design primers. The details of the primers and reference genes are listed in Supplementary Table S3. Total RNA was extracted by the TIANGEN DP441 Reagent Kit (Tiangen, Beijing, China). A HiScript III 1st Strand cDNA Synthesis Kit (+gDNA wiper; Vazyme, Nanjing, China) was used to reverse-transcribe RNA to cDNA. Based on the Taq Pro Universal SYBR qPCR Master Mix kit (Vazyme, Nanjing, China), the ABI 7500 Real-Time System (Applied Biosystems, Foster City, CA, USA) was used to analyze the RT-qPCR. Finally, the 2−∆∆CT method was used to calculate the expression level [26,33,38].

3. Results

3.1. Identification and Sequence Analysis of PEBP Genes in Three Cymbidium Species

The basic information and physicochemical properties of the PEBP genes for three Cymbidium species are shown in Table 1. A total of 11, 9, and 7 PEBP genes were found in C. ensifolium, C. sinense, and C. goeringii, respectively. Based on the sequential distribution on chromosomes, these 27 PEBP genes were named CePEBP1-11, CsPEBP1-9, and CgPEBP1-7, respectively. A sequence analysis of the encoded proteins showed that the physicochemical properties of amino acids, isoelectric point, molecular weight, grand average of hydropathicity, aliphatic index, and instability index of the PEBP genes in three Cymbidium species differed significantly (Table 1). The deduced protein length (AA) of PEBP genes ranged from 66 (CgPEBP3) to 379 (CsPEBP9) amino acids. The isoelectric point (pI) values of the 27 PEBP genes in Cymbidium ranged from 5.13 (CgPEBP1) to 10.75 (CgPEBP3). Among them, 6 PEBP proteins had an acidic pI below seven, while the 21 PEBP proteins with a pI higher than seven were alkaline. The grand average of hydropathicity (GRAVY) values of PEBP genes were ranged from −0.577 (CgPEBP3) to −0.118 (CePEBP2), with all GRAVY values of less than 0, indicating that they were hydrophilic. The molecular weight (Mw) ranged from 7806.99 kD (CgPEBP3) to 42330.61 kD (CsPEBP9), with the aliphatic index (AI) between 66.52 (CgPEBP3) and 89.15 (CePEBP4). The maximum instability index (II) value was 58.26 (CePEBP2), and the minimum value was 30.19 (CgPEBP4).

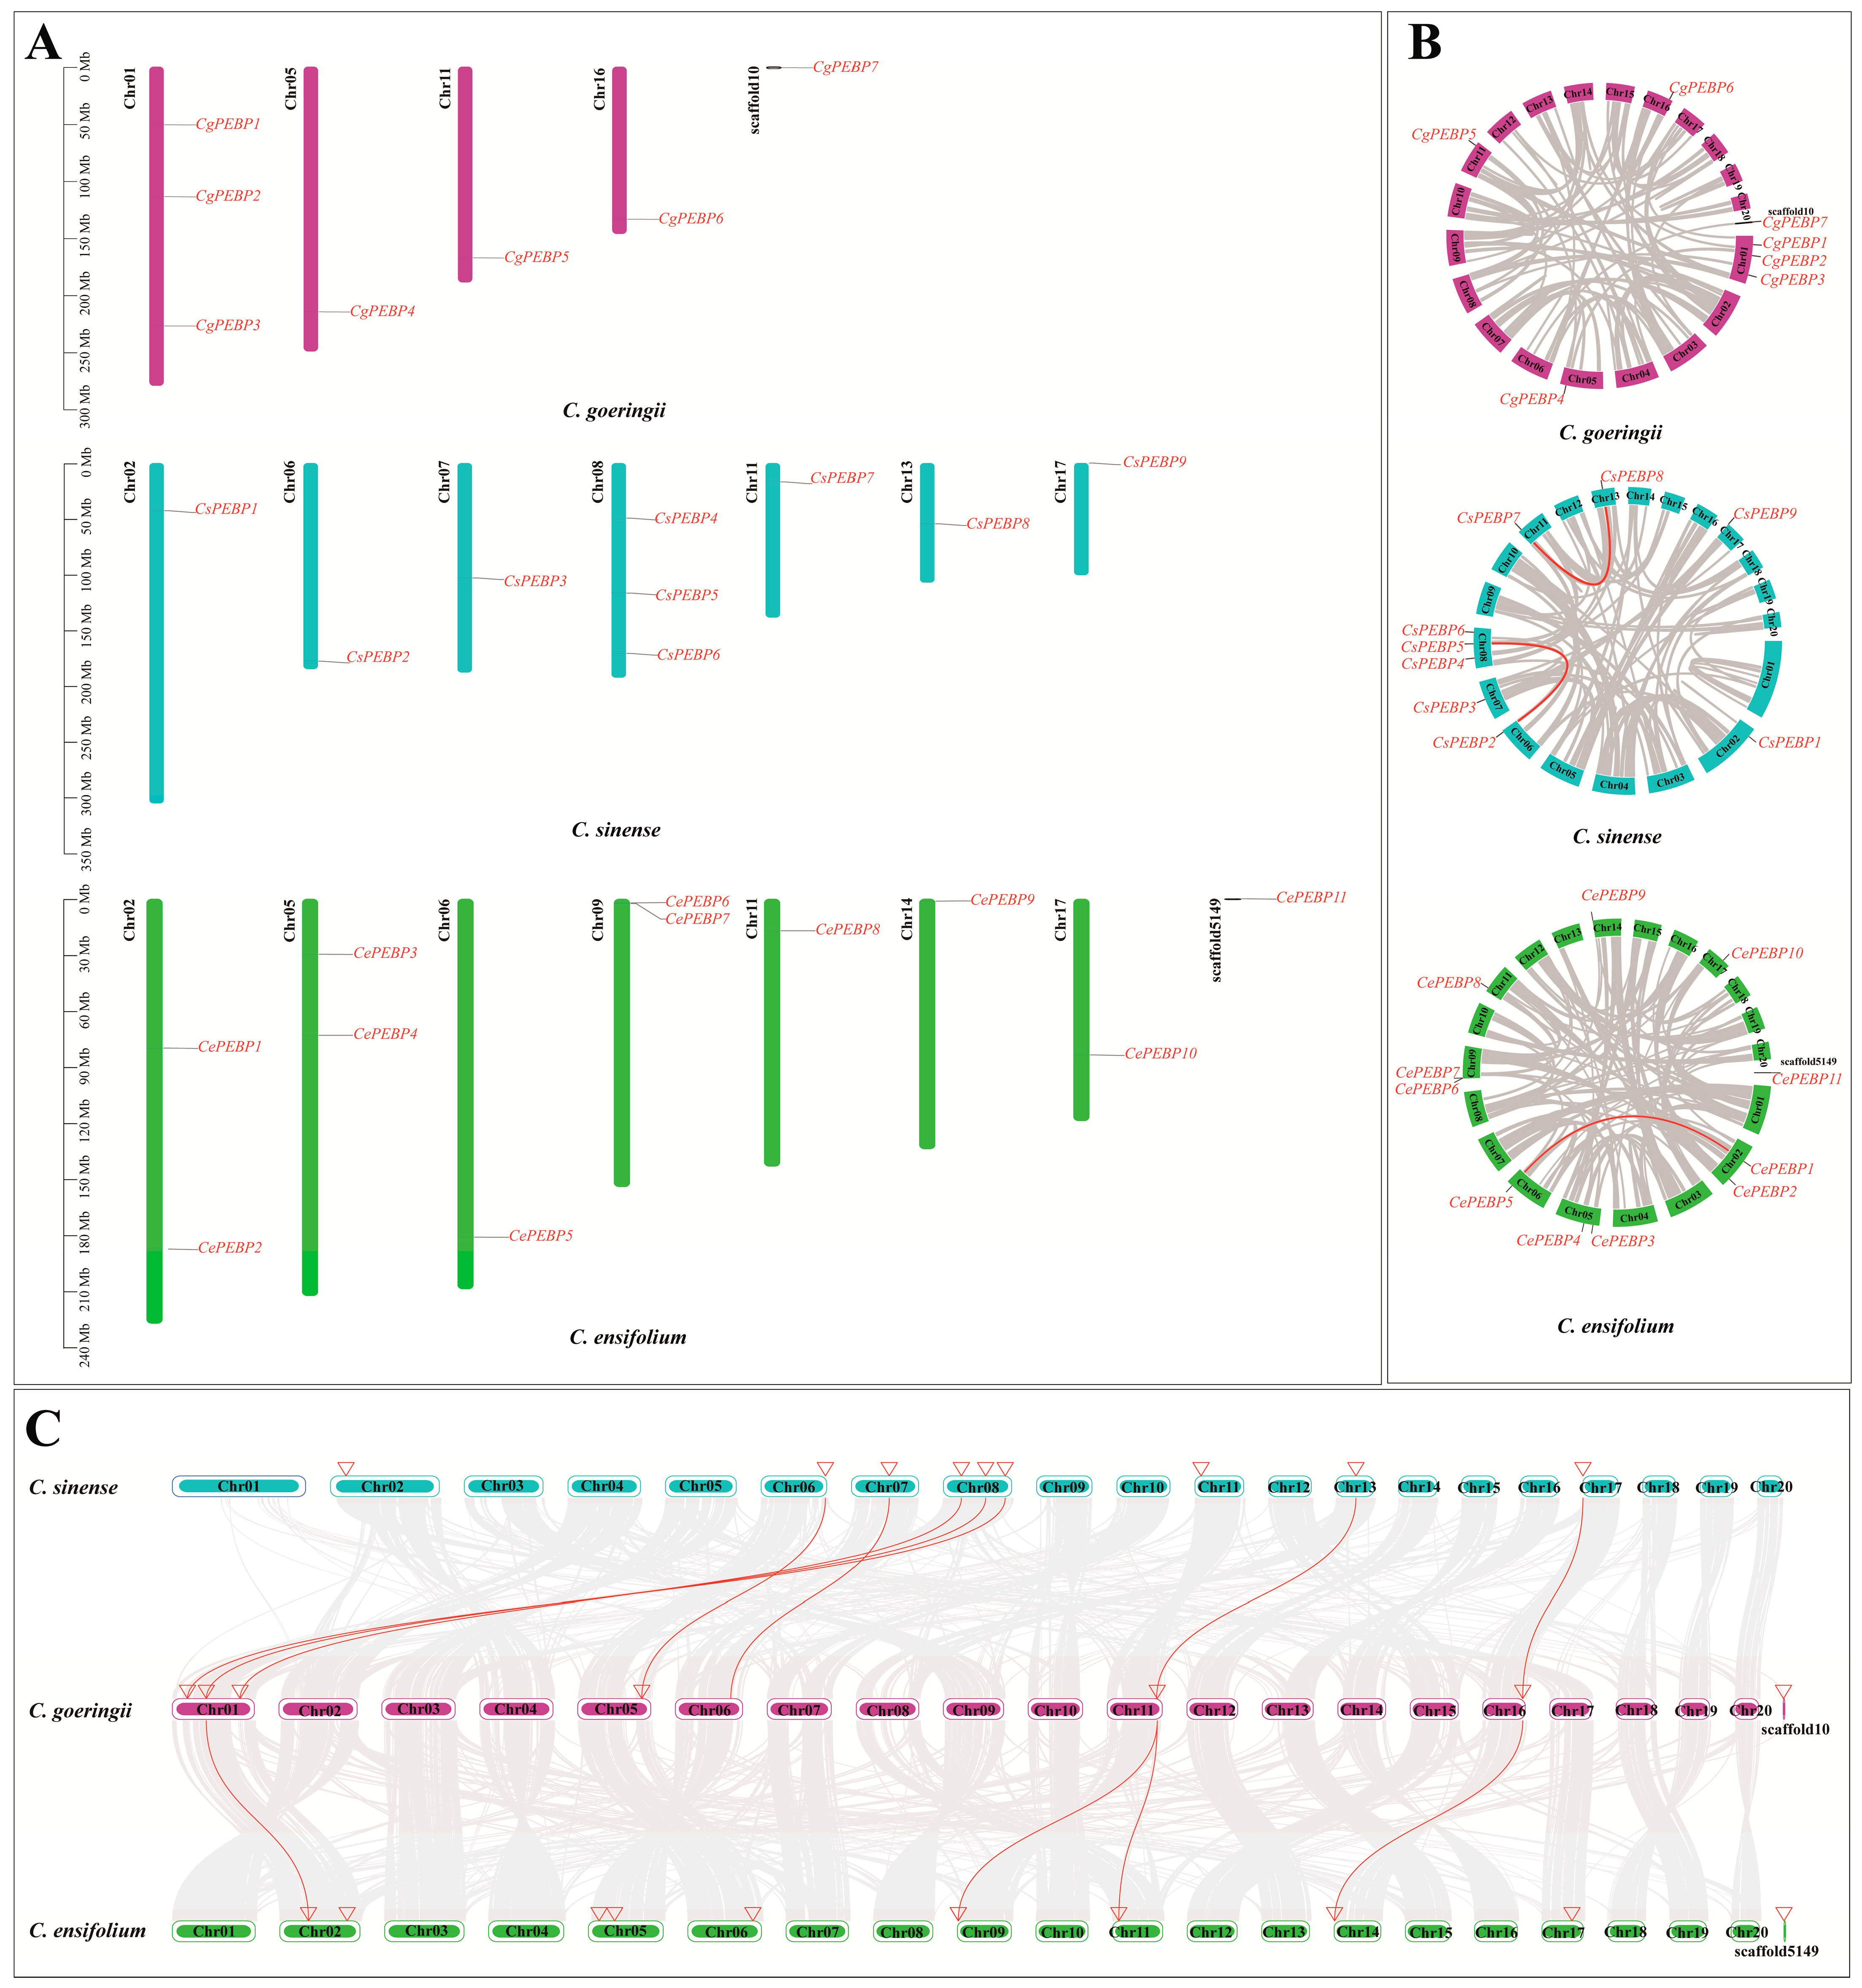
3.2. Chromosome Localization and Collinearity Analysis of PEBP Genes in Three Cymbidium Species

The relationship between the location of the PEBP genes on the chromosomes and the collinearity within three Cymbidium species is shown in Figure 1. The PEBPs are exclusively located on the partial chromosomes of three Cymbidium species and are dispersed. Ten CePEBPs were unevenly distributed on seven chromosomes (Chr02, 05, 06, 09, 11, 14, and 17). Chromosome 02,05,09 contained two genes, while each of the remaining chromosomes contained one gene. CePEBP9 was localized to the unanchored scaffold, named Scaffold5149. Chromosome localization analysis in C. sinense showed that nine CsPEBPs were unevenly distributed on seven chromosomes (Chr02, 06, 07, 08, 11, 13, and 17). The chromosome 08 contained three genes (CsPEBP4, CsPEBP5, and CsPEBP6), while the other chromosomes contained one gene each. Six CgPEBPs were unevenly distributed on four chromosomes (Chr01, 05, 11, and 16). Chromosome 01 contained three genes (CgPEBP1, CgPEBP2, and CgPEBP3), whereas the other chromosomes contained one gene each. CgPEBP7 was localized to the unanchored scaffold, named Scaffold10 (Figure 1A).
The analysis of collinearity between genes revealed replication relationships between them. Within C. ensifolium, the PEBP genes had one collinear relationship, which was between CePEBP5 on Chr06 and CePEBP1 on Chr02 (Figure 1B). There were two collinear relationships in C. sinense, which were CsPEBP2 on Chr06 and CsPEBP5 on Chr08, and CsPEBP7 on Chr011 and CsPEBP8 on Chr11, respectively. They exhibited similar conserved motifs and gene arrangements. No collinear relationship was detected in C. goeringii (Figure 1B). Figure 1C shows the collinear relationships of PEBP genes in three Cymbidium species. The analysis results indicated that C. goeringii shared seven collinearities with C. sinense and four collinearities with C. ensifolium. Among the three species, CgPEBP was most closely related to CsPEBP.

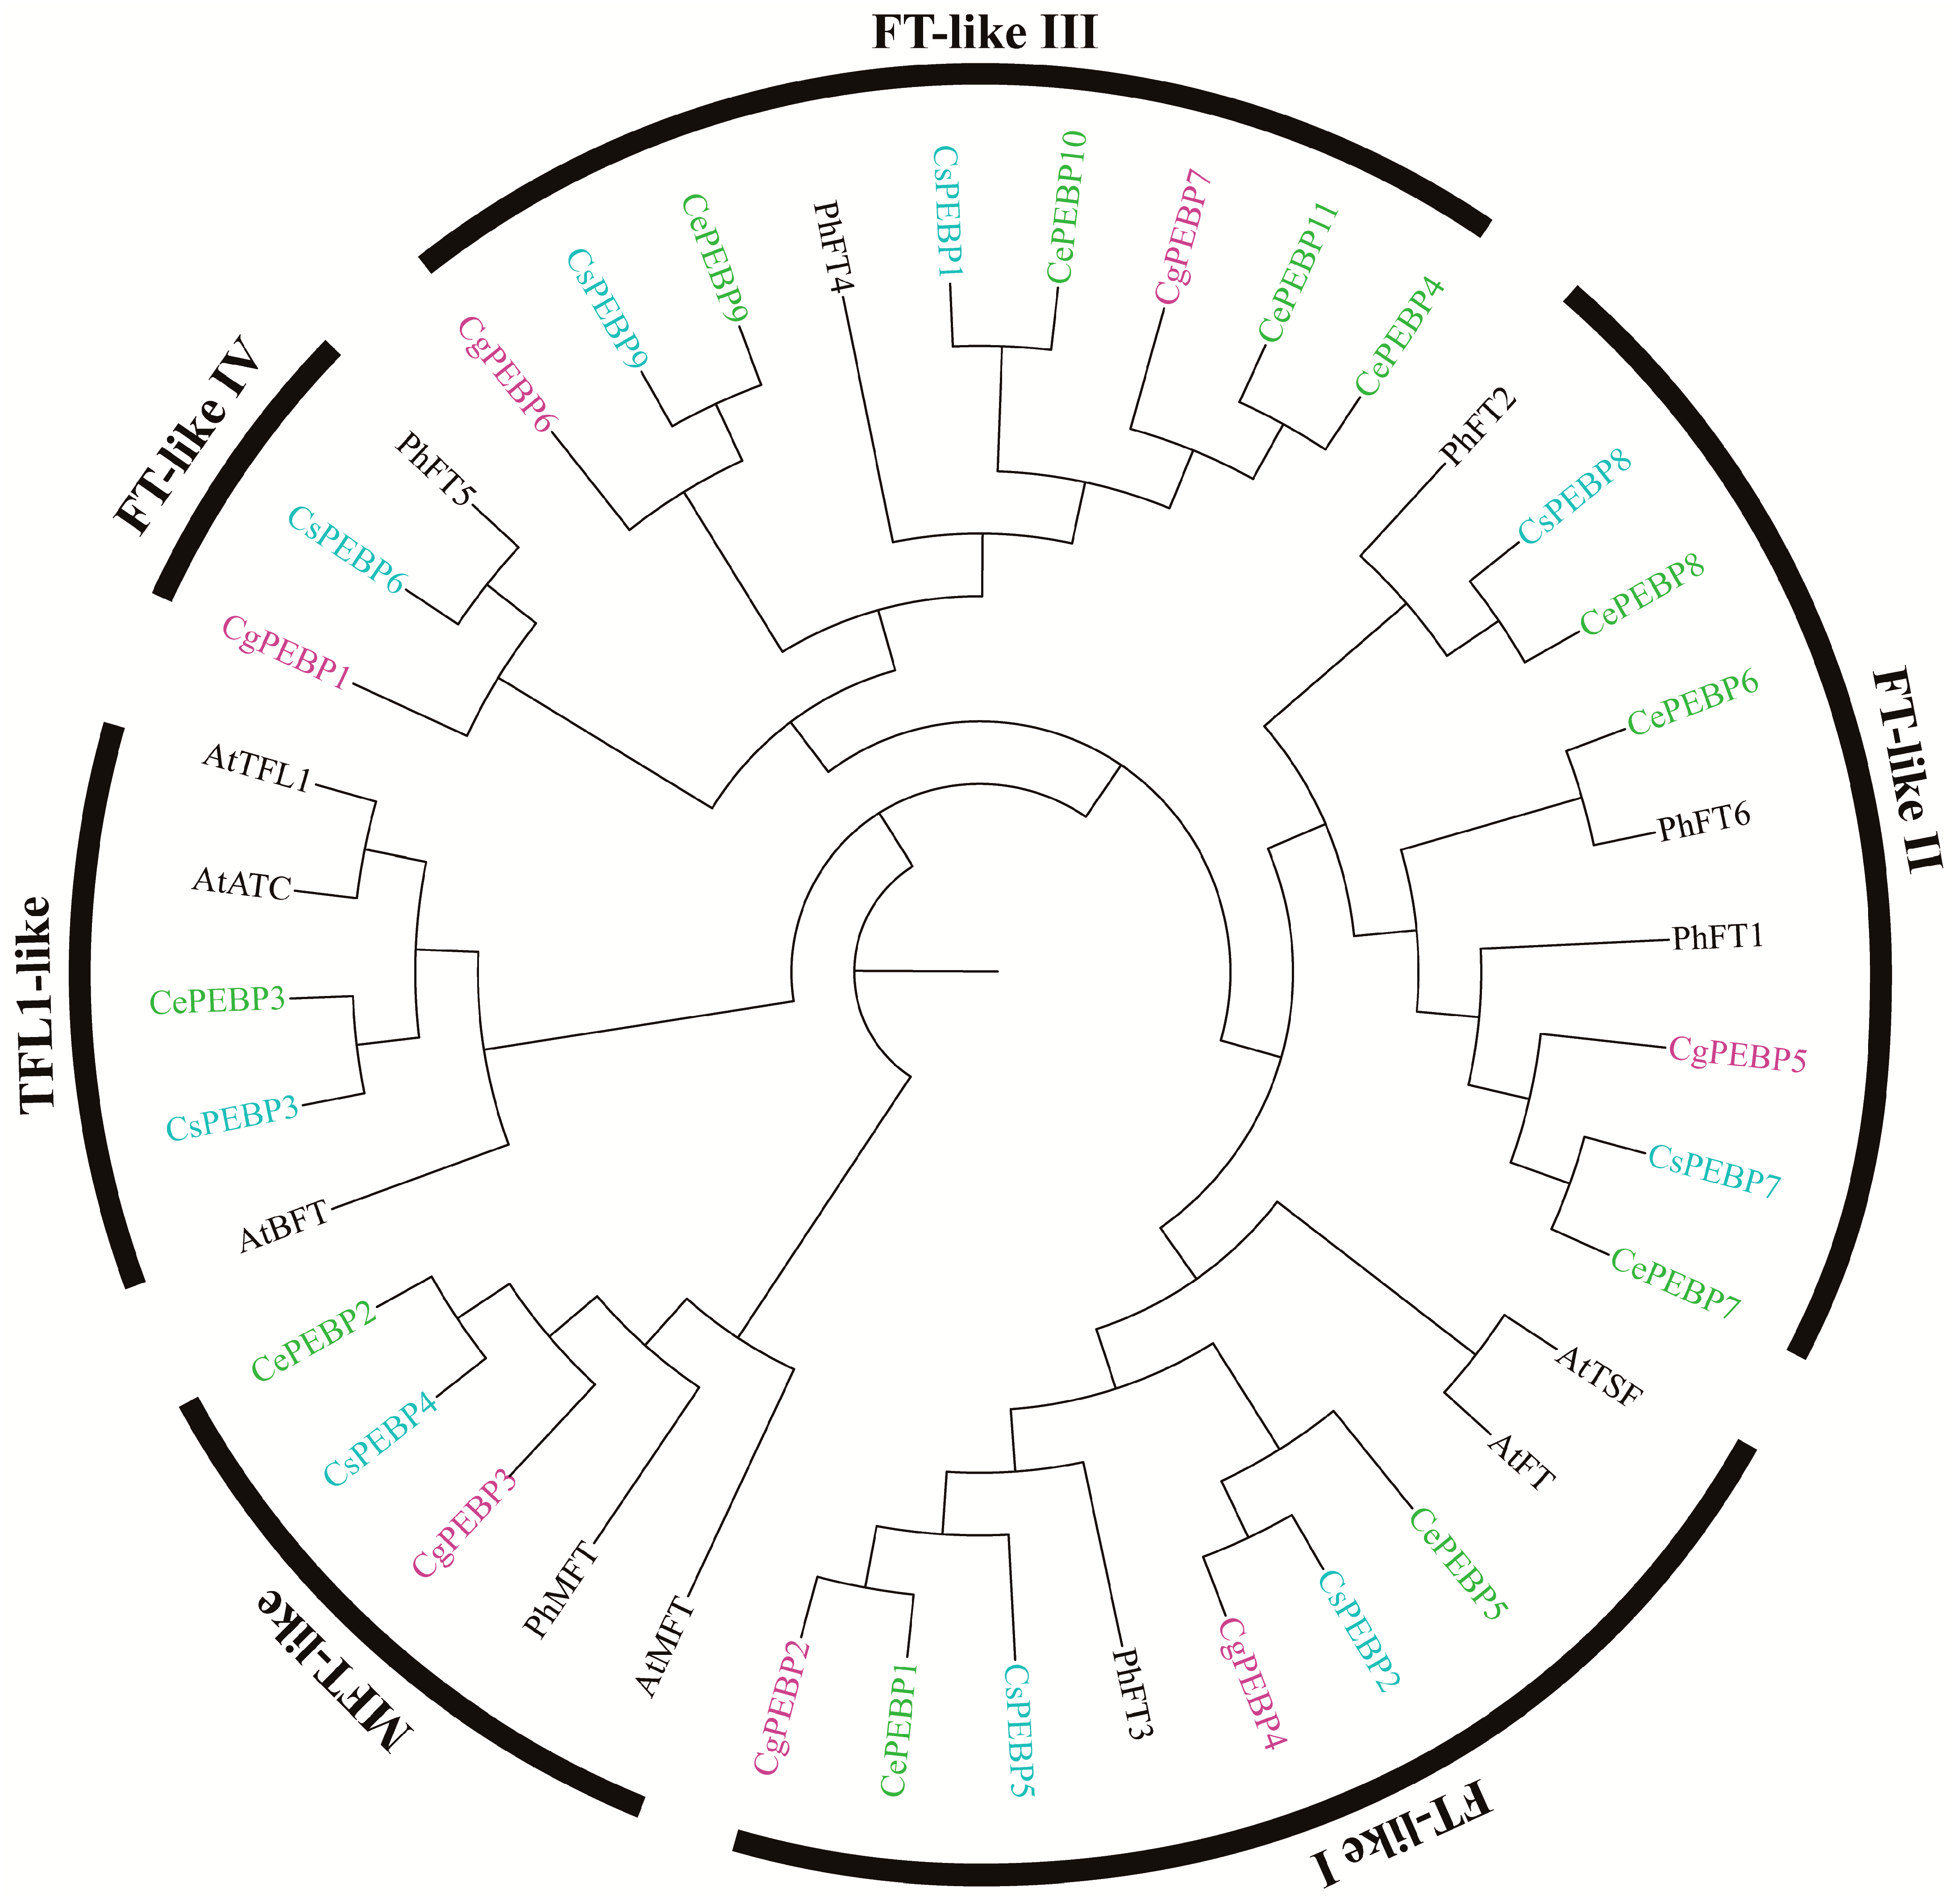
3.3. Phylogenetic Relationship Analysis of PEBP Genes

To analyze the phylogenetic relationships of PEBPs and other homologous genes in three Cymbidium species, we constructed a maximum likelihood (ML) phylogenetic tree using the amino acid sequences of 6 AtPEBP proteins, 7 PhPEBP proteins, 7 CgPEBP proteins, 9 CsPEBP proteins, and 11 CePEBP proteins (Figure 2). The phylogenetic trees showed that the forty PEBP proteins were categorized into three subfamilies: FT, TFL1, and MFT. Among these, twenty-two PEBP genes belonged to the FT subfamily for three Cymbidium species (six CgPEBP, seven CsPEBP, and nine CePEBP, respectively), and the number of members of the TFL1 subfamily was the lowest (two members, CePEBP3 and CsPEBP3, respectively). Moreover, the TFL1 gene was absent in C. goeringii. The PEBPs of the three Cymbidium species were classified into four types (I-IV) based on the topology of the phylogenetic tree. The like-I clade consists of genes that are very similar to the FT-like genes in A. thaliana.

3.4. Conserved Motif and Gene Structure Analysis of PEBP Gene Family

To understand the gene structure of PEBPs in three Cymbidium species, we predicted ten conserved motifs of PEBP genes by MEME and demonstrated the exon intron structure using Tbtools. The result showed that the majority of PEBP genes exhibited six conserved motifs, numbered one to six. Members of the same subfamily within the PEBP family share similar conserved motifs. Additionally, motifs 7 and 9 were exclusively observed in MFT-like genes. Except for CePEBP10 and CsPEBP1, almost all PEBP genes contained at least four conserved motifs (Figure 3A). Motif 1 (e-value = 2.0e − 723) contained a conserved motif D-P-D-X-P and its critical AA84 amino acid residue (Y). Motif 2 (e-value = 3.6e − 708) contained the critical AA139 amino acid residue (Q). Motif 4 (e-value = 8.3e − 285) contained a conserved motif G-X-H-R, and motif G-X-H-R had a strong effect on the Ile (I) residue with a preference (Figure 3B, 3C). The gene structure analysis indicated that 17 PEBPs (accounting for 63%) contained four exons and three introns, and four PEBPs (accounting for 15%) contained three exons and two introns. Three PEBPs (accounting for 11%) contained five exons and four introns, and three PEBPs (accounting for 11%) contained six exons and five introns. All PEBP genes had between one and five introns, with CsPEBP9 having the longest intron and CgPEBP3 having only one intron (Figure 3B).
The PEBP gene family had two key amino acid (AA) residues at the AA85 (Tyr, Y) and AA140 (Gln, Q) positions in Arabidopsis [18,20]. We performed the protein alignment of PEBP homologs from three Cymbidium species (Figure 3D). In these three Cymbidium species, Tyr (Y) at AA85 was replaced by Cys (C) and His (H) in MFT-like (CgPEBP3, CsPEBP4, and CePEBP2) and TFL1-like (CsPEBP3, CePEBP3), respectively. In the FT subfamily, Tyr (Y) at AA85 was replaced by His (H) and Leu (L) in three genes (CgPEBP6, CsPEBP9, CePEBP9) and five genes (CgPEBP7, CePEBP10, CePEBP11, CePEBP4, CsPEBP1) of FT-like III, respectively. The key amino acid residues of other PEBP genes in the FT subfamily were highly conserved at AA85. In addition, another key amino acid residue at the AA140 (Gln, Q) positions of PEBP genes was replaced by Asp (D) in the TFL1-like subfamily and replaced by Glu (E) and His (H) in the FT-like II tapy, respectively, and in CgPEBP4 by Lys (K). Key amino acid residues of other PEBP genes were highly conserved at AA140. The amino acid comparison showed that the functions of these PEBP genes might be largely conserved (Figure 3D).

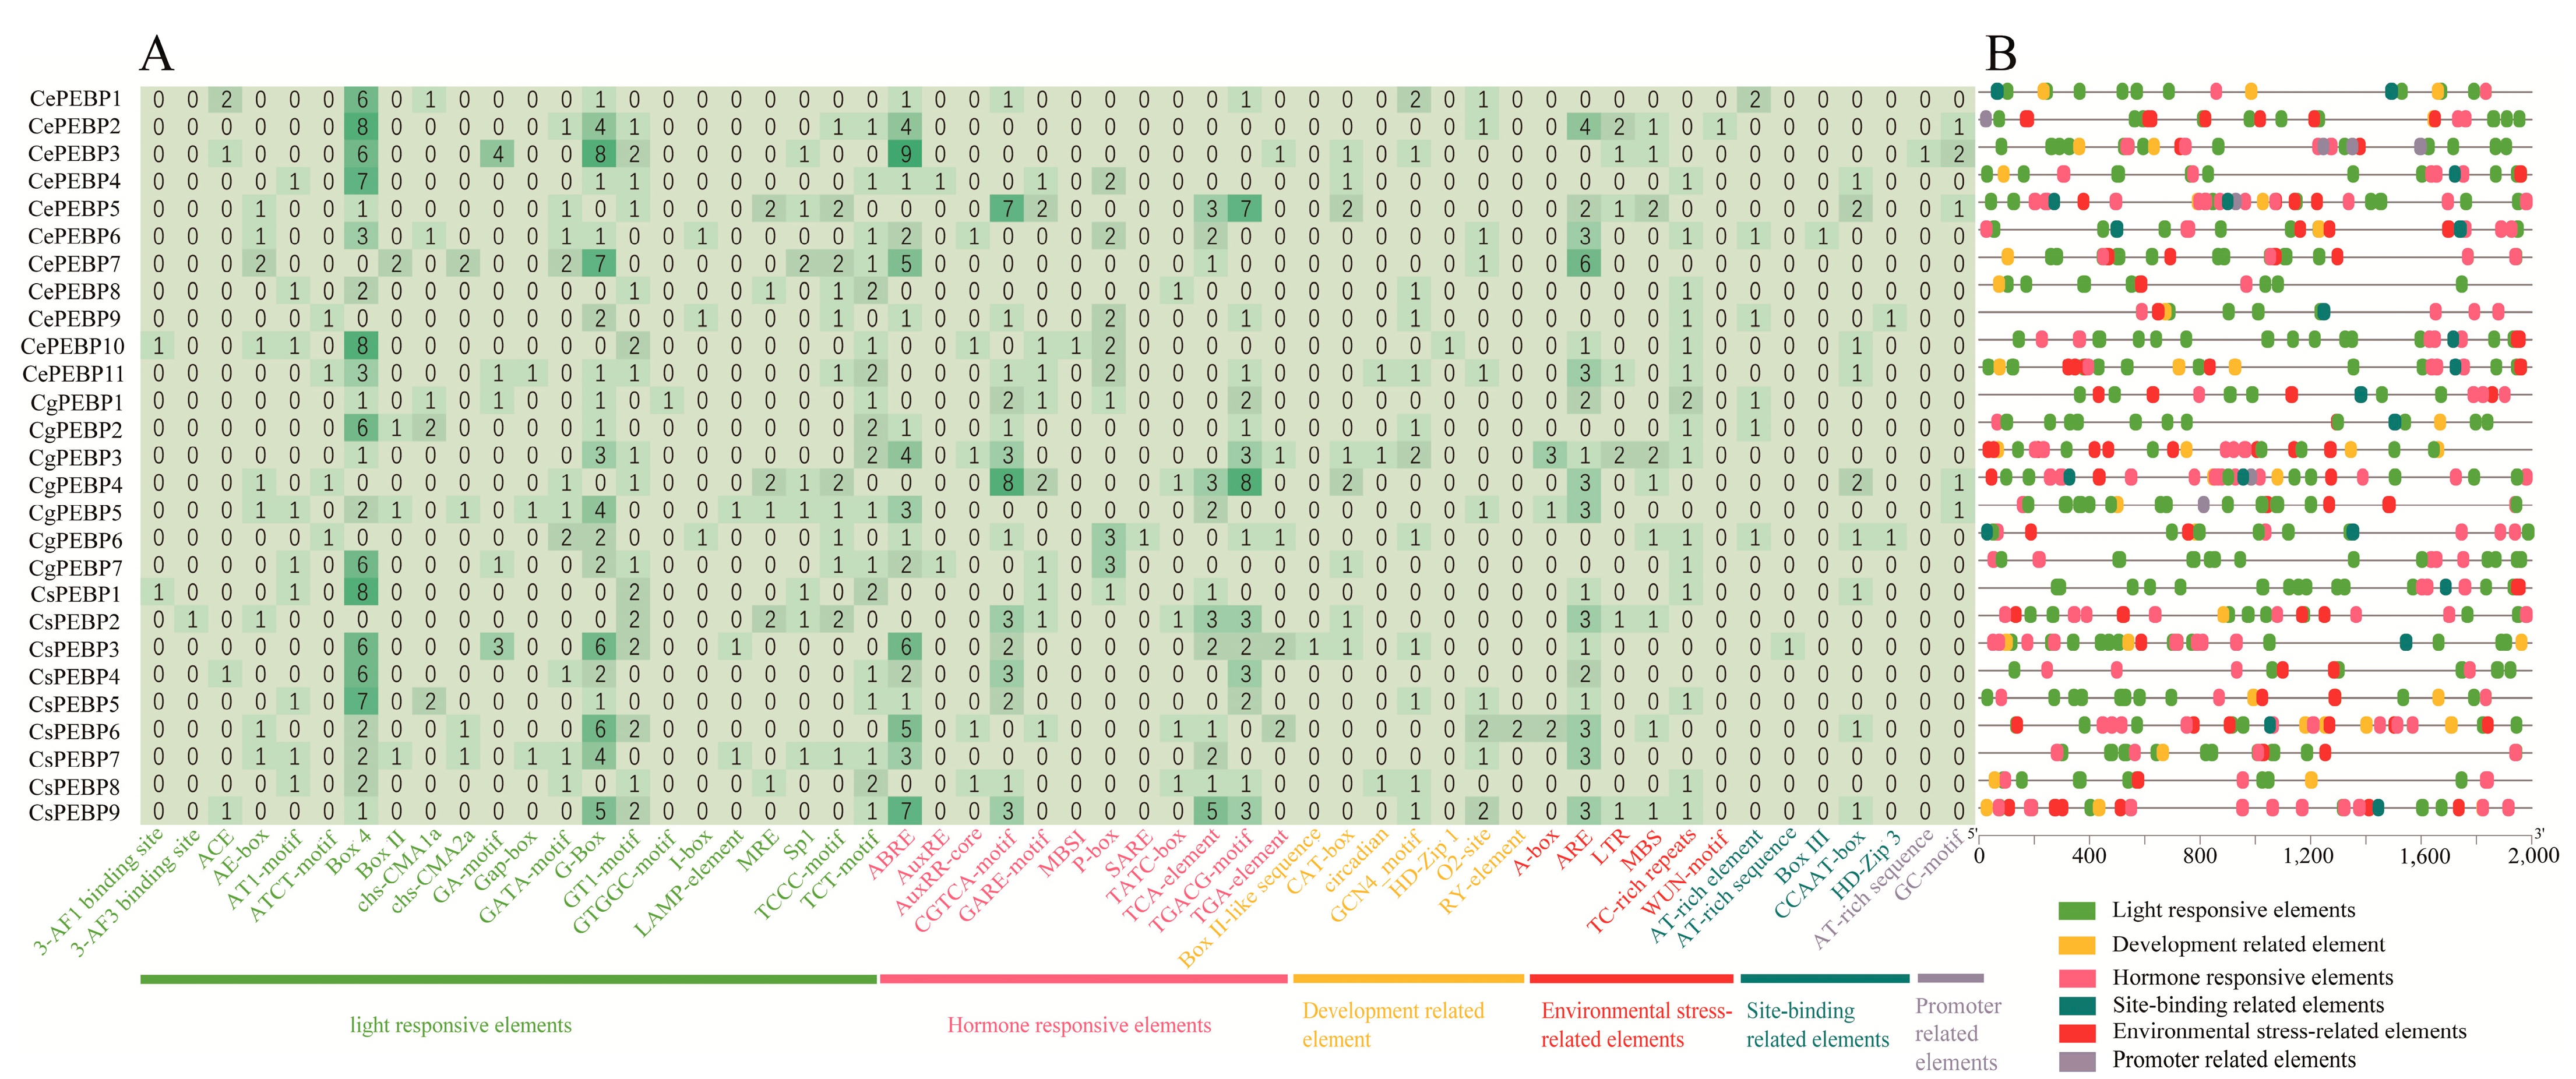
3.5. Cis-Element Analysis of Three Cymbidium Species

We extracted the 2000 bp sequence upstream region of each gene in the PEBP genes for three Cymbidium species and predicted cis-acting elements using the PlantCARE databases. There were 690 predicted cis-acting elements in three Cymbidium species, and C. ensifolium had the most cis-elements (273/690), followed by C. sinense (239/690) and C. goeringii (178/690). These were categorized into six groups: light-responsive elements (317), hormone-responsive elements (213), developmental-associated elements (43), environmental stress-related elements (88), site-binding-associated elements (22), and promoter-associated elements (7). Among them, the maximum number of light-responsive elements were Box 4 (94/317, 29.65%) and G-box (62/317, 19.55%), followed by TCT-motifs (24/317) and GT1-motifs (223/317). Among the phytohormone response elements, a higher number of ABRE (58/213, 27.23%), CGTCA-motif (39/213, 7.8%), and TGACG-motifs (39/213, 7.8%), were associated with abscisic acid response and MeJA, respectively. The remaining elements were associated with the salicylic acid response. Among the plant growth- and development-related response elements, GCN4-motif (14/43, 32.55%) and O2-site (12/43, 27.91%) were associated with circadian rhythm control and arginine metabolism, respectively. In contrast, other elements such as CAT-box motifs, circadian, and RY-elements were associated with phloem tissue expression and seed development. Thus, the PEBP genes of the three orchids were mainly associated with light response and the regulation of tissue metabolism (Figure 4, Supplementary Table S1).

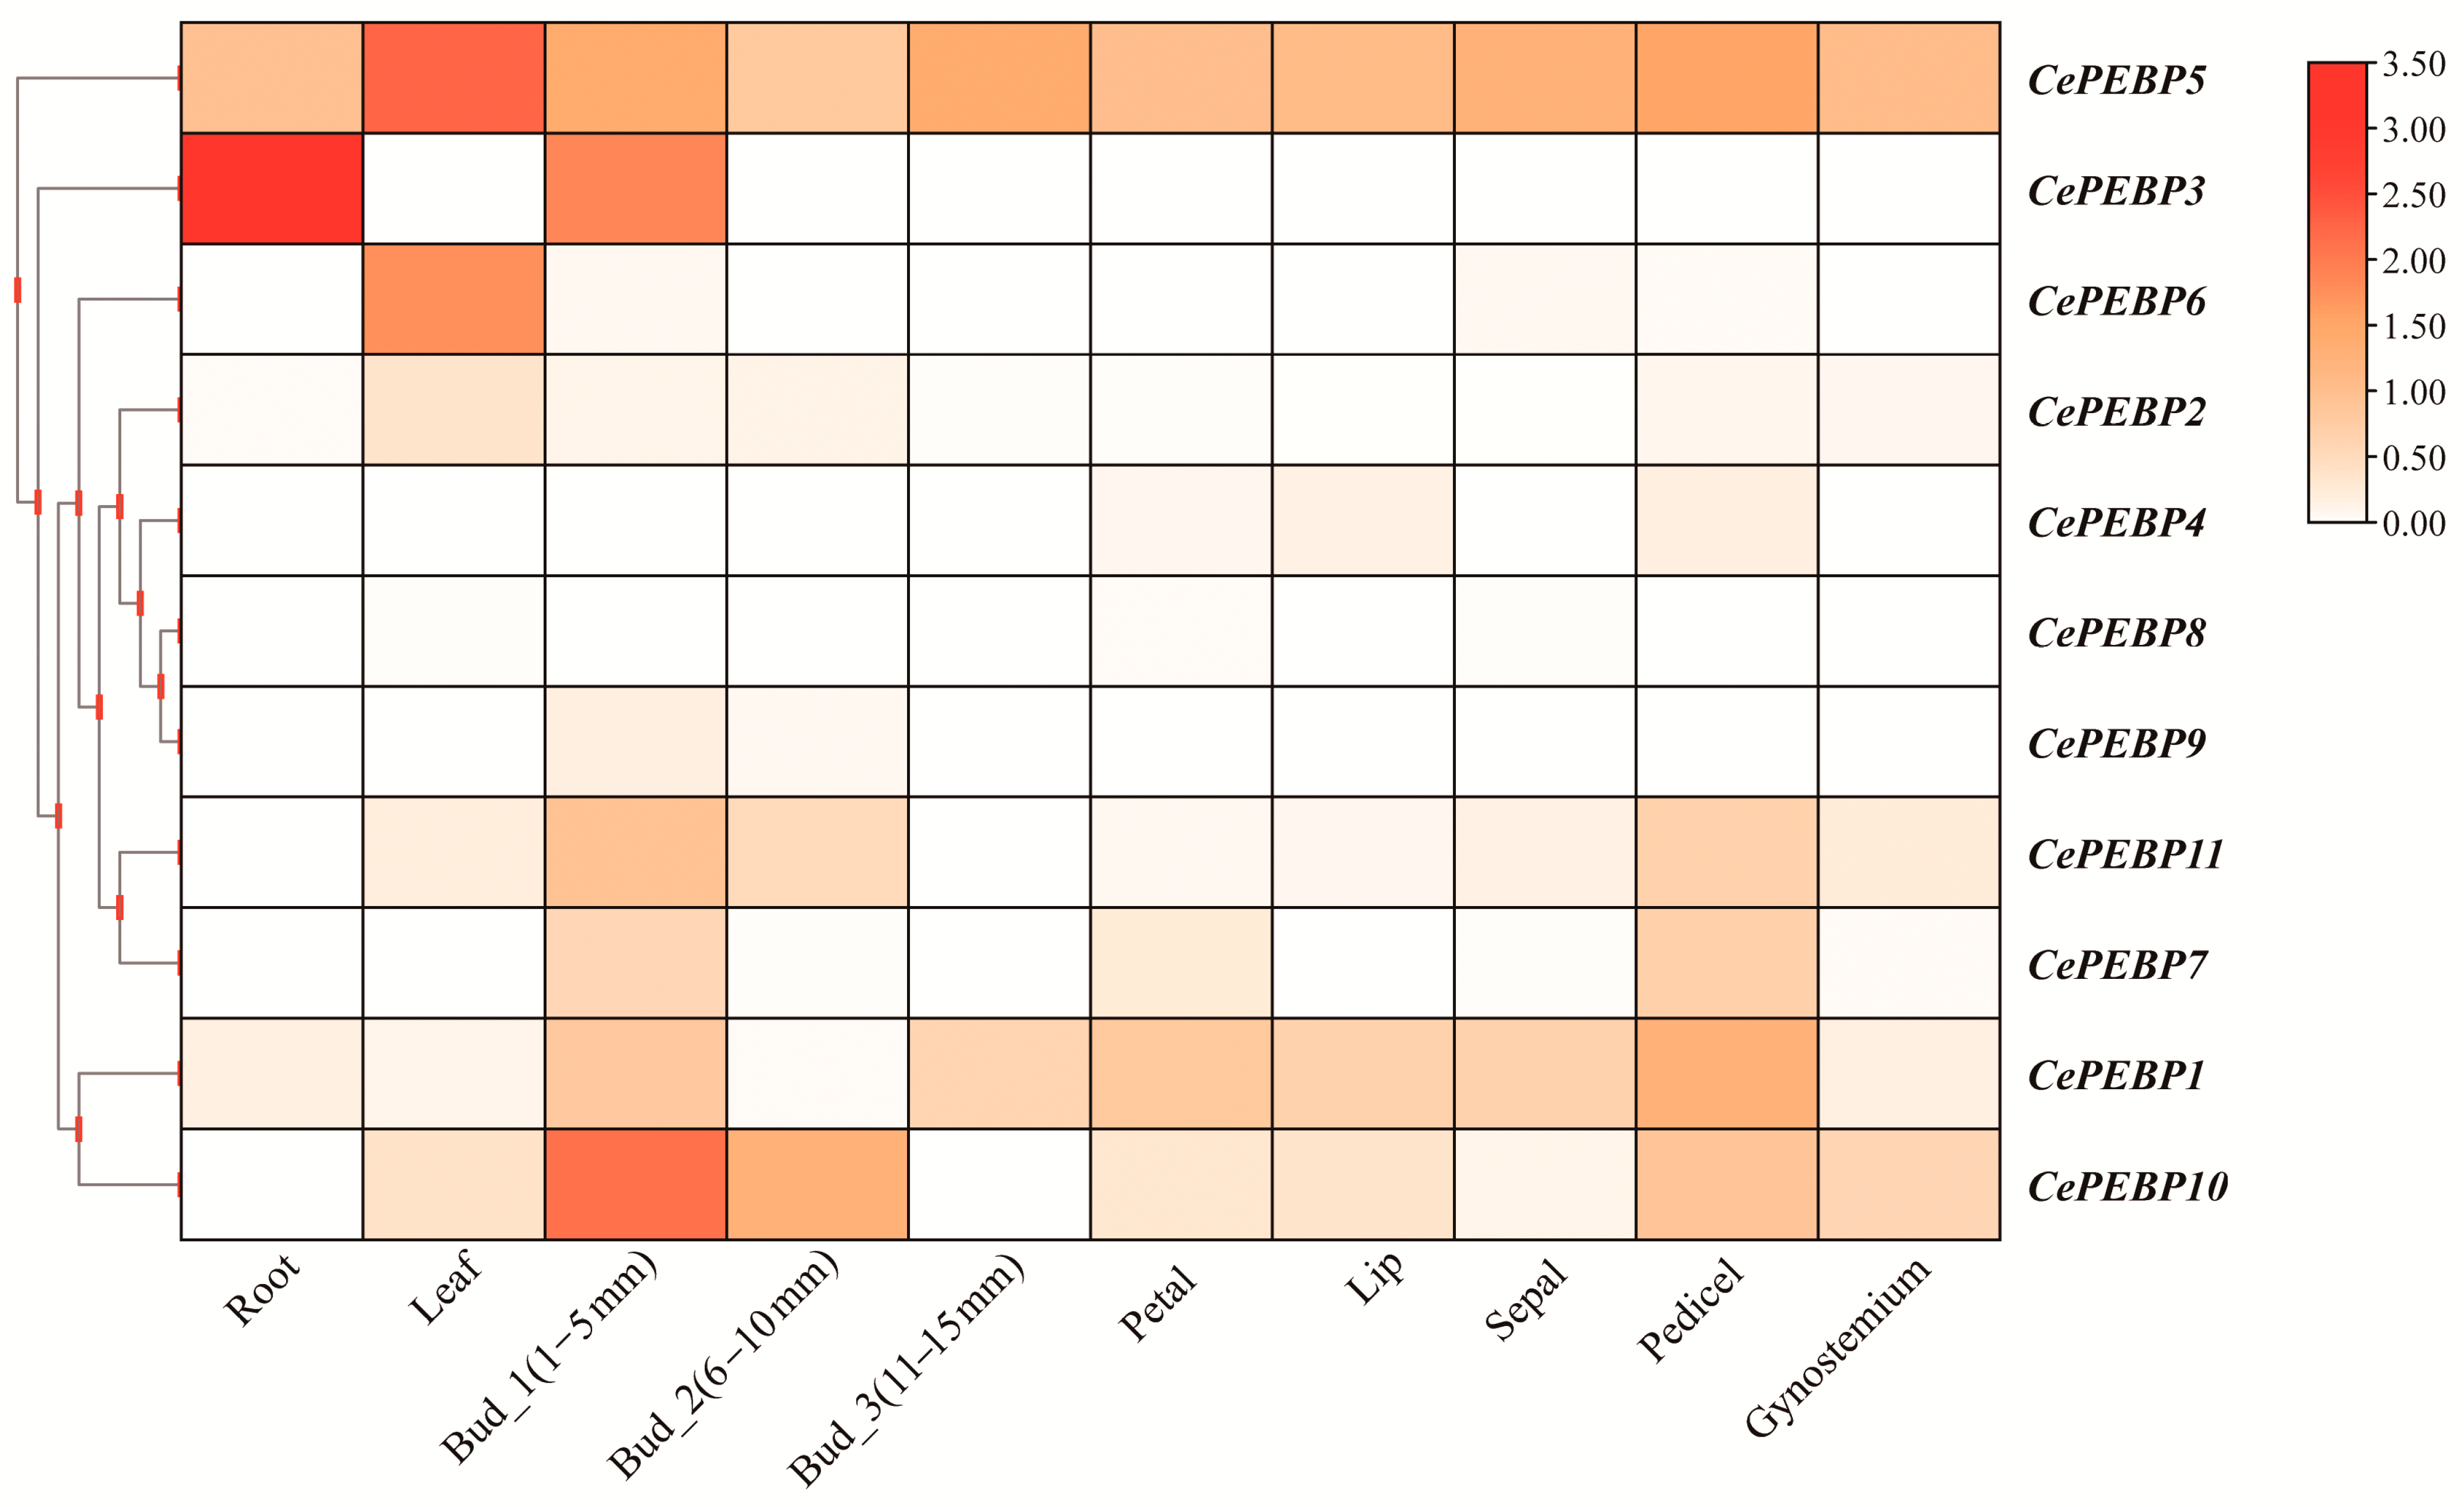
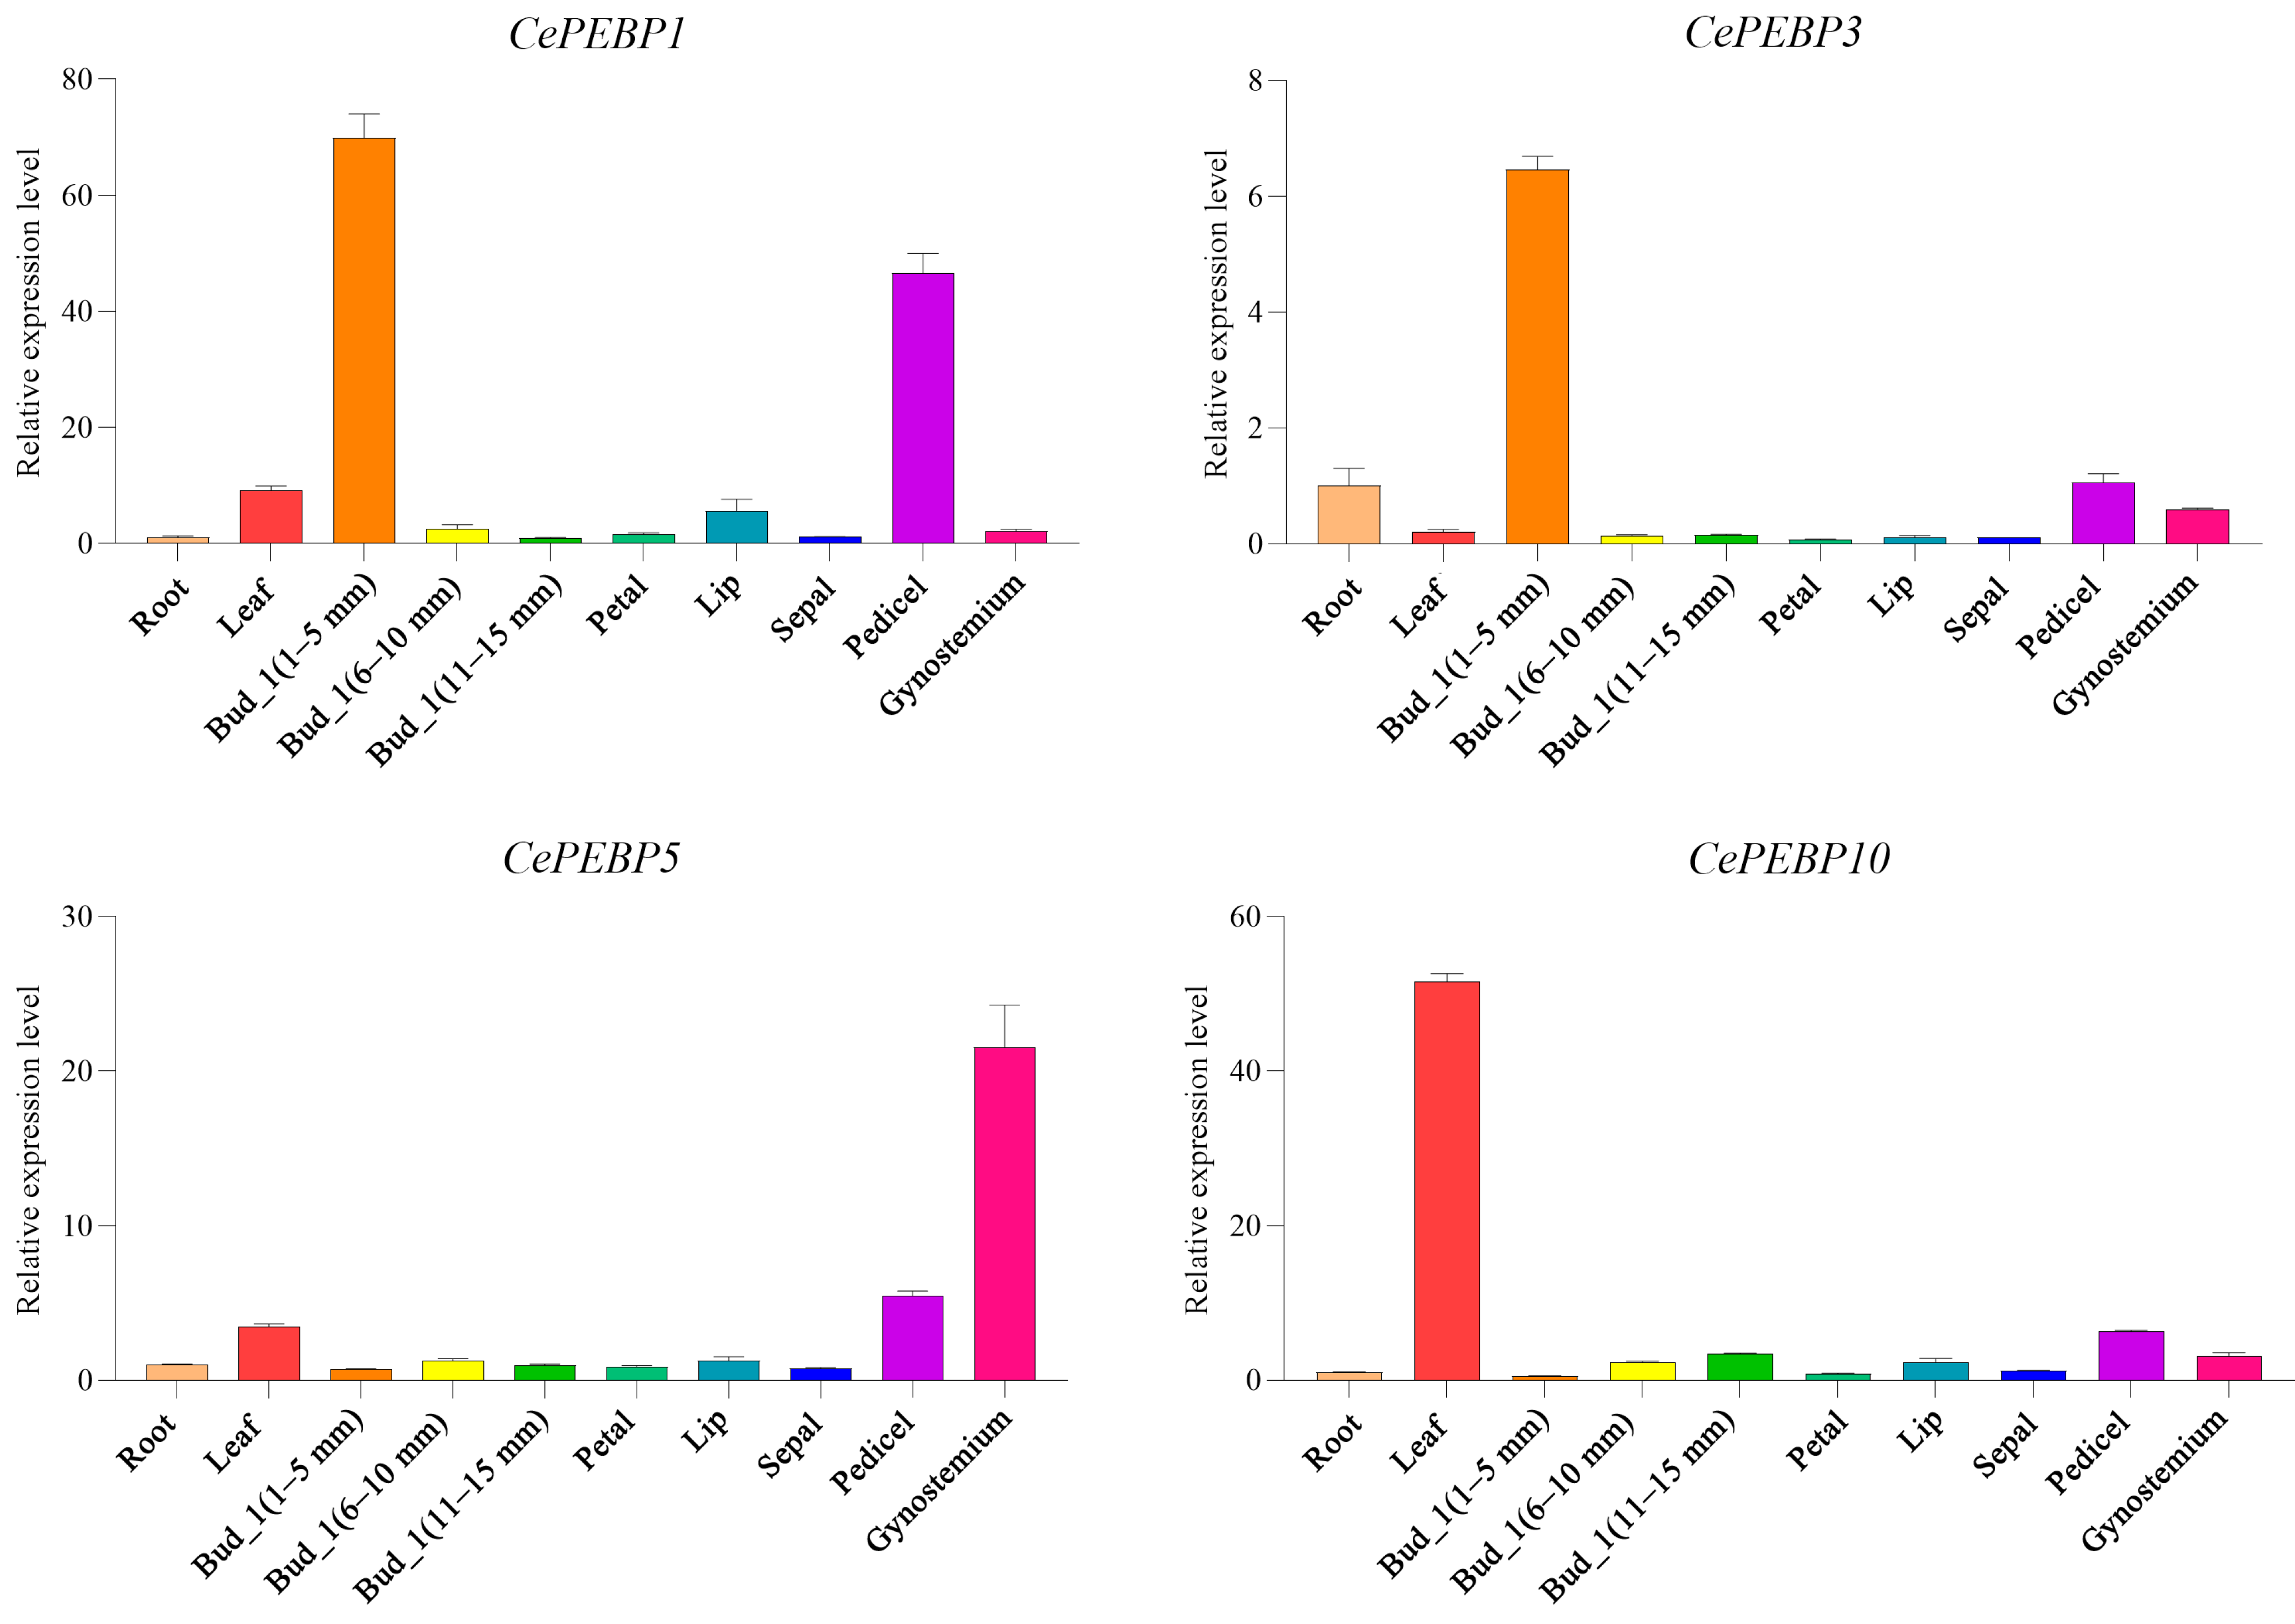
3.6. Expression Patterns of PEBP Genes in C. ensifolium

Based on the transcriptome data, three PEBP genes were significantly expressed in the buds and flowers of C. ensifolium, and two genes were significantly expressed in the leaves and roots (Figure 5). Some genes (CePEBP5, CePEBP1) were expressed in several tissues, whereas some genes (CePEBP8, CePEBP9, and CePEBP4) showed little or no expression in the tissues. The average FPKM values of the transcriptome of CePEBP genes in different tissues of C. ensifolium are shown in Supplementary Table S2.
We selected four genes, CePEBP1, CePEBP3, CePEBP5, and CePEBP10, for RT-qPCR experiments according to the transcriptome data (primer sequence information is shown in Table S3). The RT-qPCR results showed that they were expressed highly in the bud (1–5 mm), leaves, roots, and pedicels, suggesting their vital role in multiple developmental stages of C. ensifolium (Figure 6). The transcriptome data and RT-qPCR results for CePEBP1 and CePEBP3 were basically the same. Transcriptome data indicated that CePEBP5 was expressed in all tissues and had the highest expression in leaves. The RT-qPCR results indicated that it had the highest expression in the gynostemium. CePEBP10 exhibited the highest expression in the bud (1–5 mm), while the RT-qPCR results showed the highest expression in leaves.

4. Discussion

The growth habit, flowering time, flower number, and floral organ development of Cymbidium species are closely related to their ornamental value. Previous studies have cloned one PEBP homologous gene in each of the three Cymbidium species and found that C. goeringii might be primarily regulated by low temperatures, while C. ensifolium and C. sinense are regulated by the photoperiod [39]. This suggests that the study of the PEBP gene family may contribute to an improvement in ornamental traits in Cymbidium species. However, the role of the PEBP gene family in Cymbidium species has not been systematically studied to examine the common characteristics of its members.
In angiosperms, the PEBP gene family has undergone two ancient duplications, giving rise to three types: FT-like, TFL1-like, and MFT-like [4,5,6]. In this study, twenty-seven PEBP genes from three Cymbidium species were classified into three subfamilies (FT, TFL1, and MFT) through phylogenetic analysis, which was consistent with other species [4,5,6]. The FT-like genes were the most diversified in terms of copy number among the three PEBP subfamilies. In a study on the evolution of FT/TFL1 in tropical new orchids, the FT-like genes in monocotyledonous plants were divided into two branches: MonFT1 and MonFT2. Genes in the MonFT1 sub-branch might have played a role in delaying flowering, while genes in the MonFT2 sub-branch could have retained the function of promoting flowering [40]. Similarly to other monocots, three Cymbidium species carried more FT-like homologous sequences than TFL1-like and MFT-like, which could be further divided into four types (like I–IV). Among them, type I belongs to the MonFT2 sub-branch and promotes flowering through genes closely related to the AtFT gene, while types II, III, and IV belong to the MonFT1 sub-branch and inhibit flowering [40]. Additionally, previous studies have reported that the TFL1-like genes have undergone duplication during evolution in dicotyledons, followed by functional divergence from the TFL1 and CEN gene lineages [1,41]. In contrast to the FT genes, the TFL1 subfamily is more diverse in dicotyledons than in monocotyledons [40]. TFL1-like genes are either completely absent or very few are present in orchids, frequently as single copies. Only homology between Oncidium ‘Gower Ramsey’ and Vanilla planifolia has been reported [40,42,43]. This may be caused by the progressive loss of function of TFL1-like genes together with functional compensation by FT-like copies, but it still needs to be tested in the necessary experiments [40]. Among the three Cymbidium species, the absence of TFL1-like in C. goeringii, while C. ensifolium and C. sinense had a single copy, agrees with the results of previous studies [25,40]. These results reveal the functional differentiation and diversity in the PEBP gene family of three Cymbidium species.
PEBP protein has highly conserved D-P-D-x-P and G-x-H-R motifs in plants, and the binding of these motifs to anions is important for the conformation of the ligand-binding site of the PEBP protein [1,44]. Mutations close to this region may affect the binding of the PEBP protein with phosphate ions, thereby altering its interaction with FD [1,45]. Previous studies have indicated that a single amino acid determines the antagonistic activity of the floral regulators, including FT-like and TFL1-like. The residues Tyr85/His88 and Gln140/Asp144 in the FT-like and TFL1-like proteins may be the key residues that distinguish FT-like and TFL1-like activity, where they form hydrogen bonds in TFL1-like but not in FT-like [18,20]. For example, one amino acid substitution (replacing His-88 with Tyr in TFL1-like) can convert TFL1-like into FT-like, which promotes flowering [18]. In another study, specific mutations at the Glu-109, Trp-138, Gln-140, and Asn-152 sites can convert the FT-like into the TFL1-like, which inhibits flowering [19]. In this study, 27 PEBPs were identified in three Cymbidium species, and the results of the conserved motifs of all PEBPs indicated that these genes contained not only key amino acid residues but also two conserved motifs (D-P-D-X-P and G-X-H-R) [44,46]. Among them, the aa85 position of the FT-like III branch (CgPEBP6, CsPEBP9, CePEBP9) and five genes (CePEBP4, CePEBP10, CePEBP11, CgPEBP7, CsPEBP1) were replaced by His (H) and Leu (L) instead of Tyr (Y). Moreover, the aa140 (Gln, Q) of the FT-like II members was replaced by (Glu, E) and (His, H). FT-like II and III belong to the MonFT1 subbranch, which inhibits flowering in plants [40]. This indicates that the changes in Tyr85/His88 and Gln140/Asp144 residues of the PEBP gene family of three Cymbidium species can determine the functional conversion of FT/TFL1, which is similar to the results of previous researches [18,19,40].
Flowering is a key developmental process for environmental adaptation and reproduction in higher plants and requires a complex network of signaling pathways, which has been studied in many plants [1]. PEBP functions as a gene hub, integrating the photoperiodic pathway, vernalization pathway, autonomous pathway, gibberellin pathway, and age pathway in major floral induction pathways [1,47,48,49]. Investigating the transcriptional regulation of gene expression at the level of promoters by cis-acting elements has advanced our basic understanding of gene regulation and enriched the arsenal of readily available promoters [50]. In this study, a series of functional regulatory elements in the promoter region of the PEBPs were identified in three Cymbidium species, including growth and development factors, stress response factors, and plant hormone response factors. Among them, the light-responsive elements had the maximum number, indicating that the PEBPs might be regulated by light signals and growth and development (Supplementary Table S1). Previous studies also found that C. ensifolium and C. sinense were regulated by photoperiod, while C. goeringii was regulated by other factors, such as low temperatures. The research results also indirectly confirmed this point [39].
The PEBP transcripts are abundant in numerous organs during the growth and development of orchids [25,42,51]. In Phalaenopsis ‘Little Gem stripes’, transcription of the PEBP genes among the various organs is detected. PhFT1 is mainly expressed in vegetative buds, PhFT2 is specifically expressed in leaves, and the expression level of PhFT3 is highest in inflorescence [25]. But the FT homologous gene is highly expressed during flower organ development and growth processes in Dendrobium ’Chao Praya Smile’ [51]. In Oncidium ‘Gower Ramsey’, the OnFT mRNA is widely detected in different organs at different growth stages and had the highest level in tender flower buds (2 mm) [42]. In this study, we observed that certain CePEBP genes exhibited tissue-specific expression (Figure 6), with CePEBP3, CePEBP5, and CePEBP6 being specifically expressed in the developing roots and leaves of C. ensifolium, independently. CePEBP1, CePEBP3, CePEBP5, and CePEBP10 were expressed specifically in buds and flowers, which might be related to flower differentiation and development. None of CePEBP8, CePEBP9, and CePEBP4 were expressed in any of the tested tissues or organs, indicating that they were not expressed in C. ensifolium. The result of RT-qPCR analysis showed that CePEBP1 and CePEBP3 had high expression in flower buds (1–5 mm) and pedicels; CePEBP5 exhibited high expression in the gynostemium and pedicel; and CePEBP10 showed high expression in the leaves of C. ensifolium ‘Longyan Su’. This may be due to an incomplete correlation between sequencing and RT-qPCR samples. These findings also suggest that the various expression patterns of the PEBP gene family may contribute to further research on functional differentiation of the FT-like branch in orchids.

5. Conclusions

In this study, seven CgPEBP, nine CsPEBP, and eleven CePEBP were identified in three Cymbidium species, which were classified into three clades. The PEBP genes of C. ensifolium can play a significant role in the development and growth of the plant, particularly in the bud (1–5 mm). It was noteworthy that CePEBP5 also played an indispensable role in both the vegetative and reproductive growth of C. ensifolium. The CePEBP1 gene was crucial for root development, while CePEBP1, CePEBP3, CePEBP5, and CePEBP10 might be involved in the growth and development of multiple floral organ tissues. These findings can provide possible directions for further investigations on the regulation of PEBPs on the flowering times of C. ensifolium.

Supplementary Materials

The following supporting information can be downloaded at: https://www.mdpi.com/article/10.3390/horticulturae10030252/s1. Table S1: Details of cis-acting elements in the promoter region of PEBP genes from three Cymbidium species (2000 bp upstream of the initiation codon); Table S2: Average FPKM value of CePEBP genes transcriptome in different tissues of C. ensifolium; Table S3: Primers used in this study.

Author Contributions

Conceptualization, methodology, J.C., F.W., Z.L. and D.P.; Software, formal analysis, visualization, writing—original draft preparation, J.C. and F.W.; Investigation, resources and data curation, validation, J.C., F.W., R.Z., Y.Z. and X.W.; Writing—review and editing, S.A., Y.A., Z.L. and D.P.; Supervision, J.C., F.W., Z.L. and D.P.; Project administration, D.P.; Funding acquisition D.P. All authors have read and agreed to the published version of the manuscript.

Funding

This research was funded by the National Natural Science Foundation of China (32071815).

Data Availability Statement

All data generated or analyzed during this study are included in this published article (Supplementary Files) and are also available from the corresponding author on reasonable request.

Conflicts of Interest

The authors declare no conflicts of interest.

References

  1. Zhang, M.; Li, P.; Yan, X.; Wang, J.; Cheng, T.; Zhang, Q. Genome-wide characterization of PEBP family genes in nine Rosaceae tree species and their expression analysis in P. mume. BMC Ecol. Evol. 2021, 21, 32. [Google Scholar] [CrossRef] [PubMed]
  2. Yu, X.; Liu, H.; Sang, N.; Li, Y.; Zhang, T.; Sun, J.; Huang, X. Identification of cotton MOTHER OF FT AND TFL1 homologs, GhMFT1 and GhMFT2, involved in seed germination. PLoS ONE 2019, 14, e0215771. [Google Scholar] [CrossRef] [PubMed]
  3. Cheng, X.; Li, G.; Krom, N.; Tang, Y.; Wen, J. Genetic regulation of flowering time and inflorescence architecture by MtFDa and MtFTa1 in Medicago truncatula. Plant Physiol. 2021, 185, 161–178. [Google Scholar] [CrossRef] [PubMed]
  4. Xu, H.; Guo, X.; Hao, Y.; Lu, G.; Li, D.; Lu, J.; Zhang, T. Genome-wide characterization of PEBP gene family in Perilla frutescens and PfFT1 promotes flowering time in Arabidopsis thaliana. Front. Plant Sci. 2022, 13, 1026696. [Google Scholar] [CrossRef]
  5. Zheng, X.-M.; Wu, F.-Q.; Zhang, X.; Lin, Q.-B.; Wang, J.; Guo, X.-P.; Lei, C.-L.; Cheng, Z.-J.; Zou, C.; Wan, J.-M. Evolution of the PEBP gene family and selective signature on FT-like clade. J. Syst. Evol. 2016, 54, 502–510. [Google Scholar] [CrossRef]
  6. Hedman, H.; Källman, T.; Lagercrantz, U. Early evolution of the MFT-like gene family in plants. Plant Mol. Biol. 2009, 70, 359–369. [Google Scholar] [CrossRef] [PubMed]
  7. Xi, W.; Liu, C.; Hou, X.; Yu, H. MOTHER OF FT AND TFL1 regulates seed germination through a negative feedback loop modulating ABA signaling in Arabidopsis. Plant Cell 2010, 22, 1733–1748. [Google Scholar] [CrossRef]
  8. Nakamura, S.; Abe, F.; Kawahigashi, H.; Nakazono, K.; Tagiri, A.; Matsumoto, T.; Utsugi, S.; Ogawa, T.; Handa, H.; Ishida, H.; et al. A wheat homolog of MOTHER OF FT AND TFL1 acts in the regulation of germination. Plant Cell 2011, 23, 3215–3229. [Google Scholar] [CrossRef]
  9. Li, Q.; Fan, C.; Zhang, X.; Wang, X.; Wu, F.; Hu, R.; Fu, Y. Identification of a soybean MOTHER OF FT AND TFL1 homolog involved in regulation of seed germination. PLoS ONE 2014, 9, e99642. [Google Scholar] [CrossRef]
  10. Eshed, Y.; Lippman, Z.B. Revolutions in agriculture chart a course for targeted breeding of old and new crops. Science 2019, 366, eaax0025. [Google Scholar] [CrossRef]
  11. Karlgren, A.; Gyllenstrand, N.; Kallman, T.; Sundstrom, J.F.; Moore, D.; Lascoux, M.; Lagercrantz, U. Evolution of the PEBP gene family in plants: Functional diversification in seed plant evolution. Plant Physiol. 2011, 156, 1967–1977. [Google Scholar] [CrossRef] [PubMed]
  12. Corbesier, L.; Vincent, C.; Jang, S.; Fornara, F.; Fan, Q.; Searle, I.; Giakountis, A.; Farrona, S.; Gissot, L.; Turnbull, C.; et al. FT protein movement contributes to long-distance signaling in floral induction of Arabidopsis. Science 2007, 316, 1030–1033. [Google Scholar] [CrossRef] [PubMed]
  13. Bradley, D.; Carpenter, R.; Copsey, L.; Vincent, C.; Rothstein, S.; Coen, E. Control of inflorescence architecture in Antirrhinum. Nature 1996, 379, 791–797. [Google Scholar] [CrossRef] [PubMed]
  14. Bradley, D.; Ratcliffe, O.; Vincent, C.; Carpenter, R.; Coen, E. Inflorescence commitment and architecture in Arabidopsis. Science 1997, 275, 80–83. [Google Scholar] [CrossRef]
  15. Kaneko-Suzuki, M.; Kurihara-Ishikawa, R.; Okushita-Terakawa, C.; Kojima, C.; Nagano-Fujiwara, M.; Ohki, I.; Tsuji, H.; Shimamoto, K.; Taoka, K.I. TFL1-Like Proteins in Rice Antagonize Rice FT-Like Protein in Inflorescence Development by Competition for Complex Formation with 14-3-3 and FD. Plant Cell Physiol. 2018, 59, 458–468. [Google Scholar] [CrossRef] [PubMed]
  16. Freytes, S.N.; Canelo, M.; Cerdan, P.D. Regulation of Flowering Time: When and Where? Curr. Opin. Plant Biol. 2021, 63, 102049. [Google Scholar] [CrossRef] [PubMed]
  17. Zuo, X.; Xiang, W.; Zhang, L.; Gao, C.; An, N.; Xing, L.; Ma, J.; Zhao, C.; Zhang, D. Identification of apple TFL1-interacting proteins uncovers an expanded flowering network. Plant Cell Rep. 2021, 40, 2325–2340. [Google Scholar] [CrossRef] [PubMed]
  18. Hanzawa, Y.; Money, T.; Bradley, D. A single amino acid converts a repressor to an activator of flowering. Proc. Natl. Acad. Sci. USA 2005, 102, 7748–7753. [Google Scholar] [CrossRef]
  19. Ho, W.W.; Weigel, D. Structural features determining flower-promoting activity of Arabidopsis FLOWERING LOCUS T. Plant Cell 2014, 26, 552–564. [Google Scholar] [CrossRef]
  20. Ahn, J.H.; Miller, D.; Winter, V.J.; Banfield, M.J.; Lee, J.H.; Yoo, S.Y.; Henz, S.R.; Brady, R.L.; Weigel, D. A divergent external loop confers antagonistic activity on floral regulators FT and TFL1. EMBO J. 2006, 25, 605–614. [Google Scholar] [CrossRef]
  21. Ramya, M.; Park, P.H.; Chuang, Y.C.; Kwon, O.K.; An, H.R.; Park, P.M.; Baek, Y.S.; Kang, B.C.; Tsai, W.C.; Chen, H.H. RNA sequencing analysis of Cymbidium goeringii identifies floral scent biosynthesis related genes. BMC Plant Biol. 2019, 19, 337. [Google Scholar] [CrossRef] [PubMed]
  22. Ai, Y.; Li, Z.; Sun, W.H.; Chen, J.; Zhang, D.; Ma, L.; Zhang, Q.H.; Chen, M.K.; Zheng, Q.D.; Liu, J.F.; et al. Correction: The Cymbidium genome reveals the evolution of unique morphological traits. Hortic. Res. 2021, 8, 264. [Google Scholar] [CrossRef] [PubMed]
  23. Yang, F.X.; Gao, J.; Wei, Y.L.; Ren, R.; Zhang, G.Q.; Lu, C.Q.; Jin, J.P.; Ai, Y.; Wang, Y.Q.; Chen, L.J.; et al. The genome of Cymbidium sinense revealed the evolution of orchid traits. Plant Biotechnol. J. 2021, 19, 2501–2516. [Google Scholar] [CrossRef] [PubMed]
  24. Sun, Y.; Chen, G.-Z.; Huang, J.; Liu, D.-K.; Xue, F.; Chen, X.-L.; Chen, S.-Q.; Liu, C.-G.; Liu, H.; Ma, H.; et al. The Cymbidium goeringii genome provides insight into organ development and adaptive evolution in orchids. Ornam. Plant Res. 2021, 1, 1–13. [Google Scholar] [CrossRef]
  25. Jiang, L.; Jiang, X.; Li, Y.; Gao, Y.; Wang, S.; Ma, Y.; Wang, G. FT-like paralogs are repressed by an SVP protein during the floral transition in Phalaenopsis orchid. Plant Cell Rep. 2022, 41, 233–248. [Google Scholar] [CrossRef] [PubMed]
  26. Zheng, R.; Peng, Y.; Chen, J.; Zhu, X.; Xie, K.; Ahmad, S.; Zhao, K.; Peng, D.; Liu, Z.J.; Zhou, Y. The Genome-Level Survey of the WOX Gene Family in Melastoma dodecandrum Lour. Int. J. Mol. Sci. 2023, 24, 17349. [Google Scholar] [CrossRef] [PubMed]
  27. Chen, C.; Chen, H.; Zhang, Y.; Thomas, H.R.; Frank, M.H.; He, Y.; Xia, R. TBtools: An Integrative Toolkit Developed for Interactive Analyses of Big Biological Data. Mol. Plant 2020, 13, 1194–1202. [Google Scholar] [CrossRef]
  28. Wang, J.; Chitsaz, F.; Derbyshire, M.K.; Gonzales, N.R.; Gwadz, M.; Lu, S.; Marchler, G.H.; Song, J.S.; Thanki, N.; Yamashita, R.A.; et al. The conserved domain database in 2023. Nucleic Acids Res. 2023, 51, D384–D388. [Google Scholar] [CrossRef]
  29. Marchler-Bauer, A.; Bo, Y.; Han, L.; He, J.; Lanczycki, C.J.; Lu, S.; Chitsaz, F.; Derbyshire, M.K.; Geer, R.C.; Gonzales, N.R.; et al. CDD/SPARCLE: Functional classification of proteins via subfamily domain architectures. Nucleic Acids Res. 2017, 45, D200–D203. [Google Scholar] [CrossRef]
  30. Lu, S.; Wang, J.; Chitsaz, F.; Derbyshire, M.K.; Geer, R.C.; Gonzales, N.R.; Gwadz, M.; Hurwitz, D.I.; Marchler, G.H.; Song, J.S.; et al. CDD/SPARCLE: The conserved domain database in 2020. Nucleic Acids Res. 2020, 48, D265–D268. [Google Scholar] [CrossRef]
  31. Letunic, I.; Khedkar, S.; Bork, P. SMART: Recent updates, new developments and status in 2020. Nucleic Acids Res. 2021, 49, D458–D460. [Google Scholar] [CrossRef] [PubMed]
  32. Duvaud, S.; Gabella, C.; Lisacek, F.; Stockinger, H.; Ioannidis, V.; Durinx, C. Expasy, the Swiss Bioinformatics Resource Portal, as designed by its users. Nucleic Acids Res. 2021, 49, W216–W227. [Google Scholar] [CrossRef] [PubMed]
  33. Zheng, Q.; Zhao, X.; Huang, Y.; Zhang, M.M.; He, X.; Ke, S.; Li, Y.; Zhang, C.; Ahmad, S.; Lan, S.; et al. Genome-Wide Identification of the YABBY Gene Family in Dendrobium Orchids and Its Expression Patterns in Dendrobium chrysotoxum. Int. J. Mol. Sci. 2023, 24, 10165. [Google Scholar] [CrossRef] [PubMed]
  34. Kumar, S.; Stecher, G.; Tamura, K. MEGA7: Molecular Evolutionary Genetics Analysis Version 7.0 for Bigger Datasets. Mol. Biol. Evol. 2016, 33, 1870–1874. [Google Scholar] [CrossRef] [PubMed]
  35. Letunic, I.; Bork, P. Interactive tree of life (iTOL) v3: An online tool for the display and annotation of phylogenetic and other trees. Nucleic Acids Res. 2016, 44, W242–W245. [Google Scholar] [CrossRef] [PubMed]
  36. Bailey, T.L.; Williams, N.; Misleh, C.; Li, W.W. MEME: Discovering and analyzing DNA and protein sequence motifs. Nucleic Acids Res. 2006, 34, W369–W373. [Google Scholar] [CrossRef] [PubMed]
  37. Rombauts, S.; Déhais, P.; Montagu, M.V.; Rouzé, P. PlantCARE, a plant cis-acting regulatory element database. Nucleic Acids Res. 1999, 27, 295–296. [Google Scholar] [CrossRef]
  38. Chen, G.Z.; Huang, J.; Zhou, X.Q.; Hao, Y.; Chen, J.L.; Zhou, Y.Z.; Ahmad, S.; Lan, S.; Liu, Z.J.; Peng, D.H. Comprehensive Analysis for GRF Transcription Factors in Sacred Lotus (Nelumbo nucifera). Int. J. Mol. Sci. 2022, 23, 6673. [Google Scholar] [CrossRef]
  39. Huang, W.; Fang, Z.; Zeng, S.; Zhang, J.; Wu, K.; Chen, Z.; Teixeira da Silva, J.A.; Duan, J. Molecular cloning and functional analysis of Three FLOWERING LOCUS T (FT) homologous genes from Chinese Cymbidium. Int. J. Mol. Sci. 2012, 13, 11385–11398. [Google Scholar] [CrossRef]
  40. Ospina-Zapata, D.A.; Madrigal, Y.; Alzate, J.F.; Pabon-Mora, N. Evolution and Expression of Reproductive Transition Regulatory Genes FT/TFL1 With Emphasis in Selected Neotropical Orchids. Front. Plant Sci. 2020, 11, 469. [Google Scholar] [CrossRef]
  41. Gao, J.; Huang, B.H.; Wan, Y.T.; Chang, J.; Li, J.Q.; Liao, P.C. Functional divergence and intron variability during evolution of angiosperm TERMINAL FLOWER1 (TFL1) genes. Sci. Rep. 2017, 7, 14830. [Google Scholar] [CrossRef]
  42. Hou, C.J.; Yang, C.H. Functional analysis of FT and TFL1 orthologs from orchid (Oncidium Gower Ramsey) that regulate the vegetative to reproductive transition. Plant Cell Physiol. 2009, 50, 1544–1557. [Google Scholar] [CrossRef] [PubMed]
  43. Cai, J.; Liu, X.; Vanneste, K.; Proost, S.; Tsai, W.C.; Liu, K.W.; Chen, L.J.; He, Y.; Xu, Q.; Bian, C.; et al. The genome sequence of the orchid Phalaenopsis equestris. Nat. Genet. 2015, 47, 65–72. [Google Scholar] [CrossRef] [PubMed]
  44. Banfield, M.J.; Brady, R.L. The structure of Antirrhinum centroradialis protein (CEN) suggests a role as a kinase regulator. J. Mol. Biol. 2000, 297, 1159–1170. [Google Scholar] [CrossRef] [PubMed]
  45. Si, Z.; Liu, H.; Zhu, J.; Chen, J.; Wang, Q.; Fang, L.; Gao, F.; Tian, Y.; Chen, Y.; Chang, L.; et al. Mutation of SELF-PRUNING homologs in cotton promotes short-branching plant architecture. J. Exp. Bot. 2018, 69, 2543–2553. [Google Scholar] [CrossRef]
  46. Zhou, S.; Jiang, L.; Guan, S.; Gao, Y.; Gao, Q.; Wang, G.; Duan, K. Expression profiles of five FT-like genes and functional analysis of PhFT-1 in a Phalaenopsis hybrid. Electron. J. Biotechnol. 2018, 31, 75–83. [Google Scholar] [CrossRef]
  47. Amasino, R. Seasonal and developmental timing of flowering. Plant J. 2010, 61, 1001–1013. [Google Scholar] [CrossRef]
  48. Teotia, S.; Tang, G. To bloom or not to bloom: Role of microRNAs in plant flowering. Mol. Plant 2015, 8, 359–377. [Google Scholar] [CrossRef]
  49. Song, Y.H.; Shim, J.S.; Kinmonth-Schultz, H.A.; Imaizumi, T. Photoperiodic flowering: Time measurement mechanisms in leaves. Annu. Rev. Plant Biol. 2015, 66, 441–464. [Google Scholar] [CrossRef]
  50. Hernandez-Garcia, C.M.; Finer, J.J. Identification and validation of promoters and cis-acting regulatory elements. Plant Sci. 2014, 217–218, 109–119. [Google Scholar] [CrossRef]
  51. Wang, Y.; Liu, L.; Song, S.; Li, Y.; Shen, L.; Yu, H. DOFT and DOFTIP1 affect reproductive development in the orchid Dendrobium Chao Praya Smile. J. Exp. Bot. 2017, 68, 5759–5772. [Google Scholar] [CrossRef] [PubMed]
Figure 1. (A) The position of PEBP gene family members on chromosomes in three Cymbidium species. The left-hand scale is used to estimate the length of chromosomes. (B) Intraspecific collinearity of the PEBP genes in the three Cymbidium species. (C) Interspecific collinearity relationship between PEBP gene family members and C. goeringii, C. ensifolium, and C. sinense. The chromosomes of C. goeringii, C. ensifolium, and C. sinense are marked with different colors. Red lines connect the collinear relationship between PEBP gene family members of different species, and the location of PEBPs is represented by the red triangle. Circles of different colors represent different Cymbidium species.
Horticulturae 10 00252 g001
Figure 2. Phylogenetic tree of the 40 PEBP proteins from Cymbidium goeringii, C. ensifolium, C. sinense, A. thaliana, and Phalaenopsis hybrid. Circles of different colors represent different Cymbidium species.
Horticulturae 10 00252 g002
Figure 3. (A) The comparative map of PEBPs is based on the phylogenetic tree and conserved protein motifs of the three Cymbidium species. (B) Distribution of UTRs and CDSs of PEBP gene family members of the three Cymbidium species. Green represents CDS s and yellow represents UTRs. The scale at the bottom is used to compare the lengths of different genes and proteins. (C) Conserved domains of the three Cymbidium species protein sequences. The overall height of each stack indicates the sequence conservation at that position. (D) The PEBP homeodomain sequence alignment analysis of three Cymbidium species. The red blocks represent highly conserved residues. The red blocks represent highly conserved residues. Ce: Cymbidium ensifolium; Cg: C. goeringii; Cs: C. sinense.
Horticulturae 10 00252 g003
Figure 4. (A) Classification and statistics of cis-acting elements of three Cymbidium species. The numbers in the grid represent the number of elements, with darker colors indicating a larger number and lighter colors indicating a smaller number. (B) The promoter region’s distribution of cis-acting elements of three Cymbidium species. The various types of cis-acting elements are represented by different colors and shapes. The sequence direction and length are indicated by the ruler at the bottom. Ce: Cymbidium ensifolium; Cg: C. goeringii; Cs: C. sinense.
Horticulturae 10 00252 g004
Figure 5. Expression of CePEBPs in various tissues of Cymbidium ensifolium. The dendrogram on the left displays the results of the inter-gene clustering analysis.
Horticulturae 10 00252 g005
Figure 6. Analysis of gene expression of four CePEBPs in Cymbidium ensifolium at ten different organ materials.
Horticulturae 10 00252 g006
Table 1. PEBP gene family protein properties table from three Cymbidium species.
Gene NameGene IDProtein Length (AA)Isoelectric Point (pI)Molecular Weight (Mw)Grand Average of Hydropathicity (GRAVY)Aliphatic Index (AI)Instability Index (II)
CePEBP1JL0067951766.4219,848.39−0.31180.7443.37
CePEBP2JL0209231737.7419,256.21−0.11883.2958.26
CePEBP3JL0100141739.0619,607.53−0.20282.1445.42
CePEBP4JL0268381896.7321,260.35−0.15189.1546.08
CePEBP5JL0204211746.4219,926.58−0.35575.5235.95
CePEBP6JL0279391015.6210,995.31−0.26573.2741.88
CePEBP7JL0022281749.0319,523.09−0.37577.8248.29
CePEBP8JL0011651779.1820,180.03−0.22783.1145.55
CePEBP9JL0134301788.4820,082.78−0.3974.4442.64
CePEBP10JL0274071125.2712,308.11−0.1486.8852.12
CePEBP11JL0287401836.1220,580.41−0.24881.9748.35
CgPEBP1GL139372365.1326,017.24−0.32380.0448.92
CgPEBP2GL013351766.4219,848.39−0.31180.7443.37
CgPEBP3GL289746610.757806.99−0.57766.5254.87
CgPEBP4GL141291256.8314,228.19−0.33182.5630.19
CgPEBP5GL076451749.0319,522.14−0.33380.0648.67
CgPEBP6GL006582017.822,704.79−0.34177.0638.75
CgPEBP7GL095951816.7320,394.24−0.22982.8749.19
CsPEBP1cymsin_Mol0267101185.3413,110.05−0.25185.8551.29
CsPEBP2cymsin_Mol0208391896.4221,659.53−0.35579.3137.43
CsPEBP3cymsin_Mol0127591739.0619,598.52−0.20382.1445.59
CsPEBP4cymsin_Mol020552187720,394.34−0.18473.4857.35
CsPEBP5cymsin_Mol0068781906.0821,404.16−0.29780.9541.78
CsPEBP6cymsin_Mol0060132436.0827,504.27−0.36380.1642.56
CsPEBP7cymsin_Mol0188681749.0319,523.09−0.37577.8248.29
CsPEBP8cymsin_Mol0032161789.1820,292.16−0.2383.242.1
CsPEBP9cymsin_Mol0173713799.5742,330.61−0.18184.6252.69
Note: Ce: Cymbidium ensifolium; Cg: C. goeringii; Cs: C. sinense.
Disclaimer/Publisher’s Note: The statements, opinions and data contained in all publications are solely those of the individual author(s) and contributor(s) and not of MDPI and/or the editor(s). MDPI and/or the editor(s) disclaim responsibility for any injury to people or property resulting from any ideas, methods, instructions or products referred to in the content.

